Microbial Processing and Production of Aquatic Fluorescent Organic Matter in a Model Freshwater System
by
 , , ,
, , ,
Bethany G. Fox
1 ,
,
Robin M.S. Thorn
1,
Alexandre M. Anesio
2,
Timothy Cox
1,
John W. Attridge
3 and
Darren M. Reynolds
1,* 1
Centre for Research in Biosciences, University of the West of England, Bristol BS16 1QY, UK
2
Department of Environmental Science, Aarhus University, 4000 Roskilde, Denmark
3
Chelsea Technologies Group Ltd., Surrey KT8 2QZ, UK
*
Author to whom correspondence should be addressed.
Water 2019, 11(1), 10; https://doi.org/10.3390/w11010010
Submission received: 14 November 2018
/
Revised: 12 December 2018
/
Accepted: 13 December 2018
/
Published: 21 December 2018
(This article belongs to the Special Issue Water Quality and Aquatic Organic Matter Fluorescence)
Abstract
:Organic matter (OM) has an essential biogeochemical influence along the hydrological continuum and within aquatic ecosystems. Organic matter derived via microbial processes was investigated within a range of model freshwater samples over a 10-day period. For this, excitation-emission matrix (EEM) fluorescence spectroscopy in combination with parallel factor (PARAFAC) analysis was employed. This research shows the origin and processing of both protein-like and humic-like fluorescence within environmental and synthetic samples over the sampling period. The microbial origin of Peak T fluorescence is demonstrated within both synthetic samples and in environmental samples. Using a range of incubation temperatures provides evidence for the microbial metabolic origin of Peak T fluorescence. From temporally resolved experiments, evidence is provided that Peak T fluorescence is an indication of metabolic activity at the microbial community level and not a proxy for bacterial enumeration. This data also reveals that humic-like fluorescence can be microbially derived in situ and is not solely of terrestrial origin, likely to result from the upregulation of cellular processes prior to cell multiplication. This work provides evidence that freshwater microbes can engineer fluorescent OM, demonstrating that microbial communities not only process, but also transform, fluorescent organic matter.
1. Introduction
Organic matter (OM) is ubiquitous to natural waters and it is a complex heterogeneous mixture that plays an important role in the transport of nutrients within global biogeochemical cycles [1,2,3]. Aquatic OM is complex, and it enters fluvial systems via a variety of sources, including that which has been transported into the system from terrestrial environments (allochthonous) and OM that has been generated in-situ (autochthonous) [4,5,6]. The molecular characteristics of aquatic OM are known to be complex and largely influenced by the biogeochemical processes that occur within the surrounding environment [2,7,8].
The fluorescent properties of dissolved organic material have been extensively employed to characterize the relative composition across a range of natural waters [9,10,11]. Previous research has shown the microbially-derived nature of aquatic fluorescence organic matter (AFOM), with emphasis on the use of Peak T (tryptophan-like) fluorescence as a proxy for microbial presence and/or activity in the aquatic environment under investigation [12,13]. Peak T, or ‘tryptophan-like, fluorescence (λex280/λem340–360 nm), is associated with proteins, specifically the amino acid tryptophan [9,14,15]. It is often the most intense protein-like fluorescence peak and it has been linked with areas of high primary productivity [14,16,17]. Much of the previous research has focused on observed significant correlations between tryptophan-like (Peak T) fluorescence intensities and biological oxygen demand (BOD) [13,15,18]. The BOD is an analytical tool that uses microbial activity to assess the labile (biodegradable) OM in aquatic systems. The known relationship between Peak T and BOD has popularized the employment of Peak T intensities as an in situ indicator of BOD [13,19,20]. More recent freshwater research has focused on groundwater systems, with low organic loads, where Peak T and Escherichia coli counts have been well correlated [21,22]. Despite this, the underpinning microbial-AFOM interactions within environmental systems are still lacking a comprehensive understanding.
Recently published literature has used the monoculturing of bacterial species to demonstrate the production and development of bacterially-produced organic matter over time, with a range of AFOM identified to be of microbial origin [6]. Whilst this work has contributed to the underpinning knowledge of the bacterial production and the processing of AFOM, there is a need for further studies to be undertaken which seek to understand the impacts of in situ processing, an essential parameter to consider when observing the biogeochemical cycling of organic material. Such insights will enable a better understanding of the role of complex microbial communities in natural environmental systems.
To further explore some of these knowledge gaps, a novel laboratory model system was developed to investigate the relationship between Peak T fluorescence, dissolved oxygen concentration, and bacterial enumeration within the system. The model system was analysed under a range of incubation times and over a range of time domains that were not previously reported within the literature. In addition, a low-nutrient minimal medium was used in order to minimize the interference from background fluorescence. By simplifying the sample matrix and analysing the samples on a longer temporal scale, the underpinning dynamics of microbial-AFOM interactions can be more extensively explored.
The main aim of this study was to explore the dynamics of microbial processing and production of AFOM, and the impact of in situ processing through time under varying environmental conditions, namely temperature and OM availability. By using model laboratory systems, this paper aims to further the understanding of potential microbial-OM interactions that occur within aquatic systems. This research provides insight into the viability of using of Peak T fluorescence as an independent water quality parameter in its own right. Ultimately, this research will inform the development of a new sensing approach for the management of water quality through time and space.
2. Materials and Methods
2.1. Laboratory Model Systems
A model system was developed to enable an in-depth investigation into bacterial AFOM dynamics and interactions; specifically, the way in which such interactions are impacted by microbial community dynamics within a closed system and by physicochemical parameters (e.g., temperature). The developed model system represents a low-nutrient environment (oligotrophic) and it enables an assessment of microbial processing and the production of AFOM as a function of residence time.
For the initial investigation into microbial processing of AFOM, aqueous samples were either collected (environmental water samples) or prepared (synthetic water samples). Environmental samples were incubated at 20 °C in the dark over a 10-day period in individual airtight 300 mL bottles, sealed with PARAFILM (Standard Methods, APHA AWWA WEF, 1999). Dissolved oxygen measurements were recorded daily using an optical DO meter (HQ10, Hach, CO, USA), which was validated using a standard Winkler titration [23].
Supplemented synthetic samples were used in time-resolved experiments, whereby aliquots of 5 mL were taken hourly from one litre Duran® bottles (Duran Group, Wertheim am Maim, Germany) and incubated at the following temperatures; 20 °C, 25 °C, 30 °C, and 37 °C. Aliquots were subject to fluorescence-excitation-emission matrices (EEM) spectroscopic analysis (Section 2.3) and flow cytometry with BacLight® LIVE/DEAD viability stain (Section 2.5).
2.2. Water Samples
2.2.1. Environmental Water Samples
Environmental samples were collected from an artificial water body (N 51°29′56″, W 2°32′39″). This water body receives OM inputs from both autochthonous and allochthonous sources (surface runoff). Water samples were collected 3 m from the edge of the water body, at a depth of approximately 30 cm from the surface. Collection was carried out using a five-litre high-density polyethylene container that was previously cleaned with a 1% Virkon™ (Virkon Disinfectant Technologies, Manchester, UK) solution, rinsed thoroughly to prevent bacterial or chemical contamination of the sample. Prior to collection, the container and aspirator were rinsed three times with environmental water. Environmental water samples were utilized within the laboratory model (or analysed), within 2 h of collection to limit any biological/biochemical changes prior to use.
2.2.2. Synthetic Water Samples and Supplemented Synthetic Water Samples
‘Synthetic water samples’ were prepared by using a nutrient enriched distilled water solution, with glucose and glutamic acid as the sole carbon sources; additives comprised of phosphate buffer, 0.25 M calcium chloride solution, 1 M magnesium sulphate solution, and 2 mM ferric chloride, whereby 1 mL of each nutrient stock was added per litre of distilled water [23]. All chemicals and reagents were sterilised using a 0.2 µm cellulose filter (Minisart®; Sartorius Stedim Biotech, Göttingen, Germany). Sterile de-ionised water was prepared by autoclaving at 121 °C for 15 min, prior to nutrient enrichment and the addition of carbon sources [23]. A standard bacterial seed (Cole Parmer Instrument Company, Vernon Hills, Illinois, USA) was used. The inoculum was activated by rehydrating the capsule contents in 500 mL of sterile de-ionised water and aerating the mixture for an hour at room temperature. The inoculum was added to individual sample bottles at a final concentration of 0.5% (v/v). The use of this minimal sample matrix, as opposed to a nutrient-rich media, made it possible to remove the interference that was caused by background fluorescence [6,9], while still providing sufficient nutrients to support bacterial growth. ‘Supplemented synthetic water samples’ were prepared by addition of 2% (v/v) environmental water to ‘synthetic water samples’ as a source of OM.
For both these sample types two negative controls were used to account for any fluorescence development via abiotic pathways: (1) samples prepared with heat treated bacterial seed solution and (2) samples prepared without the bacterial seed.
2.3. Fluorescence Measurements
A fluoroSENS (Gilden Photonics Ltd., Clydebank, Scotland, UK) fluorimeter was used to collect fluorescence spectroscopy data, using a 3.5 mL quartz cuvette with a 10 mm path-length. The following scan parameters were employed: excitation wavelengths from 200 to 450 nm at 5 nm steps; emission wavelengths of 250 to 550 nm with 5 nm bandpass; integration time of 200 ms.
Fluorescence excitation-emission matrices (EEMs) were collected using an Aqualog® spectrofluorimeter (HORIBA Ltd., Kyoto, Japan). The following scan parameters were employed; excitation wavelengths from 240 to 500 nm via 1 nm steps and emission wavelengths of 247.88 to 829.85 nm in 1.16 nm steps using an integration time of 1 s. A standard volume (3.5 mL) quartz cuvette with a 10 mm path-length was used throughout. The spectra that were measured were subjected to post-processing (Aqualog® Software, HORIBA Ltd., Kyoto, Japan): blank subtraction; first and second order Rayleigh Scattering Masking (±10 nm at λex = λem and 2λex = λem); and, correction for inner filter effects at both the excitation and emission wavelengths [6,9,24]. The fluorescence of all samples was normalised to the fluorescence from 1 µg L−1 quinine sulphate at λex = 347.5 nm and λem = 450 nm, reporting data in quinine sulphate units, QSU [6,25,26]. Instrument validation was carried out five times daily using a certified quinine sulphate standard (Starna Scientific Ltd., Ilford, UK), with CV being <3% in all events.
2.4. Fluorescence Data Analysis
All fluorescence data collected using the fluoroSENS was normalised to the water Raman line at λex280/λem310(300–315) nm arbitrary units (A.U.) [27,28]. Peak-picking analysis was undertaken using a customised R (The R Foundation) script [29].
All fluorescence data that was collected using the Aqualog® was normalised to QSU to allow for quantitative analysis, and graphical EEM presentation was carried out using a custom script written in PythonTM (Python Software Foundation), which crops the data window to λex 240–490 nm, λem 250–550 nm to allow for the analysis of the UV spectra. Parallel factor (PARAFAC) analysis was used to decompose the EEM data [30] using Solo (Eigenvector Research Inc., Wenatchee, WA, USA) software, which employs the PLS-Toolbox with MATLAB®. The PARAFAC model was validated by CORCONDIA and investigation of the models’ residuals. For specific fluorescence peaks of interest, peak-picking analysis was undertaken using PythonTM.
2.5. Bacterial Enumeration
Bacterial enumeration was performed using flow cytometry (Accuri® C6, BD Biosciences, San Jose, CA, USA). The flow cytometer was validated daily to ensure <2.5% instrument error. BacLightTM LIVE/DEAD® (Molecular ProbesTM, Invitrogen, Carlsbad, CA, USA) bacterial viability staining kit was used to stain samples and to differentiate between viable and non-viable cells. A 2x working concentration stock was made using filter sterilized water (Molecular ProbesTM, Invitrogen, Carlsbad, CA, USA). Samples (50 µL) were stained, at 1x working concentration, for 15 min in the dark prior to analysis. Samples were run at a flow rate of 11 µL/min using a core size of 5 µm for one minute. Two manually drawn gates were used to distinguish the live and dead cells [31]. All bacterial enumeration data is reported in cells mL−1.
3. Results
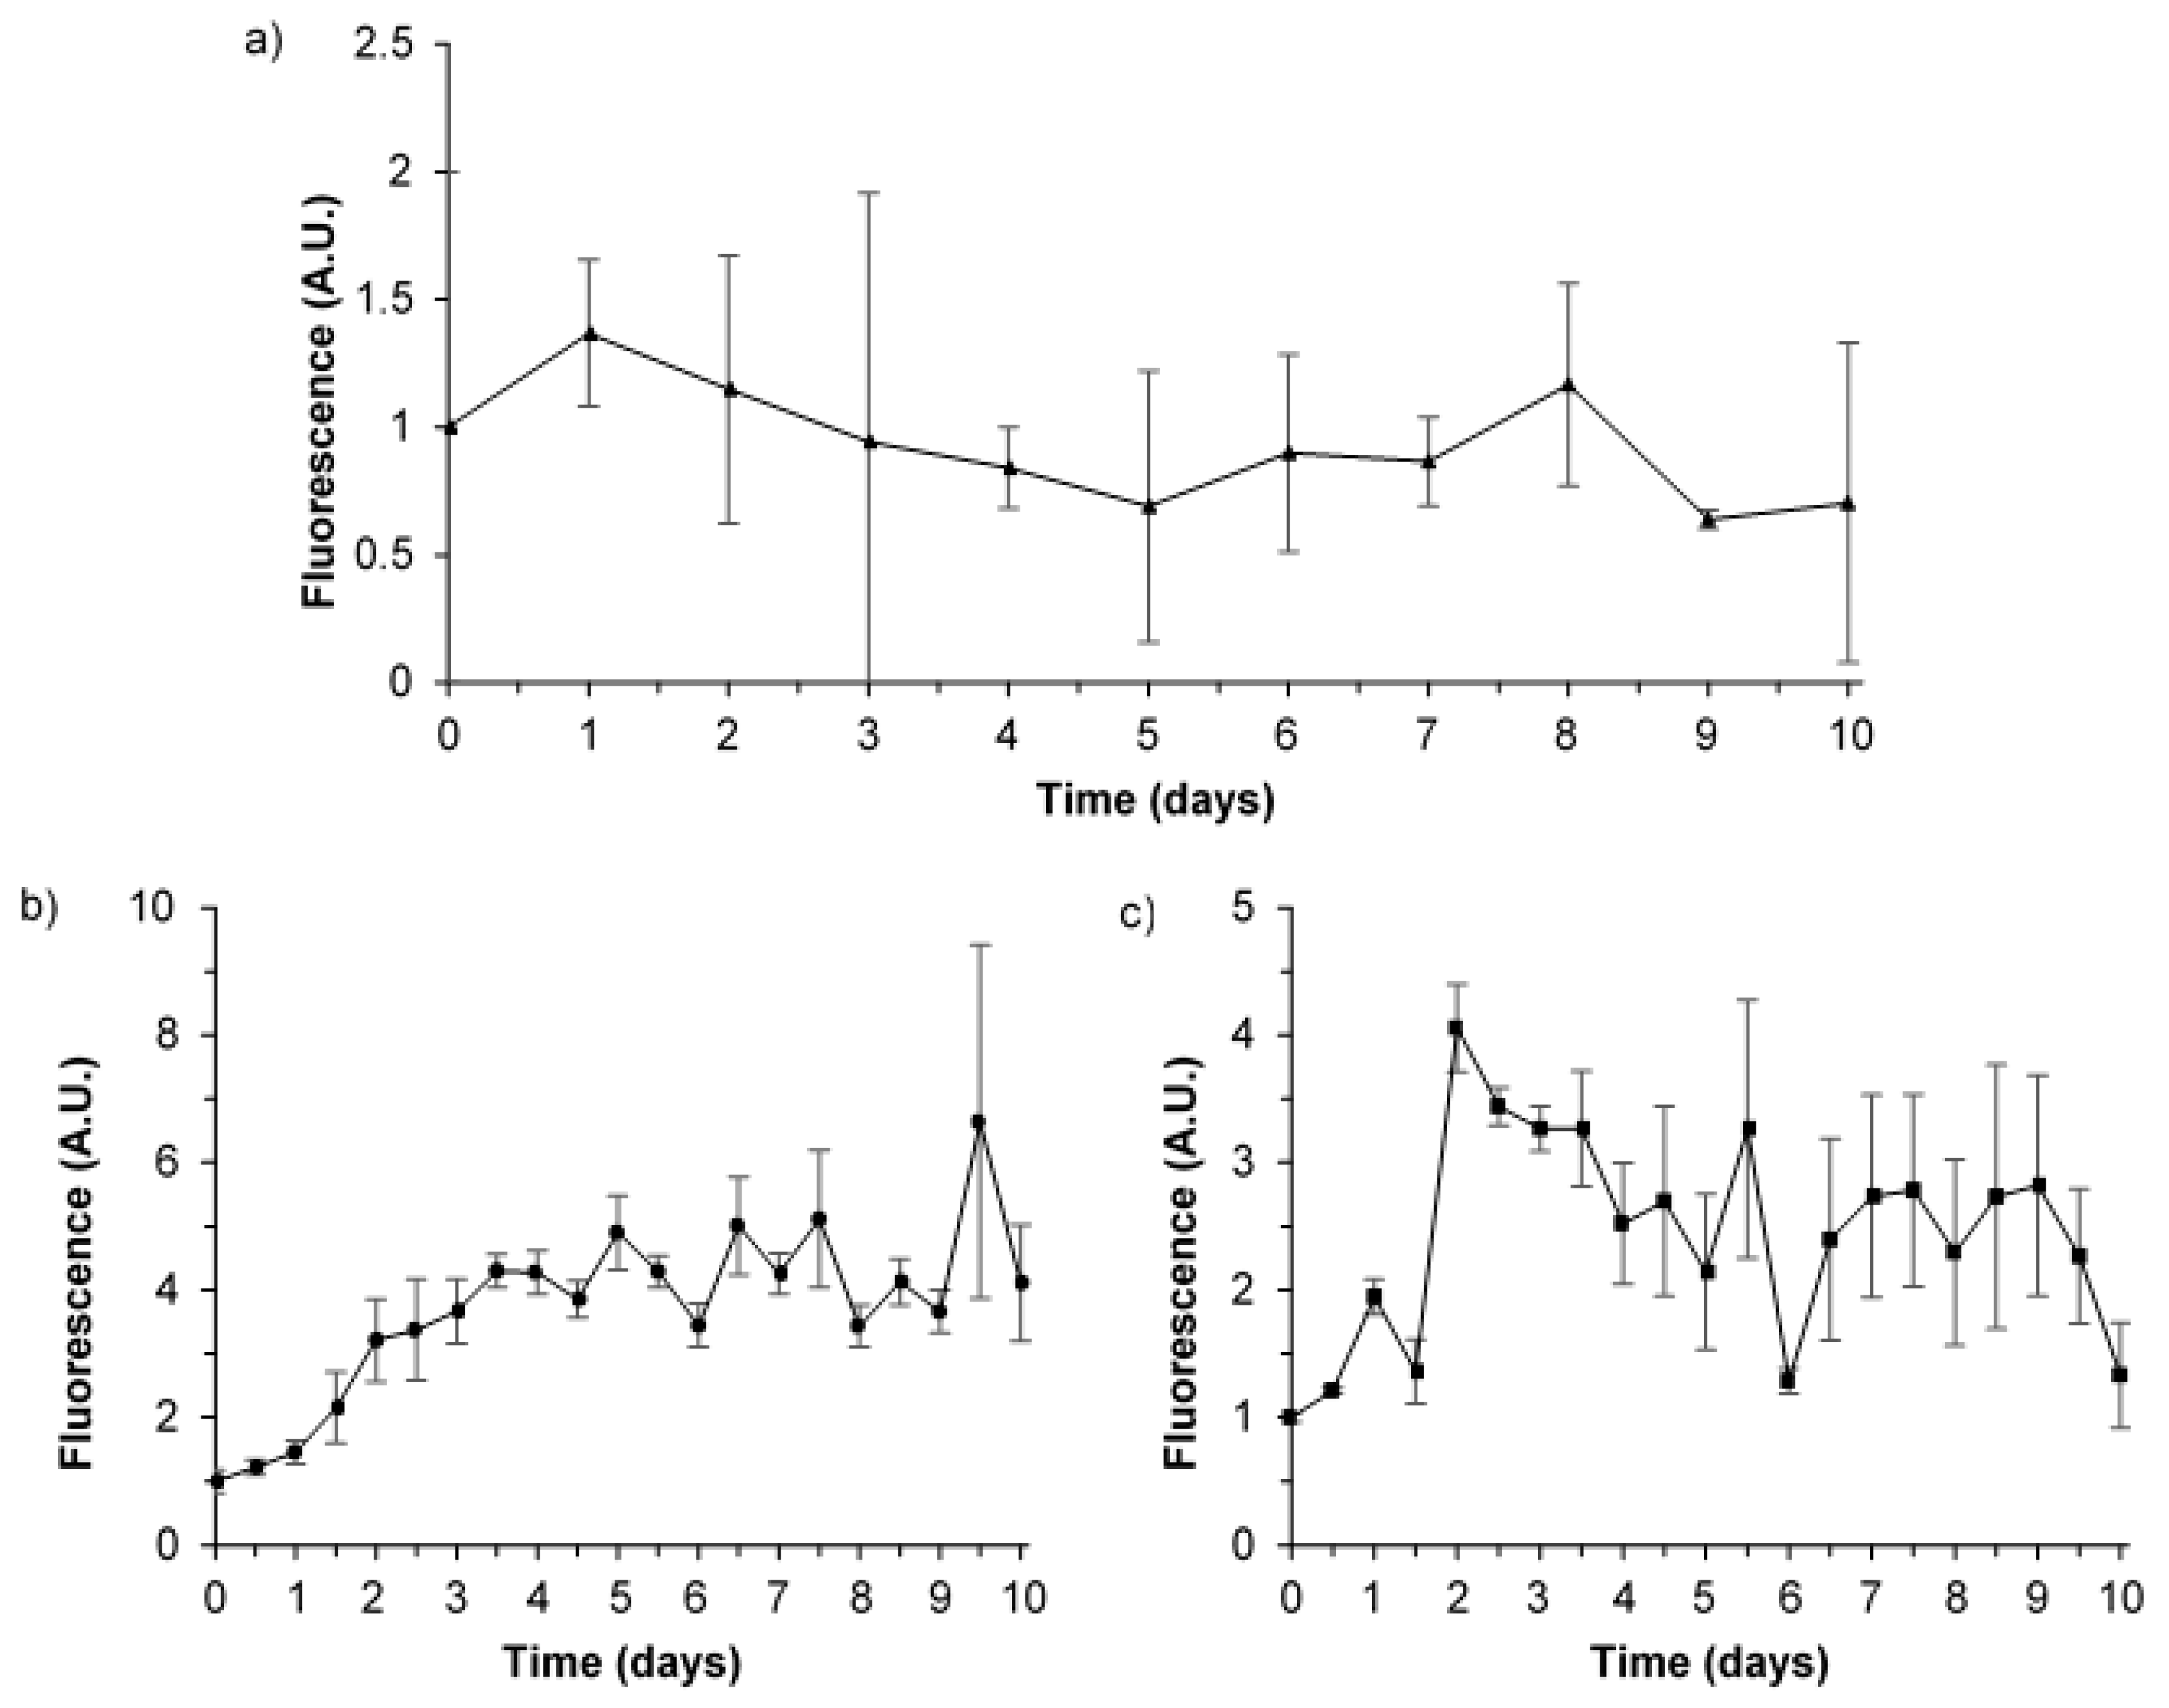
The developed model system (Section 2.2.1) was initially used to explore microbial-OM interactions (i.e., microbial processing) and AFOM variations (Peak T) within environmental water samples, as a function of time over a 10-day period. Temporal variation in the Peak T fluorescence signal, both decreasing and increasing in intensity, was identified within all experimental repeats, over the 10-day period, as shown in Figure 1a.
To enable the better understanding of microbial processing within a defined system, more simplistic sample matrices were employed, in the form of synthetic water samples and supplemented synthetic water samples (as detailed in Section 2.2.2). By using a minimal base media for these synthetic samples, any interfering background signal from fluorescing organic media material can be removed, allowing a simplified and more detailed investigation. Moreover, this low nutrient media more closely replicates environmental systems, limiting AFOM production, and resulting in a fluorescence intensity that is commensurate with that seen within environmental aquatic systems. Nonetheless, there was still significant variation in Peak T fluorescence throughout the 10-day period for these synthetic water samples (Figure 1b,c). Fluctuations in Peak T fluorescence highlight the variable nature of microbial production and the consumption of FOM, even within a controlled, closed model system.
To allow for quantitative analysis, the 10-day experiments for all sample types were repeated and all measured fluorescence intensities were standardised to quinine sulphate units, QSU (Section 2.3) [6,32,33]. The fluorescence spectral data set, containing 217 EEMs in total from environmental, synthetic and supplemented synthetic water samples, was subjected to PARAFAC analysis. This analysis of the EEM (n = 217) data (excluding EEMs with scattering anomalies) identified the common presence of five fluorescence components (Table 1). The five-component PARAFAC model accounted for 97.64% of the total variation in fluorescence, adequately describing the AFOM spectral variability. These fluorescence components have been previously described [9] and they are commonly attributed to freshwater AFOM, namely humic-like (components 2 and 4) and protein-like (components 1, 3, and 5) fluorescence peaks; components and fluorescence peaks are detailed in Table 1.
3.1. Microbial AFOM Processing over Time: Environmental Samples
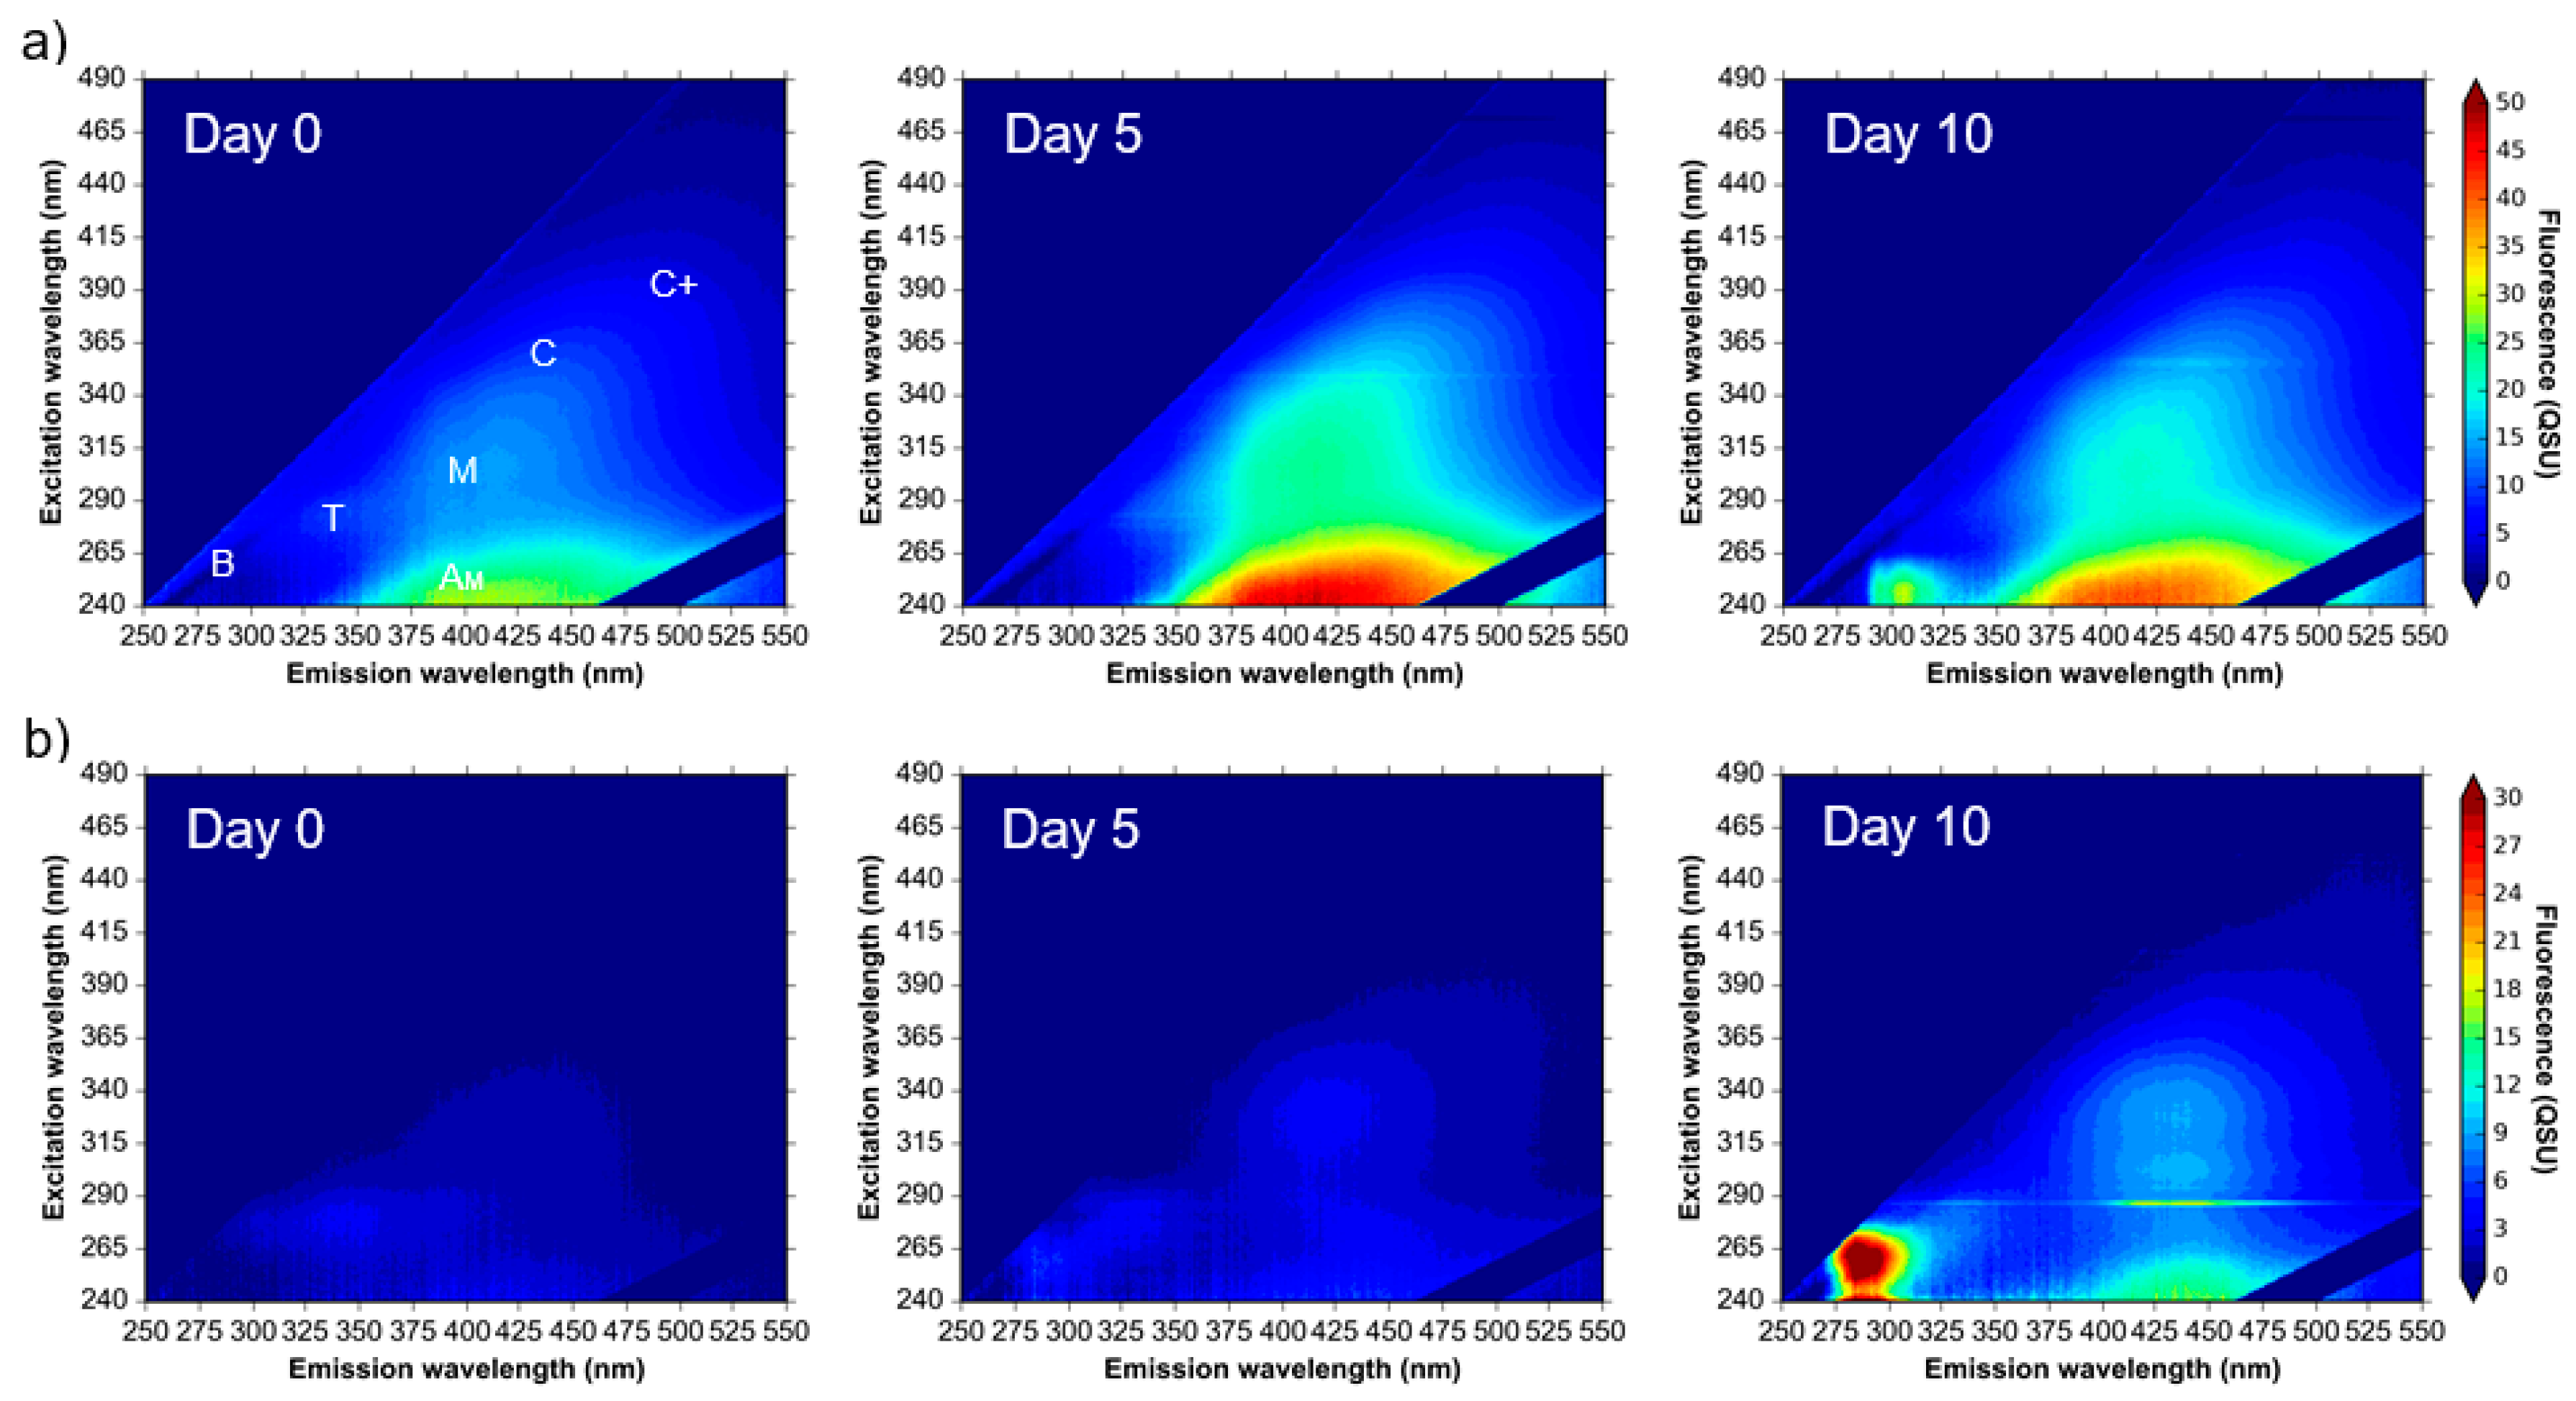
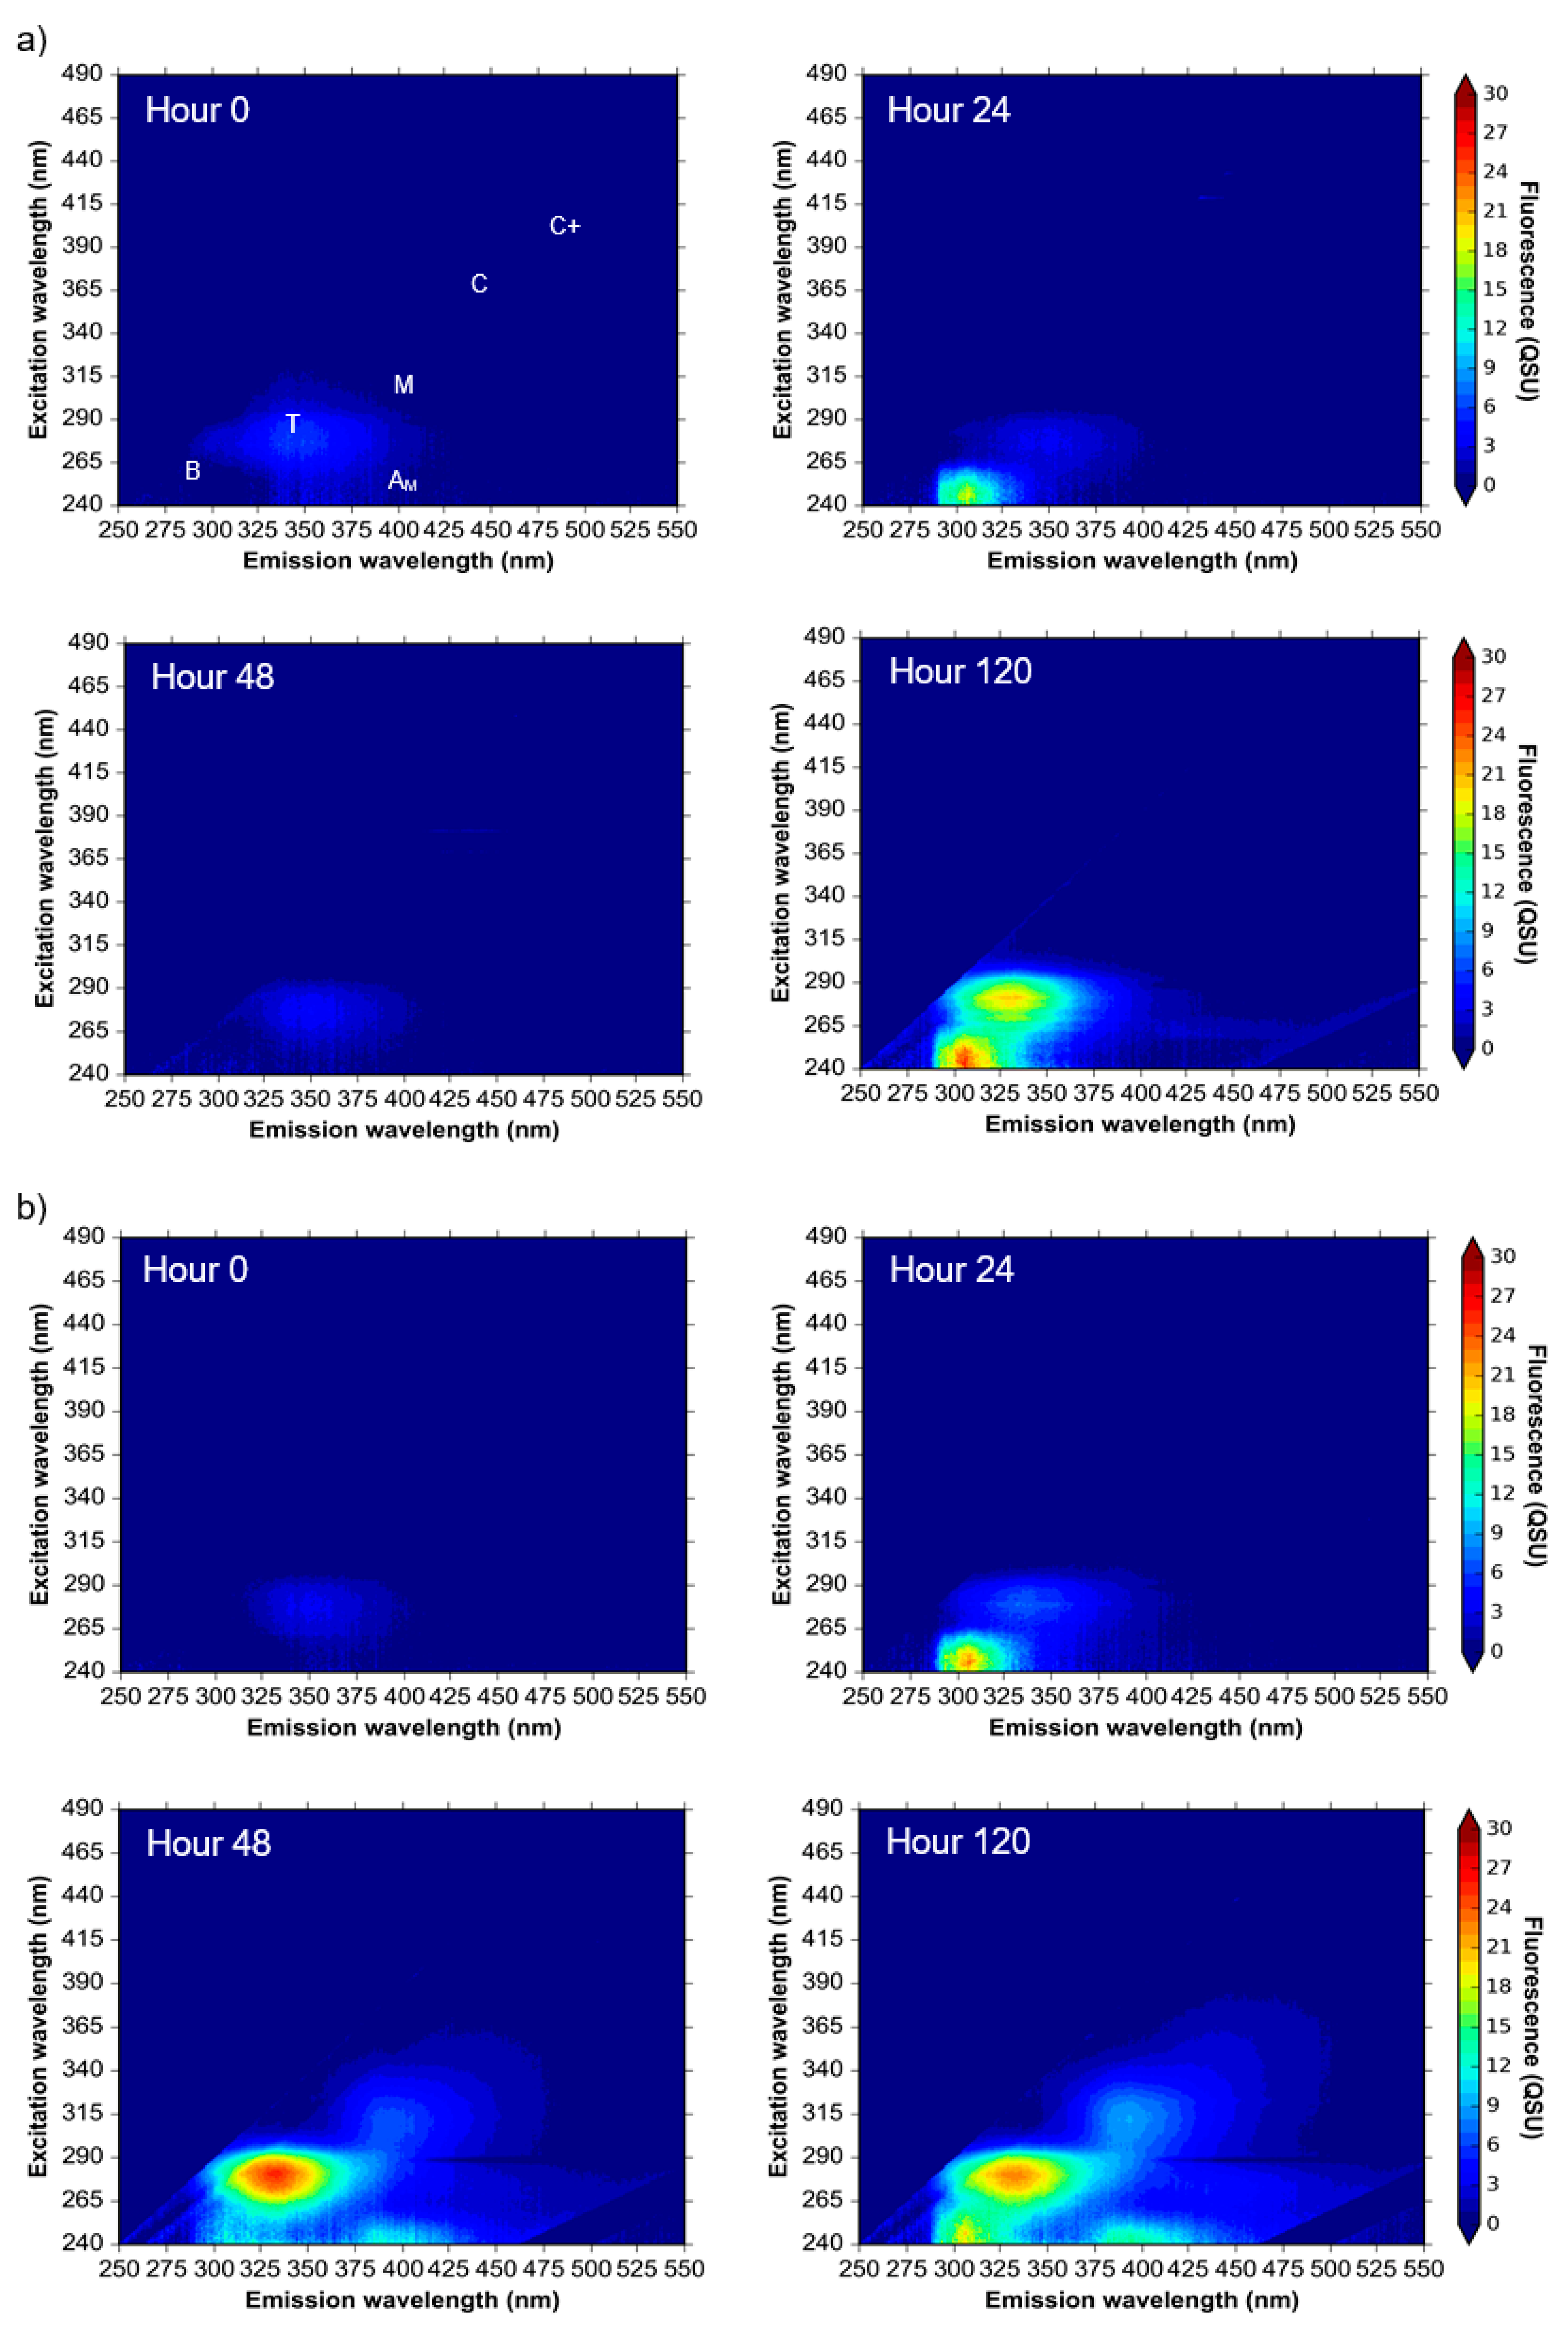
Environmental samples that were analysed throughout a 10-day period show an increase in the intensity of components 1 and 3 (Peaks T and B, respectively) from day zero to day five (Figure 2a). By day ten, Peak T had undergone decline, whilst the intensity of Peak B increased beyond the original intensity that was observed at day zero (Figure 2). This variation in fluorescence intensity over a 10-day period was observed for all model system experiments utilizing environmental water samples (Figure 1 and Figure 2). Components 2 (Peaks M and AM) and 4 (Peaks C and C+) were omnipresent within the environmental samples, and although some variation in the fluorescence intensity of these components was observed over the 10-day experimental period, the measured intensity was consistently higher than components 1 and 3 (Figure 2a).
3.2. Bacterial AFOM Processing over Time: Supplemented Synthetic Samples
The results from the incubation and analysis of environmental water samples highlighted the issues of matrix complexity and background fluorescence that are associated with such samples. To further explore time-resolved microbial-AFOM interactions, supplemented synthetic samples were used within the model system.
The supplemented synthetic water samples exhibited initial background fluorescence consistent with the fluorescence components that were observed in the environmental water samples, albeit at lower intensities (Figure 2b). By day two of the experiment, Peak T fluorescence (component 1) was shown to develop from a low baseline of 3 QSU to maxima of 25.2 QSU (data not shown). By day five, the fluorescence intensity of Peak T decreased to 2 QSU, and maintained a low fluorescence (between 0.5–5.5 QSU) throughout the remaining experimental period (Figure 2b). This variation in fluorescence intensity highlights the necessity of high-frequency monitoring to understand dynamic changes in Peak T that identify the utilisation of this AFOM by the microbial community, alongside its production [9].
For these supplemented synthetic water samples, PARAFAC components 2 and 4 (Table 1) varied as a function of time, reaching a maximum intensity (a factor of six higher than the initial intensity) on day two (data not shown). The fluorescence then decreased and remained stable until the second maxima (half the intensity of that observed on day two) was reached on day nine. Importantly, the observed variation associated with the fluorescence intensities of components 2 and 4 throughout the experimental period provides an indication that this AFOM is both labile and bioavailable.
3.3. Bacterial AFOM Processing over Time: Synthetic Samples
Four of the five PARAFAC components were identified within the EEMs for the synthetic samples (see Table 1). Upon observation of AFOM produced by microbial processing within the synthetic samples, it is revealed that PARAFAC components 2, 4, and 5 are present within all of the samples (Table 1). Once developed, the fluorescence peaks that gave rise to components 2 and 4 persisted throughout the 10-day experimental period, a phenomenon that was observed in all experimental repeats (Figure 1) and in agreement with other samples. The variation in the fluorescence intensity of these humic-like components throughout the 10-day experimental period exhibited a Coefficient of Variance (n = 5) between 54% and 104%. Interestingly, component 5 (Peak B) varied greatly throughout the 10-day experimental period (exhibiting a Coefficient of Variance (n = 5) between 73% and 232%), suggesting that both production and consumption of Peak B takes place in situ.
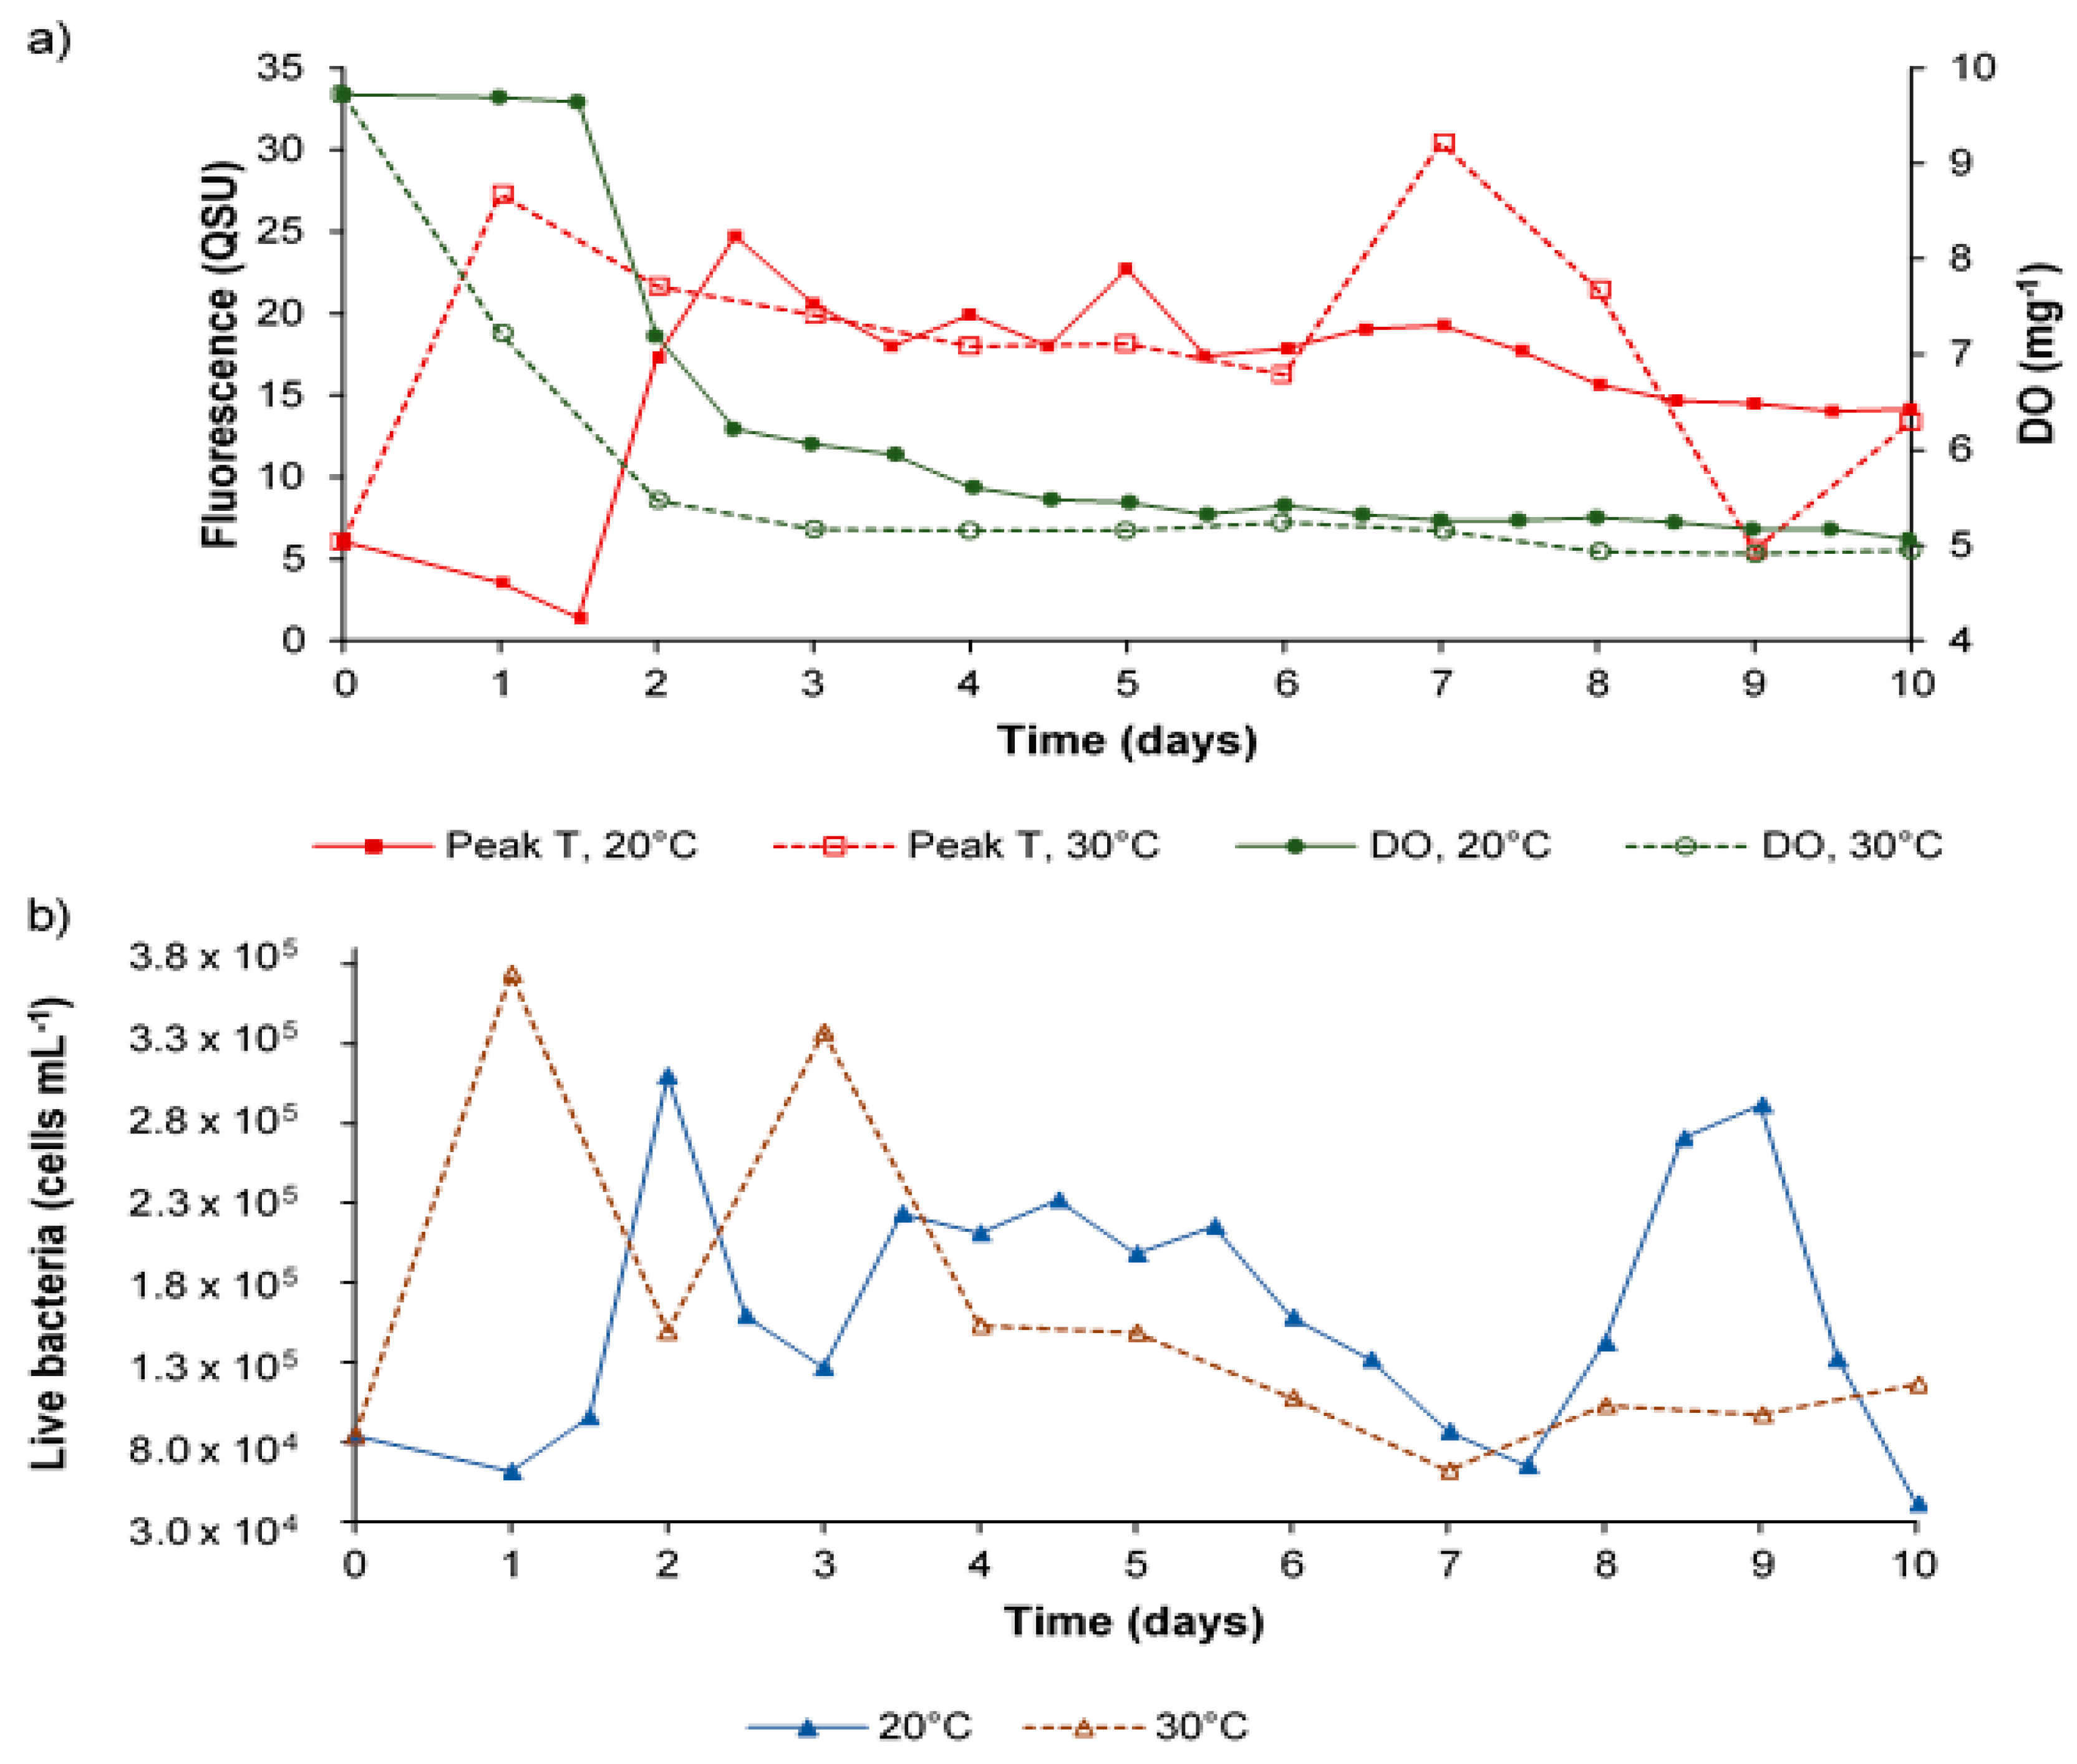
This work provides further evidence that Peak T is derived from an active bacterial population [6]. The development of Peak T fluorescence (component 1) can be accelerated via incubation at 30 °C when compared to data that was derived from samples incubated at 20 °C, as shown in Figure 3. Both incubation temperatures produced a variable Peak T fluorescence intensity throughout the 10-day experimental period.
Variation in dissolved oxygen and Peak T fluorescence in synthetic water samples was monitored on a daily basis. This data indicated that Peak T fluorescence intensity was variable over time, whilst DO declined and then plateaued, as expected. This data clearly demonstrates that, within the model system, Peak T fluorescence is extremely variable (Figure 3). Whilst the DO concentration undergoes rapid decline during the first two days before experiencing a plateau, it is not fully depleted, suggesting that it does not present a limiting factor within the model system. Importantly, this data demonstrates that there was no significant correlation between the intensity of Peak T and the enumeration of live, dead, or total bacterial cell counts (p > 0.5).
3.4. Hourly Monitoring of Synthetic Samples: Bacterial Growth and Fluorescence Development
To further understand the development of bacterial-OM fluorescence within the model system, synthetic samples were cultured and incubated at a series of temperatures to provide evidence of the production of fluorescence peaks in the absence of OM. Samples were analysed at hourly intervals over a 48-h period and then again after 120 h.
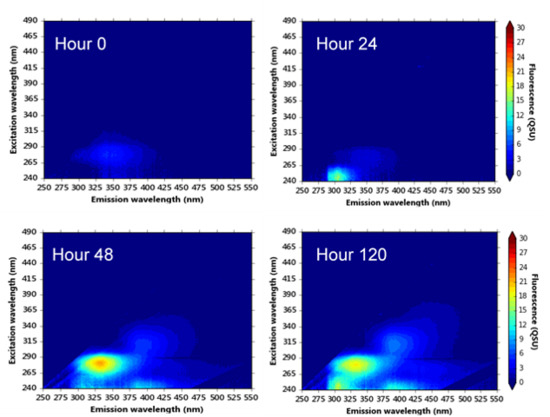
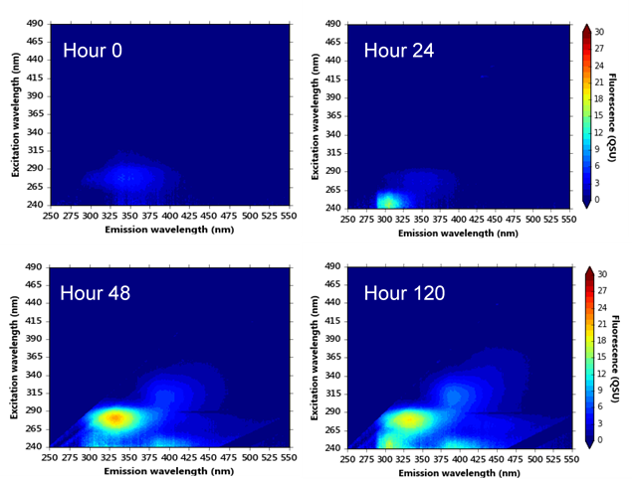
The EEMs from this dataset were included in the PARAFAC model (Table 1). Component 2 was identified within the synthetic samples, as was component 4, albeit at low fluorescence intensities; a “shoulder” of this fluorescence can be seen in Figure 4b. Peaks T and B were present in all samples (see Figure 4). Interestingly, in comparison to the environmental and supplemented synthetic samples, Peak B was only identified as component 5 within the synthetic samples (no component 3 was observed), see Table 1. Throughout the 48-h period, the OM that gives rise to Peak B fluorescence was shown to be produced and assimilated, resulting in large variations in the fluorescence intensities (see Figure 4).
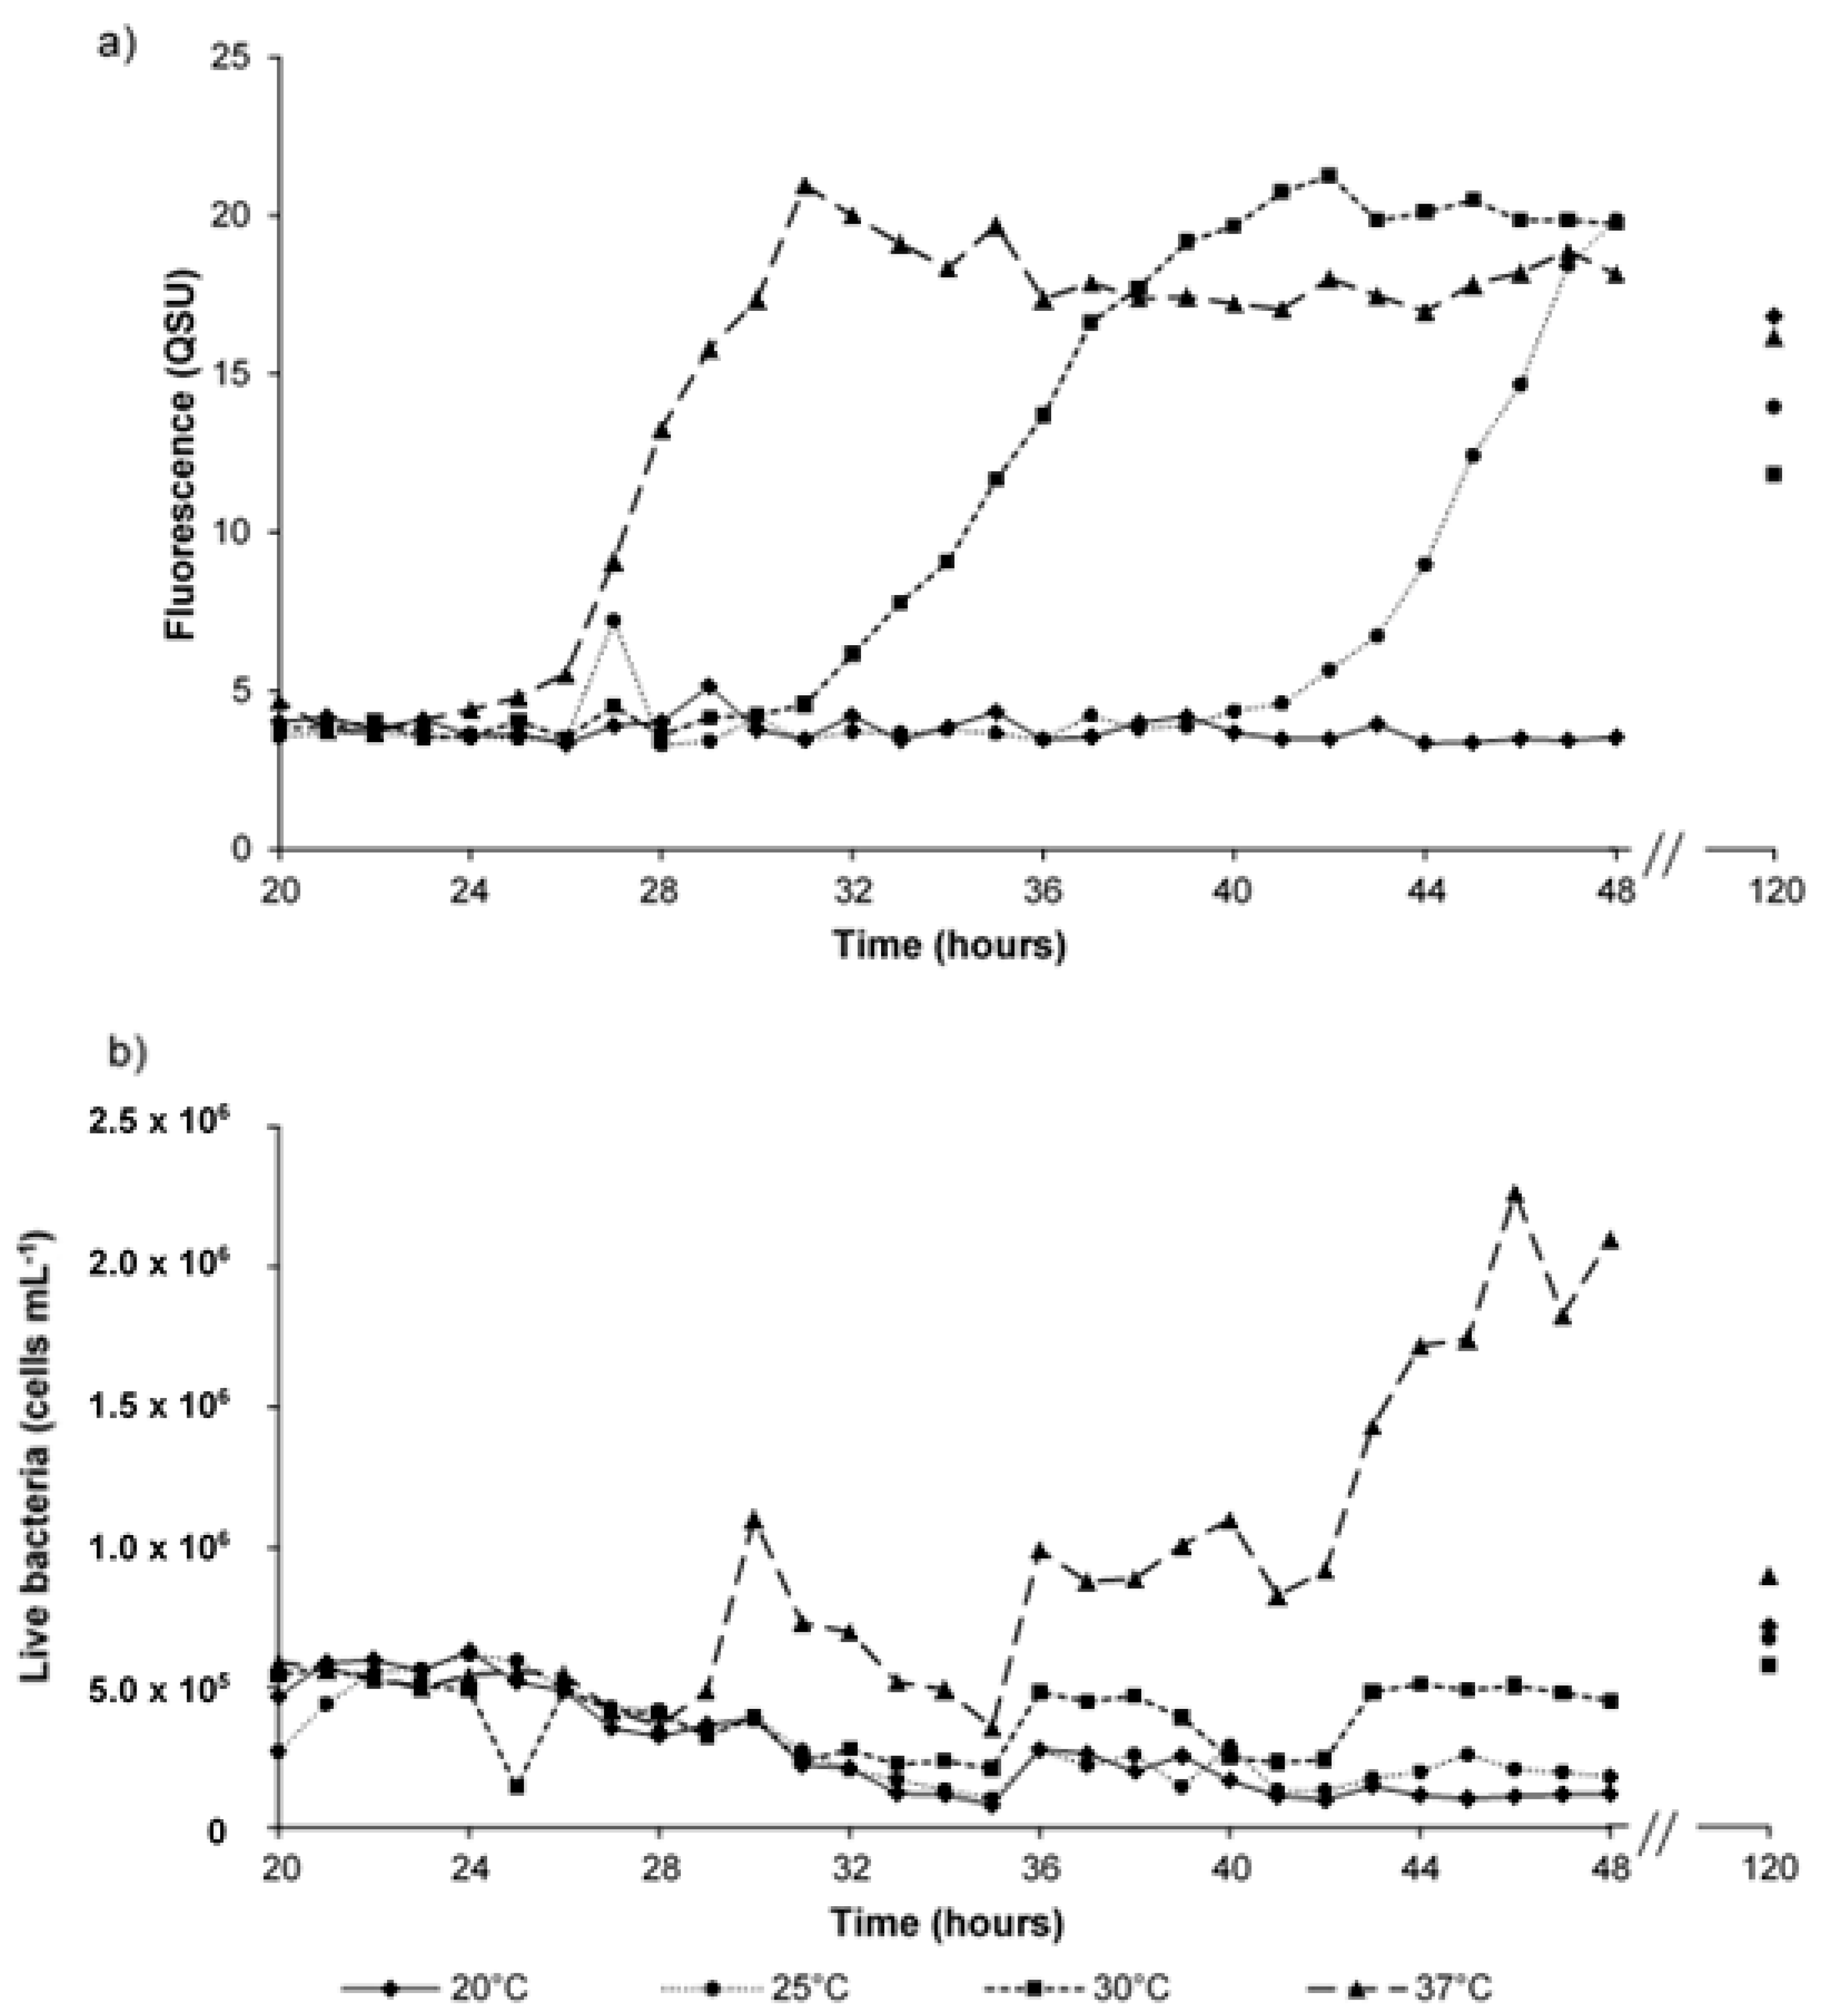
Peak T fluorescence was observed in all synthetic samples at all temperatures (component 1, Table 1). For the first 24 h, the development of Peak T fluorescence that was observed in all samples was minimal (~ 3 QSUmin). However, Peak T fluorescence was seen to develop five-fold (16.8 QSUmax) by the 120 h time point at 20 °C incubation (Figure 4 and Figure 5), which is in agreement with data gained from the 10-day experiments (Figure 3). The data shown in Figure 5a shows that incubation temperature is directly correlated with the production and development of Peak T, likely to be as a function of increased bacterial metabolic activity.
Analysis that was undertaken at hourly intervals from samples incubated at 37 °C show that an observed log-fold increase in living bacterial numbers (5.0 × 10⁵ live cells mL−1 to 2.4 × 10⁶ live cells mL−1), at hour 46, was preceded by a four-fold increase (from 5 QSU to 20 QSU), at hour 31, in Peak T fluorescence intensity. Although the initial induction of Peak T fluorescence can be identified, the monitoring of the fluorescence phenomenon dynamics at hourly intervals reveals no significant correlations (p > 0.5) between Peak T fluorescence intensity and bacterial cell enumeration for either live, dead, or total cell counts.
4. Discussion
4.1. Microbially Engineered Protein-Like Fluorescence
The data that was obtained from the model system demonstrated the increase and decrease in the Peak T fluorescence signal (Component 1, Table 1) over time, for all sample types; environmental, supplemented synthetic, and synthetic. This is clearly demonstrated by the peak picking data in Figure 1 and the EEMs presented in Figure 2. The variation in fluorescence intensity over the 10-day experimental period indicates both the production and processing of AFOM in situ [6]. This provides evidence that Peak T fluorescence can be of autochthonous origin and is labile [6,9]. However, whilst the variation in the fluorescence signal over time is reproducible, the importance of the sample matrix and community composition is highlighted by the variation between model system experiments, as demonstrated by Figure 1.
The use of synthetic samples within the model system (i.e., in the absence of environmental DOM) highlights the autochthonous origins of the proteinaceous AFOM, namely peaks T and B; identified within the PARAFAC analysis as components 1 and 3, respectively (Table 1). Peak B is seen to vary greatly throughout the 10-day experimental period, suggesting both production and consumption of the OM in situ. This further supports previous studies that reported Peak B to be a labile and microbially-derived compound [34,35]. This work also provides further evidence that Peak T is derived from an active bacterial population, via bacterial metabolic processes, as has been previously suggested in recent literature [6,36,37]. This is highlighted by the accelerated development of Peak T fluorescence when increasing the incubation temperature, from 20 °C to 30 °C (Figure 3). This supports the hypothesis that Peak T fluorescence is the result of microbial metabolic processes, and that the rate of its formation is dependent on the rate of microbial activity (and therefore metabolism) [6,38]. Within synthetic samples incubated at 30 °C, the increase in Peak T intensity, while bacterial numbers and DO remains constant, which also indicates that Peak T can provide information about microbial activity and metabolic processing, irrespective of microbial density. This is further supported by the lack of significant correlation identified between Peak T and bacterial numbers within this work. By using high resolution temporal scales not investigated in previous Peak T/DO research, this work challenges the correlations that were previously reported in the literature. This is likely the result of the complex and dynamic interactions that occur within a given microbial community, suggesting that Peak T fluorescence is not a suitable proxy for bacterial enumeration, but instead it is indicative of microbial activity. Furthermore, and most importantly, the observation of variable Peak T intensity at both incubation temperatures suggests that this AFOM can be processed and produced in situ by the bacterial community present within the sample [6].
Fluorescence, Microbes and Dissolved Oxygen
Previous research supports the relationship between Peak T fluorescence and the BOD [13,15,39]. As a result, Peak T fluorescence is often used as a surrogate for the BOD5 test, an important water quality parameter. The BOD5 is a widely utilised method by which to approximate bioavailable organic matter, through measuring the change in oxygen over a five-day period as a consequence of biological activity [40]. Interference from background fluorescence within the environmental water samples analysed within this study prevented the accurate determination of the variation and dynamics of Peak T fluorescence. However, the results from the analysis of synthetic samples (Figure 3) show that Peak T can be clearly identified without interference from Peak C. The data shown in Figure 3 for the synthetic water samples demonstrates the variation in Peak T fluorescence intensity, with a steady decline in DO. This suggests that the correlations between Peak T and BOD5 that have been previously stated in the literature are limited by the temporal resolution of the analysis (five days). Within this study, despite the observed increase in Peak T fluorescence, the temporal dynamism of its production indicates that Peak T fluorescence alone is difficult to apply as a BOD5 proxy, which has a fixed and defined temporal resolution of five days. This elucidation of dynamic bacterial processing of organic material has only been possible due to the measurement of fluorescence and DO concentrations at higher temporal resolutions. However, although the variability of Peak T fluorescence, alongside the steady decline in DO concentration, resulted in no significant correlation being identified between these two parameters, significant correlations would exist, if only day zero and day five data was analysed, as per the BOD5 test and observations from previous studies [13,18,41]. The time-resolved data presented here demonstrates that the relationship between Peat T and bacteria is complex and more related to microbial metabolism and processing, as opposed to only oxygen demand [42].
By investigating the dynamic relationship between DO mass transfer and Peak T fluorescence with higher temporal resolution analysis, clear variation between the time points can be seen. This provides evidence that the BOD5 test is not representative of such an active system [20], rendering it unsuitable for comparison with fluorescence in a dynamic system and explaining the lack of significant correlations in the data presented here. From this study, it can be concluded that the BOD5 and Peak T fluorescence cannot be correlated due to the disparities between the analysis techniques [20]. The BOD5 test is limited due to the low temporal resolution, assumptions that are made about the system under study, and its representation of a demand without providing any information concerning the rate or kinetics of this demand. The data presented in this study highlights the significance of the rate of metabolic activity within the microbial community and its relationship with fluorescence signal development. This further supports the view proposed by Hudson et al., (2008), which suggests using Peak T fluorescence as an independent indicator of labile material [15]. Ultimately, this would allow for the development of a real-time monitoring system for microbial activity in aquatic systems.
4.2. Microbially Engineered Humic-Like Fluorescence
The data presented suggests that the in situ production and consumption of AFOM occurs as a result of microbial processing within all sample types. By using environmental samples within the model system, we can attempt to gain an insight into the microbial-FOM dynamics that occur in large-scale systems. The omnipresence of fluorescence Peaks C and M within the environmental samples (Figure 2), which are identified as humic and terrestrial in nature, supports the notion that the majority of the AFOM found in environmental samples (components 2 and 4, Table 1) is inherently recalcitrant in nature [25,43,44]. This is in line with the general understanding that component 4, Peak C, represents high molecular weight non-bioavailable AFOM, currently considered to be of allochthonous origin [37], whereas component 2, Peak M, is biodegraded material. However, some variation in the fluorescence intensity for these components was observed over time, suggesting that the production and processing of these AFOM components may be occurring in situ [6]. The ability to gain a comprehensive insight of the microbial community’s potential to influence these humic-like components is significantly hampered by the presence of background fluorescence that occurs within all environmental samples.
The use of supplemented synthetic samples (Figure 2) within the model system removed much of the background fluorescence that is seen in the environmental samples whilst providing a natural OM source. The increase and variability of component 2 and component 4 fluorescence intensity that is observed within the supplemented synthetic samples further supports the assertion (as seen in the environmental samples) that humic-like fluorescence can be produced, potentially as metabolic by-products or functional/structural components, within the bacterial cell and exported and utilised in situ by the microbial community [6]. This challenges the current status quo within much of the freshwater AFOM research, as it demonstrates that these fluorescence peaks are not solely attributed to terrestrial allochthonous sources. Although this is in agreement with the established literature within marine-based AFOM studies [11,32,45], it has only has recently been proposed for freshwater systems [46]. The use of closed model systems and high-temporal monitoring enables the observation of both the production and consumption of a range of AFOM compounds and highlights the dynamic changes to AFOM composition as a result of microbial processes.
The use of synthetic samples within the model system (i.e., in the absence of a natural OM source) clearly demonstrates the ability of the microbial community to produce AFOM in situ, albeit under controlled closed conditions. These samples provide clear evidence, in line with the environmental and supplemented synthetic samples, that ‘microbially-derived’ AFOM are not, in theory, restricted to proteinaceous material or the degradation of humic-like compounds. Higher molecular weight AFOM can be engineered by microbes in situ, potentially arising from the production of functional/structural components or metabolic by-products created within the bacterial cell and exported. Again, this is in agreement with recent FOM research, which has focused on marine environments [11,33,47], soils [48], and some freshwater literature [6,46]. Similarly to protein-like fluorescence, these fluorescence peaks, once developed, are persistent but variable in intensity throughout the 10-day experimental period. This is supported by the observation of this phenomenon throughout the use of the model system and it therefore demonstrates the fast-acting microbial dynamics that are involved in the consumption and production of Peaks M, AM, C and C+ [49]. The microbial building of higher molecular weight recalcitrant OM, as shown here, could have important implications for longer-term carbon storage and transportation throughout the aquatic continuum [43,50,51].
4.3. Microbially Engineered AFOM: Hourly Fluorescence and Bacterial Enumeration Measurements
Utilising an hourly temporal resolution of fluorescence monitoring within the model system provides details regarding the fast-acting dynamics of bacterial-OM interactions. These time resolved experiments further demonstrate the lability of Peak B (Figure 5), whereby the dynamic nature of its production results in no significant correlation between Peak B fluorescence and bacterial numbers. However, its omnipresence, alongside Peak T, asserts these fluorescence peaks as ‘microbially-derived’ and they are consequently associated with the presence of an aquatic microbial component. The five-fold increase in Peak T fluorescence intensity, as seen in both Figure 4 and Figure 5, further highlights the dynamics of microbial metabolism and the impact that this has on the origin of such AFOM. For the hourly monitored samples (Figure 5), there is an initial observed lag in Peak T fluorescence development, suggesting that residence time may be important for the production of autochthonous AFOM, particularly within nutrient limited environments (as shown here). The impact of incubation at a range of temperatures clearly demonstrates the relationship between microbial metabolic activity and fluorescence intensity, as evidenced from synthetic sample data obtained during the 10-day experiment. This directly supports the hypothesis that heterotrophic microbial metabolism, and its rate, are key drivers in the production of microbially-derived AFOM [34,35,38].
The fluorescence intensity increase preceding that of cell multiplication suggests the upregulation of bacterial metabolic processes, at least within this nutrient limited system, prior to cell multiplication. This provides supporting evidence that microbially-derived fluorescence is the result of metabolic activity. It is likely that this discrepancy is the reason that significant correlations were not identified, within this study, between the Peak T fluorescence and microbial enumeration. This is in agreement with the daily samples from the 10-day experimental period previously discussed. From this, unlike groundwater systems [21,22], it can be recommended that Peak T fluorescence cannot be used to determine species specific enumeration within surface freshwater systems where there is high AFOM background [12,52]. From the data that is presented within this study, it can be suggested that the correlations identified in other work are limited by low temporal resolution (five days) used during sample analysis and not truly reflective of the complex microbial-OM interactions that occur within these dynamic systems. The higher resolved temporal study data presented here clearly identifies the bacterial origin of Peak T fluorescence. Therefore, it can be proposed that the microbially-derived fluorescence observed in aquatic systems is a function of heterotrophic microbial metabolism, as opposed to a measure of absolute bacterial cell enumeration.
The time resolved analysis of synthetic samples (Figure 4) also provides further clear direct evidence that AFOM, attributed to Peak M and Peak AM (Table 1), can be manufactured without the presence of terrestrial OM material, namely Peak C [25,46], as reported in marine OM research [32,33,51]. However, this study provides detailed insight into dynamic production and the assimilation of microbially-derived FOM in freshwater systems, both temporally and over a range of temperatures. From this, further evidence is provided that supports the attribution of Peak M to microbially-derived extracellular AFOM production. The shoulder of Peak C+ seen at the 120 h time point (Figure 4) is in agreement with Peak C+ production in the 10-day experiments. This highlights the importance of temporal differences in metabolic processes and community composition on the AFOM characteristics of a freshwater body. This further supports the hypothesis that the autochthonous production of OM extends beyond proteinaceous material into higher molecular weight compounds.
In addition to the importance of microbial metabolism, the data also highlights the need to further study the role of low nutrient environments in the production and assimilation of AFOM. When synthetic water was used within the model system to investigate the production and assimilation of AFOM, the Peak T fluorescence QSUmax was approximately 25 (see Figure 3, Figure 4 and Figure 5). It is likely that this maximum is limited by nutrient availability, further supporting the theory that aquatic fluorescence organic matter is intrinsically related to the microbial metabolism at a community level, which is, in turn, limited by the environmental constraints of the system. Moreover, lower temperatures, such as those reflective of temperate surface waters (5–15 °C) [53], should also be researched to assess the impact that this has on metabolic activity and resultant AFOM processes.
In addition to the impact of temperature on microbial processing, further research is necessary to understand the effects of diurnal and seasonal variations. This study has been limited to the application of Peak T as an independent water quality parameter within surface freshwaters. However, this research builds upon existing AFOM research undertaken in groundwaters [21,54,55], surface freshwaters [52,56,57], estuarine systems [50,58], and the marine environment [11,36,59]. The wide spread use of this approach throughout the hydrological continuum would need to account for the differing complexities of sample matrices. Understanding the origins of Peak T enables its use as a parameter for monitoring bacterial activity within aquatic systems. As an independent water quality parameter, Peak T can provide insight into the in situ and real-time microbial dynamics in relation to organic matter processing. The efficiency and resilience of such processing underpins aquatic system health. Therefore, the spatial and temporal sensing of such a parameter throughout a catchment will enable and enhance water quality management.
5. Conclusions
The temporal scales used within our laboratory model system demonstrate, for the first time, the evolution of AFOM produced by bacterial communities through time. We reveal the details of the fast-acting dynamics of bacterial-OM interactions and AFOM production. In this study, there are no significant correlations between bacterial enumeration and fluorescence intensities. Therefore, we demonstrate that Peak T fluorescence is not an appropriate proxy for bacterial enumeration, particularly in samples where a high AFOM background is present. Furthermore, Peak T fluorescence and BOD5 should be used independently of each other, with in situ Peak T fluorescence providing a real-time indicator of microbial activity in freshwater aquatic systems, as opposed to the biological oxygen demand. Finally, this work provides evidence that bacterial communities can produce a range of complex high molecular weight AFOM, in situ, likely to be metabolic by-products or the production of structural/functional components, created within the bacterial cell and exported.
Author Contributions
Conceptualization, D.M.R., A.M.A., R.M.S.T., J.W.A. and B.G.F.; Methodology, B.G.F., D.M.R. and R.M.S.T.; Software, B.G.F.; Validation, B.G.F.; Formal Analysis, B.G.F.; Investigation, B.G.F.; Resources, B.G.F., D.M.R. and R.M.S.T.; Data Curation, B.G.F.; Writing-Original Draft Preparation, B.G.F., D.M.R. and R.M.S.T.; Writing-Review & Editing, J.W.A., A.M.A. and T.C.; Visualization, B.G.F., R.M.S.T. and D.M.R.; Supervision, D.M.R., R.M.S.T., J.W.A., A.M.A. and T.C.; Project Administration, D.M.R., B.G.F. and R.M.S.T.; Funding Acquisition, D.M.R., A.M.A., J.W.A., and T.C.
Funding
This research was funded by the Natural Environment Research Council, UK [NE/K007572/1].
Conflicts of Interest
The authors declare no conflict of interest.
References
- Baker, A.; Spencer, R.G.M. Characterization of dissolved organic matter from source to sea using fluorescence and absorbance spectroscopy. Sci. Total Environ. 2004, 333, 217–232. [Google Scholar] [CrossRef] [PubMed]
- Larsen, L.G.; Aiken, G.R.; Harvey, J.W.; Noe, G.B.; Crimaldi, J.P. Using fluorescence spectroscopy to trace seasonal DOM dynamics, disturbance effects, and hydrologic transport in the Florida Everglades. J. Geophys. Res. Biogeosci. 2010, 115, 1–14. [Google Scholar] [CrossRef]
- Bieroza, M.Z.; Heathwaite, A.L. Unravelling organic matter and nutrient biogeochemistry in groundwater-fed rivers under baseflow conditions: Uncertainty in in situ high-frequency analysis. Sci. Total Environ. 2016, 572, 1520–1533. [Google Scholar] [CrossRef] [PubMed] [Green Version]
- Omori, Y.; Hama, T.; Ishii, M.; Saito, S. Vertical change in the composition of marine humic-like fluorescent dissolved organic matter in the subtropical western North Pacific and its relation to photoreactivity. Mar. Chem. 2011, 124, 38–47. [Google Scholar] [CrossRef]
- Reynolds, D.M. The Principles of Fluorescence. In Aquatic Organic Matter Fluorescence; Baker, A., Reynolds, D.M., Lead, J., Coble, P.G., Spencer, R.G.M., Eds.; Cambridge Environmental Chemistry Series; Cambridge University Press: Cambridge, UK, 2014; pp. 3–34. ISBN 9780521764612. [Google Scholar]
- Fox, B.G.; Thorn, R.M.S.; Anesio, A.M.; Reynolds, D.M. The in situ bacterial production of fluorescent organic matter; an investigation at a species level. Water Res. 2017, 125, 350–359. [Google Scholar] [CrossRef] [PubMed] [Green Version]
- Stedmon, C.A.; Markager, S. Resolving the variability of dissolved organic matter fluorescence in a temperate estuary and its catchment using PARAFAC analysis. Limnol. Oceanogr. 2005, 50, 686–697. [Google Scholar] [CrossRef]
- Pellerin, B.A.; Saraceno, J.F.; Shanley, J.B.; Sebestyen, S.D.; Aiken, G.R.; Wollheim, W.M.; Bergamaschi, B.A. Taking the pulse of snowmelt: In situ sensors reveal seasonal, event and diurnal patterns of nitrate and dissolved organic matter variability in an upland forest stream. Biogeochemistry 2012, 108, 183–198. [Google Scholar] [CrossRef]
- Coble, P.G.; Lead, J.; Baker, A.; Reynolds, D.M.; Spencer, R.G.M. Aquatic Organic Matter Fluorescence; Cambridge University Press: Cambridge, UK, 2014; ISBN 9780521764612. [Google Scholar]
- Khamis, K.; Bradley, C.; Hannah, D.M. Understanding dissolved organic matter dynamics in urban catchments: Insights from in situ fluorescence sensor technology. Wiley Interdiscip. Rev. Water 2017, 5, e1259. [Google Scholar] [CrossRef]
- Stolpe, B.; Zhou, Z.; Guo, L.; Shiller, A.M. Colloidal size distribution of humic- and protein-like fluorescent organic matter in the northern Gulf of Mexico. Mar. Chem. 2014, 164, 25–37. [Google Scholar] [CrossRef]
- Sorensen, J.P.R.; Vivanco, A.; Ascott, M.J.; Gooddy, D.C.; Lapworth, D.J.; Read, D.S.; Rushworth, C.M.; Bucknall, J.; Herbert, K.; Karapanos, I.; et al. Online fluorescence spectroscopy for the real-time evaluation of the microbial quality of drinking water. Water Res. 2018. [Google Scholar] [CrossRef]
- Baker, A.; Inverarity, R. Protein-like fluorescence intensity as a possible tool for determining river water quality. Hydrol. Process. 2004, 18, 2927–2945. [Google Scholar] [CrossRef]
- Hudson, N.; Baker, A.; Reynolds, D.M. Fluorescence Analysis of Dissolved Organic Matter in Natural, Waste and Polluted Water—A Review. River Res. Appl. 2007, 23, 631–649. [Google Scholar] [CrossRef]
- Hudson, N.; Baker, A.; Ward, D.; Reynolds, D.M.; Brunsdon, C.; Carliell-Marquet, C.; Browning, S. Can fluorescence spectrometry be used as a surrogate for the Biochemical Oxygen Demand (BOD) test in water quality assessment? An example from South West England. Sci. Total Environ. 2008, 391, 149–158. [Google Scholar] [CrossRef] [PubMed]
- Coble, P.G. Characterization of marine and terrestrial DOM in seawater using excitation-emission matrix spectroscopy. Mar. Chem. 1996, 51, 325–346. [Google Scholar] [CrossRef]
- Reynolds, D.M. Rapid and direct determination of tryptophan in water using synchronous fluorescence spectroscopy. Water Res. 2003, 37, 3055–3060. [Google Scholar] [CrossRef] [Green Version]
- Bridgeman, J.; Baker, A.; Carliell-Marquet, C.; Carstea, E. Determination of changes in wastewater quality through a treatment works using fluorescence spectroscopy. Environ. Technol. 2013, 34, 3069–3077. [Google Scholar] [CrossRef] [PubMed]
- Reynolds, D.M. The differentiation of biodegradable and non-biodegradable dissolved organic matter in wastewaters using fluorescence spectroscopy. J. Chem. Technol. Biotechnol. 2002, 77, 965–972. [Google Scholar] [CrossRef]
- Carstea, E.M.; Bridgeman, J.; Baker, A.; Reynolds, D.M. Fluorescence spectroscopy for wastewater monitoring: A review. Water Res. 2016, 95, 205–219. [Google Scholar] [CrossRef] [PubMed] [Green Version]
- Sorensen, J.P.R.; Baker, A.; Cumberland, S.A.; Lapworth, D.J.; MacDonald, A.M.; Pedley, S.; Taylor, R.G.; Ward, J.S.T. Real-time detection of faecally contaminated drinking water with tryptophan-like fluorescence: Defining threshold values. Sci. Total Environ. 2018, 622–623, 1250–1257. [Google Scholar] [CrossRef] [PubMed]
- Sorensen, J.P.R.; Sadhu, A.; Sampath, G.; Sugden, S.; Dutta Gupta, S.; Lapworth, D.J.; Marchant, B.P.; Pedley, S. Are sanitation interventions a threat to drinking water supplies in rural India? An application of tryptophan-like fluorescence. Water Res. 2016, 88, 923–932. [Google Scholar] [CrossRef]
- APHA AWWA WEF. Standard Methods for the Examination of Water and Wastewater, 20th ed.; American Public Health Association: Washington, DC, USA, 1999. [Google Scholar]
- McKnight, D.M.; Boyer, E.W.; Westerhoff, P.K.; Doran, P.T.; Kulbe, T.; Anderson, D.T. Spectroflourometric characterization of dissolved organic matter for indication of precursor organic material and aromaticity. Limnol. Oceanogr. 2001, 46, 38–48. [Google Scholar] [CrossRef]
- Shimotori, K.; Omori, Y.; Hama, T. Bacterial production of marine humic-like fluorescent dissolved organic matter and its biogeochemical importance. Aquat. Microb. Ecol. 2009, 58, 55–66. [Google Scholar] [CrossRef] [Green Version]
- Mostofa, K.M.G.; Yoshioka, T.; Mottaleb, A.; Vione, D. Photobiogeochemistry of Organic Matter: Principles and Practices in Water Environments; Springer: Berlin/Heidelberg, Germany, 2013; ISBN 978-3642322228. [Google Scholar]
- Determann, S.; Lobbes, J.M.; Reuter, R.; Rullkötter, J. Ultraviolet fluorescence excitation and emission spectroscopy of marine algae and bacteria. Mar. Chem. 1998, 62, 137–156. [Google Scholar] [CrossRef] [Green Version]
- Baker, A. Spectrophotometric discrimination of river dissolved organic matter. Hydrol. Process. 2002, 16, 3203–3213. [Google Scholar] [CrossRef]
- Lapworth, D.J.; Kinniburgh, D.G. An R script for visualising and analysing fluorescence excitation-emission matrices (EEMs). Comput. Geosci. 2009, 35, 2160–2163. [Google Scholar] [CrossRef]
- Stedmon, C.A.; Bro, R. Characterizing dissolved organic matter fluorescence with parallel factor analysis: A tutorial. Limnol. Oceanogr. Methods 2008, 6, 572–579. [Google Scholar] [CrossRef]
- Molecular Probes Inc. LIVE/DEAD® BacLightTM Bacterial Viability Kits. Available online: https://tools.thermofisher.com/content/sfs/manuals/mp07007.pdf (accessed on 12 April 2016).
- Kramer, G.D.; Herndl, G.J. Photo- and bioreactivity of chromophoric dissolved organic matter produced by marine bacterioplankton. Aquat. Microb. Ecol. 2004, 36, 239–246. [Google Scholar] [CrossRef] [Green Version]
- Shimotori, K.; Watanabe, K.; Hama, T. Fluorescence characteristics of humic-like fluorescent dissolved organic matter produced by various taxa of marine bacteria. Aquat. Microb. Ecol. 2012, 65, 249–260. [Google Scholar] [CrossRef] [Green Version]
- Parlanti, E.; Wörz, K.; Geoffroy, L.; Lamotte, M. Dissolved organic matter fluorescence spectroscopy as a tool to estimate biological activity in a coastal zone submitted to anthropogenic inputs. Org. Geochem. 2000, 31, 1765–1781. [Google Scholar] [CrossRef]
- Cammack, W.K.L.; Kalff, J.; Prairie, Y.T.; Smith, E.M. Fluorescent dissolved organic matter in lakes: Relationships with heterotrophic metabolism. Limnol. Oceanogr. 2004, 49, 2034–2045. [Google Scholar] [CrossRef] [Green Version]
- Ziervogel, K.; Osburn, C.; Brym, A.; Battles, J.; Joye, S.; D’souza, N.; Montoya, J.; Passow, U.; Arnosti, C. Linking Heterotrophic Microbial Activities with Particle Characteristics in Waters of the Mississippi River Delta in the Aftermath of Hurricane Isaac. Front. Mar. Sci. 2016, 3, 8. [Google Scholar] [CrossRef]
- Cooper, K.J.; Whitaker, F.F.; Anesio, A.M.; Naish, M.; Reynolds, D.M.; Evans, E.L. Dissolved organic carbon transformations and microbial community response to variations in recharge waters in a shallow carbonate aquifer. Biogeochemistry 2016, 129, 215–234. [Google Scholar] [CrossRef] [Green Version]
- Ogawa, H.; Amagai, Y.; Koike, I.; Kaiser, K.; Benner, R. Production of Refractory Dissolved Organic Matter by Bakteria. Science 2001, 292, 917–920. [Google Scholar] [CrossRef] [PubMed]
- Reynolds, D.M.; Ahmad, S.R. Rapid and direct determination of wastewater BOD values using a fluorescence technique. Water Res. 1997, 31, 2012–2018. [Google Scholar] [CrossRef]
- Cutrera, G.; Manfredi, L.; Valle, C.E.; González, J.F. On the determination of the kinetic parameters for the BOD test. Water SA 1999, 25, 377–380. [Google Scholar]
- Khamis, K.; Sorensen, J.P.R.; Bradley, C.; Hannah, D.M.; Lapworth, D.J.; Stevens, R. In situ tryptophan-like fluorometers: Assessing turbidity and temperature effects for freshwater applications. Environ. Sci. Process. Impacts 2015, 17, 740–752. [Google Scholar] [CrossRef] [PubMed]
- Reynolds, D.M.; Ahmad, S.R. The effect of metal ions on the fluorescence of sewage wastewater. Water Res. 1995, 29, 2214–2216. [Google Scholar] [CrossRef]
- Tanaka, K.; Kuma, K.; Hamasaki, K.; Yamashita, Y. Accumulation of humic-like fluorescent dissolved organic matter in the Japan Sea. Sci. Rep. 2014, 4, 5292. [Google Scholar] [CrossRef]
- Jiao, N.; Herndl, G.J.; Hansell, D.A.; Benner, R.; Kattner, G.; Wilhelm, S.W.; Kirchman, D.L.; Weinbauer, M.G.; Luo, T.; Chen, F.; Azam, F. Microbial production of recalcitrant dissolved organic matter: Long-term carbon storage in the global ocean. Nat. Rev. Microbiol. 2010, 8, 593. [Google Scholar] [CrossRef]
- Fukuzaki, K.; Imai, I.; Fukushima, K.; Ishii, K.I.; Sawayama, S.; Yoshioka, T. Fluorescent characteristics of dissolved organic matter produced by bloom-forming coastal phytoplankton. J. Plankton Res. 2014, 36, 685–694. [Google Scholar] [CrossRef] [Green Version]
- Guillemette, F.; del Giorgio, P.A. Simultaneous consumption and production of fluorescent dissolved organic matter by lake bacterioplankton. Environ. Microbiol. 2012, 14, 1432–1443. [Google Scholar] [CrossRef]
- Timko, S.A.; Maydanov, A.; Pittelli, S.L.; Conte, M.H.; Cooper, W.J.; Koch, B.P.; Schmitt-Kopplin, P.; Gonsior, M. Depth-dependent photodegradation of marine dissolved organic matter. Front. Mar. Sci. 2015, 2, 66. [Google Scholar] [CrossRef]
- Kallenbach, C.M.; Frey, S.D.; Grandy, A.S. Direct evidence for microbial-derived soil organic matter formation and its ecophysiological controls. Nat. Commun. 2016, 7, 1–10. [Google Scholar] [CrossRef] [PubMed]
- Lee, C.; Sultana, C.M.; Collins, D.B.; Santander, M.V.; Axson, J.L.; Malfatti, F.; Cornwell, G.C.; Grandquist, J.R.; Deane, G.B.; Stokes, M.D.; et al. Advancing Model Systems for Fundamental Laboratory Studies of Sea Spray Aerosol Using the Microbial Loop. J. Phys. Chem. A 2015, 119, 8860–8870. [Google Scholar] [CrossRef] [PubMed]
- Asmala, E.; Autio, R.; Kaartokallio, H.; Stedmon, C.A.; Thomas, D.N. Processing of humic-rich riverine dissolved organic matter by estuarine bacteria: Effects of predegradation and inorganic nutrients. Aquat. Sci. 2014, 76, 451–463. [Google Scholar] [CrossRef]
- Jørgensen, L.; Stedmon, C.A.; Granskog, M.A.; Middelboe, M. Tracing the long-term microbial production of recalcitrant fluorescent dissolved organic matter in seawater. Geophys. Res. Lett. 2014, 41, 2481–2488. [Google Scholar] [CrossRef] [Green Version]
- Baker, A.; Cumberland, S.A.; Bradley, C.; Buckley, C.; Bridgeman, J. To what extent can portable fluorescence spectroscopy be used in the real-time assessment of microbial water quality? Sci. Total Environ. 2015, 532, 14–19. [Google Scholar] [CrossRef] [PubMed]
- Sommerwerk, N.; Hein, T.; Schneider-Jacoby, M.; Baumgartner, C.; Ostojić, A.; Siber, R.; Bloesch, J.; Paunović, M.; Tockner, K. Chapter 3—The Danube River Basin. In Rivers of Europe; Tockner, K., Uehlinger, U., Robinson, C.T., Eds.; Academic Press: London, UK, 2009; pp. 59–112. ISBN 978-0-12-369449-2. [Google Scholar]
- Sorensen, J.P.R.; Lapworth, D.J.; Marchant, B.P.; Nkhuwa, D.C.W.; Pedley, S.; Stuart, M.E.; Bell, R.A.; Chirwa, M.; Kabika, J.; Liemisa, M.; et al. In situ tryptophan-like fluorescence: A real-time indicator of faecal contamination in drinking water supplies. Water Res. 2015, 81, 38–46. [Google Scholar] [CrossRef]
- Sorensen, J.P.R.; Lapworth, D.J.; Read, D.S.; Nkhuwa, D.C.W.; Bell, R.A.; Chibesa, M.; Chirwa, M.; Kabika, J.; Liemisa, M.; Pedley, S. Tracing enteric pathogen contamination in sub-Saharan African groundwater. Sci. Total Environ. 2015, 538, 888–895. [Google Scholar] [CrossRef]
- Cumberland, S.; Bridgeman, J.; Baker, A.; Sterling, M.; Ward, D. Fluorescence spectroscopy as a tool for determining microbial quality in potable water applications. Environ. Technol. 2012, 33, 687–693. [Google Scholar] [CrossRef]
- Blaen, P.J.; Khamis, K.; Lloyd, C.E.M.; Bradley, C.; Hannah, D.; Krause, S. Real-time monitoring of nutrients and dissolved organic matter in rivers: Capturing event dynamics, technological opportunities and future directions. Sci. Total Environ. 2016, 569–570, 647–660. [Google Scholar] [CrossRef] [PubMed]
- Asmala, E.; Kaartokallio, H.; Carstensen, J.; Thomas, D.N. Variation in Riverine Inputs Affect Dissolved Organic Matter Characteristics throughout the Estuarine Gradient. Front. Mar. Sci. 2016, 2, 125. [Google Scholar] [CrossRef]
- Makarewicz, A.; Kowalczuk, P.; Sagan, S.; Granskog, M.A.; Pavlov, A.K.; Zdun, A.; Borzycka, K.; Zabłocka, M. Characteristics of Chromophoric and Fluorescent Dissolved Organic Matter in the Nordic Seas. Ocean Sci. Discuss. 2018, 14, 543–562. [Google Scholar] [CrossRef]
Figure 1.
Variation of Peak T fluorescence (λex280/λem340–360 nm) data throughout the 10-day experimental period. (a) averaged environmental water samples ±1 standard deviation (n = 3), top; (b) averaged synthetic water samples (n = 5), bottom left; and, (c) averaged supplemented synthetic water samples ±1 standard deviation (n = 3), bottom right. See Section 2.2 for sample definitions. All fluorescence data reported as arbitrary units (AU) normalised to time zero and corrected to the water Raman line at λex280/λem310 (300–315) nm. Fluorescence excitation-emission matrices (EEM) spectra for the different sample types are provided within this manuscript (Figure 2 and Figure 4).

Figure 2.
Excitation-emission matrices of (a) environmental water samples and (b) supplemented synthetic water samples incubated at 20 °C over a 10-day experimental period. Colour bars are in quinine sulphate units, QSU (1 QSU = 1 µg L−1 quinine sulphate). Peaks labelled as described in Table 1, derived from Coble et al., (2014) nomenclature [9].

Figure 3.
Data for synthetic water samples incubated at 20 °C and 30 °C over a 10-day microbial processing period: showing (a) Peak T fluorescence and dissolved oxygen and; (b) the number of living bacteria (cells mL−1).
Figure 3.
Data for synthetic water samples incubated at 20 °C and 30 °C over a 10-day microbial processing period: showing (a) Peak T fluorescence and dissolved oxygen and; (b) the number of living bacteria (cells mL−1).

Figure 4.
Excitation-emission matrices of synthetic water samples incubated at (a) 20 °C and (b) 37 °C over a five-day microbial processing period (analysis performed hourly during the first 48-h). Colour bars are in quinine sulphate units, QSU (1 QSU = 1 µg L−1 quinine sulphate).
Figure 4.
Excitation-emission matrices of synthetic water samples incubated at (a) 20 °C and (b) 37 °C over a five-day microbial processing period (analysis performed hourly during the first 48-h). Colour bars are in quinine sulphate units, QSU (1 QSU = 1 µg L−1 quinine sulphate).

Figure 5.
Fluorescence and bacterial enumeration data for synthetic water samples incubated at a range of temperatures over a five-day experimental period, showing; (a) Peak T fluorescence, QSU (1 QSU = 1 µg L−1 quinine sulphate); and (b) the number of living bacteria (cells mL−1). Data shown is from 20 to 48-h plus a single time point at day five (120 h).


Table 1.
Identified parallel factor (PARAFAC) analysis components and fluorescence peaks generated through microbial processing of environmental and synthetic samples over a 10-day experimental period. EW—environmental water samples; SW—synthetic water samples; SSW—supplemented synthetic water samples.
| PARAFAC Component | Named Fluorescence Peak * | λex/λem (nm) | Description | Present in Sample Type | ||
|---|---|---|---|---|---|---|
| EW | SW | SSW | ||||
| 1 | T Tryptophan-like | 275/340 | Autochthonous peak, described unanimously in the literature as microbially-derived and associated with protein presence. | ✔ | ✔ | ✔ |
| 2 | M AM Humic-like (Marine-like) | 300/410 240/410 | Biologically or photochemically degraded terrestrial humic-like, sometimes referred to as ‘marine-like’ OM [16]. | ✔ | ✔ | ✔ |
| 3 | B Tyrosine-like | 265/290 | Autochthonous peak, described as microbially-derived and associated with amino-acid and protein presence. | ✔ | ✔ | |
| 4 | C+ C Humic-like | 260/490 390/490 260/430 360/430 | Double maxima components of terrestrial allochthonous higher molecular weight aromatic compounds, noted as humic-like fluorescence. | ✔ | ✔ | ✔ |
| 5 | B | 250/300 | Region similar to Peak B, associated with autochthonous production or possible photodegraded OM. Also similar to BTEX fluorescence signature. | ✔ | ✔ | ✔ |
* Nomenclature consistent with peak ranges from Coble et al., (2014) [9].
© 2018 by the authors. Licensee MDPI, Basel, Switzerland. This article is an open access article distributed under the terms and conditions of the Creative Commons Attribution (CC BY) license (http://creativecommons.org/licenses/by/4.0/).
Share and Cite
MDPI and ACS Style
Fox, B.G.; Thorn, R.M.S.; Anesio, A.M.; Cox, T.; Attridge, J.W.; Reynolds, D.M. Microbial Processing and Production of Aquatic Fluorescent Organic Matter in a Model Freshwater System. Water 2019, 11, 10. https://doi.org/10.3390/w11010010
AMA Style
Fox BG, Thorn RMS, Anesio AM, Cox T, Attridge JW, Reynolds DM. Microbial Processing and Production of Aquatic Fluorescent Organic Matter in a Model Freshwater System. Water. 2019; 11(1):10. https://doi.org/10.3390/w11010010
Chicago/Turabian StyleFox, Bethany G., Robin M.S. Thorn, Alexandre M. Anesio, Timothy Cox, John W. Attridge, and Darren M. Reynolds. 2019. "Microbial Processing and Production of Aquatic Fluorescent Organic Matter in a Model Freshwater System" Water 11, no. 1: 10. https://doi.org/10.3390/w11010010
Note that from the first issue of 2016, this journal uses article numbers instead of page numbers. See further details here.