1. Introduction
During the third World Water Forum, held in Kyoto in 2003, two important concepts were established [
1]:
the twentieth century saw the construction of new dams, while the twenty-first century will have to transform existing life-limited reservoirs into durable infrastructures that can be used by future generations;
the international scientific community have to identify solutions able to preserve the existing reservoirs as long as possible or even indefinitely.
Since the beginning of the twentieth century a notable increase in the construction of new dams has been occurred, with a peak observed in the year period 1940–1960 [
2,
3]. Subsequently, there was a significant decrease in new dams and this is also due to the depletion of suitable sites for their construction. Until the early 2000s, life of a reservoir has been considered as finite and based on the estimation of the filling time of the so-called ‘dead volume’.
Moreover, studies and analyses carried out at world level in the field of reservoir sedimentation have led to estimate a loss of storage capacity of 45–50% at 2050 [
2,
4].
Thus, by reason of decreasing in the rate of dam construction for environmental, social and economic reasons, existing dams should be managed as renewable resources [
5,
6]. As a consequence, promoting effective and sustainable reservoir sediment management strategies is necessary to extend indefinitely the life of dam [
5,
7]. In particular, De Vincenzo and Molino introduced the new concept of Sustainable Useful Capacity (SUC) of a reservoir [
7,
8], which is based on a continuous control of the current storage capacity so that water demand of users can be satisfied in continuous and for an indefinite time. If the current useful capacity, less than the initial reservoir storage capacity due to the sedimentation phenomenon, is not able to guarantee the users’ demands, planning of ‘extraordinary management’ interventions will be necessary. For instance, desilting operations for the recovery of storage capacity must be performed [
7]. Moreover, the extraordinary management interventions could also request safety operations aimed to desilting of the areas closed to partially or totally obstructed water intake structures and outlets and/or to restoration of the original slope of the reservoir tributary river which, due to the sedimentation phenomenon near the entrance to the reservoir, may present a riverbed aggradation and, therefore, increase the flooding risk in the neighboring areas also due to climate changes [
9]. In any case, in order to compensate for the desilting costs, activation of the economic process that results from the re-use of recovered sediments will be crucial [
10,
11].
This study proposes, for the first time, the utilization of reservoir sediments for beach nourishment as an alternative to sediments from marine caves normally used [
12], which would represent a point of convergence between water resource management, reuse of sediments dredged by reservoirs and protection of coastlines from erosion [
7]. Moreover, such a proposal could contribute significantly to reconstitute the sediment budget of the river–coast–sea system, often altered by the realization of a dam-reservoir complex that, modifying transport capacity in the upstream and downstream riverbeds, decrease the amount of sediments reaching the coast and generate beach erosion especially for short dam–coast distances [
13,
14,
15,
16,
17,
18,
19,
20,
21,
22,
23,
24].
The aim of this work is to propose an innovative methodological approach to the reuse of sediments deposited on a reservoir bottom for the nourishment of eroding coastlines in the current Italian legislative context. This approach is based on:
a connection between quantifying of sediment volumes potentially available for beach nourishment and extraordinary managing operations of a dam-reservoir system;
an analysis of granulometric compatibility of reservoir and coastal sediments, based on both the comparison between statistics (mean and standard deviation) of sediment distributions and the use of overfill factor and the Abacus of Krumbein;
an analysis of the qualitative suitability of reservoir sediments for beach nourishment, founded on the combination of current European and Italian regulations and the examination of additional chemical contamination associated to human activities in the study area and several specific characteristics of the reservoir.
Finally, the proposed methodology was applied to the case study of the Guardialfiera reservoir (Molise Region, Italy) that is located only 25 km upstream of the Molise coast. For this coastal area has been shown by study [
25] that it suffers from an erosional trend larger than 2 m/year, at the mouths of the rivers Trigno and Biferno respectively, whereas the rest of coast remains in a substantial equilibrium [
25]. These authors have recently carried out a long-term analysis (1954–2014) of the shoreline evolution in the region included between the creeks of Formale del Molino and Saccione (the borders of Molise Coast facing the Adriatic Sea).
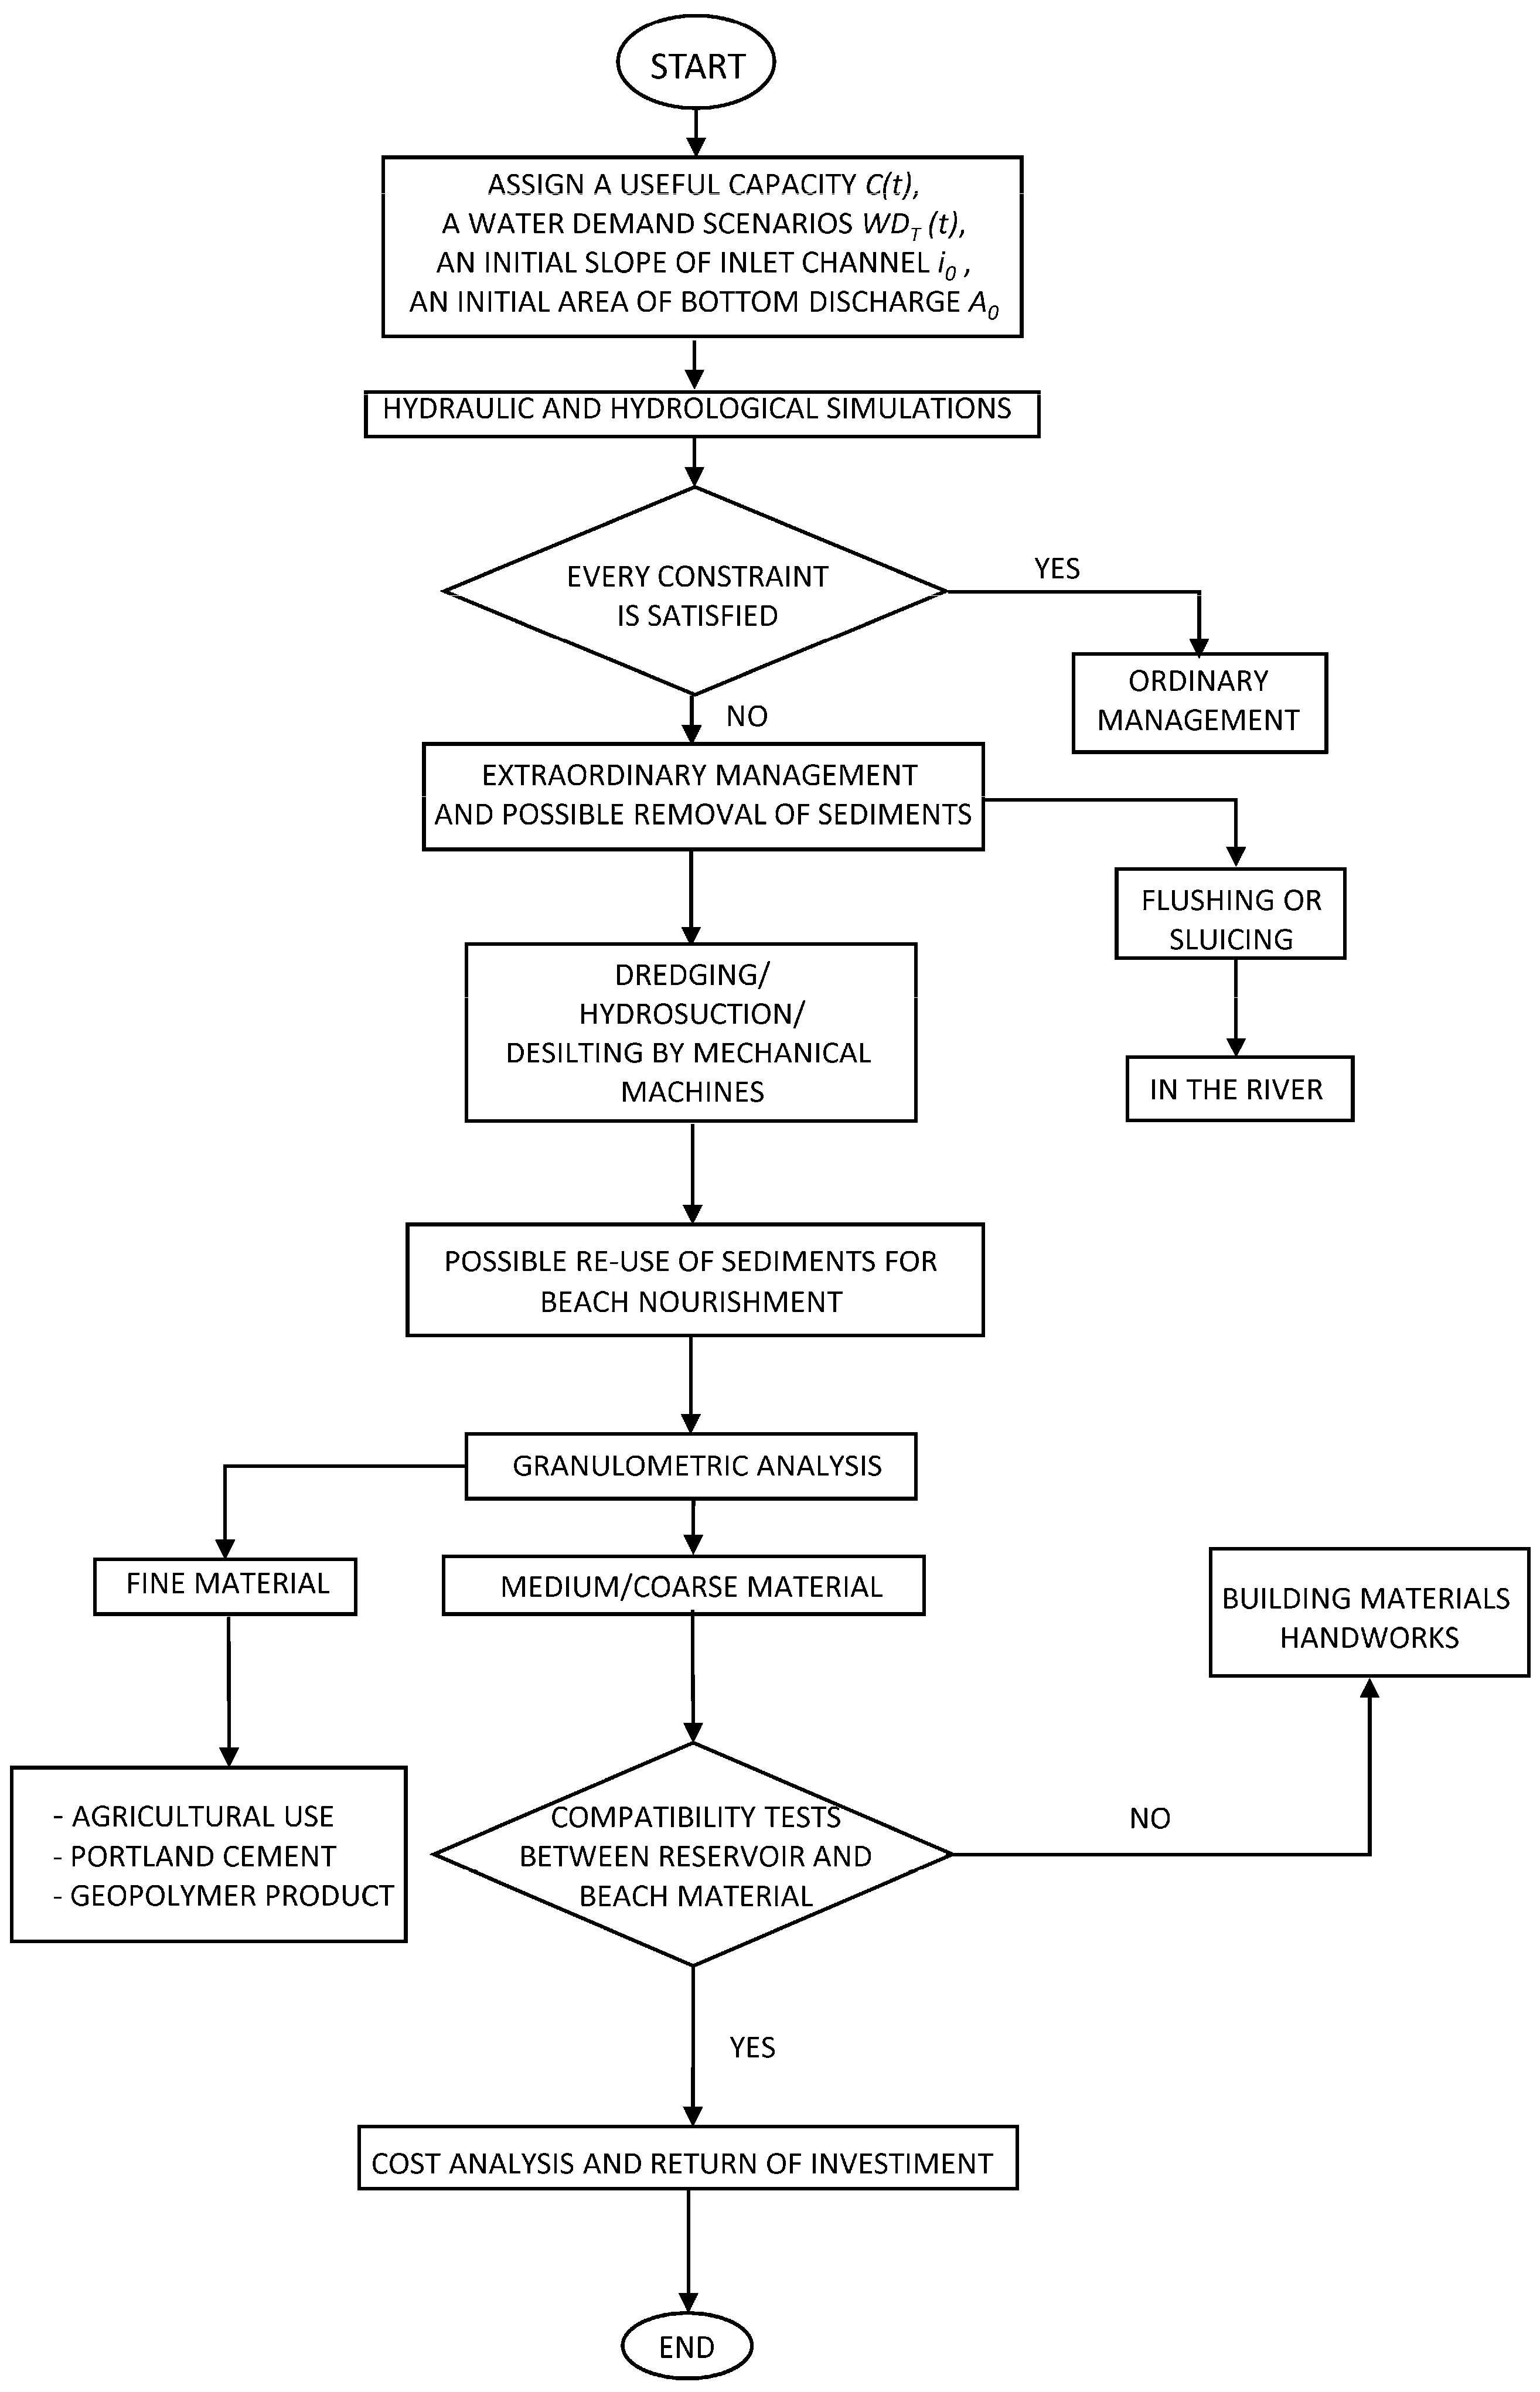
2. The Proposed Methodology
The proposed methodology, which is summarized in the flow-chart of
Figure 1, introduces of a sequence of actions that allow, on the basis of the current technical/scientific knowledge and of the European and Italian legislation currently in force, the reuse of sediments deposited on a reservoir bottom for the nourishment of eroding coastlines.
The first step deals with the estimation of the current storage capacity C(t), which is a function of the sedimentation that occurred in the t years of reservoir’s life, in addition to the analysis of granulometry of sediments and their spatial distribution within the lake, in the fluvial reach immediately upstream and in specific areas, such as those close to water intakes and bottom outlets. Provided that the deposited sediment volume is greater than the dead-volume of design phase and that, consequently, the original storage capacity of the reservoir has been reduced, it is necessary to compare C(t) with the current water demand of users WDT(t), estimated as a function of the real water volumes requested by reservoir users.
An extraordinary management intervention, consisting of a removal of sediments from the reservoir bottom [
7,
8], will be required if:
and the minimum sediment volume
Vs(T) to be removed will be:
If the volume of deposited sediment is less than the design dead volume, extraordinary management interventions may still be necessary in the following cases:
partial or total occlusion of outlets and/or water intake structures, with initial
A0 and
A(t) at time
t cross sections such that:
a bed aggradation phenomenon in the riverbed immediately upstream of the reservoir, due to the deposit of sediments transported by the river upstream of dam. This phenomenon generates a decreasing in slope such that:
where
i0 and
i(t) are the initial and at time
t bed slopes, respectively. As a result, flood risk is expected to increase.
In above mentioned cases, the extraordinary management of the reservoir will require removal of sediments at specific locations, which can be carried out through (see
Figure 1):
- (a)
flushing or sluicing operations, which will introduce removed sediments in the downstream riverbed and will require a significant loss of water volumes and a careful control of the impact on the involved ecosystems [
26,
27,
28];
- (b)
dredging, which implies significant costs and does not allow an appropriate selection of the storage sites;
- (c)
technological hydro-suction that is quite expensive and causes a significant loss of water, even if it permits choosing of appropriate sites for the removed material storage [
29,
30];
- (d)
mechanical removal, which is cheaper and more easily achievable for seasonal storage reservoir that may have emerging bottom areas during dry periods of the year.
Except for the first type of intervention, storage of recovered sediment requires the selection of sediment storage sites, which will be temporary only when a sediment reuse is planned. As shown in
Figure 1, the type of reuse changes according to sediment granulometry [
7]. Studies carried out in the last years allow to identify different alternatives of re-using of reservoir sediments including production of:
construction materials for gravel [
31];
environmentally sustainable building products for clay [
32,
33,
34];
amendment of agricultural soils for clay [
35];
Portland Cement production for sand [
36].
If removed sediments are predominantly sand and therefore, they are potentially suitable also for a coastal nourishment intervention, it will be necessary to carry out two important analyses:
the granulometric and mineralogical-petrographic compatibility analysis between sands of the reservoir and those of beach to nourish, which is certainly an essential element for the planning of a coastal nourishment project [
37,
38,
39,
40];
chemical, microbiological, and ecotoxicological analyses for qualitative characterization of reservoir sediments, which are essential for environmentally beach nourishments.
Italian legislation makes mineralogical-petrographic compatibility analysis mandatory but does not give specific indications on the related necessary approaches [
41]. While, as regards the qualitative characterization, at European level, there is no law regulating reusing of reservoir sediments for beach nourishment. However, the European Directive 2008/98/EC [
42], which regulates wastes of human activities, allows us to consider reservoir sediments as a by-product and, therefore, usable if they do not cause damages to humans and ecosystems. Within the Italian legislative framework, rules governing the qualitative characterization of sediments to be re-used are different when considering sediments of inland water bodies or sediments of submarine deposits. Specifically, Legislative Decree 173/2016 [
43], which is inspired by the decree [
41], regulates the qualitative characterization of sediments of submarine deposits aimed to their reuse for beach nourishment. The Legislative Decree 120/2017 [
44] on excavated Lands and Rocks, which is inspired by Legislative Decree 152/06 [
45], indicates the analysis to be carried out for qualitative characterization of sediments of ‘inland water bodies’ as a by-product, that is potentially reusable, without any specific reference to their reuse for beach nourishment.
The use of a by-product is, however, legal when it meets the requirements for specific use and all other relevant requirements concerning the protection of human health and environment, in accordance with the aforementioned European directive. It follows that sand of a reservoir, in order to be used, must be subjected to a careful and scrupulous qualitative characterization, not before having carried out a compatibility analysis that ascertains its possible use for the specific use.
Legislative Decree 120/2017 [
44], as well as the threshold limits envisaged for these analyses, do not coincide with the analyses and limits set by ICRAM-APAT Manual [
41]. In particular, for the latter, limits defined for chemical and ecotoxicological analyses are more restrictive. Furthermore, chemical analyses provided for by Legislative Decree 120/2017 [
44] may not be exhaustive, due to possible specific sources of pollutants present in the river basin.
For this reason, the procedures suggested by Legislative Decree 173/2016 [
43] should be applied for qualitative characterization of reservoir sediments. The human activities present in the river basin, along with the shape of reservoir, its operating regime and the position of water withdrawal points, should be considered in order to determine further chemical substances, not included in technical annex of aforesaid decree [
43] whose concentration in sediments could be unsafe for human health and environment.
So, in order to meet the goal of the paper, the authors propose the following steps:
verifying the necessity of removing sediments for a reservoir extraordinary management;
estimation of sediment volume potentially available for coastal nourishment and spatial distribution of sediments within the reservoir and in the riverbed immediately upstream;
analysis of granulometric and mineralogical-petrographic compatibility between reservoir and beach sediments;
cost analysis and Return on Investment (RoI) [
46].
The proposed methodology, applied to the study-case of Guardialfiera Reservoir, which is located 25 kilometers upstream of the eroding Molise shoreline, could become a point of reference in the management of sediments and volume of water of reservoirs and coastlines, whose erosion often depends significantly on the presence of dams very close to the river mouths.
The Study Case
Although the proposed study is general, for the sake of simplicity the following sections describe a particular study-case with the relative field data available and the methods used to test the proposed methodology. The study case deals with the possible use of sediments of Guardialfiera Reservoir (Molise, Italy) (see
Figure 2) for nourishment of Molise coast which is eroding in many zones [
25].
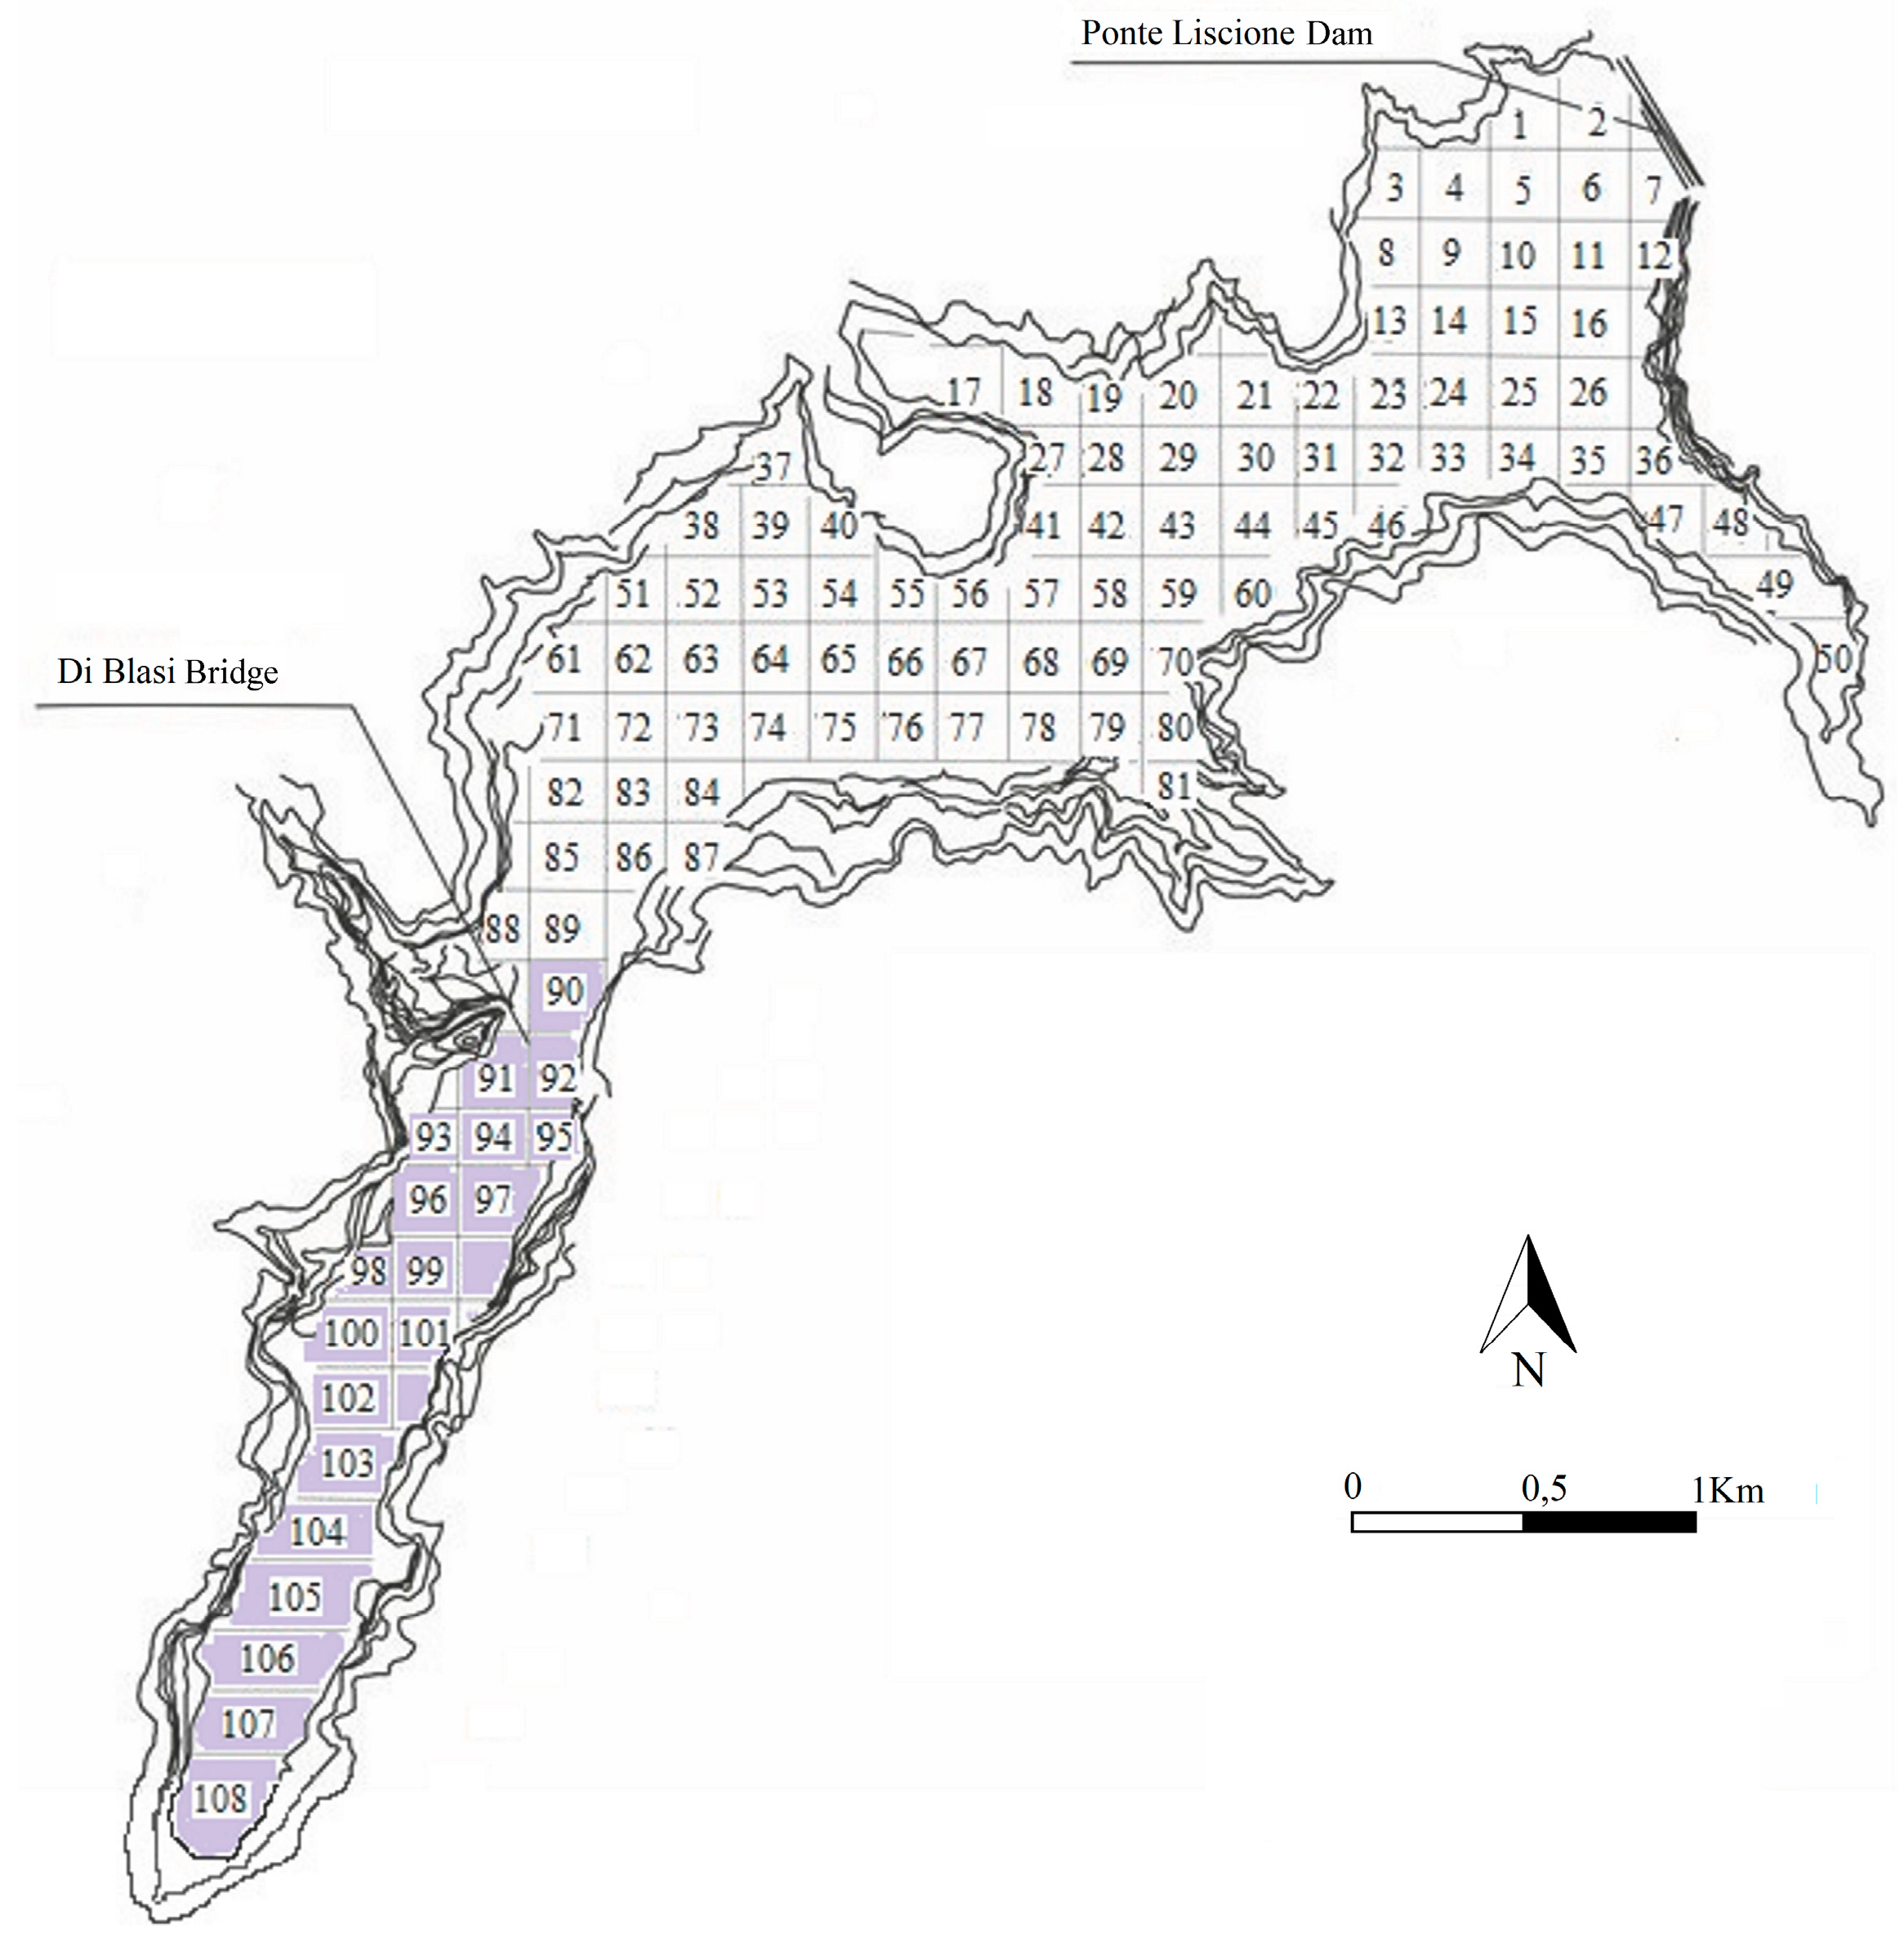
Guardialfiera Reservoir was created between 1966 and 1973 with the construction of the earthfill dam of Ponte Liscione on Biferno River in Molise (Southern Italy). Water surface corresponding to maximum reservoir water level extends from dam to Di Blasi Bridge. Guardialfiera Reservoir, which is a seasonal storage reservoir, was intended for multiple water uses (irrigational, drinkable, industrial, hydroelectric and flood mitigation).
Table 1 shows the main characteristics of the reservoir.
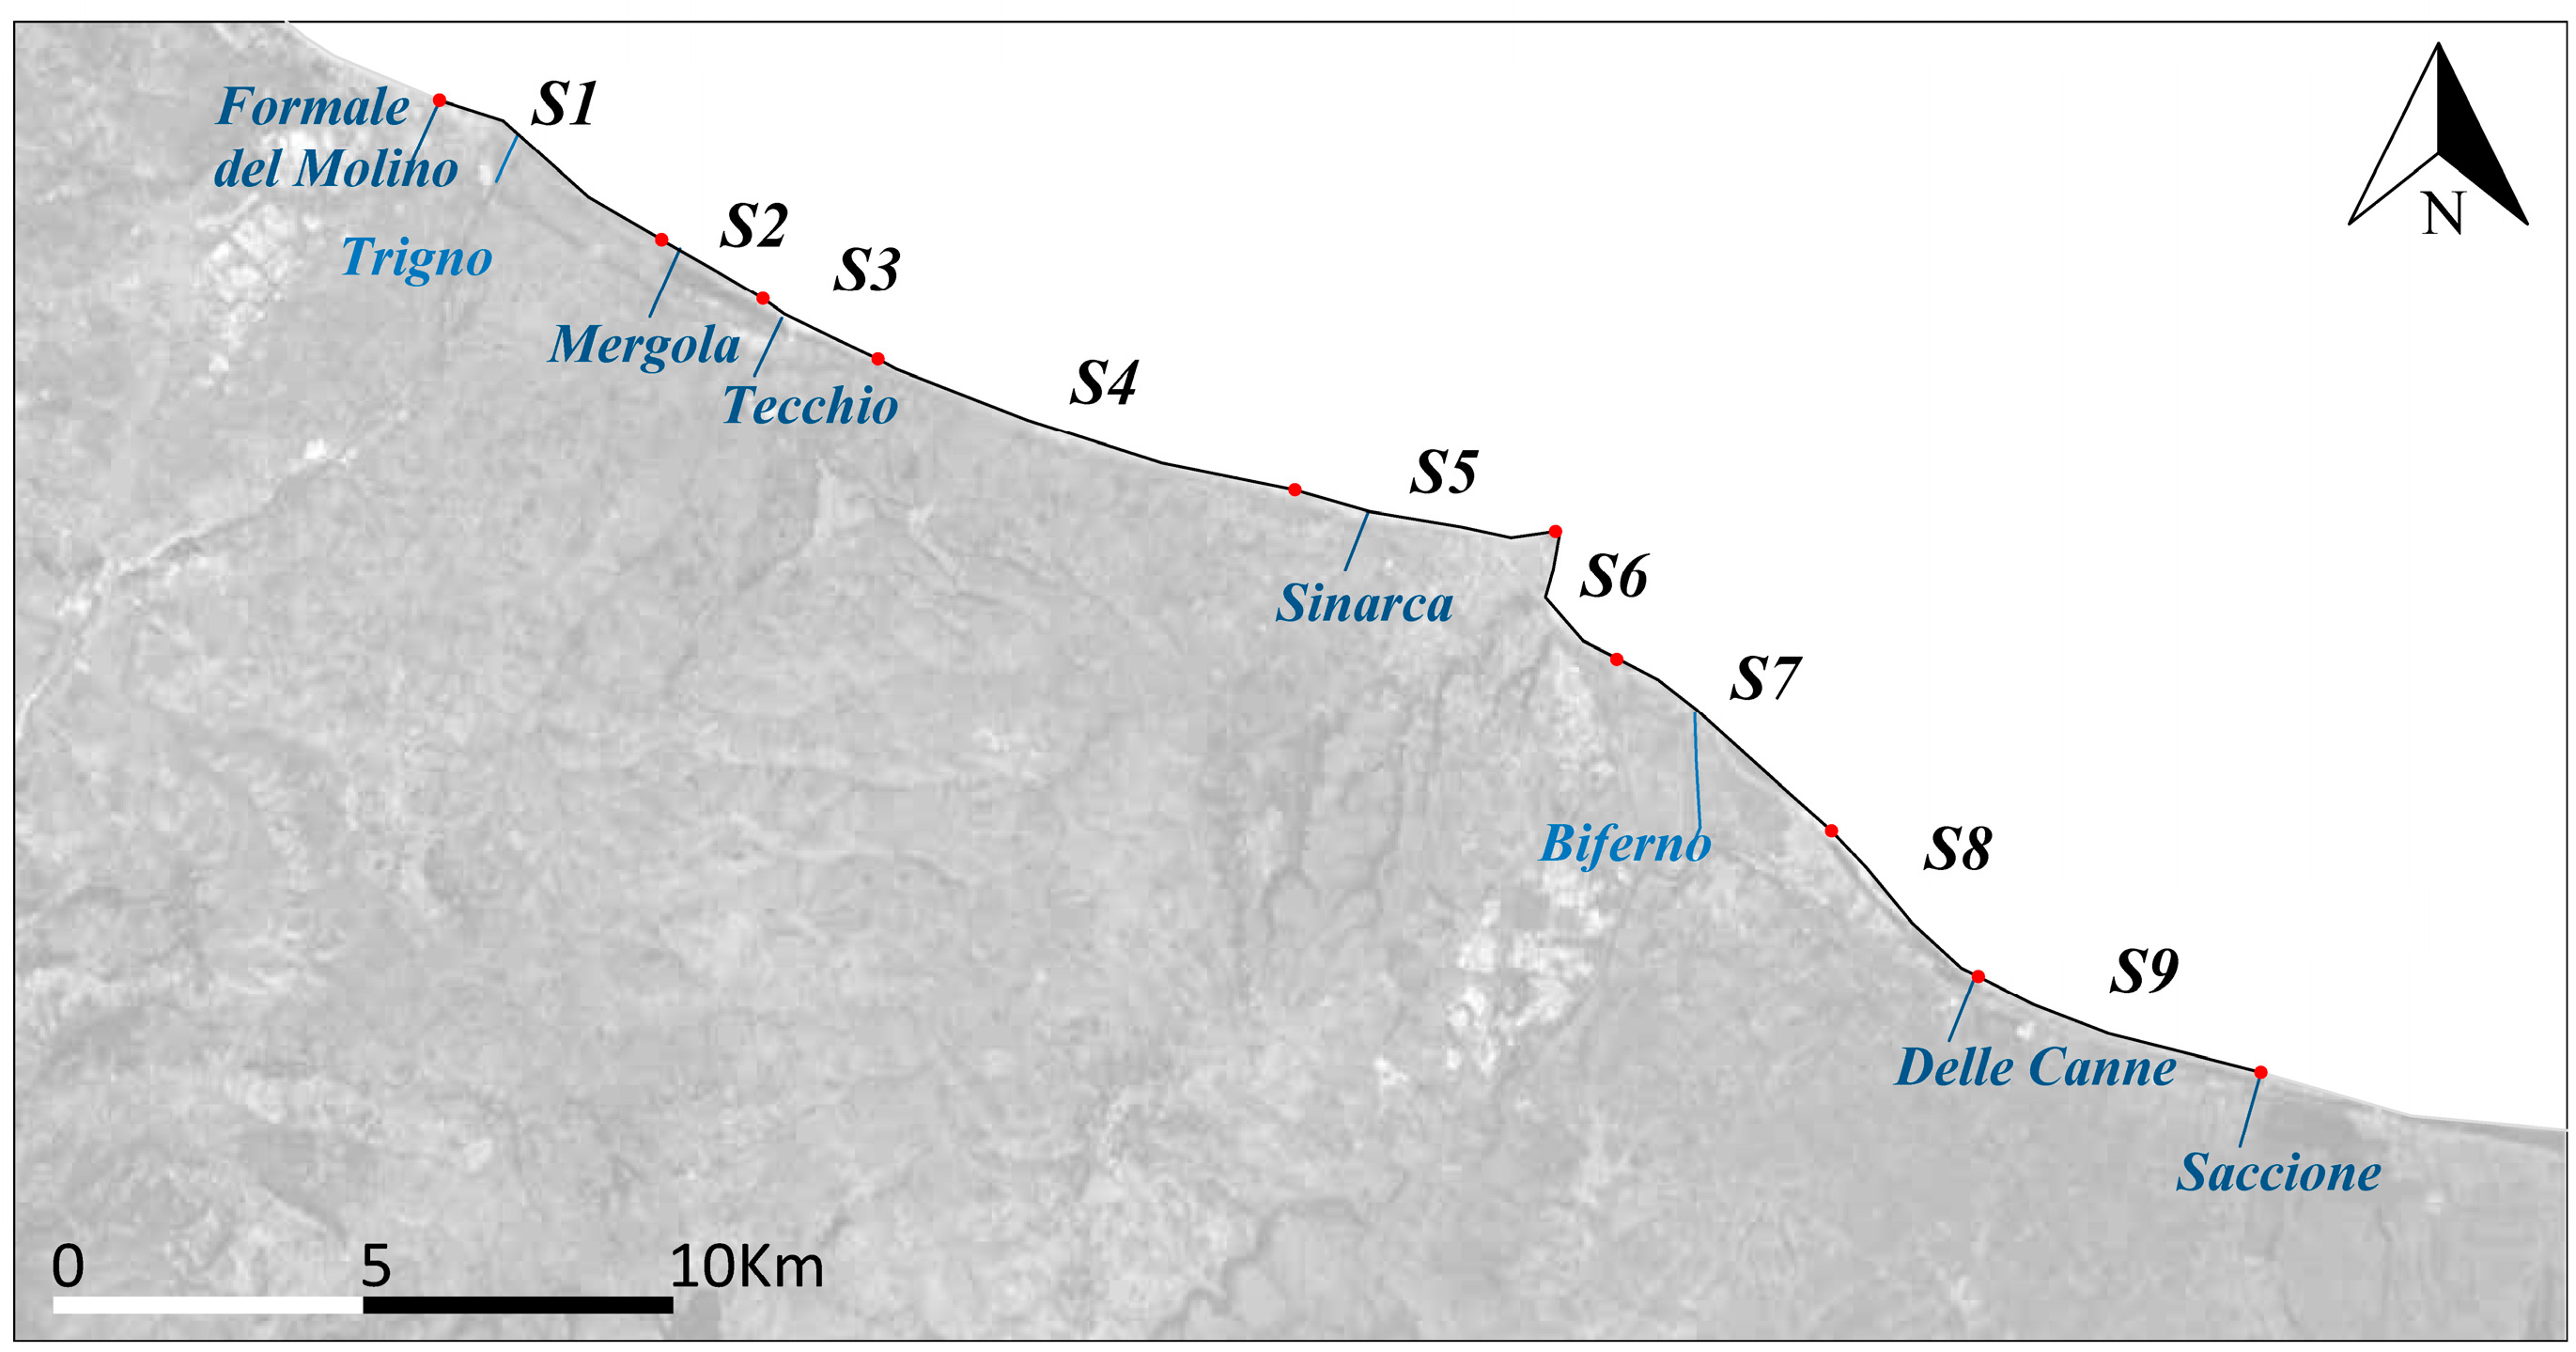
The Molise coast extends by 36 km facing the Adriatic Sea, between the Trigno River to the North and the Saccione creek to the South (
Figure 2). It includes mostly sandy beaches, apart from the rocky cliff of Termoli. The coastline is interrupted by many rivers flowing into Adriatic Sea, of which the most important are the Trigno and Biferno rivers, located north and south of Termoli, respectively A long-term analysis (1954–2014) of the shoreline evolution in the area included between the creeks of Formale del Molino and Saccione was recently carried out [
25]. The authors divided this stretch of coast into 9 cells (see
Figure 3), and for each of them the shoreline variation rate was assessed for different periods. Moreover, the shoreline digitalization in ArcGIS environment was carried out using aerial photos of 1954, 1986, 1992, and 1998, orthophoto maps of 2004 and 2011, and images of 2014 taken by Google Earth [
25]. But, only the sub-period from 1986 to 2014 was useful to develop the study of this paper focusing on the years after the construction of the Ponte Liscione Dam.
Table 2 reports the results obtained in the period 1986–2014 through a years-weighted average of the Δy/Δt values [
25]; from data, 2 hot spots can be recognized, cells S1 and S7, which correspond to the mouths of the rivers Trigno and Biferno respectively. These areas suffer from an erosional trend larger than 2 m/year despite of their high protection degree (74% and 100%, respectively, since 2004), whereas the rest of coast remains in a substantial equilibrium.
Despite not providing a direct comparison between the pre and post construction phases, this outcome has been argued to be the the consequence of the presence of dams along both the river reaches, which has likely deprived the coastal sedimentary budget by significant volumes. Specifically, Ponte Liscione Dam has modified water discharge and sediment load into the downstream river channel [
26] and has induced a bed degradation, in many cases higher than 6 m, that has been already and mostly manifested a few years after the dam closure and has involved the whole river reach between dam and coastline [
47].
For this study, the cell number S7 is of utmost importance, being located only 25 km downstream the Ponte Liscione Dam. A simplified analysis of the coastal dynamics of this area is provided in the
Section 3.2.
4. Results and discussion
Volume of sediments deposited in Guardialfiera Reservoir from 1965 to 2007, as estimated in a previous work [
25] are given in
Table 5. In the same table, the sediment volumes referred to the 1965–2016 period are also given. These values were evaluated assuming a sedimentation rate constant over time both in the overall reservoir and upstream of the Di Blasi Bridge. In 2007, a sediment volume of 3.1 × 10
6 m
3 was available in the area upstream of the Di Blasi Bridge.
By comparison between total sediment volume of Guardialfiera Reservoir (5.4 × 10
6 m
3), shown in
Table 5, and its design dead volume (11 × 10
6 m
3), shown in
Table 1, we can deduce that sedimentation process did not modify initial reservoir storage capacity, thus guaranteeing the possibility to meet the current water demand of users. As a matter of fact, the total volume of reservoir sediments, equal to 5.4 × 10
6 m
3, represents only 50% of the dead volume. While assuming that the 105 ×10
3 m
3/year sedimentation rate will remain constant and will not decrease over time, as would be expected, about 50 years should be necessary to completely fill the dead volume. As a consequence, for several decades the sustainable useful capacity should remain the same as that of the initial capacity, without sediment removal operations.
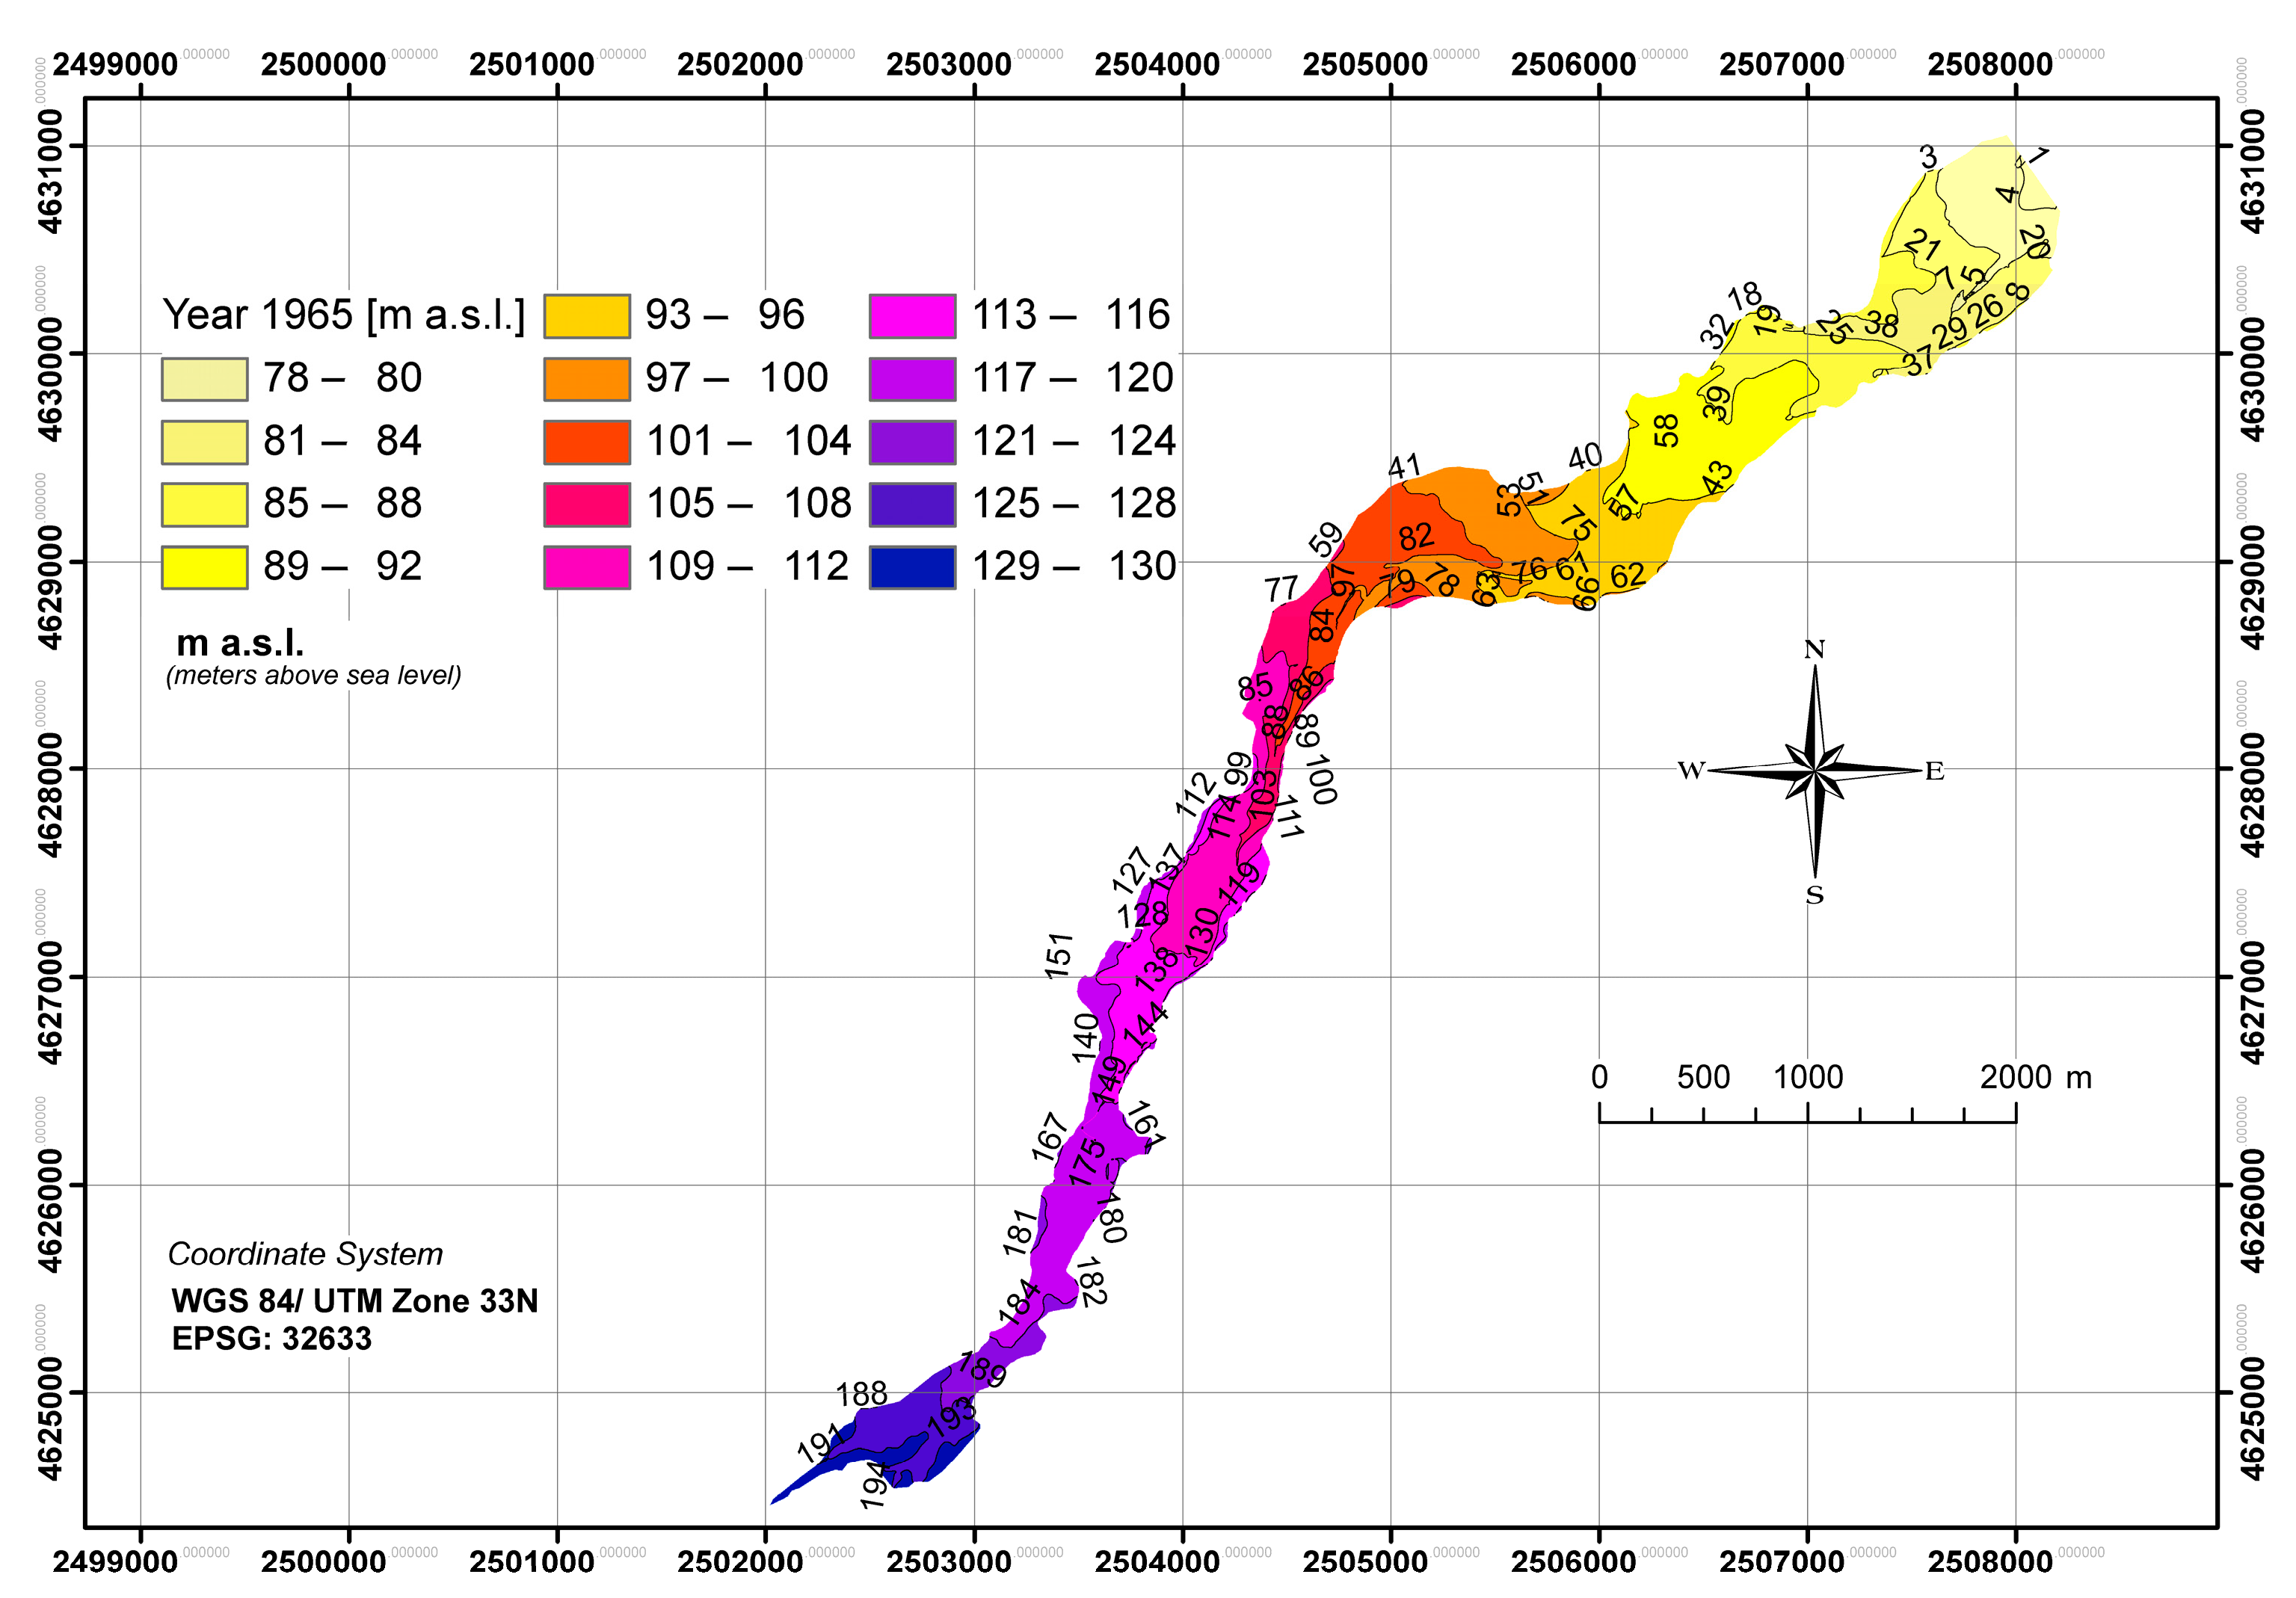
The analysis of data of sedimentation rates and spatial dislocation of the deposit volumes (
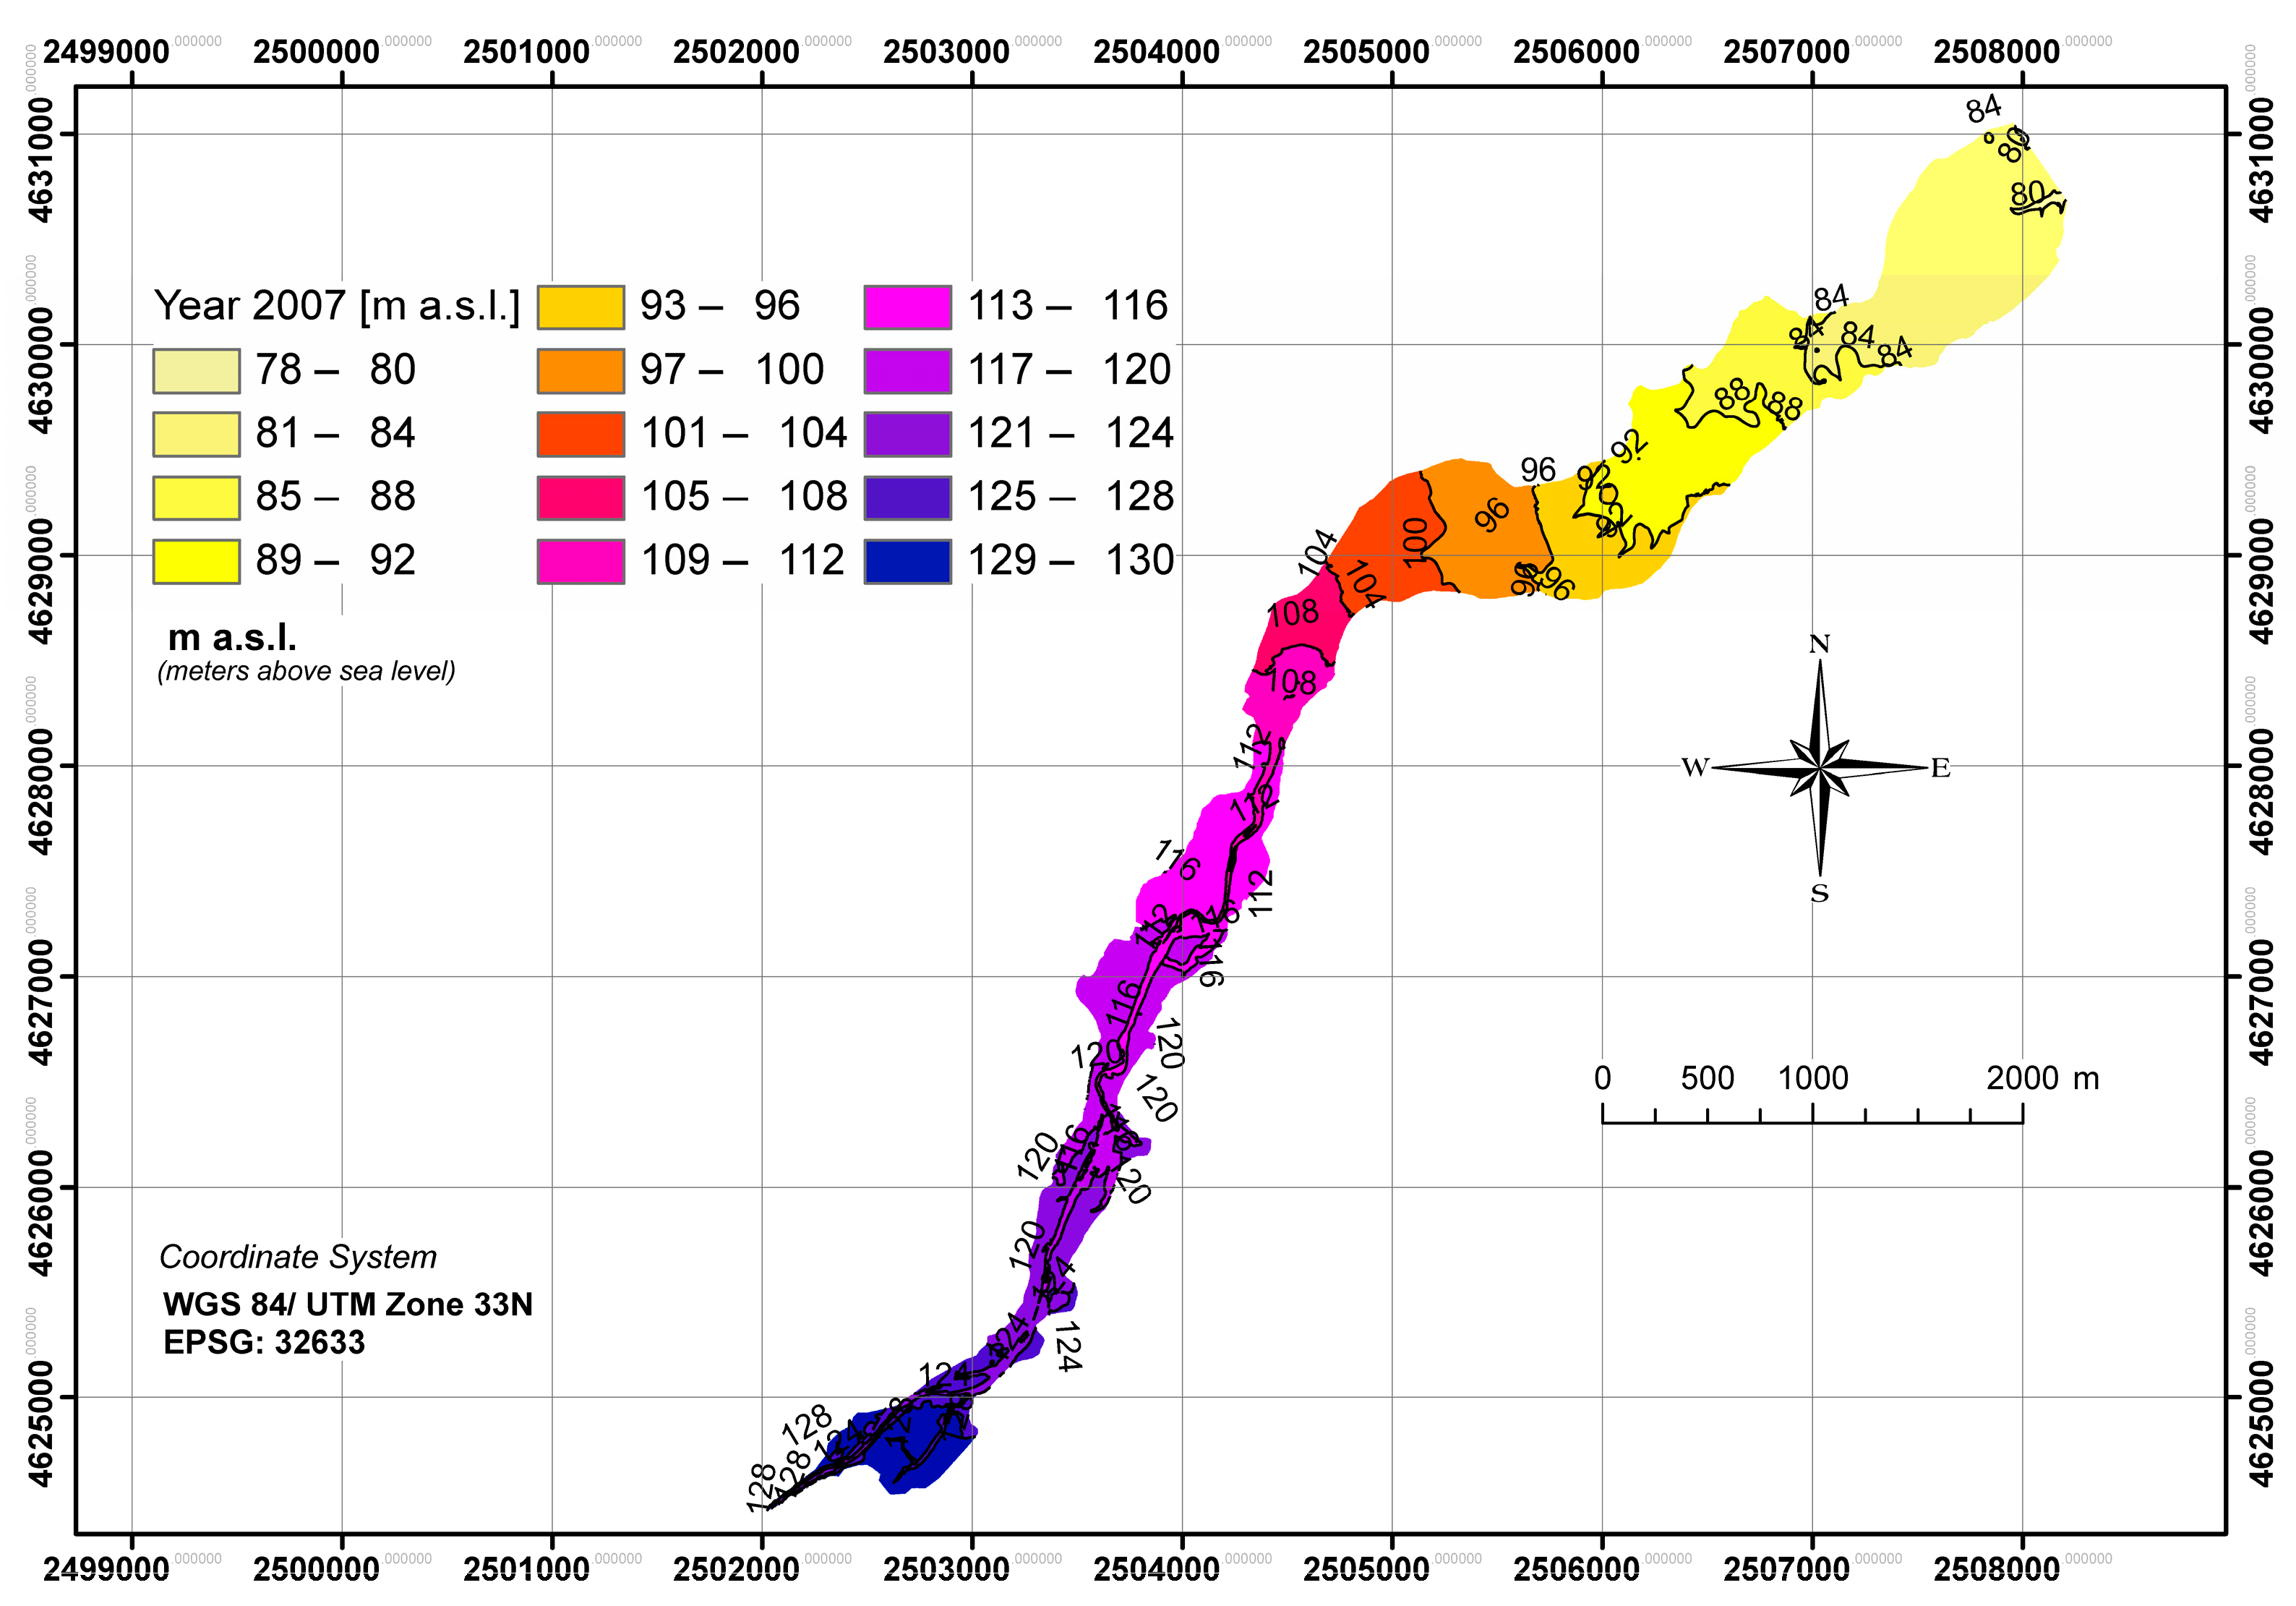
Table 4) has shown that about 70% of the total sediment volume is localized upstream of the Di Blasi Bridge. Sediment deposition upstream of the bridge, although not having reduced the useful storage capacity of the reservoir, has induced also an aggradation phenomenon in the upstream fluvial reach. As evidenced by the comparison of 1965 and 2007 contour lines (see
Figure 6 and
Figure 7), an evident bed aggradation has occurred in the channel upstream the lake, which is affected by backwaters. Specifically, in the last 1 km long river reach upstream of the Di Blasi bridge, bed elevations ranged from 82 to 76 m.a.s.l. (meters above sea level) in 1965, while in the same area they were included on average between 82 and 80 m.a.s.l. in 2007. As a result, bed slopes in the river reach immediately upstream the lake ranged between 0.006 and 0.002, averaging 0.0038 in 1965 (
Figure 6). The average bed slope was 0.0017 in 2007. On average, the sediment accumulation has induced an average reduction in slope of 0.21%.
Moreover, results of bathymetric surveys have not highlighted partial or total occlusion of water intake structures and bottom outlets. According to the proposed methodology (see flow chart in
Figure 1), an extraordinary management of the reservoir is requested, with a removal of the sediments form the channel and the lake portion upstream of the bridge, in order to limit flooding risk in the anthropized adjacent areas.
Furthermore, according to the results presented in
Section 3.3, the percentage of silt and clay in the material deposited upstream the Di Blasi Bridge is 11.6% on average [
7]. Thus, the volume of sand yearly available for beach nourishment is:
This value is very close to the amount of littoral sand deficit of Equation (7), indicating the dramatic effect of the dam construction on the coastal sediment budget.
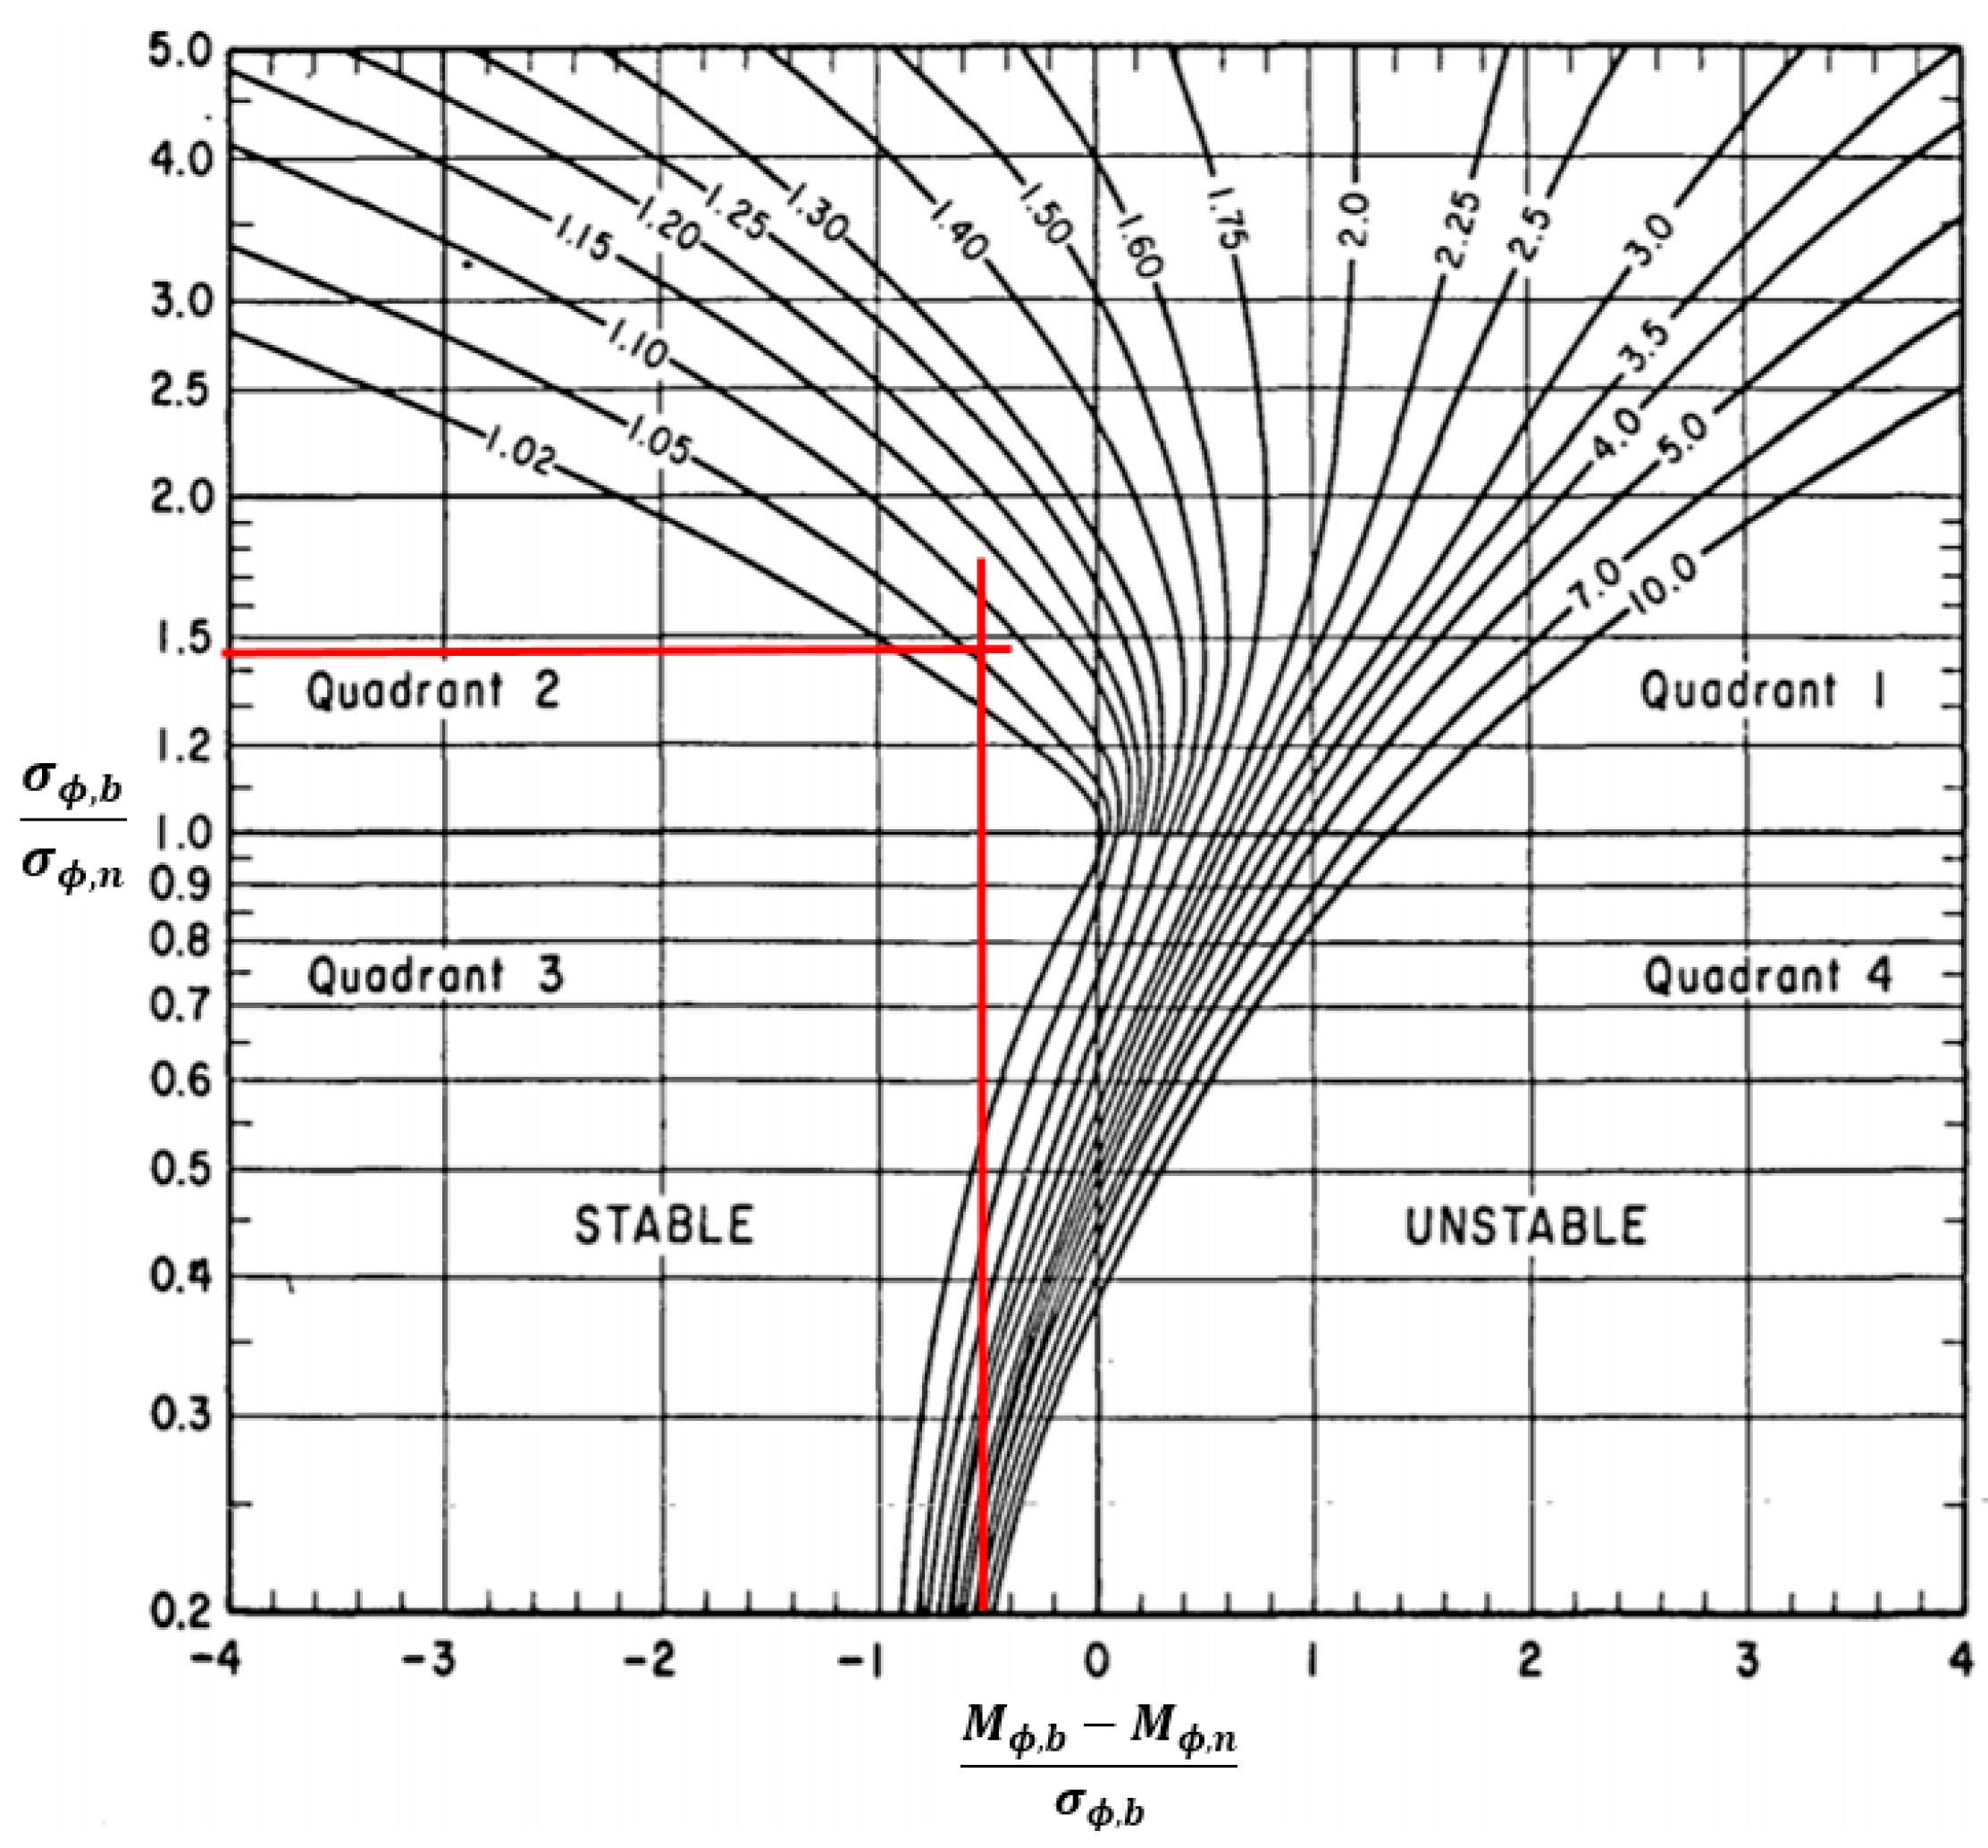
However, to establish if the available volume is really suitable for beach nourishment purposes, dam and coastal sediment gradings need to be compared to each other. It is known that the textural properties of borrow material have important effects on the postplacement behavior of beach fill. Fine material tends to be unstable on the beach, moving rapidly offshore. Thus, when a certain material is used as beach fill, natural sorting processes act upon it, redistributing the finer part offshore and the coarser residual on the shore and in the surf zone, providing no functional use in beach erosion control. In this view the ‘Abacus of Krumbein and James’ [
38,
39,
40] can be employed. This abacus furnishes the ‘overfill factor’, that is the volume of borrow material required to produce a stable unit of usable fill material, as a function of the mean and standard deviation of both the natural and borrow sands. Hence, by means of the overfill factor two results are achieved:
So if the values of mean and standard deviation are similar (granulometric compatibility), when the overfill factor is located on the left side of the Abacus of Krumbein and James (see following
Figure 8), the production of a stable nourishment is achieved.
For the case under study, taking the average grain size characteristics (see
Table 6), an expected overfill factor of 1.05 is achieved, as shown in
Figure 8. The high degree compatibility tends to confirm the relationship between dam silting and coastal retreat.
In particular, the amount of stable sand for nourishment is:
which is similar to the estimated coastal demand (see Equation (6)). These results indicate that the sand accumulated within the Liscione Reservoir is suitable nourishment of the beach at the mouth of the Biferno River and such that to compensate the local long-term sedimentary deficit.
5. Cost Analysis and Return on Investment
In this section a cost analysis was carried out. In fact, the goal of the paper is to evaluate the possibility to provide annual artificial nourishment using the whole volume of sand that stocks upstream of the dam every year. In this way we will return to the coast the volume that every year would come from the river. Therefore, the coast would remain stable (without erosion) and the reservoir would preserve its current useful capacity indefinitely over time. For this reason, among the methods developed for the extraction of sediments from a reservoir (mechanical removal, flushing and hydro-suction), the authors have previously proposed mechanical removal of sediments deposited in the area upstream of the Di Blasi Bridge [
7] (see
Figure 5). This area is more easily accessible during autumn and is found to have the greater availability of sediments (see
Table 4). Generally speaking, mechanical removal of sediments would be also the most economical solution. It is necessary taking in account that costs of sediment removal, transport, and deposition on the destination beach should be balanced by economic revenues, associated with the increased water volumes available to be supplied to users, the augmented production of hydroelectric power, the lamination of floods and the environmental benefits arising from coastal protection and releasing of a higher ecological discharge [
53]. In any case, costs for sediment transport should be relatively low in virtue of the short distance dam–coast (about 25 km). Thus, the cost of the nourishment can be now estimated based on Molise Price List [
51], including the items reported in the following
Table 7. On the whole, a total amount of 21.39 €/m
3 is obtained, which is comparable to the ordinary nourishments with offshore sand (see
Table 7 and
Table 8).
Thus, the total yearly cost to stop the coastal erosion and to promote the beach widening of 2.12 × 4870 = 10,324 m2/year, by means of the nourishment by material dredged from the Guardialfiera Reservoir, is equal to 2,065,400 (€/year)/10,324 (m2) = 200.06 (€/m2/year).
Now, to assess whether a real economical benefit could exist, the RoI parameter must be estimated. This parameter is a performance measure used to evaluate the efficiency of an investment. It is known that RoI tries to directly measure the amount of return on a particular investment, relative to the investment cost:
Then, the former value of 200.06 €/m
2/year should be compared with the possible revenues coming from the beach widening. To this purpose, an analysis developed within the EU funded project BEACHMED [
46] is employed. It indicates that the economic impact per square meter of beach can be calculated as:
where: I is the total impact,
IU is the revenue related to the beach usage and
MD and
MI are economic multipliers associated to the direct and indirect impacts of the beach on the local economy. Direct impact
ID (=MD × IU) includes revenues of bar, restaurants, real estate etc. Indirect impact
II (=MI × IU) depends on the features of the local economy, which may include, for example, the industries.
The following
Table 9 shows the values of
ID (direct impact) estimated for four sites located along the Adriatic coast, with the hypothetical RoI related to the expected disbursement of 200.06 €/m
2/year). The very high values of RoI, which range from 139% to 400%, strongly highlight the convenience of the proposed solution. Therefore, supposing a direct impact of 571 (€/m
2) for the Molise coasts (averaged value of
ID of following
Table 9) the RoI will be very high, even neglecting the related indirect impacts and the economic revenues associated to the benefits of removing sand from the reservoir.
As a consequence, the coastline could be protected from erosion and, at the same time, the reservoir useful capacity would be maintained practically unchanged over time.
Moreover, in the long term the use of reservoir sediments instead of marine sand will be preferable due to the joint beneficial effects on maintenance of reservoir’s functionality, re-establishing or river–coast sediment-flow, conservation of seafloor topography, in which affects wave climate, and preservation of marine and coastal environmental.
Finally, it should be noted that the sediment color and mineralogy were not evaluated because of the lacking of specific regulations or guidelines. Anyway, it is expected that reservoir sediment mineralogy and color should be well-matched by those of the sand of the Biferno River mouth area and adjacent beaches, given the impact of the Ponte Liscione Dam on the sediment delivery to the coastline [
26] and the short sea–dam distance.
As regards to the qualitative characterization of reservoir sediments, the analyses carried out by the Molise Regional Agency for Environmental Protection, performed for some chemical elements and for the vibrio fischeri bacterium for purposes other than beach nourishment, gave results consistent with limits imposed by Legislative Decree 173/2016 [
43]. Despite the good results of the bioassays already performed on vibrio fischeri and the chemical analyses already carried out in 2007, further chemical, ecotoxicological, and microbiological contamination analyses will be needed immediately before planning a beach nourishment project of the coastline in study, in order to demonstrate the total eligibility of Guardialfiera reservoir sediments for this purpose. It could be appropriate, for example, to analyze chemical contaminants resulting from agricultural practices (heavy metal, fertilizers) typical of the study area and emissions of vehicles traveling on the nearby roads and bridges, which could be dangerous for human health and coastal environment.
6. Conclusions
This paper proposes a methodological approach for reusing reservoir deposits as an alternative source of sediments destined to beach nourishment projects. This approach is based on the European Directive 2008/98/EC, which allows us to consider reservoir sediments as a by-product of a human activity, and on the Italian Legislative Decree 173/2016 that, as for marine sediments, could regulates their chemical, ecotoxicological and microbiological contamination analyses. The proposed methodology relates sediment removal operations to reservoir extraordinary management conditions, such as loss over time of water storage capacity, partial or total occlusion of outlets and/or water intake structures and bed aggradation in the riverbed immediately upstream of the reservoir, resulting in an increased flood risk in the surrounding area. Moreover, because of the maintenance of the natural upstream–downstream sediment flow, even for the coastal area a great benefit is obtained. Besides, in the long period the use of dredged sand from reservoir is more sustainable than the dredging marine sand which could alter the bathymetry, inducing a variation in wave climate and exposing the marine-life to serious risks. So, the management of the ‘reservoir–coast’ system will be cost-effective for the whole area because of the economic and environmental revenues associated to both the benefits for removing sand from the reservoir and the benefits related to the direct and indirect impacts of the coast. Therefore, a double result is achieved: the reservoir useful capacity will be unchanged over time and the erosion of the coast is avoided by means of a periodic nourishment.
The analysis of the study case allowed us to conclude that coastal nourishments with reservoir sediments:
are certainly a point of convergence between the need to protect the coast from erosion and the necessity of reservoir sediment removal for extraordinary management exigencies;
could contribute significantly to reconstituting the sediment budget of the river–coast–sea system, especially for short dam–coast distance;
can guarantee, through the annual average reservoir sedimentation rate, a constant availability of potentially usable sediments;
get environmental benefits due to preserve the submarine ecosystem as marine caves are not used.
Last conclusion should be consistent with the post Kyoto 2003 guide principle of infinite life of reservoirs. More detailed analyses are requested for the coastline in study, in order to plan effective scenarios of managing reservoir sedimentation for coastline protection. Additionally, a deep cost–benefit analysis should be carried out on the feasibility of a beach nourishment performed with reservoir sediments as a management strategy that allows prolonging life of dams. Finally, more studies, performed in different legislative contexts, could be useful for defining new short-term and long-term management policies of reservoirs, rivers, and coasts, and also for upgrading European and Italian Regulations, especially regarding the mineralogical-petrographic compatibility.

 ,
, 


