Variability of Arctic Sea Ice (1979–2016)

1
College of Information Science and Engineering, Henan University of Technology, Zhengzhou 450001, China
2
State Key Laboratory of Remote Sensing Science, Institute of Remote Sensing and Digital Earth, Chinese Academy of Sciences, Beijing 100101, China
*
Author to whom correspondence should be addressed.
Water 2019, 11(1), 23; https://doi.org/10.3390/w11010023
Submission received: 31 August 2018
/
Revised: 18 December 2018
/
Accepted: 21 December 2018
/
Published: 23 December 2018
(This article belongs to the Special Issue Satellite Remote Sensing and Analyses of Climate Variability)
Abstract
:This study is based on the daily sea ice concentration data from the National Snow and Ice Data Center (NSIDC; Cooperative Institute for Research in Environmental Sciences (CIRES), Boulder, CO, USA) from 1979 to 2016. The Arctic sea ice is analyzed from the total sea ice area, first year ice extent, multiyear ice area, and the variability of sea ice concentration in different ranges. The results show that the total sea ice area decreased by 0.0453 × 10⁶ km2·year−1 (−0.55%/year) between 1979 and 2016, and the variability of the sea ice area from 1997 to 2016 is significantly larger than that from 1979 to 1996. The first-year ice extent increased by 0.0199 × 10⁶ km2·year−1 (0.36%/year) from 1997 to 2016. The multiyear ice area decreased by 0.0711 × 10⁶ km2·year−1 (−0.66%/year) from 1979 to 2016, of which in the last 20 years is about 30.8% less than in 1979–1996. In terms of concentration, we have focused on comparing 1979–1996 and 1997–2016 in different ranges. Sea ice concentration between 0.9–1 accounted for about 39.57% from 1979 to 1996, while from 1997–2016, it accounted for only 27.75%. However, the sea ice of concentration between 0.15–0.4 exhibits no significant trend changes.
1. Introduction
In recent years, global warming has accelerated the melting of ice and snow in the Arctic region. Arctic sea ice is the clearest and most important indicator of climate change due to the Arctic’s climate amplification effect [1]. As economic globalization advances and regional integration further progresses and intensifies, the Arctic is gaining global significance for its rising strategic and economic values as well as those related to scientific research, environmental protection, sea passages, and natural resources [2,3]. At the same time, the Arctic region is an important part of the global climate system and an indicator of global climate change. The Arctic is a global cold source, the movements of the atmosphere, oceans, and sea ice directly or indirectly affect the intensity of global water vapor circulation, global heat balance, and climate change, among which sea ice is a key factor affecting the global climate system [4,5,6]. The Arctic environment will continue to undergo greater changes in the future, so the rapid changes of Arctic sea ice will certainly have a profound impact on the Arctic region, and northern hemisphere [7]. With the advent of global warming, the Arctic sea ice gradually began to melt, making the opening of an Arctic shipping route possible, but sea ice is still the biggest obstacle to the development of the Arctic route [8]. Nevertheless, with the development of the global economy in recent years, the development of the “Polar Silk Road” has become inevitable. In addition, the world has begun to attach great importance to navigation security in the Arctic shipping routes. Accordingly, studies on these routes and hydrographic surveys have been continuously strengthened with the aim of improving the navigation, security and logistical capacities in the Arctic.
In the past 38 years Arctic sea ice cover has been decreasing, showing the most significant reduction in the summer. The Arctic multiyear ice area decreased at a relatively fast rate of 10% per decade [9,10], and decreased by nearly 30% from 2002 to 2010 [11]. In March of the period from 1979–2006, the sea ice extent (SIE) decreased by 2.8% per 10 years, while in September of the same period, it decreased by 8.6% per 10 years [12]. Analysis of Arctic SIE for the 28-year period from 1979–2006 reveals that they were decreased by 4.51 × 10⁴ km2·year−1, and the seasonal and monthly average of the SIEs also decreased [13]. The daily sea ice concentration data from the NSIDC from 1979 to 2013, shows that the sea ice concentration varies significantly between 2007 and 2012. The high-concentration sea ice was greatly reduced, but the low-concentration sea ice was increased [14]. Arctic SIE has noticeably decreased over the last two decades, and the regions where it is decreasing at the highest rate are mainly concentrated in the Beaufort, Chukchi, and East Siberian Seas. The historical minimum values of the Arctic SIE, observed in September 2007 and September 2012, it may be related to the abnormal state of seawater [15].
The SIE declined significantly in the summer, followed by that in autumn, winter, and spring during the 1979–2013 period [16]. In the summer of 2010, there was a very low sea-ice concentration that appeared at high Arctic latitudes—even lower than that of surrounding pack of ice at lower latitudes [17]. The extent of perennial sea ice in the Arctic decreased rapidly, and in the East Arctic Ocean continued to be depleted with an areal reduction of 70% from October 2005 to April 2006 [18]. Perennial ice extent loss in March within the Drift-Age Model domain was noticeable after the 1960s, and the loss became more rapid in the 2000s when QSCAT observations were available to verify the model results [19]. Comiso et al. recent study show that Goddard Bootstrap (SB2), Goddard NASA Team (NT1), EUMETSAT Ocean and Sea Ice Satellite Application Facility (OSI-SAF 1.2), and Hadley HadISST 2.2 data in evaluating variability and trends in the Arctic sea ice cover have different results [20]. The recent results show record-late 2016 freeze-up in the central Arctic, North Atlantic and the Alaskan Arctic sector in particular, associated with strong sea surface temperature anomalies that appeared shortly after the 2016 minimum (October onwards) [21]. Acceleration in the decline is evident as the extent and area trends of the entire ice cover (seasonal and perennial ice) have shifted from about −2.2 and −3.0% per decade in 1979–1996 to about −10.1 and −10.7% per decade in the last 10 years. The latter trends are now comparable to the high negative trends of −10.2 and −11.4% per decade for the perennial ice extent and area, 1979–2007 [22]. Liu et al. (2018), divided the Arctic into thirteen sub-regions, the results show that the changes in the four active regions are periodic and the change period is over 10 years during the period from 1979 to 2016 [23].
In this paper, our analysis of sea ice variability is performed primarily based on the total sea ice area (SIA), first year ice extent, multiyear ice area, and sea ice concentration in different ranges. In addition, it also focuses on the comparison of the Arctic sea ice for the two periods, 1979–1996 and 1997–2016, respectively.
2. Dataset
The data used in this study were obtained from NSIDC (https://nsidc.org/noaa/data-sets). This data set includes data from several microwave radiometers (Table 1): The Nimbus-7 Scanning Multi-channel Microwave Radiometer (SMMR, National Oceanic and Atmospheric Administration (NOAA), Washington DC, USA); Defense Meteorological Satellite Program (DMSP, Defense); F8, F11, and F13 Special Sensor Microwave/Imagers (SSM/Is); DMSP-F17, DMSP-F18 Special Sensor Microwave Imager/Sounder (SSMIS, NOAA, Washington DC, USA) [24]. The sea ice concentration calculation was performed using the NASA Team algorithm developed by the Sea Ice Division of the NASA Goddard Space Flight Center Water Cycle Laboratory [25]. The data are mapped to a common rectangular grid overlaid on a north polar stereographic projection with a grid cell size of 25 km × 25 km [25]. In this study, the sea ice concentration data set, was the source data for the calculation of the SIE and SIA. The SIE is the cumulative area of all polar grid cells that have at least 15% sea ice concentration. The SIA is the sum of the grid cell areas multiplied by the sea ice concentration for all cells with ice concentration of at least 15%. The 15% threshold is used for both ice extent and ice area calculations [26]. In this paper, we used data from 1979 to 2016.
3. Results and Analysis
3.1. Total Sea Ice Area
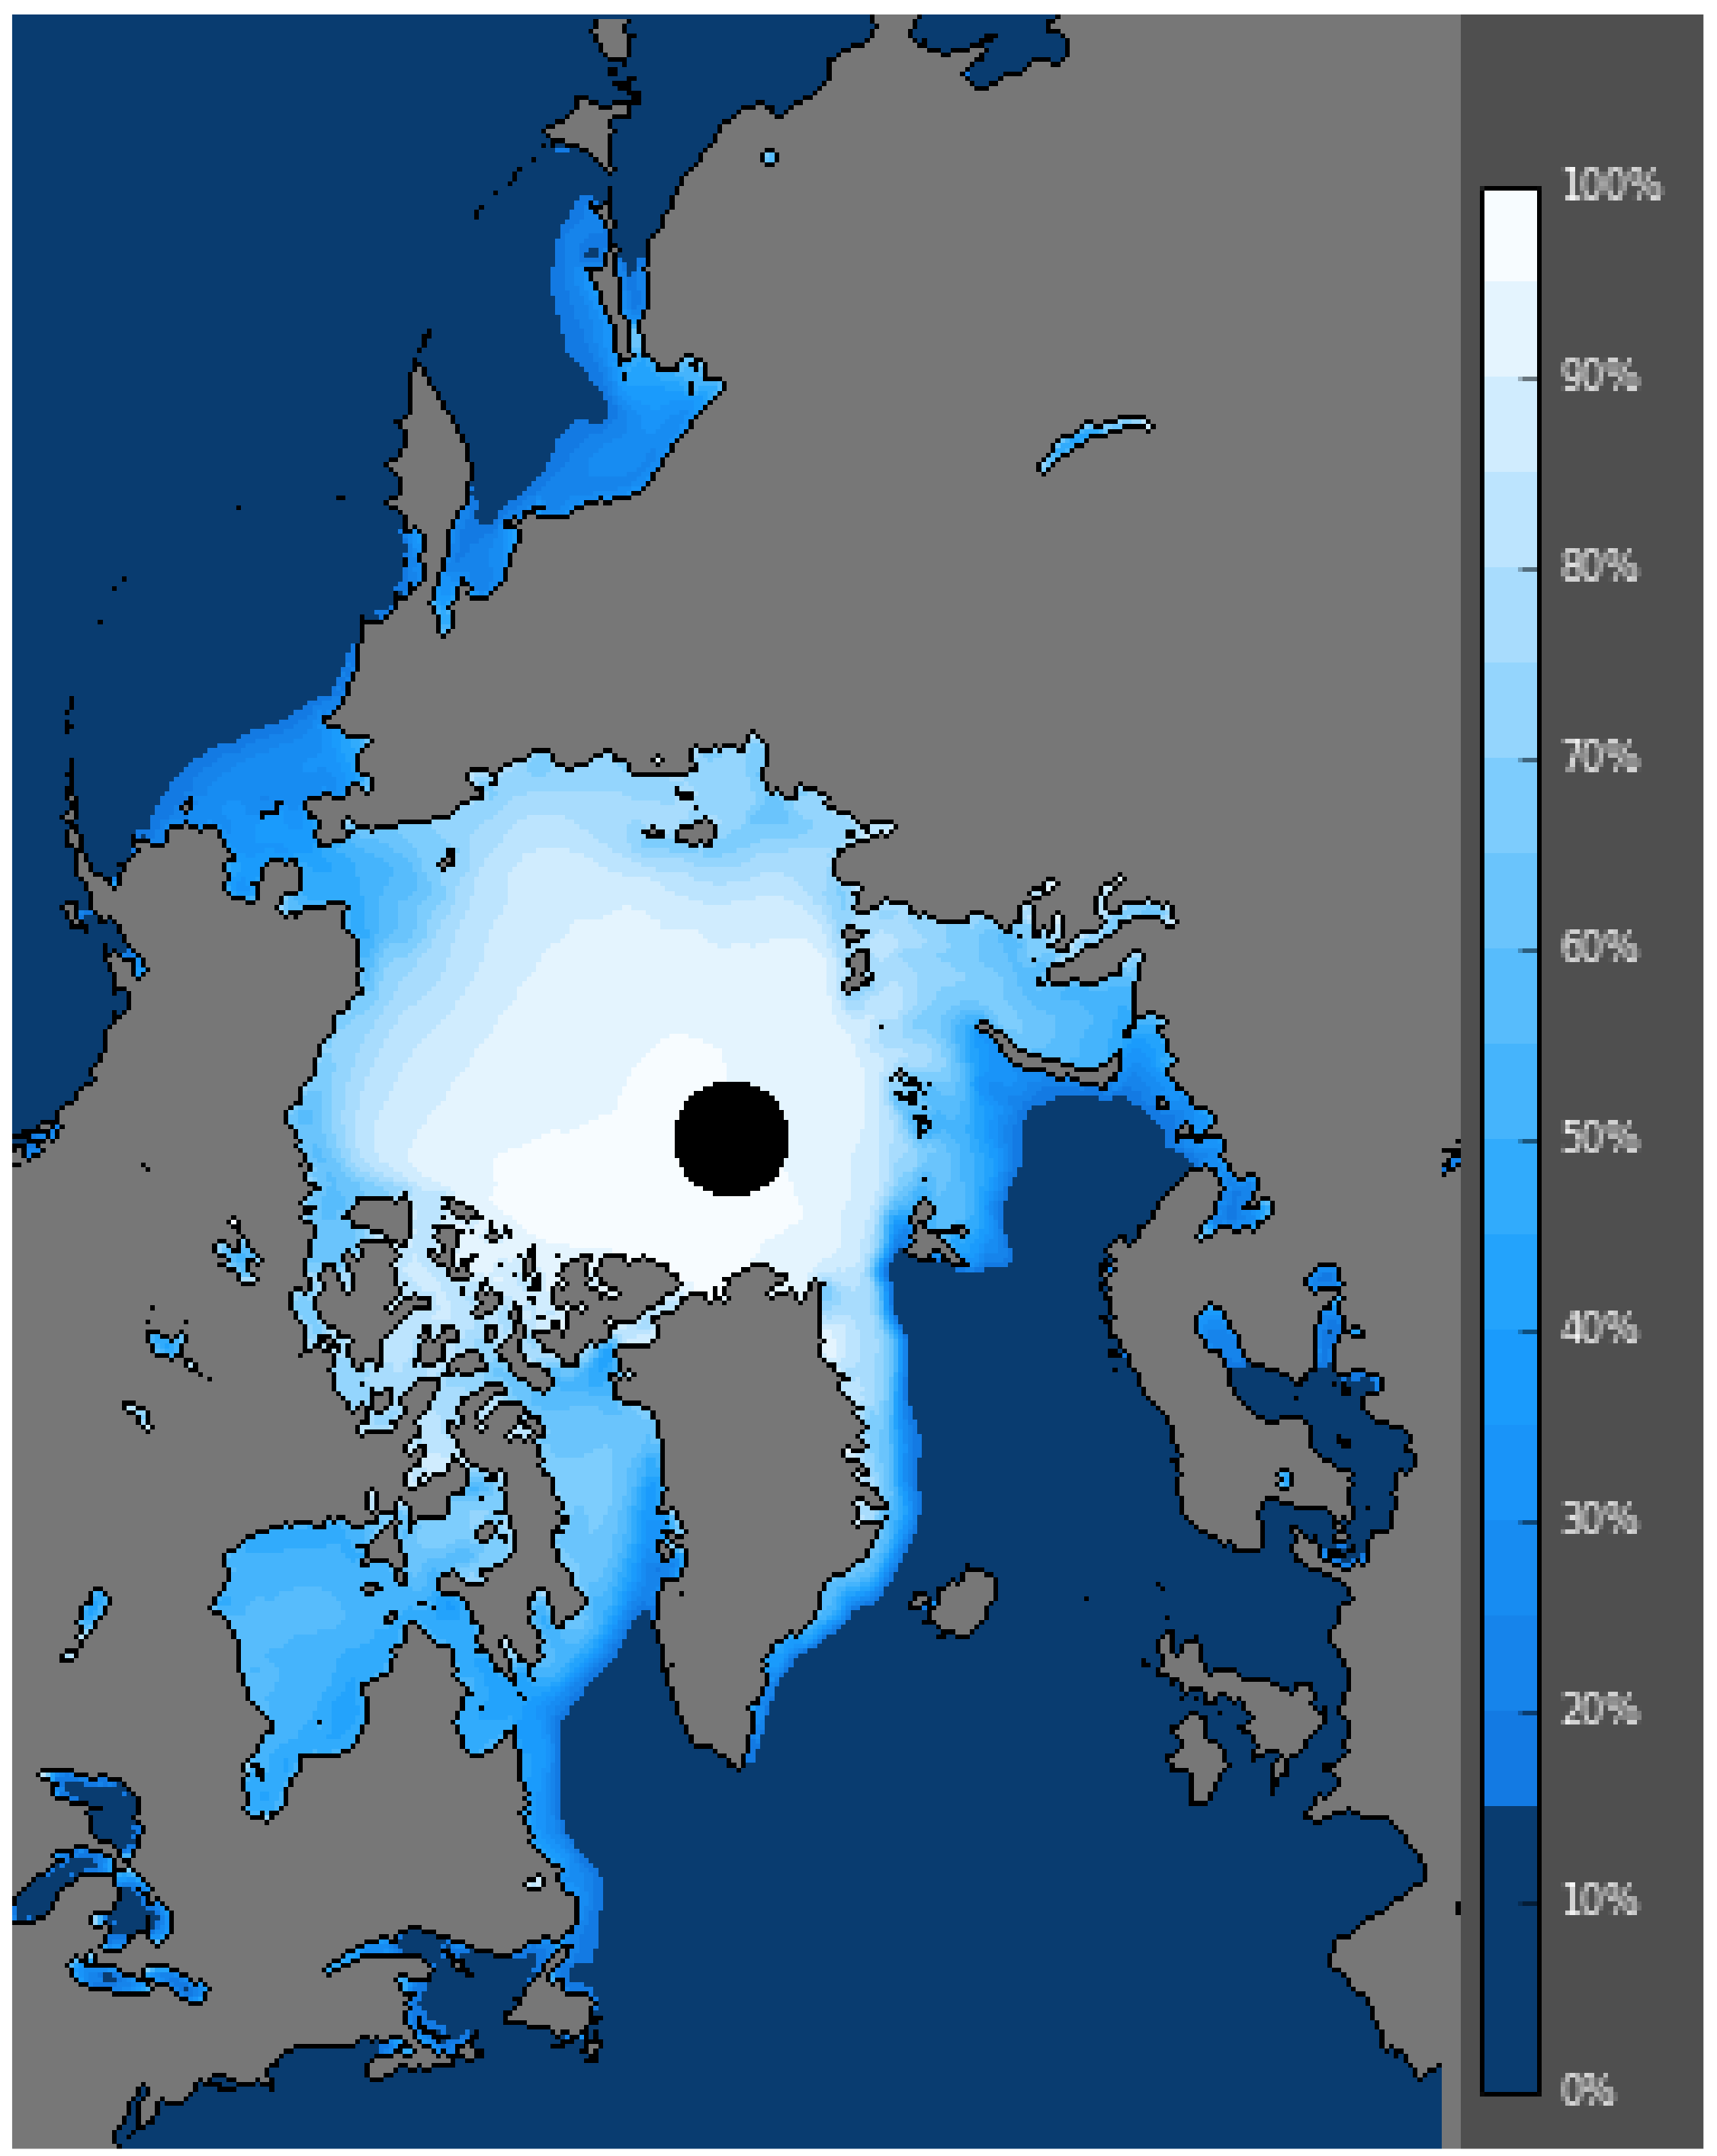
The interannual variation of the Arctic SIA has great reference value for the study of global temperature. Therefore, studying the Arctic total SIA is very important and necessary to reveal the role of Arctic sea ice cover in relation to the global climate changes. The total SIA is calculated on a daily basis and then combined to monthly, yearly, every 20-year and 38-year averages. The average sea ice concentration results for the 38-year period was obtained and presented in Figure 1. The yearly fitting line of the SIA is plotted in Figure 2.
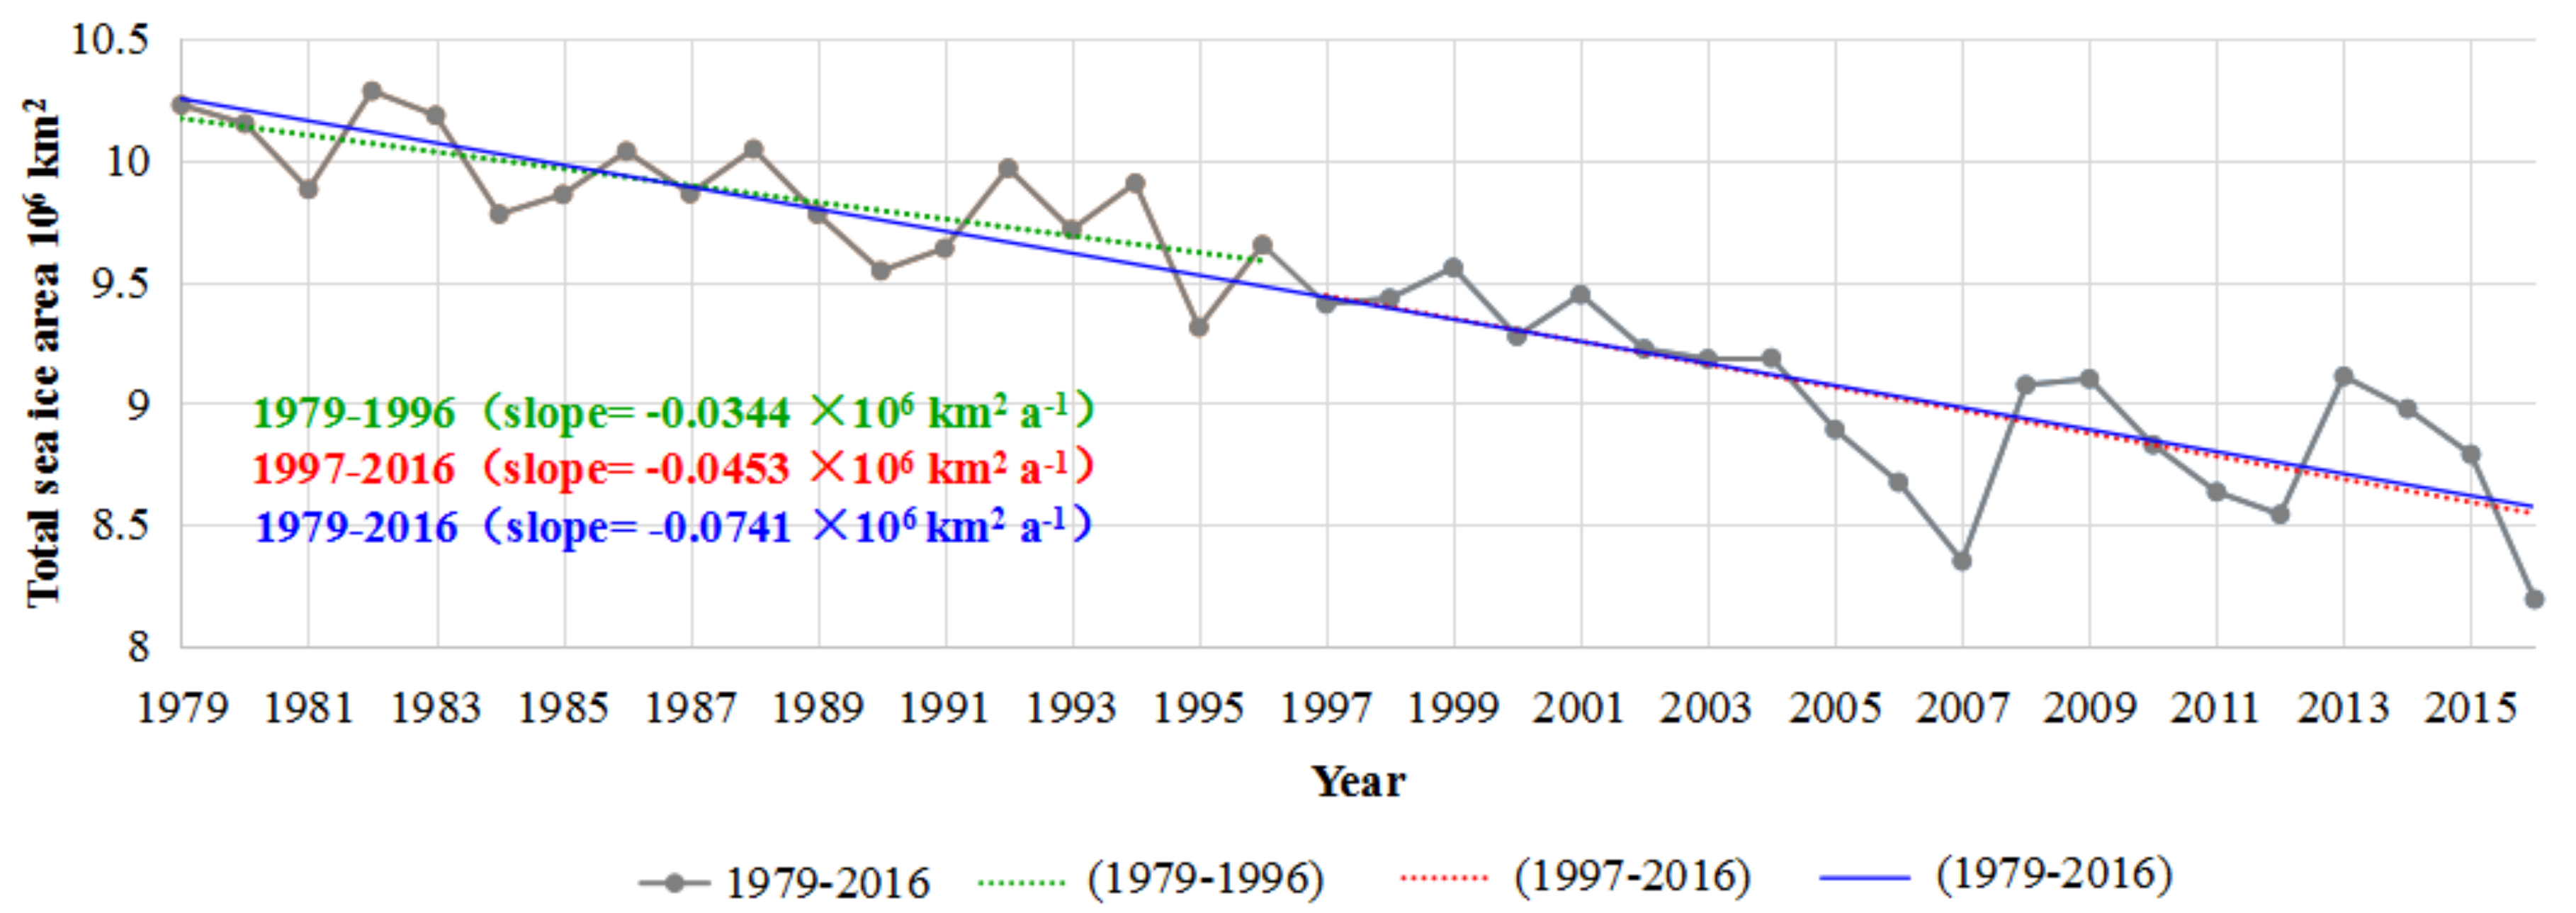
As illustrated in Figure 1 the high-concentration sea ice shrunk to the center of the Arctic Ocean during 1979–2016. The data shown in Figure 2 present the yearly variation of Arctic SIA. Specifically, the results in Figure 2 reveal that the SIA decreased from 1979 to 2016 by approximately 0.0453 × 10⁶ km2·year−1 (−0.55%/year) (at the 90% level). Meanwhile, from 1979 to 1996, the SIA decreased by 0.0344 × 10⁶ km2·year−1 (Figure 2), and from 1997 to 2016 it decreased at a rate of 0.0471 × 10⁶ km2·year−1 (Figure 2). Three years has a particular low SIA; 2007 (8.35 × 10⁶ km2), 2012 (8.24 × 10⁶ km2) and 2016 (8.19 × 10⁶ km2), with 2016 being the lowest SIA seen in the 1979–2016 record. Previous studies have shown that the extent and area of the ice cover reached minima on 14 September 2007 at 4.1 × 10⁶ km2 and 3.6 × 10⁶ km2, respectively [22]. The year 2012 has a lower SIA also, but in the year 2013 the SIA was significantly increased compared to 2012, and ice conditions were similarly severe in 2009. The SIA of 2016 showed a significant downward trend compared to 2015, and it was the year with the lowest SIA in the past 38 years. At the same time, some studies show that the Arctic sea ice cover of 2016 was highly noteworthy, as it featured record low monthly sea ice extents at the start of the year but a summer (September) extent that was higher than expected by most seasonal forecasts [21].
A comparison of the results of two consecutive half periods (1979–1996 and 1997–2016) revealed that although the SIA in both periods showed a downward trend, the specific trend of change was different. Evidently, the Goodness of fit value for the first half period is 0.5221, which is smaller than the 0.5503 of the second half period. In order to quantitatively compare the differences between the two half periods, the yearly SIA was calculated and are shown in Figure 2. The average SIA from 1979 to 1996 is 9.877 × 10⁶ km2, with a variance of 0.061; from 1997 to 2016, the average SIA is 8.993 × 10⁶ km2, with a variance of 0.134. Thus, the average SIA differs only by about 8.94%, but the variance of the latter half period is significantly greater than that of the previous half period. Accordingly, the volatility of the latter half period is higher, which means that the Arctic sea ice likely has a trend of overall decline, but will be more volatile in the future.
3.2. First Year Ice Extent
First-year ice means that the sea ice lasts for no more than one year. It is generally formed in the winter and melts in the summer. The first-year ice can reflect the difference in ice conditions during that year. Based on the daily sea ice concentration obtained from the NSIDC, the maximum and minimum SIEs for each day are calculated during a year. The first-year ice extent is given as the difference between the yearly minimum and maximum daily SIE.
The first-year ice extent is calculated based on the daily SIE obtained from the NSIDC. Some preprocessing on the daily sea ice extent data is required before calculating the multiyear ice area. First, the value of the sea ice pixel is assigned to be 0, the value of the seawater pixel is assigned to be 1, and the land is masked out. Next, the daily SIEs are counted, and the annual data are accumulated. Ultimately, if the accumulated value of a pixel is not equal 0 or 365 (leap year: 366), it means that the pixel is first-year ice. Ultimately, the statistical results and trend (Figure 3) of the first-year extent were obtained.
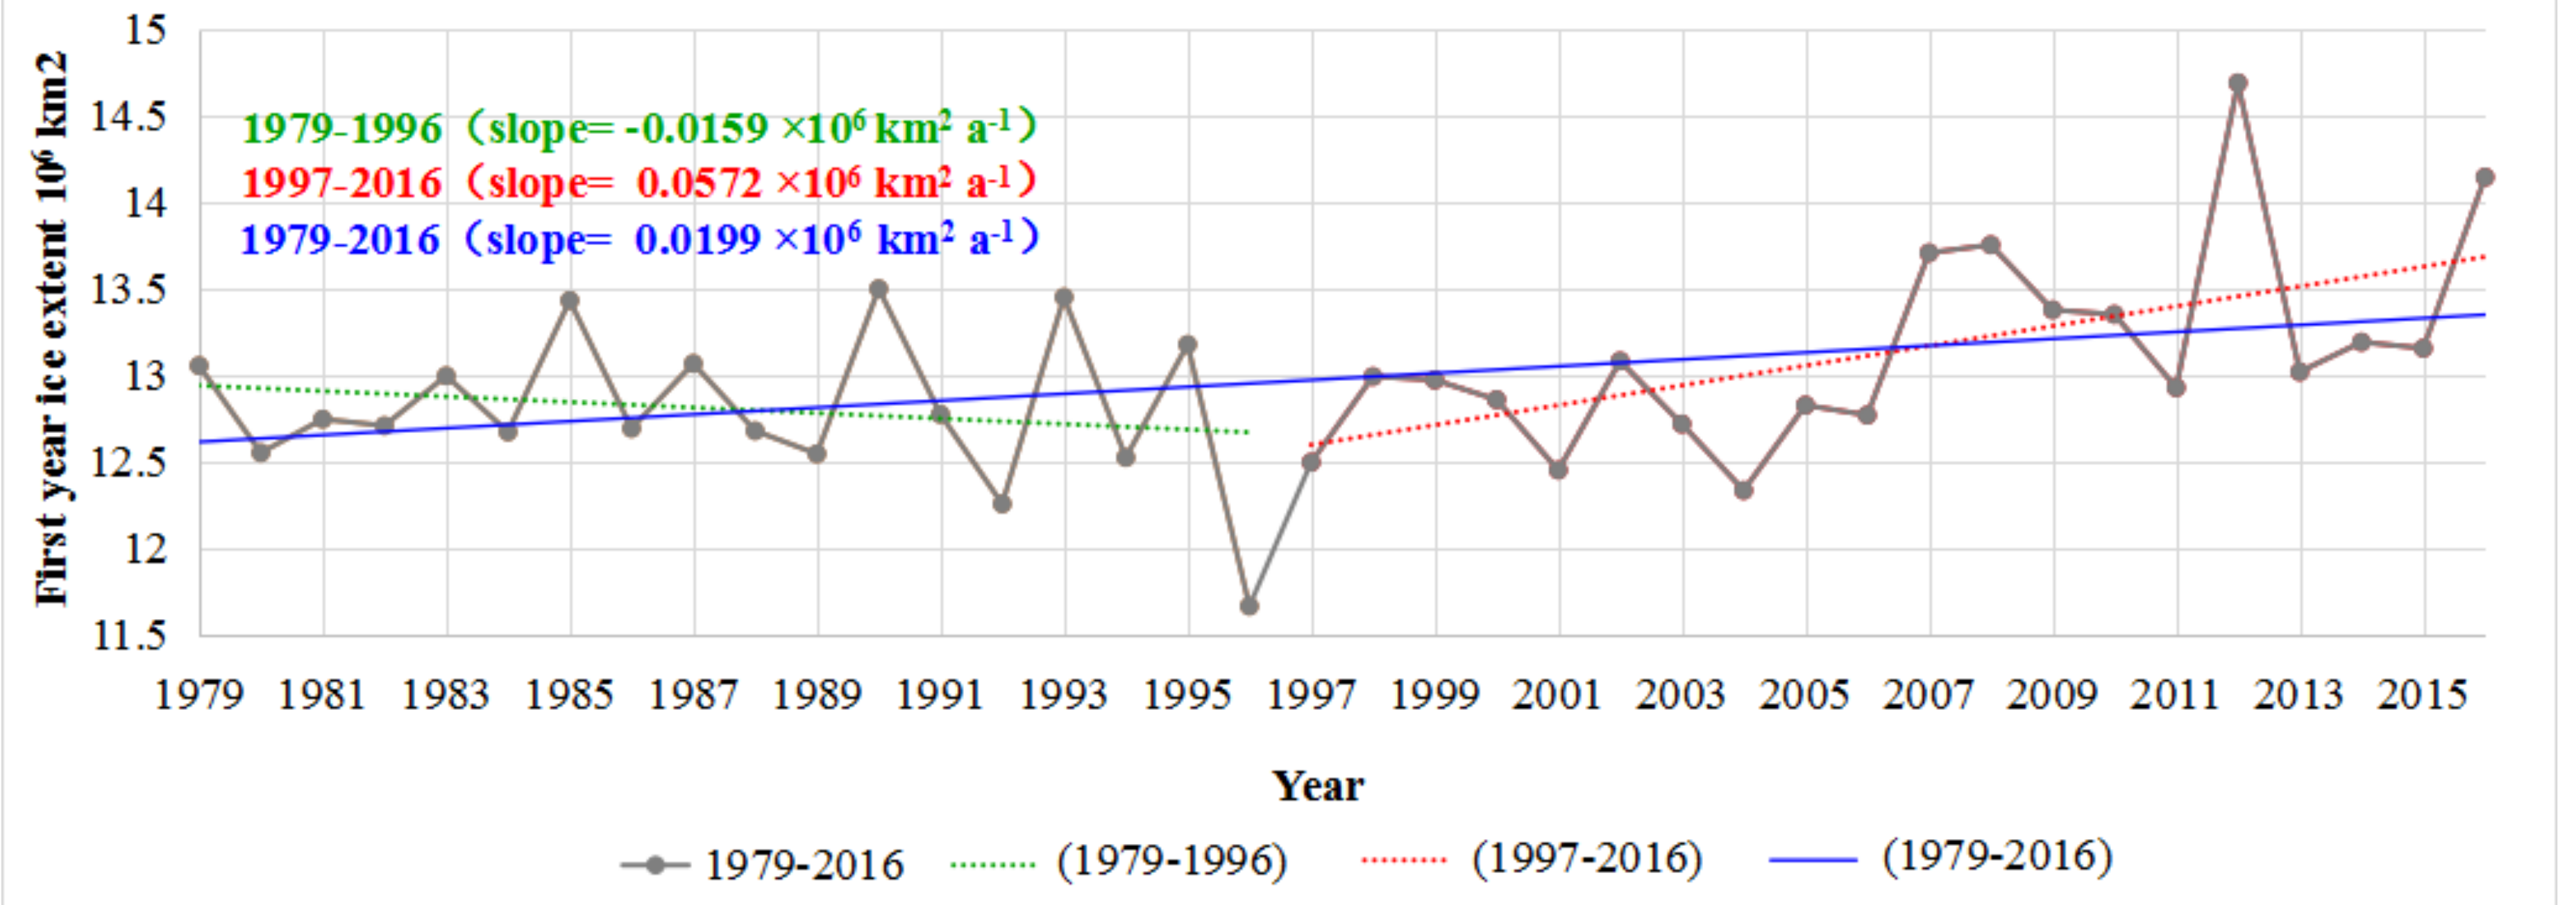
The data presented in Figure 3 indicates that the first-year ice extent from 1979 to 2016, increased by about 0.0199 × 10⁶ km2·year−1 (0.36%/year) (at the 95% level). Meanwhile, from 1979 to 1996, the first-year ice extent decreased by 0.0159 × 10⁶ km2·year−1(Figure 3), and from 1997 to 2016 it increased at a rate of disappearance of 0.0572 × 10⁶ km2·year−1 (Figure 3). The two periods show the opposite trend. Thus the first-year ice extent increased rate of latter half period is much larger than the decrease rate of the former half period.
The average first-year ice extent is 12.807 × 10⁶ km2 from 1979 to 1996 and 13.142 × 10⁶ km2 from 1997 to 2016. It is obvious that the average extent of the first-year ice in the former period is 2.62% smaller than that of the latter, while the variances are 0.192 and 0.318 in the two half periods, respectively. Variance is used to describe the volatility of a set of data. The results reveal that the volatility during the latter half period is far greater than that during the former half period. Therefore, in recent years, the first-year ice extent has changed significantly and fluctuated considerably.
3.3. Multiyear Ice Area
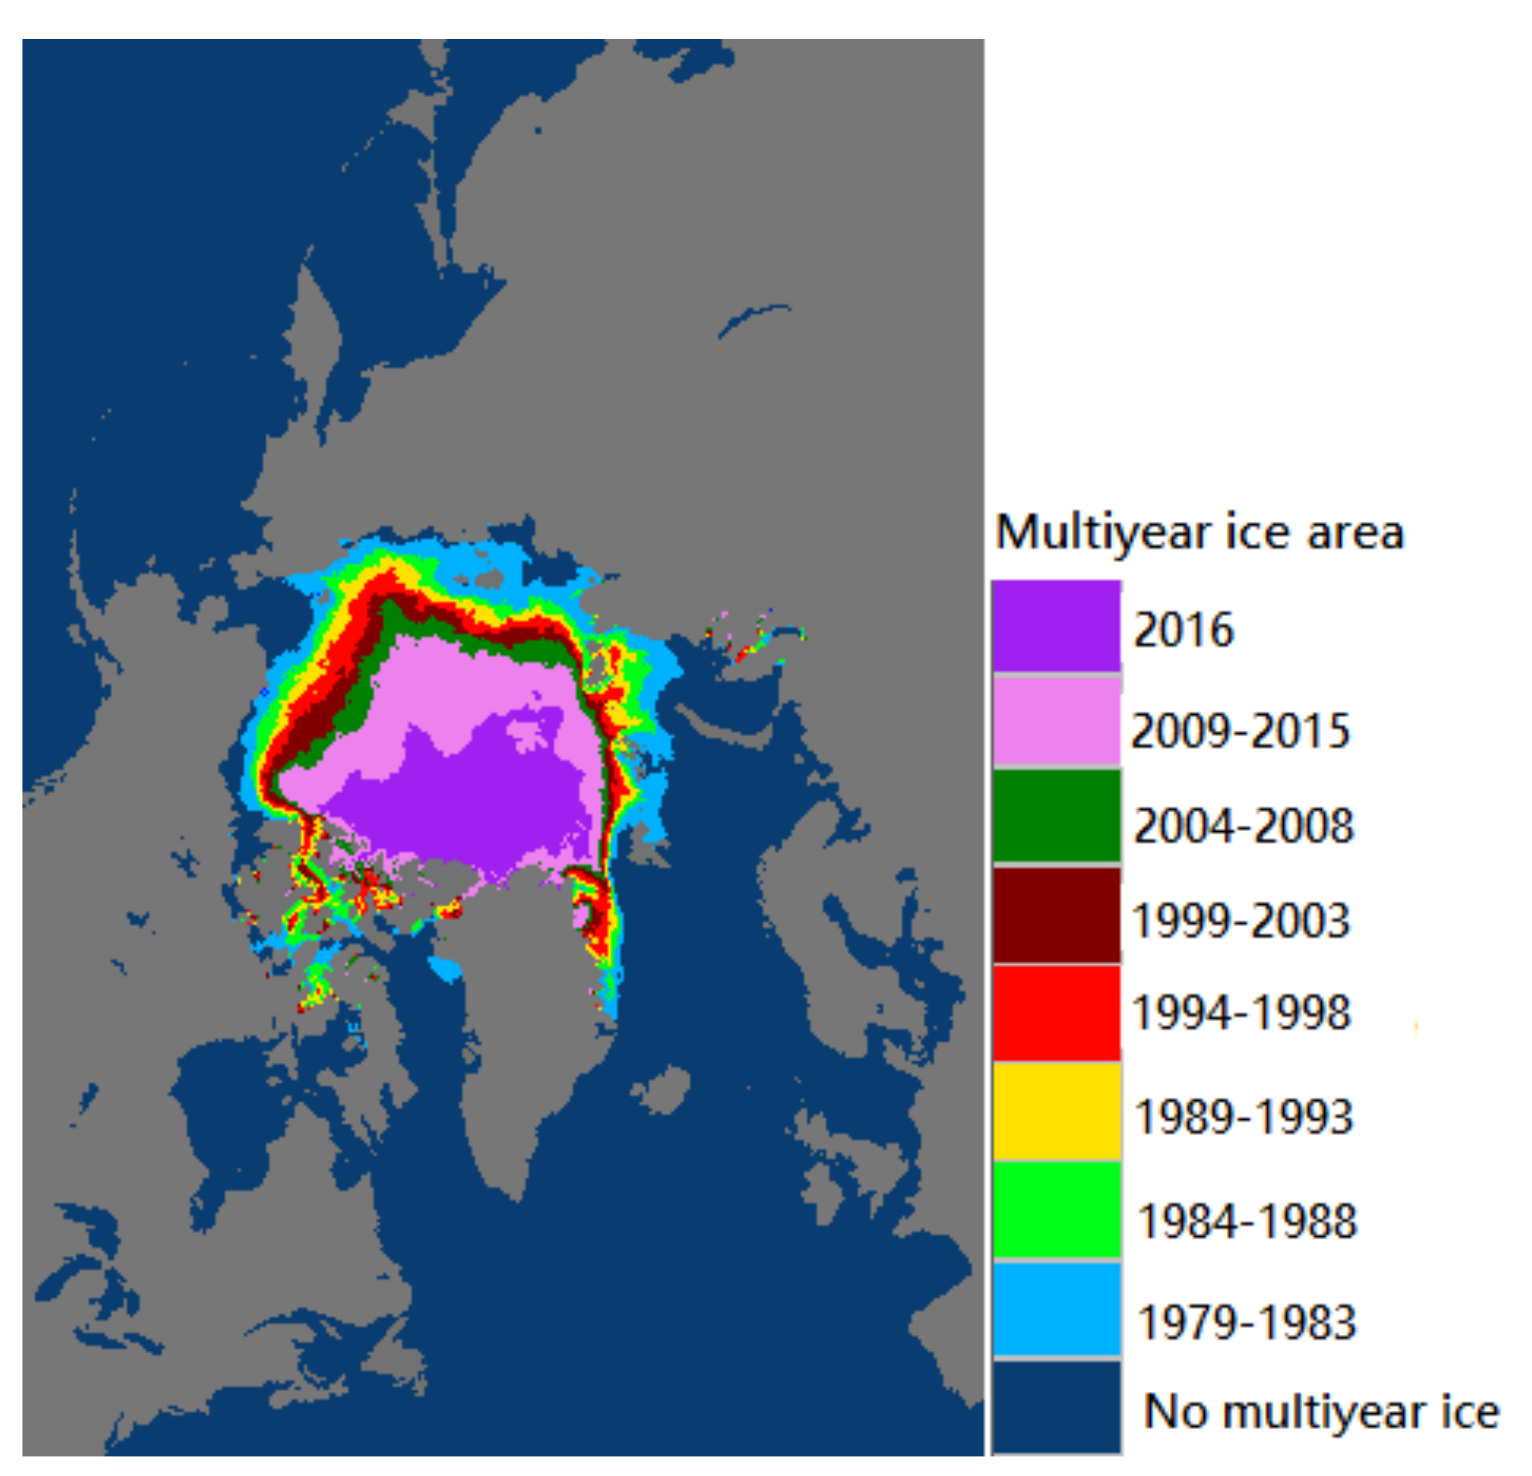
Multiyear ice is present in the Arctic Ocean and account for a large part of Arctic sea ice. Multiyear ice is more stable than the first-year ice. Therefore, a long-term study of multiyear ice can predict the trend of the Arctic SIA in the future. It is important for a more accurate quantification of the multiyear ice extent to perform the quantification with data obtained during a minimum extent period (typically September), since at this time the first-year sea ice cover has basically melted and what is left the multiyear ice [10]. The multiyear ice area is calculated based on the daily SIE obtained from the NSIDC. Some preprocessing on the daily sea ice extent data is required before calculating the multiyear ice area. First, the value of the sea ice pixel is assigned to be 0, the value of the seawater pixel is assigned to be 1, and the land is masked out. Next, the daily SIEs are counted, and the annual data are accumulated. Ultimately, if the accumulated value of a pixel is 0, it means that the pixel is multiyear ice. The distribution of multiyear ice in different time periods were obtained and are presented in Figure 4. The statistical results of multiyear ice area and proportion are shown in Table 2.
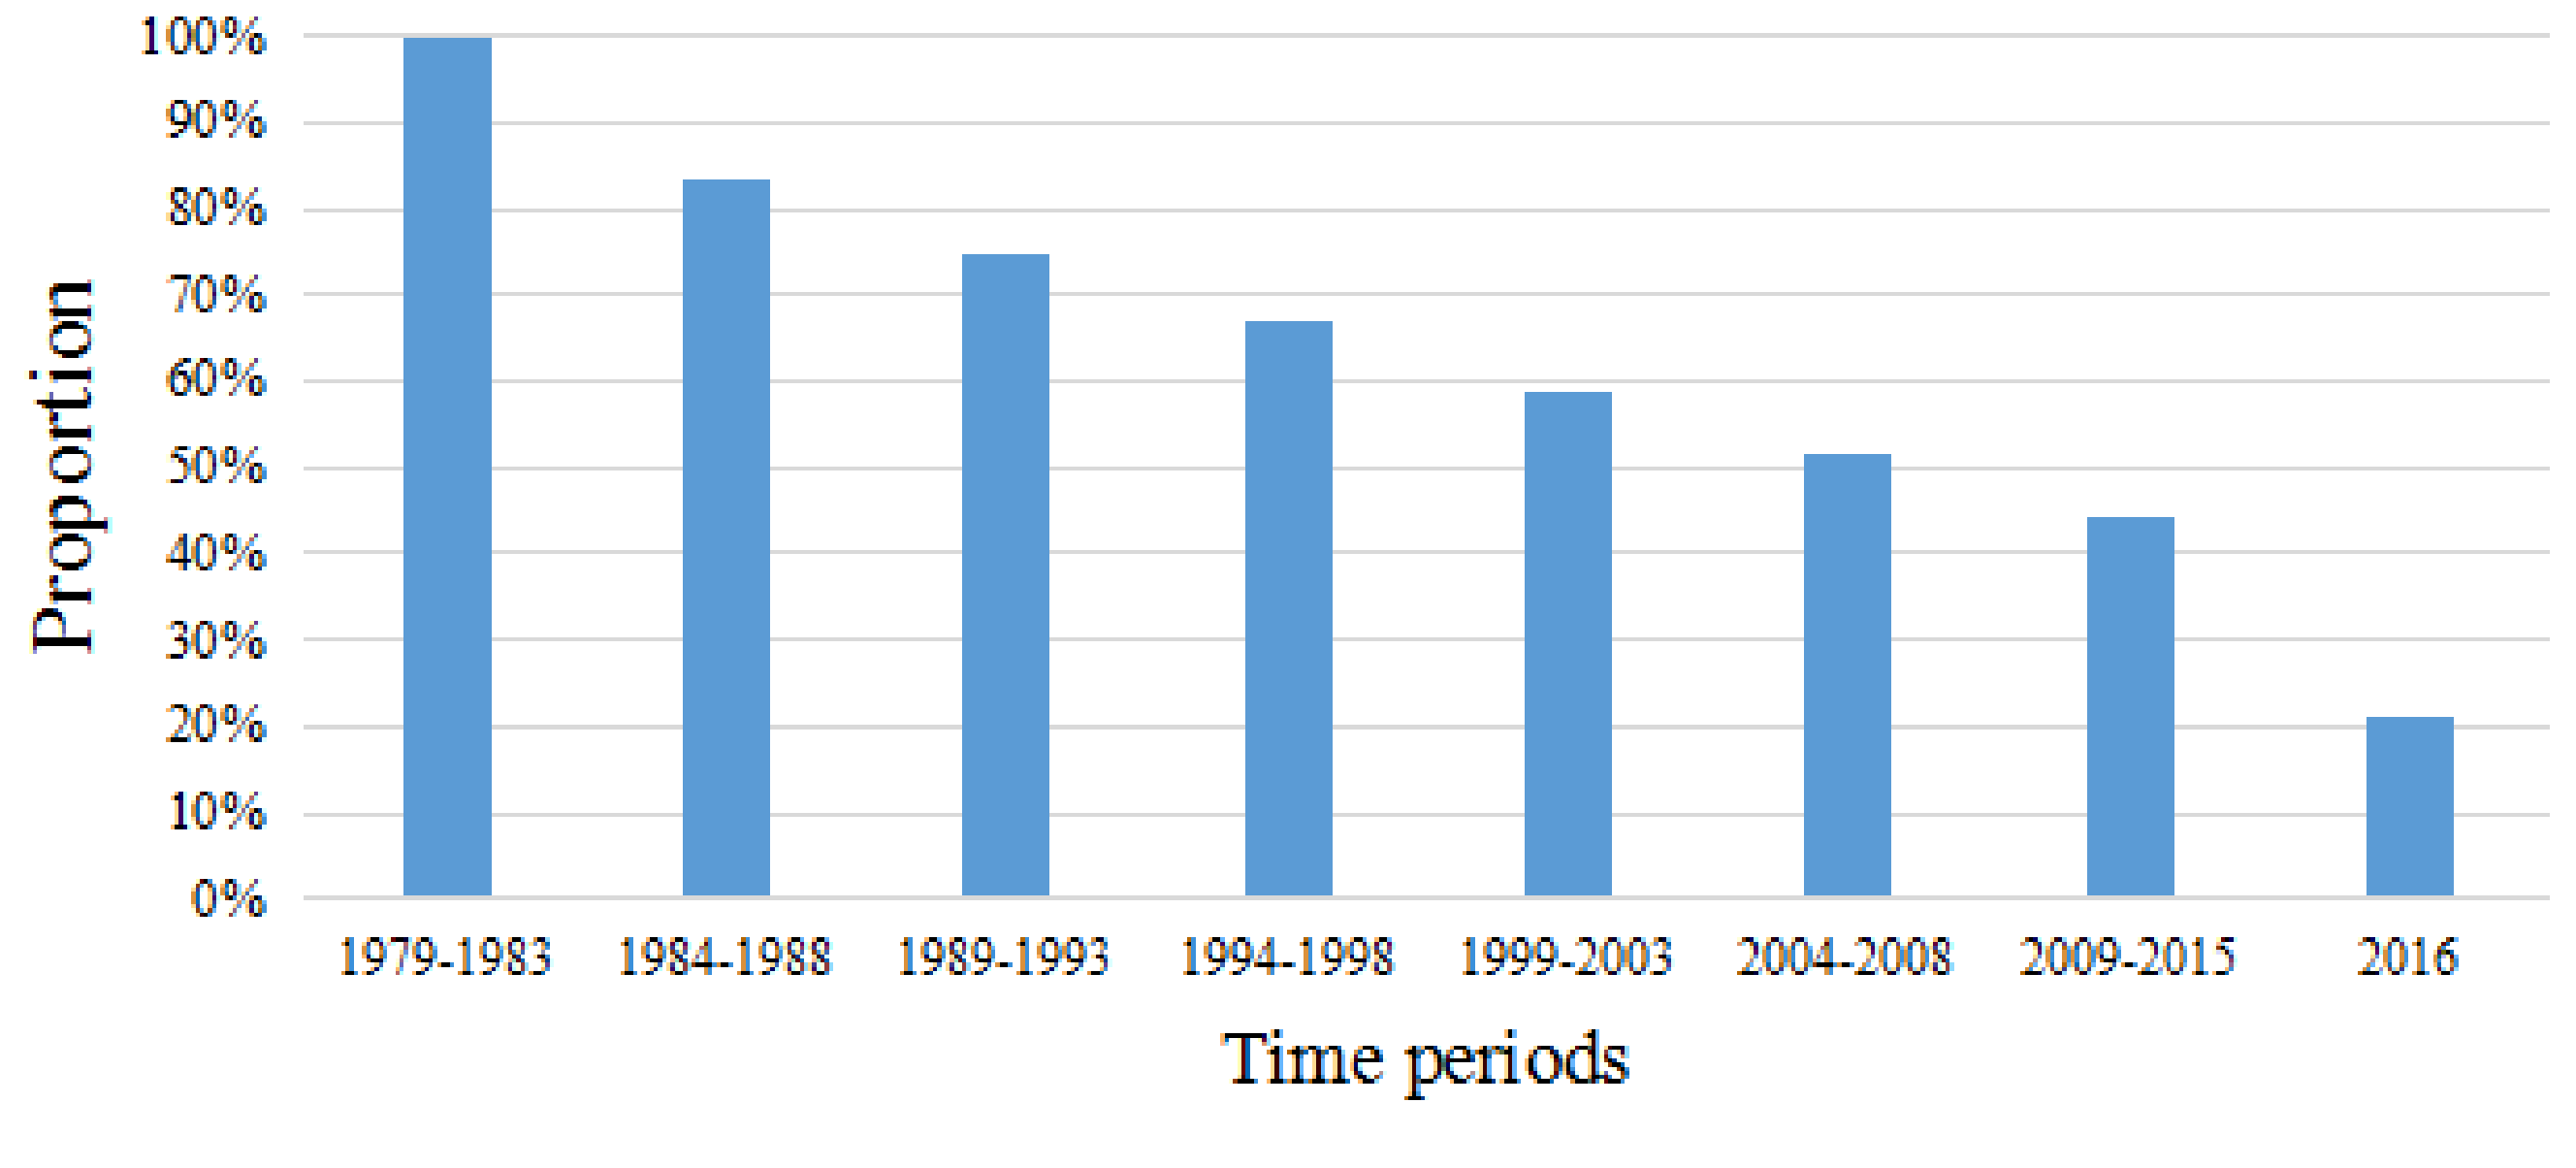
As illustrated in Figure 4, the high age multiyear ice shrunk to the center of the Arctic Ocean through the period 1979–2016. And the center of the Arctic Ocean was 2009–2016 of multiyear ice. As shown in Figure 5 and Table 2, the multiyear ice of 2009–2016 accounted for 44.21%, and the 2016 multiyear ice area just accounted for 21.29%.
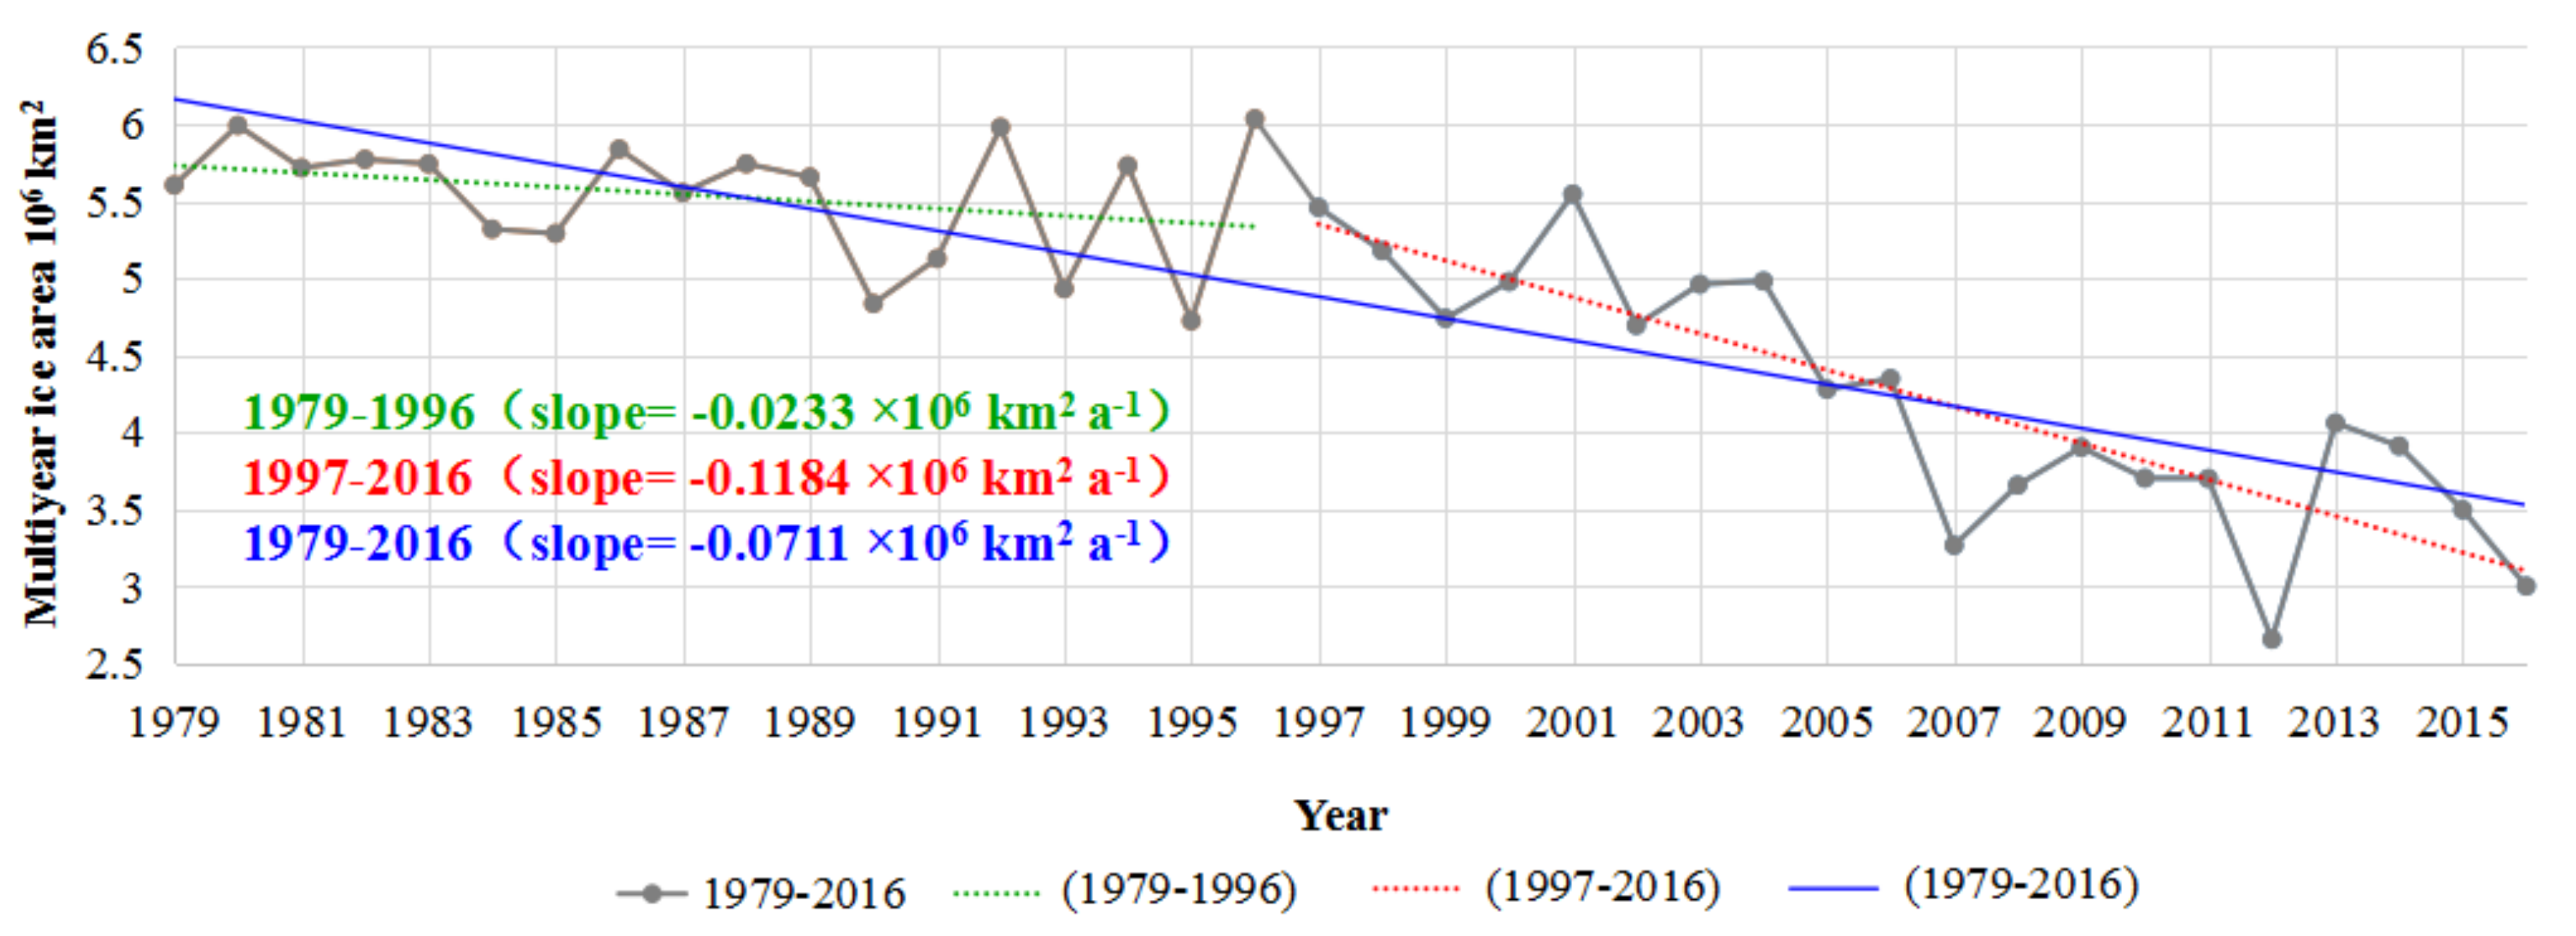
The yearly multiyear ice area from 1979 to 2016, and the yearly trend for the 38-year period is shown as Figure 6.
The multiyear ice area shows a decreasing trend from 1979 to 2016, and is reduced at 0.0711 × 10⁶ km2·year−1 (−0.66%/year) (at the 95% level). From 1979 to 1996, the multiyear ice area decreased by 0.0233 × 10⁶ km2·year−1 (Figure 6), and from 1997 to 2016 it decreased at a rate of 0.01184 × 10⁶ km2·year−1 (Figure 6). The three years of 2007, 2012 and 2016 are the extremely-low years of multiyear ice area. Multiyear ice is a kind of stable sea ice, so to a certain extent, its variation can reflect the trend of the overall SIA. The average multiyear ice area from 1979 to 1996 was 5.531 × 10⁶ km2, while from 1997 to 2016 the area was 4.226 × 10⁶ km2, a difference of about 30.9%. Thus, the multiyear ice area has been significantly reduced in recent years. The variances were 0.403 and 0.822 in the two half periods, respectively.
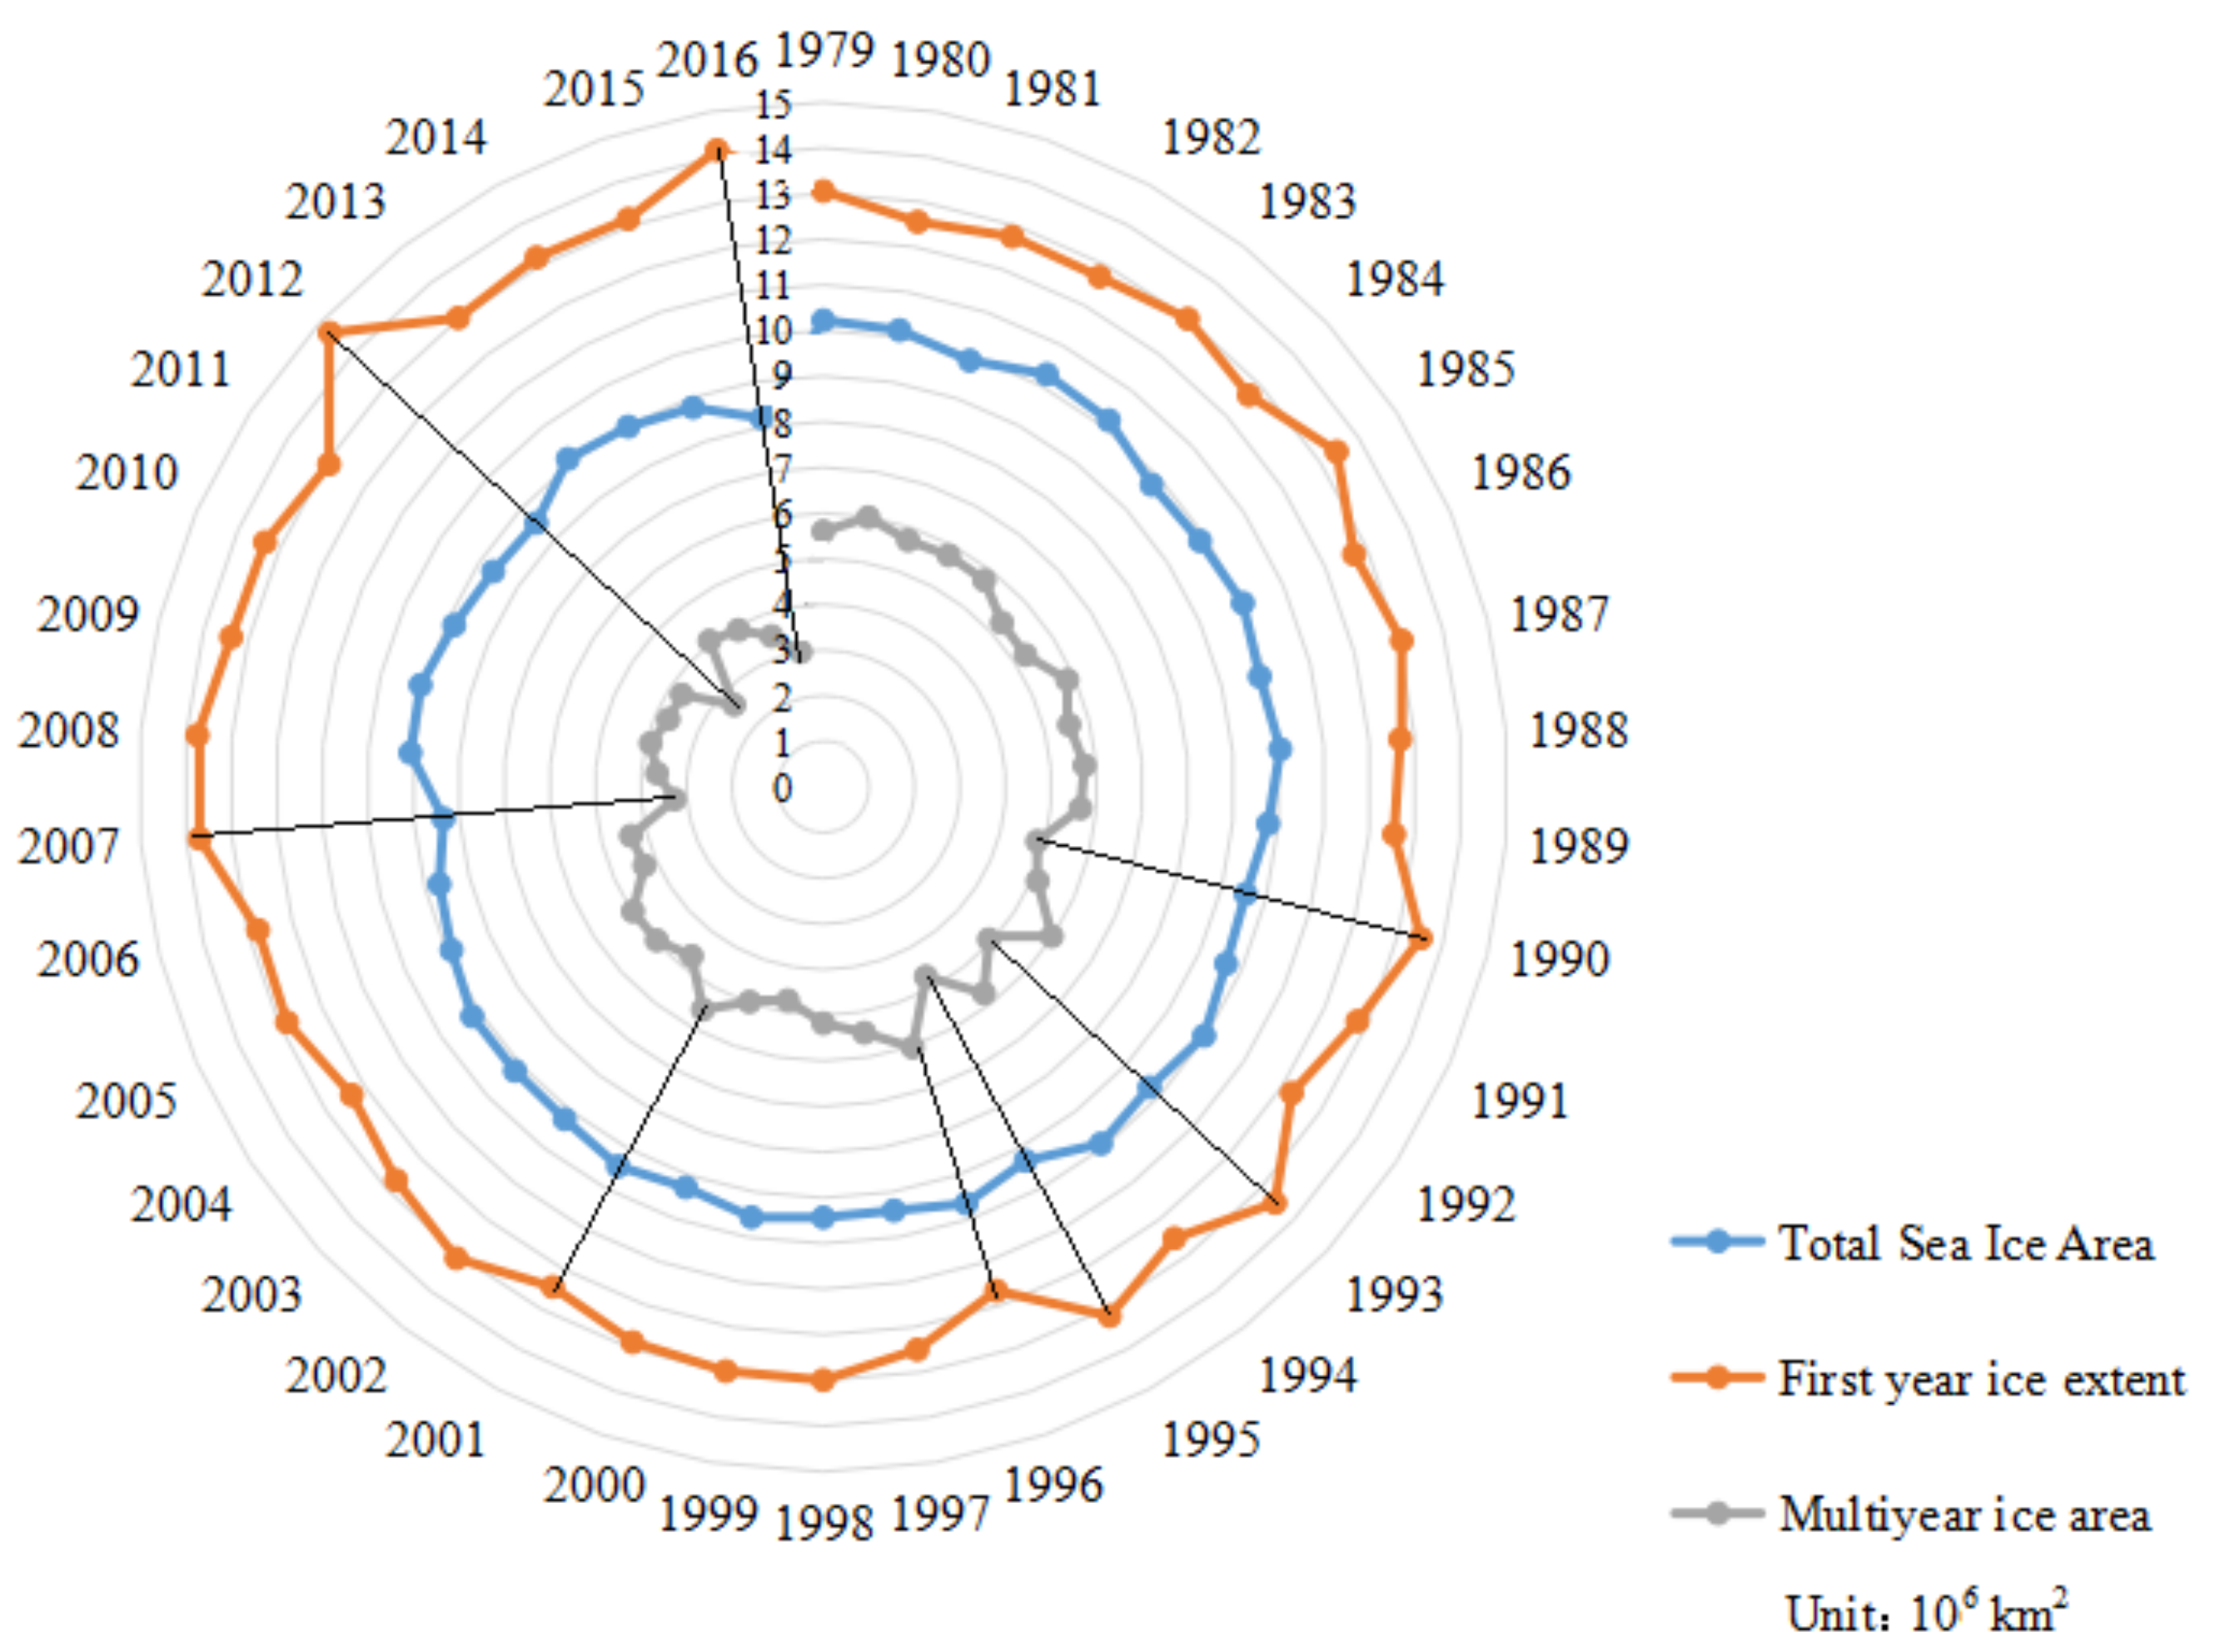
In order to better compare the relationship between the total sea ice area, first-year ice extent and the multi-year ice area, the contrast radar map shown in Figure 7. Among them, the blue circular line represents the change trend of the total sea ice area from 1979 to 2016, the orange circular line represents the change trend of the annual ice area from 1979 to 2016, and the gray one represents the change trend of the multi-year ice area. It can be seen from Figure 7 that the circular line of the multi-year ice area and the total sea ice area shrink inwardly, showing the decreasing trend, but the circular line of the first-year ice extent expands outward, showing an increasing trend.
Comparing with them, it is found that the change of multi-year ice area is the most significant, the annual fluctuation is extensive, and the contraction is the largest. The total sea ice area changes relatively gently with respect to the other sea ice parameters. Roughly, from 1979 to 1996, the total sea ice area was about 10 × 106 km2, and it fluctuated in 8–10 × 106 km2 during 1997–2016. The range of change with the first-year ice extent is in 12–14 × 106 km2, and it fluctuated in 12–15 × 106 km2 during 1997–2016. From 1979 to 1996, the multi-year ice area fluctuated in 5–6 × 10⁶ km2, but from 1997 to 2016, it fluctuated in the range of 3–6 × 10⁶ km2. It can be seen that the fluctuation range and frequency of the total sea ice area, first-year ice extent and multi-year ice area in the latter half period are larger than those in the former half. This increased variability may be a persistent feature of Arctic sea ice in the future.
As can be seen from Figure 7, the multi-year ice area in 1990, 1993, 1995, 2007, 2012, and 2016 have decreased significantly, which provides an opportunity for greater first-year ice extent in these same years. In 1996 and 2001, the increase of the multi-year ice area led to a decrease of the first-year ice extent were more obvious. The fluctuation of the total sea ice area is basically the same as the multi-year ice area. It is contrary to the fluctuation of the first-year ice extent, but its variation range is relatively flat. So this indicates that there is a negative correlation between the first-year ice extent and the multi-year ice area. A weak negative correlation between the first-year ice extent and the total sea ice area. A weak positive correlation between the multi-year ice area and the total sea ice area.
3.4. Analysis of Sea Ice Concentration
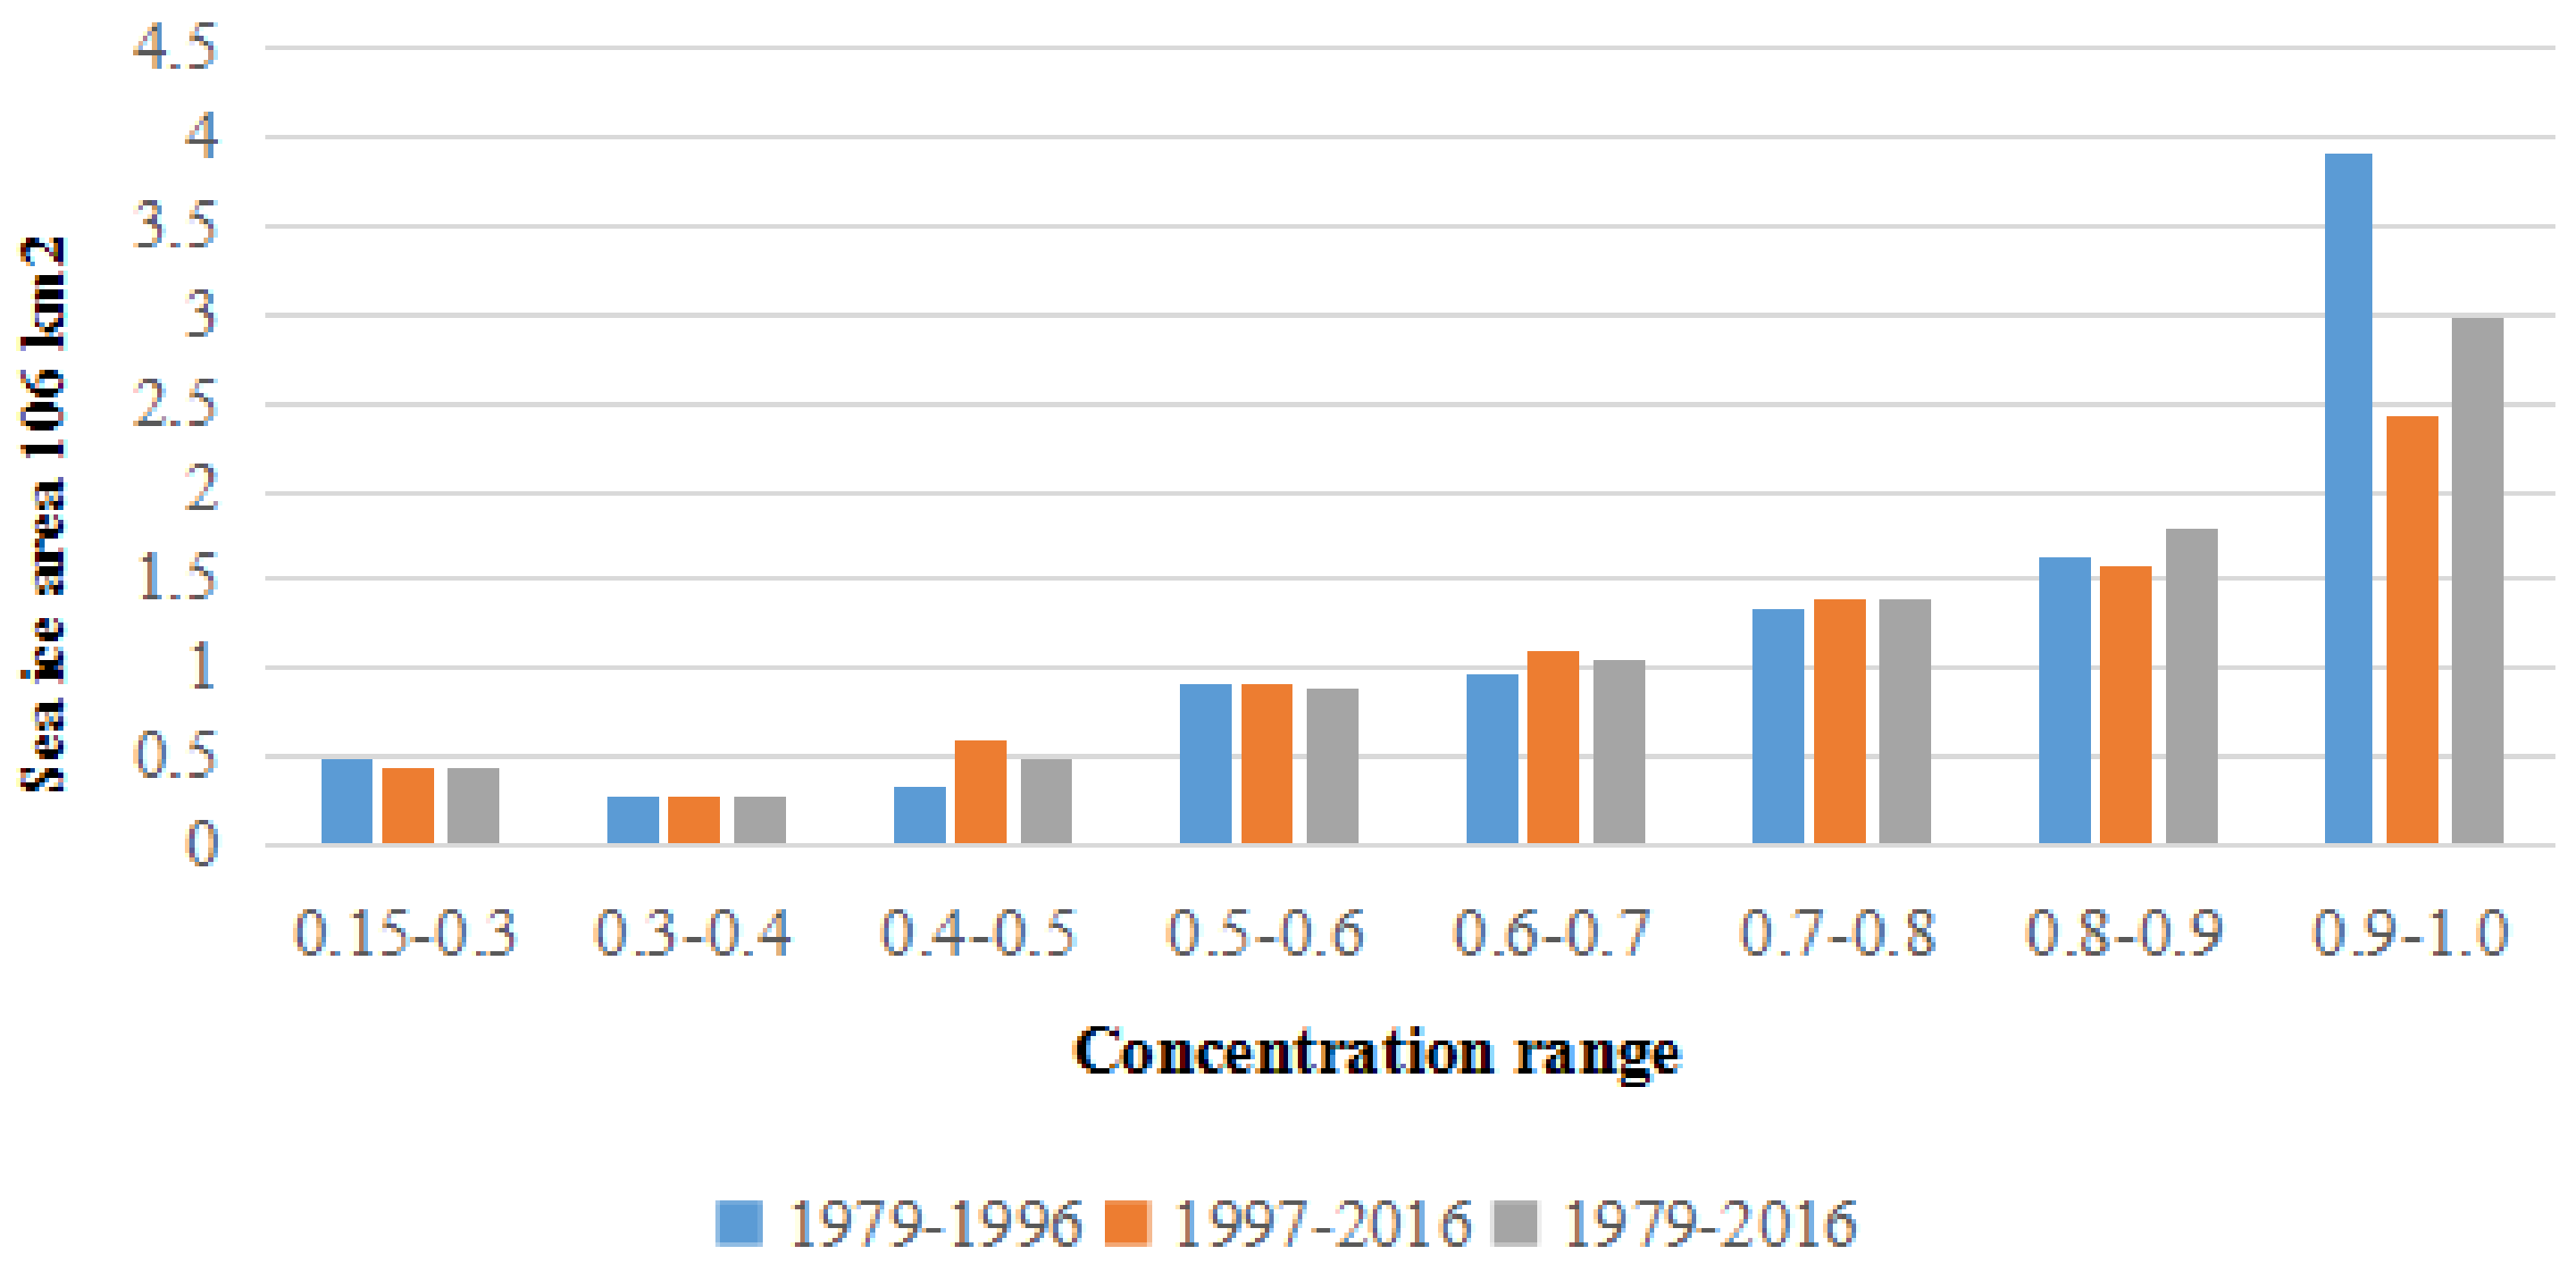
Sea ice concentration is a useful variable for climate scientists and nautical navigators and it is defined as the area of sea ice relative to the total at a given point in the ocean. It is one of the most important parameter to describe the characteristics of sea ice, and is also a major factor in the study of atmospheric and ocean circulation patterns. It represents the percentage of sea ice in a grid cell area, which ranges from 0 to 100%. Based on the daily average sea ice concentration, the yearly sea ice concentration was calculated. Then, the yearly sea ice concentration range is divided into ranges of 10%, and the sea ice area of each range is calculated. To better illustrate the changes between two half time periods, the area of the different ice concentration ranges are shown in Figure 8.
A comparison of the data presented in Figure 8 reveal that the average sea ice concentration between 0.9–1 is about 31.91% of the total sea ice area in 38 years. It accounted for about 39.57% of the total sea ice area in the former half period, but it only accounted for 27.75% in the latter half period. This indicates that sea ice of the high-concentration decreased significantly. The data presented in Figure 8 intuitively show that the area with the concentration between 0.4–0.9 exhibited a significant increase, of approximately 8.53%, over the earlier half period. The area with concentration less than 0.4 showed almost no change.
To sum up, the total SIA showed a strong consistency in the multiyear ice area, but the reduction rate of the multiyear ice is faster than that of the total sea ice. The extents of first-year ice showed an increasing trend from 1997 to 2016, among which the years of 2007, 2012, and 2016 were clearly higher than that in other years. However, the multiyear ice was clearly less than that of other years in these three years. Therefore, there is a mutual compensation and significant negative correlation between first-year ice and multiyear ice. The melt duration of the first-year ice is more consistent with that of the multiyear ice. In other words, the more the melt duration, the less multiyear ice area.
4. Conclusion
In this paper, the variability of Arctic sea ice from 1979 to 2016 were analyzed according to five parameters: the total SIA, the extent of first-year ice, the multiyear ice area, and the sea ice concentration in different ranges, and reached the following specific conclusions:
- (1)
- The total SIA decreased by an average of 0.0453 × 10⁶ km2·year−1 during the 38-year period studied and decreased by 0.0344 × 10⁶ km2·year−1 from 1979 to 1996 and 0.0471 × 10⁶ km2·year−1 from 1997 to 2016. Additionally, 2016 was the year with the lowest SIA in the past 38 years. The average SIA of the former half period was about 8.94% more than the following half period. The variance of the SIA from 1997 to 2016 is 0.134, and that from 1979 to 1996 is 0.061. Therefore, the volatility of SIA increased significantly in recent years.
- (2)
- The first-year ice extent increased at a rate of 0.0199 × 10⁶ km2·year−1. A comparison of the results of two consecutive decade periods (1979–1996 and 1997–2016) revealed that the averages of the extent are not significantly different, but the variances, which are 0.192 and 0.318, respectively, are relatively large.
- (3)
- The area of multiyear ice cover was shown to be declining at a rate of 0.0711 × 10⁶ km2·year−1, from 1979 to 2016. The average multiyear ice area in 1997–2016 was about 30.9% lower than that in 1979–1996. Therefore, the multiyear ice has been significantly decreased in recent years.
- (4)
- The area of the concentration between 0.9–1 is about 31.91% in the 38-year period studied. About 39.57% in the 1979–1996 period, but only 27.75% in the 1997–2016 period. The SIA within the range of 0.4–0.9 showed a significant increase over the previous half period, an increment of about 8.53%. The area with a concentration of less than 0.4 showed almost no change in the 38-year period. Therefore, the area of high-concentration sea ice declined significantly, the amount of low-concentration sea ice was almost practically unchanged, while in the mid-range concentration it was increased.
- (5)
- The total SIA, multiyear ice area, and high-concentration sea ice all exhibited a downward trend, and there was an obvious positive correlation between them. The first-year ice extent and melting time both showed an increasing trend, and there is an inverse relationship between first year ice extent and multiyear sea ice extent.
Author Contributions
Z.W. conceived and designed the methodology, figures, conducted the data, collection, data analysis, and wrote the paper; X.W. performed the literature search, and figures and wrote a part of the paper.
Funding
Research was supported by Open Fund of State Key Laboratory of Remote Sensing Science No. OFSLRSS201810; National Natural Science Foundation of China, no. 41606209; the Open Fund from Key Laboratory of Global Change and Marine-Atmospheric Chemistry, no. GCMAC1605; and the Key Laboratory of Ocean Circulation and Waves, Institute of Oceanology, Chinese Academy of Sciences, no. KLOCW1805.
Conflicts of Interest
The authors declare no conflict of interest.
References
- Cavalieri, D.J.; Gloersen, P.; Campbell, W. Determination of sea ice parameters with the Nimbus 7 SMMR. J. Geophys. Res. Atmos. 1984, 89, 5355–5369. [Google Scholar] [CrossRef]
- Tan, J.Q.; Zhan, Q.M.; Yin, F.Z.; Han, L. On Evolution of Technologies in Remote Sensing for Sea Ice Change Monitoring in Polar Regions. Geom. Spat. Inf. Technol. 2014, 37, 23–31. [Google Scholar]
- Wang, M.; Ke, C.; Shao, Z. Arctic sea ice volume estimation method based on CryoSat-2Satellitealtimeter data. Haiyang Xuebao 2017, 39, 135–144. [Google Scholar]
- Kang, D.; Im, J.; Lee, M.I.; Quackenbush, L.J. The MODIS ice surface temperature product as an indicator of sea ice minimum over the Arctic Ocean. Remote Sens. Environ. 2014, 152, 99–108. [Google Scholar] [CrossRef]
- Letterly, A.; Key, J.; Liu, Y.H. The influence of winter cloud on summer sea ice in the Arctic, 1983–2013. J. Geophys. Res. Atmos. 2016, 121, 2178–2187. [Google Scholar] [CrossRef]
- Lu, J.Y. Analysis of the strategic impact of environmental change in the Arctic on China. Hum. Geogr. 2014, 4, 98–103. [Google Scholar]
- Su, J.; Hao, G.H.; Ye, X.X.; Wang, W.B. The experiment and validation of sea ice concentration AMSR-E retrieval algorithm in polar region. J. Remote Sens. 2013, 17, 495–513. [Google Scholar]
- Comiso, J.C. Arctic multiyear ice classification and summer ice cover using passive microwave satellite data. J. Geophys. Res. Ocenas 1990, 95, 13411–13422. [Google Scholar] [CrossRef]
- Comiso, J.C. A rapidly declining perennial sea ice cover in the Arctic. Geophys. Res. Lett. 2002, 29, 171–174. [Google Scholar] [CrossRef]
- Ke, C.Q.; Peng, H.T.; Sun, B.; Xie, H. Spatio temporal variability of Arctic sea ice from 2002 to 2011. J. Remote Sens. 2013, 17, 452–466. [Google Scholar]
- Serreze, M.C.; Holland, M.M.; Stroeve, J. Perspectives on the Arctic’s shrinking sea-ice cover. Science 2007, 315, 1533–1536. [Google Scholar] [CrossRef]
- Parkinson, C.L.; Cavalieri, D.J. Arctic sea ice variability and trends, 1979–2006. J. Geophys. Res. 2008, 113, 1–28. [Google Scholar] [CrossRef]
- Deng, J. Northern Hemisphere Sea Ice Variability and Its Relationship with Climate Iactors; Nanjing University: Nanjing, China, 2014. [Google Scholar]
- Vazquez, M.; Nieto, R.; Drumond, A.; Gimeno, L. Extreme Sea Ice Loss over the Arctic: An Analysis is Based on Anomalous Moisture Transport. Atmosphere 2017, 8, 32. [Google Scholar] [CrossRef]
- Chen, P.; Zhao, J.P. Variation of sea ice extent in different regions of the Arctic Ocean. Acta Oceanol. Sin. 2017, 36, 9–19. [Google Scholar] [CrossRef]
- Zhao, J.P.; Barber, D.; Zhang, S.G.; Yang, Q.; Wang, X.; Xie, H. Record low sea-ice concentration in the central Arctic during summer 2010. Adv. Atmos. Sci. 2018, 35, 106–115. [Google Scholar] [CrossRef]
- Cavalieri, D.J.; Parkinson, C.L. Arctic sea ice variability and trends, 1979–2010. Cryosphere 2012, 6, 881–889. [Google Scholar] [CrossRef] [Green Version]
- Nghiem, S.V.; Chao, Y.; Neumann, G.; Li, P.; Perovich, D.K.; Street, T.; Clemente-Colón, P. Depletion of perennial sea ice in the east arctic ocean. Geophys. Res. Lett. 2006, 331. [Google Scholar] [CrossRef]
- Nghiem, S.V.; Rigor, I.G.; Perovich, D.K.; Clemente-Colón, P.; Weatherly, J.W.; Neumann, G. Rapid reduction of arctic perennial sea ice. Geophys. Res. Lett. 2007, 34, 228–262. [Google Scholar] [CrossRef]
- Comiso, J.C.; Meier, W.N.; Gersten, R. Variability and trends in the Arctic Sea ice cover: Results from different techniques. J. Geophys. Res. Oceans 2017, 122, 6883–6900. [Google Scholar] [CrossRef] [Green Version]
- Petty, A.A.; Stroeve, J.C.; Holland, P.R.; Boisvert, L.N.; Bliss, A.C.; Kimura, N.; Meier, W.N. The Arctic sea ice cover of 2016: A year of record-low highs and higher-than-expected lows. Cryosphere 2018, 12, 433–452. [Google Scholar] [CrossRef]
- Liu, X.; Chen, H.; Feng, T. Multi-scale change analysis of sea ice extent in Arctic. The International Archives of the Photogrammetry. Remote Sens. Spat. Inf. Sci. 2018, 42, 1153–1156. [Google Scholar]
- Comiso, J.C.; Parkinson, C.L.; Gersten, R.; Stock, L. Accelerated decline in the arctic sea icecover. Geophys. Res. Lett. 2008, 35, L01703. [Google Scholar] [CrossRef]
- Cavalieri, D.J.; Parkinson, C.L.; DiGirolamo, N.; Ivanoff, A. Intersensor Calibration between F13 SSMI and F17 SSMIS for Global Sea Ice Data Records. Geosci. Remote Sens. Lett. 2012, 9, 233–236. [Google Scholar] [CrossRef]
- NSIDC. DMSP SSM/I Brightness Temperatures and Sea Ice Concentration Grids for the Polar Regions on CD-ROM User’s Guide; Spec. Rep. 1; National Snow and Ice Data Center, Cooperative Institute for Research in Environmental Sciences, University of Colorado: Boulder, CO, USA, 1992. [Google Scholar]
- Parkinson, C.L.; Cavalieri, D.J.; Gloersen, P.; Zwally, H.J.; Comiso, J.C. Arctic sea ice extents, areas, and trends, 1978–1996. J. Geophys. Res. 1999, 104, 20837–20856. [Google Scholar] [CrossRef]
Figure 1.
The results of the average sea ice concentration (1979–2016).

Figure 2.
The variation of Arctic SIA from 1979–2016. (Grey solid line: 1979–2016 yearly data; blue solid line: 1979–2016 trend; green dashed line: 1979–1996 trend; red dashed line: 1997–2016 trend).
Figure 2.
The variation of Arctic SIA from 1979–2016. (Grey solid line: 1979–2016 yearly data; blue solid line: 1979–2016 trend; green dashed line: 1979–1996 trend; red dashed line: 1997–2016 trend).

Figure 3.
The variation of first year ice extent from 1979–2016. (Grey solid line: 1979–2016 yearly data; blue solid line: 1979–2016 trend; green dashed line: 1979–1996 trend; red dashed line: 1997–2016 trend).
Figure 3.
The variation of first year ice extent from 1979–2016. (Grey solid line: 1979–2016 yearly data; blue solid line: 1979–2016 trend; green dashed line: 1979–1996 trend; red dashed line: 1997–2016 trend).

Figure 4.
The results of multiyear ice in different years (1979–2016).

Figure 5.
The proportion of multiyear ice area in different time periods.

Figure 6.
Trend of multiyear ice area from 1997–2016 (grey solid line: 1979–2016 yearly data; blue solid line: 1979–2016 trend; green dashed line: 1979–1996 trend; red dashed line: 1997–2016 trend).
Figure 6.
Trend of multiyear ice area from 1997–2016 (grey solid line: 1979–2016 yearly data; blue solid line: 1979–2016 trend; green dashed line: 1979–1996 trend; red dashed line: 1997–2016 trend).

Figure 7.
Comparisons of total sea ice area, first-year ice extent and multi-year ice area.

Figure 8.
Sea ice area in different ranges concentration.


Table 1.
Passive microwave sensor platform and the start and stop using time of data.
| Sensor | Platform | Start Time | Stop Time |
|---|---|---|---|
| SMMR | Nimbus-7 | 6 October 1978 | 20 August 1987 |
| SSM/Is | DMSP-F08 | 21 August 1987 | 18 December 1991 |
| DMSP-F11 | 19 December 1991 | 29 September 1995 | |
| DMSP-F13 | 30 September 1995 | 31 December 2007 | |
| SSMIS | DMSP-F17 | 1 January 2008 | 31 March 2016 |
| DMSP-F18 | 1 April 2016 | Present |
Table 2.
The statistical results of multiyear ice area and proportion.
| Multiyear Ice Area Time Periods | 1979–1983 | 1984–1988 | 1989–1993 | 1994–1998 | 1999–2003 | 2004–2008 | 2009–2015 | 2016 |
|---|---|---|---|---|---|---|---|---|
| Area (106 km2) | 7.87 | 6.568 | 5.889 | 5.277 | 4.631 | 4.059 | 3.479 | 1.676 |
| Proportion | 100% | 83.45% | 74.83% | 67.05% | 58.84% | 51.57% | 44.21% | 21.29% |
© 2018 by the authors. Licensee MDPI, Basel, Switzerland. This article is an open access article distributed under the terms and conditions of the Creative Commons Attribution (CC BY) license (http://creativecommons.org/licenses/by/4.0/).
Share and Cite
MDPI and ACS Style
Wu, Z.; Wang, X. Variability of Arctic Sea Ice (1979–2016). Water 2019, 11, 23. https://doi.org/10.3390/w11010023
AMA Style
Wu Z, Wang X. Variability of Arctic Sea Ice (1979–2016). Water. 2019; 11(1):23. https://doi.org/10.3390/w11010023
Chicago/Turabian StyleWu, Zhankai, and Xingdong Wang. 2019. "Variability of Arctic Sea Ice (1979–2016)" Water 11, no. 1: 23. https://doi.org/10.3390/w11010023
Note that from the first issue of 2016, this journal uses article numbers instead of page numbers. See further details here.