Water Footprint and Virtual Water Accounting for China Using a Multi-Regional Input-Output Model


Guangdong Key Laboratory for Urbanization and Geo-simulation, School of Geography and Planning, Sun Yat-sen University, Guangzhou 510275, China
*
Author to whom correspondence should be addressed.
Water 2019, 11(1), 34; https://doi.org/10.3390/w11010034
Submission received: 26 October 2018
/
Revised: 13 December 2018
/
Accepted: 21 December 2018
/
Published: 25 December 2018
(This article belongs to the Section Water Use and Scarcity)
Abstract
:Water footprint (WF) is a measure of the actual appropriation of water resources. WF accounting can provide a scientific basis for the managements of water resources. In this study, a multi-regional input-output model is employed to measure the quantity of blue WF (WF) and inter-provincial virtual water (VW) flows in China for the years of 2007 and 2010. The results show that: (1) China’s total WF increased from 205.42 billion m3 in 2007 to 229.34 billion m3 in 2010. Approximately 42% of the WF was attributed to VW embodied in inter-provincial trade. Xinjiang is the largest province of VW export, whereas Shanghai had the largest net VW inflows. (2) From 2007 to 2010, the share of the agricultural sector in the entire VW trade declined, but was still as high as 82.78%, followed by the industrial sector. (3) The north-to-south and south-to-south patterns were witnessed in the domestic VW flows. The provincial WF variations are found to be affected by the per capital GDP, total water resources, per capita water resources, and urban population. (4) By linking VW with an integrated WAVE+ (water accounting and vulnerability evaluation) factor, it was found that virtual scarce water (VSW) was mainly exported by the provinces in northern China. At the national level, the amounts of VSW inflows were consistently greater than those of VSW outflows for both years, 2007 and 2010, implying an increased pressure on the provinces with water deprivation issues. Overall, these results can provide a basis for refining the spatiotemporal allocation of water resources and mitigating the conflict between water supply and demand in China.
1. Introduction
According to the World Water Development Report 2018 [1], due to economic developments, population growth, and changes in consumption patterns, global demand for water is rising at an annual rate of 1%, and the population suffering from water shortages is expected to reach nearly six billion by 2050. China will face severe water shortages as its per capita water resources is only one quarter of the world’s average level, and will be aggravated due to climate change, environmental pollution, and ecosystem damage [2]. Therefore, the scarce water resources require proper management to maintain the sustainability of human societies.
Reallocation of physical water, such as the South-to-North Water Diversion project, is costly and may have negative impacts on ecosystems [3]. The concepts of virtual water (VW) and water footprint (WF) provide a new approach to solve the water scarcity issues. VW refers to the total amount of freshwater required to produce a certain kind of product along their supply chains [4]. This concept illustrates that regions with insufficient water resources can fulfill the consumption of water-intensive products by importing them rather than producing them locally so as to conserve local water resources. In this manner, fresh water embodied in the products is transferred from one region to another through inter-regional trade, which is termed VW flows [5]. With the increasingly close inter-regional trade, the significance of studying the rule of VW flow to optimize the spatial and temporal allocation of water resources becomes prominent. Dalin et al. [6] found that the number of trade connections and the volume of VW trade more than doubled in the past two decades. Feng et al. [7] demonstrated that VW flows between regions redistributes water resources from water-rich areas to water-poor areas, and effectively reduced water stress within the Yellow River Basin.
The concept of WF is closely related to VW. WF is a consumption-based indicator that refers to the total amount of VW content consumed by a region [8,9]. WF can be classified into three types, namely, blue WF (the amount of surface and underground water resources consumed in the product supply chain), green WF (water that is stored in the unsaturated soil and consumed by vegetation evapotranspiration), and gray WF (polluted water during production) [5]. The green WF is only related to the agricultural sector. The grey WF, however, is difficult to calculate due to the complexity of contents and concentration of sewage and the lack of a unified quantitative method [10]. In this study, we focus on blue WF (BWF), mainly because the incorporation of green WF may cause content inconsistency between the agricultural sector and other sectors [11], and grey WF as an environmental indicator does not reflect the consumptive use of water [12].
For a country/region, a variety of goods or services consumed within its territory are not only produced by using local water resources, but also by using water resources in other regions. Therefore, the WF of a country (region) is composed of two parts: Internal WF and external WF, with the former referring to the actual local and the latter non-local water resources used in practice [13]. Distinguishing the internal WF from the external WF is helpful to reveal the source and destination of the VW flows and to explore the interdependence of water resources among regions [14]. For instance, Zoumides et al. [15] assessed the WF of crop production in Cyprus and found that this semi-arid nation largely relied on external water resources, which may increase the risk of food security. Steen-Olsen et al. [16] analyzed the water displacement relationships among European Union countries, in which Spain and France are two primary exporters of embodied water.
The input-output model (IO) is an important method for the assessment of WF. Single-region input-output model (SRIO) uses input-output data of a single region to calculate the WF based on the estimated regional total water use coefficient [17]. The extended form of SRIO, i.e., multi-regional input-output (MRIO) model, can describe the input-output relationships between different sectors among different regions, and hence is capable of tracing the resource and environmental impacts of consumption activities in one region to a specific production sector in another region via the inter-regional supply chain within the system [18,19]. Additionally, MRIO can distinguish the internal and external WF so that one can explore the VW flow relationships between regions [20]. MRIO has been widely used in the studies on inter-regional water flows [21], PM2.5 emissions [22], and carbon emission transfers [23].
In recent years, many studies have explored the WF and VW flows across different scales, e.g., from nations [24,25], river basins [26], provinces [27], and to cities [11]. Tian et al. [28] examined the temporal changes of China’s WF and their results suggest that China was a net exporter of VW during 1995–2009. Wang et al. [29] found that China’s total WF decreased from 495.5 billion m3 in 1997 to 447.6 billion m3 in 2007. Zhang et al. [30] compared the direct water consumption coefficient and the net VW outflows between different sectors of 30 provinces in China from 2002 to 2007, and explored the spatial and sectoral characteristics of China’s VW flows. The ongoing rapid development of China’s economy puts more pressure on China’s water demand [31]. China’s GDP growth rate decreased from 14.2% in 2007 to 10.63% in 2010, while the development level varies greatly among regions [32]. In this context, how do China’s WF and inter-regional VW flow relationships change? What are their driving forces? This study aims to answer these questions by examining the magnitudes and structures of inter-regional VW trade and provincial WF based on an MRIO analysis for the years, 2007 and 2010. Moreover, the assessed VW was combined with an integrated factor of WAVE+ (water accounting and vulnerability evaluation) [33], thereby providing a basis for better management of water resources.
2. Materials and Methods
2.1. MRIO Model
Assuming that a system contains, m, regions (, , ,…, ) and each region has n sectors (, , ,…, ), this system can be represented using a MRIO model with m × n linear equations:
where is the total output of sector i in region R, and are the intermediate input from sector i in region R to sector j in region S and the final demand of sector i in region R for region S, respectively. A direct consumption coefficient, , is introduced to represent the quantity of input of sector i in region R required to increase one monetary unit of output of sector j in region S. The value of is the ratio of the intermediate input of a specific sector in a specific region to total output:
Thus, Equation (1) can be transformed to:
For a multi-regional system, Equation (3) can be expressed as follows:
where , and are the output matrix, the direct consumption coefficient matrix, and the final demand matrix, respectively. Equation (4) can be transformed to:
where is the inverse Leontief matrix and its element, , is the output of sector i in region R required to satisfy one monetary unit of final consumption of sector j in region S. By applying Equation (5), one can calculate how a change in the final demand affects the output of a sector. This equation can be further applied to analyze water consumption among regions and sectors. A direct water use coefficient matrix, , is introduced, with its element, , representing the amount of water consumed to produce one unit of product of sector i in region R:
where is the amount of water consumed by sector i in region R for production. A total water consumption coefficient matrix, , is further defined with the element, , that represents the total amount of water consumed by sector i in region R to satisfy one monetary unit of final consumption of sector j in region S on the whole production chain. The matrix, , can be obtained through the following equation:
The WF of different sectors in different regions, represented by an F* matrix, can then be determined by multiplying the total water consumption coefficient matrix by the final demand matrix:
In addition, the scarcity of water resources can be further incorporated into the MRIO analysis. This can be accomplished by multiplying F* by a column vector V*, which is composed of the values of an integrated WAVE+ factor for each province:
where is the footprint of virtual scarce water (VSW). More information of the integrated WAVE+ factor is provided in Section 2.2.
2.2. Data Sources
The main data used in this study were the 2007 [34] and 2010 [35] multi-regional IO tables for provincial units of China (including 30 provinces, municipalities, or autonomous regions and excluding Xizang, Taiwan, Hong Kong, and Macao), which cover six economic sectors (agriculture, industries, construction, transportation and warehousing, wholesale and retail, and other service industries). Both the gross domestic product (GDP) and population data originated from the China Statistical Yearbook [32] of each corresponding year.
The amounts of provincial water consumption of the agricultural and industrial sectors were mainly collected from the water resource bulletins. For some provinces with missing data, the water consumption data of the agricultural and industrial sectors were estimated by multiplying the provincial quantities of water withdrawal (obtained from the National Bureau of Statistics of China [36]) by the national average of water consumption rates of these two sectors (derived from the water resource bulletins [37]). The amounts of provincial water consumption of the construction sector were estimated by multiplying the amounts of water withdrawal (obtained from the Bulletin of First National Census for Water [38]) by a water consumption rate of 0.8, which was based on the estimation of Zhang et al. [25]. For the other three sectors, namely transportation and warehousing, wholesale and retail, and other service, their amounts of water withdrawal were included in the total amount of water withdrawal of the tertiary industries in the National Bureau of Statistics of China. Based on these data, the provincial water consumption of the tertiary industries was then estimated by multiplying the provincial water withdrawal by the national average of the water consumption rate of the tertiary industries. Afterward, the respective amounts of provincial water consumption for the sectors of transportation and warehousing, wholesale and retail, and other service were assumed to be proportional to their shares of monetary outputs in the tertiary industries. That is, the provincial water consumption for these three sectors were estimated by multiplying the provincial water consumption of the tertiary industries by the respective shares of monetary outputs for these three sectors.
The integrated WAVE+ factor data were collected from the website [39], which was developed by Berger et al. [33]. This data was an enhanced version generated using an updated WAVE model with finer spatial and temporal resolution. The data applied in this study was the annual average data at the basin level. The basin level WAVE+ factor values range from 0 to 6, with a larger value indicating a more vulnerable situation. The basin level WAVE+ factor values were aggregated into the provincial level by averaging the values weighted by the basin areas.
3. Results
3.1. China’s WF and Its Composition
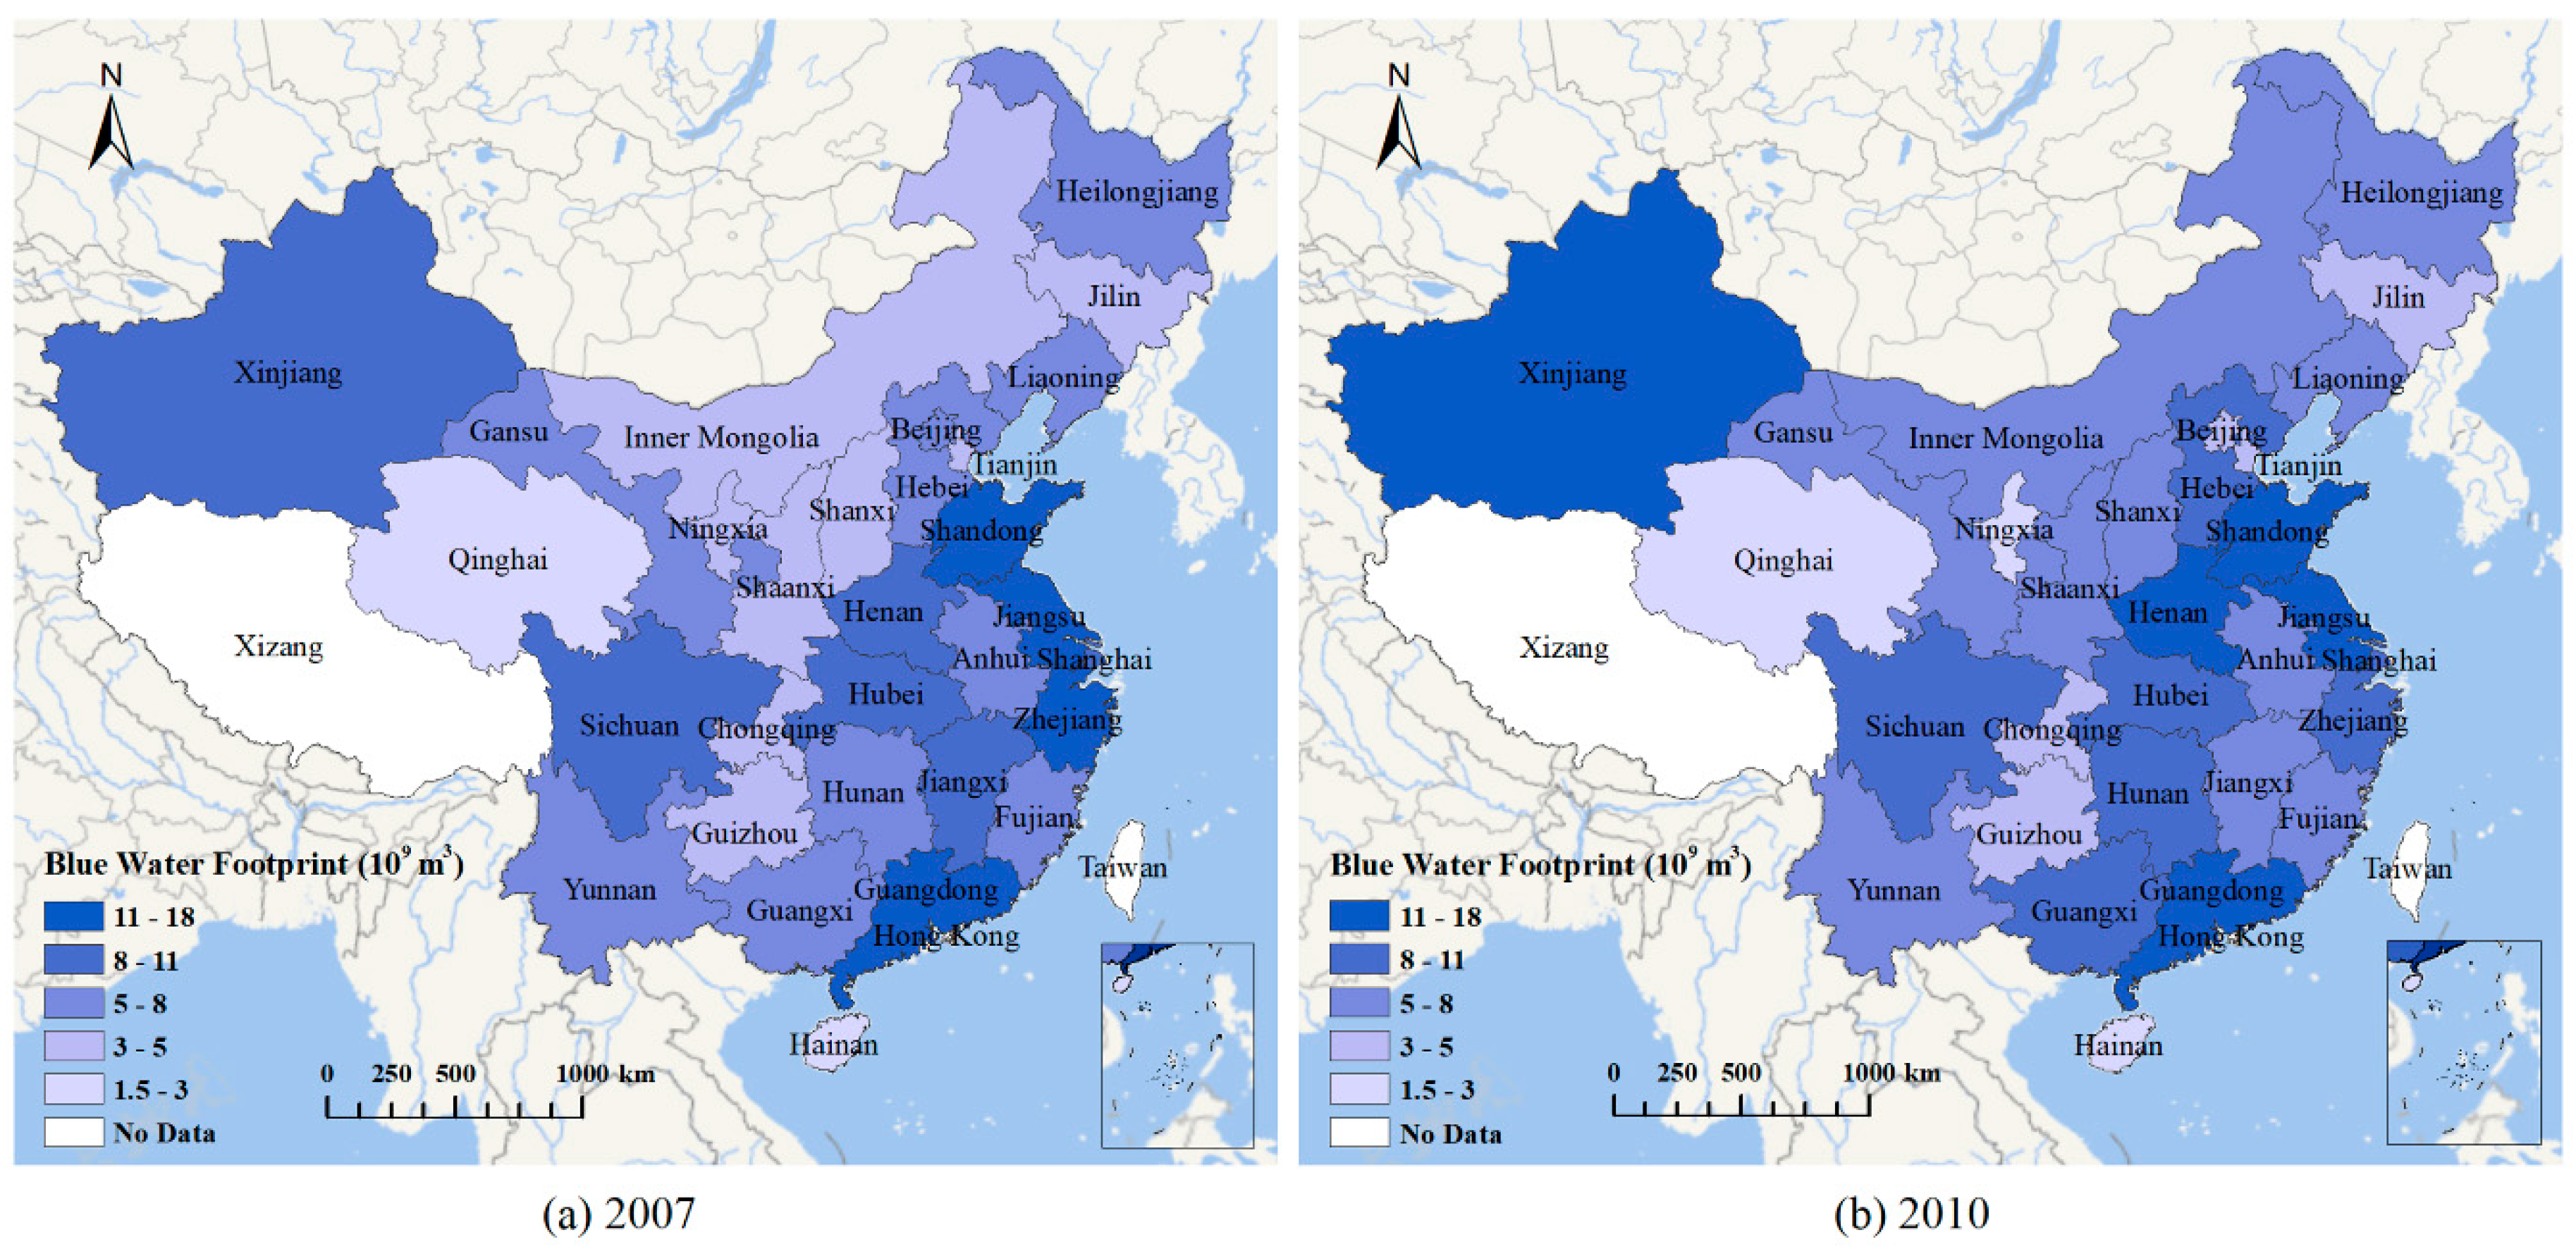
China had a total WF of 205.42 billion m3 in 2007 and 229.34 billion m3 in 2010. Coastal provinces in the east had relatively large WF compared to the inland provinces in the west (Figure 1). In 2007, Guangdong (14.92 billion m3), Shandong (13.57 billion m3), Jiangsu (12.60 billion m3), and Zhejiang (11.14 billion m3) featured the largest amounts of WF, while Hainan (1.70 billion m3) and Qinghai (1.84 billion m3) had the smallest WF. In 2010, in addition to Guangdong (14.42 billion m3), Shandong (12.23 billion m3), and Jiangsu (17. 53 billion m3), another two important provinces in terms of WF emerged, namely Xinjiang (14.57 billion m3) and Henan (11.37 billion m3). Hainan (1.63 billion m3), Qinghai (2.40 billion m3), and Ningxia (2.28 billion m3) were among those with small WF.
By comparing the results for the years, 2007 and 2010, we found that eight provinces (i.e., Jiangxi, Shandong, Zhejiang, Shanghai, Beijing, Ningxia, Guangdong, and Hainan) had a decreased WF. The largest decrease was witnessed in Jiangxi, which was 1.72 billion m3 or 21.00% of the WF in 2007. The WF of Xinjiang, Jiangsu, and Inner Mongolia increased by 5.13 billion m3 (54.43%), 4.92 billion m3 (39.07%), and 3.83 billion m3 (115.05%), respectively.
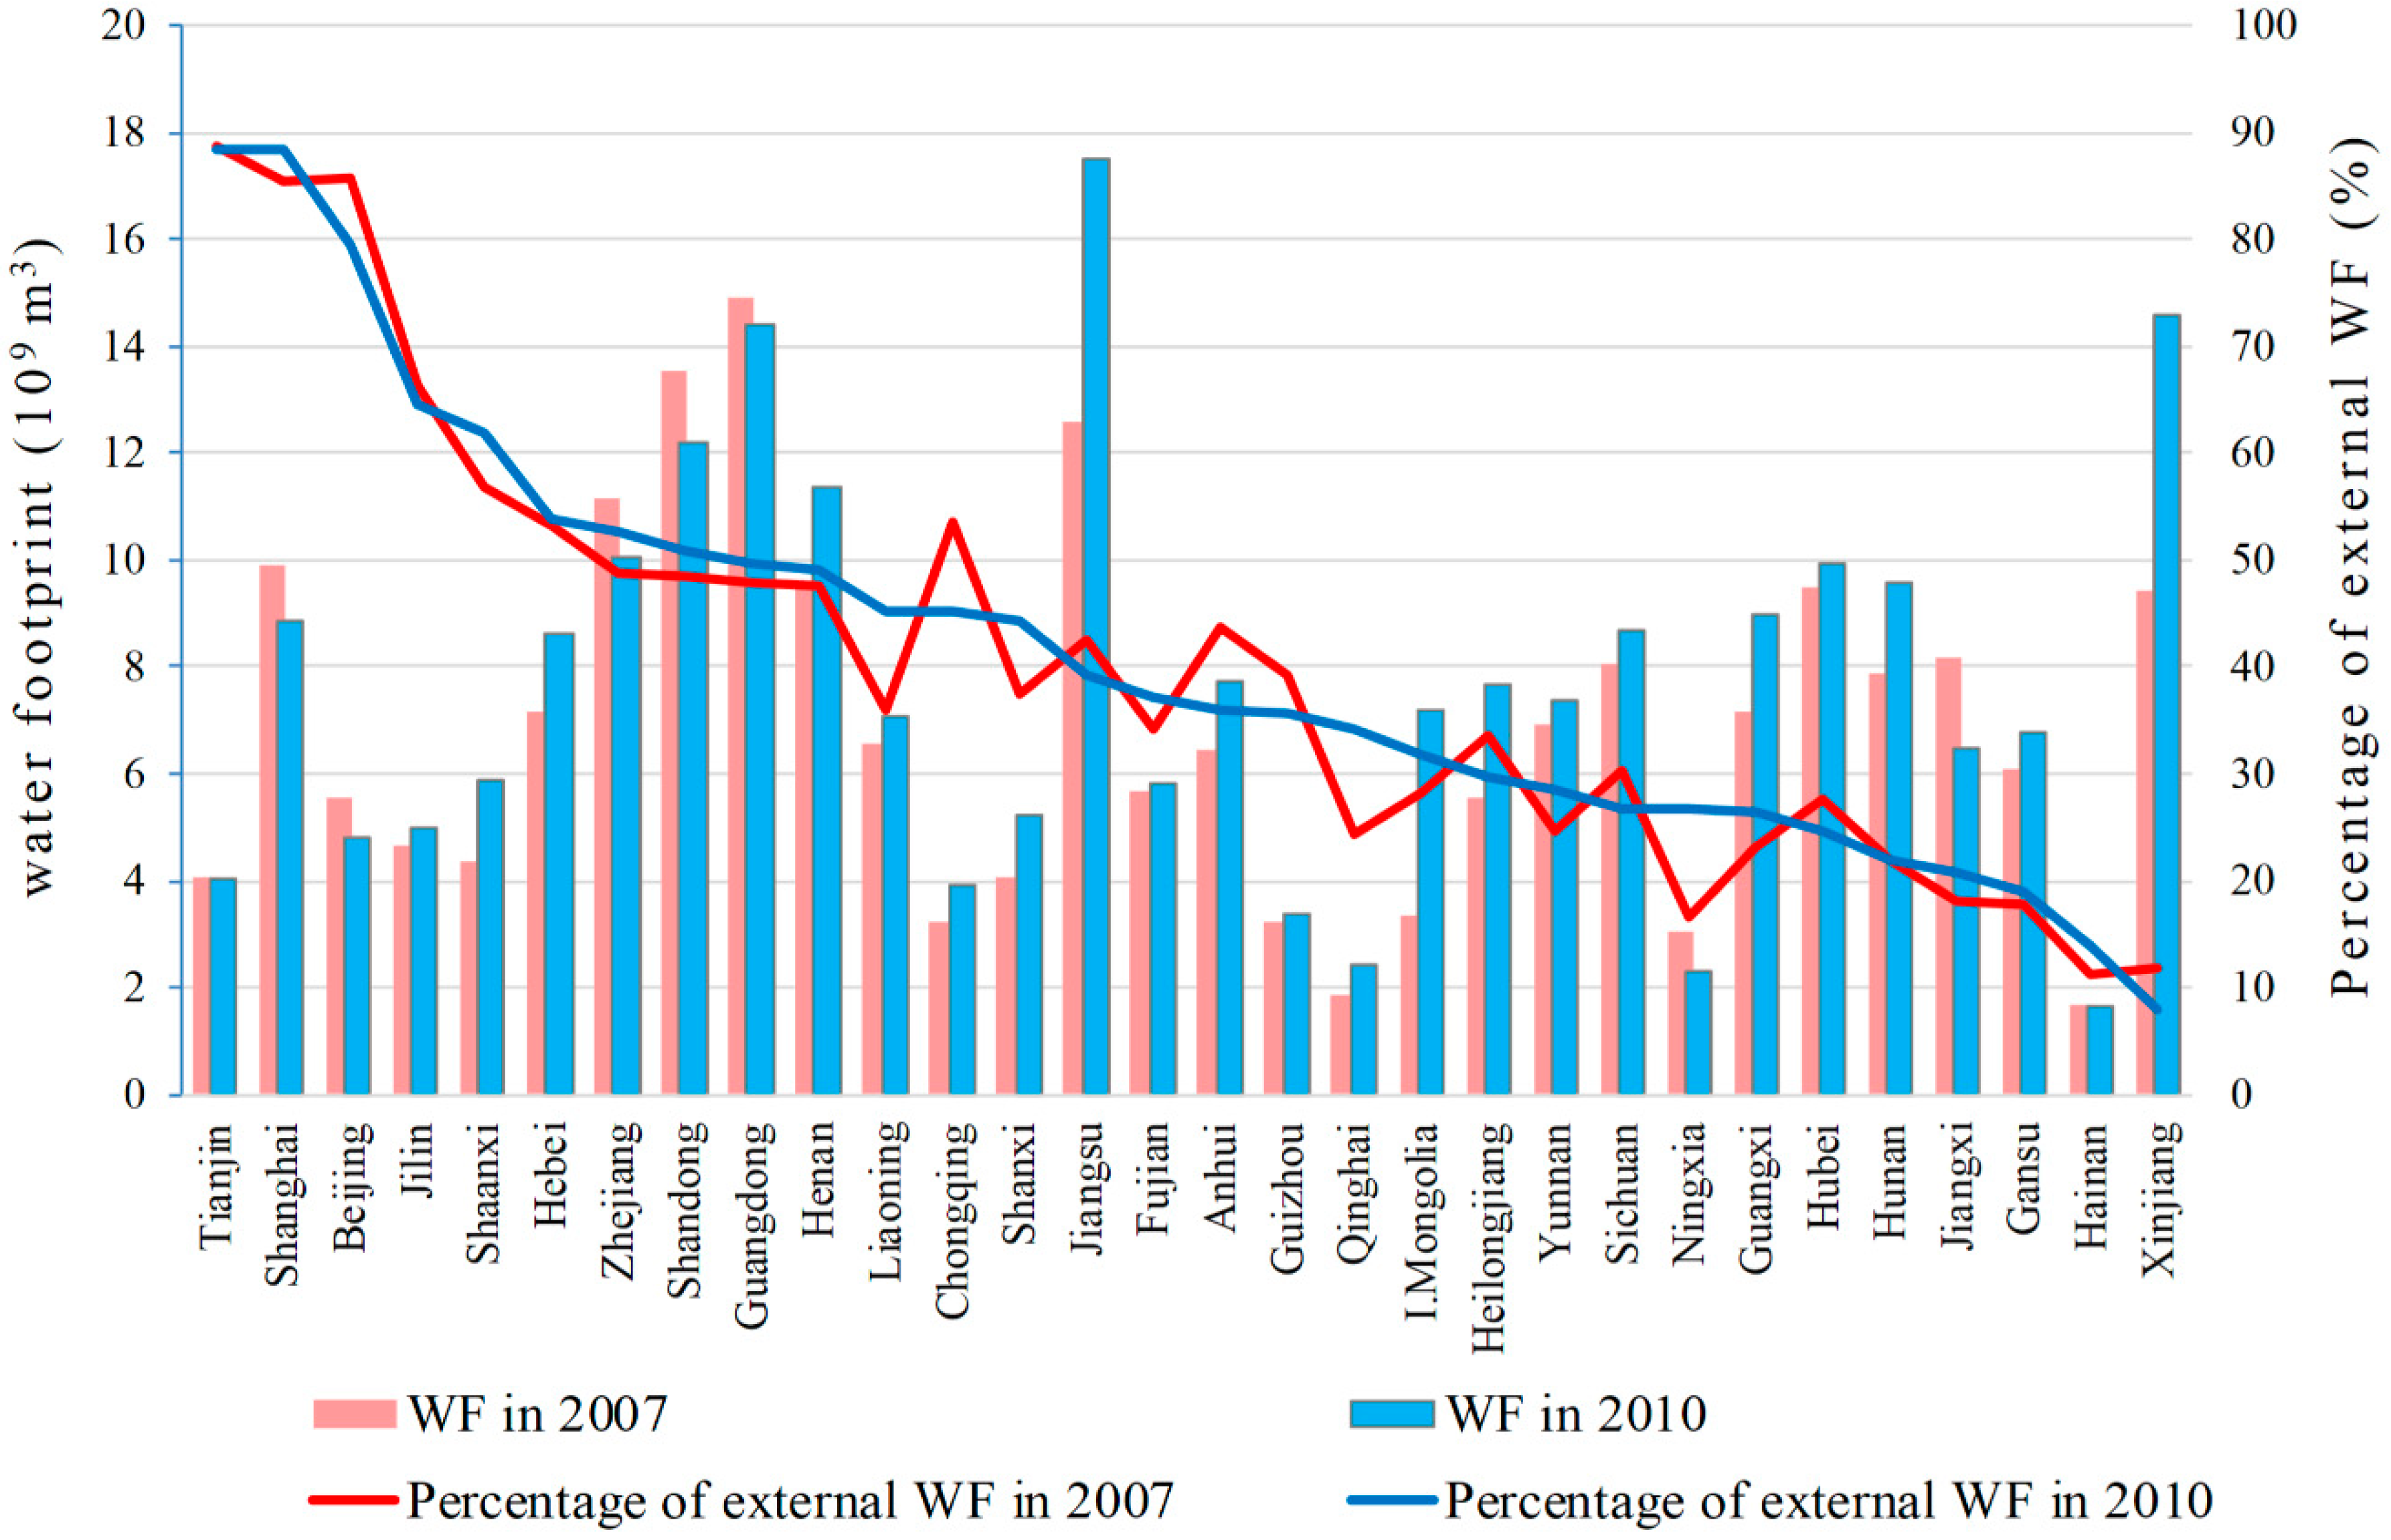
The results revealed that, on average, the proportions of external WF for the years, 2007 and 2010, were 40.20% and 41.11%, respectively (Figure 2). In 2010, Tianjin, Shanghai, and Beijing featured the largest proportions of external WF, which were 88.54%, 88.43%, and 79.44%, respectively, indicating that these regions relied heavily on VW imports. In addition, more than 50% of the total WF of Jilin, Shaanxi, Hebei, Zhejiang, and Shandong originated from external sources. The fractions of the external WF were the smallest for provinces, such as Xinjiang (7.83%), Hainan (13.98%), Gansu (19.06%), Jiangxi (20.63%), and Hunan (21.86%). These provinces mainly consumed water resources within their territories.
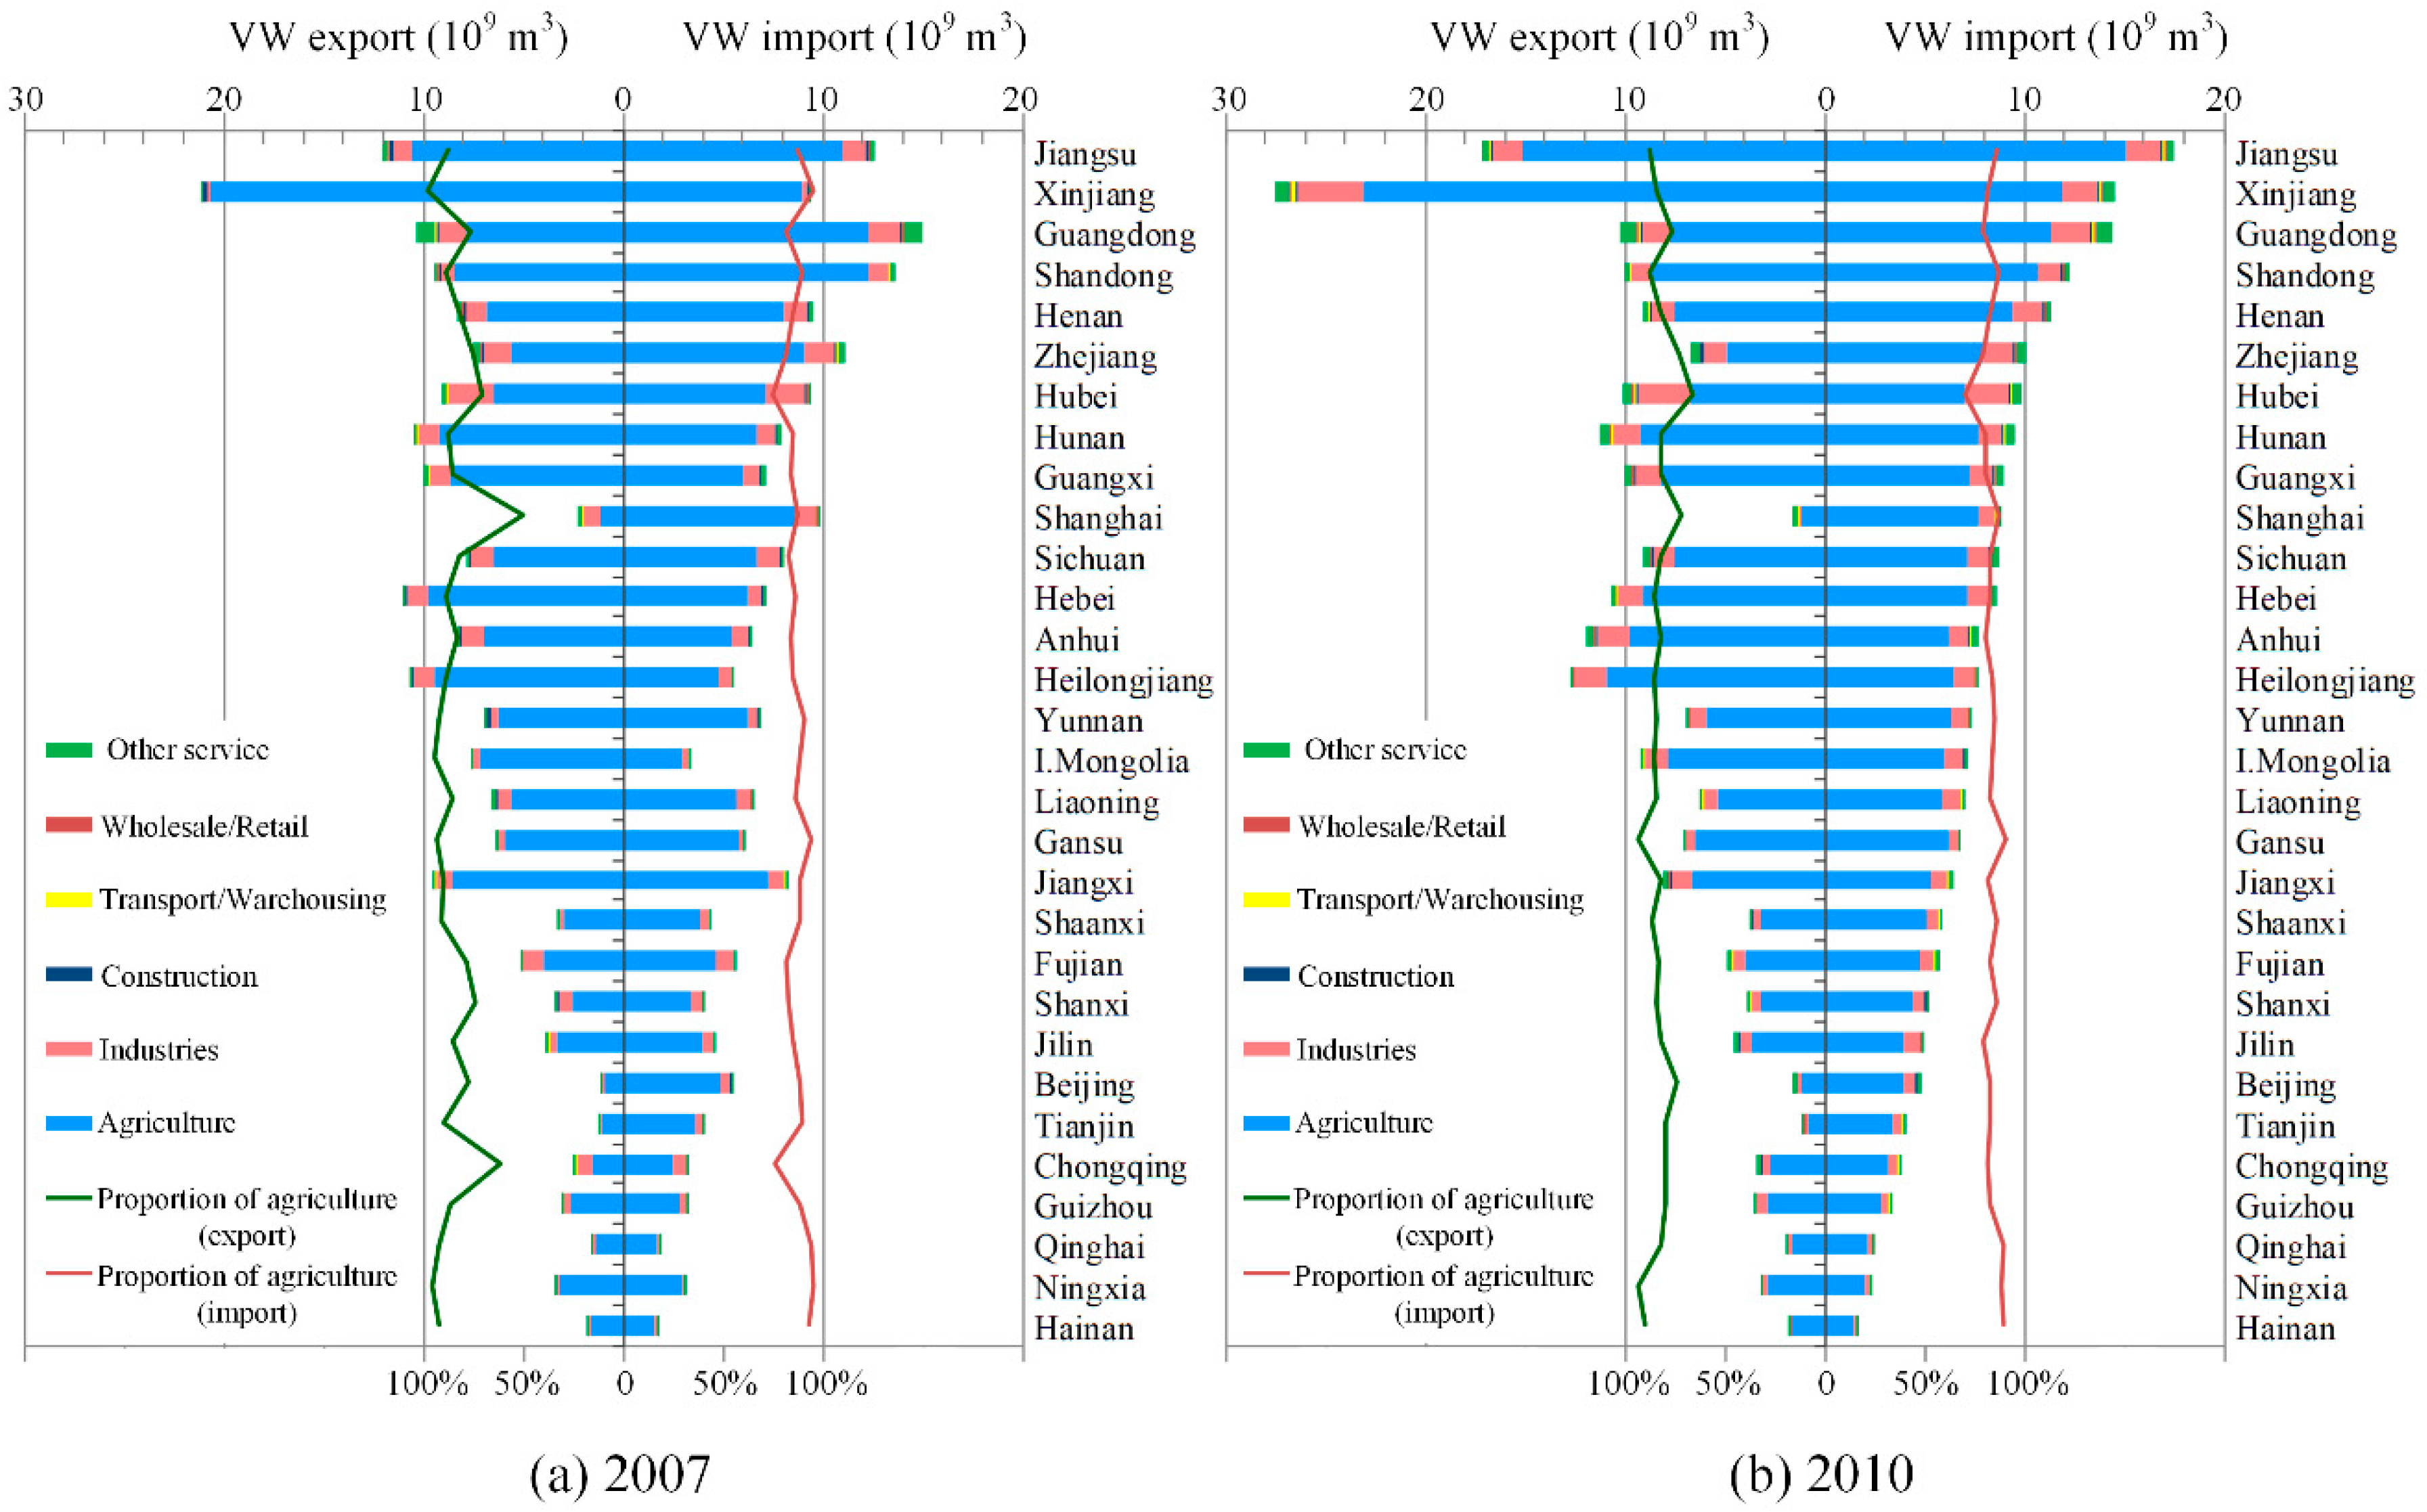
Averaged nationally (Figure 3), a dominant share of VW was related to the agricultural sector. The amounts of agricultural VW increased from 176.70 billion m3 (86.02% of total VW) in 2007 to 189.85 billion m3 (82.78% of total VW) in 2010. The second largest sector of VW was the industrial sector, which contributed 10.41% in 2007 and 12.13% in 2010 to the total amounts of VW, respectively.
Table 1 and Table 2 demonstrate the sectoral composition of VW outflows and inflows, respectively, for the representative provinces in years, 2007 and 2010. These provinces have similar sector compositions of VW. Most provinces have higher proportions of agricultural VW outflows and inflows compared to the national average. For Xinjiang and Inner Mongolia, their shares of agricultural VW in 2007 were as high as 98.02% and 94.35%, respectively. Some marginal changes were found in the provincial average proportions of agricultural VW outflows/inflows, i.e., from 84.24% in 2007 to 82.29% in 2010 for agricultural VW outflows and from 86.60% in 2007 to 83.34% in 2010 for agricultural VW inflows, respectively. The sectoral proportions of industrial VW inflows, on provincial average, slightly increased from 10.11% in 2007 to 11.77% in 2010. Overall, the sectoral compositions of VW outflows and inflows were relatively consistent for the years, 2007 and 2010.
3.2. Inter-Regional VW Transfer
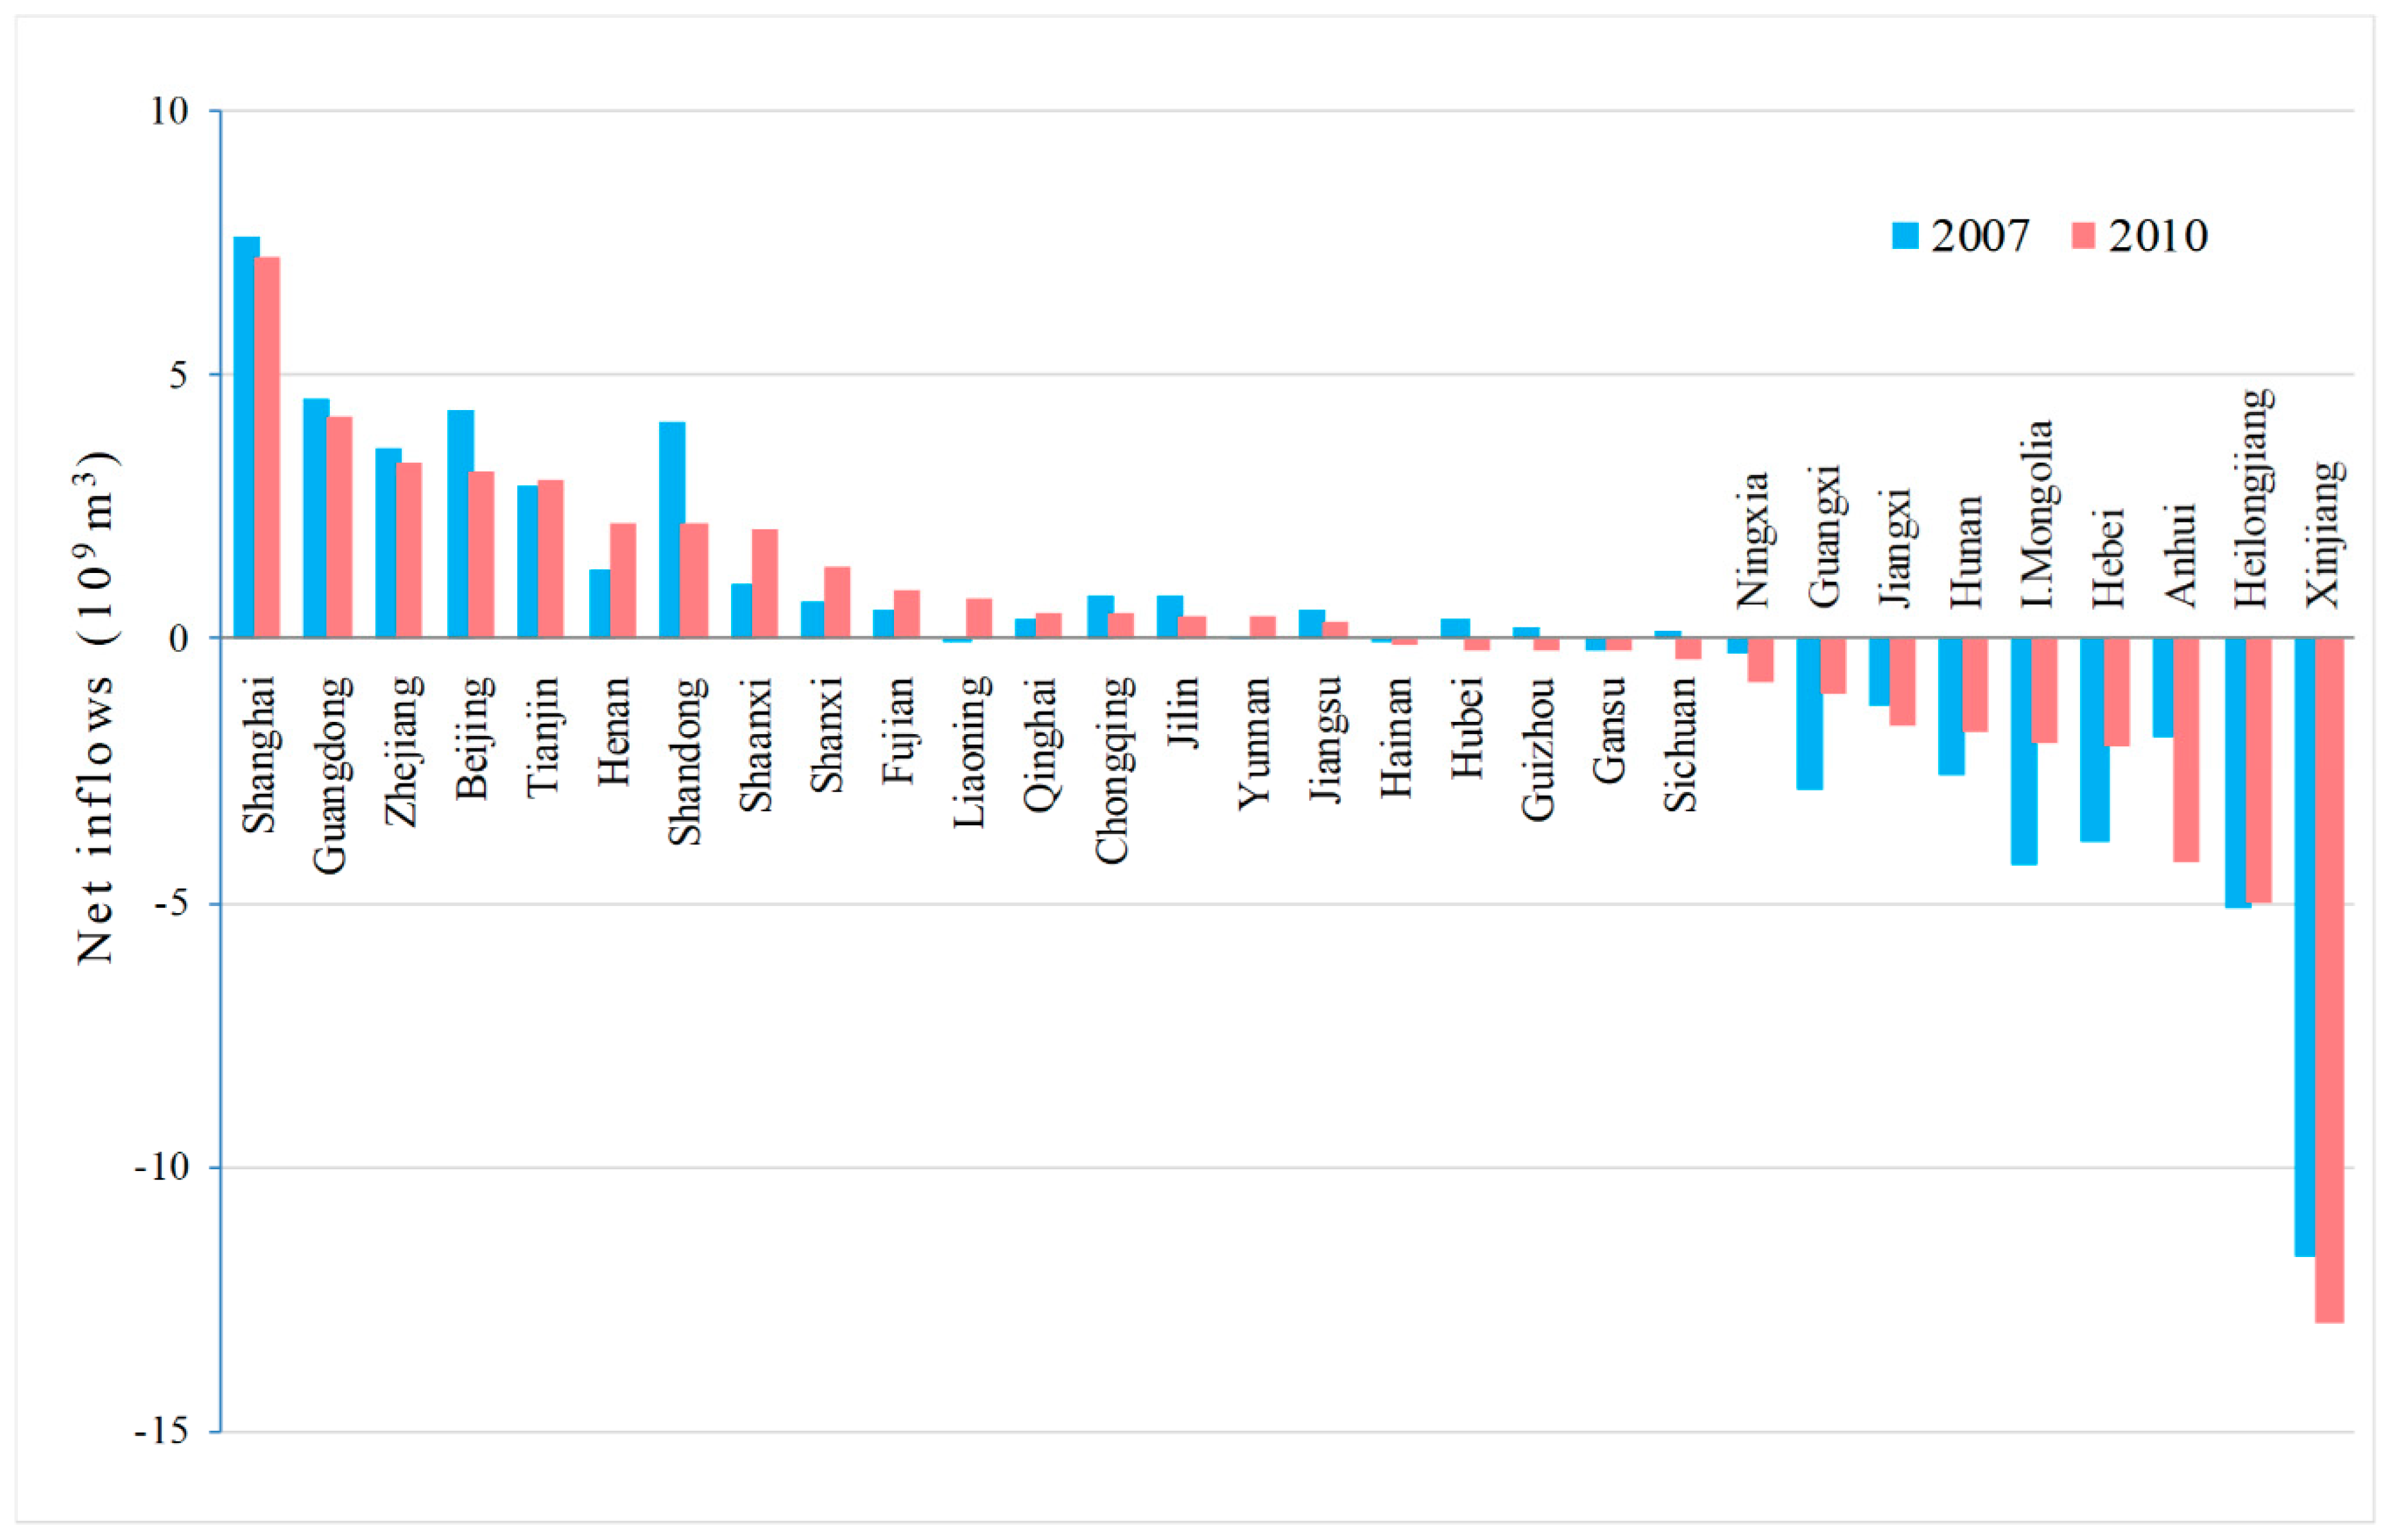
As shown in Figure 4, in 2010, Shanghai (7.25 billion m3), Guangdong (4.22 billion m3), Zhejiang (3.32 billion m3), Beijing (3.20 billion m3), and Tianjin (3.02 billion m3) had the largest net inflows, mainly due to their developed economies and extremely large populations that demand a large amount of water resources and related products. Xinjiang (12.96 billion m3), Heilongjiang (5.01 billion m3), Anhui (4.23 billion m3), Hebei (2.02 billion m3), and Inner Mongolia (2.00 billion m3) had the largest net VW outflows in 2010. These inland provinces are less developed regions in China and become the major exporters of VW. Jiangsu, Hainan, Hubei, Guizhou, and Gansu had relatively small amounts of net VW inflows and outflows and maintained a balance between the import and the export of VW in inter-provincial trade.
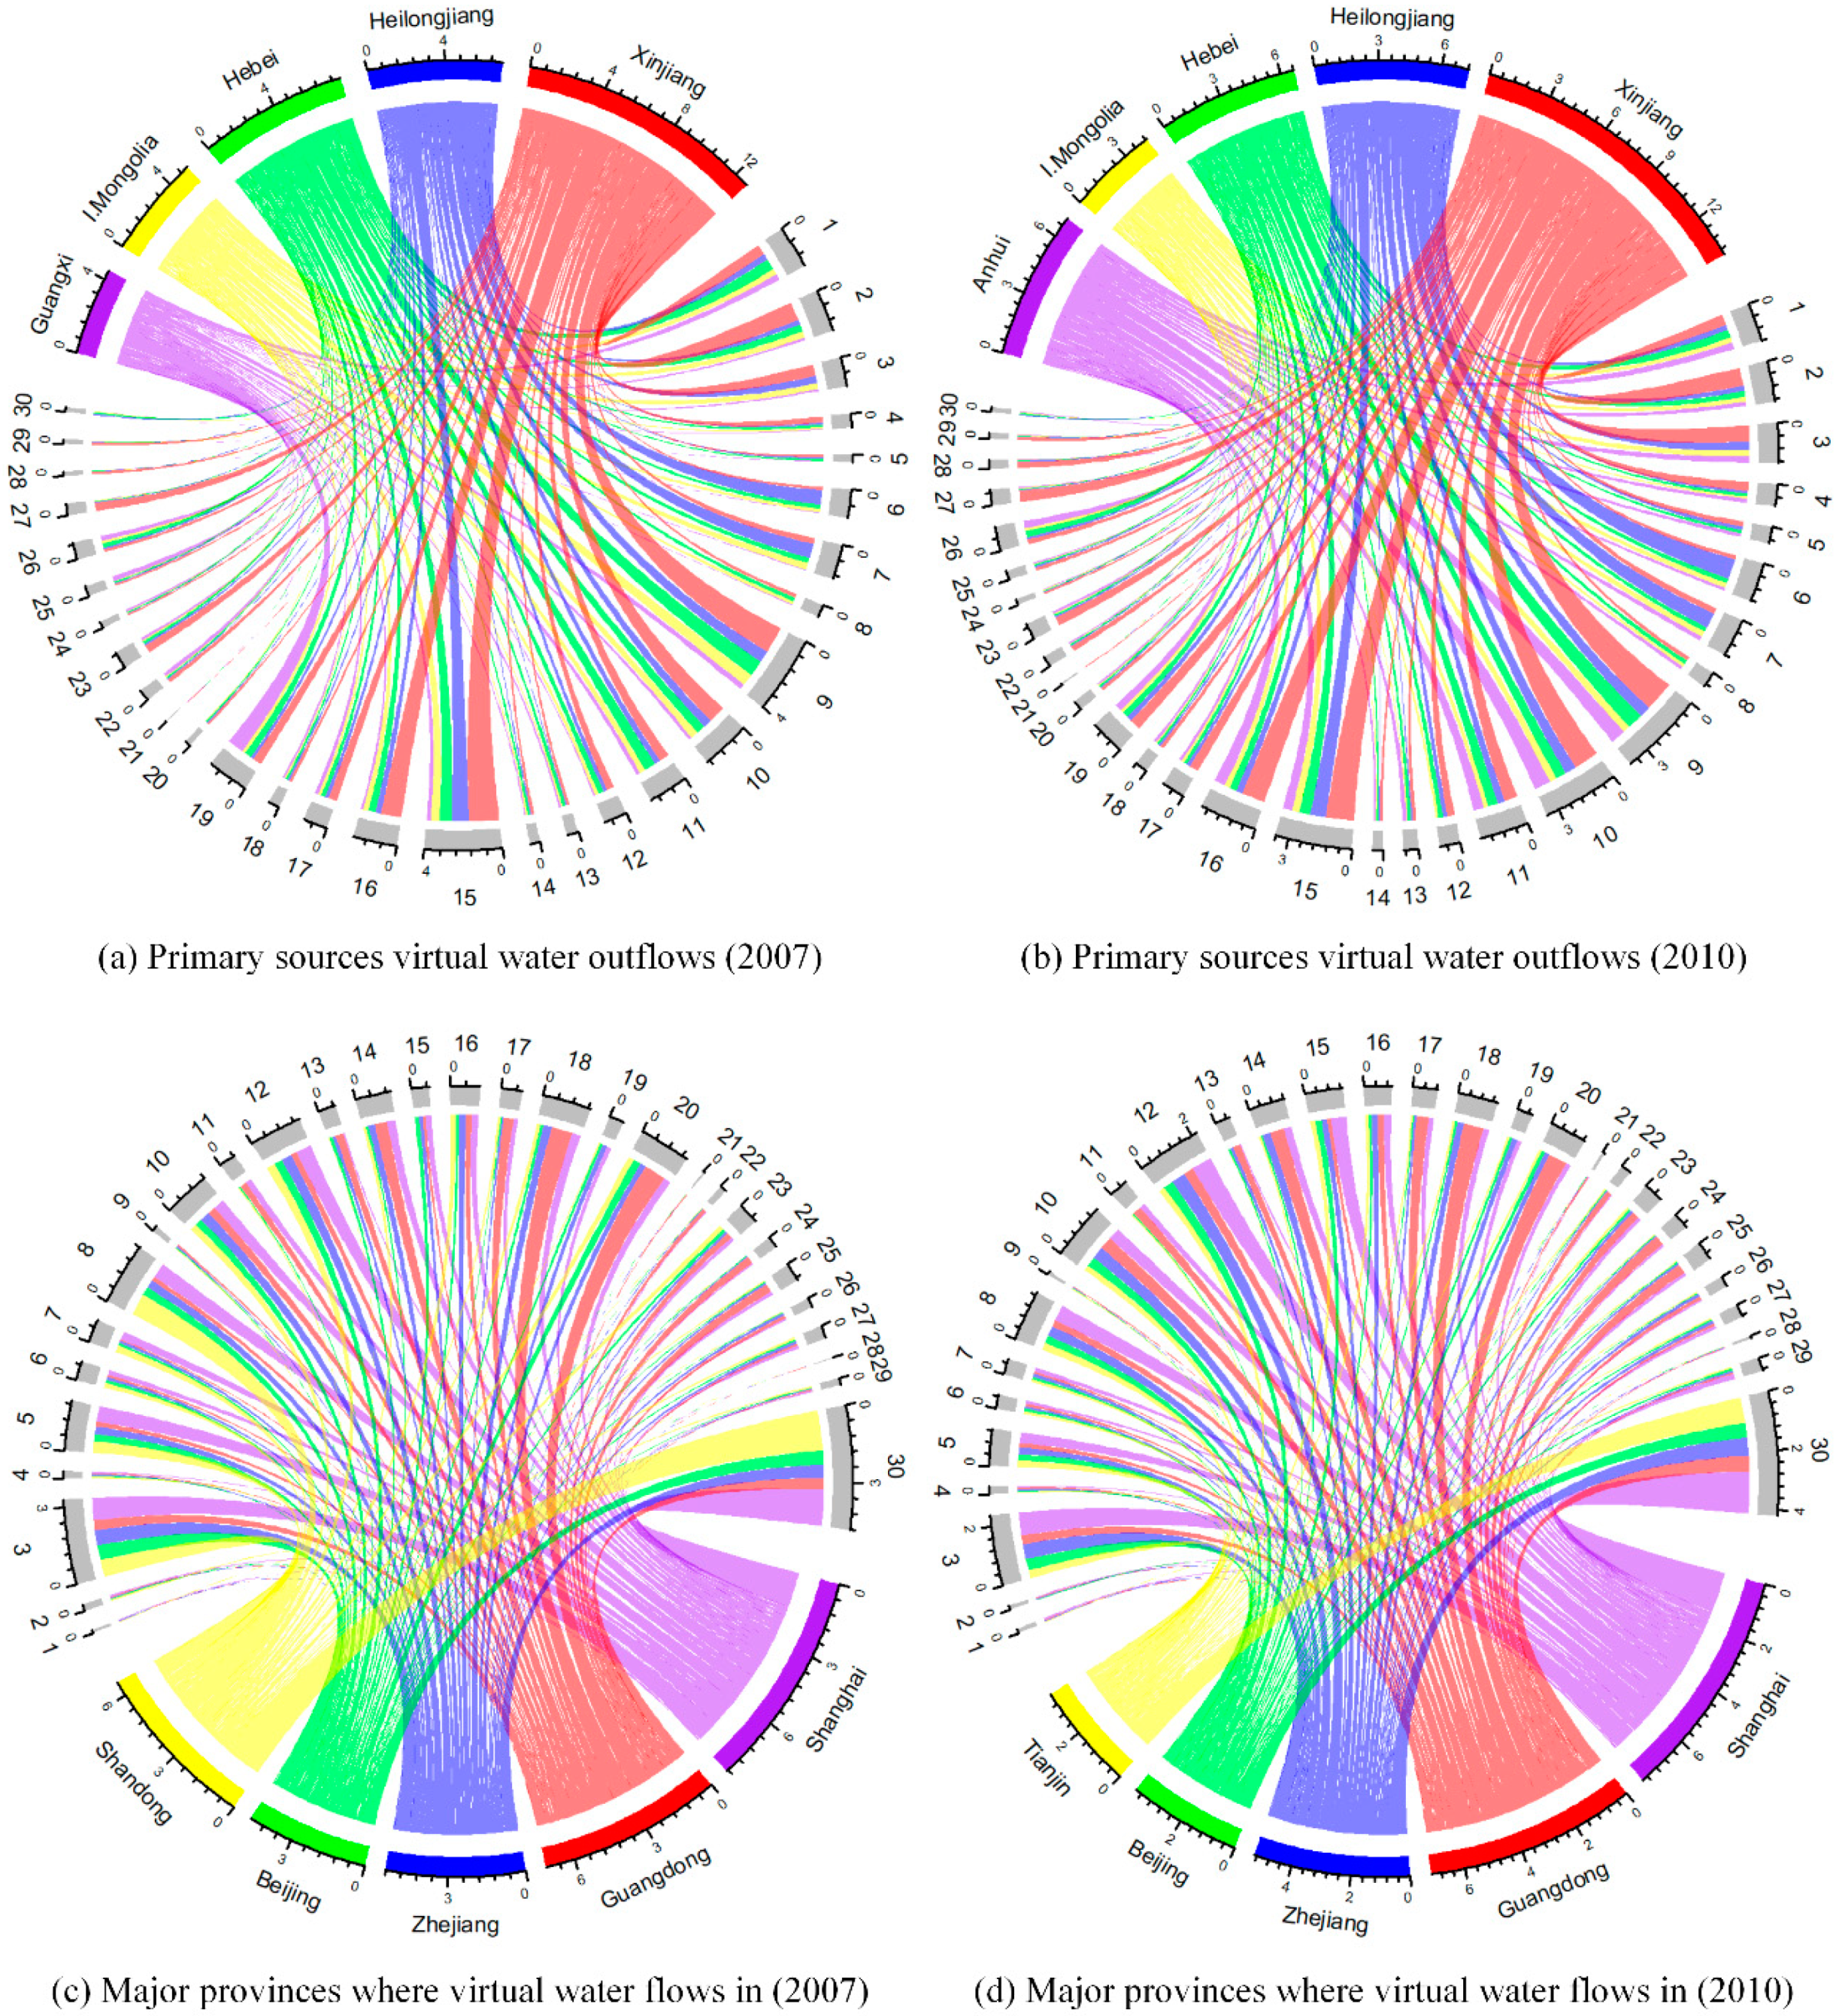
Figure 5 shows the VW flows in the five representative provinces of China with the largest amounts of net inflows/outflows for the years, 2007 and 2010 (for each circle, the upper section shows the provinces from which VW flows out while the lower section shows the provinces that receive VW flows; the thickness of strips represents the magnitude of VW flows). In 2007, the VW exported by Guangxi exclusively flowed to its neighboring province, namely Guangdong (0.91 billion m3). Anhui surpassed Guangxi and became one of the five provinces with the largest net VW outflows in 2010, with the other four provinces of Hebei, Inner Mongolia, Heilongjiang, and Xinjiang. Anhui exported large amounts of VW mainly to Jiangsu (0.83 billion m3), Shanghai (0.75 billion m3), Henan (0.57 billion m3), Zhejiang (0.52 billion m3), and Shandong (0.47 billion m3). Xinjiang was the biggest province in terms of net VW outflows in both years, 2007 and 2010. In 2010, Xinjiang exported 1.52 billion m3, 1.43 billion m3, 1.29 billion m3, and 1.20 billion m3 of VW to Shanghai, Shandong, Jiangsu, and Henan, respectively.
3.3. Inter-Regional Virtual Scarce Water Flows
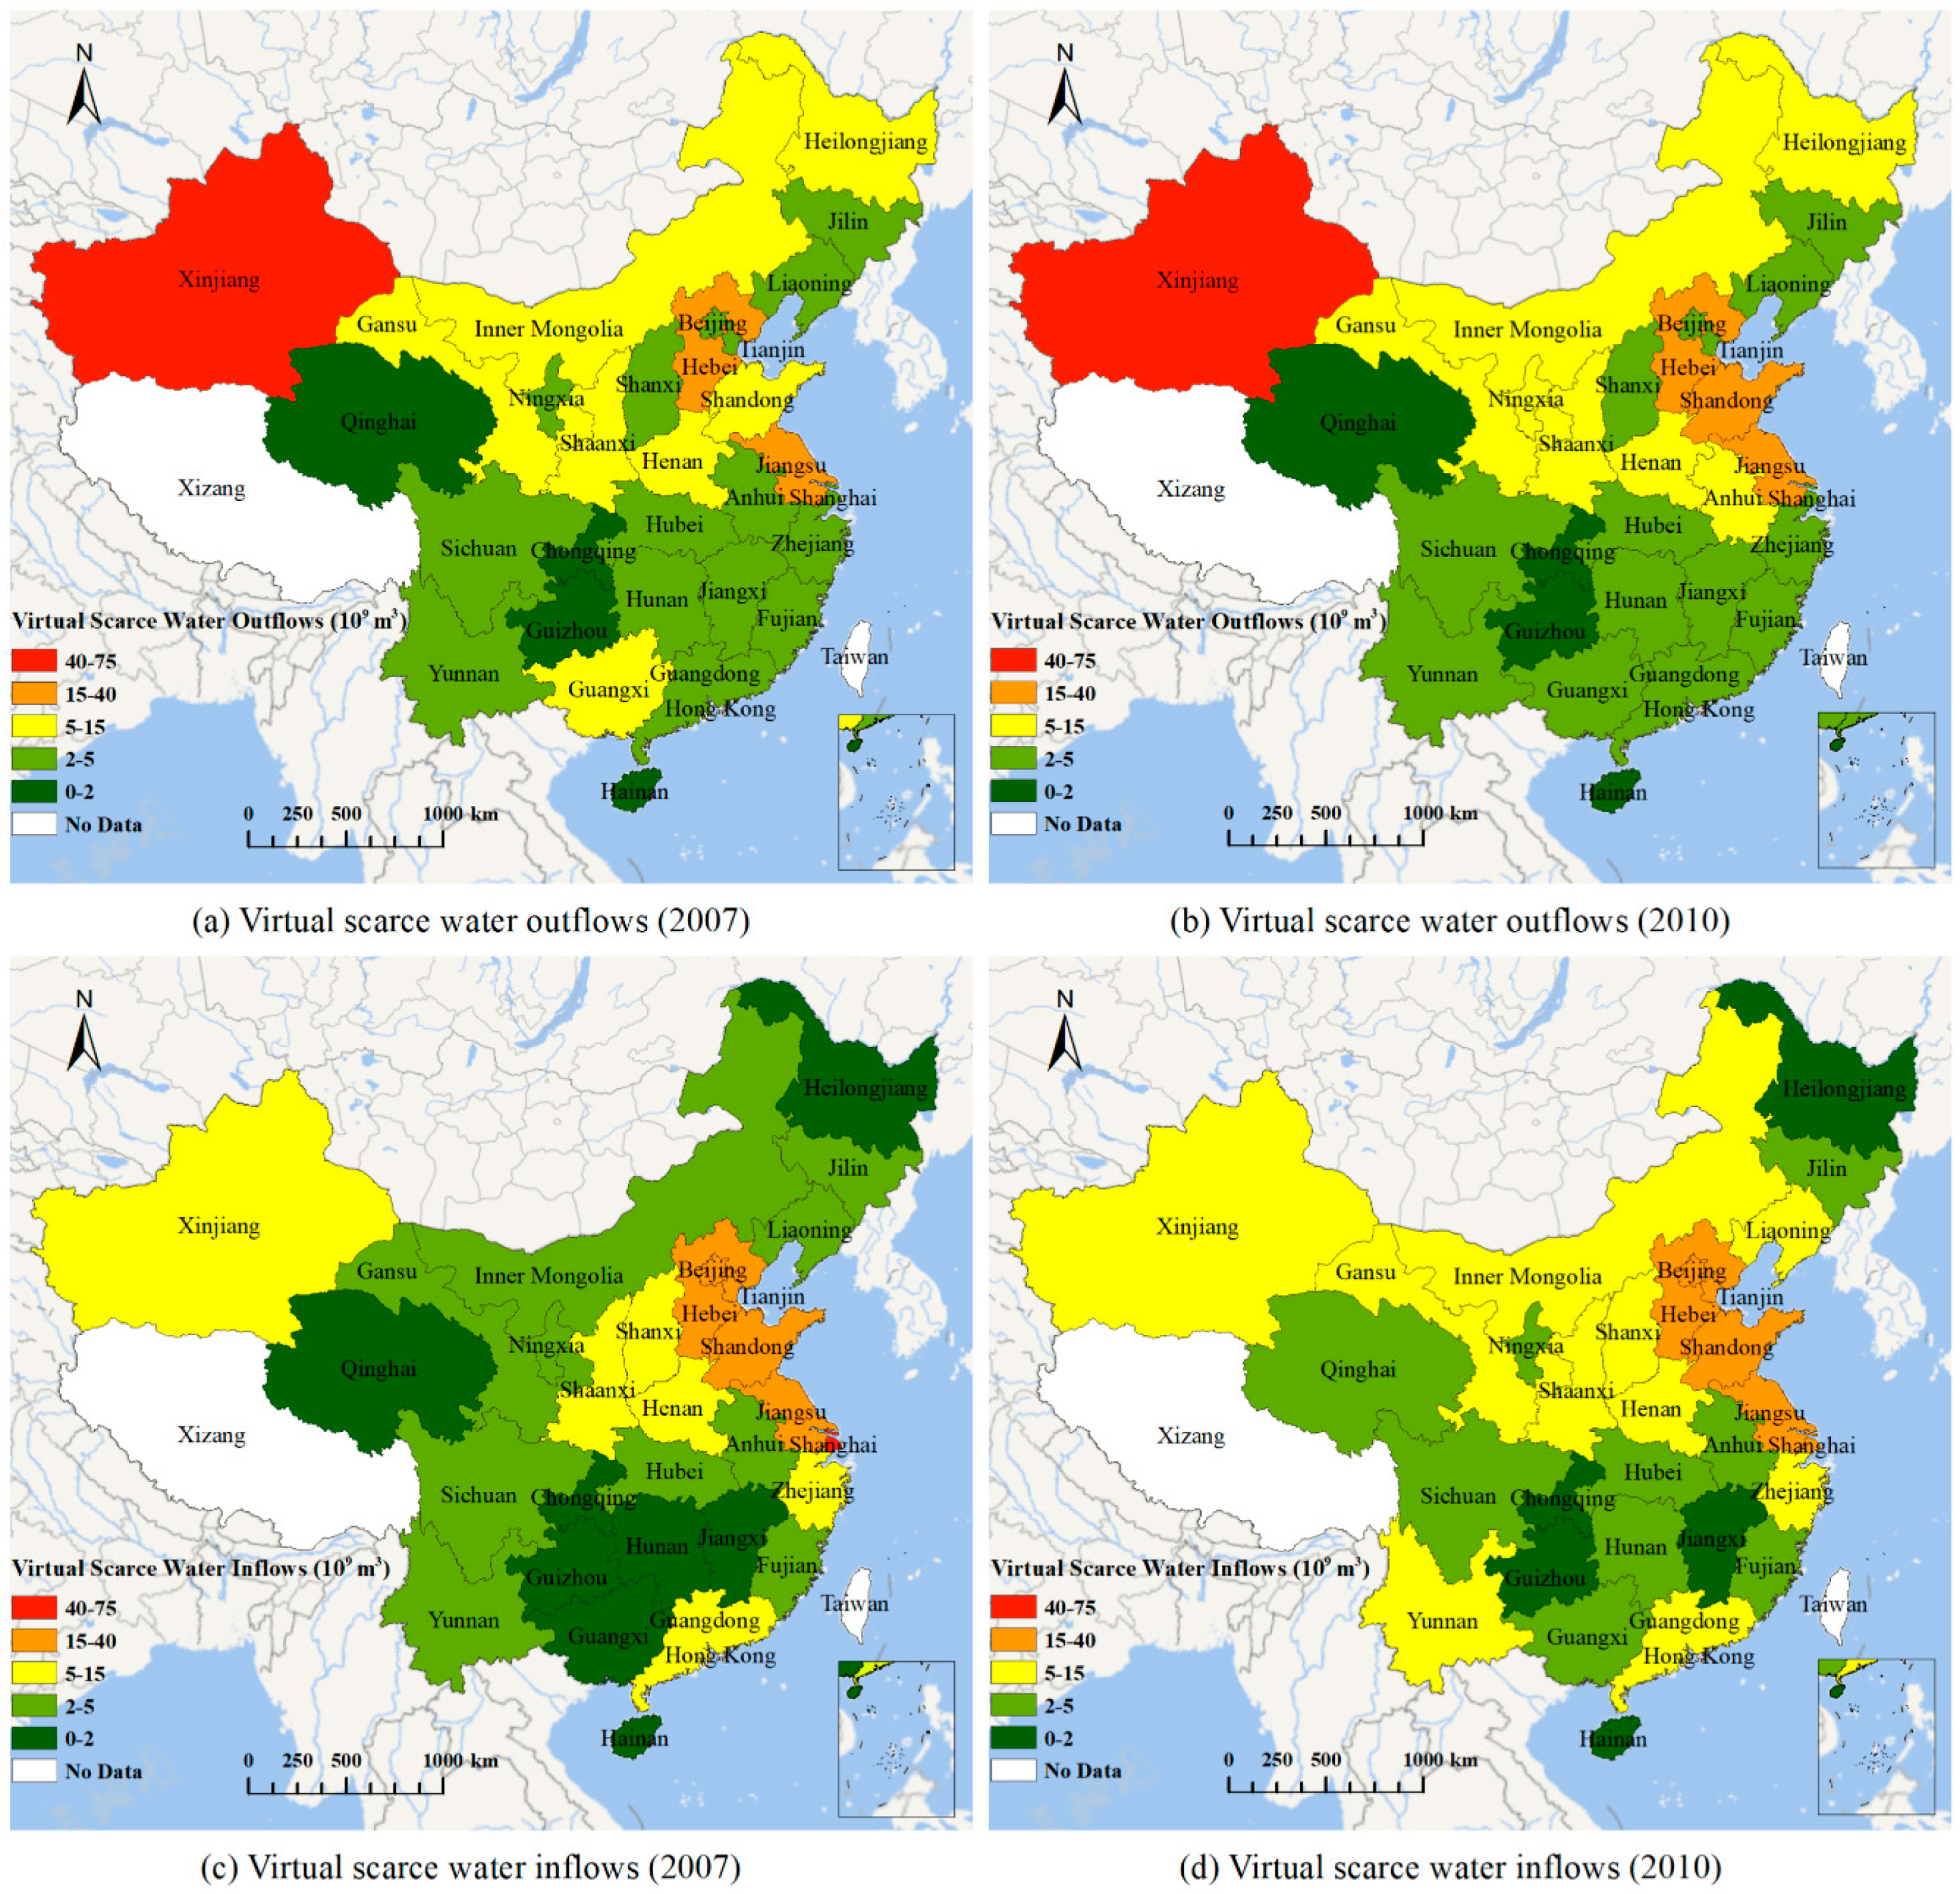
By linking the results of VW with the WAVE+ factor, we obtained the VSW flows among different provinces for the years, 2007 and 2010. For the VSW outflows, the national total increased from 233.33 billion m3 in 2007 to 256.33 billion m3 in 2010. Most of the VSW came from northern provinces (Figure 6a, b). For instance, Xinjiang (66.14 billion m3 in 2007 and 72.89 billion m3 in 2010), Hebei (35.88 billion m3 in 2007 and 31.12 billion m3 in 2010), and Jiangsu (17.00 billion m3 in 2007 and 23.19 billion m3 in 2010) were the most important exporters of VSW. They collectively contributed to approximately 51% and 50% of the national total VSW for the years, 2007 and 2010, respectively. Shandong became one of the largest VSW exporters in 2010, which supplied 20.49 billion m3 VSW to other provinces. Some other provinces in the north, such as Heilongjiang, Inner Mongolia, Gansu, Shaanxi, and Henan, were also the major sources of VSW outflows for both years, 2007 and 2010. These five provinces collectively shared approximately 16% and 14% of the national total VSW.
With respect to the VSW inflows, their total amounts reached 257.43 billion m3 in 2007 and increased to 277.49 billion m3 in 2010. The results consistently show that Shanghai was the largest importer of VSW for both years, 2007 and 2010 (Figure 6c,d). Shanghai appropriated 42.34 billion m3 in 2007 and 39.10 billion m3 in 2010, mainly from the provinces of Xinjiang, Hebei, and Jiangsu. Notably, the provinces of Hebei (17.78 billion m3 in 2007 and 21.66 billion m3 in 2010), Shandong (33.62 billion m3 in 2007 and 31.75 billion m3 in 2010), and Jiangsu (19.01 billion m3 in 2007 and 24.24 billion m3 in 2010), which were important exporters of VSW, were also the among largest importers of VSW. Beijing (24.48 billion m3 in 2007 and 19.79 billion m3 in 2010) and Tianjin (20.48 billion m3 in 2007 and 20.46 billion m3 in 2010) were another two major importers of VSW. Overall, these six provinces collectively contributed to 61.26% and 56.58% of the national total for the years, 2007 and 2010, respectively.
4. Discussion
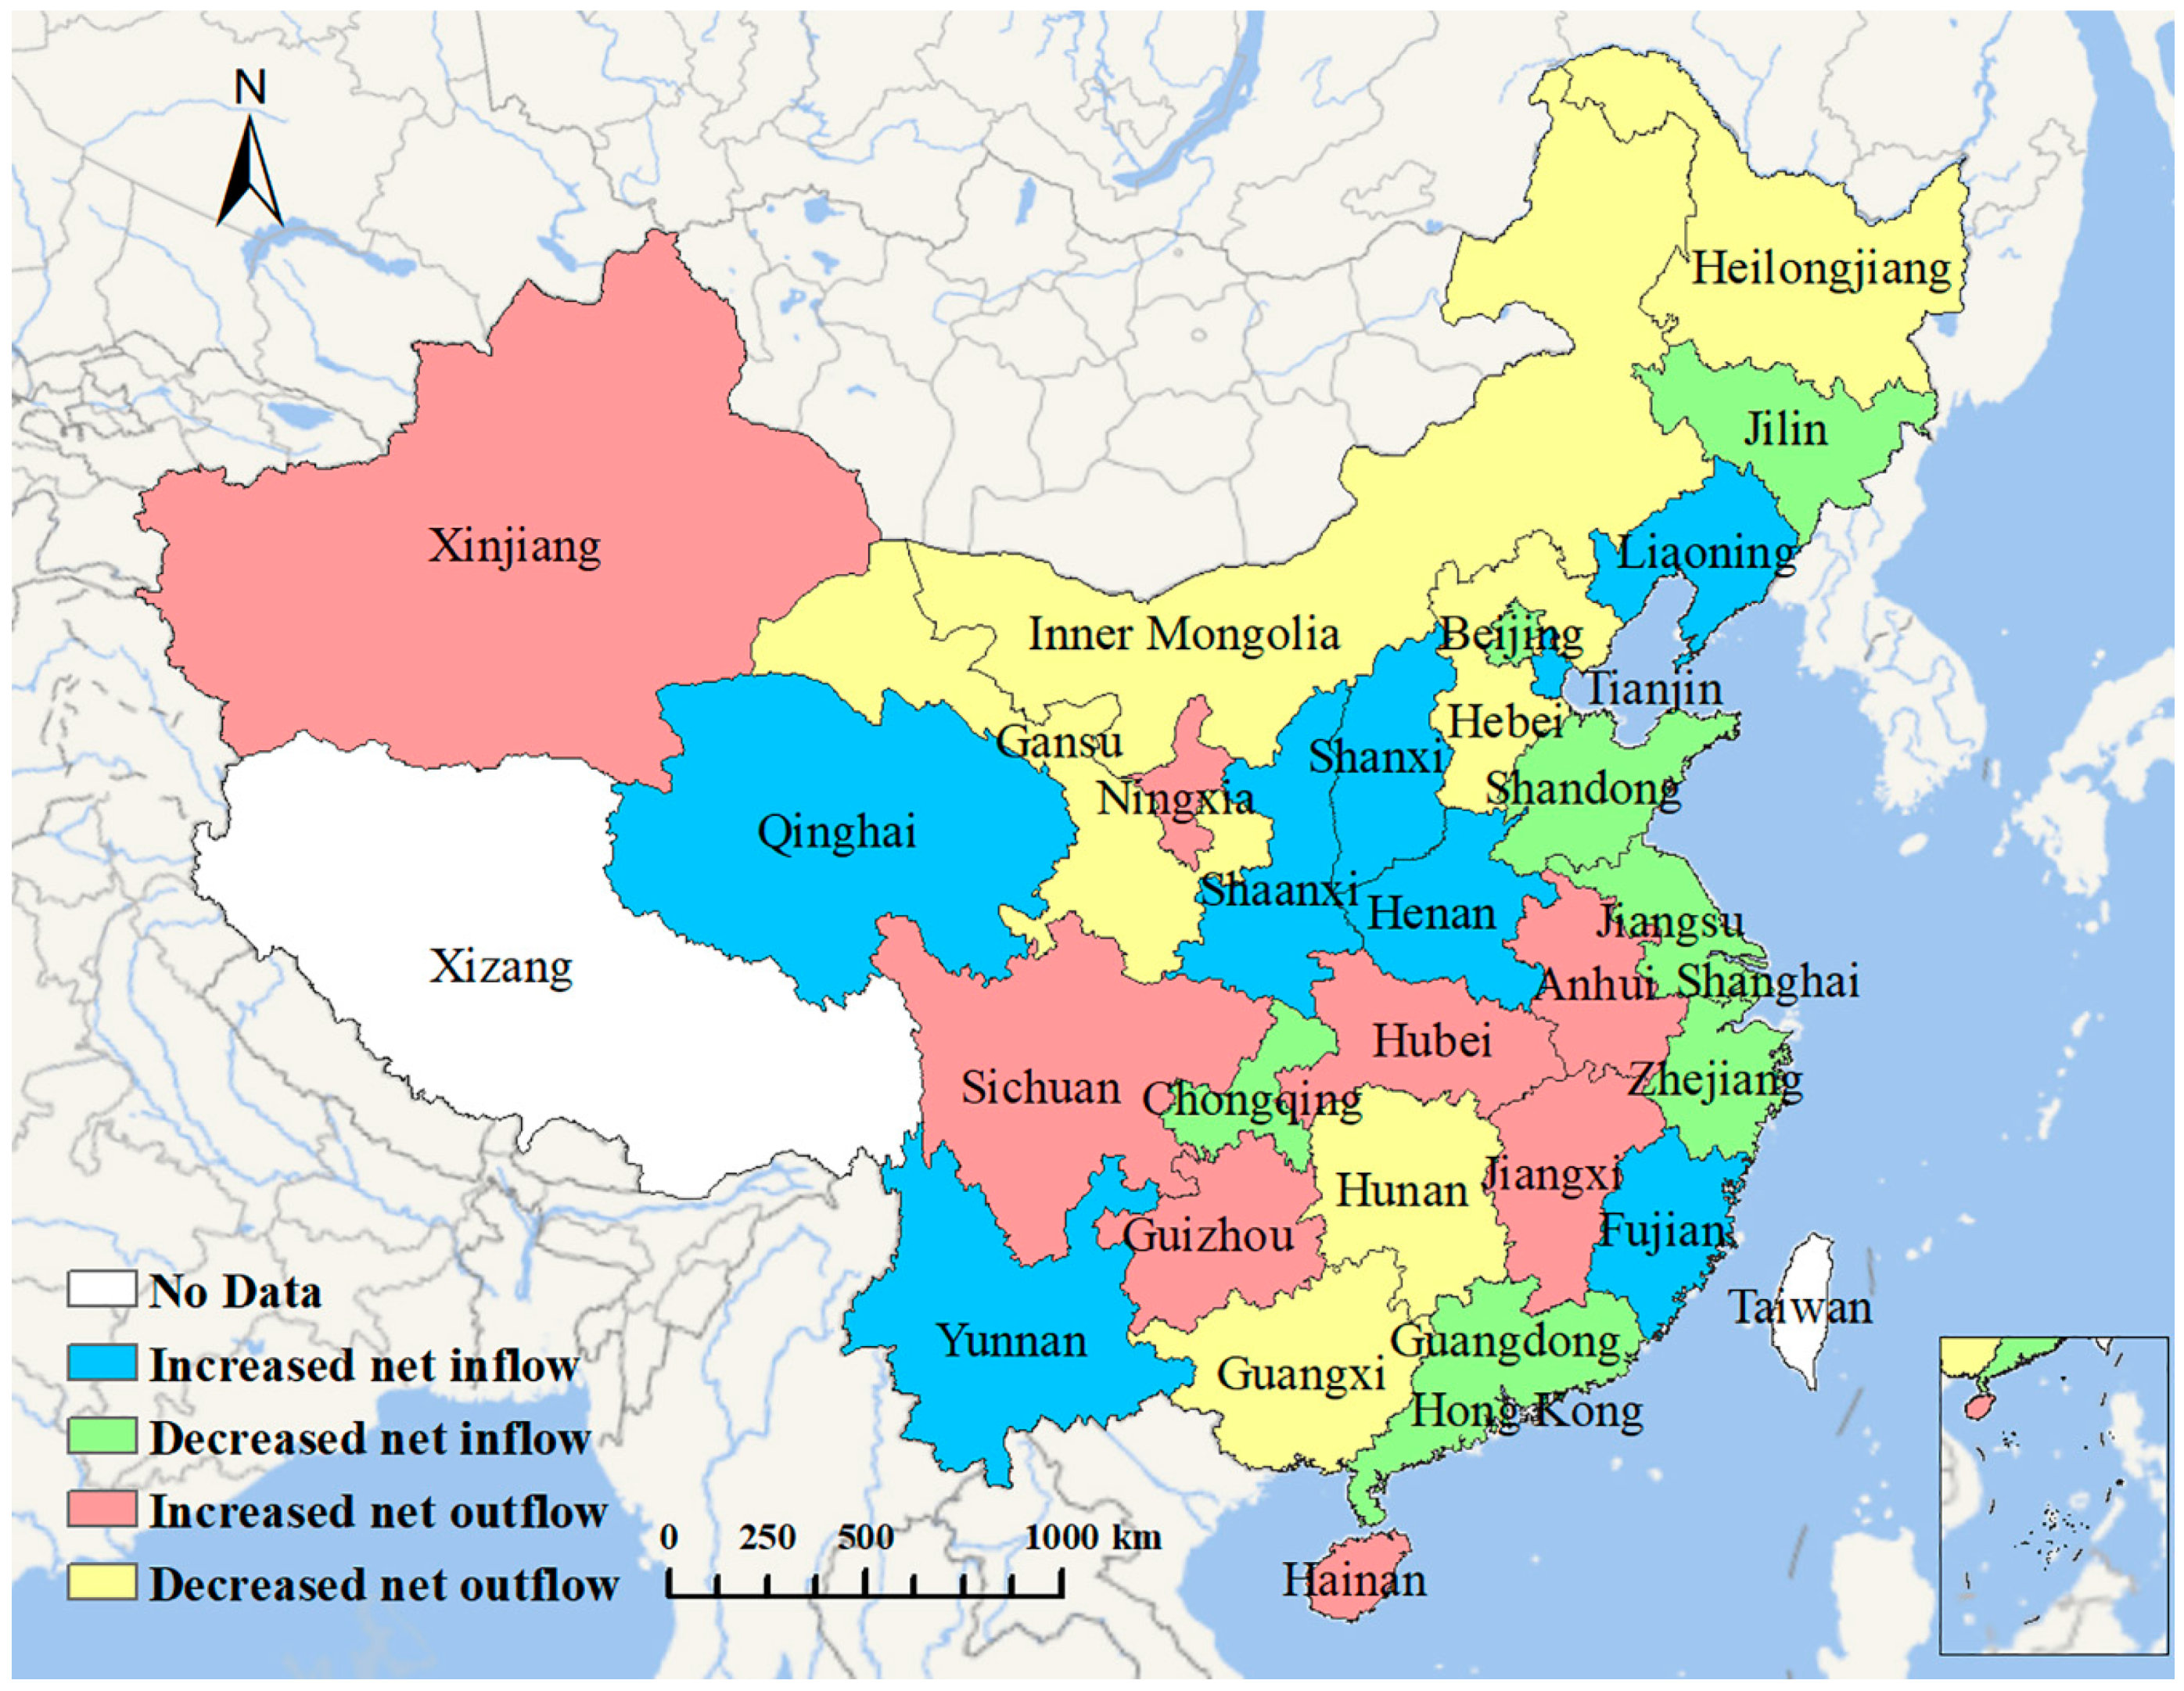
The results of MRIO analysis for both years, 2007 and 2010, suggest a consistent north-to-south and south-to-south net VW trade pattern in China. However, changes can be observed in the VW supplying regions by comparing the VW trade patterns for the years, 2007 and 2010, respectively. As shown in Figure 7, the net outflows of VW decreased in Heilongjiang, Inner Mongolia, Hebei, and Gansu while they increased in Xinjiang and Ningxia in Northwestern China. Sichuan, Guizhou, Hubei, Anhui, Jiangxi, and Hainan, which are in southern China, were also found having an increased amount of net outflows of VW in 2010. For the main VW-consuming coastal provinces, namely Shandong, Jiangsu, Shanghai, Zhejiang, and Guangdong, a decrease in the net inflows was observed for these provinces in 2010. This result suggests a reduced dependence of these regions on imports of external VW. Contrastingly, there was an increase in the net inflows of VW for some inland provinces, such as Qinghai, Shaanxi, Shanxi, Henan, and Yunnan.
Moreover, according to the results of the VSW assessment, the amounts of VSW inflows were consistently greater than those of VSW outflows at the national level for both years, 2007 and 2010. The national total of net VSW inflows were 24.10 billion m3 and 21.16 billion m3, respectively, for the years, 2007 and 2010. These results indicate an increased pressure on the environmentally vulnerable provinces due to water consumption displacement. The vulnerable provinces with water deprivation issues are also the important regions of agricultural production. Therefore, the results of our analysis may raise special concern about the proper formulation of policies to alleviate the water deprivation issues in northern China.
To further investigate the influential factors of WF, a multivariate regression analysis was applied with the explanatory variables of per capita GDP, total amount of water resources, per capita amount of water resources, urban population, and rural population. The results show that at the 95% confidence level, per capita GDP, total amount of water resources, and per capita amount of water resources have significant relationships with regional WF, albeit to varying degrees, in both years of 2007 and 2010. Compared to 2007, in 2010, each region’s WF was also significantly affected by urban population (Table 3).
Unbalanced economic development is a main factor that causes the regional differences in WF. China’s eastern coastal regions are its most economically advanced regions. These regions consistently rely heavily on large amounts of VW imports through inter-provincial trade of, for instance, crop and grain from those less developed regions. The economically underdeveloped regions primarily export agricultural products in the domestic trade system. Therefore, the per capita GDP of a region is significantly positively correlated to the size of its WF. Regions with affluent water resources are found to be less dependent on the consumption of VW products and services, as suggested by the significantly negative relationship between per capita amount of water resources and the amount of WF. Urban population was significantly negatively correlated to WF only in 2010. This result partially suggests the impacts of urbanization on improving the usage and efficiency of water resources. In the results for both years of 2007 and 2010, rural population does not show a significant relationship with WF.
Additionally, although we did not include a policy factor into the analysis due to data unavailability, some previous research has identified the importance of policy intervention to influence WF. For instance, Wang et al. [40] found a downward trend of water use in Shandong from 1997 to 2002, which was largely owing to the implementation of water use quotas’ policy and the shut-down of backward-technology production lines. Moreover, climatic variability/change may cause substantial impacts on water resources in the future [41]. Our results indicate that provinces in the regions of northeast and northwest China are primary exporters of water resources. However, empirical research has suggested a decreasing trend in precipitation in these regions mainly due to the climatic variability/change since the late 1980s, which may impose challenges on future water supply [42]. These results further stress the importance of policy makings to mitigate the impacts of climatic change and better manage water resources both in local regions and the entire country.
The presented analysis has several limitations. First, the data we used cannot reflect the latest situation of inter-regional water flows, although the data were indeed published quite recently in 2012 and 2014. This drawback is mainly due to the complicated procedures for a set of well-established IO tables. In future study, we will try to apply more recent data if there is any. Second, the MRIO model applied only provides a snapshot of the overall WF pattern in China from the sectoral perspective and fails to reflect the detail impacts of individual products on WF [43]. Additionally, the data we used only covered six economic sectors, which have a relatively coarse resolution. The aggregation of multiple sub-sectors (e.g., the agricultural sector) may introduce uncertainty to the modeling results [44]. Third, the presented analysis focuses more on domestic inter-regional water flows while it does not account for those embodied in international trade between China and other countries in the world. We will address this issue in future work by incorporating complementary data of international trade.
5. Conclusions
The problem of water shortages is challenging the rapid industrialization and urbanization in China. The investigation of VW trade and flows in China can facilitate the optimal allocation and proper use of water resources. In this study, based on the 2007 and 2010 IO tables for China’s regions, the magnitude and inter-regional flow of China’s VW were assessed for the years, 2007 and 2010. The findings are obtained as follows.
- From 2007 to 2010, there was a slight increase in China’s total BWF. The eastern regions had a larger WF than the western regions. The average provincial proportion of external WF held almost constant for the years, 2007 and 2010. Tianjin, Shanghai, and Beijing relied heavily on water appropriated in other provinces. Xinjiang, Hainan, and Gansu mainly consumed local water resources. Xinjiang featured the largest exports of VW, while Shanghai had the largest net VW inflows.
- The agricultural sector had the largest WF (approximately 83% of the total WF), followed by the industrial sector. The comparison of the results for the years, 2007 and 2010, shows that the share of the construction sector decreased, while the share of other service industries increased. The overall sectoral VW flow structure changed marginally.
- The results for the years, 2007 and 2010, revealed a consistent north-to-south and south-to-south net VW trade pattern. Based on a regression analysis, it was found that per capita GDP and total amount of water resources were positively correlated to regional WF. The per capita amount of water resources and urban population were negatively correlated to regional WF.
- The assessment of VSW flows indicates that most of the VSW was exported from the provinces in northern China. Shanghai was the largest consumer of VSW, suggesting the profound impacts exerted by Shanghai on those environmentally vulnerable provinces. It was also found that the amounts of VSW inflows were consistently greater than those of VSW outflows at the national level for both years, 2007 and 2010. This result implies an increased pressure of the provinces with a water shortage problem and raises special concern of policy makings to alleviate the water deprivation issues in these provinces.
Author Contributions
All authors make significant contributions to this article. Conceptualization, Y.Z. and Y.C.; Methodology, Y.Z. and M.H.; Formal analysis, Y.Z.; Data curation, Y.Z. and M.H.; Writing—Original Draft, Y.Z.; Writing—Review and Editing, Y.Z. and Y.C.; Funding acquisition, Y.C.
Funding
This research was supported by the National Key R&D Program of China (Grant No. 2017YFA0604401), the National Natural Science Foundation of China (Grant Nos. 41871306 and 41601420), the Key National Natural Science Foundation of China (Grant No. 41531176) and the research fund from Shenzhen Key Laboratory of Spatial Smart Sensing and Service.
Acknowledgments
The authors sincerely thank the anonymous reviewers for their useful comments and suggestions. The authors also thank Penghua Liu for his kind help in revising this paper.
Conflicts of Interest
The authors declare no conflict of interest.
References
- United Nations. The United Nations World Water Development Report 2018; United Nations Educational, Scientific and Cultural Organization: Paris, France, 2018. [Google Scholar]
- Xu, X.; Wang, H.; Liu, H. China Water Use Efficiency Assessment Reports; Beijing Normal University Publishing Group: Beijing, China, 2010. [Google Scholar]
- Cai, B.; Zhang, W.; Hubacek, K.; Feng, K.; Li, Z.; Liu, Y.; Liu, Y. Drivers of virtual water flows on regional water scarcity in China. J. Clean. Prod. 2019, 207, 1112–1122. [Google Scholar] [CrossRef]
- Allan, J.A. Virtual Water: A Strategic Resource Global Solutions to Regional Deficits. Groundwater 1998, 36, 545–546. [Google Scholar] [CrossRef]
- Hoekstra, A.Y.; Mekonnen, M.M. The water footprint of humanity. Proc. Natl. Acad. Sci. USA 2012, 109, 3232–3237. [Google Scholar] [CrossRef] [PubMed] [Green Version]
- Dalin, C.; Konar, M.; Hanasaki, N.; Rinaldo, A.; Rodrigueziturbe, I. Evolution of the global virtual water trade network. Proc. Natl. Acad. Sci. USA 2012, 109, 5989. [Google Scholar] [CrossRef] [PubMed]
- Feng, K.; Siu, Y.L.; Guan, D.; Hubacek, K. Assessing regional virtual water flows and water footprints in the Yellow River Basin, China: A consumption based approach. Appl. Geogr. 2012, 32, 691–701. [Google Scholar] [CrossRef]
- Hoekstra, A.Y. Human appropriation of natural capital: A comparison of ecological footprint and water footprint analysis. Ecol. Econ. 2009, 68, 1963–1974. [Google Scholar] [CrossRef] [Green Version]
- Feng, L.; Chen, B.; Hayat, T.; Alsaedi, A.; Ahmad, B. The driving force of water footprint under the rapid urbanization process: A structural decomposition analysis for Zhangye city in China. J. Clean. Prod. 2017, 163, S322–S328. [Google Scholar] [CrossRef]
- Zhao, X.; Yang, H.; Yang, Z.; Chen, B.; Qin, Y. Applying the Input-Output Method to Account for Water Footprint and Virtual Water Trade in the Haihe River Basin in China. Environ. Sci. Technol. 2010, 44, 9150. [Google Scholar] [CrossRef]
- Zhang, Z.; Yang, H.; Shi, M. Analyses of water footprint of Beijing in an interregional input-output framework. Ecol. Econ. 2011, 70, 2494–2502. [Google Scholar] [CrossRef]
- Chenoweth, J.; Hadjikakou, M.; Zoumides, C. Quantifying the human impact on water resources: A critical review of the water footprint concept. Hydrol. Earth Syst. Sci. 2014, 18, 2325–2342. [Google Scholar] [CrossRef]
- Fader, M.; Gerten, D.; Thammer, M.; Heinke, J.; Lotzecampen, H.; Lucht, W.; Cramer, W. Internal and external green-blue agricultural water footprints of nations, and related water and land savings through trade. Hydrol. Earth Syst. Sci. 2011, 8, 483–527. [Google Scholar] [CrossRef]
- Wang, Y.; Xiao, H.L.; Lu, M.F. Analysis of water consumption using a regional input-output model: Model development and application to Zhangye City, Northwestern China. J. Arid. Environ. 2009, 73, 894–900. [Google Scholar] [CrossRef]
- Zoumides, C.; Bruggeman, A.; Hadjikakou, M.; Zachariadis, T. Policy-relevant indicators for semi-arid nations: The water footprint of crop production and supply utilization of Cyprus. Ecol. Indic. 2014, 43, 205–214. [Google Scholar] [CrossRef]
- Steen-Olsen, K.; Weinzettel, J.; Cranston, G.; Ercin, A.E.; Hertwich, E.G. Carbon, land, and water footprint accounts for the European Union: Consumption, production, and displacements through international trade. Environ. Sci. Technol. 2012, 46, 10883–10891. [Google Scholar] [CrossRef] [PubMed]
- Kitzes, J. An introduction to environmentally-extended input-output analysis. Resources 2013, 2, 489–503. [Google Scholar] [CrossRef]
- Oel, P.R.V.; Mekonnen, M.M.; Hoekstra, A.Y. The external water footprint of the Netherlands: Geographically-explicit quantification and impact assessment. Ecol. Econ. 2009, 69, 82–92. [Google Scholar]
- Chen, Y.; Li, X.; Liu, X.; Zhang, Y.; Huang, M. Tele-connecting China’s future urban growth to impacts on ecosystem services under the shared socioeconomic pathways. Sci. Total. Environ. 2019, 652, 765–779. [Google Scholar] [CrossRef]
- Hou, S.; Liu, Y.; Zhao, X.; Tillotson, M.; Guo, W.; Li, Y. Blue and Green Water Footprint Assessment for China—A Multi-Region Input-Output Approach. Sustainability 2018, 10, 2822. [Google Scholar] [CrossRef]
- Lenzen, M.; Moran, D.; Bhaduri, A.; Kanemoto, K.; Bekchanov, M.; Geschke, A.; Foran, B. International trade of scarce water. Ecol. Econ. 2013, 94, 78–85. [Google Scholar] [CrossRef]
- Yang, X.; Zhang, W.; Fan, J.; Yu, J.; Zhao, H. Transfers of embodied PM2.5 emissions from and to the North China region based on a multiregional input-output model. Environ. Pollut. 2018, 235, 381–393. [Google Scholar] [CrossRef]
- Su, B.; Ang, B.W. Input-output analysis of CO2 emissions embodied in trade: A multi-region model for China. Ecol. Econ. 2014, 71, 42–53. [Google Scholar] [CrossRef]
- Chen, Z.M.; Chen, G.Q. Virtual water accounting for the globalized world economy: National water footprint and international virtual water trade. Ecol. Indic. 2013, 28, 142–149. [Google Scholar] [CrossRef]
- Zhang, C.; Anadon, L.D. A multi-regional input-output analysis of domestic virtual water trade and provincial water footprint in China. Ecol. Econ. 2014, 100, 159–172. [Google Scholar] [CrossRef]
- Liu, G.; Shi, L.; Li, K. Equitable Allocation of Blue and Green Water Footprints Based on Land-Use Types: A Case Study of the Yangtze River Economic Belt. Sustainability 2018, 10, 3556. [Google Scholar] [CrossRef]
- Dong, H.; Geng, Y.; Sarkis, J.; Fujita, T.; Okadera, T.; Xue, B. Regional water footprint evaluation in China: A case of Liaoning. Sci. Total. Environ. 2013, 442, 215–224. [Google Scholar] [CrossRef] [PubMed]
- Tian, X.; Sarkis, J.; Geng, Y.; Qian, Y.; Gao, C.; Bleischwitz, R.; Xu, Y. Evolution of China’s water footprint and virtual water trade: A global trade assessment. Environ. Int. 2018, 121, 178–188. [Google Scholar] [CrossRef] [PubMed]
- Wang, X.; Huang, K.; Yu, Y.; Hu, T.; Xu, Y. An input-output structural decomposition analysis of changes in sectoral water footprint in China. Ecol. Indic. 2016, 69, 26–34. [Google Scholar] [CrossRef]
- Zhang, Z.; Yang, H.; Shi, M. Spatial and sectoral characteristics of China’s international and interregional virtual water flows—Based on multi-regional input-output model. Econ. Syst. Res. 2016, 28, 1–21. [Google Scholar] [CrossRef]
- Zhao, X.; Chen, B.; Yang, Z.F. National water footprint in an input-output framework—A case study of China 2002. Ecol. Model. 2009, 220, 245–253. [Google Scholar] [CrossRef]
- National Bureau of Statistics of China. China Statistical Yearbook 2011; National Bureau of Statistics of China: Beijing, China, 2011.
- Berger, M.; Eisner, S.; van der Ent, R.; Flörke, M.; Link, A.; Poligkeit, J.; Bach, V.; Finkbeiner, M. Enhancing the Water Accounting and Vulnerability Evaluation Model: WAVE+. Environ. Sci. Technol. 2018, 52, 10757–10766. [Google Scholar] [CrossRef]
- Liu, W.; Chen, J.; Tang, Z.; Liu, H.; Han, D.; Li, F. Theory and Practice for Building Multi-Regional Input-Output Table for 30 Provinces in China in 2007; China Statistics Press: Beijing, China, 2012. [Google Scholar]
- Liu, W.; Tang, Z.; Chen, J. Theory and Practice for Building Multi-Regional Input-Output Table for 30 Provinces in China in 2010; China Statistics Press: Beijing, China, 2014. [Google Scholar]
- National Bureau of Statistics of China. Available online: http://www.stats.gov.cn/ztjc/ztsj/hjtjzl/ (accessed on 24 December 2018).
- China Water Resource Bulletin. Available online: http://www.mwr.gov.cn/sj/tjgb/szygb/ (accessed on 24 December 2018).
- Bulletin of First National Census for Water. Available online: http://slpc.mwr.gov.cn/gbzq/ (accessed on 24 December 2018).
- Enhancing the water accounting and vulnerability evaluation model: WAVE+. Available online: https://www.see.tu-berlin.de/menue/forschung/ergebnisse/wave/parameter/en/ (accessed on 24 December 2018).
- Wang, W.; Gao, L.; Liu, P.; Hailu, A. Relationships between regional economic sectors and water use in a water-scarce area in China: A quantitative analysis. J. Hydrol. 2014, 515, 180–190. [Google Scholar] [CrossRef]
- Bryan, B.A.; Gao, L.; Ye, Y.; Sun, X.; Connor, J.D.; Crossman, N.D.; Stafford-Smith, M.; Wu, J.; He, C.; Yu, D. China’s response to a national land-system sustainability emergency. Nature 2018, 559, 193. [Google Scholar] [CrossRef]
- Xie, X.; Liang, S.; Yao, Y.; Jia, K.; Meng, S.; Li, J. Detection and attribution of changes in hydrological cycle over the Three-North region of China: Climate change versus afforestation effect. Agric. For. Meteorol. 2015, 203, 74–87. [Google Scholar] [CrossRef]
- White, D.J.; Hubacek, K.; Feng, K.; Sun, L.; Meng, B. The Water-Energy-Food Nexus in East Asia: A tele-connected value chain analysis using inter-regional input-output analysis. Appl. Energy 2018, 210, 550–567. [Google Scholar] [CrossRef]
- Wiedmann, T. A review of recent multi-region input-output models used for consumption-based emission and resource accounting. Ecol. Econ. 2009, 69, 211–222. [Google Scholar] [CrossRef]
Figure 1.
Spatial distribution of China’s WF for the years, 2007 and 2010.

Figure 2.
Provincial WF and the proportion of external WF for the years, 2007 and 2010.

Figure 3.
Sectoral composition of VW in 30 regions of China for the years, 2007 and 2010.

Figure 4.
Net VW inflows into each region of China for the years, 2007 and 2010.

Figure 5.
VW flows in the five regions of China with the largest net inflows/outflows for the years, 2007 and 2010 (100 million m3). Note: 1 = Beijing, 2 = Tianjin, 3 = Hebei, 4 = Shanxi, 5 = Inner Mongolia, 6 = Liaoning, 7 = Jilin, 8 = Heilongjiang, 9 = Shanghai, 10 = Jiangsu, 11 = Zhejiang, 12 = Anhui, 13 = Fujian, 14 = Jiangxi, 15 = Shandong, 16 = Henan, 17 = Hubei, 18 = Hunan, 19 = Guangdong, 20 = Guangxi, 21 = Hainan, 22 = Chongqing, 23 = Sichuan, 24 = Guizhou, 25 = Yunnan, 26 = Shaanxi, 27 = Gansu, 28 = Qinghai, 29 = Ningxia and 30 = Xinjiang.

Figure 6.
The amounts of VSW outflows/inflows for China’s 30 provinces.

Figure 7.
Changes in VW inflows/outflows in China from 2007 to 2010.


Table 1.
Sectoral proportions of VW flowing out of the five regions with the largest net outflows for the years, 2007 and 2010 (units: %).
Table 1.
Sectoral proportions of VW flowing out of the five regions with the largest net outflows for the years, 2007 and 2010 (units: %).
| Sector | VW Outflows by Each Sector in 2007 | VW Outflows by Each Sector in 2010 | ||||||||
|---|---|---|---|---|---|---|---|---|---|---|
| XJN | HLJ | IMG | HEB | GXI | XJN | HLJ | ANH | HEB | IMG | |
| AGR | 98.02 | 89.06 | 94.35 | 89.06 | 85.86 | 84.06 | 85.84 | 82.41 | 85.18 | 85.24 |
| IND | 0.69 | 9.47 | 4.24 | 9.41 | 10.52 | 11.60 | 12.67 | 12.83 | 11.95 | 12.98 |
| CON | 0.80 | 0.37 | 0.41 | 0.44 | 0.54 | 0.63 | 0.37 | 0.74 | 0.43 | 0.34 |
| TAW | 0.09 | 0.19 | 0.26 | 0.26 | 0.44 | 0.69 | 0.18 | 0.62 | 0.72 | 0.47 |
| WAR | 0.04 | 0.18 | 0.16 | 0.12 | 0.45 | 0.35 | 0.18 | 0.38 | 0.28 | 0.20 |
| SER | 0.37 | 0.73 | 0.58 | 0.71 | 2.19 | 2.67 | 0.76 | 3.02 | 1.44 | 0.77 |
Note: For sector abbreviations, AGR = Agriculture, IND = Industries, CON = Construction, TAW = Transportation and warehousing, WAR = Wholesale and retail, and SER = Other service. For province abbreviations, XJN = Xinjiang, HLJ = Heilongjiang, IMG = Inner Mongolia, HEB = Hebei, GXI = Guangxi, and ANH = Anhui.
Table 2.
Sectoral proportions of VW flowing into the five regions of China with the largest net inflows for the years, 2007 and 2010 (units: %).
Table 2.
Sectoral proportions of VW flowing into the five regions of China with the largest net inflows for the years, 2007 and 2010 (units: %).
| Sector | VW Inflows by Each Sector in 2007 | VW Inflows by Each Sector in 2010 | ||||||||
|---|---|---|---|---|---|---|---|---|---|---|
| SNH | GND | BEJ | SND | ZJN | SNH | GND | ZJN | BEJ | TJN | |
| AGR | 87.62 | 81.76 | 87.96 | 90.10 | 81.90 | 87.58 | 78.95 | 79.29 | 83.01 | 82.49 |
| IND | 9.70 | 10.82 | 8.88 | 7.33 | 12.83 | 8.92 | 13.11 | 14.04 | 11.54 | 12.70 |
| CON | 0.18 | 0.74 | 0.59 | 0.61 | 1.24 | 0.16 | 0.74 | 1.36 | 0.54 | 0.64 |
| TAW | 0.27 | 0.51 | 0.32 | 0.33 | 0.40 | 0.57 | 0.81 | 0.60 | 0.80 | 1.46 |
| WAR | 0.24 | 0.52 | 0.32 | 0.16 | 0.54 | 0.53 | 0.79 | 0.56 | 0.77 | 0.64 |
| SER | 1.99 | 5.65 | 1.93 | 1.48 | 3.10 | 2.23 | 5.60 | 4.15 | 3.35 | 2.08 |
Note: For sector abbreviations, AGR = Agriculture, IND = Industries, CON = Construction, TAW = Transportation and warehousing, WAR = Wholesale and retail, and SER = other service. For province abbreviations, SNH = Shanghai, GND = Guangdong, BEJ = Beijing, SND = Shandong, ZJN = Zhejiang, and TJN = Tianjin.
Table 3.
Regression analysis for regional WF for the years, 2007 and 2010, at a 95% confidence level.
Table 3.
Regression analysis for regional WF for the years, 2007 and 2010, at a 95% confidence level.
| Influential Factor | 2007 (R2 = 0.760) | 2010 (R2 = 0.759) | ||
|---|---|---|---|---|
| Coef. | Sig. | Coef. | Sig. | |
| Per capita GDP | 0.809 | 0.025 | 1.137 | 0.016 |
| Total amount of water resources | 2.170 | 0.042 | 3.192 | 0.020 |
| Per capita amount of water resources | −2.126 | 0.043 | −3.126 | 0.021 |
| Urban population | - | - | −2.138 | 0.045 |
| Rural population | - | - | - | - |
Note: Coef. = coefficients; and Sig. = Significance level.
© 2018 by the authors. Licensee MDPI, Basel, Switzerland. This article is an open access article distributed under the terms and conditions of the Creative Commons Attribution (CC BY) license (http://creativecommons.org/licenses/by/4.0/).
Share and Cite
MDPI and ACS Style
Zhang, Y.; Chen, Y.; Huang, M. Water Footprint and Virtual Water Accounting for China Using a Multi-Regional Input-Output Model. Water 2019, 11, 34. https://doi.org/10.3390/w11010034
AMA Style
Zhang Y, Chen Y, Huang M. Water Footprint and Virtual Water Accounting for China Using a Multi-Regional Input-Output Model. Water. 2019; 11(1):34. https://doi.org/10.3390/w11010034
Chicago/Turabian StyleZhang, Yuanying, Yimin Chen, and Min Huang. 2019. "Water Footprint and Virtual Water Accounting for China Using a Multi-Regional Input-Output Model" Water 11, no. 1: 34. https://doi.org/10.3390/w11010034
Note that from the first issue of 2016, this journal uses article numbers instead of page numbers. See further details here.