Article

Water Footprint and Crop Water Usage of Oil Palm (Eleasis guineensis) in Central Kalimantan: Environmental Sustainability Indicators for Different Crop Age and Soil Conditions

by
Lisma Safitri
1,*,
Hermantoro Hermantoro
1,
Sentot Purboseno
1,
Valensi Kautsar
1,
Satyanto Krido Saptomo
2 and
Agung Kurniawan
3
1
Department of Agricultural Engineering, Stiper Agricultural University, Daerah Istimewa Yogyakarta 55281, Indonesia
2
Department of Civil and Environmental Engineering, Bogor Agricultural University, Jawa Barat 16680, Indonesia
3
Research Centre PT Bumitama Gunajaya Agro, Pundu, Kotawaringin Timur, Kalimantan Tengah 74359, Indonesia
*
Author to whom correspondence should be addressed.
Water 2019, 11(1), 35; https://doi.org/10.3390/w11010035
Submission received: 28 September 2018 / Revised: 19 December 2018 / Accepted: 20 December 2018 / Published: 25 December 2018
(This article belongs to the Special Issue Progress in Water Footprint Assessment)

Abstract

:
Various issues related to oil palm production, such as biodiversity, drought, water scarcity, and water and soil resource exploitation, have become major challenges for environmental sustainability. The water footprint method indicates that the quantity of water used by plants to produce one biomass product could become a parameter to assess the environmental sustainability for a plantation. The objective of this study is to calculate the water footprint of oil palm on a temporal scale based on root water uptake with a specific climate condition under different crop age and soil type conditions, as a means to assess environmental sustainability. The research was conducted in Pundu village, Central Kalimantan, Indonesia. The methodology adopted in carrying out this study consisted of monitoring soil moisture, rainfall, and the water table, and estimating reference evapotranspiration (ETo), root water uptake, and the oil palm water footprint. Based on the study, it was shown that the oil palm water usage in the observation area varies with different crop ages and soil types from 3.07–3.73 mm/day, with the highest contribution of oil palm water usage was in the first root zone which correlates to the root density distribution. The total water footprint values obtained were between 0.56 and 1.14 m3/kg for various plant ages and soil types. This study also found that the source of green water from rainfall on the upper oil palm root zone delivers the highest contribution to oil palm root water uptake than the blue water from groundwater on the bottom layer root zone.

1. Introduction

Oil palm plantations in Indonesia are well developed. Based on analysis, it was found that in 2015, the total area of oil palm in Indonesia was 5,980,982 ha, and it increased by about 13.7% by 2017 to 6,798,820 ha [1]. Various environmental issues related to oil palm commodity production, such as biodiversity, drought, water scarcity, and water and soil resource exploitation, have become major challenges for environmental sustainability. One of the persistent and recurring developing issues is that of water usage. One plant water usage efficiency parameter is the water footprint (WF), which indicates the quantity of water used by plants to produce one mass unit of biomass product. The water footprint of plants consists of a green water footprint (from rainfall), a blue water footprint (from aquifers, rivers, irrigation, etc.), and a gray water footprint (certain quantity of water used to dissolve chemical substances in order to make it appropriate with the environmental threshold) [2]. The water footprint is generally affected by the water usage of plants and its generated production. Two techniques are used to determine the rate of plant water usage or water utilization, which use a crop water requirement (ETP, potential evapotranspiration) and crop water usage (ETA, actual evapotranspiration) [2,3].
Plant water usage using actual evapotranspiration assumes more representative value to the real condition than to potential evapotranspiration. There are various values of the oil palm water footprint, which are usually based on geographical location and the climate condition. It should also be noted that the value of the water footprint tends to vary based on soil type, plant age, etc.
Nowadays, the water footprint has become an indication of environmental sustainability. There is an urgent need to develop oil palm plantations as a way to sustain plantations and encourage efforts to analyze the water footprint condition in each plantation location. Water footprint analysis could be conducted by various methods, such as the eco-scarcity method, the Milai Canals approach, the Pfister approach, etc. [4]. The water footprint represents the total sum of water used in a supply chain, which comprises blue, green, and gray water [3]. Lower water usage input without having a significant impact on yield will decrease the water footprint in milk production [5].
However, the limitation of climate data, which is the main factor used to analyze the water footprint in oil palm plantations, has become a major challenge. Moreover, the temporary cultivation of crops, and the various impacts associated with it, have been neglected in analyzing the water footprint in oil palm plantations globally [4]. Consequently, an annual assessment might be misleading regarding crop choices within and among different regions. A temporal resolution is therefore essential for proper life cycle assessment (LCA) or assessing the water footprint of crop production. For this purpose, a water stress index (WSI) was developed on a monthly basis for more than 11,000 watersheds with global coverage [6].
On the other hand, the water footprint has been calculated using an evapotranspiration and productivity approach which gave different ranges of variation between each region [7]. This analysis was based on geographical location, climate condition, plant condition factors, soil types, etc. As a result of this, and in order to develop the water footprint as a factor of environmental sustainability, a description of the water footprint value in the specific location with various soil types and plant ages is needed. The limitations of climate data for analyzing the water footprint in a specific time frame could be solved by developing a method of water footprint analysis using primary data.
Another factor that affects water usage as the main factor of the water footprint is root density. The oil palm root architecture consists of primary vertical and horizontal roots, secondary horizontal roots, vertical upward and downward growing secondary roots, superficial and deep tertiary roots, and quaternary roots [8,9,10]. The distribution of root density on the structure of oil palm root architecture varies between different soil types and crop ages. Therefore, in this research study, the water footprint of oil palms growing in various soil types and with different plant ages were analyzed. Based on the above-stated problems, it could be stated that variations of oil palm water footprint values are developed based on actual climate and production data in specified locations. It is of interest to find how oil palm water usage varies with different crop ages and soil types, how it distributes between the upper, middle, or lower part of the oil palm root zone, and which one is the highest. Furthermore, it is also important to determine how the water footprint varies temporally and which is greater between consumption from green water from rainwater and blue water from the subsurface layer. The current study is the first to propose the water footprint estimation under varying soil types and crop ages at a specific developmental stage of the oil palm plant in order to provide detailed information about the water footprint of oil palm and as an indicator of environmental sustainability in oil palm plantation.

Site Specific Features of Biophysics and Production

The research was conducted in Pundu village, Central Kalimantan, Indonesia, located at 11°58′01′′ S and 113°04′32′′ E at an altitude of 27 m above sea level. The site experiences a tropical climate and is represented by: (1) average annual rainfall of 3002 mm/year; (2) average annual temperatures between 21.4 and 33.8 °C; and (3) yearly average daily sunshine hours of around 5.9. The various observed plant ages and soil types were obtained from an oil palm plantation of 22,457.7 hectares in area.
Generally, the soil types used for oil palm plantations in Indonesia are spodosols and inceptisols. These soils are spread across Kalimantan and Sumatra island [11], where most oil palm plantations in Indonesia are located, making it feasible to analyze the effect of the utilization of spodosols and inceptisols and their relation to the water footprint.
There are limiting factors associated with the use of spodosols, such as the depth of the spodic layer, its sandy soil texture, and its acidic texture associated with the tropical area. The depth of the spodic layer is the main factor contributing to poor root growth. This is because it depends on the roots to penetrate the soil, whereas the sandy soil texture will reduce the soil’s ability to retain water and produce a greater chance for the soil to leach its nutrients. Other limiting factors that could possibly hinder plant growth include poor drainage and soil acidity. The depth of the spodic layer in spodosols ranges from 30 to 70 cm below the soil surface [12]. Oil palm requires solum depths greater than or equal to 80 cm without layers of rock for optimal growth and development [13]. In some marginal area, the oil palm needs a minimum depth of 75 cm to grow well without additional land improvement [14].
Inceptisols are acid mineral soils with low nutrient availability. The productivity of oil palm planted in this soil is low, and there are symptoms of decreased productivity in certain months of the year. The use of inceptisols for agricultural purposes has resulted in many physical, biological, and chemical inconsistency properties of the soil. The problem associated with the physical properties of inceptisols is related to the coarse texture of the topsoil, which happens to be less coarse in the lower layer. Therefore, the permeability value is bigger on the top surface and smaller in the lower layer. The topsoil structure is granular or crumby with a lower unstructured layer. Its density is lower on the surface and increases with depth. The cation exchange capacity is relatively moderate at about 14.1–17.3 me/100 g, while base saturation is low, between the range of 24% to 29% [15].

2. Materials and Methods

The methodology used in this study was accomplished through the following stages:

2.1. Observing Soil Moisture, Rainfall, and the Water Table for Varying Crop Age and Soil Type

In order to better understand the water balance system in the oil palm, a set of computerized instruments were installed to observe water balance parameters such as rainfall, water table depth, and soil moisture in the oil palm root zone. The data were used to predict the crop water usage of oil palm as a main variable to determine the water footprint. The lateral water flux in and out of the oil palm system was neglected.
The observation was undertaken for various soil types and crop ages as shown below:
  • Soil type: inceptisol; crop age: 8 years old
  • Soil type: inceptisol; crop age: 13 years old
  • Soil type: spodosol; crop age: 8 years old
  • Soil type: spodosol; crop age: 13 years old
  • Soil type: spodosol; crop age: 7 years old
  • Soil type: ultisol; crop age: 9 years old
Rainfall was measured using an automatic double-tipping bucket rain gauge while the water was measured using an automatic water level. Soil moisture was observed using a soil moisture sensor which was spread horizontally and vertically in the root zone based under varying crop age and soil types by referring to oil palm root architecture [16].

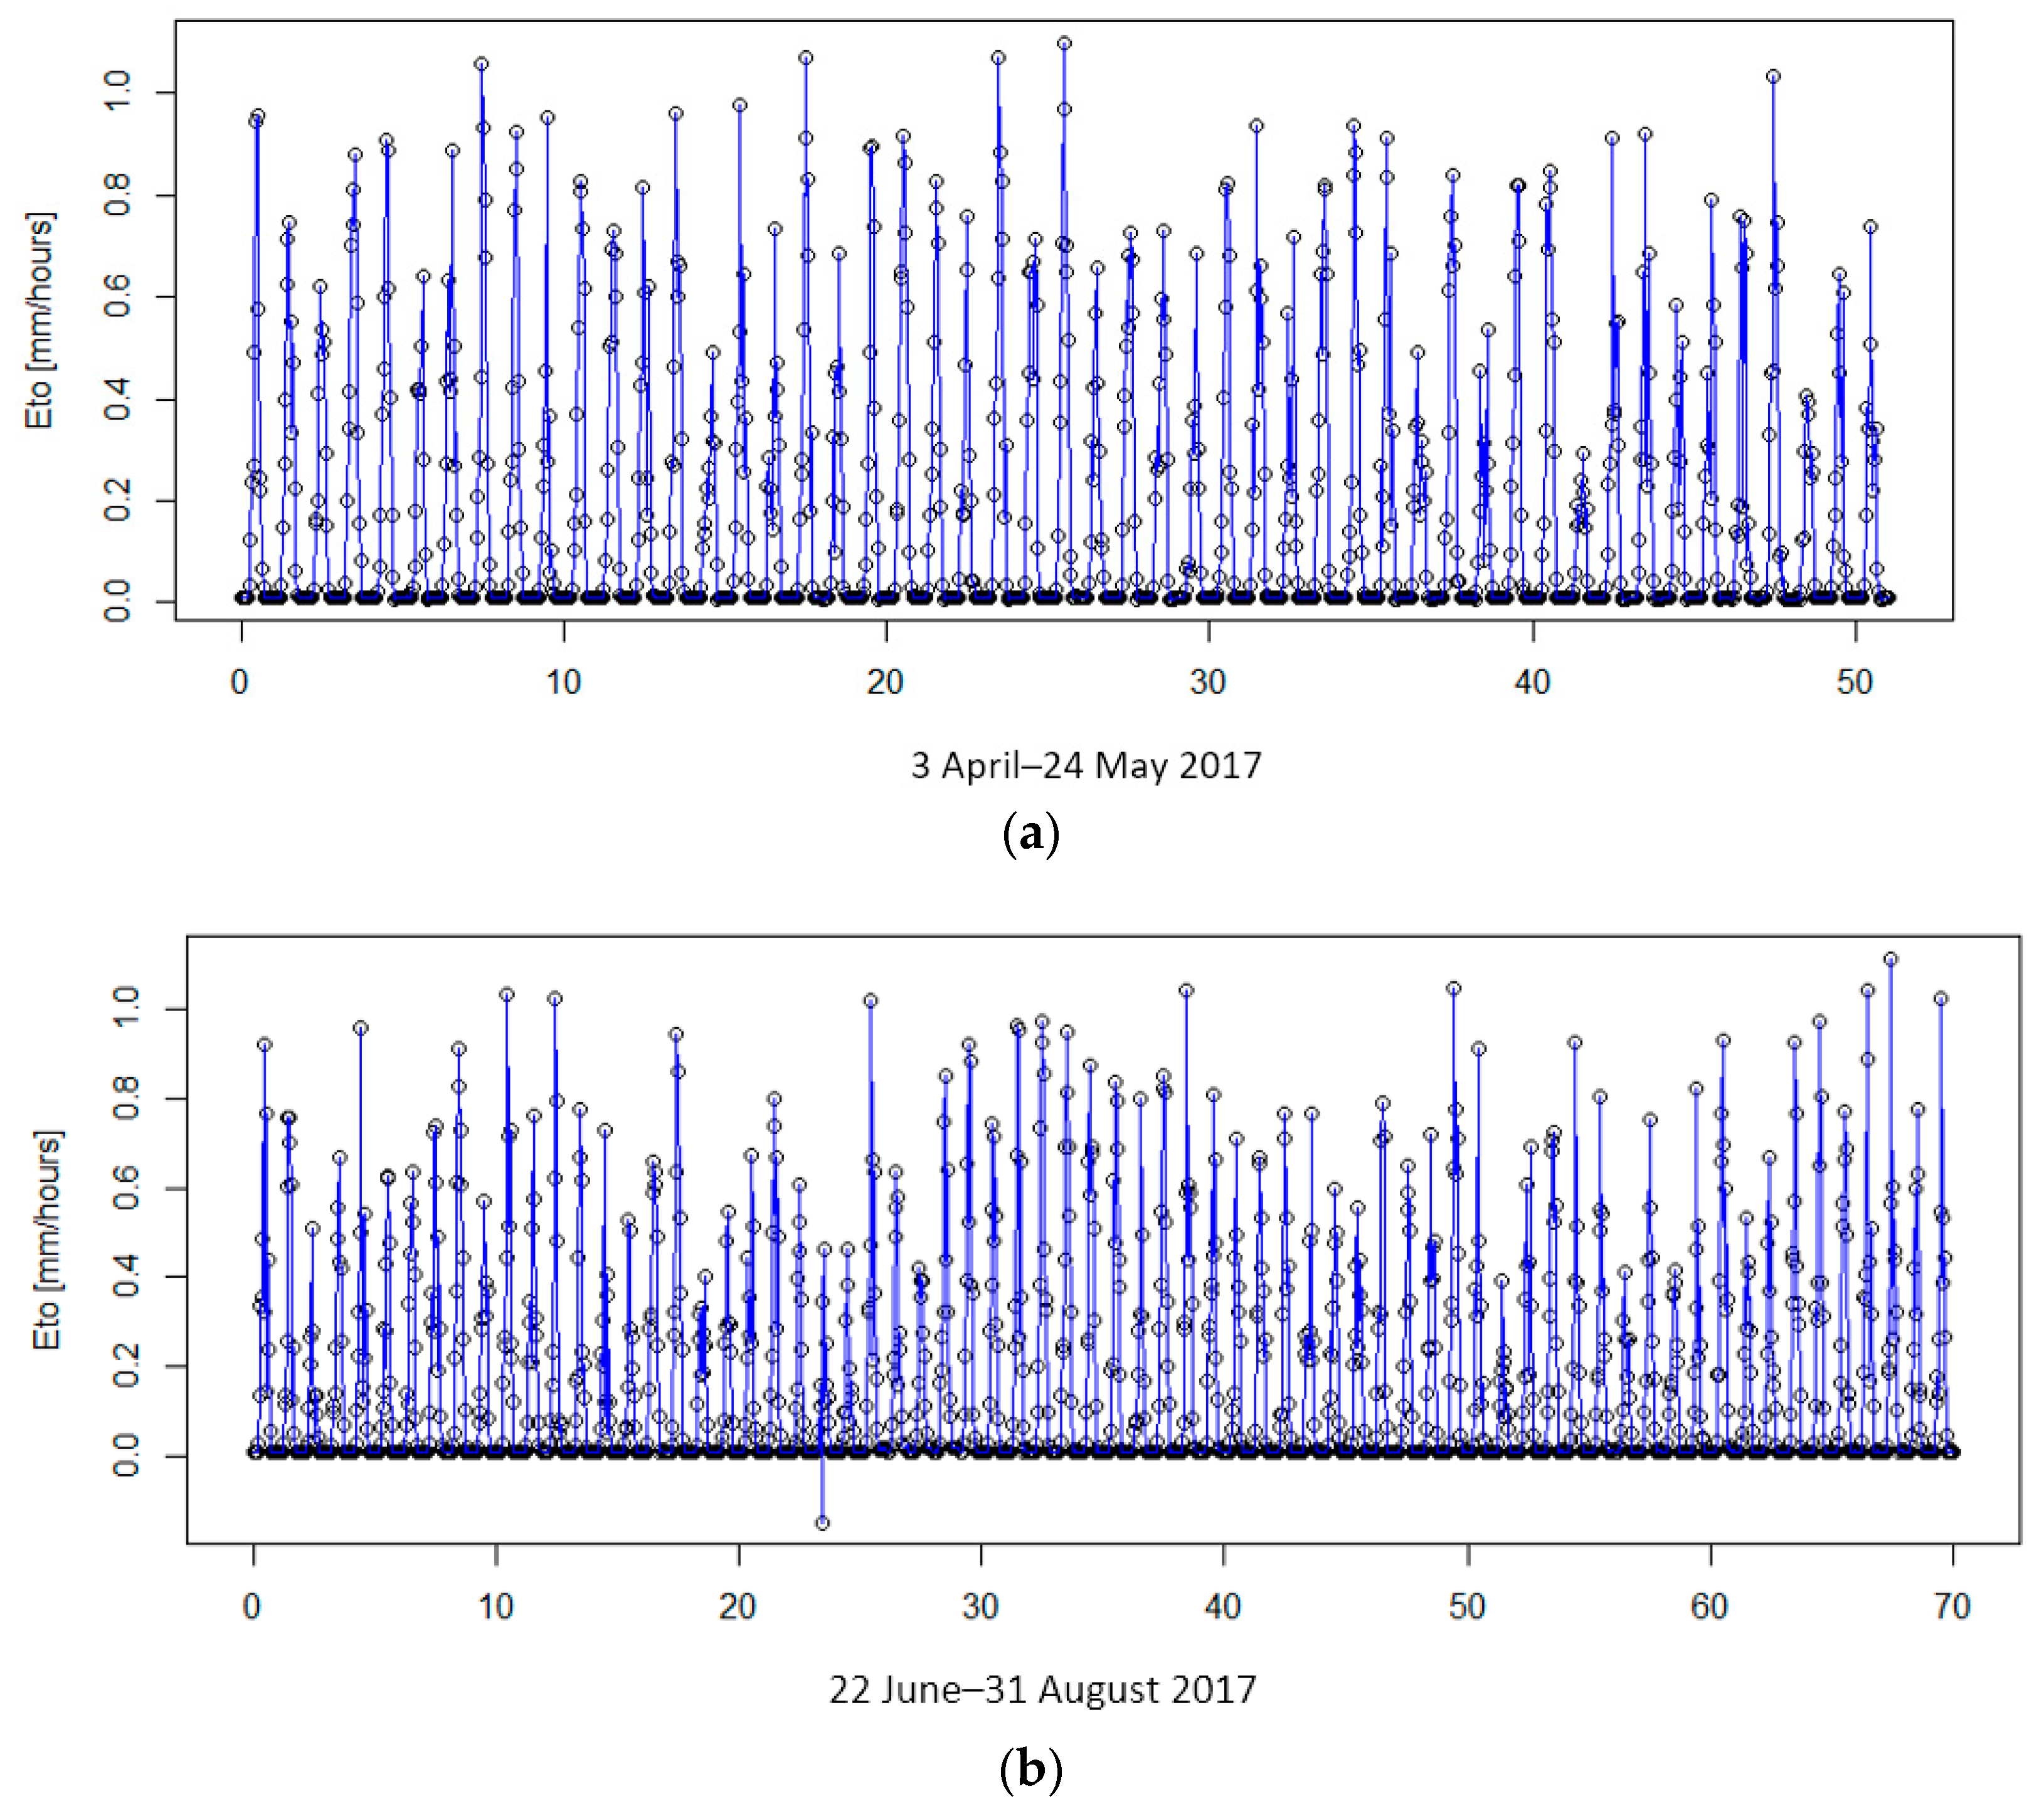
2.2. Reference Evapotranspiration (ETo) Analysis by Penman–Monteith

The reference evapotranspiration (ETo) is the main parameter of crop water usage. In this study, the ETo was calculated using the Penman–Monteith equation according to study analysis by References [17,18,19,20,21], using inputs of hourly climate data, including solar radiation, sunshine, wind speed, temperature, and relative humidity, that were observed using an automatic weather station (AWS). Climate data were collected from April–May 2017 and June–August 2017. The ETo was predicted using Equation (1) by the standardization for grass crops [17,18,19,20,21].
E T o = 0.408 × Δ ( R n G ) + γ C n T + 273 u 2 ( e s e a ) Δ + γ ( 1 + C d )
where:
  • ETo = reference evapotranspiration (mm day−1);
  • Rn = net radiation at the crop surface (MJ m−2 day−1);
  • G = soil heat flux density (MJ m−2 day−1);
  • T = mean daily air temperature at 2 m height (°C);
  • u2 = wind speed at 2 m height (m s−1);
  • es = saturation vapor pressure (kPa);
  • ea = actual vapor pressure (kPa);
  • esea = saturation vapor pressure deficit (kPa);
  • D = slope vapor pressure curve (kPa °C−1);
  • g = psychrometric constant (kPa °C−1);
  • Cn = numerator constant for reference type and calculation time step, aerodynamic resistance where the constant was 900 for daily, and 37 for hourly daytime and night-time;
  • Cd = denominator constant for reference type and calculation time step. Bulk surface resistance and aerodynamic resistance where the constant was 0.34 for daily, 0.24 for hourly daytime, and 0.96 for hourly night-time.

2.3. Root Water Uptake Analysis under Varying Crop Age and Soil Type

The crop water usage was the major formula used to calculate the water footprint in this study. The root water uptake in the oil palm root zone could be represented by the actual evapotranspiration in each root zone layer. The distribution of this root water uptake could also be determined using the water used by the oil palm which led to the emission of green or blue water. There are several methods used for measuring actual evapotranspiration (crop water usage), such as change in soil water, lysimetry, Bowen ratio-energy balance (BREB), eddy covariance, water balance, and remote sensing energy balance [21]. We have already observed the oil palm in fields, as well as the water balance at small scales (plant and root zone), using the Penman–Monteith equation. Following the procedure in [17] and R [21], we installed several soil moisture sensors in the root zone layer, following the result of oil palm root architecture [16], which we used to measure the change in soil water in the root zone. The recorded change in soil moisture was then used to adjust the coefficient of oil palm compared to the change in soil moisture using Richards’ equation [22,23,24,25].

2.3.1. Calculation of Soil Moisture Change Based on the Richards’ Equation Model under Varying Soil Type Which Depends on Soil Properties

The soil properties of the oil palm field study are denoted in Table 1.
The distribution of soil moisture in the oil palm root zone was analyzed using Richards’ equation [22,23,24,25,26,27,28] as shown below:
  • Water retention calculated by van Genuchten [24]:
    θ ( h ) = θ r + θ s θ h ( 1 + | α h | n ) m m = 1 1 n
  • Water capacity (Darcy’s law and Richards’ equation):
    C   ( h ) =   d θ   d h = α n ( θ s   θ r ) ( n 1 ) ( | h | ) n 1   [ 1 +   ( α | h | ) n ] 2 1 / n
    K   ( S e ) =   K s   × S e λ × ( 1 [ 1 S e 1 / m ] m ) 2
  • S degree of saturation [24]:
    S e =   θ ( h )   θ r θ s   θ r
  • Water flux by vertical flow of Richards’ equation:
      J w = ( K h z K )
  • Richards’ equation (positive downward): 1D vertical flow
    θ t = J w z S θ t = z ( ( K h z K ) ) S θ h = C w C w h t = z ( ( K h z K ) ) S
where:
  • K = hydraulic conductivity (cm/hour);
  • h = water pressure head (Pa);
  • θs = saturated water content (cm3/cm3);
  • θr = residual water content (cm3/cm3);
  • α = air entry value (ha = α−1);
  • n = curve gradient;
  • λ = pore-size distribution index;
  • C (h) = water capacity;
  • Se = effective saturation/degree saturation;
  • m = empirical parameters;
  • Jw = total flux (cm/hour);
  • S = sink factor, root water uptake/accumulative actual evapotranspiration (cm/hour).

2.3.2. Determination of Root Water Uptake Distribution in Root Zone

The value of root water uptake, which is considered as the actual evapotranspiration, was analyzed by the varied crop coefficient (Kc) value and ETo as shown in Equation (8) below:
E T = K c × E T o
where:
  • ET = evapotranspiration (root water uptake) (mm/hour);
  • Kc = crop coefficient;
  • ETo = reference evapotranspiration (mm/hour).
The crop coefficient based on a grass crop is the ratio of ET to ETo, which depends on nonlinear interactions of soil, crop, atmospheric conditions, and irrigation management practices [17,21]. A major uncertainty associated with using this approach is that a significant number of Kc values used in the literature were empirical and often not adapted to local conditions. Therefore, in this study, Kc was determined through the calibration between the soil moisture change model based on Richards’ equation and the soil moisture change observation based on the soil moisture sensor placed in the root zone. Based on the results, it can be deduced that the values of Kc vary between 0.68 and 0.7 for different crop ages of oil palm (7–13 years). Furthermore, the total root water uptake was partitioned along the oil palm root zone [16], which was referred to as the root density distribution.

2.4. The Monthly Oil Palm Water Footprint Analysis under Varying Crop Age and Soil Type

The water footprint concept includes green, blue, and gray water footprints (Equations (9)–(12)). Due to the absence of fertilization during the observation period, the gray water footprint was disregarded. The monthly water footprint of oil palm was determined based on Equations (10). This involved the root water uptake as evapotranspiration (mm/month) and oil palm yields (kg/month).
W F   g r e e n =   a r e a   ×   E T g r e e n Y   ( m 3 / k g )
W F   b l u e =   a r e a   ×   E T b l u e Y   ( m 3 / k g )
W F   g r e y =   α   ×   A R   / ( C m a x C n a t ) Y     ( m 3 / k g )
W F T o t a l = W F g r e e n + W F b l u e + W F g r e y
The ET green was considered as root water uptake from rainfall and ET blue from groundwater. The contribution of groundwater to oil palm was neglected because the water level depth was below 10 m, which is where the root zone only reaches a maximum of 2 m. The oil palm absorbed the water from capillary only in shallow ground water in this case < 2 m from the top soil. As well as the value of crop water used, it is necessary to determine the yield data production of oil palm in order to determine the oil palm water footprint.

3. Results

3.1. Reference Evapotranspiration (ETo) as the Main Parameter of Crop Water Usage

The ETo is the main factor used to determine the crop water requirements based on the rate of transpiration in the area. Figure 1 demonstrates the result of the ETo (mm/hour) in the study area for two consecutive observations. Figure 1a shows that the average ETo (mm/hour) between 3 April and 24 May 2017 was 0.17 mm/hour, with the minimum recorded value being 0.0068 mm/hour during the night and the maximum value of 1.099 mm/hour during the day. For the daily rate, the average ETo value was 4.18 mm/day. Figure 1b shows that the average ETo (mm/hour) during 22 June–31 August 2017 was 0.16 mm/hour, with the minimum value obtained being 0 mm/hour during the night and the maximum value being 1.114 mm/hour during the day. For the daily rate, the average ETo was 3.87 mm/day. This shows that in the field study, which is categorized in the tropical rainforest zone, there is insignificantly different rates of reference evapotranspiration.

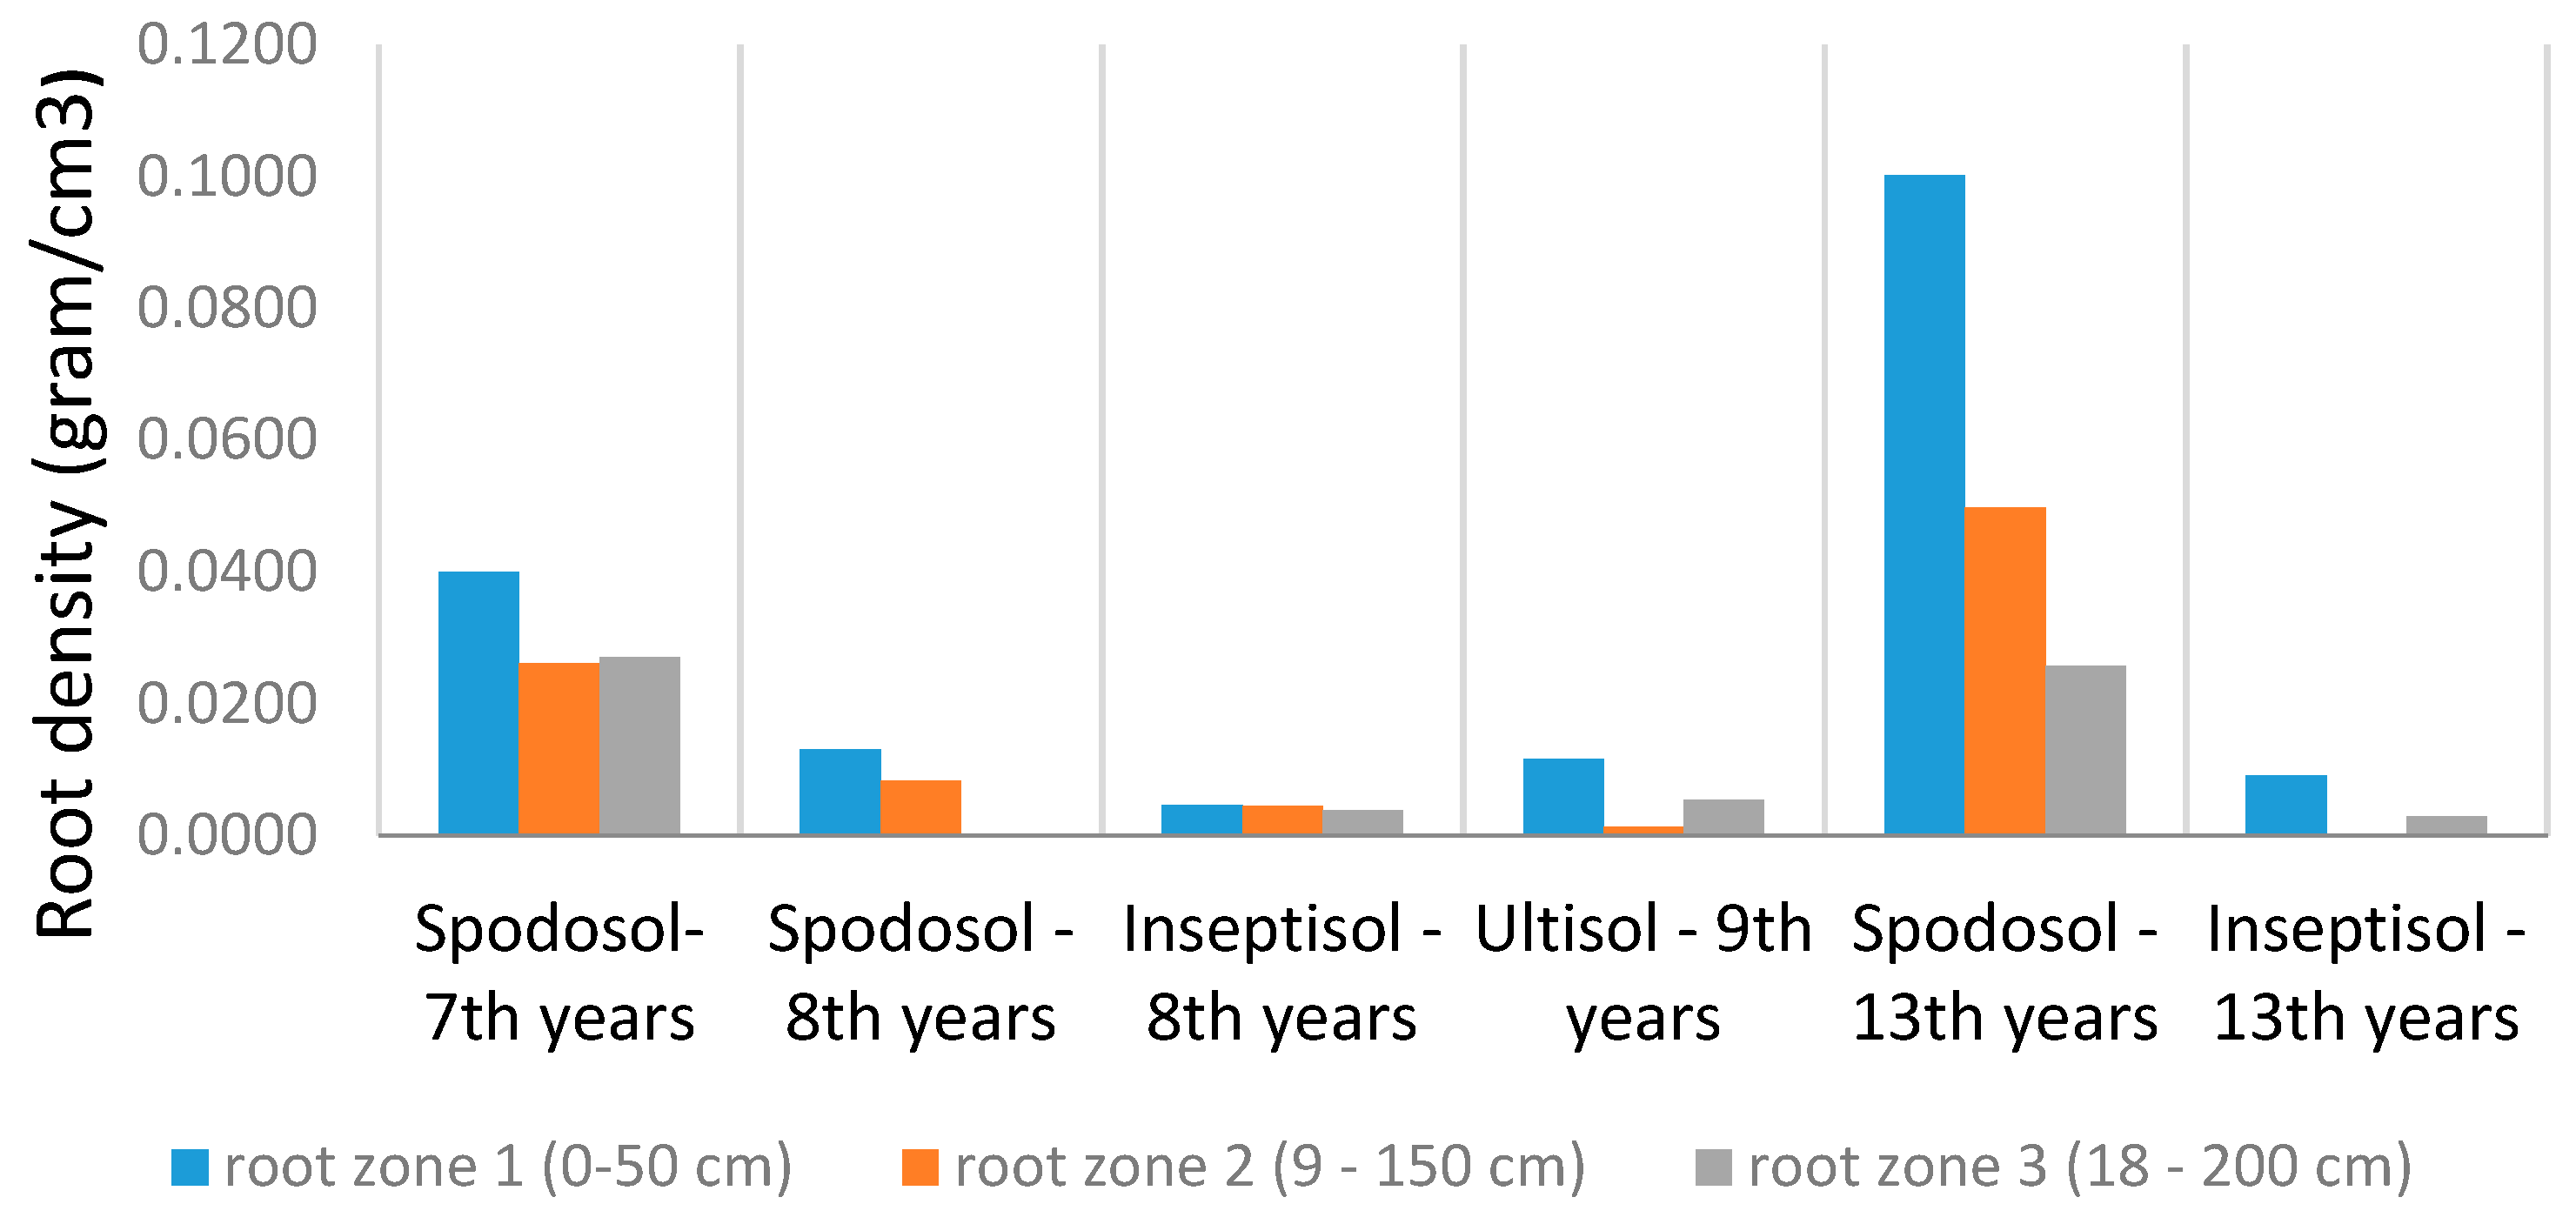
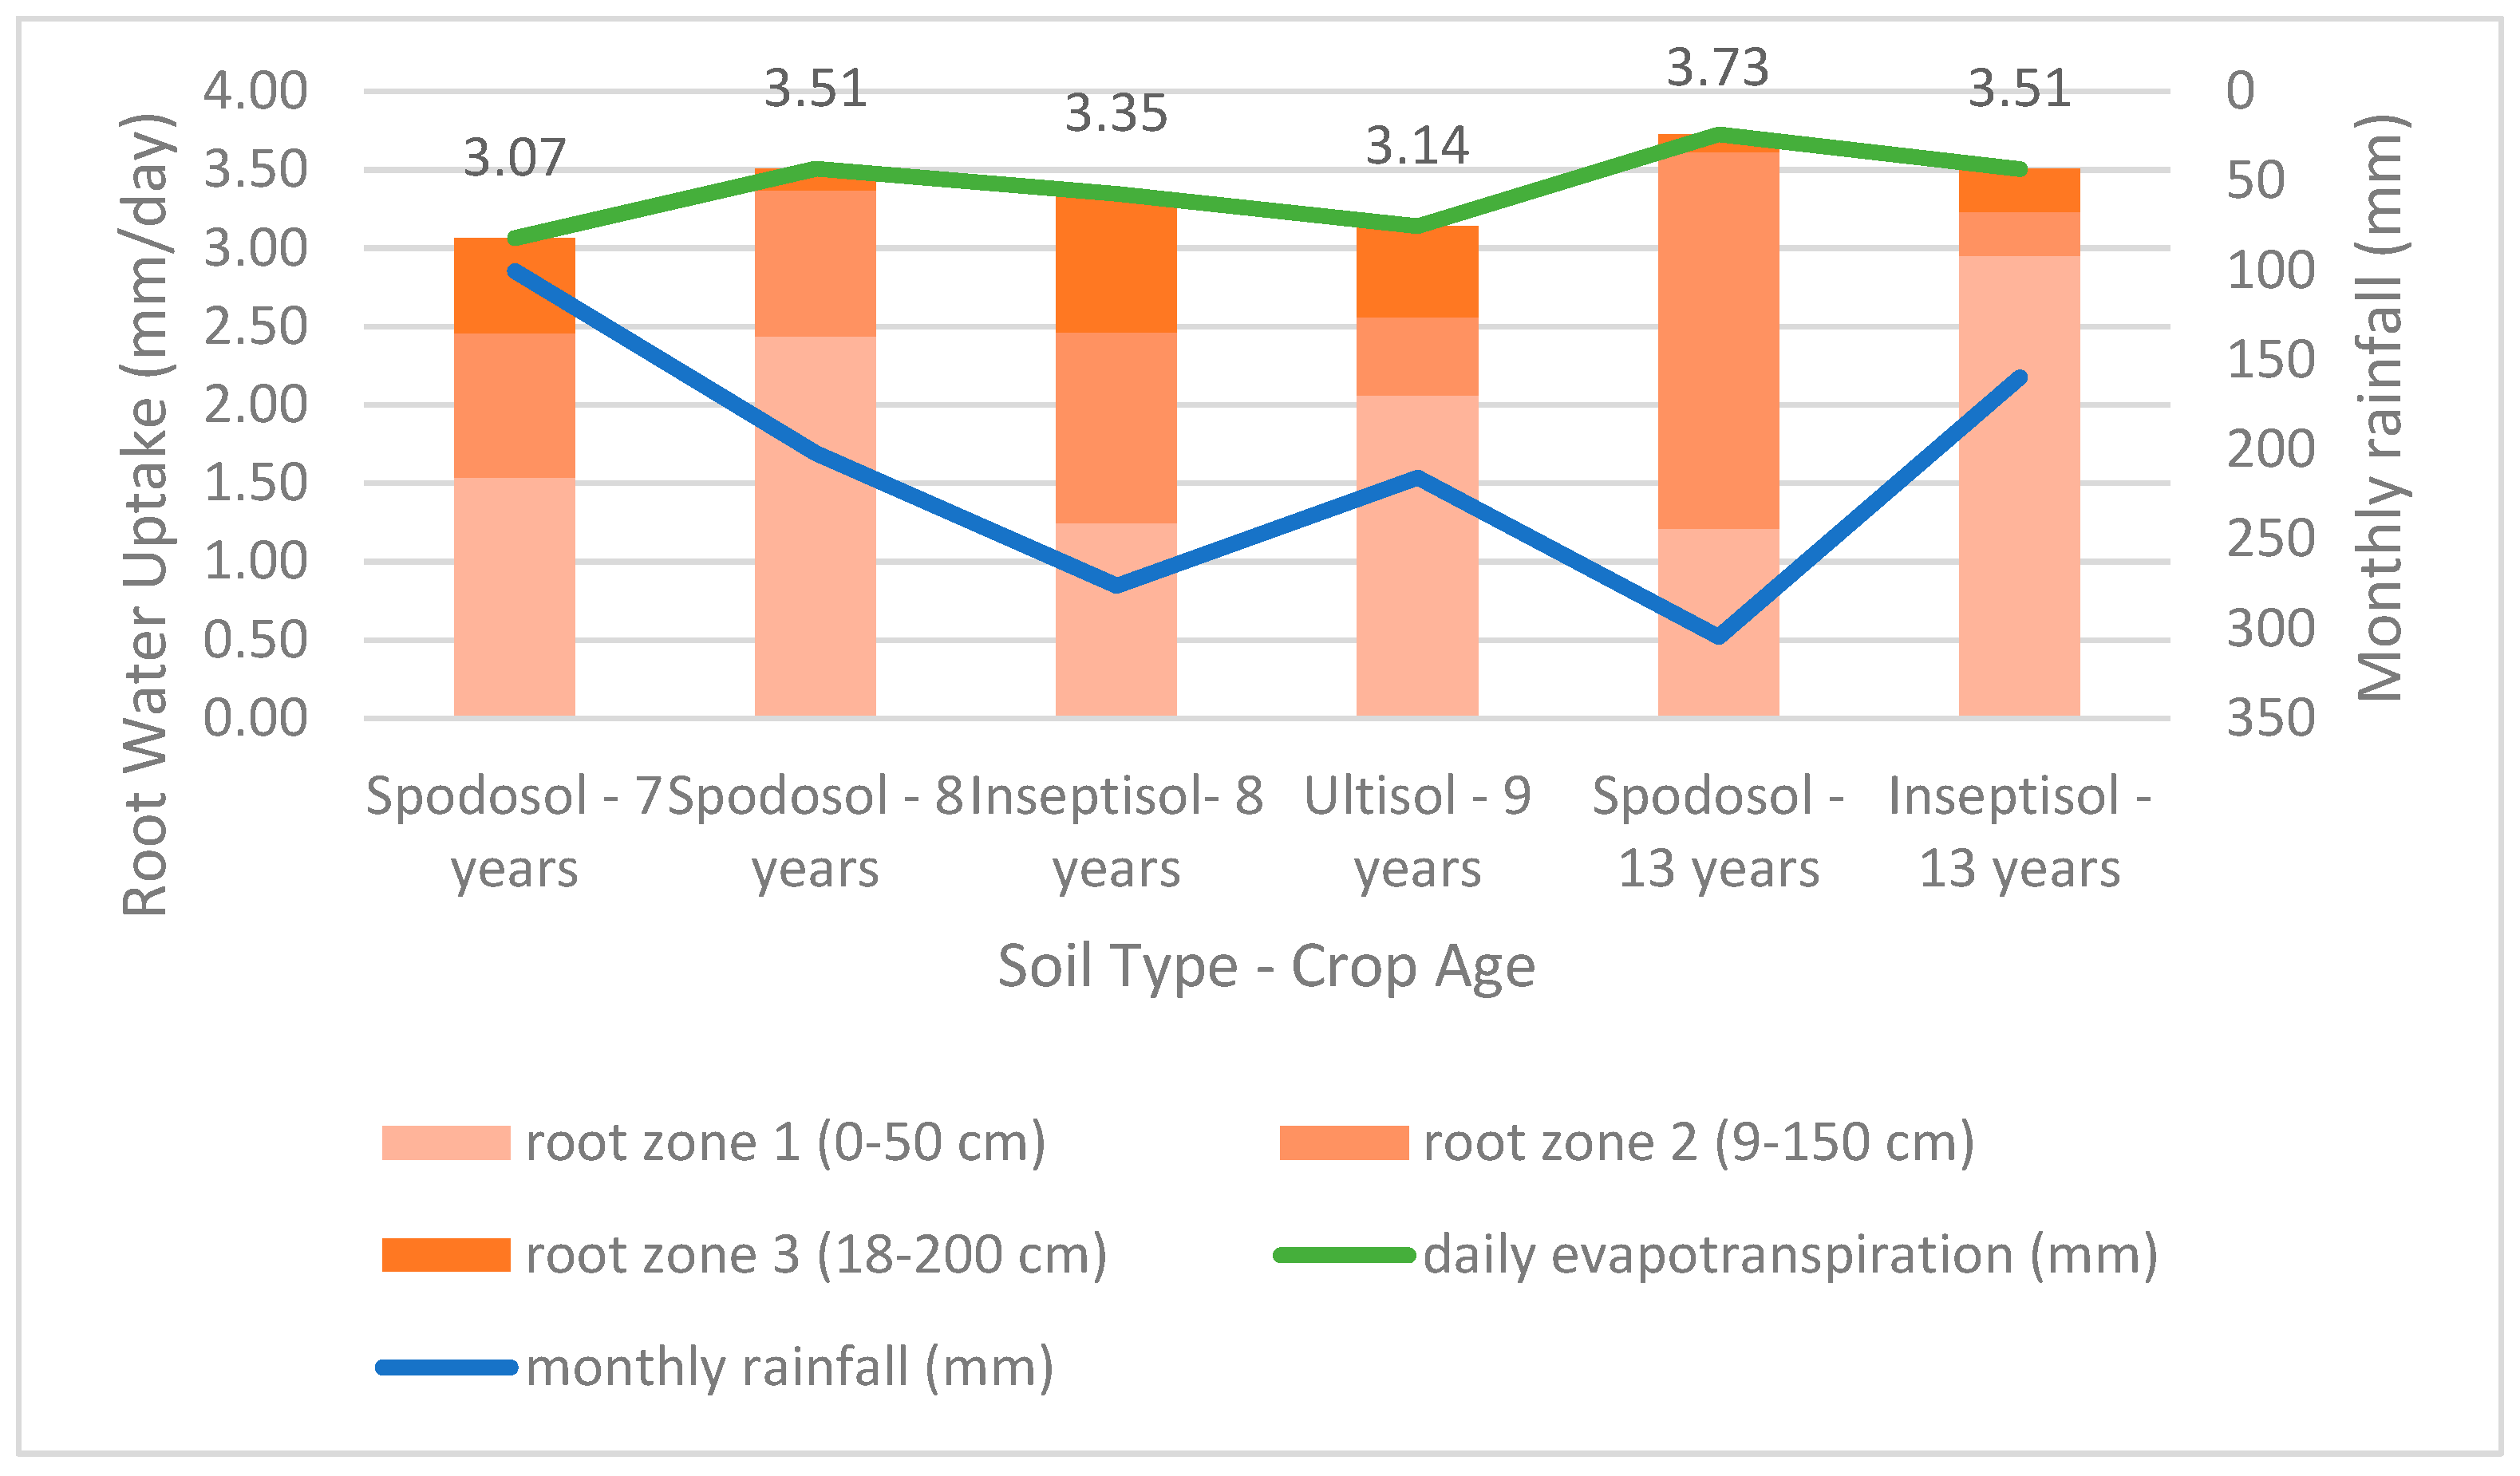
3.2. Oil Palm Root Water Uptake (mm/day) Analysis and Its Distribution in the Root Zone

The term evapotranspiration has become more common compared to the term consumptive use. ET is the same as consumptive use, with the only difference between the two being that the latter includes minor water retained in the plant tissue that is relative to the total ET [21].
In this study, the term consumptive use was represented by the root water uptake of oil palm, which is obtained from the water absorption of the root spread along the root zone. Many studies such as References have shown that the highest contribution of root extraction comes from the smaller/finer root [29,30,31]. Among the fourth level oil palm root architecture, the sizes (primary, secondary, tertiary, and quarterly root) of the tertiary and quarterly absorb more water than others [8,9,10]. A classified oil palm root zone in several types of soil and oil palm crop ages in oil palm fields in Pundu, Central Kalimantan [16], shown in Table 2.
Based on the root zone classification, some field and laboratory works were established to analyze the distribution of root density (gram/cm3) in the oil palm root zone, as displayed in Figure 2. The root density represents the mass of oil palm root for each bulk soil volume. As shown in Figure 2, the value of root density varies between 0 and 0.1 gram/cm3; it also varies with the soil type and crop age.
Among all the plants studied, the 13-yearsold oil palm in spodosol has the highest root density, with root densities of 0.1001, 0.0497, and 0.0257 gram/cm3 for the first, second, and third root zone, respectively. This was followed by the 7-years-old oil palm fruit in spodosol, which had root densities of 0.0400, 0.0262, and 0.0270 gram/cm3 for the first, second, and third root zone, respectively. The lowest root density was obtained in the 8-years-old oil palm in inceptisol, which had root densities of 0.0046, 0.0045, and 0.0038 gram/cm3 for the first, second, and third root zone, respectively. The root density was subsequently used to determine the contribution of root water uptake in the oil palm root zone.
According to the results of this study, the highest root density was in the first root zone, followed by the second root zone. Among the soil types, the spodosol contained higher root densities than the inceptisol and ultisol. As shown in Table 1, the spodosol consists of sands (89%), silt (3%), and loam (7%), while inceptisol and ultisol contain higher compositions of loam and silt. It could also be seen that the root density decreased gradually from the older to the younger oil palm plants in the same soil type.
In this study, the root water uptake is calculated based on the standard of reference evapotranspiration and crop coefficient. The root water uptake value illustrates the actual condition for adjusting the Kc value obtained by calibrating the result obtained by the soil moisture change model using Richards’ equation [22] and the sensor technique. A variety of Kc values are obtained which are between 0.68 and 0.7.
Figure 3 shows the distribution of root water uptake in the oil palm root zone. Based on this study, the average root water uptake in the observation area varies between 3.07 and 3.73 mm/day, although this depends on the crop age and soil type. The highest water consumption was by the 13-years-old oil palm in spodosol, with an average daily rate of 3.73 mm/day, followed by the 8-year-old oil palm in spodosol and the 13-years-old oil palm in inceptisol, with a value of 3.51 mm/day. The lowest measured evapotranspiration, 3.07 mm/day, was for the 7-years-old oil palm in spodosol.
The distribution of root water uptake shown in Figure 3 demonstrates that the first oil palm root layer contributes more water than the second and third layers. For example, for the 13-years-old oil palm planted in inceptisol, the root water uptake from the first root layer reached almost 85%; this was followed by the 8-years-old oil palm planted in spodosol, whose root water uptake reached 69%, the 9-years-old oil palm planted in ultisol, whose root water uptake reached 65%, and the 7-years-old oil palm planted in spodosol, whose root water uptake reached 50%. The root water uptake of the 8-years-old oil palm planted in inceptisol seemed to be distributed on the root zone layer (38%, 36%, and 26% for first, second, and third root zone, respectively), while the 13-years-old oil palm planted in spodosol had a highest contribution of root water uptake 65% from second root zone, followed by 32% and 3% from the first and third root zone.
The analysis of oil palm root water for a variety of soils and plant ages could also describe the relationship and influence between the parameters. Table 3 shows the result of the correlation test between the variables derived from soil types, such as Ks (saturated hydraulic conductivity), the total available water (TAW), plant ages, yields, and climatic factors such as rainfall. From Table 3, it can clearly be seen that there are some strong relations between the parameters and the root water uptake. The total root water uptake value has a positive correlation of 0.730 with the crop age. Inverse correlations were found between the root water uptake in zone 3 and the yields.

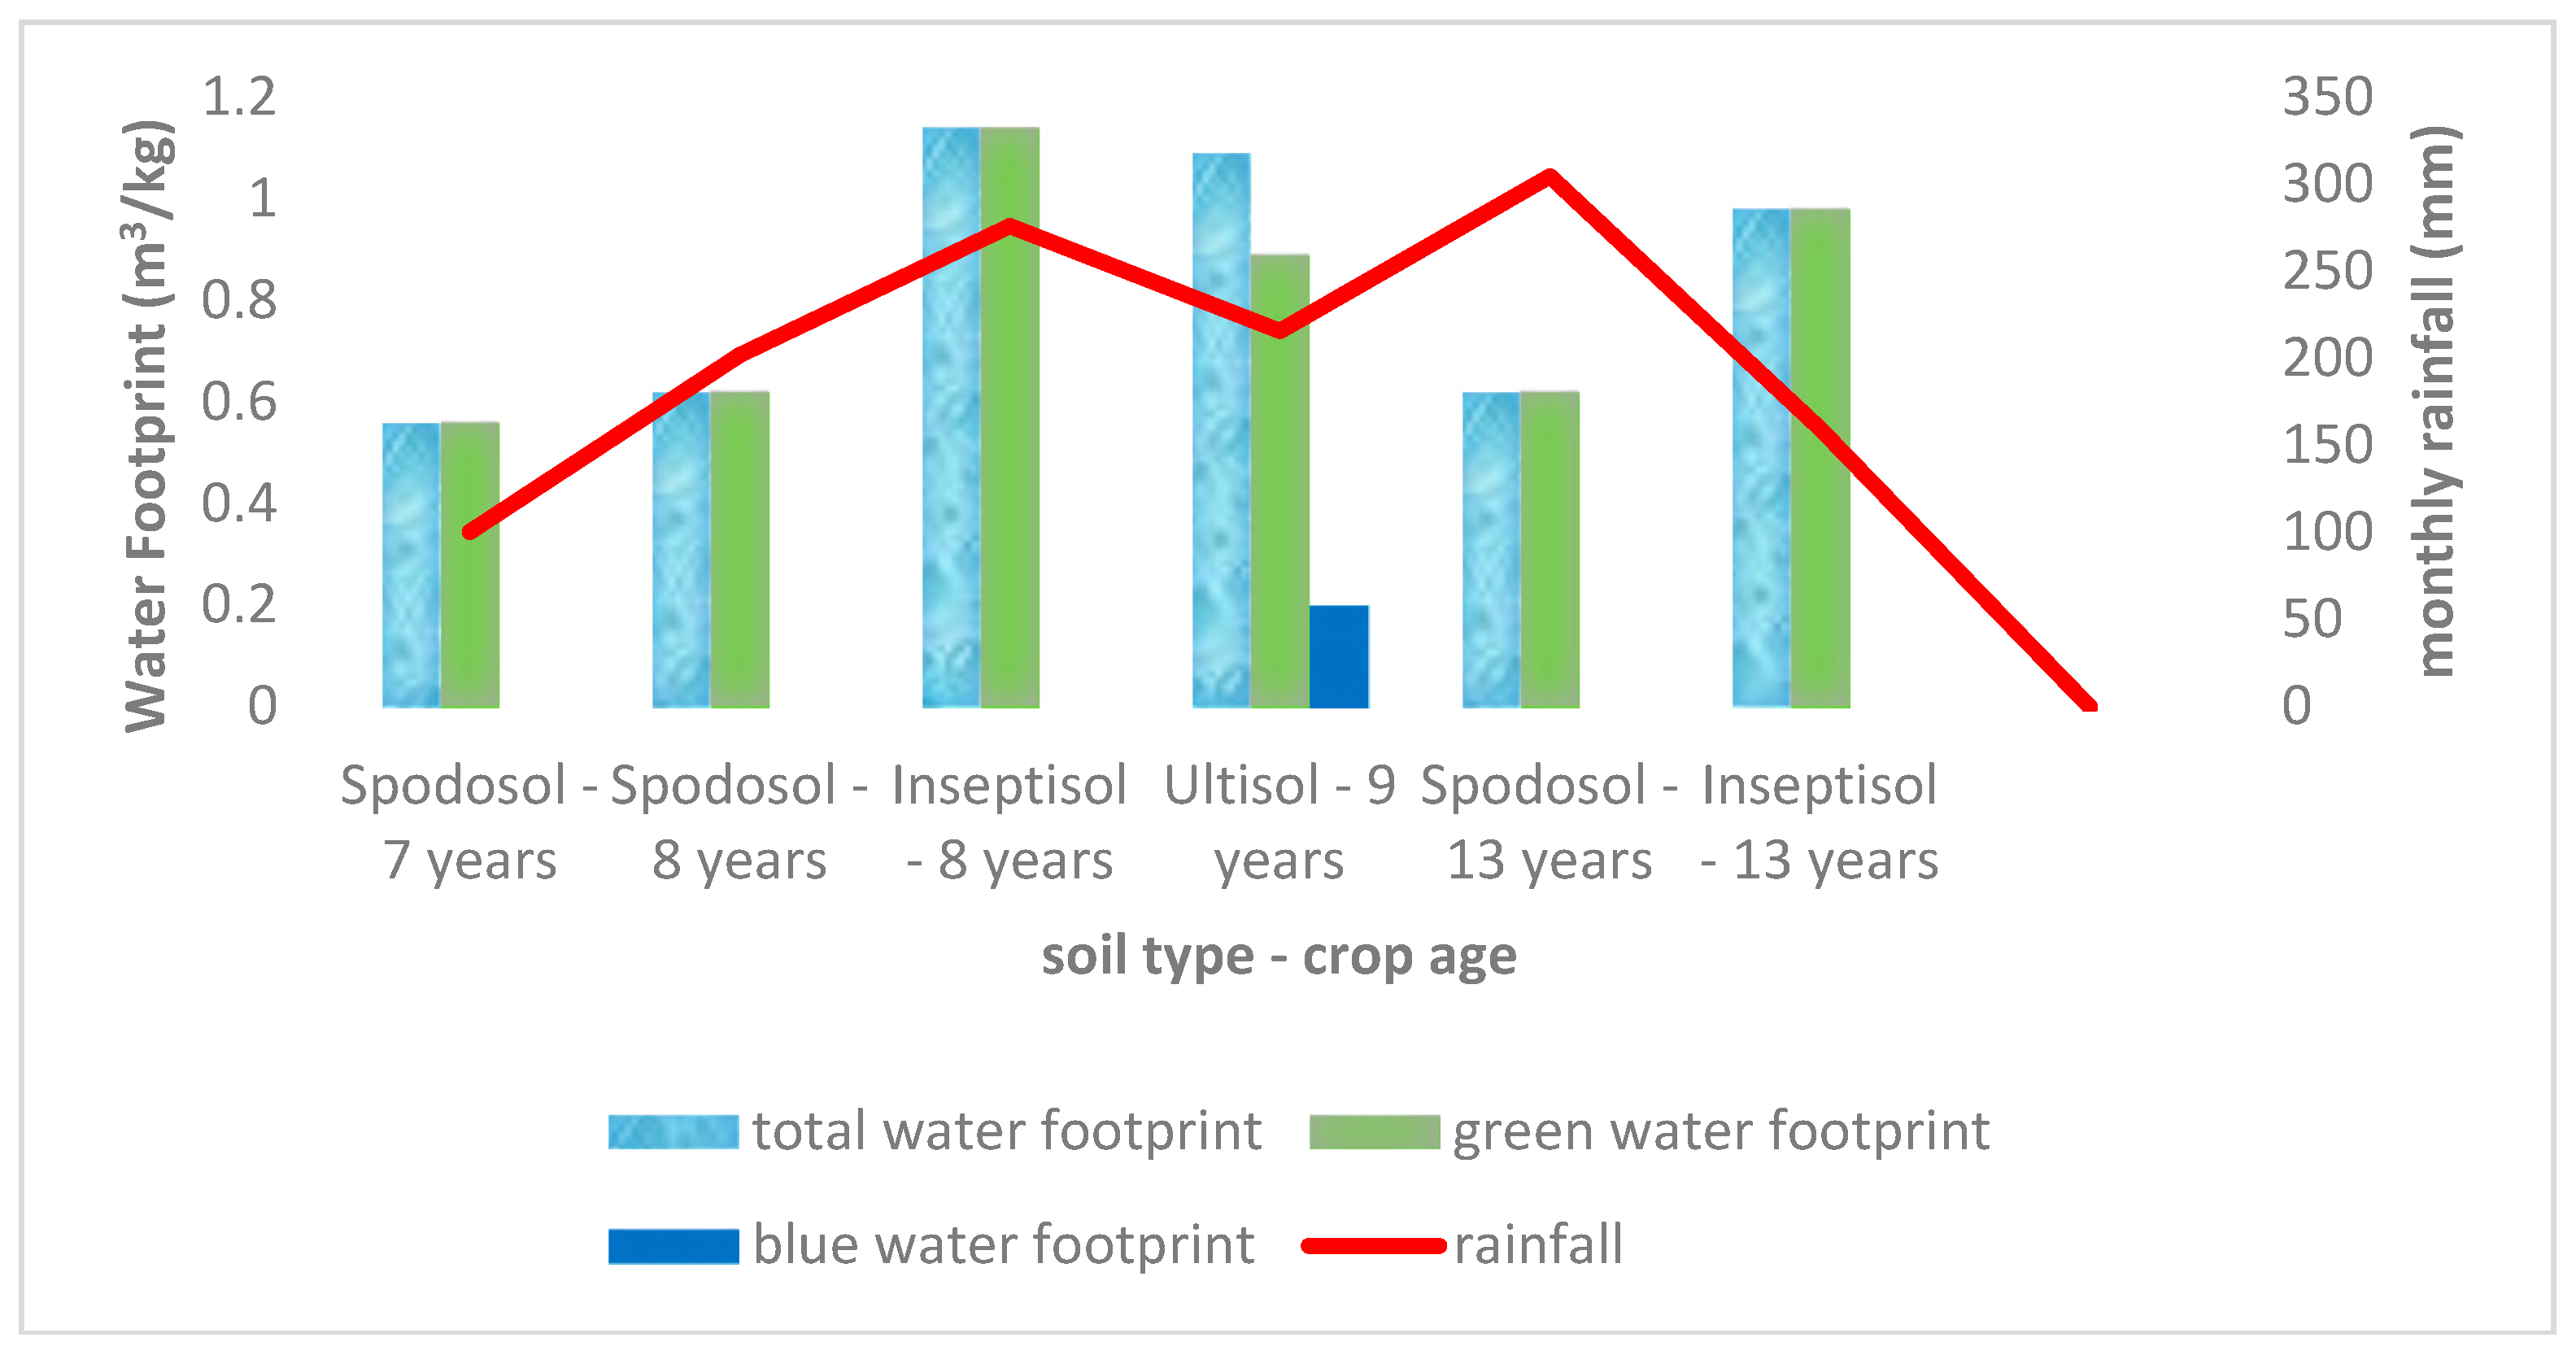
3.3. Oil Palm Water Footprint under Varying Crop Ages and Soil Types

According to the root water uptake and yield production, as shown in Table 4, the value of the oil palm water footprint could be analyzed. Figure 4 denotes the oil palm water footprint (m3/kg fresh fruit bunch [FFB]) under varying crop ages and soil types. The total water footprint of oil palm varied between 0.56 and 1.14 m3/kg, with the highest water footprint of 1.14 m3/kg being obtained for the 8-years-old oil palm in inceptisol. The lowest value, 0.56 m3/kg, was obtained for the 7-years-old oil palm in spodosol.
Figure 4 shows that the water footprint of oil palm was mostly contributed by the green water, which was pointed out by the green water footprint for 100% contribution to the water footprint. The only case in which blue water contributed to oil palm crop water usage was for the 9-years-old oil palm in ultisol, for which blue water contributed about 28% of the total water footprint.
The contribution of groundwater was neglected in areas where the water level depth was below 10 m and where the root zone only reached a maximum of 2 m for the 8-years-old and 13-years-old oil palms in inceptisol. For the spodosol, there was a spodic layer which does not allow water to flow, both as deep percolation and capillary. The blue water indicated in the 9-years-old oil palm in ultisol was present due to the existence of the shallow water table (under 2 m under the top soil). This groundwater capillary in the third oil palm root zone contributed to the root water uptake from blue water.
The analyses of the oil palm water footprint with various soil types and ages also illustrates the influential relationship between the parameters. Table 4 shows the correlation test result between the descendant variable from various soil types, such as Ks, the total available water (TAW), and plant ages, such as crop age. This also yields some climatic factors, such as rainfall. From Table 4, it can be seen that the total value of the water footprint and the green water footprint negatively correlate to the Ks value (−0.975). The blue water footprint was positively correlated with TAW, with a value of 0.977.

4. Discussion

The reference evapotranspiration performed in this study could become the parameter of drought of an area [32,33,34,35,36,37]. Due to the absence of experimental reference evapotranspiration (ETo) records, the modeling of reference evapotranspiration is reliable usually according to the standard FAO56 Penman Monteith equation (FAO56-PM) [38]. Based on the result, the average daily reference evapotranspiration obtained from both observation periods had an insignificantly different rate. According to the document of Food and Agricultural Organization FAO no. 56, the average value of ETo for tropical areas, particularly in humid and sub-humid zones ranges between 3 and 5 mm/day for moderate temperature and 5 and 7 mm/day for warm temperatures [17,39].
Actual evapotranspiration in this study referred to oil palm crop water usage, and the actual evapotranspiration is represented by root water uptake. Compared to the study presented in Johor, Malaysia where the annual crop evapotranspiration of oil palm, was calculated to be between 1100 and 1365 mm/year, or similar to 3 to 3.7 mm/day [40], the result showed in the same range. Additionally, several studies pointed out that the average oil palm crop evapotranspiration was 4.1 mm/day (between 3.5 and 5.5 mm/day) [41].
These results can also be compared with other types of plant. For example, the maximum value of daily evapotranspiration varies between 3.3 and 5.6 mm/day for rain-fed sunflower crops and between 6 and 7 mm/day for sunflower crops with optimal irrigation [42]. Similarly, the evapotranspiration of irrigated sunflower and canola crops varied between 3.6 and 10 mm/day and 2 to 11 mm/day, respectively [43]. This is similar to the values obtained for oil palm crops, with the consumptive water use of oil palm showing a lower rate.
On the other hand, comparing crop water use with forest plants shows that the level of evapotranspiration of the oil palm is slightly higher. A one-year daily observation in the Bornean tropical rainforest determined a varied evapotranspiration between 2.7 and 2.8 mm/day [44]. From the analysis obtained, it could be concluded that oil palm is not a crop with an extreme absorption rate that could be categorized as wasteful of water. Even if it could be compared to forest plants in the same location, the water absorption rate is only slightly different.
Root water uptake increases as the plant age increases and as the root becomes denser. The oil palm in spodosol absorbs more water than those in ultisol and inceptisol. This is in line with the root density level shown in Figure 1b, where the spodosol contains a higher root density than others. This is also supported by the production data in Table 5, where production over spodosol soil type is higher than in inceptisol. We can also conclude that the highest contribution of root water uptake was in the first root zone, which correlates to the root density distribution.
The findings of this study are also similar to those of one which showed that the root length density and the potential rate of root extraction decreased with the depth of the oil palm root zone [29]. The soil moisture extraction efficiency (SMEE) value increased with depth and distance from the palm. With regard to other plants, corn field extracted moisture mainly from the upper root dense soil profile when water content was in an optimal range [30]. Additionally, the distribution and density of wheat roots increases the water uptake [31].
Oil palms are often regarded as a plant capable of absorbing a large amount of water, thereby threatening the availability of ground water. From the results obtained in this study, it can be seen that oil palms display a low level of root water uptake when compared to other oil-producing plants, such as sunflower and canola. The distribution of the root water uptake of oil palm plants is mainly from the upper root zone layer. In the first layer, soil moisture comes from rainfall, while in the second and third layers, it comes from either rainwater with deep percolation or the capillary from ground water from a shallow water level with a maximum depth of roots.
The amount of crop water used by the root water uptake is used to analyze the oil palm water footprint with the supported production data listed in Table 4. The water footprint analysis in this research study is based on a specific location and a partial temporal climate. Studies related to crop water footprints mostly provide the global annual result by ignoring temporal aspects and other influential factors. However, in some areas, such as the Kalimantan region, the temporal aspects and local climate data vary greatly and affect the consumption and use of water as a major factor in the crop water footprint.
The pattern of the crop water footprint changes considerably with higher temporal resolution [6]. These changes are also shown to be sensitive to crop types due to different growth patterns leading to an increasing or decreasing water footprint. In line with this opinion, the results of this study show that there are variations in water footprint values for various conditions that represent the differences in rainfall, soil type, and growth of oil palm plantations.
The water footprint of the oil palm fresh fruit bunch for the spodosol soil type is lower than that for the inceptisol and ultisol soil types. With the same type of soil, younger plants have a higher water footprint, as shown in Figure 4. The crop water footprint is mainly driven by yield trends, while evapotranspiration plays a minor role in the annual water crop analysis for the wheat, rice, and maize and soybean footprint. Apart from correlations with yield and irrigation volume, the water footprint values are not correlated to soil properties [45]; however, it can be seen in Figure 3 that root water uptake varies.
Therefore, if drawn on the annual global scale, there will be a huge significant difference between these variables. The process of root water uptake analysis itself is strongly influenced by climatic factors, soil physical properties, and plant coefficient factors. In this analysis, the discovery of variations in root water uptake and water footprint values at the local and temporal scale could enrich the understanding of the water footprint of oil palm plants in particular, as well as other types of plants.
Another interesting fact worthy of discussion in this research study is the percentage contributions from each element of water (green, blue, and gray) to the total water footprint value of oil palm with variations in age and soil type. As shown in Figure 4, assuming no fertilization occurred during the observation process, the gray water footprint contribution would be 0%, while the green temporal water footprint reached would be 100% of the total water footprint for almost all variations.
In this oil palm water footprint analysis, the range of blue water footprint is relatively small. In its annual scope, the green, blue, and gray water footprints were 876.6, 35.9, and 91 m3 ton−1, respectively, and the contributions were 87.3%, 3.6%, and 9% for the case study in the oil palm plantation in Pundu, Central Borneo [46]. Additionally, the composition of the green, blue, and gray water footprint to be 68%, 18%, and 14% of the total average of the water footprint from several provinces in Thailand, respectively [47].
The crop water footprint for tomato cultivation showed the highest variability found in the water footprint green component, which ranged from 5% to 45.2% [45]. The blue water footprint ranged from 14.3% to 63.6% and the gray water footprint from 23.8% to 46.5% of the total water footprint. Therefore, it could be said that the range of groundwater use in oil palm plants in this study is relatively small. With no irrigation activities in the field, the possibility of using blue water only comes from the capillarity of groundwater.
The total value of the water footprint, the use of green and blue water, and the distribution of root water uptake in the rooting layers of the oil palm could be described as an indication of environmental sustainability. The various negative issues associated with the absorption of water by oil palm plants are inversely proportional to the results obtained in this study. The root water uptake of the oil palm is relatively low compared to that of other food crops. Additionally, the maximum level of water absorbed in the upper root zone also shows that oil palm plants absorb a lot of rainwater (green water), which is fast circle, compared to ground water (blue water), which is long circle.

5. Conclusions

  • Oil palm water usage in the observation area varies within different crop ages and soil types from 3.07 to 3.73 mm/day. The highest water usage was contributed by the 13-years-old oil palm in spodosol soil, with an average daily water usage of 3.73 mm/day. This was followed by the 8-years-old oil palm in spodosol soil and the 13-years-old oil palm in inceptisol soil, with a value of 3.51 mm/day. The lowest evapotranspiration was represented by the 7-years-old oil palm in spodosol soil, with a value of 3.07 mm/day. At the same soil type, the root water uptake of the oil palm increases as the plant age increases and as the root becomes denser, but there is no soil type parameter that showed a significant correlation with the root water uptake.
  • The water usage of the oil palm is distributed along the root zone in line with the root density. The upper zone of the oil palm root zone contributes more root water uptake (more than 50% of total) than the middle and the lower root zone. It can be concluded that the highest contribution of oil palm water usage was in the first root zone, which correlates to the root density distribution. The distribution of root water uptake in the rooting layers of the oil palm could be described as an indication of environmental sustainability.
  • The total water footprint of the oil palm fresh fruit bunch ranged from 0.56 to 1.14 m3/kg for various plant ages and soil types. With higher yields, it can be concluded that the water footprint value of the oil palm fresh fruit bunch for spodosol soil types is lower than the inceptisol and ultisol soil types. It can also be stated that the plants with younger ages have relatively higher water footprint values for the same soil types. The water footprint value illustrates the efficiency of water use by plants; the higher the productivity, the larger the amount of water used. The variations in the water footprint values at the local and temporal scale could enrich the understanding of the water footprint of oil palm plants in particular, as well as other types of plants.
  • Green water contribution reached 82–100% to the total water footprint, while the blue water reached 0–28% of the total water footprint. The green water footprint reached 100% for all observed variations except for the 9-years-old oil palm in ultisol (25% blue water contribution rate out of the total water footprint due to the presence of shallow ground water with a depth of <2 m). This study showed that the source of green water from the upper oil palm root zone delivers the highest contribution for oil palm root water uptake than the blue water. The detailed description of the water footprint value could be a parameter for assessing environmental sustainability as an implication of oil palm plantations in certain regions.

Author Contributions

Conceptualization, L.S. and H.H.; Data curation, V.K.; Formal analysis, V.K.; Project administration, A.K.; Supervision, S.P.; Writing–original draft, L.S.; Writing–review and editing, S.K.S.

Funding

This research was funded by Oil Palm Plantation Fund Management Agency (BPDPKS), Indonesia grant number [PRJ-44/DPKS/2016].

Acknowledgments

This research and publication was fully supported by the Oil Palm Plantation Fund Management Agency (BPDPKS), Indonesia. We also thank our colleagues from PT Bumitama Gunajaya Agro, Indonesia, who provided the location, accommodation, and labors that greatly assisted the research. We thank our colleagues Rudyanto and Andiko Putro Suryotomo for assistance with the running of data analysis using R in finite different method and Willy Bayuardi Suwarno for his reviews and suggestions while preparing this manuscript.

Conflicts of Interest

The authors declare no conflict of interest. The founding sponsors had no role in the design of the study; in the collection, analyses, or interpretation of data; in the writing of the manuscript, and in the decision to publish the results.

References

  1. Directorate General of Estate Crop Republik of Indonesia. The Statisitic of Indonesia Plantation; Indonesia Ministry of Agriculture: Jakarta, Indonesia, 2018; p. 5.
  2. Hoekstra, A.Y.; Chapagain, A.K.; Aldaya, M.M.; Mekonnen, M.M. Water Footprint Manual State of the Art; Water Footprint Network: Enschede, The Netherlands, 2009. [Google Scholar]
  3. Hoekstra, A.Y.; Chapagain, A.K.; Aldaya, M.M.; Mekonnen, M.M. The Water Footprint Assessment Manual; Water Footprint Network: Enschede, The Netherlands, 2011. [Google Scholar]
  4. Jeswani, H.K. Azapagic Water footprint: Methodologies and a case study for assessing the impacts of water use. J. Clean. Prod. 2011, 11, 1288–1299. [Google Scholar] [CrossRef]
  5. Cosentino, C.; Adduci, F.; Musto, M.; Paolino, R.; Freschi, P.; Pecora, G.; D’adamo, C.; Valentini, V. Low vs high “water footprint assessment” diet in milk production: A comparison between triticale and corn silage based diets. Emirates J. Food Agric. 2015, 27, 312–317. [Google Scholar] [CrossRef]
  6. Pfister, S.; Bayer, P. Monthly water stress: Spatially and temporally explicit consumptive water footprint of global crop production. J. Clean. Prod. 2014, 73, 52–62. [Google Scholar] [CrossRef]
  7. Mekonnen, M.M.; Hoekstra, A.Y. The Green, Blue and Gray Water Footprint of Crops and Derived Crop Products; Volume 1: Main Repport Value of Water Research Report Series No. 47; Twente Water Centre; University of Twente: Enschede, The Netherlands, 2010. [Google Scholar]
  8. Jourdan, C.; Ferrière, N.M.; Perbal, G. Root System Architecture and Gravitropism in the Oil Palm. Ann. Bot. 2000, 85, 861–868. [Google Scholar] [CrossRef] [PubMed] [Green Version]
  9. Jourdan, C.; Rey, H. Architecture and development of the oil-palm (Elaeis guineensis Jacq.) Root System. Plant Soil 1997, 189, 33–48. [Google Scholar] [CrossRef]
  10. Lynch, J. Root architecture and plant productivity. Plant Physiol. 1995, 109, 7–13. [Google Scholar] [CrossRef] [PubMed]
  11. Wigena, I.D.P.; Sudrajat Sitorus, S.R.P.; Siregar, H. Soil and Climate Characterization and Its Suitability for Nucleus Smallholder Oil Palm at Sei Pagar, Kampar District, Riau Province. J. Soil Clim. 2009, 30, 1–16. [Google Scholar]
  12. Kasno, A.; Subardja, D. Soil fertility and nutrient management on spodosol for oil palm. Agrivita 2010, 32, 285–292. [Google Scholar]
  13. Lubis, A.R. Kelapa Sawit di Indonesia; Pusat Penelitian Bandar Kuala Marihat: Pematang Siantar, Sumatera Utara, Indonesia, 2008. [Google Scholar]
  14. Wiratmoko; Darlan, N.H.; Winarna Purba, A.R. Teknologi Pengelolaan Lahan Sub Optimal untuk Optimalisasi Produksi Kelapa Sawit. In , Proceedings of Seminar Optimalisasi Pemanfaatan Lahan Marginal untuk Usaha Perkebunan, Surabaya, Indonesia, 29–30 April 2015. [Google Scholar]
  15. Nasrul, B.; Hamzah, A.; Anom, E. Klasifikasi tanah dan evaluasi kesesuaian lahan Kebun Percobaan Fakultas Pertanian Universitas Riau. Jurnal Sagu 2002, 2, 16–26. [Google Scholar]
  16. Safitri, L.; Suryanti, S.; Kautsar, V.; Kurniawan, A.; Santiabudi, F. Study of oil palm root architecture with variation of crop stage and soil type vulnerable to drought. In Conference Series: Earth and Environmental Science, Bogor, Indonesia; IOP: Bogor, Indonesia, 2018. [Google Scholar]
  17. Allen, R.G.; Pereira, L.S.; Raes, D.; Smith, M. Crop Evapotranspiration-Guidelines for Computing Crop Water Requirements-FAO Irrigation and Drainage Paper 56; FAO: Rome, Italy, 1998; Volume 300, p. D05109. [Google Scholar]
  18. Walter, I.A.; Allen, R.G.; Elliott, R.; Jensen, M.E.; Itenfisu, D.; Mecham, B.; Spofford, T. ASCE’s standardized reference evapotranspiration Equation. In Watershed Management and Operations Management; ASCE Press: Reston, VA, USA, 2000; pp. 1–11. [Google Scholar]
  19. FAO. Irrigation and Drainage Paper: Crop Evapotranspiration; Water Resources; Development and Management Service: Rome, Italy, 2006. [Google Scholar]
  20. Pereira, L.S.; Allen, R.G.; Smith, M.; Raes, D. Crop evapotranspiration estimation with FAO56, Past and future. Agric. Water Manag. 2015, 147, 4–20. [Google Scholar] [CrossRef]
  21. Jensen, M.E.; Allen, R.G. (Eds.) Evaporation, Evapotranspiration, and Irrigation Water Requirements; American Society of Civil Engineers: Reston, VA, USA, 2016. [Google Scholar]
  22. Richards, L.A. Capillary Conduction of Liquids through Porous Mediums. Physics 1931, 1, 318–333. [Google Scholar] [CrossRef]
  23. Mualem, Y. A new model for predicting the hydraulic conductivity of unsaturated porous media. Water Resour. Res. 1976, 12, 513–522. [Google Scholar] [CrossRef]
  24. Van Genuchten, M.T. A closed-form Equation for predicting the hydraulic conductivity of unsaturated soils. Soil Sci. Soc. Am. J. 1980, 44, 892–898. [Google Scholar] [CrossRef]
  25. Van Genuchten, M.T.; Nielsen, D.R. On describing and predicting the hydraulic propertis of unsaturated soils. Ann. Geophys. 1985, 3, 615–628. [Google Scholar]
  26. Feddes, R.A.; Raats, P.A.C. Parameterizing the soil-water-plant root system. In Unsaturated Zone Modeling: Progress, Challenges and Applications; Feddes, R.A., de Rooij, G.H., van Dam, J.C., Eds.; Wageningen UR Frontis Series; Kluwer Academic Publ.: Dordrecht, The Netherlands, 2004; pp. 95–141. [Google Scholar]
  27. Huang, R.Q.; Wu, L.Z. Analytical solutions to 1-D horizontal and vertical water infiltration in saturated/unsaturated soils considering time-varying rainfall. Comput. Geotech. 2012, 39, 66–72. [Google Scholar] [CrossRef]
  28. Safitri, L.; Hermantoro Purboseno, S.; Kautsar, V.; Wijayanti, Y.; Ardiyanto, A. Development of oil palm water balance tool for predicting water content distribution in root zone. IJETS 2018, 5, 38–45. [Google Scholar]
  29. Nodichao, L.; Chopart, J.L.; Roupsard, O.; Vauclin, M.; Aké, S.; Jourdan, C. Genotypic variability of oil palm root system distribution in the field. Consequences for water uptake. Plant Soil 2011, 341, 505–520. [Google Scholar] [CrossRef]
  30. Yadav, B.K.; Mathur, S. Modeling soil water uptake by plants using nonlinear dynamic root density distribution function. J. Irrig. Drain. Eng. 2008, 134, 430–436. [Google Scholar] [CrossRef]
  31. White, R.G.; Kirkegaard, J.A. The distribution and abundance of wheat roots in a dense, structured subsoil–implications for water uptake. Plant Cell Environ. 2010, 33, 133–148. [Google Scholar] [CrossRef]
  32. Ortega-Farias, S.; Irmak, S.; Cuenca, R.H. Special issue on evapotranspiration measurement and modeling. Irrig. Sci. 2009, 28, 1–3. [Google Scholar] [CrossRef] [Green Version]
  33. Croitoru, A.E.; Piticar, A.; Dragotă, C.S.; Burada, D.C. Recent changes in reference evapotranspiration in Romania. Glob. Planet. Chang. 2013, 111, 127–136. [Google Scholar] [CrossRef]
  34. Vicente-Serrano, S.M.; Beguería, S.; Lorenzo-Lacruz, J.; Camarero, J.J.; López-Moreno, J.I.; Azorin-Molina, C.; Revuelto, J.; Morán-Tejeda, E.; Sanchez-Lorenzo, A. Performance of drought indices for ecological, agricultural, and hydrological applications. Earth Interact. 2012, 16, 1–27. [Google Scholar] [CrossRef]
  35. Vicente-Serrano, S.M.; Van der Schrier, G.; Beguería, S.; Azorin-Molina, C.; Lopez-Moreno, J.I. Contribution of precipitation and reference evapotranspiration to drought indices under different climates. J. Hydrol. 2015, 526, 42–54. [Google Scholar] [CrossRef] [Green Version]
  36. Cook, B.I.; Smerdon, J.E.; Seager, R.; Coats, S. Global warming and 21 st century drying. Clim. Dyn. 2014, 43, 2607–2627. [Google Scholar] [CrossRef]
  37. Senay, G.B.; Verdin, J.P.; Lietzow, R.; Melesse, A.M. Global daily reference evapotranspiration modeling and evaluation. JAWRA J. Am. Water Resour. Assoc. 2008, 44, 969–979. [Google Scholar] [CrossRef]
  38. Martí, P.; González-Altozano, P.; López-Urrea, R.; Mancha, L.A.; Shiri, J. Modeling reference evapotranspiration with calculated targets. Assessment and implications. Agric. Water Manag. 2015, 149, 81–90. [Google Scholar] [CrossRef]
  39. Jhajharia, D.; Dinpashoh, Y.; Kahya, E.; Singh, V.P.; Fakheri-Fard, A. Trends in reference evapotranspiration in the humid region of northeast India. Hydrol. Process. 2012, 26, 421–435. [Google Scholar] [CrossRef]
  40. Yusop, Z.; Chong, M.H.; Garusu James, G.; Katiomon, A. Estimation of evapotranspiration in oil palm catchment by short-time period water-budget method. Malays. J. Civ. Eng. 2008, 20, 160–174. [Google Scholar]
  41. Carr, M. The Water Relations and Irrigation Requirements of Oil Palm (Elaeis Guineensis): A Review. Exp. Agric. 2011, 47, 629–652. [Google Scholar] [CrossRef]
  42. Matev, A.; Petrova, R.; Kirchev, H. Evapotranspiration of sunflower crops depending on irrigation. Agric. Sci. Technol. 2012, 4, 1313–8820. [Google Scholar]
  43. Sánchez, J.M.; López-Urrea, R.; Rubio, E.; González-Piqueras, J.; Caselles, V. Assessing crop coefficients of sunflower and canola using two-source energy balance and thermal radiometry. Agric. Water Manag. 2014, 137, 23–29. [Google Scholar] [CrossRef]
  44. Kume, T.; Tanaka, N.; Kuraji, K.; Komatsu, H.; Yoshifuji, N.; Saitoh, T.M.; Suzuki, M.; Kumagai, T.O. Ten-year evapotranspiration estimates in a Bornean tropical rainforest. Agric. For. Meteorol. 2011, 151, 1183–1192. [Google Scholar] [CrossRef]
  45. Evangelou, E.; Tsadilas, C.; Tserlikakis, N.; Tsitouras, A.; Kyritsis, A. Water footprint of industrial tomato cultivations in the Pinios river basin: Soil properties interactions. Water 2016, 8, 515. [Google Scholar] [CrossRef]
  46. Safitri, L.; Kautsar, V.; Purboseno, S.; Wulandari, R.K.; Ardiyanto, A. (Forthcoming). Water Footprint Analysis of Oil Palm (Case Study of Pundu Region, Central Borneo). Inter. J. Palm Oil. 2019. Available online: https://ijop.id/index.php/ijop (accessed on 21 December 2018).
  47. Suttayakul, P.; Aran, H.; Suksaroj, C.; Mungkalasiri, J.; Wisansuwannakorn, R.; Musikavong, C. Water footprints of products of oil palm plantations and palm oil mills in Thailand. Sci. Total Environ. 2016, 542, 521–529. [Google Scholar] [CrossRef] [PubMed]
Figure 1. The reference evapotranspiration (ETo) (mm/hour) of the oil palm plantation area in Pundu, Central Kalimantan, during (a) April–May 2017, (b) June–August 2017.
Water 11 00035 g001
Figure 2. The distribution of oil palm root density under varying soil type and crop age.
Water 11 00035 g002
Figure 3. The distribution of root water uptake in oil palm root zone.
Water 11 00035 g003
Figure 4. Oil palm water footprint (m3/kg FFB) for varying crop ages and soil types.
Water 11 00035 g004
Table 1. Soil properties and van Genuchten parameter of soil type variation.
Soil TypeUltisolSpodosolInceptisol
Sand (%)33.389.2952.38
Silt (%)30.323.4416.24
Loam (%)36.397.2831.38
Bulk Density (g/cm3)1.331.421.38
Porosity (%)49.9146.5947.86
Ks (cm/hour)10.3136.498.24
Vg Parameters
θs0.4390.4040.418
θr0.1420.1470.169
alpha0.0110.0090.011
n1.3561.8211.605
Table 2. The oil palm root zone for varying soil type and crop age.
Soil Type and Crop Age
Inceptisol 8 YearsInceptisol 13 YearsSpodosol 8 YearsSpodosol 13 YearsSpodosol 7 YearsUltisol 9 Years
Root zone 1 (cm)0–300–500–90–50–90–30
Root zone 2 (cm)30–6050–1509–185–259–1830–60
Root zone 3 (cm)60–90150–20018–2825–5718–2860–90
Spodic layer (cm)--565656-
Table 3. The variable correlations with root water uptake (RWU).
VariableRWU totalRWU_z1RWU_z2RWU_z3
Cor_estCor_estCor_estCor_est
Precipitation0.607−0.4760.678−0.069
Sat. hydraulic conductivity (Ks)0.206−0.2790.547−0.527
Crop age0.7300.2420.257−0.591
Yields0.4080.0930.383−0.816
Total available water (TAW)−0.4660.160−0.4420.333
Table 4. Yield production of the fresh fruit bunch (FFB) (kg/tree/month) in the field study.
Soil TypeCrop Age YearsYield FFB
(kg/Tree/Month)
Inceptisol810.73
Spodosol814.69
Spodosol713.06
Ultisol914.19
Inceptisol1312.83
Spodosol1315.62
Table 5. Variable correlations with water with total, green, and blue footprint. WF: water footprint.
VariableYieldsWF TotalWF GreenWF Blue
Cor_estCor_estCor_estCor_est
Precipitation0.1470.2590.2760.039
Sat. hydraulic conductivity (Ks)0.619−0.975−0.948−0.404
Crop age0.3610.0540.103−0.123
Yields-−0.596−0.7330.191
Total available water (TAW)0.0260.6460.3830.978

