Article

Multilevel Adaptive Control of Alternating Aeration Cycles in Wastewater Treatment to Improve Nitrogen and Phosphorous Removal and to Obtain Energy Saving

by
Pedro T. Martín de la Vega
and
Miguel A. Jaramillo-Morán
*
Department of Electrical Engineering, Electronics & Automation, University of Extremadura, Avda. Elvas s/n, 06006 Badajoz, Spain
*
Author to whom correspondence should be addressed.
Water 2019, 11(1), 60; https://doi.org/10.3390/w11010060
Submission received: 6 November 2018 / Revised: 20 December 2018 / Accepted: 26 December 2018 / Published: 31 December 2018
(This article belongs to the Special Issue Advances in Water and Wastewater Monitoring and Treatment Technology)

Abstract

:
This work presents an adaptive control of the process of alternating aeration/non-aeration cycles for wastewater treatment. It is aimed at improving nitrogen and phosphorous removal efficiency and reducing energy consumption. It comprises two control levels. The first decides when to switch on and off aeration by comparing the Dissolved Oxygen (DO) and the Oxidation Reduction Potential (ORP) with two activation thresholds. The second, a supervisory control, continuously adapt their values by analyzing the working conditions of the reactor (organic matter and ammonium loads). These working conditions are described by four parameters obtained from the DO and ORP curves: Oxygen Uptake Rate (OUR), Oxygen Rise Average Slope (ORAS), ORParrow and Nitrate and Oxygen Uptake Rate (NOUR). It also adjusts the aeration system power to adapt it to those conditions. This adaptive control has been implemented in a laboratory scale prototype and its performance compared with that provided by another control with fixed thresholds and aeration power implemented in a similar prototype. The adaptive control clearly outperforms that without adaptation in nitrogen and phosphorous removal efficiency and requires lower energy consumption. Similar efficiencies were obtained for organic matter removal (higher than 90% in both cases).

1. Introduction

Water availability for human consumption has become one of the most important problems to deal with nowadays. Not only an increasing human population needs more and more water for living but also most of our activities demand an increasing amount of water. But once water is used it returns polluted into water bodies. Therefore, if it is not treated before released those water bodies may become unfit for human use because of that pollution. To deal with this problem governments all over the world have issued more and more restrictive regulations concerning water treatment, which impose very stringent pollution limits that treated water must comply with before released into water bodies. In Europe the Urban Waste Water Treatment Directive [1,2] demands the European Union (EU) members to set up sewer systems and biological wastewater treatment plants (WWTP) (a list with all acronyms used in the text appear in “Appendix A”) to collect and process wastewaters. In addition, it also states that a more stringent treatment concerning nutrient removal (mainly nitrogen and phosphorus) must be carried out in sensitive areas, i.e., those where water suffers from eutrophication or are to be used for human consumption.
Spain, as a member of the EU, has issued legal regulations [3,4] to comply with European directives. They state that, in water released by WWTPs, Chemical Oxygen Demand (COD) must be lower than 125 mg L−1 (or reduced by at least 75%), Biological Oxygen Demand (BOD) must be lower than 25 mg L−1 (or reduced by at least 70–90%) and Total Suspended Solids (TSS) must be lower than 35 mg L−1 (or reduced by at least 90%). In addition, nitrogen concentration must be lower than 15 mg L−1 for urban areas with population between 10,000 and 100,000 inhabitants equivalent (IE) (10 mg L−1 for those higher than 100,000) or be reduced by at least 70–80%. The limits for phosphorous concentration are: 2 mg L−1 for urban areas with population between 10,000 and 100,000 IE (1 mg L−1 for those higher than 100,000) or a reduction of at least 80%. For populations lower than 10,000 IE there is no limit in nitrogen and phosphorous discharges, although government agencies managing river basins usually extend the aforementioned requirements to those small urban agglomerations and take into account two nitrogen forms: Total Nitrogen (TN) and Total Ammonia Nitrogen (TAN).
New WWTPs will be designed following those regulations, but existing plants must be modified to comply with them by upgrading their treatment technologies, when possible, or by implementing new and more efficient ones. The new pollution limits are going to force most Spanish WWTPs to improve their performance in order to comply with those regulations, a fact that has boosted interest among researchers and enterprises in developing more efficient treatment processes and control strategies. In this way upgrading existing plants to comply with those new requirements should attract most of their efforts, as it represents the most economical option and also the easiest to implement.
Activated Sludge Process (ASP) [5] is the most widespread technology among plants that need to be updated. WWTPs performing this process comprise a biological reactor where polluted water is mixed with a biological sludge made up by bacteria which carry out their metabolic activities by “eating” pollution. Oxygen is provided by aeration systems to allow bacteria to undertake those processes. Then, this mixed liquor flows to another vessel, the clarifier, where the biological sludge settles and the clarified water flows over its top to be released to nearby water bodies (many times a last chemical process is applied to that effluent water to remove some pollutants that could not be properly removed in the treatment process). Several configurations have been developed to carry out this process. Those more widely used in urban wastewater treatment are: the oxidization ditch [6,7], alternated aeration/non-aeration cycles [8,9,10], pre-anoxic or anaerobic-anoxic-aerobic [11,12] or post-anoxic configurations [13]. In addition, efficient control strategies have been also developed to improve the treatment process performance. They mainly use oxygen [14,15], Oxidation Reduction Potential (ORP) [16,17] or ammonia and nitrogen profiles [18] to provide the information needed to carry out those control strategies.
Activated Sludge Processes are ideal candidates to be upgraded to comply with the new legal requirements, as their performance may be improved by only implementing new control strategies, which efficiently fix the length of the aeration and non-aeration cycles. Those strategies may be easily programmed in the automata or computers used in the plants instead of the old control laws without further modifications in the vessel. Those old laws were usually based on the definition of fixed length aeration/non-aeration cycles, so that the process always received the same amount of oxygen regardless the total pollution that the plant received. The lengths of those cycles were fixed to values that could ensure that organic matter was efficiently removed. In this way, those plants used to provide very good organic matter removal rates, although those related to nitrogen and phosphorous were very poor and far from complying with legal regulations. Energy consumption efficiency was also low because aeration was excessive and unnecessary when waters with low pollution levels were processed by the plant. New control strategies that look for optimizing the length of the aeration/non-aeration cycles could improve the process performance, so that it could comply with the new legal requirements.
In this work a new multilevel adaptive control is proposed with the aim of improving the removal efficiency of the alternating aeration/non-aeration process in WWTPs. The first level represents an improvement of a control already installed in an actual plant [19,20], that of La Albuera, a small village in the southwest of Spain, which may be considered as typical in that area. It allowed the process to comply with regulations concerning organic matter removal, although those concerning phosphorous and nitrogen removal were not reached. Therefore a second level control has been defined with the aim of improving removal efficiency of those chemicals by adapting the length of the aeration and non-aeration cycles to the working conditions of the plant. A significant reduction of energy consumption was also expected. This new control strategy has been tested in a laboratory scale plant and its treatment performance studied.

2. Materials and Methods

2.1. Control Parameters Description

The control proposed in this work is organized in a two levels structure: an aeration control, which switches on and off aeration and a supervisory control, which decides which must be the references used to carry out those two actions.
The aeration control uses the values of the Oxidation Reduction Potential (ORP), the Dissolved Oxygen (DO) and an estimation of the nitrates concentration trend (to increase or decrease) to decide when to switch on and off aeration. Therefore three thresholds should be provided to make those decisions.
The supervisory control will estimate the values of those thresholds that could optimize the length of the aeration and non-aeration cycles. They will be calculated taking into account the values and evolution of DO and ORP to adapt them to the working conditions of the process.
DO and ORP have been selected to characterize the process state and as control variables because probes providing their values are installed in all ASP plants. They provide reliable values and are relatively cheap and easy to maintain. pH and other variables usually measured in that kind of plants, such as Total Ammonia Nitrogen (TAN) or Sludge Retention Time (SRT), were discarded because their evolution provided little information or were really difficult to analyze. pH variations appeared in the second or third decimal place, TAN probes had problems with their accuracy and management, and, finally, SRT in this kind of processes was really difficult to measure, as specific probes were needed to monitor the suspended solids in the vessel and in the waste sludge line of the WWTP.
The DO and ORP evolution may be studied by means of some parameters, obtained from their time evolution curves, that identify and define the states of the treatment process. In [20] three parameters were proposed to characterize the aeration/non-aeration process: Oxygen Rise Average Slope (ORAS), which provides information about the oxygen concentration raise in the aeration cycle, ORParrow, as it provides information about the availability of organic matter for the denitrification process carried out in the non-aeration cycle and Oxygen Uptake Rate (OUR), which provides information about oxygen consumption in that non-aeration cycle.
In this work a new parameter, Nitrate and Oxygen Uptake Rate (NOUR), will be defined, not to adapt the aforementioned thresholds, but to refine the aeration control, as it will provide information about the nitrates trend (to increase or decrease) when the non-aeration cycle starts. The meaning of these parameters and how they are obtained are described below.

2.1.1. ORAS

It represents the slope of the linear approximation to the DO curve during the aeration cycle, that is to say:
O R A S = D O h D O o n t h t o n
where DOh represents the highest value DO reaches and DOon its value when aeration starts. th and ton represent the time at those values. The DO curve provides information regarding the balance between the rate at which oxygen is transferred to the vessel by blowers and the rate at which bacteria consume it [19].

2.1.2. ORParrow

It is defined as the maximum distance between the decreasing curve of ORP (it is measured in the non-aeration cycle) and its linear approximation between the point where DO is 0 mg L−1 and the ORP “knee” (i.e., the point where the ORP curve suffers a sudden decrease that points out the end of the denitrification process) [19].
This parameter provides information about the kind of organic matter present in the vessel after switching off aeration. When the readily biodegradable organic matter has been completely consumed in the previous aeration cycle only that slowly biodegradable will remain in the vessel. Thus the denitrification process slows down and ORP experiences a steep decrease, so that its profile will separate from its linear approximation. Therefore, high values of ORParrow will be obtained. On the other hand if some readily biodegradable organic matter remains in the vessel after aeration was switched off the denitrification process will be faster and the curve shape will be close to its linear approximation, providing low values of ORParrow. This parameter is obtained from:
O R P a r r o w = max ( O R P a r r o w ( t i ) )
O R P a r r o w ( t i ) = [ ( t α t p ) ( O R P p O R P i ) + ( t i t p ) ( O R P α O R P p ) ] ( O R P α O R P p ) 2 + ( t α t p ) 2
where ORPp is the ORP value when DO is 0 mgL−1, ORPα the value where the ORP “knee” appears and ORPi the ORP values between these two limits. tp, tα and ti represent their corresponding time instants.

2.1.3. OUR

It represents the oxygen consumption rate in the non-aeration cycle. Its value can be obtained from:
O U R = 0.8 × D O h 0.4 × D O h t 0.4 t 0.8
where DOh is the highest value DO reaches when aeration is switched off. DO is measured at 80% and 40% of that maximum value (with t0.4 and t0.8 representing their corresponding times) to avoid nonlinearities that appear when its value begins to decrease and when it approaches 0 mg L−1, as established in Monod Kinetics. OUR represents a very precise approximation to the value of the DO curve slope in that time interval.

2.1.4. NOUR

It provides information about the evolution of nitrates once aeration is switched off. At that moment DO must begin to decrease, but ORP may have two possible options: to keep growing (although at a lower rate) or to begin to decrease.
This last state appears when a significant amount of readily biodegradable organic matter remains in the vessel after aerations was switched off. As there is not enough oxygen to oxidize it, nitrates generated in the previous aeration cycle by oxidation of incoming ammonium begin to act as oxidizers, forcing ORP to decrease.
ORP keeps growing when the readily biodegradable organic matter was almost entirely oxidized in the previous aeration cycle and the remaining oxygen is able to oxidize that small amount, avoiding nitrates becoming oxidizers.
NOUR is defined in the ORP curve as:
N O U R = O R P t 0.8 O R P t 0.4 t 0.8 t 0.4
where t0.4 and t0.8 represent the same time points used to define OUR and ORPt0.4 and ORPt0.8 their corresponding ORP values. This parameter provides valuable information about the process trend to accumulate or consume nitrates, which may be used to decide whether or not to extend the non-aeration stage in order to improve Biological Nitrogen Removal (BNR) [13].

2.2. Control Structure

As it has been previously stated, the control proposed in this work comprises two action levels: the first, the aeration control, decides when to switch on and off aeration, while the second, a supervisory control, adjust the thresholds the first one uses to make those decisions. They both work in parallel so that the second constantly calculates the values of the thresholds that better adapt to the treatment needs.

2.2.1. Aeration Control

The aeration control (Figure 1) starts by switching on aerators, which remain in this state until DO reaches a certain threshold, whose value must be such as to ensure the transformation of ammonium into nitrate and to allow the accumulation of a fraction of organic matter inside the vessel [21,22]. When this happens aeration is switched off and a non-aeration cycle starts. Then the algorithm calculates OUR and compares it with another threshold.
A value lower than this threshold points to a low oxygen consumption rate, which means that there is a low organic matter concentration in the reactor. In that case the non-aeration cycle should continue to allow the denitrification process to start, where nitrates will be reduced by using the remaining organic matter (which is mainly slowly biodegradable). This non-aeration cycle will last until ORP becomes lower than a certain threshold and aeration is switched on again. This threshold must be low enough to ensure that as much nitrates as possible are reduced and, therefore, nitrogen is removed from the reactor.
The non-aeration cycle must be long enough to allow the process to enter into an anaerobic stage which promotes Enhance Biological Phosphorous Removal (EBPR) [23,24], in which Polyphosphate Accumulating Organisms (PAO) consume organic matter by transforming it into polyhidroxyalcalanoates (PHA) and release phosphorous into the reactor. It will be subsequently absorbed by PAOs beyond their metabolic needs in the following aeration cycle by degrading PHA [25]. Phosphorous may be removed from the plant when a fraction of the biological sludge is removed to maintain the sludge age.
It is worth noting that the ORP threshold must not be too low since, in that case, the non-aeration cycle will last too much and the incoming organic matter will accumulate in the reactor and will not be oxidized because of the lack of oxygen. Thus an undesired reduction in the organic matter removing performance would be obtained.
An OUR higher than the threshold will mean that oxygen is quickly consumed, a fact that shows that a significant amount of organic matter (both readily and slowly biodegradable) and ammonium still remains in the vessel. They must be treated by providing more oxygen to the process (aeration should be switched on). Nevertheless, prior to switching on aeration, NOUR must be checked to find out whether the process is still oxidizing or has started to reduce nitrates. A positive value means that the system is still oxidizing an excess of organic matter. So the controller will allow this process to continue and will wait until DO reaches 0 mg L−1 (actually this value was fixed to 0.1 mg L−1 because of the difficult of the DO probes to reach 0 mg L−1 in actual plants) to switch aeration on. A negative value means that the system has started to reduce nitrates and it should remain in the non-aeration cycle to allow this process to be completed. So the control keeps aeration off until the aforementioned ORP threshold is reached. Then the algorithm is repeated again.
This control only needs two thresholds to be fixed: one for ORP and another for DO.
The OUR threshold needs not be adjusted because of the nature of the processes it measures: the oxygen consumption rate in the non-aeration cycle. So, when the readily biodegradable organic matter was completely consumed in the previous aeration cycle, only the oxidation of that slowly biodegradable and endogenous bacterial respiration consume oxygen. These processes should give a more or less constant value of OUR. Values higher than it point to the presence of readily biodegradable organic matter, which was not consumed in the previous aeration cycle. Therefore, this threshold was defined as the OUR value for which oxygen is consumed only by the slowly biodegradable organic matter oxidation and endogenous respiration increased by 20% or 30% to ensure the presence of the readily biodegradable organic matter to promote BNR and EBPR. That value was obtained by means of respirometric tests [26]. It was fixed to 10 mg L−1 h−1 for the prototypes developed in this work.

2.2.2. Supervisory Control

The adjustment of the two aforementioned thresholds will be carried out based on the estimation of the incoming pollution the bacterial population must deal with. Values of OUR, ORAS and ORParrow obtained from the DO and ORP curves will be taken into account to do that. Several working conditions will be defined and each one will provide a proper value to the corresponding threshold.
The adjustment of the DO threshold should be carried out based on the oxygen requirements of the treatment process. So only the parameters related to oxygen concentration should be considered: OUR and ORAS. Four states are defined, Figure 2a:
  • Standard working conditions: 6 mg L1h1< OUR < 12 mg L1h1. This relatively high value of OUR points to a moderate load of organic matter and ammonium, which was efficiently oxidized in the aeration cycle, although a small amount of that organic matter (mainly slowly biodegradable) remains in the non-aeration cycle promoting BNR and EBPR. The DO threshold is hold to the standard value of 2 mg L−1 [21,22].
  • Low organic matter load and high ammonium load: OUR < 6 mg L1h1and ORAS < 0.2 mg L1h1. The low value of OUR points to organic matter scarcity after aeration was switched off. Nevertheless, the low value of ORAS points to high oxygen demand, a fact that can only be explained by the presence of a high amount of ammonium in the input, which demands oxygen to be properly oxidized to nitrates. They should be reduced in the following non-aeration cycle. The DO threshold is only slightly decreased to a value of 1.5 mg L−1 to allow that process to be carried out. This is an abnormal state in standard low/medium WWTPs as that used as reference in this work.
  • Very low organic matter and ammonium load: OUR < 6 mg L1h1and ORAS > 0.2 mg L1h1. The low value of OUR shows a low load of organic matter and ammonium, a fact that is further supported by the high value of ORAS (DO quickly rises because of the low oxygen demand). The threshold is decreased to 1 mg L−1 to avoid an unnecessary supply of oxygen.
  • Organic matter stress: OUR > 12 mg L1h1. This very high value of OUR points to a very high load of organic matter or ammonium in the incoming water which was not completely oxidized in the aeration cycle and remains in the following non-aeration one. Therefore, the DO threshold is increased to a value of 2.5 mg L−1 to provide enough oxygen to properly process all the incoming organic matter.
The adjustment of the ORP threshold also needs the definition of four working conditions, which will provide four different values for this parameter. They are related to the presence of organic matter in the reactor during the non-aeration stage, which is needed to carry out BNR. Therefore ORParrow will be used instead of ORAS to adjust the threshold (Figure 2b):
  • Standard organic matter concentration: 6 mg L1h1< OUR < 12 mg L1h1. This is the standard working conditions previously described in the algorithm adjusting DO. A threshold of −30 mV will ensure that organic matter is removed and denitrification is carried out.
  • Low organic matter concentration: OUR < 6 mg L1h1and ORParrow < 30. The low value of OUR shows that the reactor has received a low amount of organic matter. Nevertheless, the low value of ORParrow points to the presence of readily biodegradable organic matter, along with that slowly biodegradable, in the non-aeration cycle. A too long non-aeration stage will make nitrates to be completely consumed and some organic matter will remain in the vessel, which will be released with the effluent. To avoid this effect the non-aeration length must be shortened (but not too much to allow BNR and EBPR to be carried out). Then the OUR threshold is decreased to −50 mV.
  • Lack of organic matter: OUR < 6 mg L1h1and ORParrow > 30. The low value of OUR points to a low load of organic matter and the high value of ORParrow shows that only that slowly biodegradable remains in the vessel after aeration was switched off. Therefore the ORP thresholds must be decreased to −70 mV to allow it to be oxidized by nitrates.
  • Excessive organic matter concentration: OUR > 12 mg L1h1. This value points to a very high load of organic matter in the affluent. The non-aeration stage will be reduced as much as possible by increasing the OUR threshold to 0 mV to avoid accumulation of organic matter in the effluent.
In actual plants of small towns aerators usually work at fixed power for the sake of simplicity of control algorithms. Their aeration systems are usually over-dimensioned to ensure the oxidation of organic matter and ammonium when the plants receive pollution peaks. Therefore, when the reactor receives a low organic load this high aeration provides an excess of oxygen which cannot be used and is therefore lost. To avoid this energy waste a third stage has been included in the supervisory control, which adjusts the aeration system power with the aim of reducing energy consumption. As oxygen demand directly depends on the amount of incoming pollution, its control will only depend on the parameter providing an estimation of that variable: ORAS. Three power levels have been defined, Figure 2c:
  • Low: ORAS > 0.2 mg L1h1. A high value of ORAS points to a low pollution load, which does not consume much oxygen to be oxidized. So DO quickly rises, providing a high value of ORAS. Therefore, the aeration power is fixed to a low value.
  • Standard: 0.1 mg L1h1< ORAS < 0.2 mg L1h1. This is assumed as the standard working condition. The aeration power is fixed to a medium value.
  • High: ORAS < 0.1 mg L1h1. This value points to a high amount of organic matter in the reactor caused by periodic or specific increments in the pollutant load. Therefore, the aeration is switched to its highest value to properly deal with this high amount of organic matter.
Only three aeration powers have been defined because small and medium WWTPs of the type studied in this work usually have very few power levels (two or three). They have been fixed in this work at 75%, 50% and 30% of the maximum power. The maximum value has been avoided for security issues of the aeration pumps.

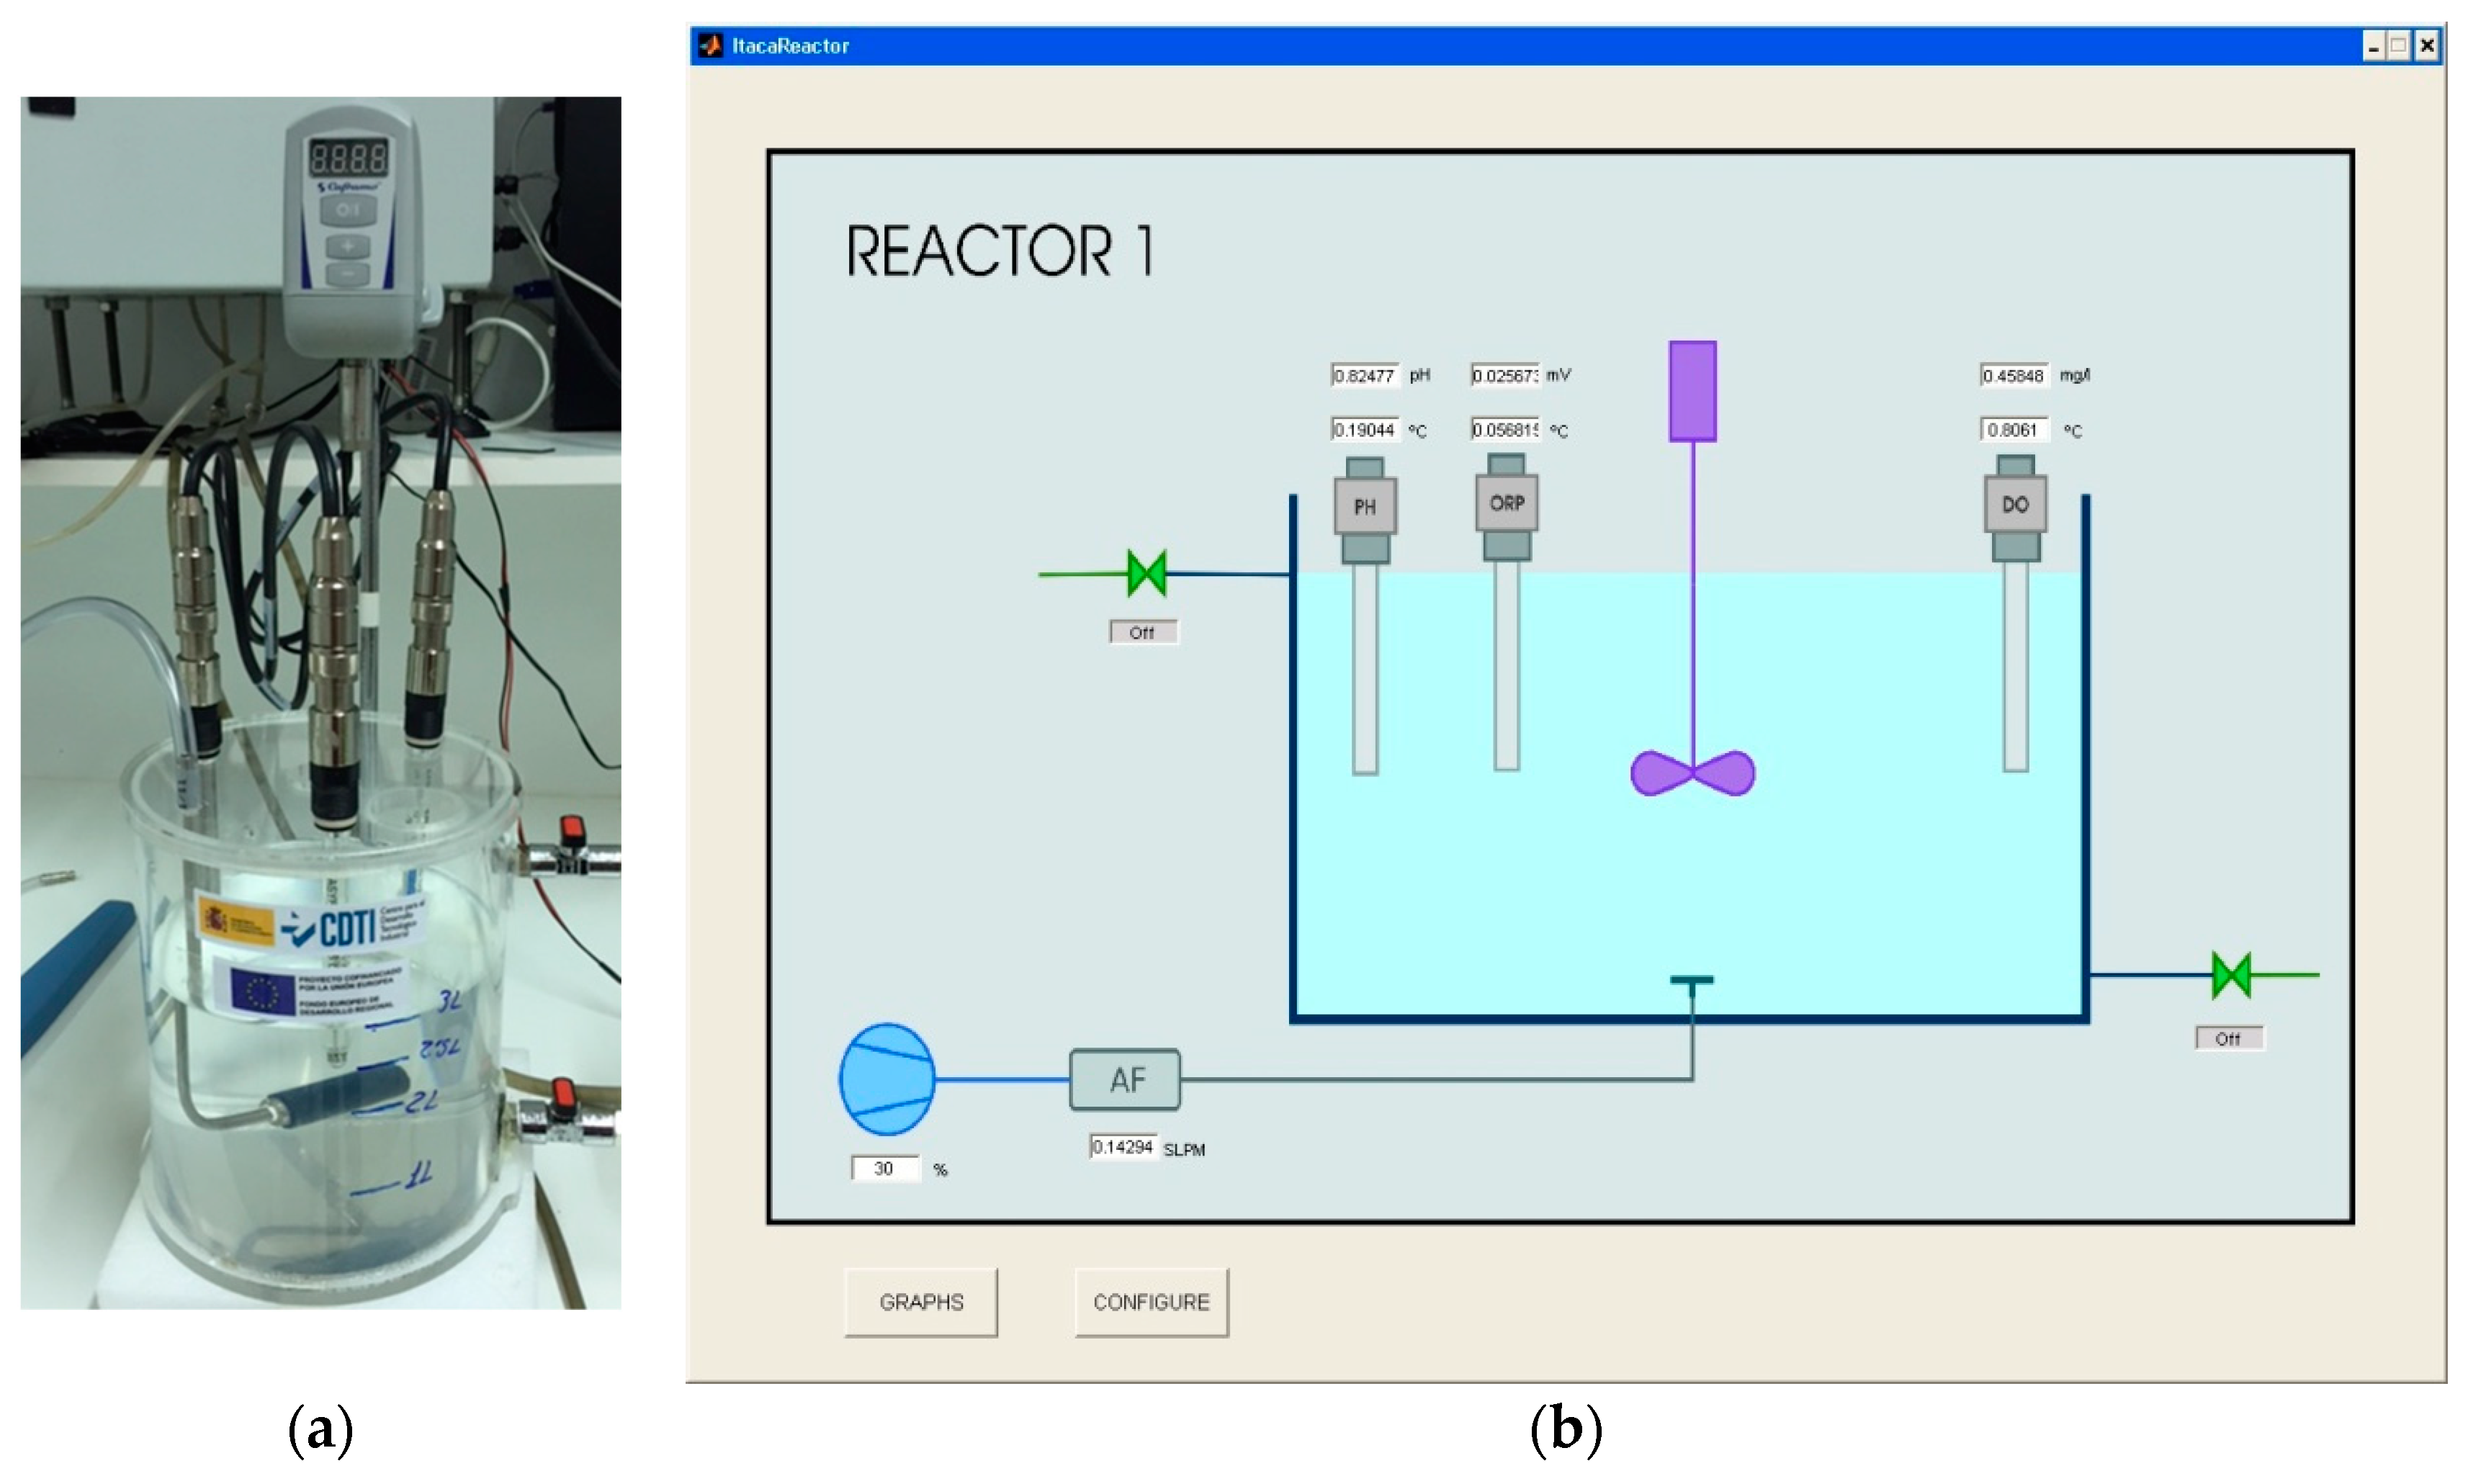
2.3. Laboratory Scale Plant

The multilevel adaptive control proposed in this work has been tested in a laboratory prototype (Figure 3) designed to reproduce the behavior of an actual WWTP. It is a 3 L cylindrical vessel (manufactured by the authors) with two probes, one for DO (VISIFERM DO ARC 120 from Hamilton) and the other for ORP (EASYFERM PLUS ARC 120, also from Hamilton), one stirrer and one aeration system with an air flow probe. Two valves were added to the vessel: one at the bottom, to allow sludge to be removed from the process, and the other at the top, to allow treated water to flow out to compensate for the incoming polluted water. Two peristaltic pumps were also included: one to feed the vessel with polluted water and the other to extract the excess sludge. A pH probe was also included, although it was not used to control or monitor the process because, as pointed out in “2.1. Control parameters description”, variations in the values measured were too small (they appeared in the second or third decimal place) to take this variable into account.
A second prototype has been also set up, although only with the aeration control with fixed thresholds. It has been used as a reference to check the performance improvement provided by the adaptive control.
The whole control structure has been programmed in Matlab R2012b (The MathWorks, Inc., Natick, MA, USA) and runned in a PC. The prototype was connected to this computer by means of a set of electronic boards which gather the information provided by probes and control stirrer, aerators and valves.
Both prototypes were working throughout ten months processing both actual and synthetic samples of polluted water.

2.4. Polution Patterns

150 different samples of polluted water were presented to both reactors to test the performance of the proposed control. They were intended to comprise all possible scenarios that small and medium WWTPs may face: variations in the influent load related to wet and dry weather, agricultural and food industry discharges and anaerobic digestion supernatants.
Each sample fed both prototypes throughout two days, as this was the maximum Hydraulic Retention Time of the actual WWTP used as reference. The process state was hourly recorded throughout those two days.
The whole set of samples have been grouped into 6 pollution patterns to allow an easier comparison of the performances of both controllers. They were intended to describe a possible common origin of the samples comprising each one (Table 1).
Each sample was characterized by taking into account their physical properties regarding particle size and solubility as defined in [27] (colloidal (big), particulate (medium) and soluble (small)) (Figure 4a) and pollutant concentration (COD, ammonium (NH4+), nitrates (NO3), total nitrogen (TN), organic nitrogen (NORG) and phosphates (PO4-)) as defined in [28] (Figure 4b). Table 2 shows the number of samples in each pattern and mean values and standard deviation of each representative variable.
The processed water was also analyzed in order to find out the treatment performance. So COD, total nitrogen, total phosphorous, nitrified ammonium and denitrified nitrate were measured in the effluent water [29]. They were obtained as integrated daily samples made up of 24 subsamples of 30 mL obtained every hour. They were analyzed with a spectrophotometer HACH DR3900 (from Hach Company, Loveland, CO, USA). Variables measured were COD, TN-N, NH4+-N, NO3-N and PO43−-P. Norg was obtained by subtracting NH4+-N and NO3-N from TN.
Energy consumed in the treatment of each sample was also recorded.

2.5. Calculation of Removal Efficiency and Energy Savings

The efficiency of the treatment process was calculated by comparing input and output pollution concentrations. It was obtained from:
R = C S i C S o C S i × 100 % .
where Csi represents the input concentration of a certain parameter and Cso its output concentration.
The denitrified nitrate percentage was also calculated to show the performance of the organic matter management carried out by each control. It was calculated by taking into account the influent ammonium, the total effluent nitrogen (which comprises the non-denitrified nitrate, the non-removed organic nitrogen and the non-oxidized ammonium) and the influent ammonium used to produce new cellular material, which, according to [30], may be obtained as 2.5% of the influent COD. Its value was obtained from:
C N O 3 N d e n = C N H 4 + N i C T N e 0.025 × C C O D i %   denitrification = C N O 3 N d e n C N O 3 N e C N O 3 N d e n × 100 %
Energy savings were calculated from the data provided by the flow probe included in each prototype. They measured the oxygen supplied to the process (measured as kg/h). Energy consumption savings were obtained by comparing the values recorded in each prototype (as saving measures the ratio between both values, they needed not be converted into electric energy consumption).

3. Results and Discussion

3.1. Removal Efficiency

A comparison between the removal efficiency of both controls is showed in Table 3. The first thing that comes to attention is the high organic matter removal rate achieved by the reference control. The adaptive control maintains that efficiency providing a slight improvement in some of the patterns (those with a removal efficiency lower than 90% or close to this value: patterns 2, 3 and 4). So it may be stated that the new adaptive control keeps the good performance in organic matter removal already obtained with the aeration control with fixed thresholds (which, in fact, represents an improvement of an actual control, that in the WWTP of La Albuera, as pointed out in “1. Introduction”), which complied with current Spanish legal regulations concerning the wastewater treatment efficiency, which require a removal rate of COD of almost 75%.
In the same way, it may be seen that ammonium removal rates are also very good for both controllers. They were higher than 90% in all cases, except for patterns 5 and 6 of the control with fixed thresholds (which, in any case, are very close to that value). The performance provided by the adaptive controller was slightly better than that of the reference control for several patterns (3, 4, 5 and 6). This good performance is hardly surprising because ammonium is oxidized along with organic matter in the aeration cycles. Thus, as the main goal of the aeration control is to efficiently remove organic matter by providing enough oxygen to the process, ammonium should also be efficiently oxidized.
The nitrogen removal efficiency presents a different landscape. The reference control provided worse removing rates. Those of patterns 1, 2, 3 and 5 complied with legal requirements (removal rates higher than 70%) although those of patterns 4 and 6 did not. These last ones define scenarios with low organic matter load that was efficiently removed. Nevertheless, the system was not able to remove nitrogen because no organic matter was available in the following non-aeration cycle. The adaptive control proposed in this work was able to provide better performances with all patterns, as it extends the non-aeration cycle length to allow the slowly biodegradable organic matter to be transformed into readily biodegradable, which will be then used to reduce nitrates. These nitrates were obtained in the previous aeration cycle from the efficient oxidation of ammonium, as the high values of ammonium removal rates show. So nitrogen removal rates higher than 80% were achieved with patterns 1 to 5 and very close to 70% for the sixth one, so that legal requirements were achieved. It is worth noting that the lower the removal efficiency achieved by the reference control the higher the improvement provided by the adaptive control developed in this work. This improvement in nitrogen removal efficiency was provided by the intelligent management of organic matter carried out by the supervisory control. This is further supported by the significant improvement provided by the adaptive control in the denitrified nitrate percentage for all patterns.
Phosphorous removal was not so good. As previously stated, phosphorous is removed from the vessel by extracting a fraction of the biological sludge, which contains PAOs that accumulate it. So, although the EBPR process may be efficiently carried out by properly adjusting the aeration/non-aeration cycles length, the physical extraction of phosphorous from the reactor is not so efficient because only a part of the bacterial population may be extracted from the reactor. In other words, phosphorous removal efficiency not only depends on efficiently adjusting the non-aeration cycle length to ensure that EBPR is properly carried out, but also on removing a fraction of the biological sludge containing PAOs. In those plants where that fraction is fixed to accomplish with the SRT stated in the plant design, such as that used in this work as a reference, the biological phosphorous removal efficiency is limited.
The adaptive control proposed in this work was not able to provide a removal efficiency that fulfills Spanish legal requirements (80%), nevertheless it provided very good results. Patters 1, 2, 3 and 5 (those providing better nitrogen removal rates) achieved removal efficiencies close to 70%. The control was able to meet legal requirements in 65% of the samples of pattern 2 and in 75% of those of pattern 3 (those providing better performance). In all cases, the adaptive control provided better removal rates than that with fixed thresholds. As with nitrogen, the improvement achieved was higher for those patterns where the efficiency provided by the aeration control with fixed thresholds was smaller.
It is worth noting that, although legal requirements regarding phosphorous removal have been met in only a few cases, the removal rate improvement achieved by the new adaptive control may provide a significant reduction of the chemicals used at the plant exit to reduce the amount of phosphorus released to water bodies. This will result in a reduction of the operating costs of the plant.
It is difficult to compare the performance improvement provided by the adaptive multilevel control proposed in this work with those achieved by other authors, as different pollution patterns are treated or different prototypes or actual plants are used. Therefore comparisons must be assumed only as approximated. In this way it may be stated that the adaptive model proposed in this work was able provide better performance than those achieved with the same configuration of WWTP in [9,10] for RTN, in which a maximum of 70% was reached. In [10] a value close to 50% was also obtained for RTP. On the other hand, wastewater treatment processes for small and medium urban agglomerations different from ASP have been also applied to remove organic matter and nutrients. Artificial wetlands and ponds are the most widespread because of their low operation costs [28,31]. Nevertheless, their removal efficiencies were lower than those provided in this work. So, in [28] the best removal efficiencies achieved were: 70.8% for COD, 79.2% for NH4+-N and 64.7% for Total Phosphorous TP. They are lower than those achieved in our work, except for two patterns with TP.

3.2. Energy Consumption Savings

As the goal of the control proposed in this work was to improve nitrogen and phosphorous removal efficiency, the non-aeration cycles should be properly extended to ensure that nitrates are efficiently reduced and the process can enter into an anaerobic state to allow EBPR to be carried out. In this way, a significant reduction of the time aeration is on will be obtained, and, therefore, of electric energy consumption. It was provided by the reduction of the oxygen supplied to the treatment process. They may be seen in Table 4, where a significant reduction of the energy consumption provided by the adaptive control when compared with that with fixed thresholds may be seen in the six patterns. The “worst” result was obtained with pattern 1, in which an improvement lower that 10% (8.3%) was obtained, a hardly surprising result if one bears in mind that it was characterized by a high concentration of organic matter, a state that demands high consumption of oxygen and, thus, the non-aeration cycle must be significantly reduced. Nevertheless, energy saving was obtained.
Savings between 10% and 20% were achieved for patterns 2, 3 and 5. They are characterized by the presence of slowly biodegradable organic matter or by a high concentration of nutrients (nitrogen and phosphorous), which needed the non-aeration cycle to be extended to properly process those nutrients. The non-aeration cycle was efficiently managed by the adaptive control, providing a good reduction of nitrates and facilitating the system to enter into the anaerobic state to allow EBPR to be properly carried out.
Finally, a reduction higher that 20% was achieved with patterns 4 and 6. The saving obtained with pattern 6 is easy to explain, as it defines a kind of water that is reach in nutrients and poor in organic matter and, therefore, demands large non-aeration cycles to reduce those nutrients. The reduction in patter 4 is particularly meaningful because it defines the typical urban wastewater in wet seasons. It may also appear in some moments of the dry season when people consume high quantities of water.
There are few works where energy savings are studied because they can be obtained only when different processes are compared. In [8] three WWTPs were updated to the alternating cycles process and energy saving of 8%, 13% and 26% were achieved. Improvements obtained in our work are provided by the efficient modification of the length of those cycles.

4. Conclusions

The efficiency of the wastewater treatment process has been improved by means of an adaptive control which decides the length of both the aeration and non-aeration cycles by adapting them to the working conditions of the plant. It adjusts the DO and ORP thresholds used as references to switch on and off the aeration pumps. The working power of those pumps was also adjusted. So the nitrogen and phosphorous removal efficiency have been improved when compared with those provided by a control with fixed values of the thresholds used as reference. In addition, it has also provided a significant reduction of energy consumption. This adaptive control was designed with a two-level structure: the first one decides when to switch aeration on and off to efficiently remove organic matter, while the second, or supervisory level, was designed to adaptabily adjust the length of the aeration and non-aeration cycles with the aim of allowing the BNR process to be efficiency carried out and to obtain energy savings. This control is easy to implement and is suited for all Activated Sludge Process configurations, which is the most widespread process used to remove organic matter and nutrients in small and medium urban agglomerations.

Author Contributions

Data curation, P.T.M.d.l.V.; Formal analysis, P.T.M.d.l.V. and M.A.J.-M.; Methodology, P.T.M.d.l.V. and M.A.J.-M.; Software, P.T.M.d.l.V.; Validation, P.T.M.d.l.V. and M.A.J.-M.; Writing—review & editing, P.T.M.d.l.V. and M.A.J.-M.

Funding

This research was funded by Junta de Extremadura through the Grant GR15019 of its Research Groups Support Program (co-financed by FEDER funds).

Conflicts of Interest

The authors declare no conflict of interest. The founding sponsors had no role in the design of the study; in the collection, analyses, or interpretation of data; in the writing of the manuscript, and in the decision to publish the results.

Appendix A

Table A1. Meaning of the acronyms used in the text.
AcronymMeaning
WWTPWastewater Treatment Plants
DODissolved Oxygen
ORPOxidation Reduction Potential
OUROxygen Uptake Rate
ORASOxygen Rise Average Slope
NOURNitrate and Oxygen Uptake Rate
CODChemical Oxygen Demand
BODBiological Oxygen Demand
TSSTotal Suspended Solids
IEInhabitants Equivalent
TNTotal Nitrogen
TANTotal Ammonia Nitrogen
ASPActivated Sludge Process
SRTSludge Retention Time
BNRBiological Nitrogen Removal
EBPREnhance Biological Phosphorous Removal
PAOPolyphosphate Accumulating Organisms
PHAPolyhidroxyalcalanoates

References

  1. Council Directive 91/271 of 21 May 1991. Official Journal of the European Communities L 135/40 (30/5/91); pp. 0040–0052. Available online: https://eur-lex.europa.eu/legal-content/EN/TXT/PDF/?uri=CELEX:31991L0271&from=en (accessed on 12 December 2018).
  2. Commission Directive 98/15/EC of 27 February 1998 Amending Council Directive 91/271. Official Journal of the European Communities L067/41 (07/03/1998); pp. 0029–0030. Available online: https://eur-lex.europa.eu/legal-content/EN/TXT/PDF/?uri=CELEX:31998L0015&from=ES (accessed on 12 December 2018).
  3. Real Decreto-ley 11/1995 of 28 December. BOE 312 (30/12/1995). pp. 37517–37519. Available online: https://www.boe.es/boe/dias/1995/12/30/pdfs/A37517-37519.pdf (accessed on 12 December 2018). (In Spanish).
  4. Real Decreto 509/1996 of 15 March 1996, Developing Real Decreto-ley 11/1995. BOE 77 (29/03/1996). pp. 12038–12041. Available online: https://www.boe.es/boe/dias/1996/03/29/pdfs/A12038-12041.pdf (accessed on 12 December 2018). (In Spanish).
  5. Hreiz, R.; Latifi, M.A.; Roche, N. Optimal design and operation of activated sludge processes: State-of-the-art. Chem. Eng. J. 2015, 281, 900–920. [Google Scholar] [CrossRef] [Green Version]
  6. Liu, J.X.; Van, G.J.W.; Doddema, H.J.; Wang, B.Z. Influence of the aeration brush on nitrogen removal in the oxidation ditch. Eur. Water Pollut. Control 1996, 6, 25–30. [Google Scholar]
  7. Zhou, X.; Han, Y.; Guo, X. Identification and evaluation of SND in a full-scale multi-channel, oxidation ditch system under different aeration modes. Chem. Eng. J. 2015, 259, 715–723. [Google Scholar] [CrossRef]
  8. Nardelli, P.; Gatti, G.; Eusebi, A.L.; Battistoni, P.; Cecchi, F. Full-scale application of the alternating oxic/anoxic process: An overview. Ind. Eng. Chem. Res. 2009, 48, 3526–3532. [Google Scholar] [CrossRef]
  9. Fatone, F.; Bolzonella, D.; Battistoni, P.; Cecchi, F. Removal of nutrients and micropollutants treating low loaded wastewaters in a membrane bioreactor operating the automatic alternate-cycles process. Desalination 2005, 183, 395–405. [Google Scholar] [CrossRef]
  10. Battistoni, P.; De Angelis, A.; Boccadoro, R.; Bolzonella, D. An automatically controlled alternate oxic–anoxic process for small municipal wastewater treatment plants. Ind. Eng. Chem. Res. 2003, 42, 509–515. [Google Scholar] [CrossRef]
  11. Molina, J.; Fernandez, J.; Ayala, D.; Ochoa, M. Simultaneous Carbon, Nitrogen and Phosphorus Removal from Wastewater with a Modified Hybrid UCT System. DYNA-Colombia 2010, 77, 39–48. [Google Scholar]
  12. Liu, Y.C.; Shi, H.C.; Wang, Z.Q.; Fan, L.; Shi, H.M. Approach to enhancing nitrogen removal performance with fluctuation of influent in an oxidation ditch system. Chem. Eng. J. 2013, 219, 520–526. [Google Scholar] [CrossRef]
  13. Ekama, G.A.; Wentzel, M.C. Nitrogen removal. In Biological Wastewater Treatment, Principles, Modelling and Design; Henze, M.M., van Loosdrecht, M.C., Ekama, G.A., Brdjanovic, D., Eds.; IWA Publishing: London, UK, 2008; pp. 87–139. ISBN 9781843391883. [Google Scholar]
  14. Ma, Y.; Peng, Y.Z.; Wang, S.Y. Feedforward-feedback control of dissolved oxygen concentration in a predenitrification system. Bioprocess Biosyst. Eng. 2005, 27, 223–228. [Google Scholar]
  15. Lin, M.J.; Luo, F. An adaptive control method for the dissolved oxygen concentration in wastewater treatment plants. Neural Comput. Appl. 2015, 26, 2027–2037. [Google Scholar] [CrossRef]
  16. Charpentier, J.; Godart, H.; Martín, G.; Mogno, Y. Oxidation-Reduction Potential (ORP) regulation as a way to optimize aeration and C, N and P removal: Experimental Basis and Various Full-Scale Examples. Water Sci. Technol. 1989, 21, 1209–1223. [Google Scholar] [CrossRef]
  17. Lackner, S.; Lindenblatt, C.; Horn, H. Swinging ORP as operation strategy for stable reject water treatment by nitritation-anammox in sequencing batch reactors. Chem. Eng. J. 2012, 180, 190–196. [Google Scholar] [CrossRef]
  18. Ostace, G.S.; Baeza, J.A.; Guerrer, J.; Guisasola, A.; Cristea, V.M.; Agachi, P.S.; Lafuente, J. Development and economic assessment of different WWTP control strategies for optimal simultaneous removal of carbon, nitrogen and phosphorus. Comput. Chem. Eng. 2013, 53, 164–177. [Google Scholar] [CrossRef] [Green Version]
  19. Martín de la Vega, P.T.; Jaramillo, M.A.; Martínez de Salazar, E.; Cros, J. New contributions to the ORP & DO time profile characterization to improve biological nutrient removal”. Bioresour. Technol. 2012, 114, 160–167. [Google Scholar] [PubMed]
  20. Martín de la Vega, P.T.; Jaramillo-Morán, M.A. Obtaining key parameter and working conditions of wastewater biological nutrient removal by means of artificial intelligence tools. Water 2018, 10, 685. [Google Scholar] [CrossRef]
  21. Martins, A.M.P.; Heijnen, J.J.; van Loosdrecht, M.C.M. Effect of feeding pattern and storage on the sludge setteability under aerobic conditions. Water Res. 2003, 37, 2555–2570. [Google Scholar] [CrossRef]
  22. Serralta, J.; Ribes, J.; Seco, A.; Ferrer, J. A supervisory control system for optimizing nitrogen removal and aeration energy consumption in wastewater treatment plants. Water Sci. Technol. 2002, 45, 309–316. [Google Scholar] [CrossRef]
  23. Makinia, J. Mathematical Modelling and Computer Simulations of Activated Sludge Systems; IWA Publishing: London, UK, 2010; ISBN 9781843392385. [Google Scholar]
  24. Liu, G.; Xu, X.; Zhu, L.; Xing, S.; Chen, J. Biological nutrient removal in a continuous anaerobic-aerobic-anoxic process treating synthetic domestic wastewater. Chem. Eng. J. 2013, 225, 223–229. [Google Scholar] [CrossRef]
  25. Wentzel, M.C.; Comeau, Y.; Ekama, G.A.; Loosdrecht, M.C.M.; Brdjanovic, D. Enhanced Biological Phosphorous Removal. In Biological Wastewater Treatment, Principles, Modelling and Design; Henze, M.M., van Loosdrecht, M.C., Ekama, G.A., Brdjanovic, D., Eds.; IWA Publishing: London, UK, 2008; pp. 155–220. ISBN 9781843391883. [Google Scholar]
  26. Jubany, I.; Carrera, J.; Lafuente, J.; Baeza, J.A. Start-up of a nitrification with automatic control to treat highly ammonium wastewater: Experimental results and modeling. Chem. Eng. J. 2008, 144, 407–419. [Google Scholar] [CrossRef]
  27. Mamais, D.; Jenkins, D.; Pitt, P.A. Rapid Physical-chemical method for the determination of readily biodegradable soluble COD in municipal wastewater. Water Res. 1993, 27, 195–197. [Google Scholar] [CrossRef]
  28. APHA. Standard Methods for the Examination of Water and Wastewater, 19th ed.; American Public Health Association Inc.: New York, NY, USA, 1995. [Google Scholar]
  29. Al-Isawi, R.H.K.; Sanak, R.; Scholz, M. Comparative study of domestic wastewater treatment by ponds and mature vertical-flow constructed wetlands. Ecol. Eng. 2017, 100, 8–18. [Google Scholar] [CrossRef]
  30. ATV-DVWK. Dimensioning of Single-Stage Acivated Sludge Plants; DVWK: Hennef, Germany, 2000. [Google Scholar]
  31. Al-Isawi, R.H.K.; Sani, A.; Almuktar, S.; Scholz, M. Vertical-flow constructed wetlands treating domestic wastewater contaminated by hydrocarbons. Water Sci. Technol. 2015, 71, 938–946. [Google Scholar] [CrossRef] [PubMed]
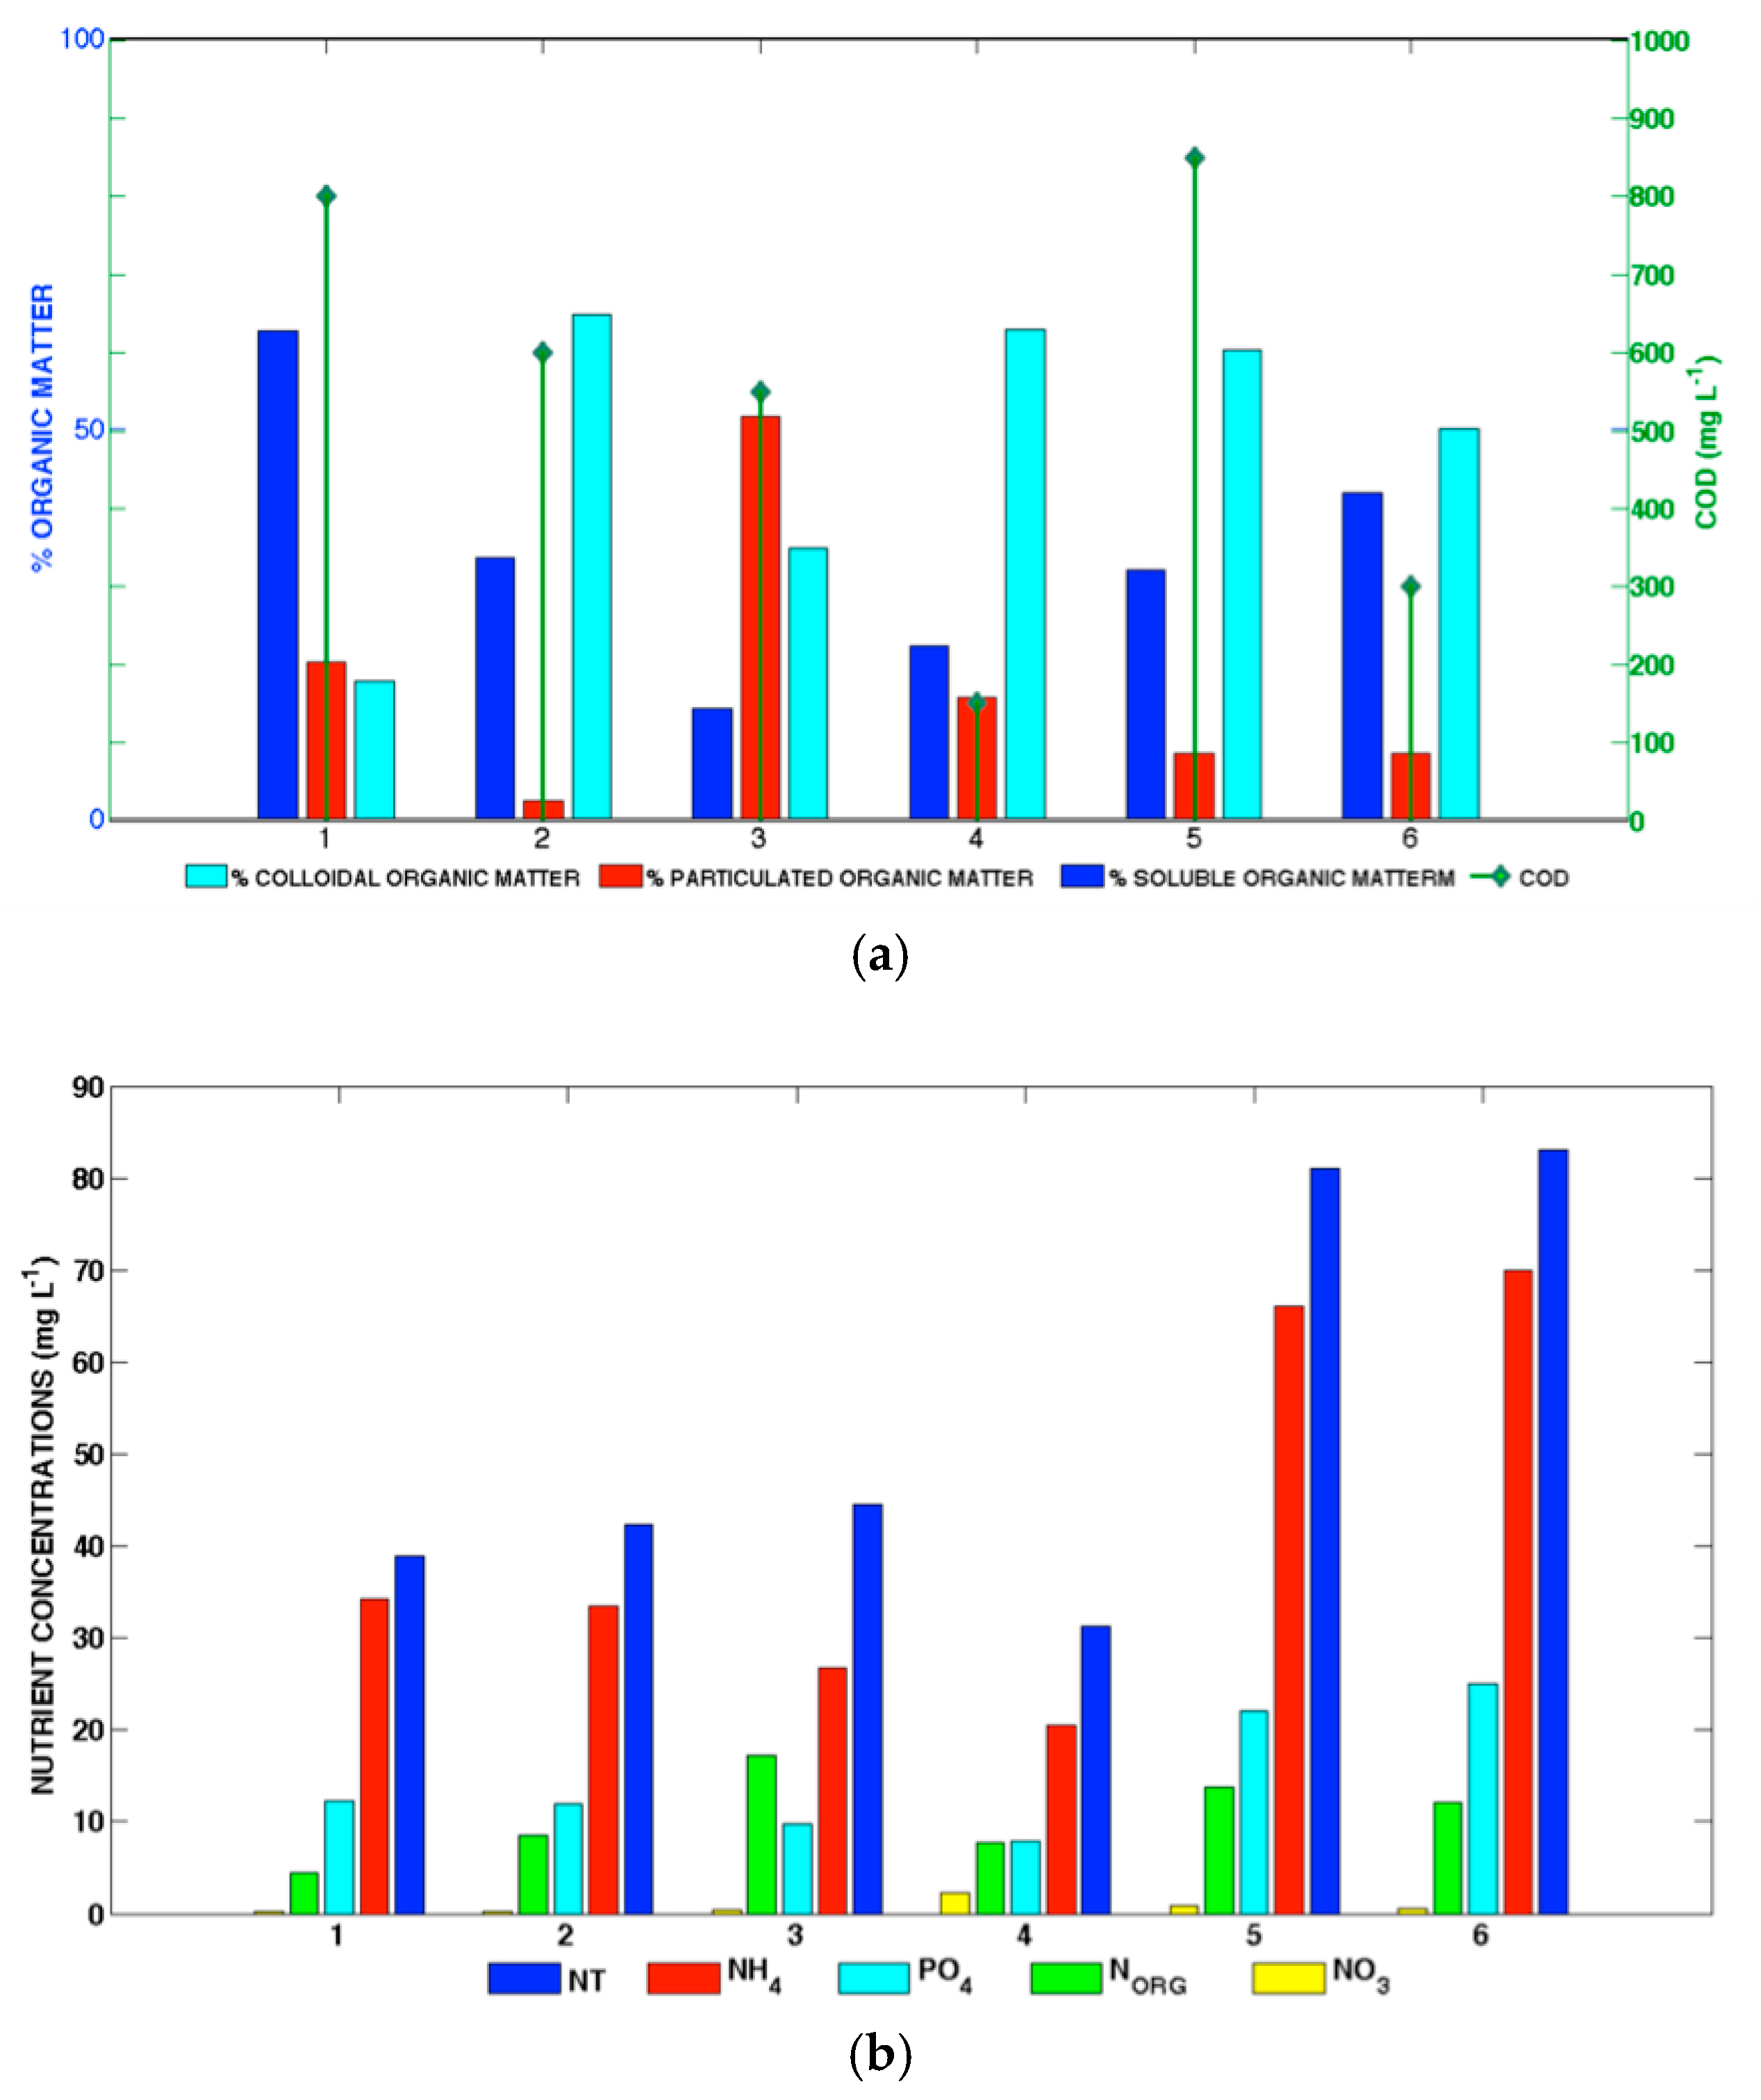
Figure 1. Description of the aeration control where DO, ORP, OUR and NOUR are used to manage the organic matter in the vessel.
Water 11 00060 g001
Figure 2. Description of the supervisory control. (a) DO threshold. (b) ORP threshold. (c) Power levels of the aeration systems.
Water 11 00060 g002aWater 11 00060 g002b
Figure 3. Prototype. (a) Picture. (b) Diagram.
Water 11 00060 g003
Figure 4. Mean values of organic matter and nutrient concentrations of the six patterns used to characterize the 150 influent samples treated by the prototypes. (a) COD (colloidal, particulate and soluble organic matter percentages). (b) Nitrogen forms and Total Phosphorous.
Water 11 00060 g004
Table 1. Description of the six pollution patterns used to test the performance of the controllers.
PatternDescriptionOriginChallenge
1High concentration of biodegradable organic matterUrban wastewater with food industry discharges.Nitrogen and Phosphorous removal
2High concentration of colloidal organic matterUrban wastewater in dry seasonBalanced treatment of organic matter and nutrients
3High concentration of particulate organic matterUrban wastewater with sand infiltration in the sewer systemsRemoving of particulate organic matter
4Low concentration of organic matterUrban wastewater in wet seasonPrevent an excess of aeration
5High concentration of nutrients and organic matterUrban wastewater with agricultural industry dischargesAeration and non-aeration cycles should be long enough
6High concentration of nutrients, low concentration of organic matterUrban wastewater with anaerobic treatment supernatantsEfficient removal of nutrients
Table 2. Characterization of the six pollution patterns related to organic matter and nutrient content.
Pat.SamplesCOD (mg L−1)NH4+ (mg L−1)NO3 (mg L−1)TN (mg L−1)NORG (mg L−1)PO43− (mg L−1)
125 800 ± 5034.2 ± 9.60.193 ± 0.04538.9 ± 12.44.406 ± 1.34512.3 ± 2.1
240 600 ± 3533.5 ± 8.90.158 ± 0.08942.3 ± 19.18.441 ± 2.72411.9 ± 2.5
330 550 ± 3226.7 ± 3.40.334 ± 0.12344.5 ± 23.617.287 ± 4.9659.8 ± 1.4
425 150 ± 5620.5 ± 5.82.310 ± 1.50631.2 ± 15.77.708 ± 3.2147.9 ± 1.1
525 850 ± 3966.0 ± 7.20.897 ± 0.06781.0 ± 36.813.762 ± 4.25622.0 ± 4.2
65 300 ± 2370.0 ± 10.90.567 ± 0.02183.0 ± 12.412.099 ± 2.56925.0 ± 2.8
Table 3. Removal efficiencies, related to the each pattern, comparing the control with fixed thresholds (Fixed) and the multilevel adaptive control (Adaptive). Removal rates (in %): COD (RCOD), Total Nitrogen (RTN), Total Phosphorous (RTP), ammonium (RNH4) and denitrified nitrates (%DEN)).
PatternControlRCODRTNRTPRNH4%DEN
1Fixed9378569957
Adaptive9385679971
2Fixed8975669358
Adaptive9086719378
3Fixed9180689460
Adaptive9288739684
4Fixed8162349248
Adaptive8485589378
5Fixed9371528956
Adaptive9386669081
6Fixed9253418838
Adaptive9269619064
Table 4. Energy savings provided by the multilevel adaptive control when compared with the control with fixed thresholds.
Pattern123456
Saving (%)8.312.715.621.916.922.7

