Article

Application of a Fuzzy Two-Stage Chance Constrained Stochastic Programming Model for Optimization of the Ecological Services Value of the Interconnected River System Network Project in the Western Jilin Province, China

1
College of Environmental Science and Engineering, North China Electric Power University, Beijing 102206, China
2
College of New Energy and Environment, Jilin University, Changchun 130012, China
3
State Key Laboratory of Water Environment Simulation, School of Environment, Beijing Normal University, Beijing 100875, China
*
Authors to whom correspondence should be addressed.
Water 2019, 11(1), 68; https://doi.org/10.3390/w11010068
Submission received: 14 November 2018 / Revised: 18 December 2018 / Accepted: 27 December 2018 / Published: 2 January 2019
(This article belongs to the Section Water Resources Management, Policy and Governance)

Abstract

:
Incremental ecological service value is an important assessment indicator for ecosystem restoration projects, such as the interconnected river system network project in western Jilin Province, China. In this paper, a fuzzy two-stage chance-constrained stochastic programming (FTSCCP) model is proposed for the optimization of regional incremental ecological service value through adjustments to the original water diversions and ecological water supplement schemes for ecosystem restoration under different management requirements and scenarios. The proposed method can effectively address uncertainties such as fuzzy parameters, probability distributions, and random variables in optimizing processes simultaneously. The results reveal that, under the requirement of meeting the original plan, a decrease in restoration scale would mainly appear under low-flow scenarios, and for the other scenarios, the original plan would be fully realized with an increase in flood utilization and a decrease in normal water supplementation. For the requirement of maximizing the incremental ecological service value, the adjustments would mainly be increases in water supplementation for reed wetlands and marsh wetlands and decreases in water surface area, including fish ponds and crab ponds. The ecological service values would be 11,256.79 million CNY (Chinese Yuan), 16,465.11 million CNY and 17,639.59 million CNY under low-, normal- and high-flow scenarios, respectively, with increases of 3.2%, 6.9% and 14.5% compared to the values based on the requirement of meeting the original plan. The results would be helpful for guiding regional ecosystem restoration and water resource management in the western Jilin Province.

1. Introduction

Ecosystems are an important part of the environment that directly influence the survival and development of animals and humans through providing necessary ecological services [1,2,3]. In recent decades, significant progress has been made regarding the theory and assessment technologies used for ecological service evaluation, and ecological service value has become a significant indicator of ecosystem function [4,5,6,7,8]. Moreover, ecological service value can be used as an important assessment index of ecosystem restoration projects [9]. For example, in the western Jilin Province, an analysis of the ecological service value caused by interconnected river system network projects could improve the evaluation of wetland restoration projects and ecosystem restoration in general.
The project seeks to create an interconnected river system network combining water diversion, storage, irrigation, drainage and supplementation for significant regional lakes, ponds and wetlands, thus providing ecological services (e.g., supply services, adjustment services, support services, and culture services) by restoring and improving the ecosystems [10]. As a result, this project would generate certain ecological service values to the regional society, economy, and environment. Moreover, the project can efficiently utilize flood resources, which are always treated as a kind of natural disaster, and would not only generate a considerable additional benefit to the economy and society, but also reduce the possibility of flood risks through the optimal allocation and sustainable utilization of water resources. However, there are many uncertainties in the environmental water system, such as the variability in the availability of water resources (especially flood resources), stochastic variability in the water quotas of ecosystems, fuzzy variability in water requirements, and the complexity of the interconnected processes. All these uncertainties present challenges for optimal water resource allocation to maximize ecological service values [11,12,13].
Previously, several optimization approaches have been developed for water resource allocation and water resource management under uncertainty [14,15,16,17,18,19]. Among these approaches, two-stage stochastic programming (TSP) is an effective method for addressing problems where uncertain parameters are expressed as probability distribution functions, which can be easily integrated with other optimization approaches to address multiform uncertainties [20]. For example, Maqsood et al. [15] presented an interval-parameter fuzzy two-stage stochastic programming (IFTSP) method for the planning of water resource management systems under uncertainty. Xie et al. [21] developed an inexact two-stage water resource management model for multi-regional water resource planning in the Nansihu Lake Basin, China. In a previous study, Cai et al. [22] developed a double-sided chance-constrained integer linear program (DCCILP) method integrating double-sided chance-constrained programming (DCCP) with an integer linear program and applied the method to optimize the incremental ecological service value. However, few studies have been reported to address such multiple constraints as simultaneously fuzzy and random variables for optimization problems in the optimization of ecological service values.
Therefore, to add to the previous studies, in this article, a fuzzy two-stage chance-constrained stochastic programming model integrating fuzzy programming, two-stage programming, and chance-constrained stochastic methods has been developed and applied to research on the optimization of regional incremental ecological service values in the western Jilin Province under different policy scenarios through optimal water resource allocation to different ecosystems and the efficient utilization of flood resources. The results provide valuable advice to the regional decision-making authority for the development of optimal schemes and adjustments to water diversions, water resource allocation, and ecosystem restoration from different perspectives.

2. Case Study

The interconnected river system network project in the western Jilin Province is located in plains on the right bank of the Nenjiang River and east bank of the Songhua River and covers Baicheng City (including Zhenlai County, Da’an City, Taonan City, Tongyu County and Taobei District), Songyuan City (including Qian’an County and Qianguo County), and Changchun City (Nong’an County), with an area of 4.46 × 10⁴ km2. In this area, the main rivers are the Nenjiang River, Songhua River, Taoer River and Huolin River, and because of the regional distinctive geological conditions and water system changes, a large area of wetlands has been formed in low-lying lands and along the river banks. There are four national nature reserves, Xianghai, Momoge, Chagan Lake and Boluo Lake, among which Xianghai and Momoge have been listed as Ramsar sites, as significant habitats of international migratory birds and homes to the red-crowned crane, which plays an irreplaceable role in protecting global biodiversity. The geographical position of the project in western Jilin Province is shown in Figure 1.
However, since the 1970s, because of climate change and a reduction in natural inflow, a portion of rivers have dried, and the groundwater level has declined; combined with the unceasing regional population growth and reclamation of wetlands, these factors have led to the increasing shrinking of lakes, ponds and wetlands in this area. In 2014, the area of wetlands in western Jilin Province was approximately 24.41 × 10⁴ ha, only 43.6% of that in the 1950s. Moreover, some lakes have dried, and water quality has deteriorated gradually, threatening the habitat of rare and endangered protected animals (e.g., oriental white stork and white crane) and regional species diversity and leading to a serious decline in wetland ecological functions; these concerns have become the dominant problems of regional ecosystems.
The interconnected river system network project has been established for water supplementation to important lakes, ponds, and wetlands in the western Jilin Province, based on guaranteeing water supply for the regional economy and society by the rational allocation and utilization of flood resources. Moreover, the project could also recharge groundwater and restore and improve the ecological environment. The project plans to supply water resources to reservoirs, lakes and surrounding wetlands in western Jilin Province, with an average annual water diversion of 54,500 × 104 m3, including flood resources of 33,900 × 104 m3 and normal water diversions of 20,600 × 104 m3. According to the water supplementation scheme, this project would restore 5.81 × 10⁴ ha of wetlands, increase the water surface area by 4.27 × 10⁴ ha, and restore and expand lakes, ponds, and wetlands to a total area of 48.91 × 10⁴ ha, thus bringing considerable ecological service value to this area.

3. Model Formulation

3.1. Model Development

This study considers different uncertainties in water diversion and supplementation for lakes and ponds in the western Jilin Province, such as the fuzzy uncertainties of the dynamic development of restoring lake and pond areas in long-run programming, the upper and lower bounds of different ecological function zones (fish ponds, crab ponds, reed wetlands and marsh wetlands), and the stochastic uncertainty of rainfall and available flood resources in different scenarios, which would have a remarkable effect on water diversion and supplementation planning in western Jilin Province. The developed fuzzy two-stage chance-constrained stochastic programming (FTSCCP) model is considered suitable for addressing local issues. The objective function for the FTSCCP model is to maximize the reginal ecological services value by adjusting the water diversion plan and ecological water supplement scheme for different ecosystems. Therefore, the FTSCCP for the optimization of the ecological services value of the interconnected river system network project in western Jilin Province can be formulated as follows:
max f = i = 1 198 j = 1 4 k = 1 15 E B W i j k E I S j k F A i j i = 1 198 j = 1 4 k = 1 15 h = 1 3 p h P E B W i j k E I S j k D F A i j h i = 1 198 h = 1 3 p h ( C W I i Q A I i h + C W N i Q A I i h + C W F i Q A F i h )
where f is the total ecological services value (millions CNY) caused by water diversion and ecological water supplementation through an interconnected river system network project in the western Jilin Province; i denotes the lakes and ponds in the project region; j denotes different ecosystems in each lake or pond ( j = 1 for fish pond, j = 2 for crab pond, j = 3 for reed wetland, and j = 4 for marsh wetland); k denotes different ecological services in each ecosystem; h denotes different scenarios of rainfall and flood resources (h = 1, 2, and 3 for low-, normal-, and high-flow years, respectively); E B W i j k represents the service value of k in ecosystem j in lake or pond i (millions CNY/104 ha); E I S j k is a 0–1 parameter that represents whether ecosystem j has ecological service k or not; F A i j represents the initial planned supplementation area of ecosystem j (104 ha); p h denotes the occurrence probability of scenario h ; P E B W i j k denotes the reduction in unit value of service k in ecosystem j in lake or pond i when the water supplement is delivered (millions CNY/104 ha); D F A i j h denotes the adjustment to the water supplement area of ecosystem j in lake or pond i under scenario h (104 ha); Q A I i h , Q A N i h and Q A F i h represent the local water resources, the normal water supplement and the flood resources in lake or pond i under scenario h (104 m3); and C W I i , C W N i and C W F i represent the costs of water utilizations of local water resources, the normal water supplement and flood resources, respectively, in lake or pond i (millions CNY/104 m3).
Constraints:
(1)
Constraints for water diversion and supplementation
Q A P i h + Q A W i h ( Q A I i h Q L I i h ) + ( Q A I i h Q L N i h ) + ( Q A F i h Q L F i h ) , i , h
( A P i D A P i h ) Q W R i Q A P i h , i , h
j = 3 4 ( F A i j D F A i j h ) Q P i j Q A W i h , i , h
where Q A P i h and Q A W i h denote the amounts of water supplements for water surface areas and wetlands, respectively, in lake or pond i under scenario h (104 m3); Q L I i h , Q L N i h and Q L F i h denote the water conveyance losses of local water resources, the normal water supplement and the flood resources, respectively, in lake or pond i under scenario h (104 m3); A P i denotes the initial planned water surface area in lake or pond i (104 ha); D A P i h denotes the adjustment of the original schemes of water surface area in lake or pond i under scenario h (104 ha); Q W R i denotes the water demand quota of the water surface area in lake or pond i (104 m3/104 ha); and Q P i j denotes the water demand quota of ecosystem j in lake or pond i (104 m3/104 ha).
(2)
Constraints for the prioritization of water supplementation to different ecological function zones in each lake and pond
Q A W i h = { ( Q A I i h Q L I i h ) + ( Q A N i h Q L N i h ) + ( Q A F i h Q L F i h ) Q A P i h , i f   A P i D A P i h A P i min 0 ,   i f   A P i D A P i h A P i min   o r   Y i 3 , Y i 4 = 0 , i , h
( F A i 4 D F A i 4 h ) Q P i 4 = { Q A W i h ( F A i 3 D F A i 3 h ) Q P i 3 , i f   F A i 3 D F A i 3 h F A min i 3   a n d   Y i 4 = 1 0 ,   i f   F A i 3 D F A i 3 h F A min i 3   o r   Y i 4 = 0 , i , h
where A P i min is a fuzzy variable that denotes the minimum requirement of water surface area in lake or pond i (104 ha); this part reflects the priority of water supplementation with respect to water surface area (including fish pond and crab pond), reed wetlands, and marsh wetlands.
(3)
Scale constraints for different ecological function zones
A P i D A P i h 0 , i , h
F A i j D F A i j h 0 , i , j , h
j = 1 2 F A i j D F A i j h A P i D A P i h , i , h
F A i j D F A i j h F A max i j Y i j , i , j , h
( A P i D A P i j h ) + j = 3 4 ( F A i j D F A i j h ) P L A i , i , h
where F A max i j is a fuzzy variable that denotes the area limit of ecosystem j in lake or pond i (104 ha); P L A i denotes the planned area limit of lake or pond i (104 ha).
(4)
Constraints for the regional water diversion of different resources
Pr { i = 1 I r [ ( A P i D A P i j h ) Q W R i + ( F A i 3 D F A i 3 h ) Q P i 3 + ( F A i 4 D F A i 4 h ) Q P i 4 ( ω ) Q A I i h Q A N i h ] Q T F r h + R F r h ( ω ) } 1 θ r , r
Q A I i h Q I i , i , h
Q A N i h Q N i , i , h
where r denotes the administrative area division depending on different water resources; Q T F r h denotes the available flood resources in region r under scenario h (104 m3); R F r h denotes the rainfall in region r under scenario h (104 m3); and θ r denotes the probability of violating the constraint.
(5)
Other constraints
D A P i h 0 , i , h
D F A i j h 0 , i , j , h
In this part, the nonnegativity restriction of D A P i h and D F A i j h is to realize the purpose of maximization of ecological service value under low flow scenario, and optimal water resources allocations on the premise of achievement of the initial water supplementation schemes, under higher flow scenarios. Additionally, release the variables D A P i h and D F A i j h as real numbers would modify the proposed model above (model 1) into a new model (model 2), in which adjustments to the original ecosystem restoration schemes would increase or decrease, following the scale constraints of each ecosystem, for the purpose of maximization of ecological service value and full use of water resources under different scenarios.

3.2. Parameters

In this study, according to the water diversion planning of the interconnected river system network project in the western Jilin Province, local water resources and the normal water supplement are fixed, and the flood resources are stochastically uncertain and divided into three scenarios: low, normal, and high flow levels. The probabilities of each scenario and available flood resources are shown in Table 1, and the initial planned water supplement for different ecosystems in each region are shown in Table 2, according to the interconnected river system network project schemes in western Jilin Province. Table 3 lists the unit ecological service value of different ecosystems, which were determined based on service indexes (including 4 first-class indexes, 12 second-class indexes, and 15 third-class indexes) constructed for ecological service value assessment in the western Jilin Province in previous studies [22].

4. Results, Analysis and Discussion

The total incremental ecological service value was obtained by solving the developed FTSCCP model (model 1), with values of 10,912.32 million CNY, 15,400.50 million CNY, and 15,400.50 million CNY under scenarios of low, normal, and high flow levels, respectively. With an increase of available flood water resources under different scenarios, there would be adequate water resources for the planned water supplementation to regional lakes and ponds in the western Jilin Province. In low-flow years, insufficient water resources would lead to an adjustment of the initial water supplement schemes and reduction in ecological service value.

4.1. Incremental Ecological Service Values and Analysis of Restored Areas

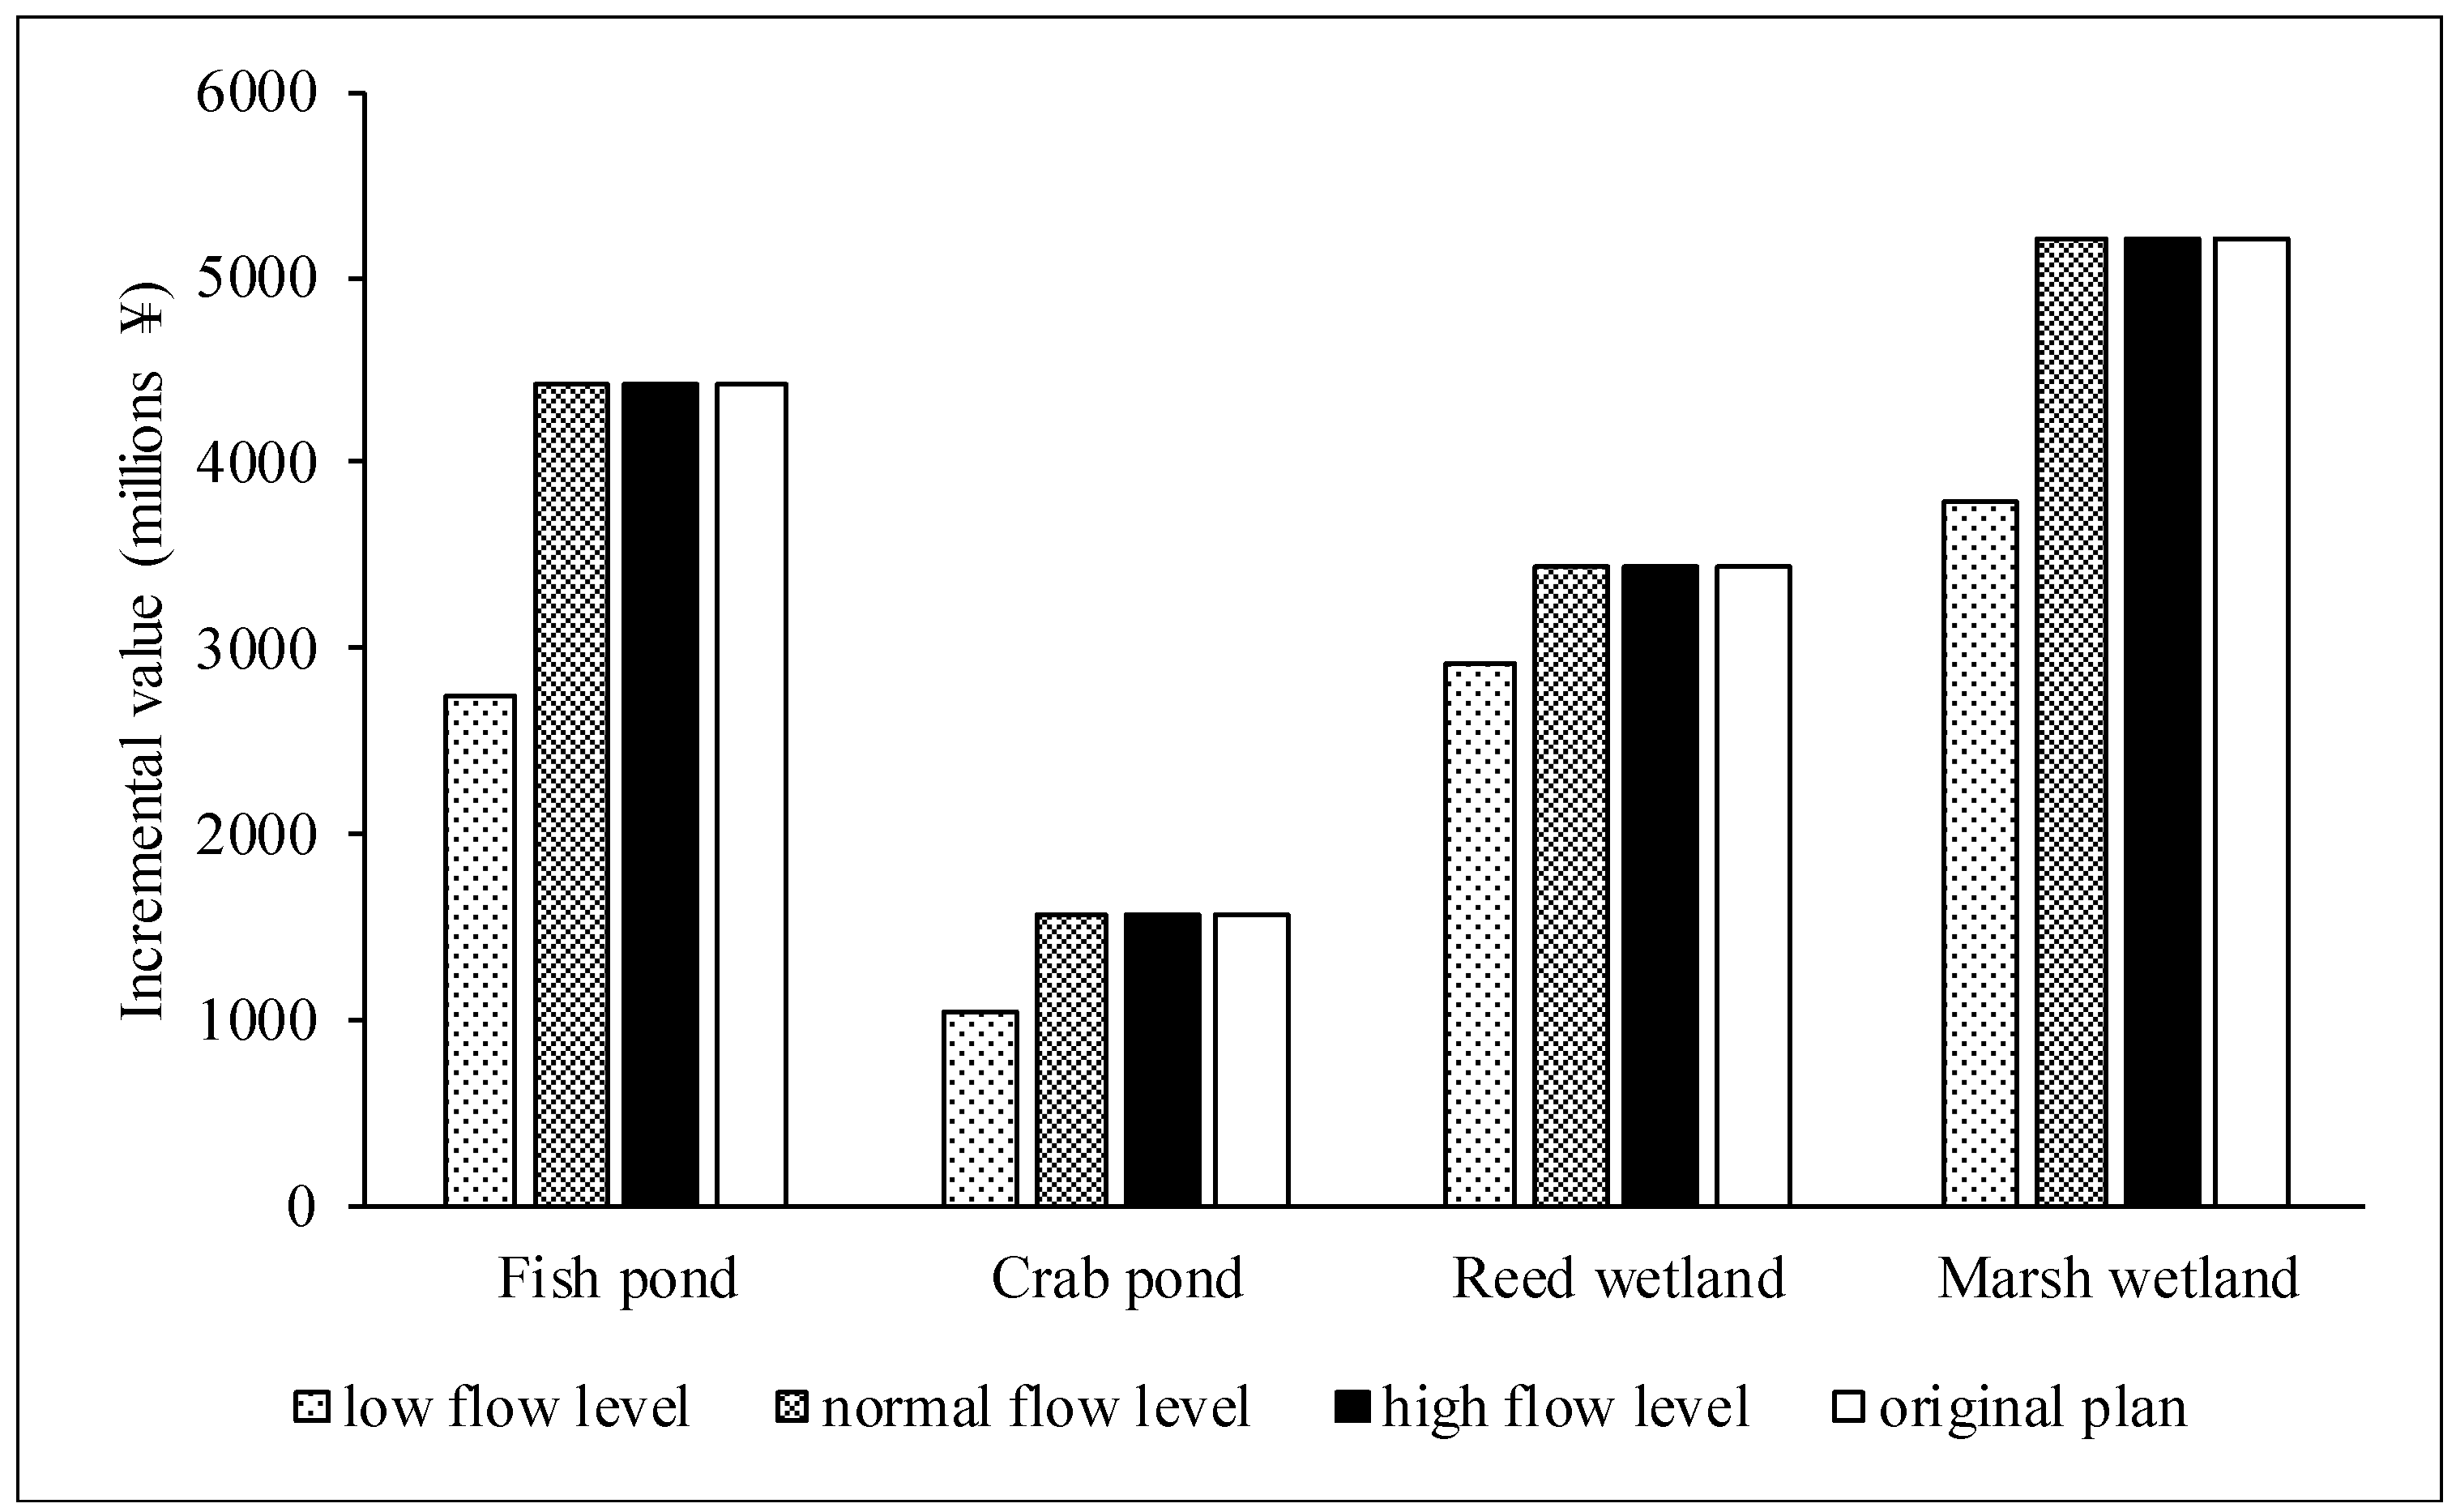
Figure 2 describes the total incremental ecological service values of different ecosystems in the western Jilin Province under low, normal, and high flow levels. With the same trend in total incremental ecological service value, the values for fish ponds, crab ponds, reed wetlands, and marsh wetlands under a low flow level would be 2735.88 million CNY, 1056.08 million CNY, 2923.11 million CNY, and 3797.77 million CNY, respectively, which are significantly lower than those obtained for normal and high levels, with reductions of 38.0%, 32.9%, 15.2%, and 27.1% compared to the original planning schemes.
Table 4 presents the trend in incremental ecological service values based on the ecological service assessment index system under different scenarios in the western Jilin Province. The ecological service values of all assessment indexes would decrease under a low flow level. Taking the third-class indexes as an example, the ecological service values of 10 indexes (e.g., fish, crab, water supply, water storage and regulation, and biodiversity) would significantly decrease with respect to the original planning schemes, with reductions of more than thirty percent. In addition, the value proportions of 9 indexes (fish, crab, and water supply) would decrease from the original levels; the proportion reductions of fish, crab, water supply, water storage and regulation would be 12.5%, 5.3%, 13.7%, 5.8%, and 3.8%, respectively, for biodiversity and all culture service indexes. For the other 6 indexes, the ecological value proportions would have a certain improvement, with values of 19.7% (reeds), 16.2% (carbon sequestration), 16.1% (oxygen release), 8.4% (microclimatic modification), and 9.3% (plant fixation and assimilative capacity). Among these indexes, the proportions of fish, reeds, water supply, carbon sequestration, and oxygen release have larger changes, and the changes in the ecological service value pattern would be highly affected under the low flow level.
Based on the above analysis, the planned scale of ecosystem restoration would not be realized in low flow years because of the decrease in flood water resources, leading to a decrease in ecological service values; furthermore, the values of indexes mainly from water surface ecosystems (e.g., fish, crabs, water supply, water storage and regulation) would present more significant decreasing trends.
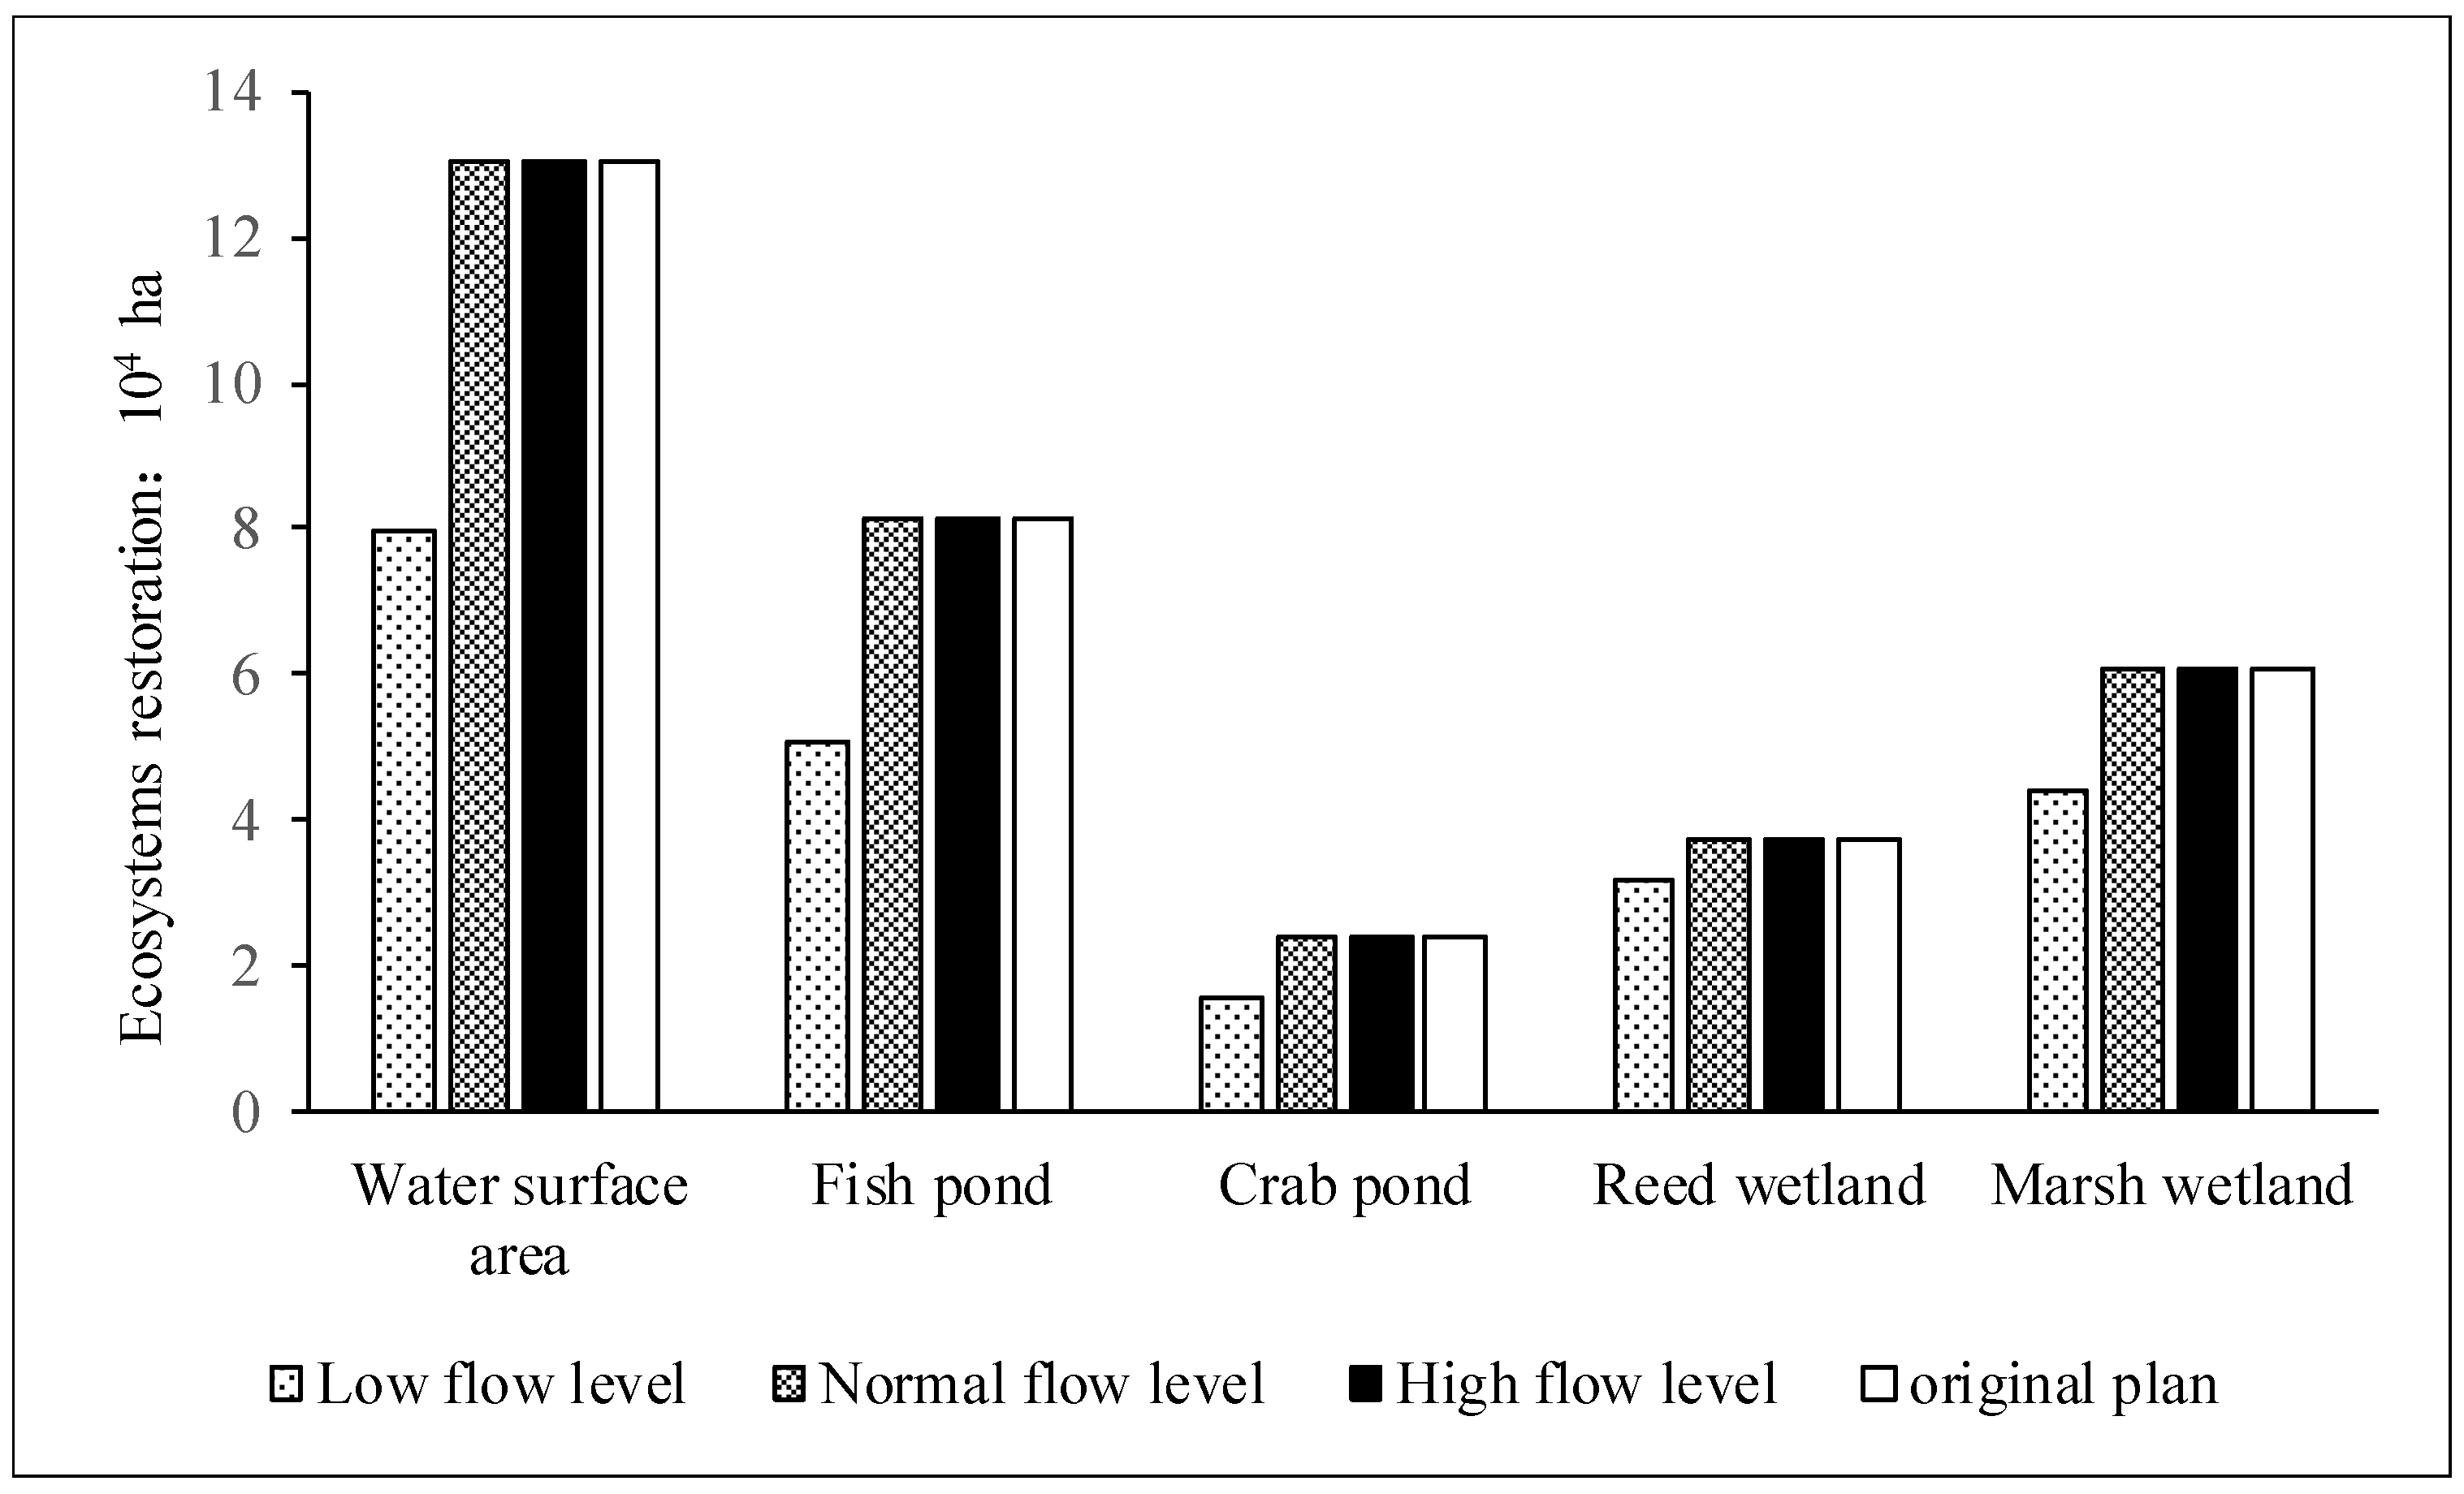
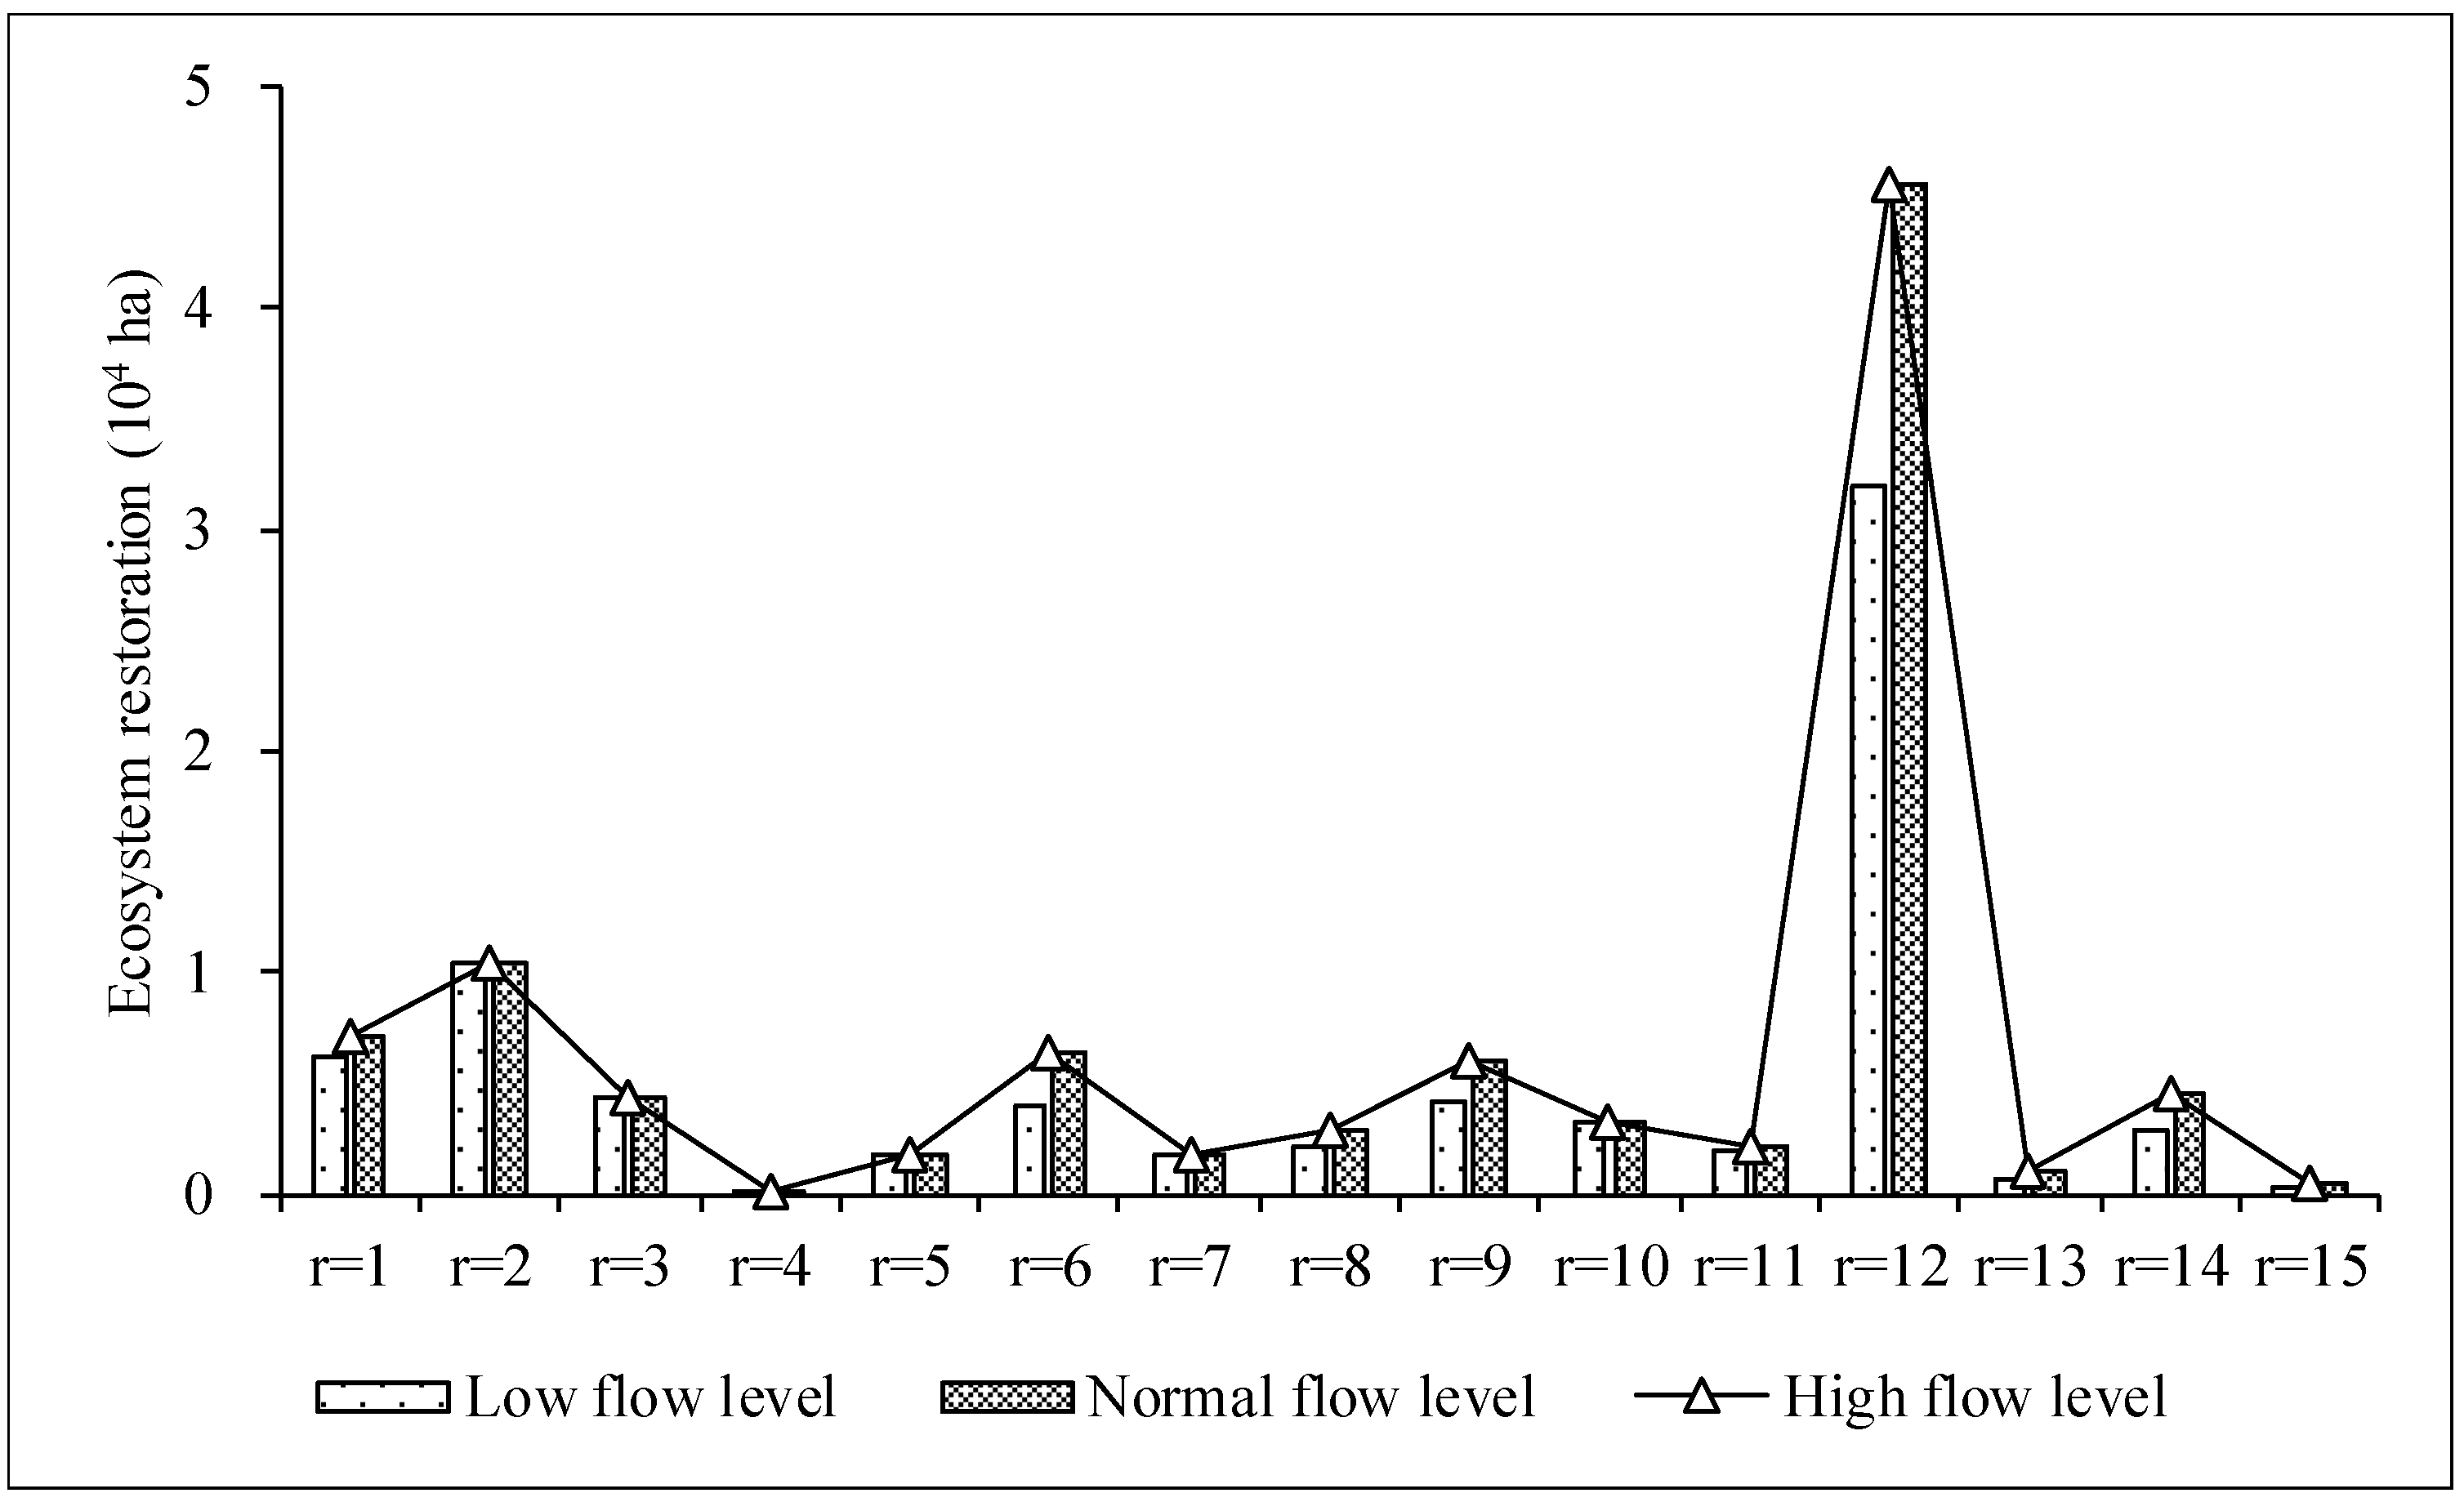
Figure 3 presents the restoration of water surface and ecosystem areas by water diversion and supplementation under different scenarios. The restored areas under the low flow level would be far smaller than those under normal and high flow levels, which are equal to the original planning schemes shown in Table 2. Compared to the original plans, in low-flow years, the areas of water surfaces, fish ponds, crab ponds, reed wetlands, and marsh wetlands would decrease by 39%, 38%, 33%, 15% and 27%, respectively. The water surface area, fish ponds and crab ponds show greater decreases, corresponding to the more significant decreasing trends in the values of indexes mainly from the water surface ecosystem.
Figure 4 and 
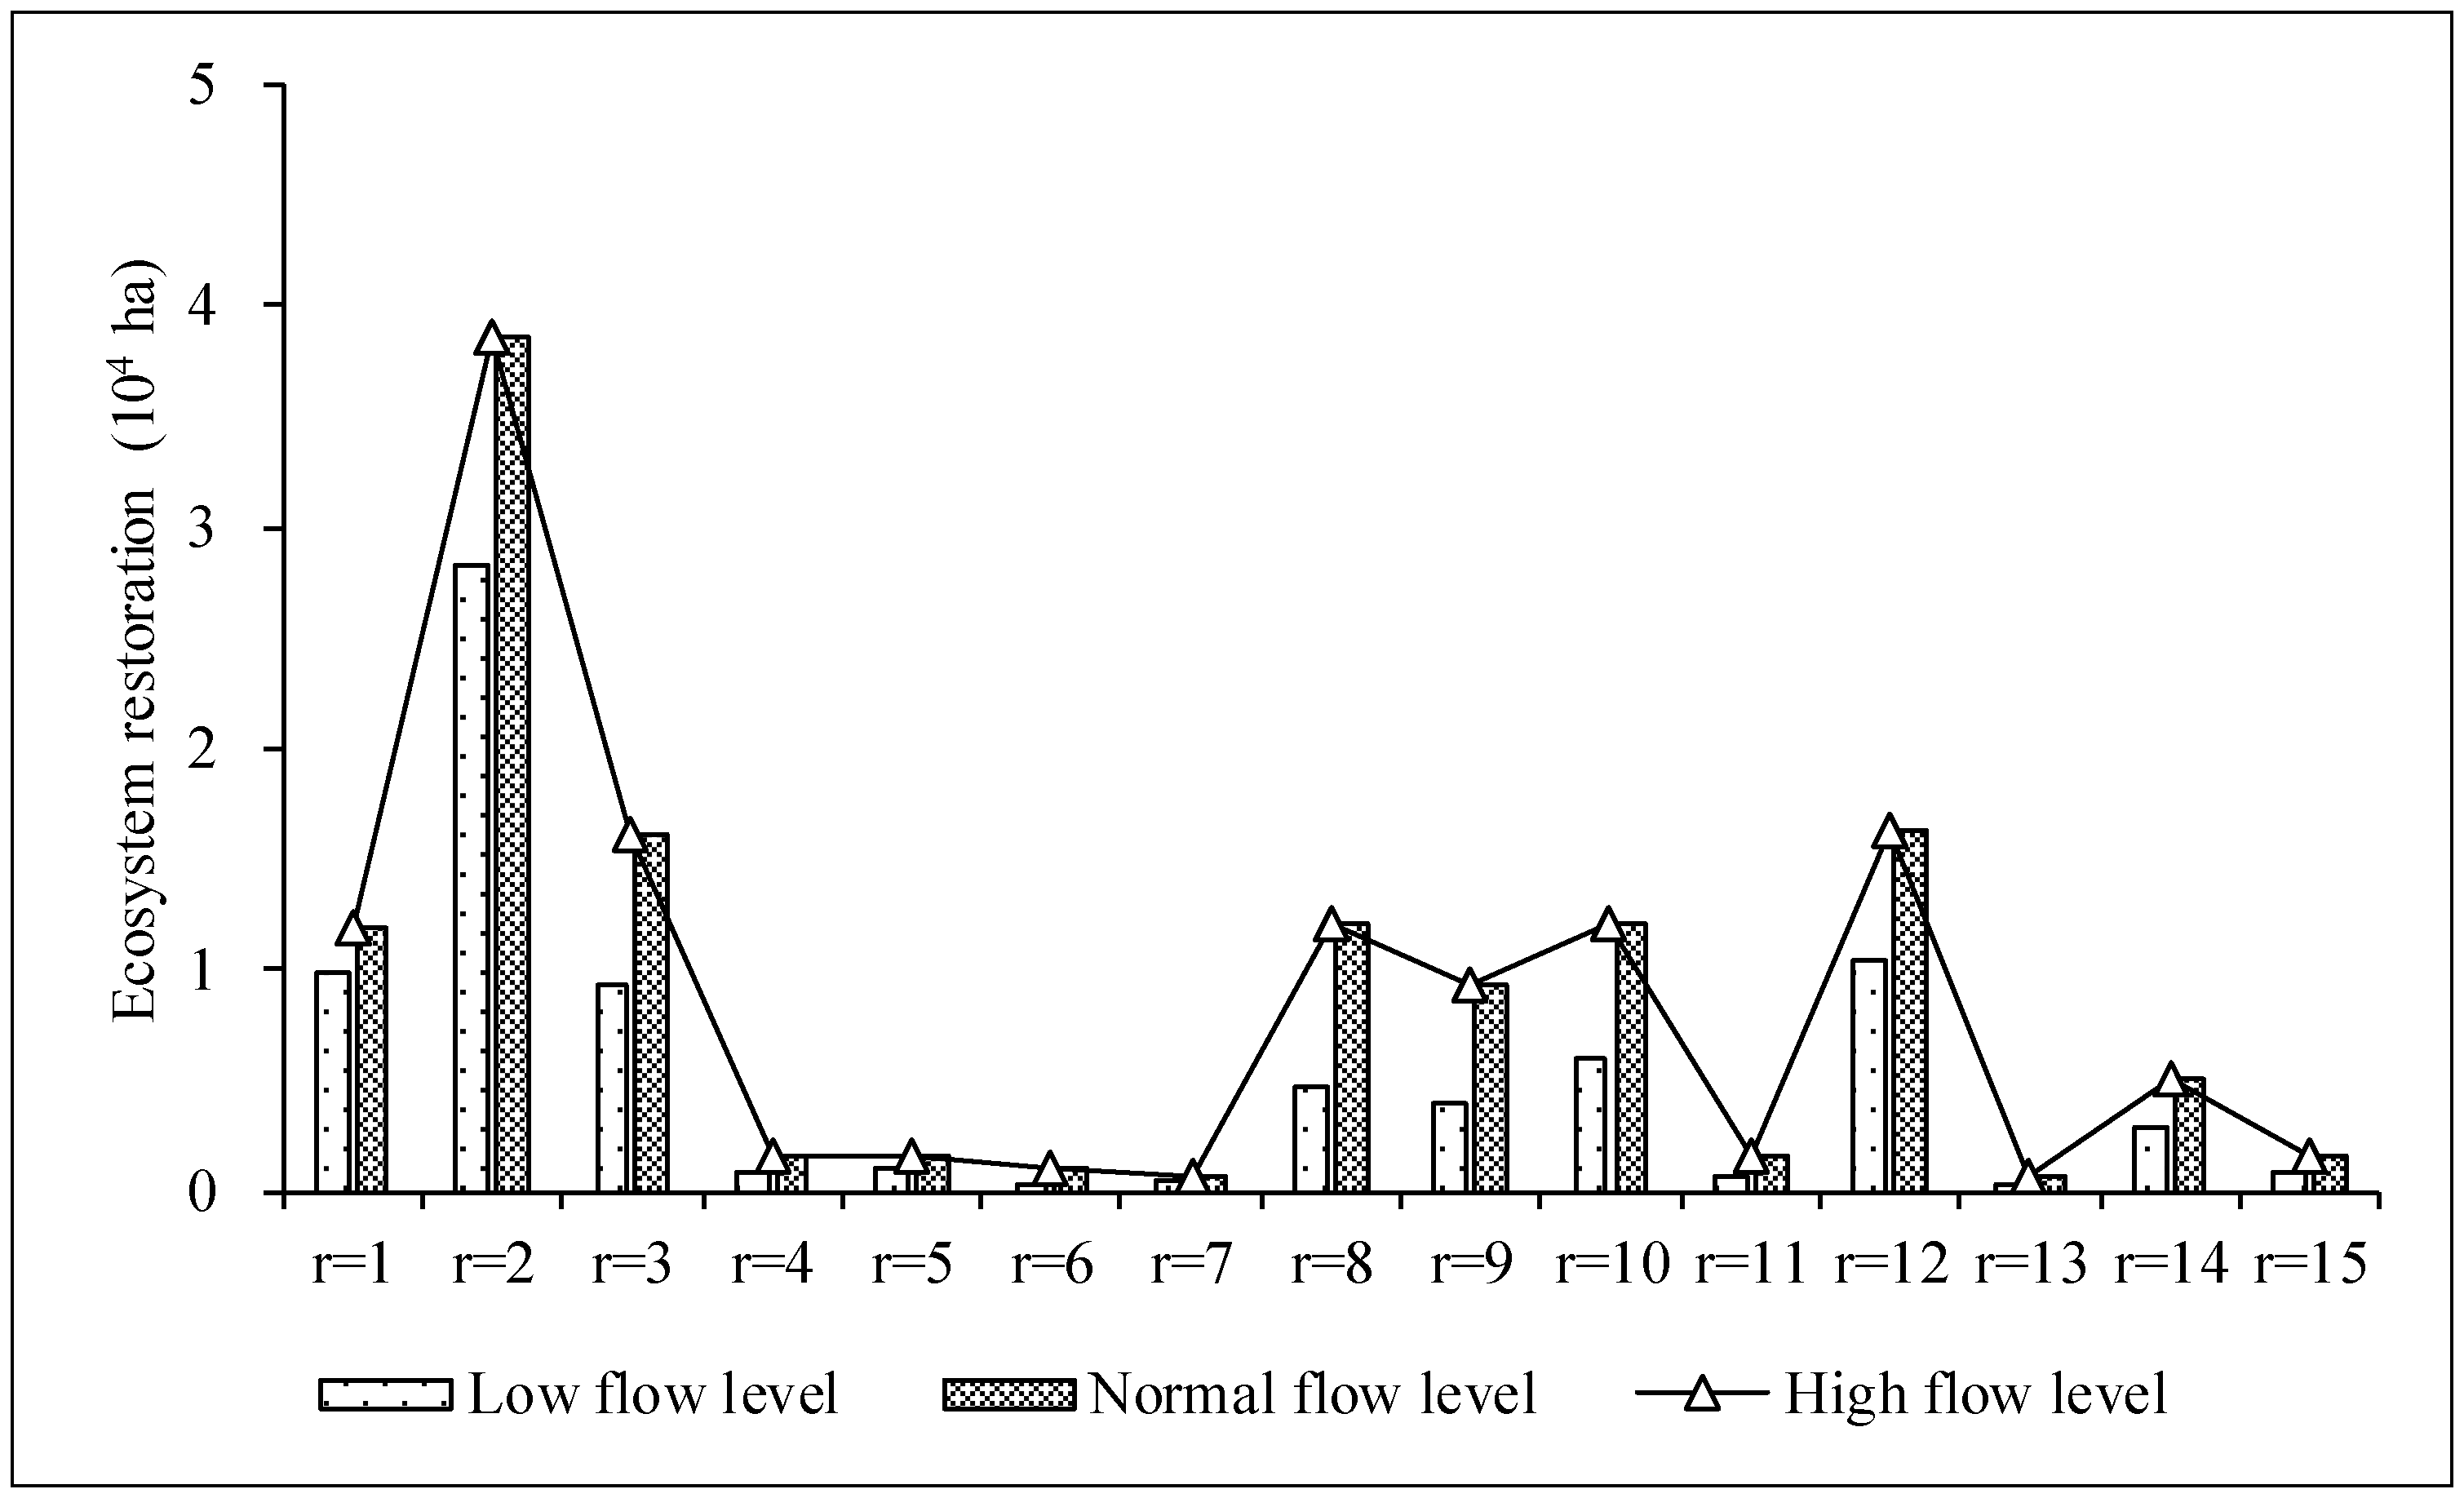
Figure 5 provide comparisons of the restored water surface area (including fish ponds and crab ponds) and wetlands under different scenarios in different regions. The figures show the same trends as those obtained for the whole western Jilin Province: the restored areas of water surfaces and wetlands under normal and high flow levels would be equal to those of the original planning schemes, and there would be decreases of different degrees under low flow levels. For example, in Nong’an County, Songhua River basin (r = 1), the restored water surface area under the low flow level would be 0.99 × 10⁴ ha, with a decrease of 17.1% compared with the original restored area of 1.20 × 10⁴ ha; in Qianguo County (r = 2), the restored water surface area under a low flow level would be 2.83 × 10⁴ ha, a decrease of 1.10 × 10⁴ ha or 26.6% with respect to the original plans; and in Tongyu County, Huolin River basin, the reduction would reach 65.1%, representing a decrease from 0.11 × 10⁴ ha to 0.04 × 10⁴ ha. For wetlands, in region 1, the restored area under a low flow level would be 0.61 × 10⁴ ha, a 14.3% decrease compared to that under normal and high levels; in region 6, the decreased area would be 0.23 × 10⁴ ha, 36.7% that of the original planning scheme. However, in regions 2, 3, 4 and 5, there would be no decrease under a low flow level; these results show varying trends in different ecosystems and regions.
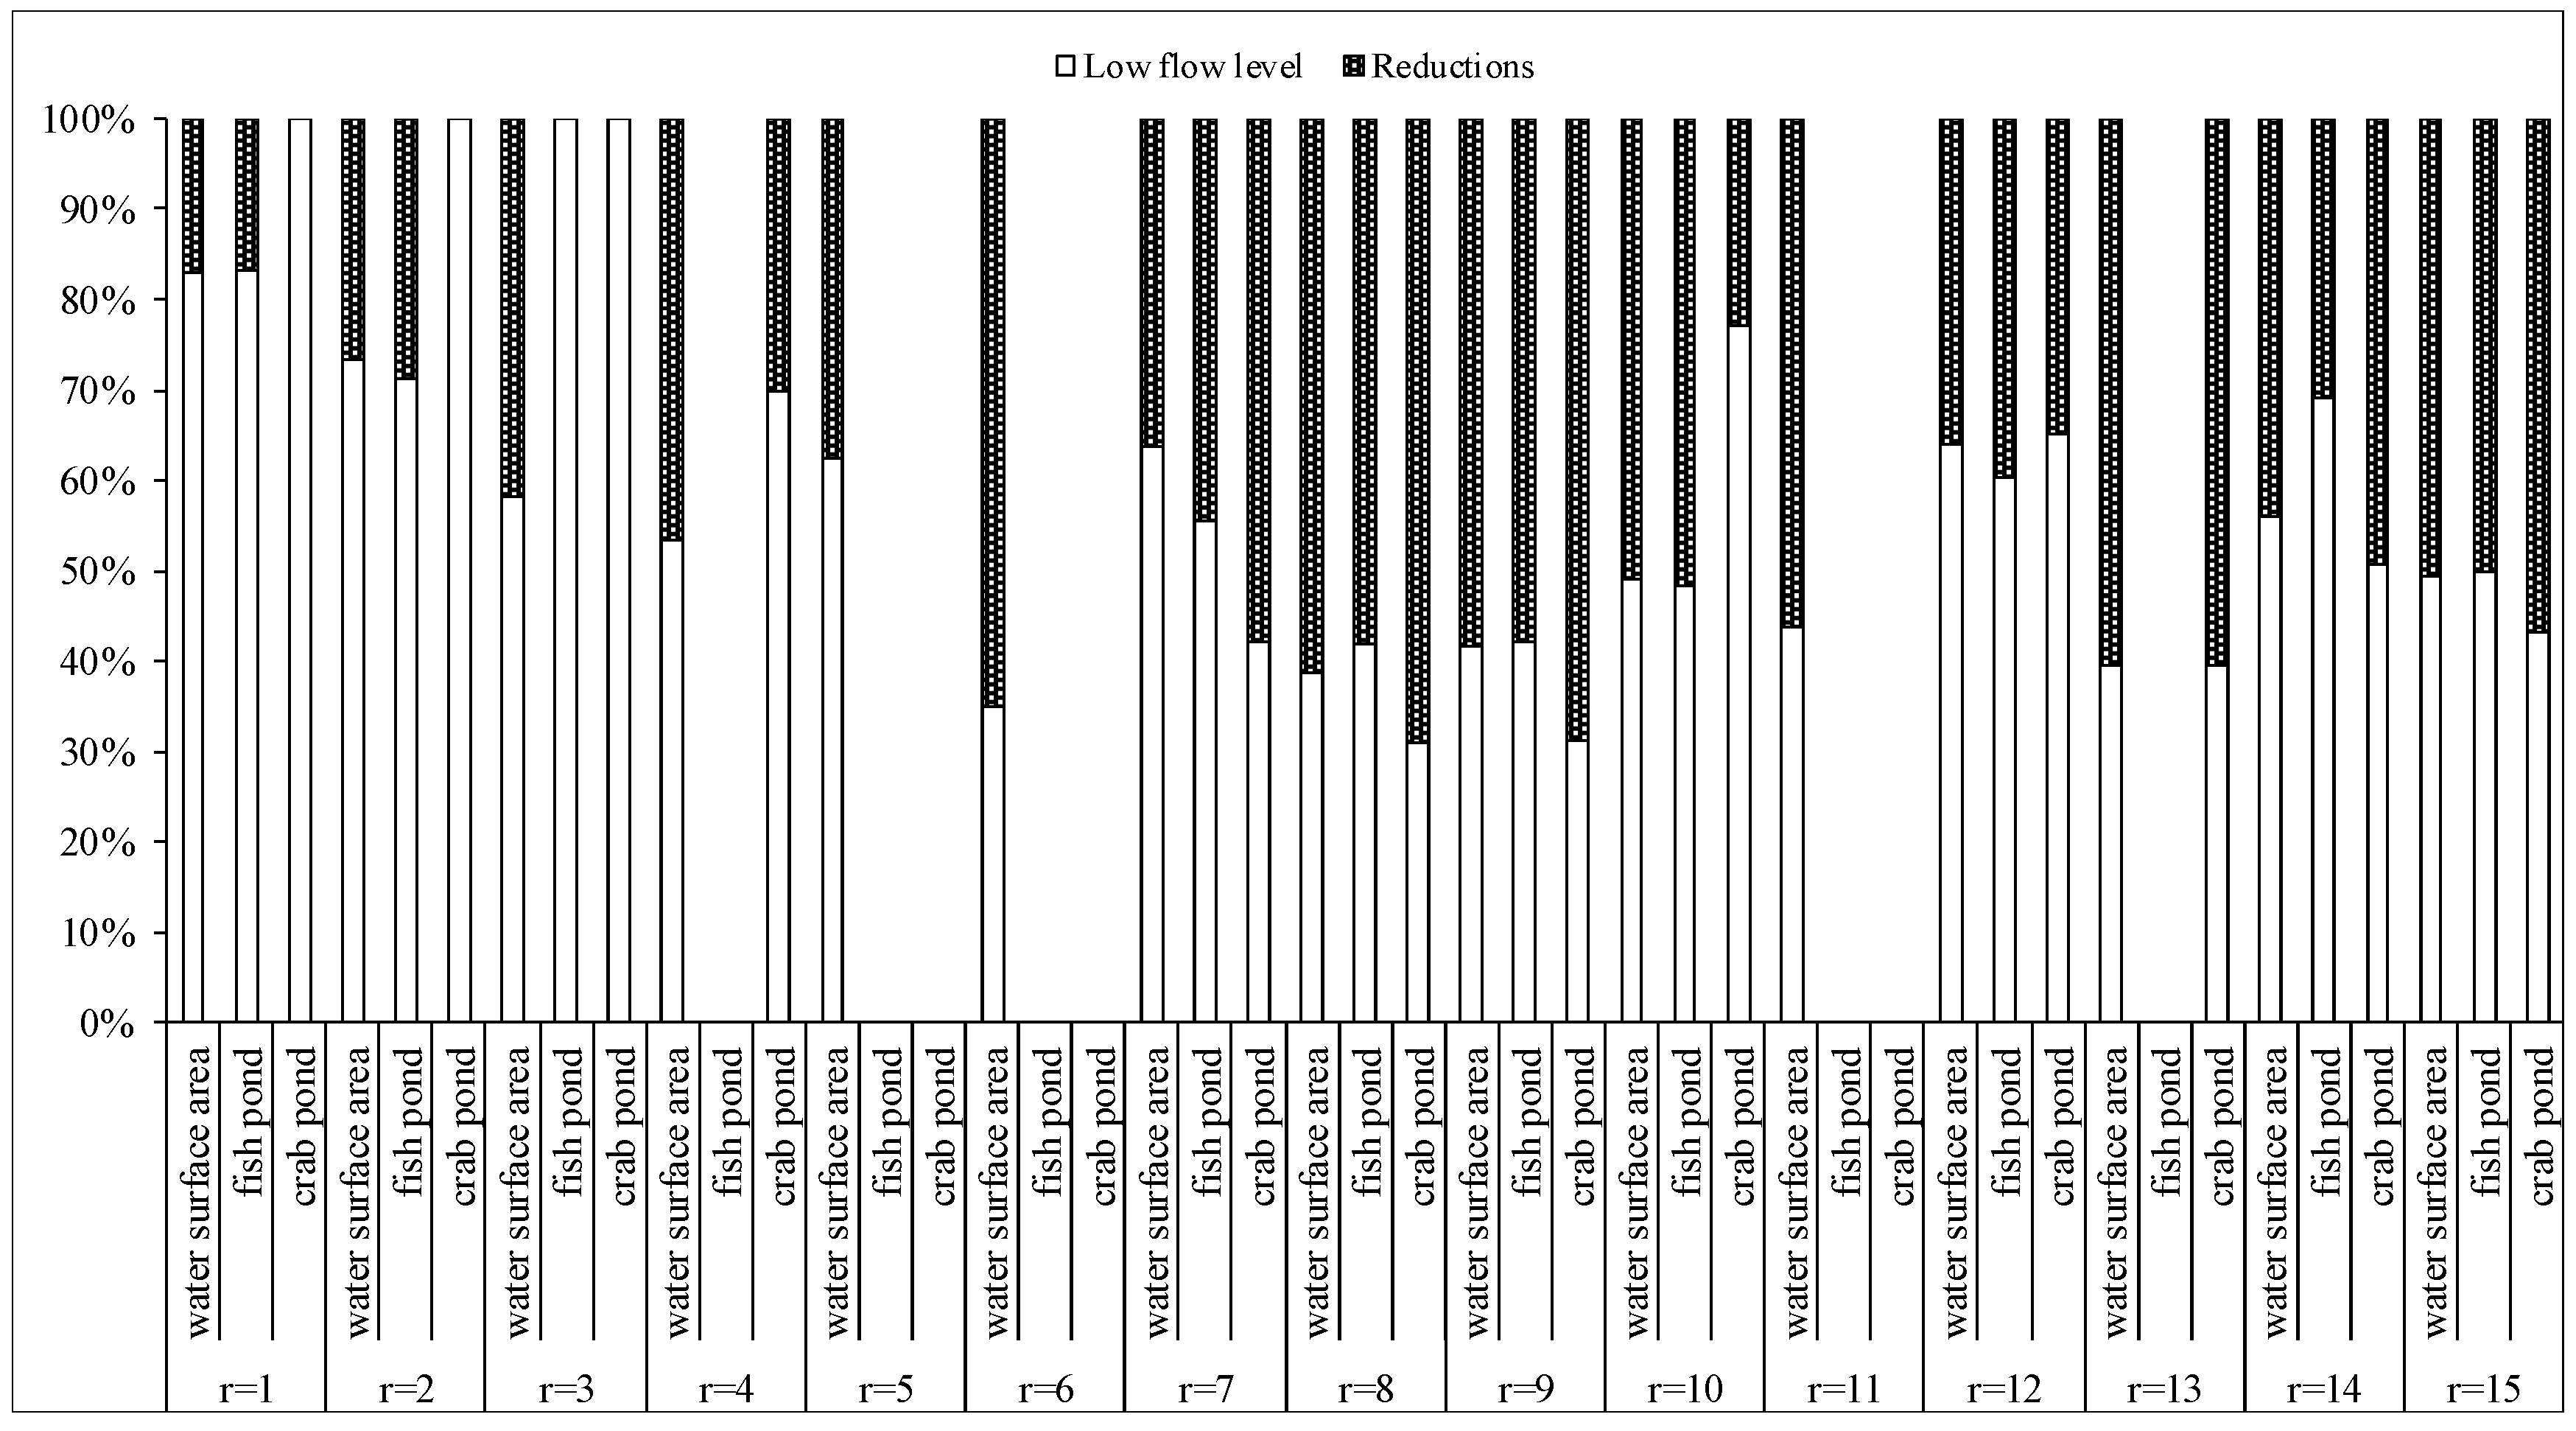
Figure 6 and Figure 7 describe the relative decreases in water surface area, fish ponds, crab ponds, reed wetlands, and marsh wetlands under low flow levels. Different ecosystems would show various degrees of decrease in each region. For example, in region 1, the decrease in water surface area, fish ponds, crab ponds, reed wetlands, and marsh wetlands would be 17.2%, 16.9%, 0, 25.1%, and 0, respectively; in region 7, the corresponding relative decreases would be 36.3%, 44.5%, 57.7%, 1.4%, and 0. The main reasons for these results are that (1) the ratio of ecological service value and water demand quota in marsh wetlands is higher than that in other ecosystems, and thus more water resources would be allocated to marsh wetlands when the minimal water requirements of each ecosystem were satisfied; and (2) the development of fish and crab ponds as part of water surface area is different from those in other regions, leading to a difference in the relative decreases in water surface area, fish ponds and crab ponds. However, in regions 4 and 15, the decreases in marsh wetlands would be 100%, because the priority of water supplementation would be water surface area, reed wetlands, and marsh wetlands. In these regions, there would not be adequate water resources to supplement for the water surface area; as a result, no water resources would be supplied to restore wetlands.
In addition, regional ecosystem planning plays a significant role in optimal adjustments to the original ecosystem restoration planning schemes under low flow levels. For example, in regions 5, 6 and 11, there was no fish or crab breeding in the water surface area with a lower ecological service value; thus, water resources would be mainly supplied for reed wetlands and marsh wetlands, combined with different minimal requirements of water surface areas. The decreases in these regions would be 37.6%, 65.2% and 56.2%, respectively. For wetland ecosystems, in region 5, without reed wetland development, there would be no decrease in marsh wetlands; in region 11, the decreases in reed wetlands and marsh wetlands would be 10% and 0, respectively. However, in region 6, there would be a 23.8% and 40.0% decrease in reed wetlands and marsh wetlands, respectively; in this region, the priority of water supplementation and lack of water resources would play the leading role in the adjustment of water supplement schemes for the restoration of ecosystems.
Above all, differences in ecosystem structure would lead to different optimal adjustments of water supplementation planning schemes in lakes and regions. Nevertheless, the amount of flood resources and regional water resource structure for ecosystem water supplementation would be the key factors in adjusting the original water supplement schemes and maximizing the regional ecological service values.

4.2. Water Diversion and Supplement Analysis

Table 5 presents the water diversion schemes and adjustments to the original ecosystem restoration schemes in 15 regions in western Jilin Province under low flow level. The proportion of flood resources is a significant factor in adjusting the original ecosystem restoration schemes. For example, in region 1, flood resources only account for 20.1% of the total water resources, and there would be only 17.2% and 14.3% reductions in the restored water surface area and wetlands, respectively; in region 7, where the proportions of local water resources and normal supplementation reach 86.5%, the reductions would be 36.3% and 1.2%, respectively. In contrast, in region 6, there is no normal water supplement planning, and the amount of local water resources is only 755 × 104 m3/year. The reductions in restored water surface area and wetlands would reach 65.2% and 36.8%, respectively.
In addition, as shown in Table 5, the reductions in water surface area would be higher than the reductions in wetlands in each region. Taking region 1 as an example, Table 6 presents the water diversion schemes and reductions to the original ecosystem restoration schemes in regional lakes and ponds. In lakes 1 and 3, there would be adequate local water resources for the original ecosystem restoration schemes, and flood resources would be allocated to the other lakes with crab ponds and marsh wetlands, e.g., lakes 5 and 7. The flood resources at lakes 5 and 7 would be 484.97 × 10⁴ m3 and 365.89 × 10⁴ m3, respectively, accounting for 33.0% and 24.9% of the total water resources. There would be no reductions in crab ponds and marsh wetlands, and a 30% reduction in reed wetlands, which would only meet the minimal requirement. Moreover, in lakes 2 and 6, although the ecological service values of the water surface area and fish ponds are lower than that of the reed wetland, because of the higher minimal requirements for water surface area, there would be lower reductions in the water surface area and fish ponds than reed wetlands.
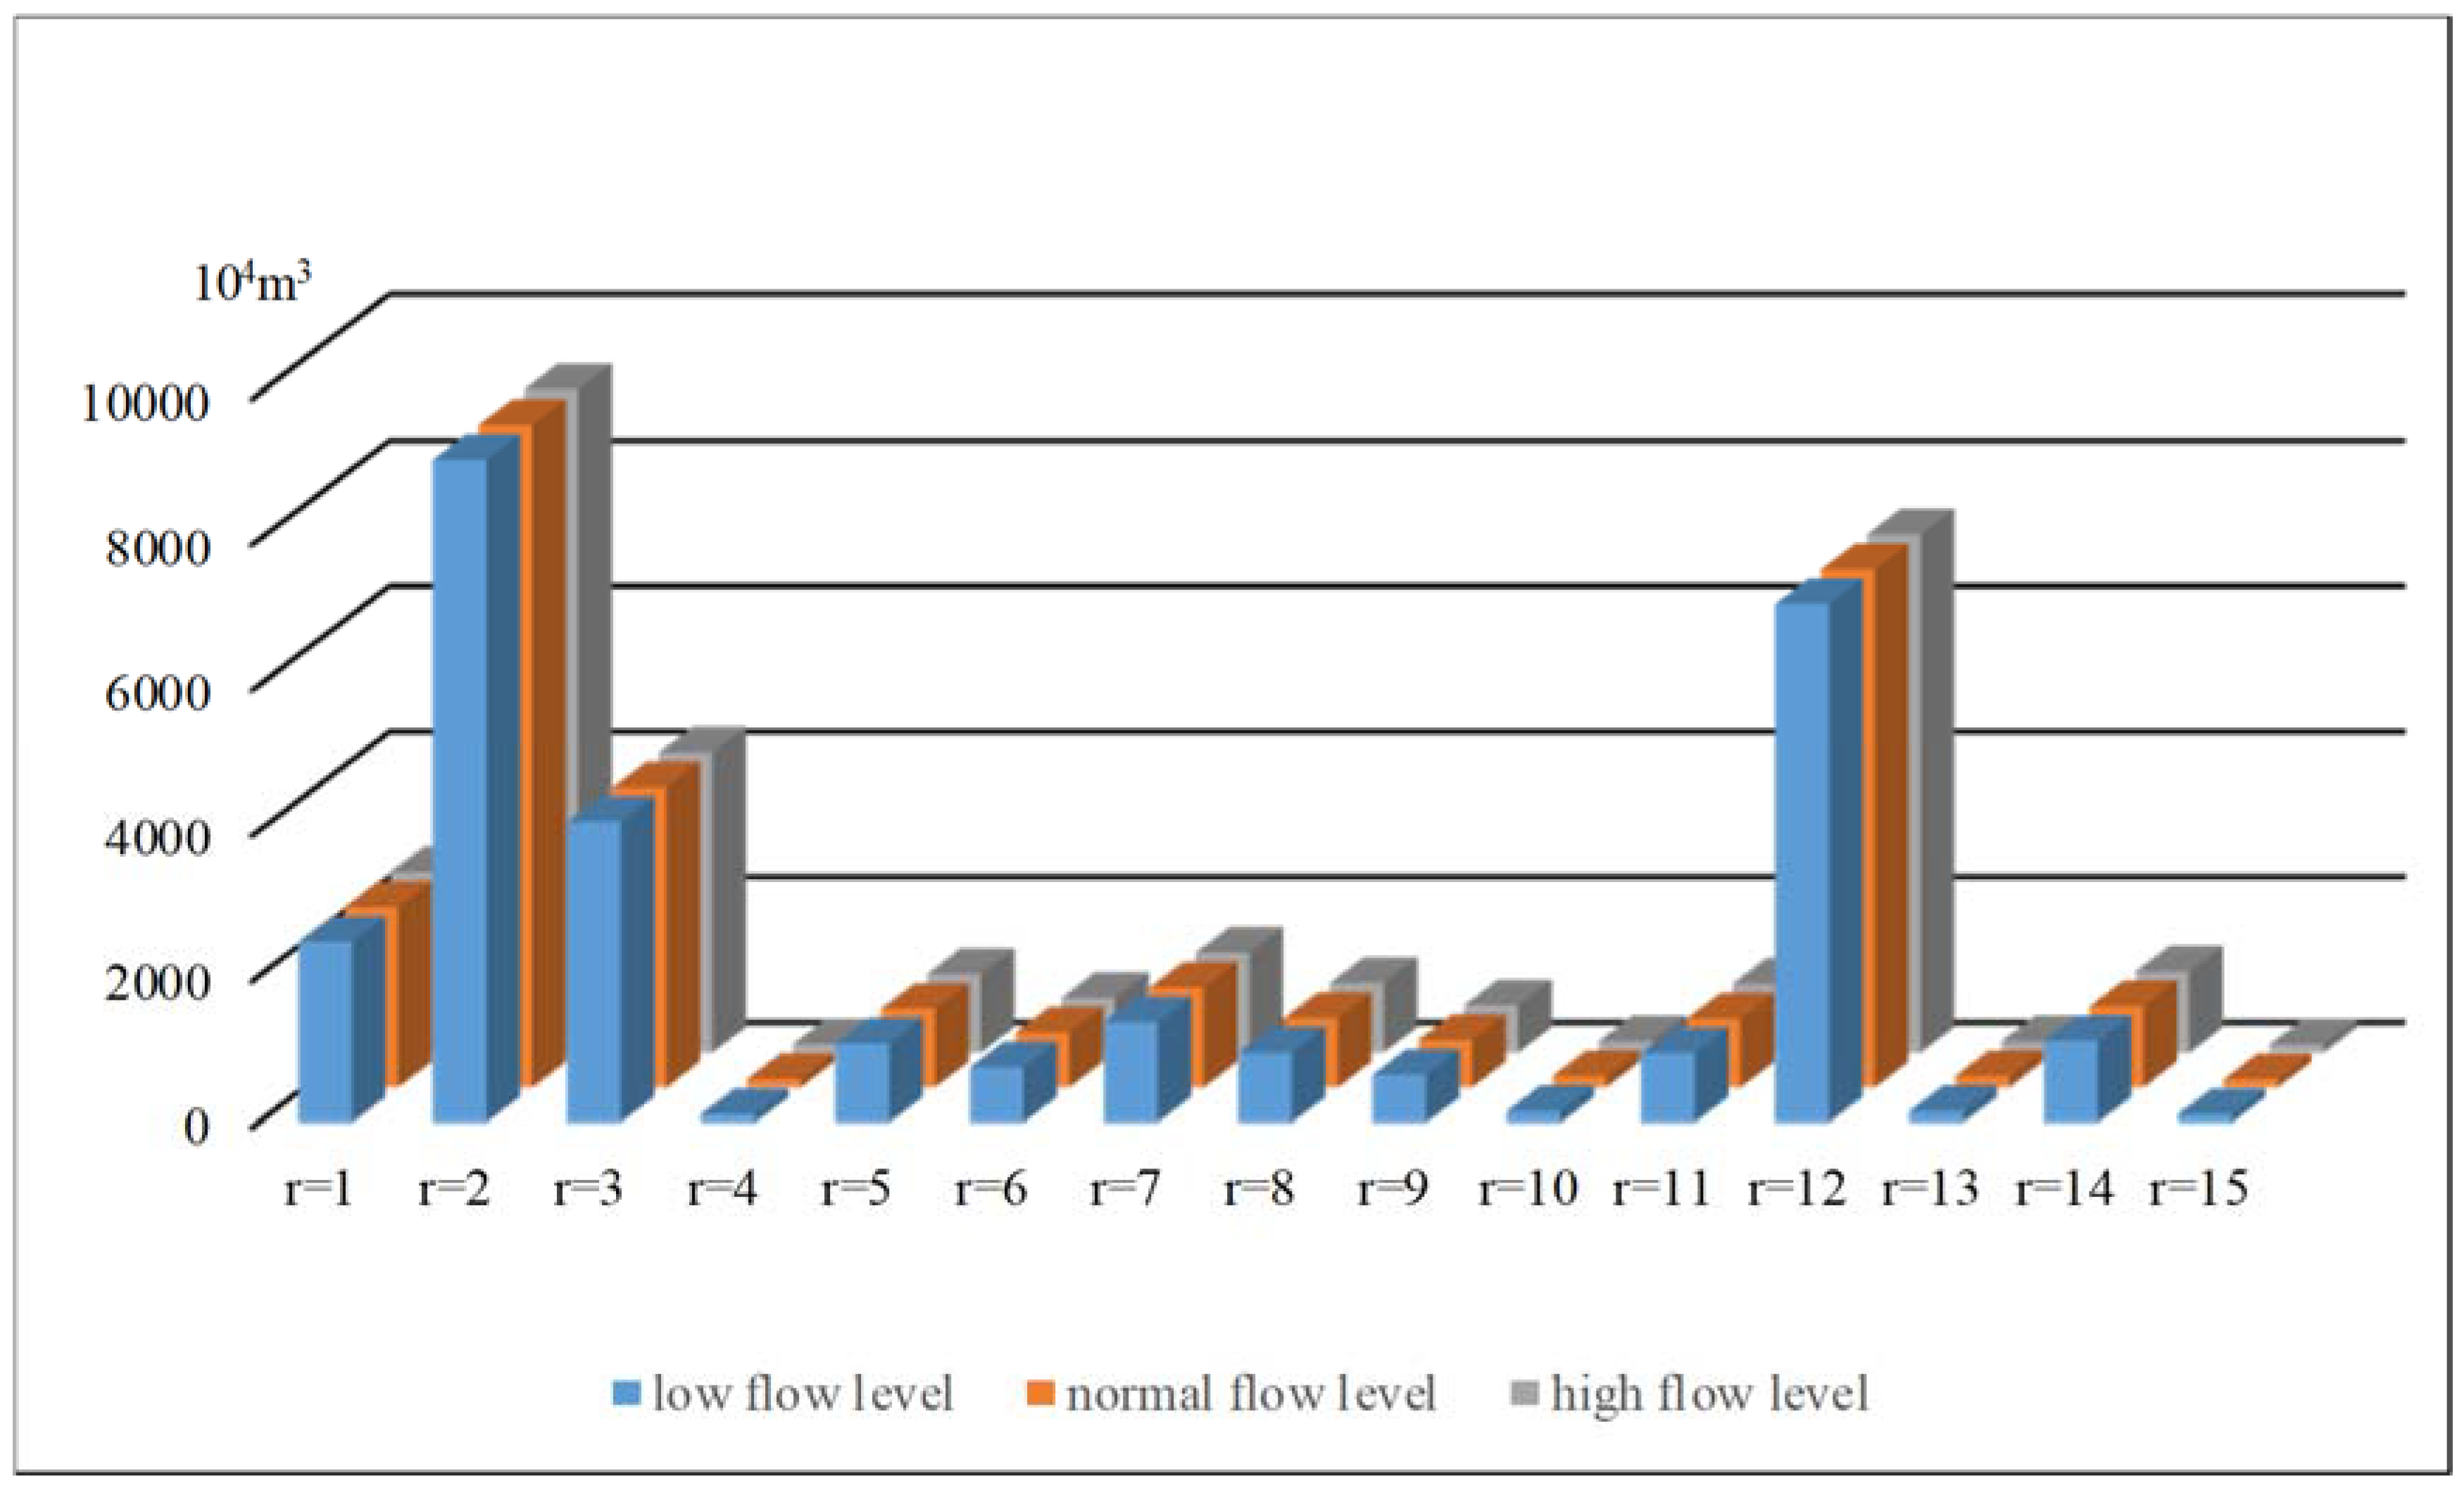
Figure 8, Figure 9 and 
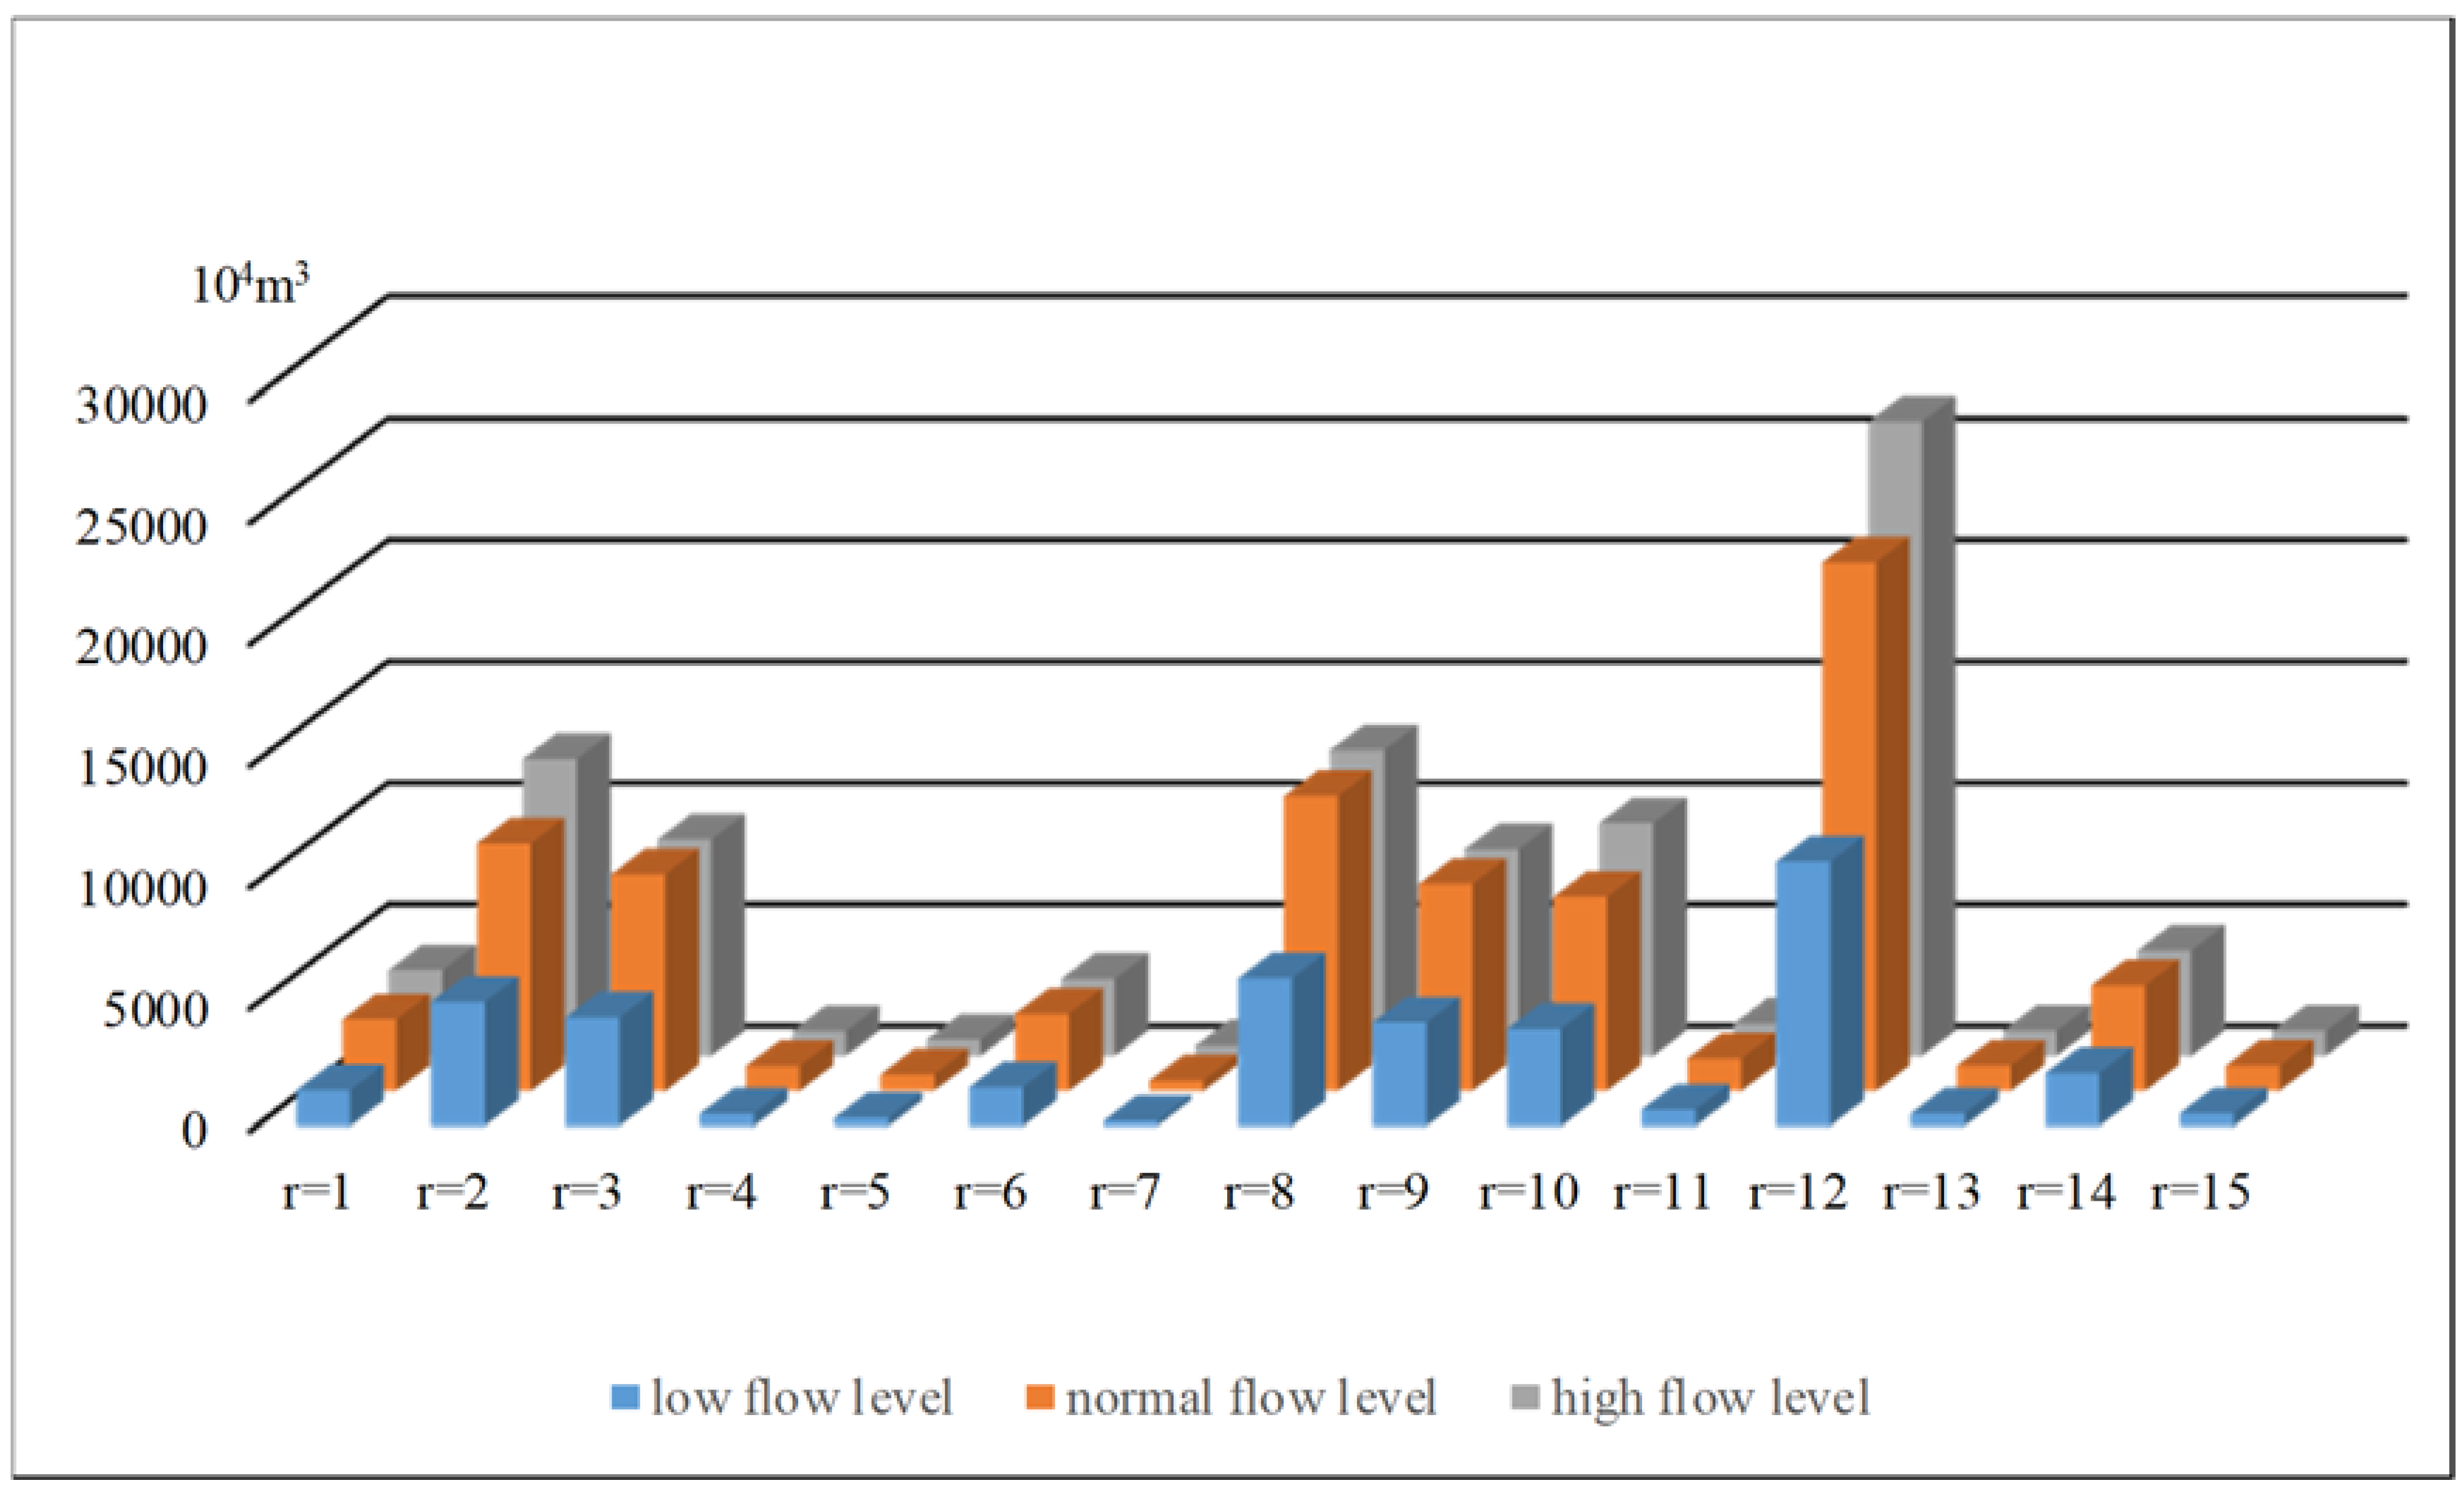
Figure 10 show the water diversion schemes of local resources, normal water supplementation and flood resources under different levels. Figure 8 shows that local water resources would have no change under the three scenarios, indicating that local water resources would be utilized prior to the other water resources.
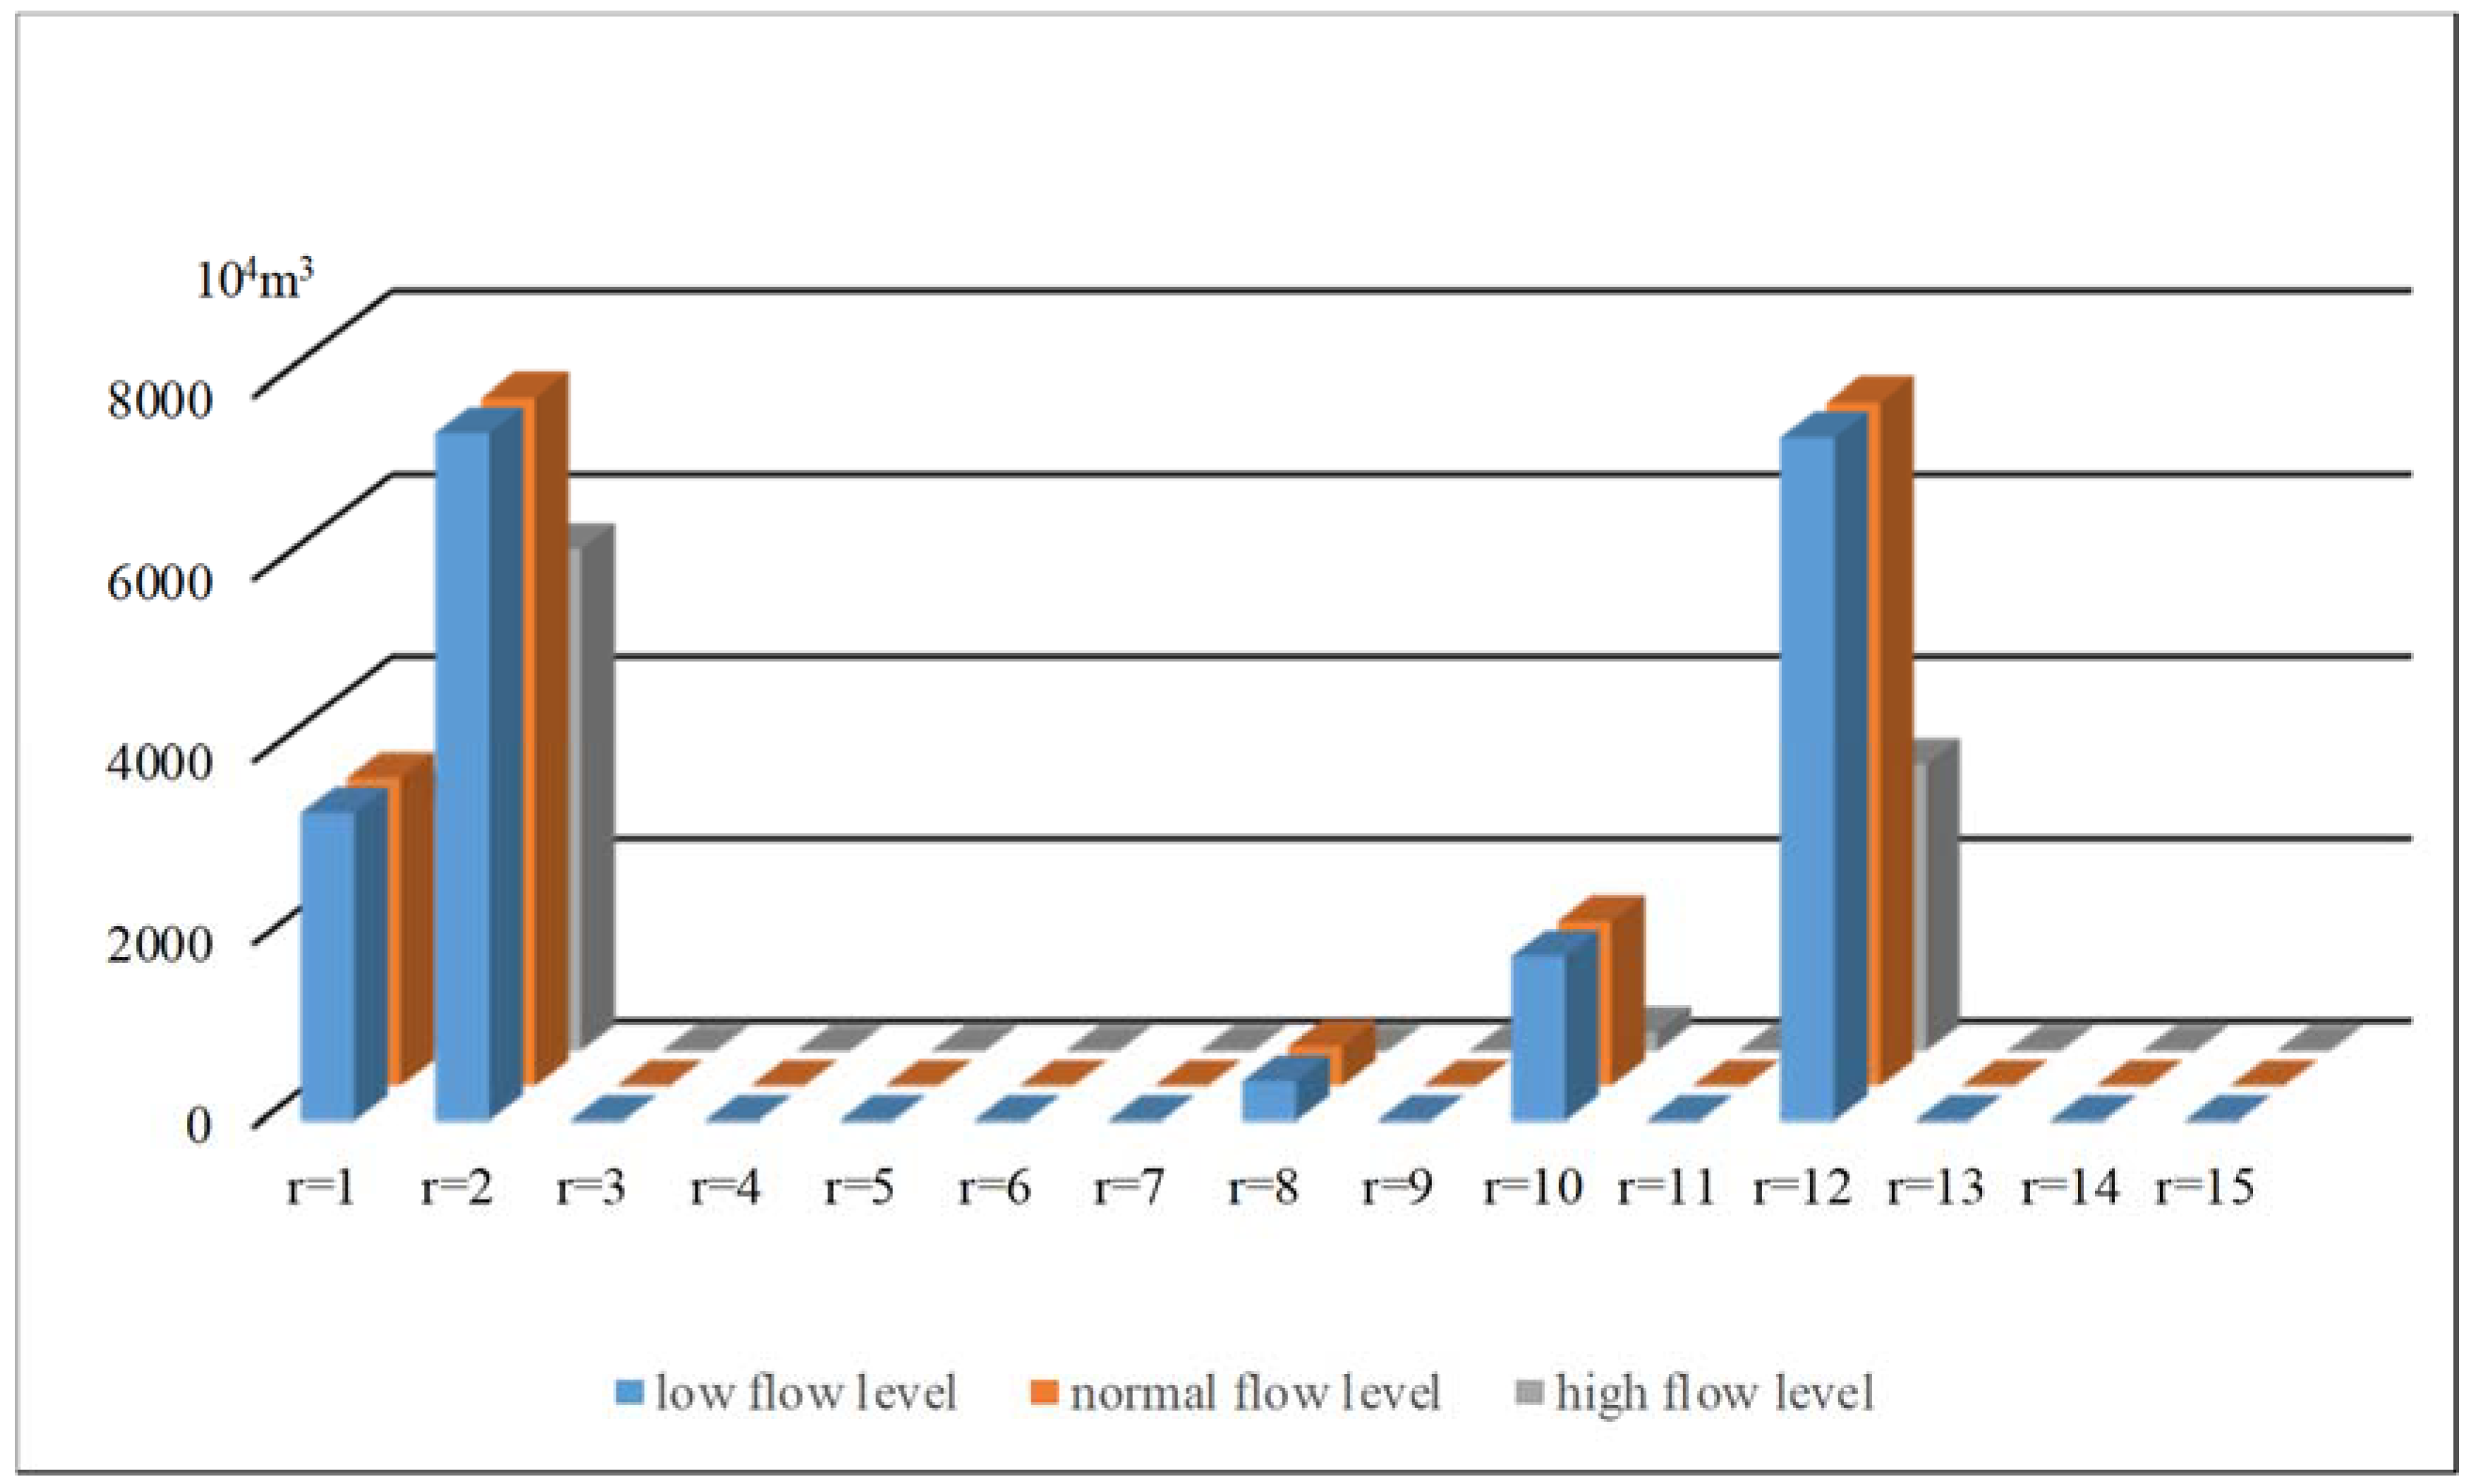
As shown in Figure 9 and Figure 10, only regions 1, 2, 8, 10, and 12 have planned normal water supplements. Along with the increase in available flood resources, under normal flow level, there would be no change in normal water supplementation and an obvious increase in flood resource utilization compared to those under a low flow level. Under a high flow level, there would be an obvious decrease in normal water supplementation and higher flood resource utilization than under a normal-level scenario. Because the original ecosystem restoration scheme could be realized under both normal- and high-flow-level scenarios, the proposed model would not only reduce normal water supplementation and the cost of water resources but also improve the utilization rate of flood resources, thus realizing higher effective water resource utilization.
However, this model was developed based on meeting the target of ecosystem restoration planning schemes to realize the optimal adjustment of the original plans under the low-flow-level scenario and water diversion schemes under normal- and high-flow-level scenarios, ignoring further developments in terms of ecosystems restoration and higher ecological service values. Meanwhile, this model would fail to make full use of flood resources and avoid possible flood risk under high-flow scenarios.

4.3. Study on the Maximization of Ecological Service Value

Compared to model 1, the total increase in ecological service value obtained by solving model 2 would be 3.2%, 6.9%, and 14.5%, with values of 11,256.79 million CNY, 16,465.11 million CNY, and 17,639.59 million CNY, under low-, normal- and high-flow scenarios, respectively.
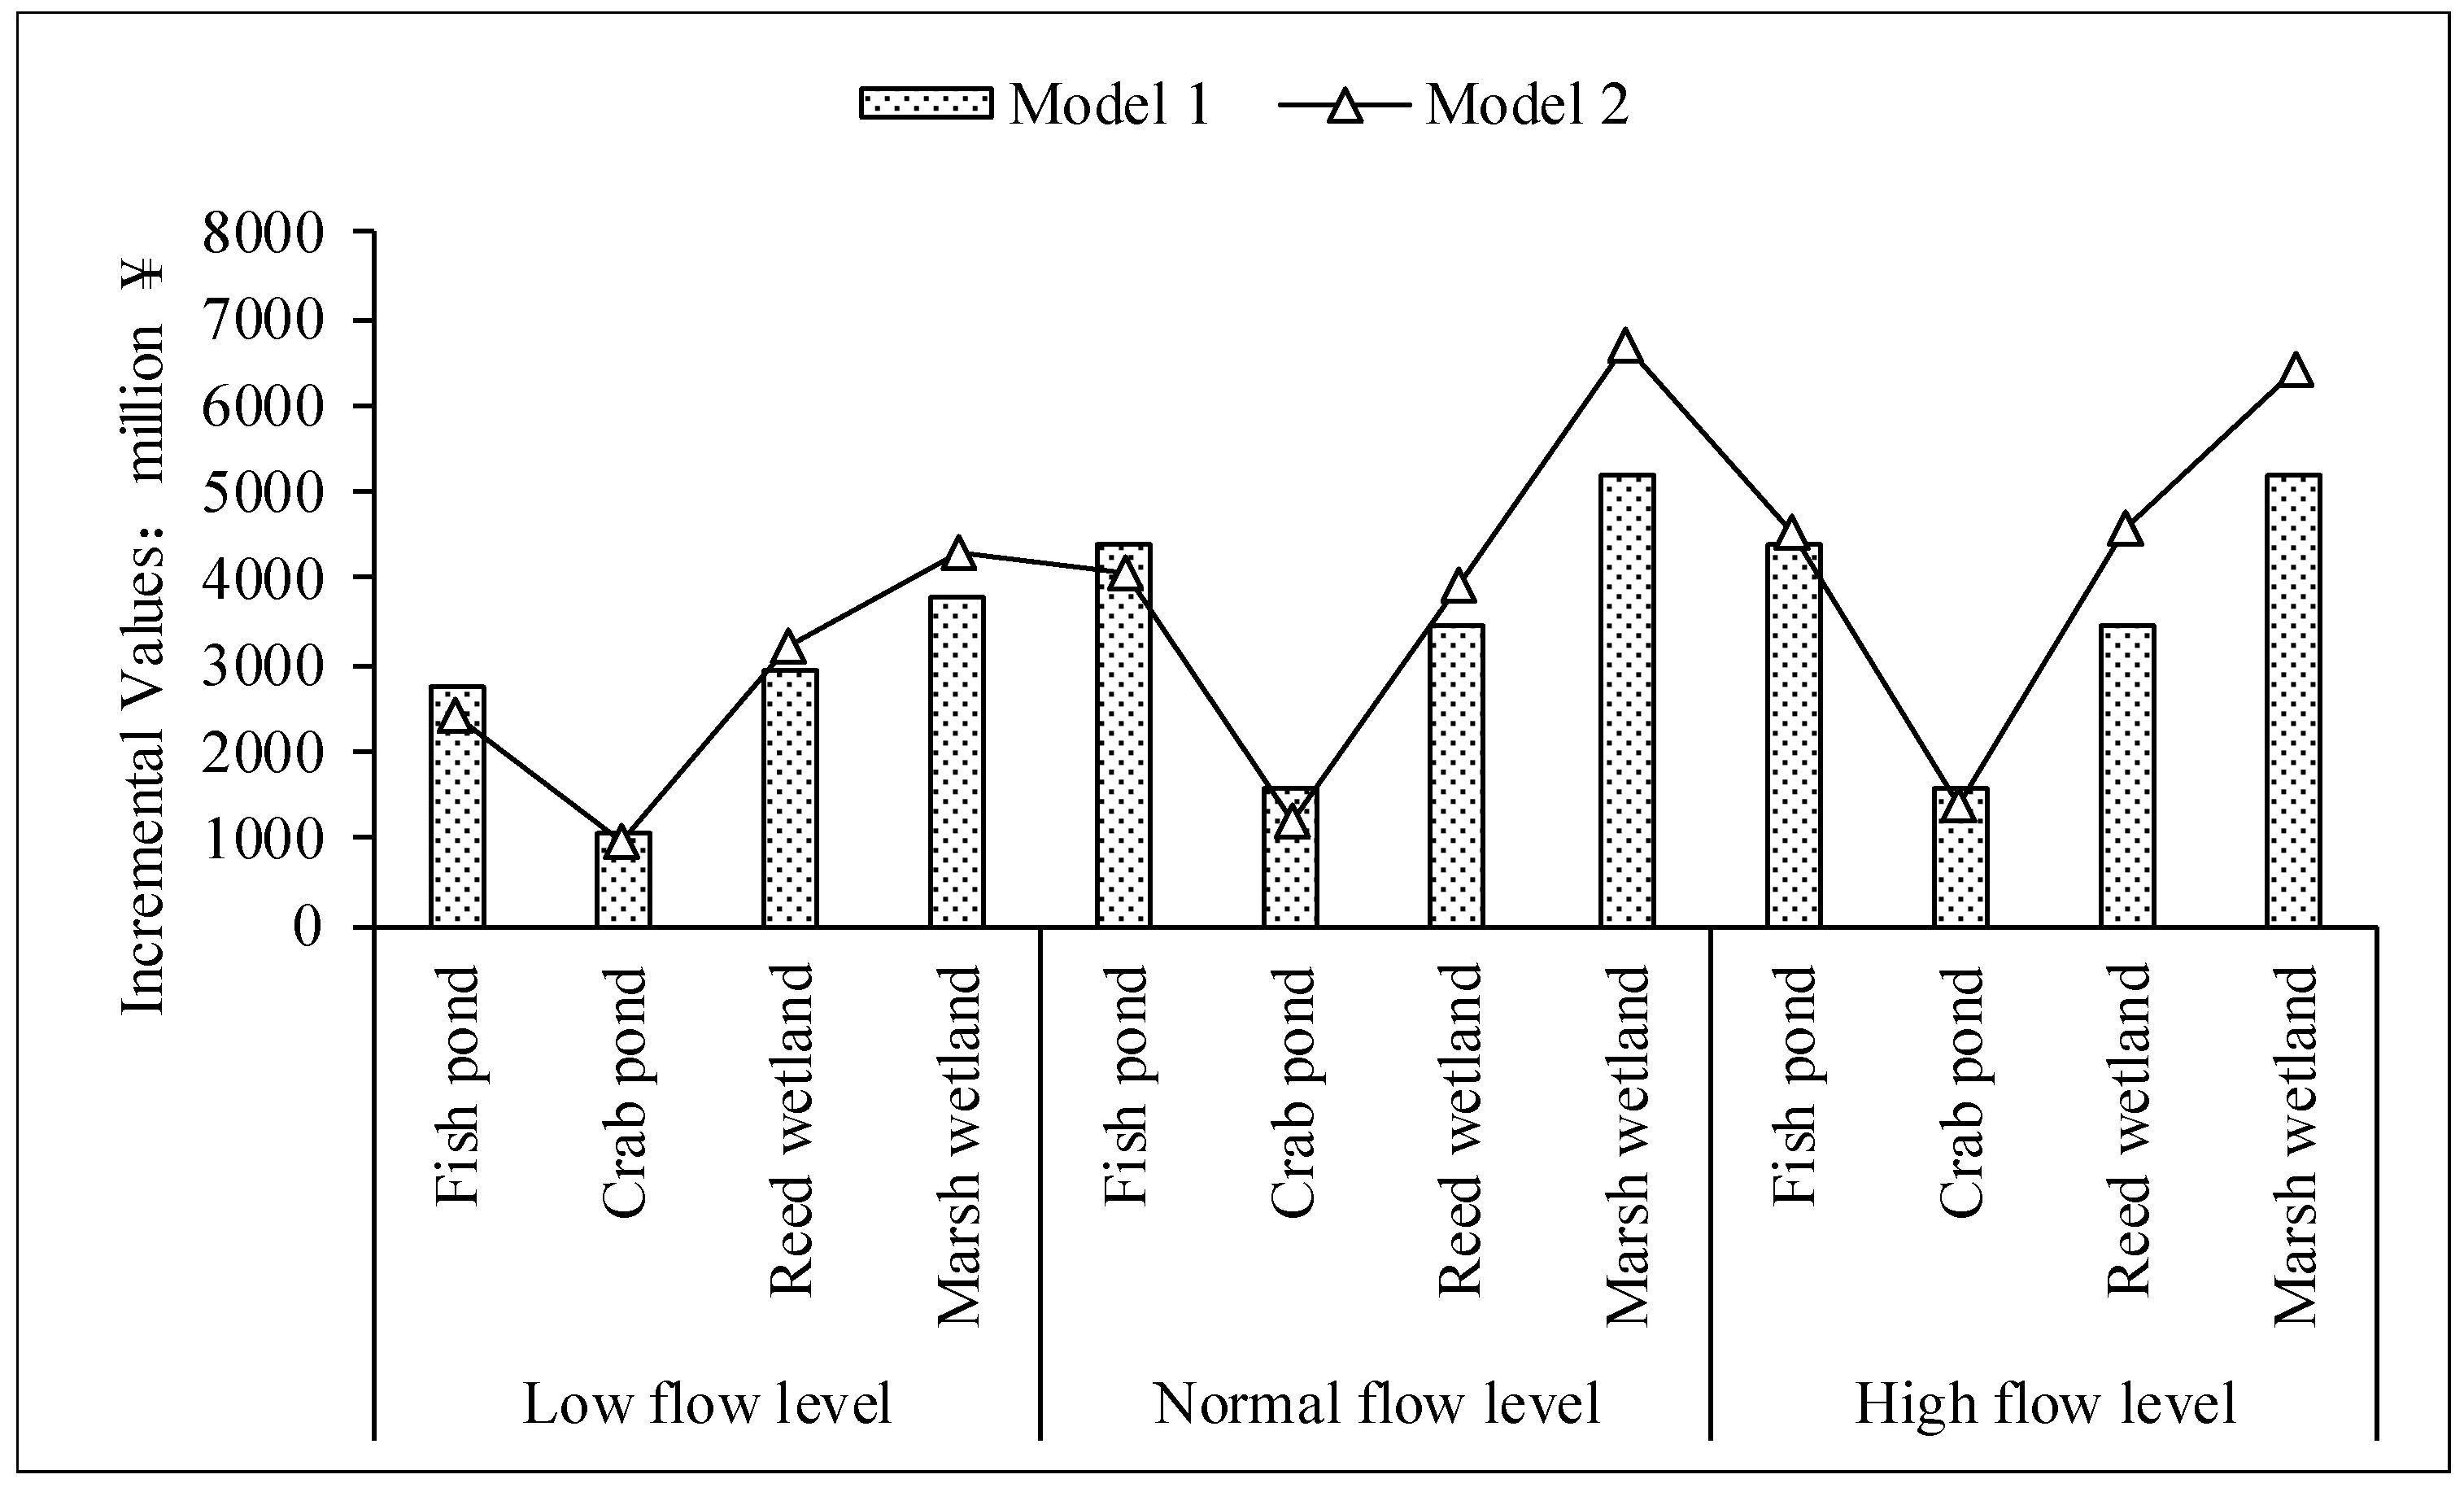
Figure 11 provides a comparison of the incremental ecological service value obtained by the two models under different scenarios. Different ecosystems show different variation trends. Compared to model 1, the incremental ecological service values of fish ponds and crab ponds obtained by model 2 would decrease, in contrast to reed wetlands and marsh wetlands. For example, under low-flow scenarios, the ecological values of fish ponds and crab ponds would decrease from 2735.88 million CNY and 1056.08 million CNY to 2423.42 million CNY and 982.49 million CNY, respectively; in contrast, the values of reed and marsh wetlands would increase from 2923.11 million CNY and 3797.77 million CNY to 3204.19 million CNY and 4292.97 million CNY, respectively. The main reason for this difference is that for most lakes in the western Jilin Province, the ecological service value of fish and crab ponds is lower than that of wetlands, so more water resources would be allocated to wetlands after meeting the minimal requirement of each ecosystem to obtain higher ecological service values. In addition, the total ecological value would increase with a gradual increase in available flood resources, although the value of marsh wetlands under the high-flow scenario would be lower than that under the normal flow scenario, indicating that model 2 could realize the maximization of ecological service value through the optimal allocation of water resources under different scenarios.
Table 7 lists comparisons of the incremental ecological service values of the two models based on assessment indexes. Under low- and normal-flow scenarios, the values of fish, crabs, water supply, water storage, and regulation obtained by solving model 2 would decrease compared to those of model 1. For example, under the normal-flow scenario, the ecological service values of water supply, water storage, and regulation would decrease from 1515.98 million CNY and 1546.01 million CNY to 1300.64 million CNY and 1524.10 million CNY, respectively, mainly because the ecological service values of these four indexes are mainly due to the ecosystems of fish and crab ponds. For the other indexes, because the main service values are generated from wetland ecosystems, the values would have a certain increase under different scenarios. For example, the values of oxygen release would increase from 210.33 million CNY, 255.63 million CNY, and 255.63 million CNY to 231.92 million CNY, 299.87 million CNY, and 335.46 million CNY under low-, normal- and high-flow scenarios, respectively. For biodiversity, ecological service values would increase from 303.36 million CNY, 445.26 million CNY, and 445.26 million CNY to 304.16 million CNY, 453.40 million CNY, and 492.74 million CNY, respectively, with lower relative increases than those obtained for oxygen release. This difference might be because of the approximate equivalent service values among different ecosystems of indexes, such as scientific culture, tourism development, urban landscape, and natural landscape.
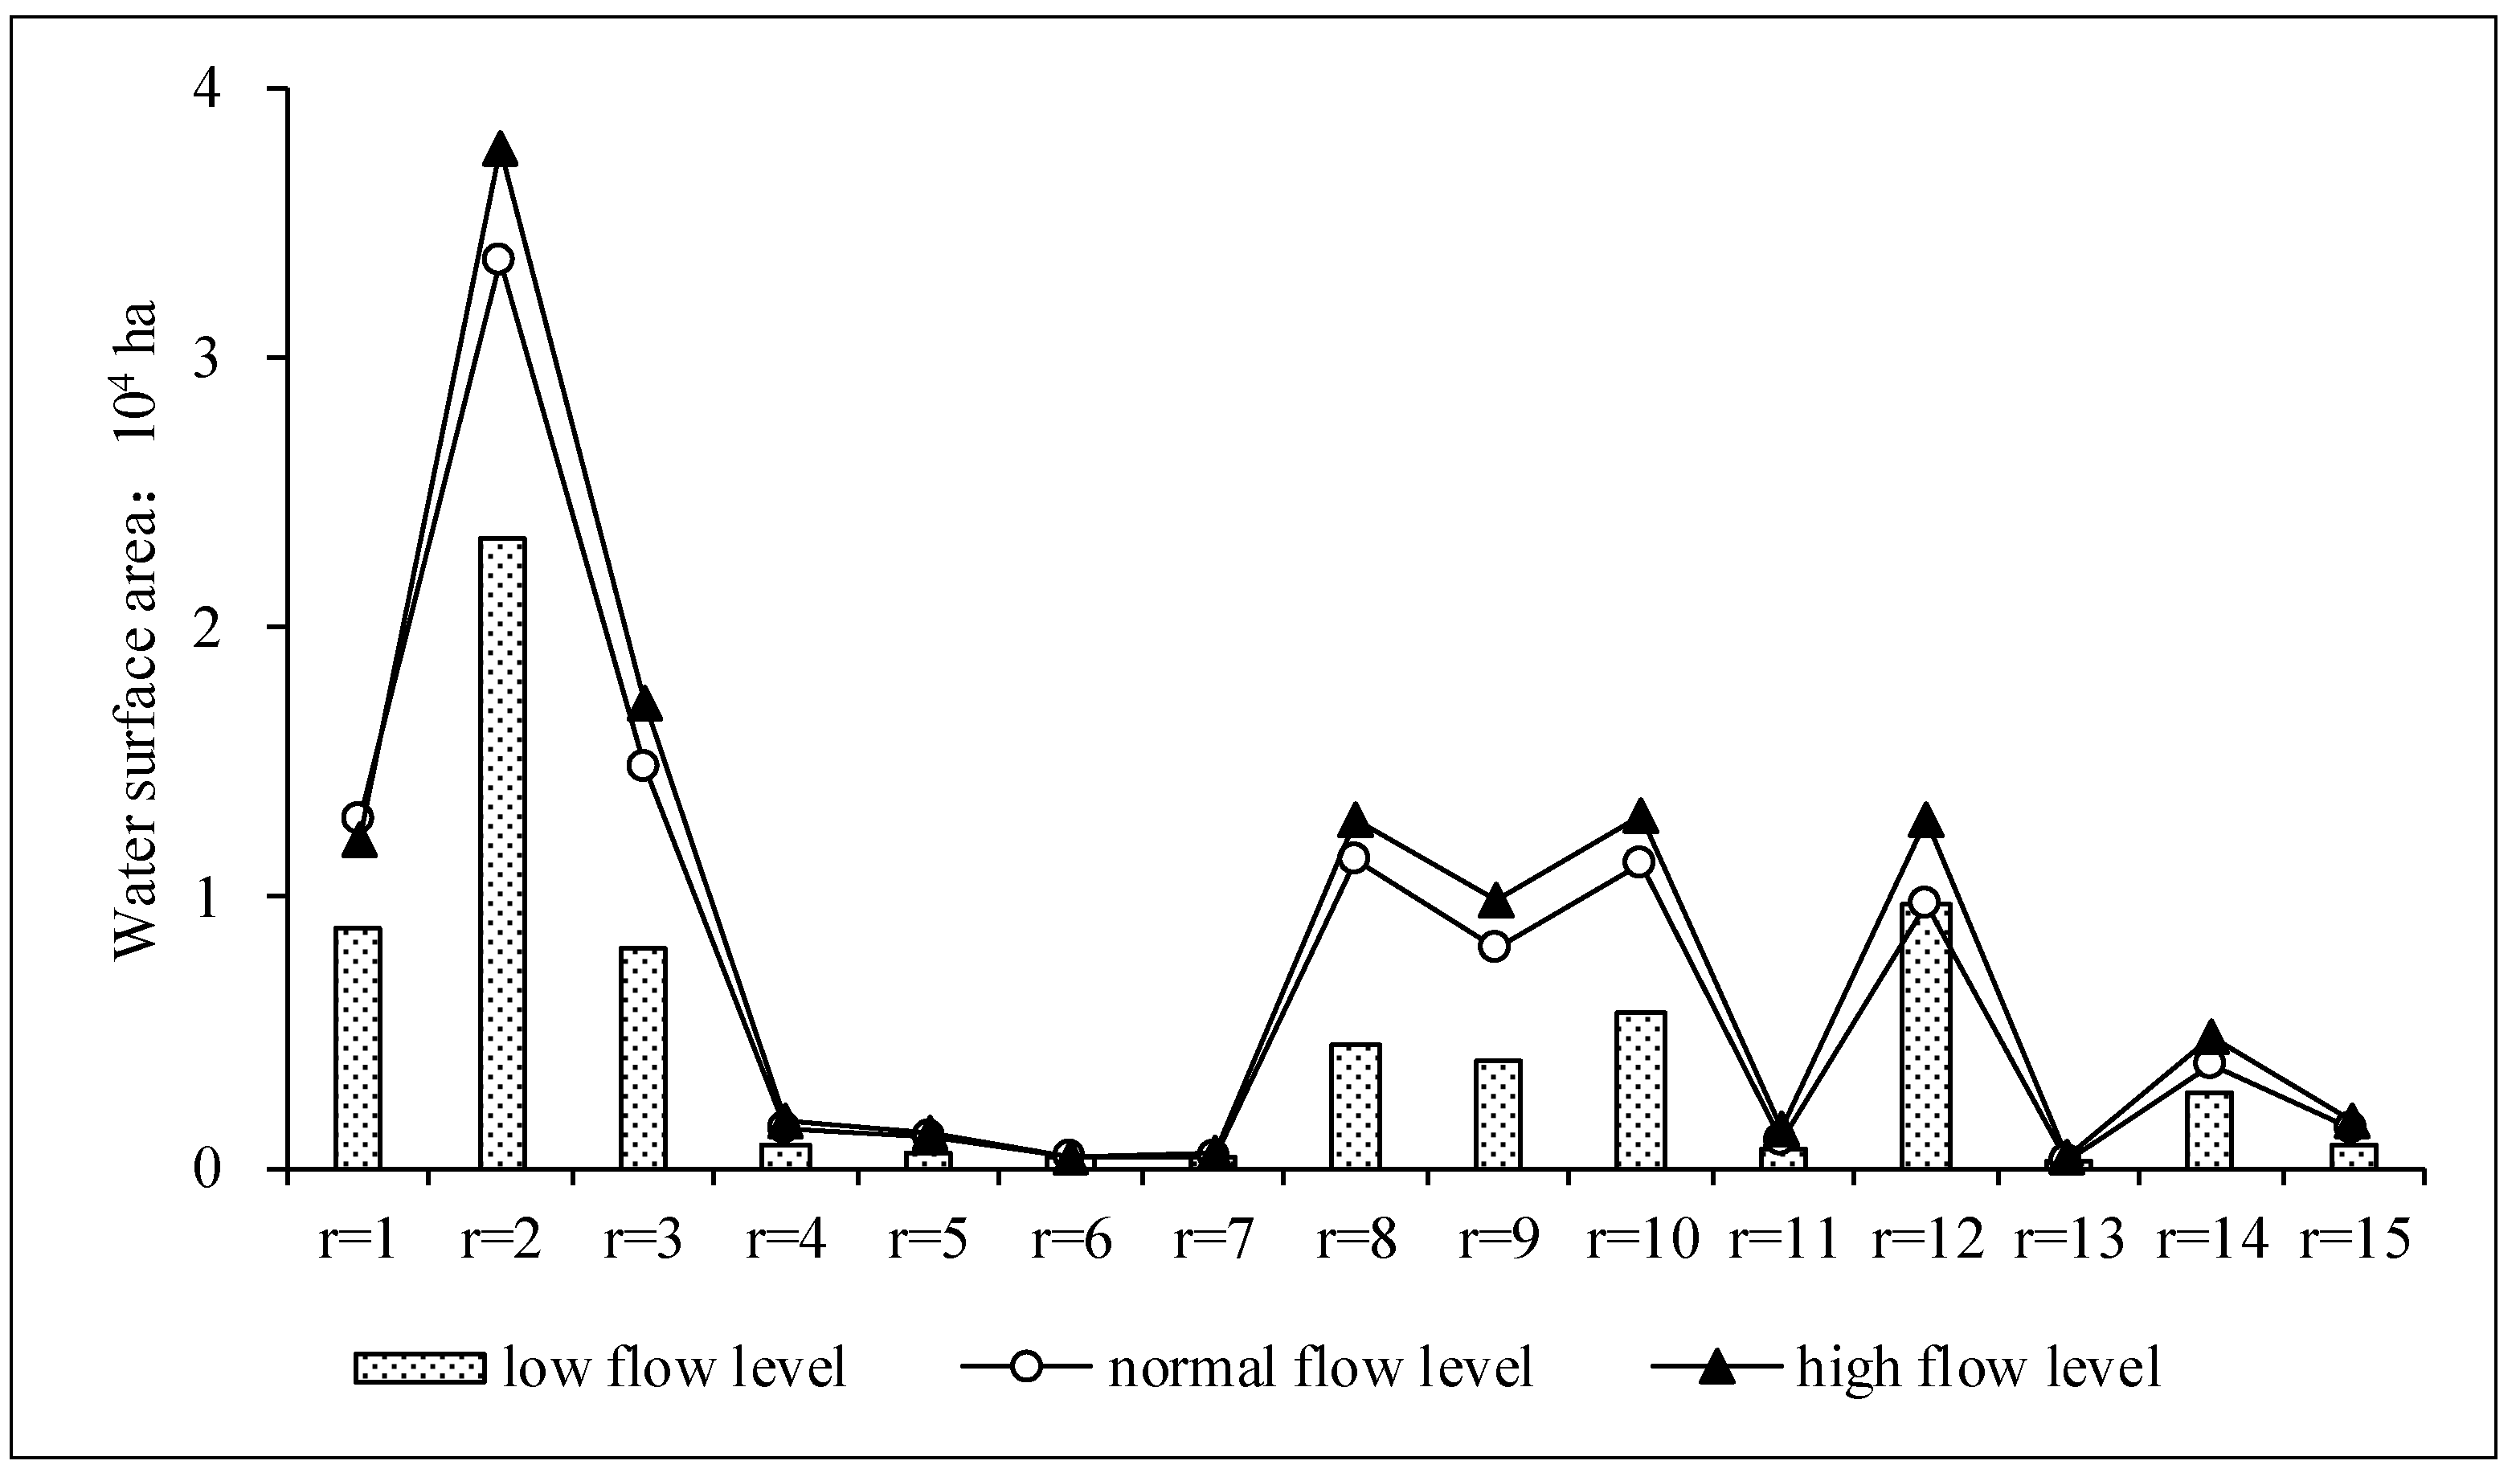
Figure 12 and Figure 13 describe the trends in restored water surface area and wetlands based on model 2 in the western Jilin Province under different scenarios. Figure 12 shows that, except for regions 1 and 6, the restored water surface area would increase with a gradual increase in flow levels. For example, in region 2, the restored areas would be 2.33 × 10⁴ ha, 3.36 × 10⁴ ha and 3.77 × 10⁴ ha, and in region 12, the areas would be 0.98 × 10⁴ ha, 0.98 × 10⁴ ha, 1.30 × 10⁴ ha, respectively. In region 6, the restored water surface area under different scenarios would be a consistent 0.04 × 10⁴ ha, mainly because of the lower service value without fish or crab breeding and the high proportion of wetlands in lakes and ponds.
For wetlands, Figure 13 shows a similar trend to that obtained for water surface area, and the restored area would increase as the flow levels gradually increased. However, under normal- and high-flow scenarios, there would be little or no increase in restored wetland areas. For example, in region 2, the restored areas of wetlands would be 1.40 × 10⁴ ha under the three scenarios; in region 12, the restored areas would be 3.33 × 10⁴ ha, 5.47 × 10⁴ ha, and 5.67 × 10⁴ ha under low, normal and high flow scenarios, respectively. This indicates that in the western Jilin Province, more water resources would be allocated to wetland ecosystems to obtain higher ecological service values. In normal-flow years, the restored area of wetlands would approximately reach the maximum planned value; as a result, there would be no obvious increase in high-flow years.
Table 8 presents adjustments to the original ecosystem restoration schemes of lakes and ponds in Nong’an County, Songhua River basin. In Table 8, the positive values and negative values represent decreases and increases with respect to the initial planned schemes, respectively. In general, adjustment schemes would mainly comprise an increase in crab ponds or marsh wetlands and a decrease in reed wetlands. For example, in lake 2, the restored area of marsh wetlands would increase by 0.043 × 10⁴ ha under all three scenarios; in low- and normal-flow years, the area of reed wetlands would decrease by 0.08 × 10⁴ ha, and in high-flow years, the area would increase by 0.04 × 10⁴ ha because of abundant water resources. In lake 5, the restored area of marsh wetlands would increase by 0.021 × 10⁴ ha under all three scenarios, and for reed wetlands, the area would decrease by 0.01 × 10⁴ ha in all three scenarios; in low-flow years, because of a lack of water resources, the restored area of crab ponds would decrease by 0.038 × 10⁴ ha, and in normal- and high-flow years, the area would increase by 0.011 × 10⁴ ha. However, in lake 1, different adjustment schemes are shown, with an increase of 0.021 × 10⁴ ha in reed wetlands and a decrease of 0.003 × 10⁴ ha in marsh wetlands under the three scenarios. Combined with water diversion schemes, there were adequate local water resources and no need for other water supplements for original restoration plans in this lake. Model 2 could realize higher ecological service values through the optimal adjustment of water resource allocation. Moreover, in lake 2, adjustments to fish pond restoration would decrease by 0.181 × 10⁴ ha, increase by 0.136 × 10⁴ ha, and increase by 0.06 × 10⁴ ha under low-, normal- and high-flow scenarios, and for reed wetlands, the adjustments would decrease by 0.08 × 10⁴ ha and 0.08 × 10⁴ ha and increase by 0.04 × 10⁴ ha, respectively. Although there would be more available flood resources under a high-flow scenario and the ratio of ecological service value to water demand quota in fish ponds is higher than in reed wetlands, a decrease in fish ponds and an increase in reed ponds appeared compared to normal-flow scenario. This result indicated that some water resources would be transferred from higher-valued ecosystems to lower-valued ecosystems to realize the full use of water resources and maximization of ecological service value by the constraint of the planned lake scale.
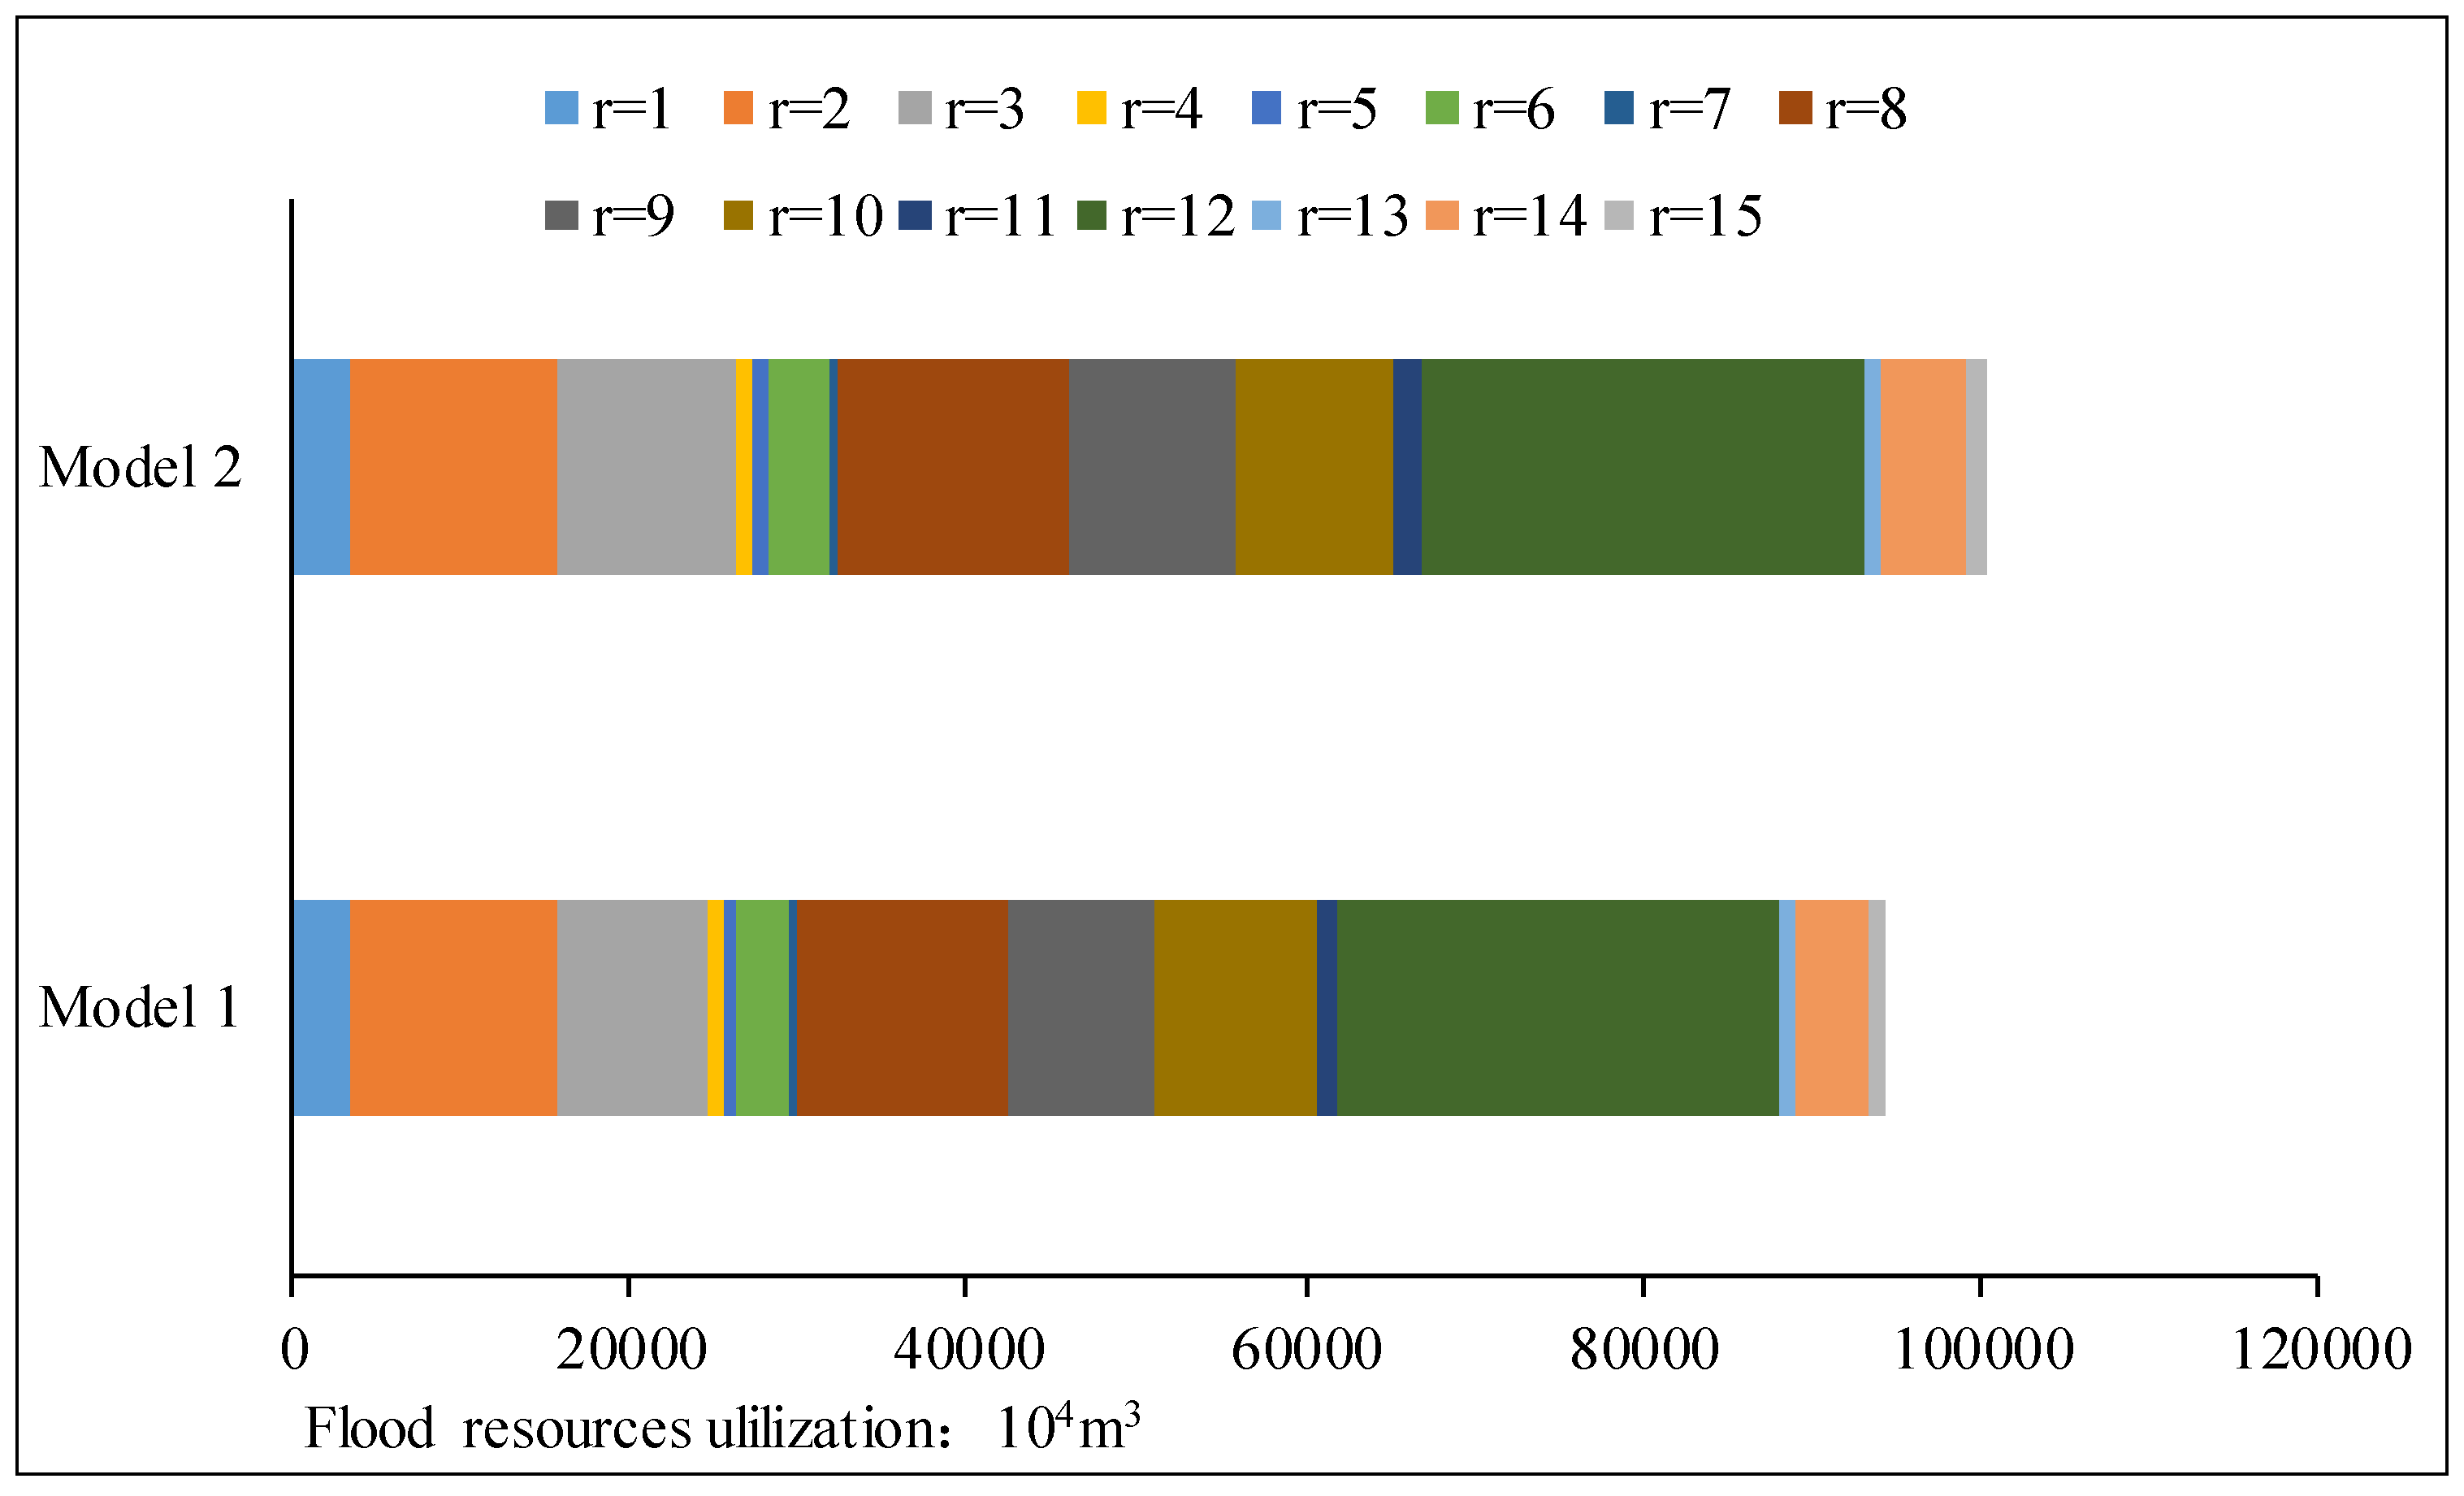
Figure 14 provides a comparison of flood resource utilization based on two optimal models under the high-flow scenario. The utilization of flood resources in model 2 would be more than in model 1, indicating the full use of flood resources, and decrease the possible flood risk to a certain extent.

5. Conclusions

In this study, a FTSCCP model was developed for the optimization of ecological service values in the western Jilin Province based on water diversion and ecological water supplementation for regional lakes and ponds through the interconnected river system network project. The developed model can simultaneously address uncertainties such as fuzzy values, probability distributions, and random variables. In addition, through different selections of decision variables, two different models were built for optimal adjustments to the original water diversion and ecological water supplement schemes to maximize the ecological service value under different scenarios. By solving the first model, optimal schemes to decrease the original restoration plans for ecosystems under low-flow scenario and optimal adjustments of water resources under normal- and high-flow scenarios would be obtained. Under low-flow scenarios, a decrease relative to the original restoration plans would mainly appear in the water surface area, including fish ponds and crab ponds; for the other scenarios, the original restoration plans would be all realized, and compared to the normal-flow scenario, there would be an increase in flood resource utilization and a decrease in normal water supplementation under the high-flow scenario. The results of the second model would show certain increases in ecological service value and the full use of flood resources, with increases of 3.2%, 6.9%, and 14.5%, based on the first model under low-, normal- and high-flow scenarios, respectively. The results could provide valuable support from different perspectives for ecosystem restoration and optimal water resource management in the western Jilin Province, and the proposed model can also be applied in other regions and management optimization problems.

Author Contributions

The study design was conducted by X.W. and Y.L., and data collected by B.C. and C.M. contributed to the overall planning of the project, analyzing and interpreting the data as well as the main draft of the manuscript. All authors read and approved the final manuscript.

Funding

This research received no external funding.

Conflicts of Interest

The authors declare no conflicts of interest.

References

  1. Fisher, B.; Turner, R.K.; Morling, P. Defining and classifying ecosystem services for decision making. Ecol. Econ. 2009, 68, 643–653. [Google Scholar] [CrossRef] [Green Version]
  2. Costanza, R.; Groot, R.D.; Sutton, P.; Van der Ploeg, S.; Anderson, S.J.; Kubiszewski, I.; Farber, S.; Turner, R.K. Changes in the global value of ecosystem services. Glob. Environ. Chang. 2014, 26, 152–158. [Google Scholar] [CrossRef]
  3. Raum, S. Reasons for adoption and advocacy of the ecosystem services concept in UK forestry. Ecol. Econ. 2018, 143, 47–54. [Google Scholar] [CrossRef]
  4. Turner, R.K.; Adger, W.N.; Brouwer, R. Ecosystem services value, research needs, and policy relevance: A commentary. Ecol. Econ. 1998, 25, 61–65. [Google Scholar] [CrossRef]
  5. Chen, Z.M.; Chen, G.Q.; Chen, B.; Zhou, J.B.; Yang, Z.F.; Zhou, Y. Net ecosystem services value of wetland: Environmental economic account. Commun. Nonlinear Sci. 2009, 14, 2837–2843. [Google Scholar] [CrossRef]
  6. He, Y.; Chen, Y.; Tang, H.; Yao, Y.; Yang, P.; Chen, Z. Exploring spatial change and gravity center movement for ecosystem services value using a spatially explicit ecosystem services value index and gravity model. Environ. Monit. Assess. 2011, 175, 563–571. [Google Scholar] [CrossRef]
  7. Turner, K.G.; Anderson, S.; Gonzales-Chang, M.; Costanza, R.; Courville, S.; Dalgaard, T.; Dominati, E.; Kubiszewski, I.; Ogilvy, S.; Porfirio, L.; et al. A review of methods, data, and models to assess changes in the value of ecosystem services from land degradation and restoration. Ecol. Model. 2016, 319, 190–207. [Google Scholar] [CrossRef]
  8. Mcdonough, S.; Gallardo, W.; Berg, H.; Trai, N.V.; Yen, N.Q. Wetland ecosystem service values and shrimp aquaculture relationships in Can Gio, Vietnam. Ecol. Indic. 2014, 46, 201–213. [Google Scholar] [CrossRef]
  9. Rey Benayas, J.M.; Newton, A.C.; Diaz, A.; Bullock, J.M. Enhancement of biodiversity and ecosystem services by ecological restoration: A meta-analysis. Science 2009, 325, 1121–1124. [Google Scholar] [CrossRef] [PubMed]
  10. Barbier, E.B.; Hacker, S.D.; Kennedy, C.; Koch, E.W.; Stier, A.C.; Silliman, B.R. The value of estuarine and coastal ecosystem services. Ecol. Monogr. 2011, 81, 169–193. [Google Scholar] [CrossRef] [Green Version]
  11. Baresel, C.; Destouni, G. Uncertainty-accounting environmental policy and management of water systems. Environ. Sci. Technol. 2007, 41, 3653. [Google Scholar] [CrossRef] [PubMed]
  12. Li, M.; Guo, P.; Singh, V.P.; Yang, G. An uncertainty-based framework for agricultural water-land resources allocation and risk evaluation. Agric. Water Manag. 2016, 177, 10–23. [Google Scholar] [CrossRef]
  13. Liu, X.M.; Huang, G.H.; Wang, S.; Fan, Y.R. Water resources management under uncertainty: Factorial multi-stage stochastic program with chance constraints. Stoch. Environ. Res. Risk Assess. 2016, 30, 945–957. [Google Scholar] [CrossRef]
  14. Bender, M.J.; Simonovic, S.P. A fuzzy compromise approach to water resource systems planning under uncertainty. Fuzzy Set Syst. 2000, 115, 35–44. [Google Scholar] [CrossRef]
  15. Maqsood, I.; Huang, G.H.; Yeomans, J.S. An interval-parameter fuzzy two-stage stochastic program for water resources management under uncertainty. Eur. J. Oper. Res. 2005, 167, 208–225. [Google Scholar] [CrossRef]
  16. Wilby, R.L. Uncertainty in water resource model parameters used for climate change impact assessment. Hydrol. Process. 2010, 19, 3201–3219. [Google Scholar] [CrossRef]
  17. Li, W.; Wang, B.; Xie, Y.L.; Huang, G.H.; Liu, L. An inexact mixed risk-aversion two-stage stochastic programming model for water resources management under uncertainty. Environ. Sci. Pollut. Res. 2015, 22, 2964–2975. [Google Scholar] [CrossRef]
  18. Xu, J.; Huang, G.; Li, Z.; Chen, J. A two-stage fuzzy chance-constrained water management model. Environ. Sci. Pollut. Res. 2017, 24, 12437–12454. [Google Scholar] [CrossRef]
  19. Meng, C.; Wang, X.; Li, Y. An optimization model for water management based on water resources and environmental carrying capacities: A case study of the Yinma River Basin, Northeast China. Water 2018, 10, 565. [Google Scholar] [CrossRef]
  20. Huang, G.H.; Loucks, D.P. An inexact two-stage stochastic programming model for water resources management under uncertainty. Civ. Eng. Syst. 2000, 17, 95–118. [Google Scholar] [CrossRef]
  21. Xie, Y.L.; Huang, G.H.; Li, W.; Li, J.B.; Li, Y.F. An inexact two-stage stochastic programming model for water resources management in Nansihu Lake Basin, China. J. Environ. Manag. 2013, 127, 188–205. [Google Scholar] [CrossRef] [PubMed]
  22. Cai, B.; Wang, X.; Li, Y. Application of a double-sided chance-constrained integer linear program for optimization of the incremental value of ecosystem services in Jilin Province, China. Water 2017, 9, 629. [Google Scholar] [CrossRef]
Figure 1. The geographical position of the interconnected river system network project in western Jilin Province.
Water 11 00068 g001
Figure 2. Incremental ecological service values in western Jilin Province under different scenarios.
Water 11 00068 g002
Figure 3. Sizes of restored ecosystem areas in western Jilin Province under different scenarios.
Water 11 00068 g003
Figure 4. Sizes of restored water surface areas in western Jilin Province under different scenarios.
Water 11 00068 g004
Figure 5. Sizes of restored wetland area in western Jilin Province under different scenarios.
Water 11 00068 g005
Figure 6. Reduction in initial planned restored water surface area in western Jilin Province under the scenario of a low flow level.
Water 11 00068 g006
Figure 7. Reduction in initial planned restored wetland area in western Jilin Province under the scenario of a low flow level.
Water 11 00068 g007
Figure 8. Water diversion schemes of local resources under different levels.
Water 11 00068 g008
Figure 9. Water diversion schemes of normal supplementation resources under different levels.
Water 11 00068 g009
Figure 10. Water diversion schemes of flood resources under different levels.
Water 11 00068 g010
Figure 11. Comparison of incremental ecological service value obtained by the two models under different scenarios.
Water 11 00068 g011
Figure 12. Sizes of restored water surface area based on model 2 in the western Jilin Province under different scenarios.
Water 11 00068 g012
Figure 13. Sizes of restored wetland area based on model 2 in western Jilin Province under different scenarios.
Water 11 00068 g013
Figure 14. Comparison of flood resource utilization based on two optimal models under the high-flow scenario.
Water 11 00068 g014
Table 1. Scenario probabilities and regional available flood resources in western Jilin Province.
RiverRegionsh = 1h = 2h = 3
(Low Flow Level)(Normal Flow Level)(High Flow Level)
Scenarios probabilities0.550.30.15
Available flood resources (104 m3)
Songhua Riverr = 1147029403528
r = 2509310,18712,224
r = 34459891910,703
r = 450910181222
r = 5338676811
Huolin Riverr = 6158531713805
Tao’er Riverr = 7215430516
r = 8607312,14614,575
r = 94255851110,213
r = 10399579899587
r = 1166513311597
Nenjiang Riverr = 1210,88021,76026,112
r = 1351710351242
r = 14216843365203
r = 1551810361243
Table 2. The initial planned water supplement area of different ecosystems by the interconnected river system network project in western Jilin Province (104 ha).
River BasinRegionsWater Surface AreaFish PondCrab PondReed WetlandMarsh Wetland
Songhua Riverr = 11.200.750.280.410.31
r = 23.863.450.020.910.13
r = 31.600.170.180.150.28
r = 40.150.150.000.020.00
r = 50.160.000.000.000.19
Huolin Riverr = 60.110.000.000.130.51
Tao’er Riverr = 70.070.030.010.160.01
r = 81.210.840.140.100.20
r = 90.940.910.020.270.34
r = 101.221.190.020.070.25
r = 110.160.000.000.110.10
Nenjiang Riverr = 121.630.361.271.153.41
r = 130.060.000.060.070.04
r = 140.500.140.360.140.31
r = 150.170.150.020.040.00
Table 3. Assessment index system for the incremental value of ecological services in western Jilin Province.
Index SystemEcosystems Values (Millions CNY/104 ha)
First Class IndicesSecond Class IndicesThird Class IndicesFish PondCrab PondReed WetlandMarsh Wetland
Supply serviceFood productionFish240000
Crab036000
Raw material productionReed00180
Water supplyWater supply116.25116.2500
Adjustment serviceCarbon sequestrationCarbon sequestration005.550.9
Atmosphere regulationOxygen release00549
Water regulation and storageWater storage and regulation78785454
Microclimate adjustmentMicroclimatic modification7.57.5264264
Support servicesPollution degradationPlant fixation00280.5280.5
Assimilative capacity00150150
Biodiversity protectionBiodiversity19.519.519.519.5
Cultural servicesScientific cultureScientific culture3.753.753.753.75
Tourism developmentTourism development55.555.555.555.5
Landscape aestheticsUrban landscape15151515
Nature landscape6666
Total ecosystem values541.5661.5925.8858.15
Table 4. Incremental values based on ecological service assessment index system in Jilin Province.
Index SystemIncremental Ecological Service Values (Millions CNY)
First Class IndexesSecond Class IndicesThird Class IndicesLow Flow LevelNormal Flow LevelHigh Flow Level
Supply serviceFood productionFish1212.581956.001956.00
Crab574.64856.80856.80
Raw material productionReed56.8367.0067.00
Water supplyWater supply927.001515.981515.98
Adjustment serviceCarbon sequestrationCarbon sequestration21.5126.1226.12
Atmosphere regulationOxygen release210.33255.63255.63
Water regulation and storageWater storage and regulation1031.461546.011546.01
Microclimate adjustmentMicroclimatic modification2061.702683.252683.25
Support servicePollution degradationPlant fixation2127.012747.032747.03
Assimilative capacity1137.441469.001469.00
Biodiversity protectionBiodiversity303.36445.26445.26
Cultural servicesScientific cultureScientific culture58.3485.6385.63
Tourism developmentTourism development863.421267.291267.29
Landscape aestheticsUrban landscape233.36342.51342.51
Nature landscape93.34137.00137.00
Table 5. Water diversion and ecosystem restoration schemes under low flow level in western Jilin Province.
RegionsWater Diversion Schemes (104 m3)Reduction Ratio
Local Water ResourcesNormal SupplementFlood ResourcesWater Surface AreaWetlands
r = 12481338114700.170.14
r = 29110755150930.270.00
r = 34128044590.420.00
r = 411805090.470.35
r = 5108303380.380.00
r = 6755015850.650.37
r = 7137602150.360.01
r = 895843560730.610.24
r = 9653042550.580.32
r = 10157180639950.510.00
r = 1194906650.560.05
r = 127127750310,8800.360.30
r = 1315805170.600.35
r = 141117021680.440.38
r = 1511605180.510.32
Table 6. Water diversion schemes and reductions with respect to the original ecosystem restoration schemes of lakes and ponds in western Jilin Province (Nong’an County in the Songhua River basin, for example).
Lakes and PondsWater Diversion Schemes (104 m3)Reductions of Original Restoring Ecosystem Schemes
Local Water ResourcesNormal SupplementFlood ResourcesWater Surface AreaFish PondCrab PondReed WetlandMarsh Wetland
i = 1651.460000-00
i = 21055.002700.00509.4517.5%17.5%-30.0%0
i = 331.98000-0--
i = 438.00011.0383.8%----
i = 5214.000484.970-030.0%0
i = 6262.00134.0098.7012.3%--30.0%0
i = 7229.00547.00365.890-030.0%0
Table 7. Comparison of incremental ecological service values based on assessment indexes (million CNY).
Assessment IndexLow Flow LevelNormal Flow LevelHigh Flow Level
Model 1Model 2Model 1Model 2Model 1Model 2
Fish1212.581074.091956.001793.531956.002012.52
Crab574.64534.59856.80658.70856.80755.99
Reed56.8362.3067.0076.5267.0089.46
Water supply927.00829.351515.981300.641515.981493.10
Carbon sequestration21.5123.7126.1230.6226.1234.29
Oxygen release210.33231.92255.63299.87255.63335.46
Water storage and regulation1031.461013.501546.011524.101546.011672.77
Microclimatic modification2061.702287.892683.253268.592683.253376.50
Plant fixation2127.012374.032747.033383.722747.033485.19
Assimilative capacity1137.441269.541469.001809.481469.001863.74
Biodiversity303.36304.16445.26453.40445.26492.74
Scientific culture58.3458.4985.6387.1985.6394.76
Tourism development863.42865.681267.291290.461267.291402.42
Urban landscape233.36233.97342.51348.77342.51379.03
Nature landscape93.3493.59137.00139.51137.00151.61
Table 8. Adjustments to the original ecosystem restoration schemes of lakes and ponds in western Jilin Province (Nong’an County in the Songhua River basin, for example).
Lakes and PondsEcosystemsInitial Planned SchemesAdjustment Schemes (104 ha)
Low Flow LevelNormal Flow LevelHigh Flow Level
i = 1Fish pond0.0270.0030.0030.003
Crab pond0000
Reed wetland0.067−0.021−0.021−0.021
Marsh wetland0.0230.0030.0030.003
i = 2Fish pond0.7230.181−0.136−0.060
Crab pond0000
Reed wetland0.2670.0800.080−0.040
Marsh wetland0.133−0.043−0.043−0.043
i = 3Fish pond0000
Crab pond0.009−0.001−0.001−0.001
Reed wetland0000
Marsh wetland0000
i = 4Fish pond0000
Crab pond0000
Reed wetland0000
Marsh wetland0000
i = 5Fish pond0000
Crab pond0.0710.038−0.011−0.011
Reed wetland0.0330.0100.0100.010
Marsh wetland0.067−0.021−0.021−0.021
i = 6Fish pond0000
Crab pond0000
Reed wetland0.0070.0020.002−0.003
Marsh wetland0.033−0.011−0.011−0.011
i = 7Fish pond0000
Crab pond0.2030.002−0.031−0.031
Reed wetland0.0330.0100.0100.010
Marsh wetland0.051−0.016−0.016−0.016

