Meteorological Drought Monitoring in Northeastern China Using Multiple Indices

1
Key Laboratory of Groundwater Resources and Environment, Ministry of Education, College of New Energy and Environment, Jilin University, Changchun 130021, China
2
State Key Laboratory of Hydrology-Water Resources and Hydraulic Engineering, Hohai University, Nanjing 210098, China
3
Northeast Institute of Geography and Agroecology, Chinese Academy of Sciences, Changchun 130102, China
4
International Water Resources Research Institute, Chungnam National University, Daejeon 34134, Korea
*
Author to whom correspondence should be addressed.
Water 2019, 11(1), 72; https://doi.org/10.3390/w11010072
Submission received: 7 November 2018
/
Revised: 26 December 2018
/
Accepted: 26 December 2018
/
Published: 3 January 2019
(This article belongs to the Special Issue Water Resources Assessment, Development and Management in Coupled Human-Natural Systems)
Abstract
:Drought monitoring is one of the significant issues of water resources assessment. Multiple drought indices (DIs), including Percent of Normal (PN), Standardized Precipitation Index (SPI), statistical Z-Score, and Effective Drought Index (EDI) at 18 different timesteps were employed to evaluate the drought condition in Wuyuer River Basin (WRB), Northeast China. Daily precipitation data of 50 years (1960–2010) from three meteorological stations were used in this study. We found DIs with intermediate time steps (7 to 18 months) to have the highest predictive values for identifying droughts. And DIs exhibited a better similarity in the 12-month timestep. Among all the DIs, EDI exhibited the best correlation with other DIs for various timesteps. When further comparing with historical droughts, Z-Score, SPI, and EDI were found more sensitive to multi-monthly cumulative precipitation changes (r2 > 0.55) with respect to monthly precipitation changes (r2 ≤ 0.10), while EDI was more preferable when only monthly precipitation data were available. These results indicated that various indices for different timesteps should be investigated in drought monitoring in WRB, especially the intermediate timesteps should be considered.
1. Introduction
Drought is considered as one of the most significant natural disasters typically resulted from a climatic-induced anomaly of significantly decreased water availability over a certain period of time [1]. Serious drought condition can exert severe and disastrous damage to socio-economic activities, ecosystems, and humanity [2,3]. In recent years, droughts are generally expected to increase in both severity and frequency [4] due to climate change. There is no universal definition of drought [5], but it is basically categorized into meteorological drought, hydrological drought, agricultural drought, and socio-economic drought [5,6]. All definitions are determined on the basis of the insufficient moisture condition caused by a deficit in precipitation over a certain period [7,8,9,10]. However, a meteorological drought may develop quickly and end abruptly, and is generally an indicator of other types [11].
Drought monitoring is essential to risk management and is normally monitored by employing drought indices, which provide a quantitative assessment to identify drought occurrence, severity, and magnitude over a region. A variety of drought indices [12,13,14,15] have been developed and applied over the past decades. These include the Palmer Drought Severity Index (PDSI) [16], the Percent of Normal (PN) [17], Z-Score [18], the Standardized Precipitation Index (SPI) [19], the Surface Water Supply Index (SWSI) [20], the Standardized Precipitation Evapotranspiration Index (SPEI) [13], the Reconnaissance Drought Index (RDI) [21], Effective Drought Index (EDI) [22], Standardized Moisture Anomaly Index (SMAI) [23], and some other remote sensing based indices [24,25,26,27]. More detailed information about these indices are listed in Table 1.
Droughts are complex because of their causation and impact, so no index is expected to be universally suitable and can sufficiently characterize the complicated drought conditions in a comprehensive manner. Previous studies have demonstrated the advantages in employing more than one index for drought evaluation [28,29]. China is one of the most vulnerable countries to frequent and severe droughts. According to statistical analyses by He et al. [30], 60% of China has experienced various types of meteorological hazards. With the impact of global warming, droughts are gaining increased attention [31,32].
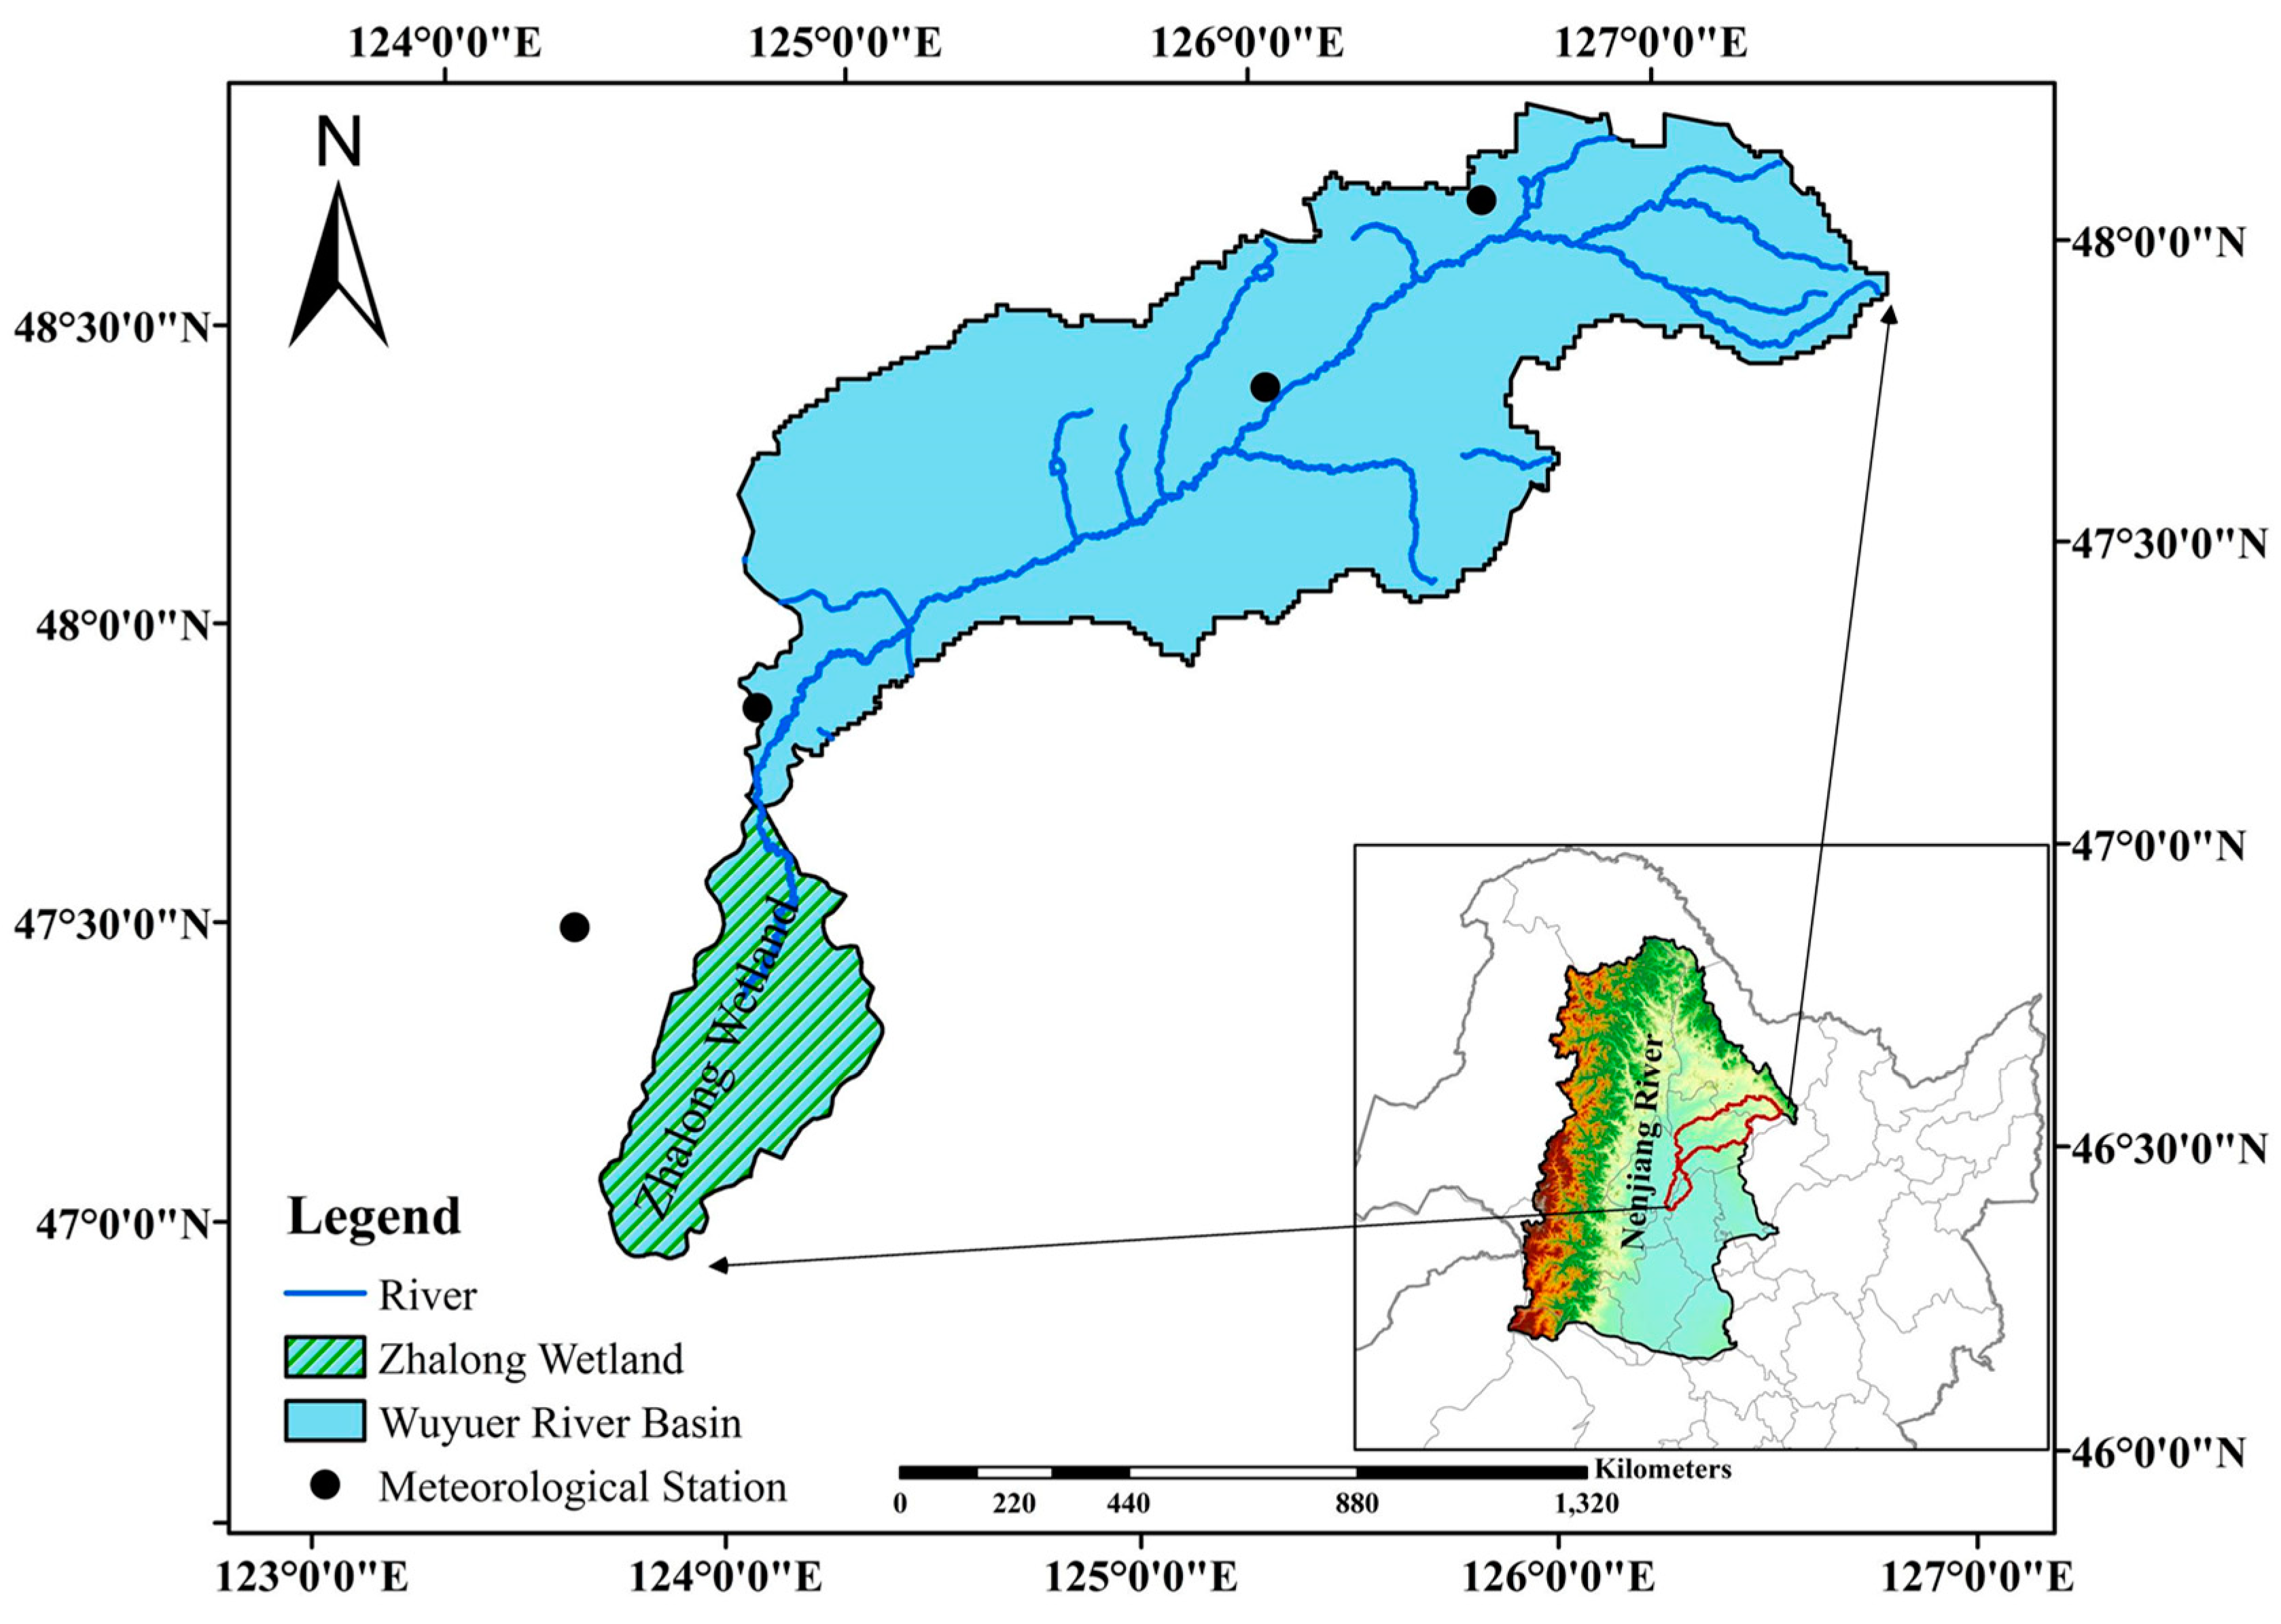
The Wuyuer Basin is located in Northeastern China, with an area of 23,110 km2. It is one of concentrative and extensive distribution area of inland wetlands in China, with a Ramsar wetland (i.e., Zhalong wetland) located at the downstream of the basin. Water supply is vital for agriculture and wetland ecosystems in this basin. Spatial-temporal changes of temperature and precipitation, which may result in drought and floods, has been reported in the basin [33]. A better understanding of droughts is essential to service for the water management and wetland protection in this area. A more detailed investigation to evaluate the performance and inherent properties of drought indices is imperative and has a special priority in this basin. Therefore, the objective of this study is to (1) identify correlations among DIs for various time scales, and (2) investigate their performances in drought monitoring. The results of this study can provide valuable information for drought monitoring and water resources management in the region.
2. Materials and Methods
2.1. Study Area
The Wuyuer River originates from the west of the Lesser Khingan Mountains and travels a total length of 576 km with a drainage area of 15,084 km2. It flows through six counties, i.e., Bei’an, Kedong, Keshan and Baiquan, Yi’an, and Fuyu, before draining to Zhalong Wetland. Zhalong wetland is one of the most important Ramsar international wetlands and supports diverse ecosystems and endangered wildlife species. Wuyuer River Basin (WRB) has a typical inland semi-arid climate and is the largest inland river in Heilongjiang province located in Northeastern China (Figure 1). It is dry and cold in winter, yet hot and rainy in summer. The annual total precipitation is about 500 mm, mainly concentrated during the period of June to September and it is the main source of the water for the WRB. Annual evapotranspiration in the WRB is 1110 to 1780 mm, much higher than the precipitation. WRB has a population of 1.7 million inhabitants, 1.24 million of which make their living from agriculture [33]. The water supplied by the river is recognized as crucial to agricultural irrigation and wetland health. With the effects of global climate change, more extreme hydro-meteorological events (especially droughts) are occurring in this area [34,35]. These pose severe threats to agriculture production and wetland conservation. However, droughts in WRB have been under studied and no comprehensive assessment is available. In this study we aim to provide a comprehensive drought assessment using four DIs (drought indices) with various timesteps.
2.2. Data Collection
Daily precipitation data were obtained from three meteorological stations across the basin (Figure 1) from China Meteorological Administration (CMA) for a period of January 1960 to December 2010.
From the basic information of precipitation shown in Table 2, it can be found that the precipitation decreases from the mountain areas in the upper basin to the plain in the lower basin. The mean value of annual precipitation during 1960–2010 varied from 424 mm to 523 mm, with an average value of 471 mm for the basin. The standard deviation of precipitation in each station was 95 mm to 125 mm, being about 25% of the stations’ mean annual precipitation.
2.3. Drought Indices Calculation
Four precipitation-based DIs, Percent of Normal by Mean (PN), Z-Score, Standardized Precipitation Index (SPI), and Effective Drought Index (EDI), were selected in this study. Observed daily precipitation records were averaged by month and then were used to calculate DIs and multi-monthly precipitations.
2.3.1. Percent of Normal by Mean (PN)
The PN is a drought index that is well known for its simple calculation and effectiveness in describing droughts. It can be computed based on the following equation [17]:
where xi is the observed precipitation value and is the average value of a certain period.
2.3.2. Z-Score
In brief, Z-Score is calculated as follows:
where xi is the observed precipitation value and is the average value of a certain period, and σ is the standard deviation of the records.
2.3.3. Standardized Precipitation Index (SPI)
The SPI was developed to determine the precipitation deficit and can be calculated with multiple timesteps [19].
When calculating the SPI, the long-term precipitation data was first fitted to a probability distribution. As proposed in previous studies [36,37], this study used the gamma distribution to fit the long-term precipitation data.
Then the fitted distribution was transformed to the standard normal distribution so that the SPI mean and variance are 0 and 1, respectively. A drought event occurs when the value of SPI is continuously negative and ends when the SPI becomes positive. More details about the calculation of SPI are available from some previous studies [36].
2.3.4. Effective Drought Index (EDI)
The EDI was proposed to provide an exact detection of occurrence and duration of droughts [21]. In contrast to other indices, EDI is a function of ‘precipitation needed to return to normal’ (PRN) and is calculated with a daily time step [38]. Specifically, EDI is calculated as follows:
where σ is the standard deviation of PRN values for a relevant period, and PRN can be obtained as:
where EP represents effective precipitation.
Effective precipitation (EP) refers to the summation of all daily precipitation with a time reduction function. The EP for any day is a function of precipitation of the current day, as well as of previous days but with lower weights. It is calculated with the following equation:
N is the duration of summation and Pi is the precipitation of i–1 days ago. In this study, a value of 365 days is chosen as the duration [26].
In this study, only EDI was calculated for one timestep because it is determined as the mean condition of precipitation over a year. For all the other DIs, the monitoring period can be either a month, 3 months, a season or a year. Therefore, to make a further understanding of timesteps effects on drought monitoring, they were computed for 18 different timesteps, i.e., 1, 2, 3, 4, 5, 6, 7, 8, 9, 10, 11, 12, 15, 18, 24, 30, 36, and 48 months, respectively.
3. Results and Discussion
3.1. Correlations of Drought Indices for Different Timesteps
The DI values were first standardized with integers based on the drought classifications (Table 3) for PN, Z-Score and SPI for 18 timesteps and EDI. Then Pearson correlation analysis was employed to detect the relationship among the calculated indices.
The average correlation coefficients among the DIs in different timesteps were calculated for the basin (Figure 2). EDI was timestep independent, so the correlation coefficients between EDI and other DIs in different timesteps were listed in Table 4. Generally, DIs calculated using intermediate timesteps varied from 7 to 13 months correlated better (>0.5) with others. While, the correlations of both shorter (1 to 6 months) and longer (18–24 months) timesteps, especially one-month, two-month, and 48-month, with others being relatively low. Additionally, DIs in intermediate timesteps showed better correlation with both shorter and longer timesteps, while DIs in shorter or longer timesteps only showed better correlation with nearby timesteps. This indicates DIs using intermediate timesteps are the best suited to evaluate drought in WRB.
When further calculating the average coefficient for each DI with all DIs in a certain timestep, DIs were found similar timestep-average correlations for each timestep. Specifically, PN showed the least correlation with other DIs with almost all timesteps. Z-Score with shorter timesteps (two-month to six-month) had a better correlation with DIs, while SPI with intermediate and longer timesteps (seven-month to 48-month) correlated better with other DIs. While, EDI is exhibiting better relationship with others in most timesteps. More than 70% of the coefficients of EDI with other DIs larger than 0.50, and about 30% of which were larger than 0.70, which making EDI to be the best correlated DI.
Therefore, Z-Score4, PN10, and SPI24 were selected as the shorter, intermediate, and longer timestep DIs, respectively, and a comparison was made between these DIs with EDI to investigate the proper timesteps of the indices.
Average values of correlation coefficients of each DI (Z-Score4, PN10, SPI24, and EDI) against other DIs were calculated for each timestep (Figure 3). For example, the blue bar in the first timestep shows the average of three coefficient values (i.e., the coefficient between EDI and PN1, the coefficient between EDI and Z-Score1, and the coefficient between EDI and SPI1), and the first green bar represents the average of three coefficient values (i.e., the coefficient between Z-Score4 and Z-Score1, the coefficient between Z-Score4 and PN1, and the coefficient between Z-Score4 and SPI1), and so on.
As illustrated in Figure 3, EDI showed higher correlation with shorter timesteps than other DIs, except shorter timesteps DI (i.e., Z-Score4), which had significantly higher correlations than other indices only in timesteps shorter than five months. For intermediate timesteps DI (i.e., PN10), the correlation was higher than EDI only for 10-, 11-, 36-, and 48-month timesteps, and even for these timesteps the correlations were very similar and close to EDI. As for longer timestep DIs (i.e., SPI24), it performed well under the longer timesteps (longer than 18 months) and possessed higher correlations than EDI. Therefore, EDI indicated a better performance than other indices for different timesteps, in general. The best correlation of EDI was observed with the timesteps between 8 to 12 months, with the average coefficients of 0.71–0.76.
3.2. Evaluation of Drought Classes Indicated by DIs
3.2.1. Comparison of PN with EDI
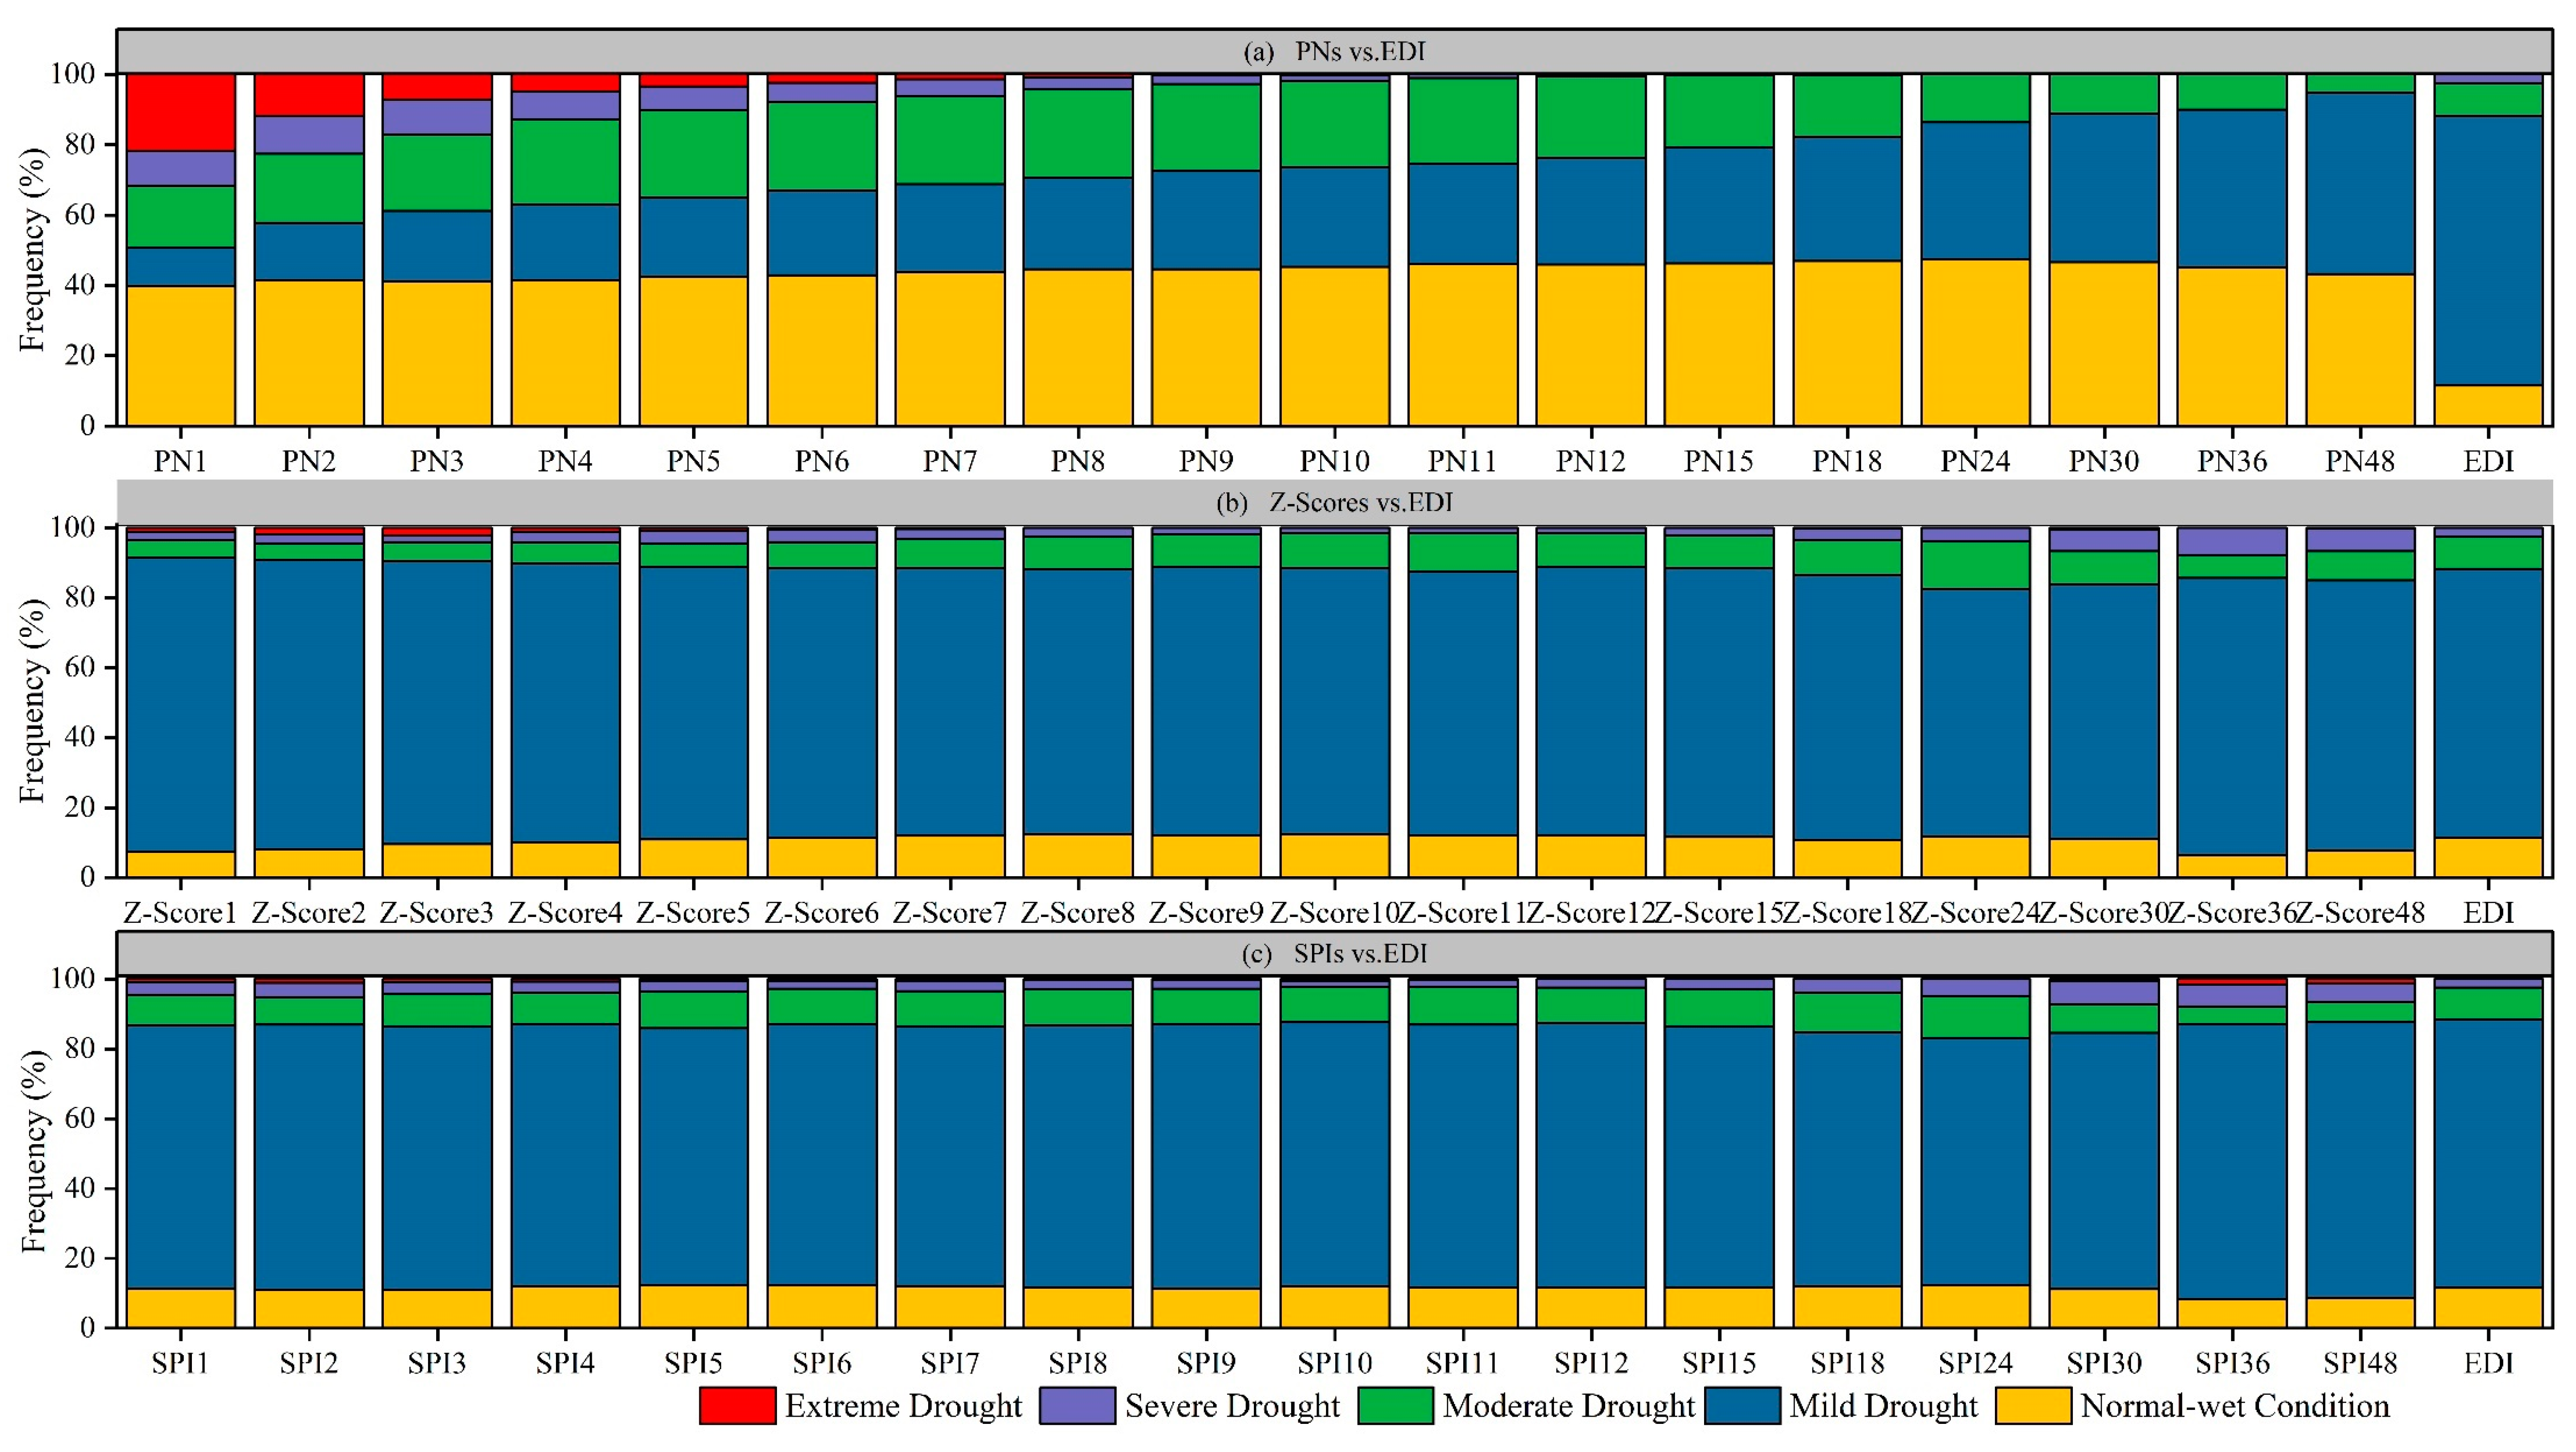
The comparison of droughts identified by PN and EDI is shown in Figure 4a. The frequency of identified severe droughts, moderate droughts, and mild droughts by EDI was, respectively, 2.5%, 9.3%, and 76.8% during 1960–2010, and no extreme drought was detected. However, the identified results of PN was very different, and the disparity became larger when the timestep increased. In general, the total percentage of droughts indicated by EDI (88.6%) was higher than that of PN for any timestep. Using the PN index, the basin was always (about 40%) in a normal or wet condition during 1960–2010. For PN with shorter timesteps (1–7 months), extreme (1.4–21.7%), severe (4.7–10.6%), and moderate droughts (17.7–25.1%) were overestimated when compared with EDI, but mild droughts (10.7–24.9%) had been underestimated. As the timestep went longer, less moderate droughts and more mild droughts were detected.
3.2.2. Comparison of Z-Score with EDI
The Z-Score had a better consistency with EDI in drought identification than PN did (Figure 4b). Based on the results of the Z-Score with various timesteps, mild drought was the most frequent drought class between 1960 and 2010. The Z-Score with intermediate timesteps matched droughts identified using EDI most closely. For example, the frequency of extreme drought, severe drought, moderate drought, and mild drought identified by Z-Score9 was 0%, 1.99%, 9.27%, and 76.66%, respectively, similar to frequencies of 0%, 2.34%, 9.36%, and 76.76%, respectively, detected by Z-Score15. Further, these values were very close to the frequencies identified using EDI. For Z-Scores with shorter timesteps, moderate droughts and normal conditions were underestimated when compared with EDI, but droughts in extreme, severe, and mild drought conditions had been overestimated. In addition, the Z-Scores with longer timesteps also overestimated the frequency of extreme droughts, but they performed very well in the identification of mild droughts. Therefore, longer timesteps in general generated more reliable Z-Score than those by shorter timesteps. However, intermediate timesteps matched EDI best.
3.2.3. Comparison of SPI with EDI
Compared to PN and Z-Score indices, SPI is more consistent with EDI in drought estimation (Figure 4c) with relatively good performances for almost all timesteps. Again, estimations by SPI using intermediate timesteps were more reliable than other timesteps. SPI using shorter timesteps showed an exact estimation of mild droughts and normal-wet conditions as EDI did. However, the identification of other drought types was poor, with moderate droughts being underestimated while extreme droughts and severe droughts were overestimated. Generally, SPI with longer timesteps displayed a similar estimation with that with shorter timesteps. Interestingly, SPI24 greatly overestimated moderate droughts, but underestimated mild droughts when compared with EDI.
Based on the above analysis, PN showed higher variability with timesteps than Z-Score and SPI. This index was also found to be the least matched DI compared with the others. If PN is the only DI choice in this basin, shorter timesteps (1–3 months) are recommended. In contrast, the Z-Score and SPI yielded more consistent results with EDI. Especially with SPI, the variability was slight among the different timesteps. For either the Z-Score or SPI, DIs with intermediate timesteps in general provided the best matches to values generated using EDI.
3.3. Effectiveness of DIs in Detecting Historical Droughts
It is known that there were four significant droughts in Keshan, i.e., from autumn 1999 to spring 2000, autumn 2000 to spring 2001, autumn 2002 to spring 2003, and autumn 2004 to spring 2005 [39]. Therefore, we enrolled the period from September 1999 to May 2001 as the representative drought period in Keshan, and the DIs were calculated based on the data of Keshan station during this period. Based on the prior analysis among DIs, only EDI, and Z-Score and SPI in intermediate timesteps (9, 12, and 15 months) were selected to identify how DIs coordinated with the historical deficiency conditions of monthly and multi-monthly precipitation.
Actual monthly precipitation (precipitation received in a particular month), average monthly precipitation (average value for a particular month during the studying period), multi-monthly average precipitation (average value of precipitation in particular preceding months), and moving cumulative precipitation was employed to evaluate a variety of precipitation.
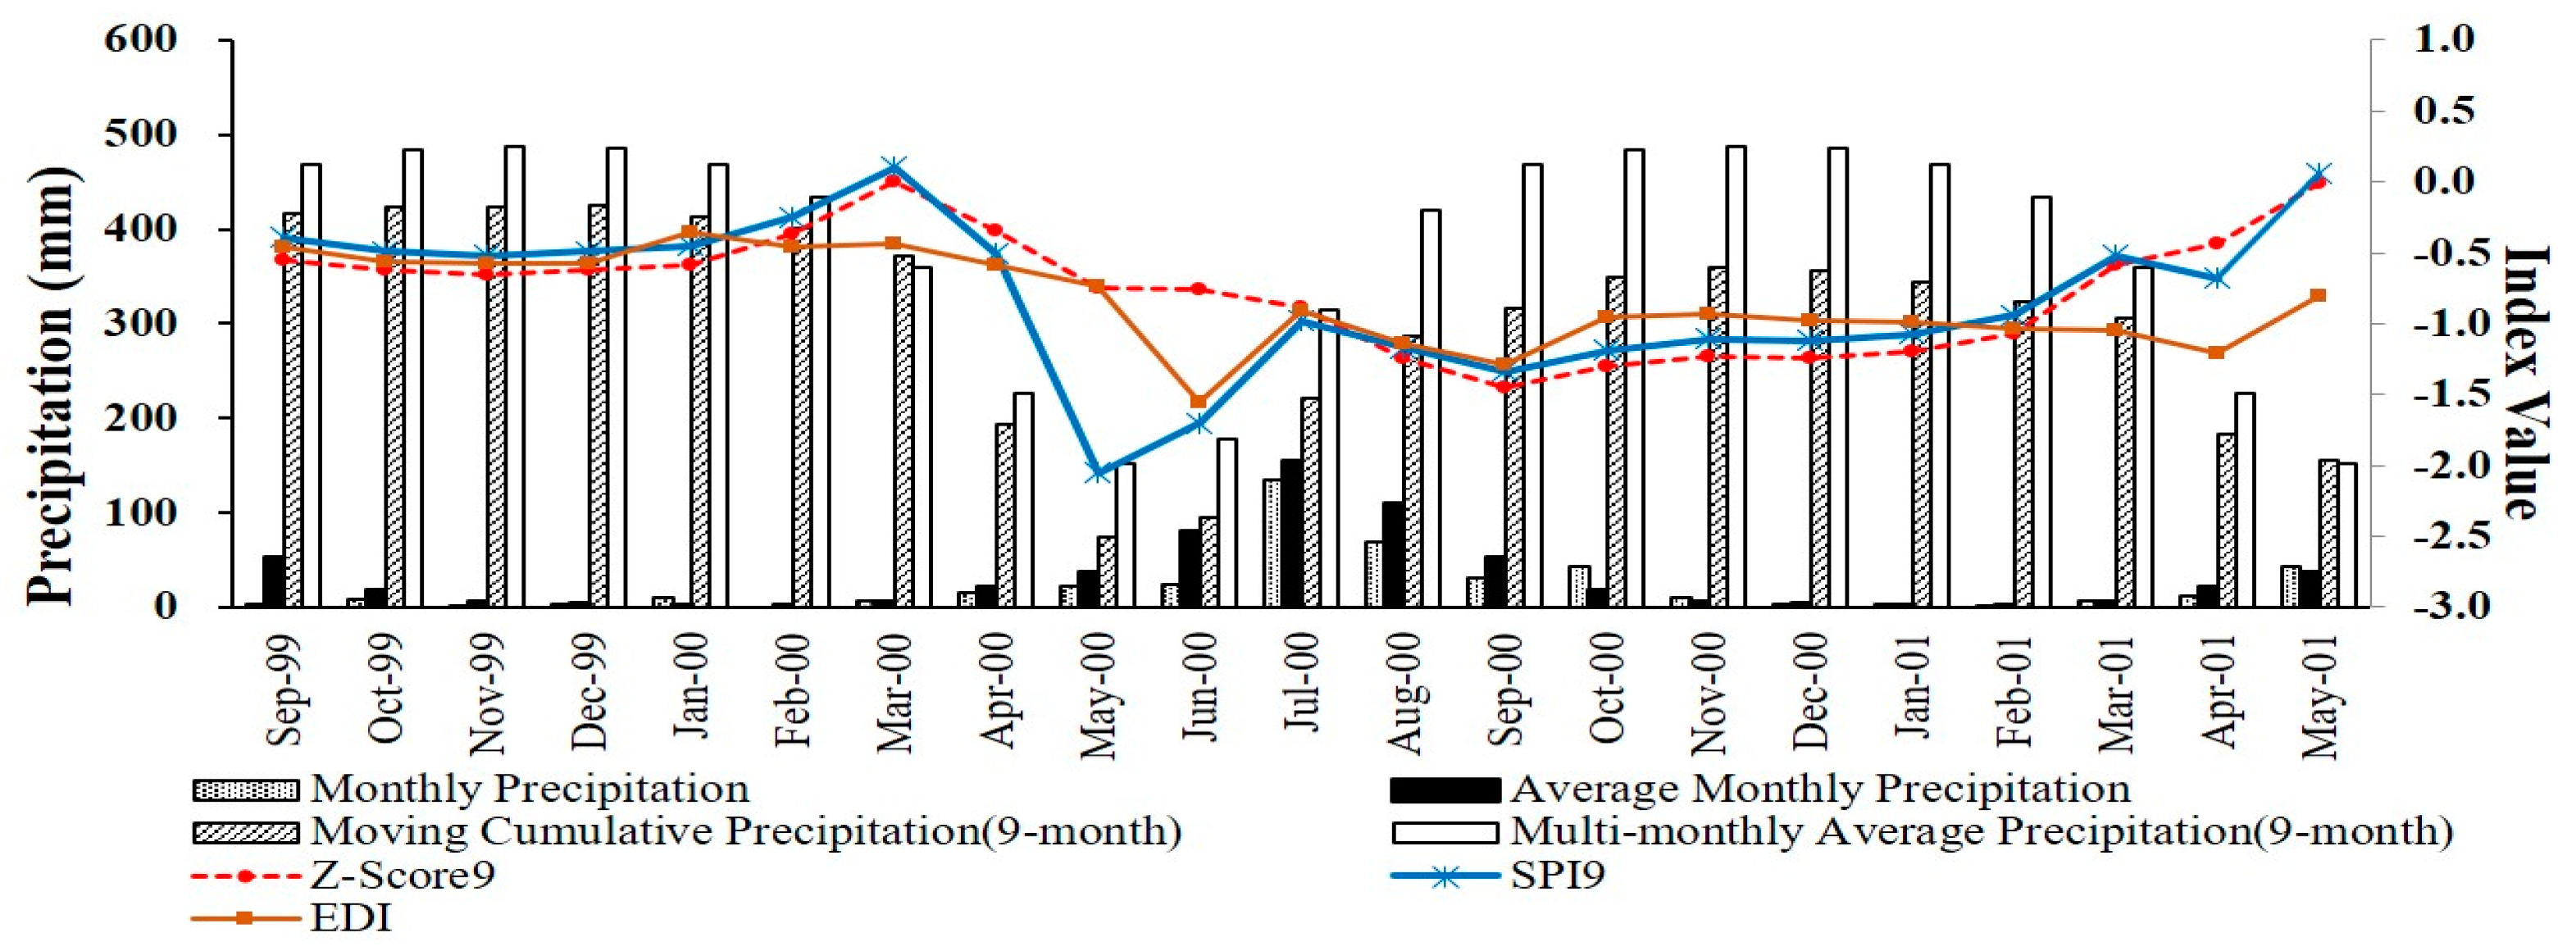
When comparing the indices and precipitation variables in 9-month timestep, recurring deficits between monthly precipitation and average monthly precipitation were observed (Figure 5). The largest deficit happened from September to November 1999 and in June 2000, with monthly precipitation not even reaching a half amount of the long-term average value for each month. The deficit of the moving cumulative precipitation compared with multi-monthly average precipitation declined gradually from September 1999 to March 2000, implying a mitigation of drought conditions, but then increased from April to June in 2000, as drought conditions took hold again. However, the deficit stabilized from July 2000 to May 2001, and then decreased from March to May 2001, after which time drought conditions ceased.
Compared with EDI, temporal changes of SPI9 and Z-Score9 generally performed better in tracking the deficits shown with moving cumulative precipitation and multi-monthly average precipitation. There were two critical differences between EDI and the other two indices. The first one was observed from February to June 2000, when SPI9 and Z-Score9 showed an increase-decrease-increase change while EDI was initially stable, but then declined. This shows that EDI did not capture the deficit signaled by the moving cumulative precipitation and multi-monthly average precipitation from February to March 2000, and also responded inversely to the decline in deficit in June 2000. The other difference was found during February to March 2001, when SPI9 and Z-Score9 showed an increase in deficit conditions but EDI was decreasing, which also implicated an inverse response to the deficit decline during this period.
The scatter plots of drought indices and precipitation deficit in the nine-month timestep were shown in Figure 6. DIs ((i.e., Z-Score9, SPI9, and EDI)) did not reflect the deficit between monthly precipitation and average monthly precipitation very well, and r2 was only 0.037, 0.10, and 0.12 respectively. However, DIs had a statistically close relationship with the deficit between moving cumulative precipitation and multi-monthly average precipitation for the nine-month timestep with 0.997, 0.55, and 0.32 values of r2.
For the 12-month timestep, multi-monthly average precipitation was relatively high in every month compared to the moving cumulative precipitation at Keshan station (Figure 7). The gap between these two variables was relatively stable from September 1999 to June 2000, and then became larger in July and August, which led to more severe drought conditions. From September 2000, it began to decrease again and reached a stable level until May 2001.
Changes of EDI, SPI12, and Z-Score12 were consistent with the water deficits indicated by moving cumulative and multi-monthly average precipitation totals. To be specific, SPI12 and Z-Score12 exhibited a similar pattern, with changing lines almost coinciding with each other. EDI deviated from these two indices in two ways. From May to June 2000, EDI decreased but the other two remained mostly stable. In the meantime, the gap between monthly precipitation and its long-term average increased from 14 mm to 56 mm, while the gap between cumulative precipitation and multi-monthly average precipitation remained mostly unchanged. EDI also deviated from the other indices in June and July of 2000. EDI increased but the other two decreased. Monthly precipitation deficits were improving and reached 87% of its long-term average, but the deficit in the moving cumulative precipitation and multi-monthly average precipitation was increasing from 62 mm to 122 mm.
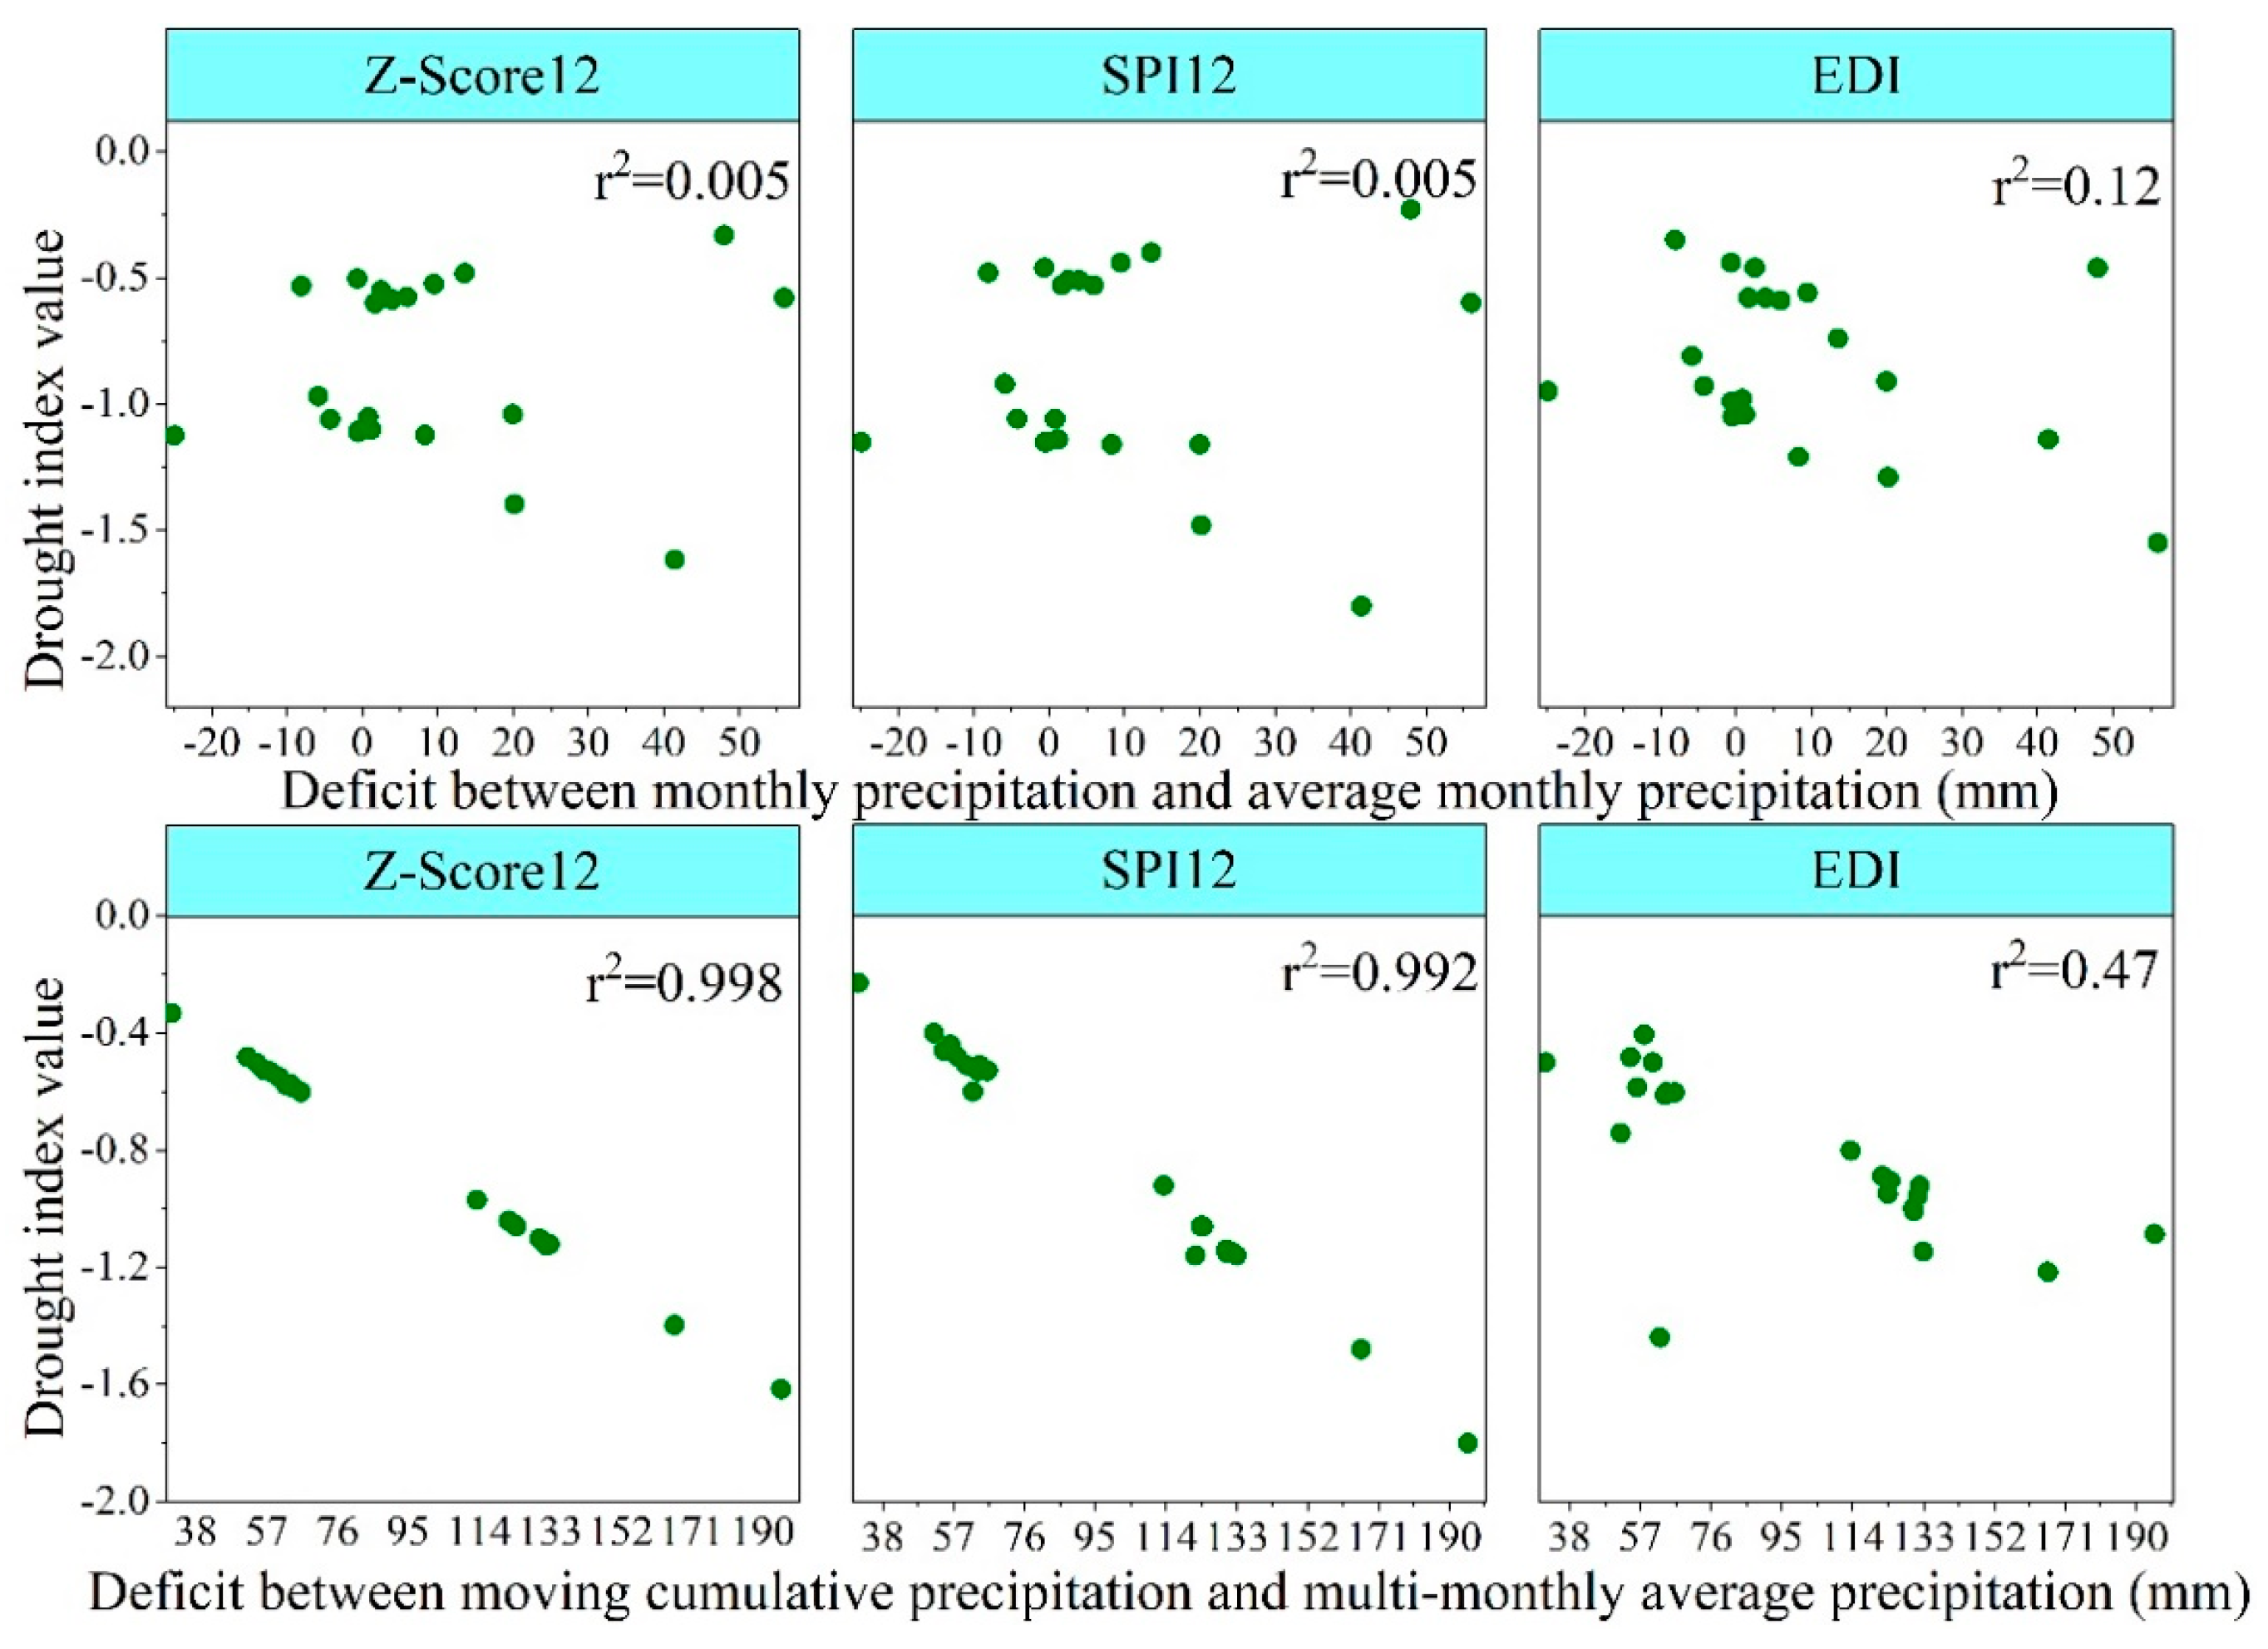
Based on the correlation analysis shown Figure 8, it was further found that Z-Score12 and SPI12 did have a weak relationship with monthly precipitation variability (r2 = 0.005). While they showed a significant correlation with deficit between moving cumulative precipitation and multi-monthly average precipitation, and the r2 was 0.998 and 0.992, respectively. Correlation between EDI and water deficit indicated by moving cumulative and multi-monthly average precipitation in 12-month timestep was also better than its relationship with monthly precipitation change, but the r2 was 0.47, which is not as strong as the other two indices were.
As shown in Figure 9, moving cumulative precipitation was larger than multi-monthly average precipitation in 15-month timestep during September and October in 1999, and then went shorter and below the multi-monthly average precipitation. The deficit was 31 mm to 80 mm from November 1999 to May 2000 and became larger from June 2000 until getting a peak value of 186 mm in November 2000. Subsequently, it declined again to 125 mm to 142 mm during December 2000 to May 2001.
Z-Score15 and SPI15 tracked cumulative precipitation changes, and generally experienced decrease-increase-decrease-increase fluctuations during the entire drought period. The indices detected a normal-wet condition in September 1999, and then decreased indicating a mild drought during November 1999 to May 2000. From June 2000, their values dropped below −1.0 indicating a moderate drought. However, EDI performed differently at times. The index detected a mild drought during September 1999 to May 2000 and then decreased further, indicating a moderate drought except in July, October to December in 2000, and in May in 2001, when EDI only performed mild drought conditions.
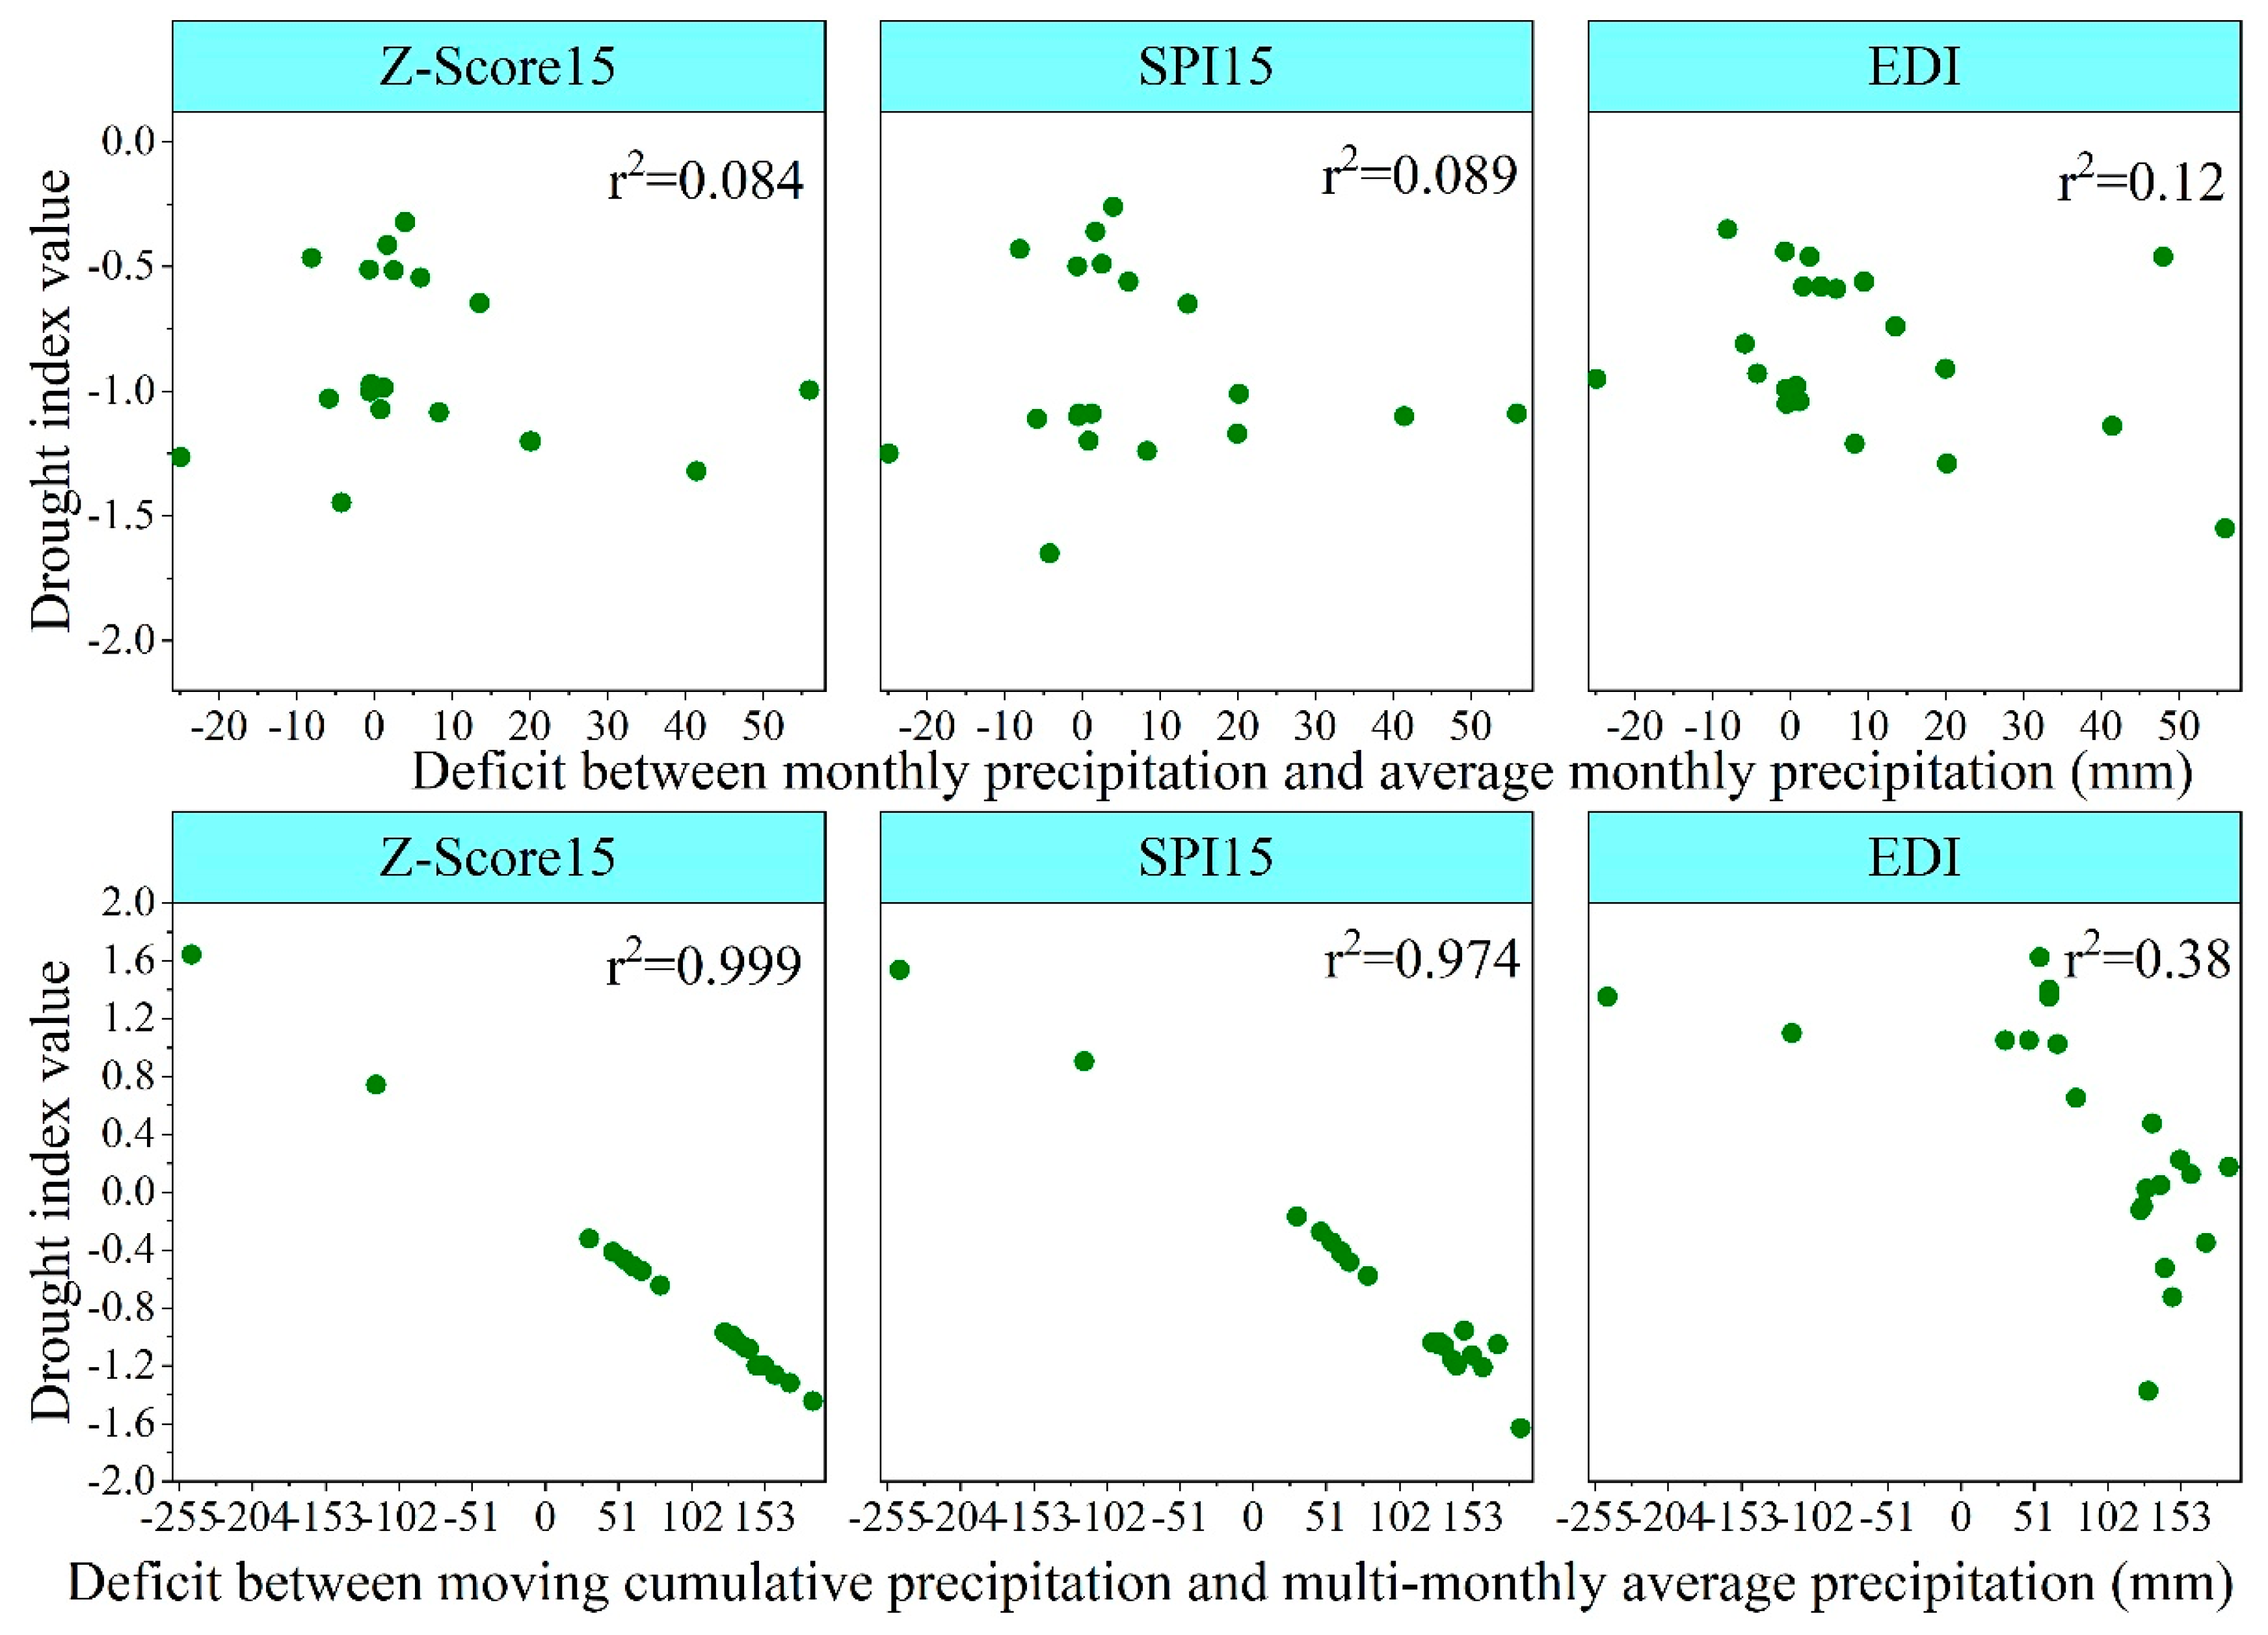
Scatter plots were also produced for DIs with respectively monthly and multi-monthly precipitation deficits in 15-month timestep Figure 10. Similar with the other timesteps, Z-Score15 and SPI15 showed a weak relationship with deficit between monthly precipitation and average monthly precipitation, the r2 was 0.0084 and 0.0089, respectively. While they correlated quite well with the deficit between moving cumulative precipitation and multi-monthly average precipitation in 15-month timestep, with r2 of both of them higher than 0.95. The r2 of EDI and water deficit indicated by moving cumulative and multi-monthly average precipitation in 15-month timestep was higher than that in the nine-month timestep but lower than the 12-month timestep.
Based on the above results using different timesteps (nine-month, 12-month, and 15-month), SPI, Z-Score, and EDI picked up the precipitation deficit and can be used to demonstrate actual drought conditions. SPI and Z-Scores were more sensitive to the changes of the deficit between moving cumulative precipitation and multi-monthly average precipitation, while EDI tracked the variation in monthly precipitation deficit more closely. Compared with other timesteps, SPI and Z-Scores best responded to deficits in cumulative precipitation and more closely tracked EDI when a 12-month timestep was used.
In terms of drought severity, SPI indicated more severe drought conditions than the Z-Score and EDI from September 1999 to May 2001, except for the 12-month time step, which was almost the same as Z-Score12. The frequency of drought severity conditions detected by DIs in Keshan is demonstrated in Table 5. The extreme drought and severe drought detected by SPI9 occurred in May and June 2000, respectively. The two severe droughts detected by Z-Score12 and SPI12 occurred in August 2000, while the severe drought was detected in November 2000 using SPI15. The cumulative precipitation respectively achieved 49.19%, 53.18%, 60.81%, and 67.55% of its corresponding multi-monthly average in each particular month. Overall, Z-Score12 and SPI12 was more consistent with drought severity according to actual conditions.
Several researchers had addressed droughts conditions in northeast China [40,41]. Song et al. [42] indicated that precipitation is a key factor affecting drought in this area, and proposed an index particularly suitable for detecting, monitoring, and exploring spring droughts in the Songnen Plain. Therefore, we selected several precipitation-based indices to evaluate the drought condition in the WRB and assessed their performances of DIs in drought monitoring. Our results proved that it was necessary to investigate various indices to develop a reliable drought monitoring system. This was consistent with previous studies [17,43,44], which indicated that considering more than one DI for drought studies can help investigate how well they cohere with each other and examine the sensitivity and accuracy of DIs. Montaseri and Amirataee [45] used seven meteorological drought indices to monitor drought characteristics in 12 diverse parts of the world endowed with various climatic conditions and found that the application of SPI can result in higher relative advantages to undertake a comprehensive and accurate analysis. Our study agrees with this study and also found SPI was the most reliable drought indicator among the DIs. The performance of SPI may vary when compared with different indices. However, this conclusion will be true for a meteorological drought monitoring which is based solely on rainfall, and also where rainfall can define drought conditions by its own [17,45,46]. In this study, performance of DIs in different timesteps varied a great deal, and DIs overall exhibited the best coherence in intermediate timesteps. This result showed that timestep selection is as important as a particular DI in drought assessment. These conclusions were supported by previous studies [28,29,47]. Therefore, we recommended that various indices should be investigated in drought monitoring considering intermediate timesteps to develop a reliable drought monitoring system.
All types of drought originate from the deficiency of precipitation and thus many drought indices incorporate the precipitation component in various forms (e.g., SPI, precipitation percentile, decile), especially for a comprehensive drought assessment [14,17,19]. However, the relationship between precipitation and drought needs to be further investigated as other studies indicated that high temperature can also contribute to the quick onset of drought [48,49]. Furthermore, according to the Fifth Assessment Report of the IPCC [50], most ecosystems will be impacted to a greater extent by the climatic extremes in future because most of the global climate models predicted more extremes in the climates such as multi-year droughts. Droughts monitoring and evaluation for ecosystems are becoming more urgent [24,26,27]. Therefore, future studies will need to focus on ecosystem droughts based on multiple drought indices, including remote-sensing indices.
4. Conclusions
Comparisons of numerical values of selected DIs using diverse timesteps and their relative applicability in drought detection for a particular period (September 1999 to May 2001) were conducted in the WRB. The results showed that timestep selection is as important as a particular DI in drought assessment. DIs with intermediate timesteps (7–18 months) were better correlated to each other and showed a better conformity. SPI was the most reliable drought indicator in the WRB, especially with timesteps of 10–12 months. Although inferior to SPI, the Z-Score was also a useful index, especially because of its simple calculation. EDI was found to be of high value and should be used with DIs because of its timestep-independence and high coherence with other DIs. However, PN was not recommended for use in determining drought in the WRB due to its poor performance in comparisons of drought class indications and, if used, should be limited to short timesteps if (less than three months). Based in the application of the DIs during an historical drought period, Z-Score and SPI were found to be more sensitive to multi-monthly cumulative precipitation changes with respect to monthly precipitation changes, while EDI can provide reasonable accuracy if only monthly precipitation data is used. DIs overall exhibited the best coherence using the 12-month timestep. These results indicate that additional studies should be conducted with various indices for different timesteps to reliably identify drought conditions, especially in combination with intermediate timesteps.
Author Contributions
All authors contributed to the design and development of this manuscript. H.L., W.L., and G.Z. provided important advice on the concept of structuring of the manuscript. F.L. carried out the formal analysis and prepared the original draft of the manuscript. J.-C.K. made great contributions to editing the manuscript.
Funding
The research was jointly funded by the National Natural Science Foundation of China (No. 41701020), the Key Program of Science and Technology Development Plan of Jilin Province (No. 20170520086JH and No. 20180101078JC), the Open Foundation of State Key Laboratory of Hydrology-Water Resources and Hydraulic Engineering (No. 2016490611), and the NSFC-NRF Scientific Cooperation Program (No. 51711540299).
Acknowledgments
The authors are grateful to Christopher Martin Swarzenski for editing the manuscript prior to submission.
Conflicts of Interest
The authors declare no conflict of interest.
References
- Chen, S.T.; Kuo, C.C.; Yu, P.S. Historical trends and variability of meteorological droughts in Taiwan. Hydrol. Sci. J. 2009, 54, 430–441. [Google Scholar] [CrossRef]
- Meehl, G.A.; Karl, T.; Easterling, D.R. An introduction to trends in extreme weather and climate events: Observations, socioeconomic impacts, terrestrial ecological impacts, and model projections. Bull. Am. Meteorol. Soc. 2000, 81, 413–416. [Google Scholar] [CrossRef]
- Zamani, R.; Tabari, H.; Willems, P. Extreme streamflow drought in the Karkheh river basin (Iran): Probabilistic and regional analyses. Nat. Hazards 2015, 76, 327–346. [Google Scholar] [CrossRef]
- Dai, A. Increasing drought under global warming in observations and models. Nat. Clim. Chang. 2013, 3, 52–58. [Google Scholar] [CrossRef]
- Wilhite, D.A.; Glantz, M.H. Understanding the drought phenomenon: The role of definitions. Water Int. 1985, 10, 111–120. [Google Scholar] [CrossRef]
- Dracup, J.A.; Lee, K.S.; Paulson, E.G. On the definition of droughts. Water Resour. Res. 1980, 16, 297–302. [Google Scholar] [CrossRef]
- Acosta-Michlik, L.A.; Kumar, K.S.K.; Klein, R.J.T.; Campe, S. Application of fuzzy models to assess susceptibility to droughts from a socio-economic perspective. Reg. Environ. Chang. 2008, 8, 151–160. [Google Scholar] [CrossRef]
- White, D.H.; Walcott, J.J. The role of seasonal indices in monitoring and assessing agricultural and other droughts: A review. Crop Pasture Sci. 2009, 60, 599–616. [Google Scholar] [CrossRef]
- Sharma, S.; Mujumdar, P. Increasing frequency and spatial extent of concurrent meteorological droughts and heatwaves in India. Sci. Rep. 2017, 7. [Google Scholar] [CrossRef]
- Wu, J.; Chen, X.; Yao, H.; Gao, L.; Chen, Y.; Lui, M. Non-linear relationship of hydrological drought responding to meteorological drought and impact of a large reservoir. J. Hydrol. 2017, 551, 495–507. [Google Scholar] [CrossRef]
- Heim, R.R.J. A Review of twentieth-century drought indices used in the United States. Bull. Am. Meteorol. Soc. 2002, 83, 1149–1165. [Google Scholar] [CrossRef]
- Manatsa, D.; Mukwada, G.; Siziba, E.; Chinyanganya, T. Analysis of multidimensional aspects of agricultural droughts in Zimbabwe using the Standardized Precipitation Index (SPI). Theor. Appl. Climatol. 2010, 102, 287–305. [Google Scholar] [CrossRef]
- Li, X.; He, B.; Quan, X.; Liao, Z.; Bai, X. Use of the standardized precipitation evapotranspiration index (SPEI) to characterize the drying trend in Southwest China from 1982–2012. Remote Sens. 2015, 7, 10917–10937. [Google Scholar] [CrossRef]
- Buttafuoco, G.; Caloiero, T.; Coscarelli, R. Analyses of drought events in Calabria (southern Italy) using standardized precipitation index. Water Res. Manag. 2015, 29, 557–573. [Google Scholar] [CrossRef]
- Joshi, N.; Singh, A.K.; Madramootoo, C.A. Corn yield simulation under different nitrogen loading and climate change scenarios. J. Irrig. Drain. Eng. 2015, 141, 04015013. [Google Scholar] [CrossRef]
- Palmer, W. Meteorological Drought; US Department of Commerce, Weather Bureau; Research Paper No. 45; US Government Printing Office: Washington, DC, USA, 1965.
- Morid, S.; Smakhtin, V.; Moghaddasi, M. Comparison of seven meteorological indices for drought monitoring in Iran. Int. J. Climatol. 2006, 26, 971–985. [Google Scholar] [CrossRef] [Green Version]
- Yao, Z.; Ding, Y. Climate Statistics; Meteorological Press: Beijing, China, 1990. (In Chinese) [Google Scholar]
- McKee, T.B.; Doesken, N.J.; Kleist, J. The Relationship of Drought Frequency and Duration to Time Scales. In Proceedings of the 8th Conference on Applied Climatology, Anaheim, CA, USA, 17–22 January 1993; American Meteorological Society: Boston, MA, USA, 1993; pp. 179–184. [Google Scholar]
- Shafer, B.A.; Dezman, L.E. Development of a surface water supply index (SWSI) to assess the severity of drought conditions in snowpack runoff areas. In Proceedings of the 50th Annual Western Snow Conference, Reno, NV, USA, 19–23 April 1982; pp. 164–175. [Google Scholar]
- Khan, M.I.; Liu, D.; Fu, Q.; Saddique, Q.; Faiz, M.A.; Li, T.; Qamar, M.U.; Cui, S.; Cheng, C. Projected changes of future extreme drought events under numerous drought indices in the Heilongjiang province of China. Water Resour. Manag. 2017, 31, 1–17. [Google Scholar] [CrossRef]
- Byun, H.-R.; Wilhite, D.A. Objective quantification of drought severity and duration. J. Clim. 1999, 12, 2747–2756. [Google Scholar] [CrossRef]
- Zhang, B.; Zhao, X.; Jin, J.; Wu, P. Development and evaluation of a physically based multiscalar drought index: The standardized moisture anomaly index. J. Geophys. Res. Atmos. 2015, 120, 11575–11588. [Google Scholar] [CrossRef]
- Bajgain, R.; Xiao, X.; Wagle, P.; Basara, J.; Zhou, Y. Sensitivity analysis of vegetation indices to drought over two tallgrass prairie sites. ISPRS J. Photogramm. Remote Sens. 2015, 108, 151–160. [Google Scholar] [CrossRef]
- Gao, B.-C. NDWI—A normalized difference water index for remote sensing of vegetation liquid water from space. Remote Sens. Environ. 1996, 58, 257–266. [Google Scholar] [CrossRef]
- Gu, Y.; Brown, J.F.; Verdin, J.P.; Wardlow, B. A five-year analysis of MODIS NDVI and NDWI for grassland drought assessment over the central Great Plains of the United States. Geophys. Res. Lett. 2007, 34. [Google Scholar] [CrossRef] [Green Version]
- Zhou, Y.; Xiao, X.; Zhang, G.; Wagle, P.; Bajgain, R.; Dong, J.; Jin, C.; Basara, J.B.; Anderson, M.C.; Hain, C.; et al. Quantifying agricultural drought in tallgrass prairie region in the US Southern Great Plains through analysis of a water-related vegetation index from MODIS images. Agric. For. Meteorol. 2017, 246, 111–122. [Google Scholar] [CrossRef]
- Keyantash, J.; Dracup, J.A. The quantification of drought: An evaluation of drought indices. Bull. Am. Meteorol. Soc. 2002, 83, 1167–1180. [Google Scholar] [CrossRef]
- Hao, Z.; Aghakouchak, A. A nonparametric multivariate multi-index drought monitoring framework. J. Hydrometeorol. 2014, 15, 89–101. [Google Scholar] [CrossRef]
- He, B.; Lü, A.F.; Wu, J.J.; Zhao, L.; Liu, M. Drought hazard assessment and spatial characteristics analysis in China. J. Geogr. Sci. 2011, 21, 235–249. [Google Scholar] [CrossRef]
- Zhai, J.Q.; Su, B.; Krysanova, V.; Vetter, T.; Gao, C.; Jiang, T. Spatial variation and trends in PDSI and SPI indices and their relation to streamflow in 10 large regions of China. J. Clim. 2010, 23, 649–663. [Google Scholar] [CrossRef]
- Wang, H.; Chen, Y.; Pan, Y.; Li, W. Spatial and temporal variability of drought in the arid region of China and its relationships to teleconnection indices. J. Hydrol. 2015, 523, 283–296. [Google Scholar] [CrossRef]
- Feng, X.; Zhang, G.; Yin, X. Hydrological responses to climate change in Nenjiang River Basin, Northeastern China. Water Resour. Manag. 2011, 25, 677–689. [Google Scholar] [CrossRef]
- Song, X.; Song, S.; Sun, W.; Mu, X.; Wang, S.; Li, J.; Li, Y. Recent changes in extreme precipitation and drought over the Songhua River Basin, China, during 1960–2013. Atmos. Res. 2015, 157, 137–152. [Google Scholar] [CrossRef] [Green Version]
- Zhong, K.; Zheng, F.; Wu, H.; Qin, C.; Xu, X. Dynamic changes in temperature extremes and their association with atmospheric circulation patterns in the Songhua River Basin, China. Atmos. Res. 2017, 190, 77–88. [Google Scholar] [CrossRef]
- Ahmadalipour, A.; Moradkhani, H.; Svoboda, M. Centennial drought outlook over the CONUS using NASA-NEX downscaled climate ensemble. Int. J. Climatol. 2017, 37, 2477–2491. [Google Scholar] [CrossRef]
- Barua, S.; Ng, A.W.M.; Perera, B.J.C. Comparative Evaluation of drought indexes: Case study on the Yarra River Catchment in Australia. J. Water Resour. Plan. Manag. 2011, 137, 215–226. [Google Scholar] [CrossRef]
- Kim, D.W.; Byun, H.R.; Choi, K.S. Evaluation, modification, and application of the effective drought index to 200-year drought climatology of Seoul, Korea. J. Hydrol. 2009, 378, 1–12. [Google Scholar] [CrossRef]
- Ding, H.; Xia, B. Analysis of drought and their factors in Keshan County. Theor. Obs. 2014, 3, 72–73. (In Chinese) [Google Scholar]
- Yang, H.; Wang, H.; Fu, G.; Yan, H.; Zhao, P.; Ma, M. A modified soil water deficit index (MSWDI) for agricultural drought monitoring: Case study of Songnen Plain, China. Agric. Water Manag. 2017, 194, 125–138. [Google Scholar] [CrossRef]
- Faiz, M.A.; Liu, D.; Fu, Q.; Sun, Q.; Li, M.; Baig, F.; Li, T.; Cui, S. How accurate are the performances of gridded precipitation data products over Northeast China? Atmos. Res. 2018, 211, 12–20. [Google Scholar] [CrossRef]
- Song, X.; Li, L.; Fu, G.; Li, J.; Zhang, A.; Liu, W.; Zhang, K. Spatial–temporal variations of spring drought based on spring-composite index values for the Songnen Plain, Northeast China. Theor. Appl. Climatol. 2014, 116, 371–384. [Google Scholar] [CrossRef]
- Pandey, R.P.; Dash, B.B.; Mishra, S.K.; Singh, R. Study of indices for drought characterization in KBK districts in Orissa (India). Hydrol. Process. 2010, 22, 1895–1907. [Google Scholar] [CrossRef]
- Paulo, A.; Pereira, L.S. Drought concepts and characterization. Water Int. 2006, 31, 37–49. [Google Scholar] [CrossRef]
- Montaseri, M.; Amirataee, B. Comprehensive stochastic assessment of meteorological drought indices. Int. J. Climatol. 2016, 37, 998–1013. [Google Scholar] [CrossRef]
- Wu, H.; Hayes, M.J.; Weiss, A.; Hu, Q. An evaluation of the standardized precipitation index, the China-Z index and the statistical Z-score. Int. J. Climatol. 2001, 21, 745–758. [Google Scholar] [CrossRef]
- Dogan, S.; Berktay, A.; Singh, V.P. Comparison of multi-monthly rainfall-based drought severity indices, with application to semi-arid Konya closed basin, Turkey. J. Hydrol. 2012, 470, 255–268. [Google Scholar] [CrossRef]
- Luo, L.; Apps, D.; Arcand, S.; Xu, H.; Pan, M.; Hoerling, M. Contribution of temperature and precipitation anomalies to the California drought during 2012–2015. Geophys. Res. Lett. 2017, 44, 3184–3192. [Google Scholar] [CrossRef]
- Williams, A.P.; Seager, R.; Abatzoglou, J.T.; Cook, B.I.; Smerdon, J.E.; Cook, E.R. Contribution of anthropogenic warming to California drought during 2012–2014. Geophys. Res. Lett. 2015, 42, 6819–6828. [Google Scholar] [CrossRef]
- Field, C.B.; Barros, V.R.; Mach, K.; Mastrandrea, M. Climate Change 2014: Impacts, Adaptation, and Vulnerability; Contribution of Working Group II to the Fifth Assessment Report; Intergovernmental Panel on Climate Change: Geneva, Switzerland, 2014. [Google Scholar]
Figure 1.
The Wuyuer River Basin in Northeast China and the meteorological (dots) stations used in this study.
Figure 1.
The Wuyuer River Basin in Northeast China and the meteorological (dots) stations used in this study.

Figure 2.
Pearson correlation coefficients between drought indices for various timesteps. Notes: Each time step consists of three different indices (one pixel for each DI in the order of PN, Z-Score, and SPI).
Figure 2.
Pearson correlation coefficients between drought indices for various timesteps. Notes: Each time step consists of three different indices (one pixel for each DI in the order of PN, Z-Score, and SPI).

Figure 3.
Average correlation coefficient of representative DIs with short (Z-Score4), intermediate (PN10), and long timesteps (SPI24) against other DIs for each timestep.
Figure 3.
Average correlation coefficient of representative DIs with short (Z-Score4), intermediate (PN10), and long timesteps (SPI24) against other DIs for each timestep.

Figure 4.
Drought frequency identified by PNs vs. EDI (a), Z-Scores vs. EDI (b) and SPIs vs. EDI (c) in the WRB during 1960–2010.
Figure 4.
Drought frequency identified by PNs vs. EDI (a), Z-Scores vs. EDI (b) and SPIs vs. EDI (c) in the WRB during 1960–2010.

Figure 5.
Changes of precipitation and drought indices for the nine-month timestep in Keshan station from September 1999 to May 2001.
Figure 5.
Changes of precipitation and drought indices for the nine-month timestep in Keshan station from September 1999 to May 2001.

Figure 6.
Scatter plots of drought indices (i.e., Z-Score9, SPI9, and EDI) and deficit between monthly precipitation and average monthly precipitation (the first row) and deficit between moving cumulative precipitation and multi-monthly average precipitation (the second row) for the nine-month timestep in Keshan station from September 1999 to May 2001.

Figure 7.
Changes of precipitation and drought indices for 12-month timestep in Keshan station from September 1999 to May 2001.
Figure 7.
Changes of precipitation and drought indices for 12-month timestep in Keshan station from September 1999 to May 2001.

Figure 8.
Scatter plots of drought indices (i.e., Z-Score12, SPI12, and EDI) and deficit between monthly precipitation and average monthly precipitation (the first row) and deficit between moving cumulative precipitation and multi-monthly average precipitation (the second row) for 12-month timestep in Keshan station from September 1999 to May 2001.

Figure 9.
Changes of precipitation and drought indices for 15-month timestep in Keshan station from September 1999 to May 2001.
Figure 9.
Changes of precipitation and drought indices for 15-month timestep in Keshan station from September 1999 to May 2001.

Figure 10.
Scatter plots of drought indices (i.e., Z-Score15, SPI15, and EDI) and deficit between monthly precipitation and average monthly precipitation (the first row) and deficit between moving cumulative precipitation and multi-monthly average precipitation (the second row) for the 15-month timestep in Keshan station from September 1999 to May 2001.


| Drought Index | Full Name | Considered Variables | References |
|---|---|---|---|
| PDSI | Palmer Drought Severity Index | Precipitation, Temperature, Soil moisture | [16] |
| PN | Percent of Normal | Precipitation | [17] |
| Z-Score | Z-Score | Precipitation | [18] |
| SPI | Standardized Precipitation Index | Precipitation | [19] |
| SWSI | Surface Water Supply Index | Rainfall, Runoff, and Snow water content, Storage Reservoir Volume | [20] |
| SPEI | Standardized Precipitation Evapotranspiration Index | Precipitation, Evapotranspiration | [13] |
| RDI | Reconnaissance Drought Index | Precipitation, Potential Evapotranspiration | [21] |
| EDI | Effective Drought Index | Precipitation | [22] |
| SMAI | Standardized Moisture Anomaly Index | Precipitation, Runoff, Soil moisture, Evapotranspiration | [23] |
| LSWI | Land Surface Water Index | Remote Sensing Based Vegetation Indices | [24] |
| NDWI | Normalized Difference Water Index | Water and Vegetation information from MODIS (Moderate Resolution Imaging Spectroradiometer) images | [25,26] |
Table 2.
Statistical characteristics of precipitation in the Wuyuer River Basin.
| Stations | Elevation (m) | Coordinates | Statistics of Annual Precipitation Series (1960–2010) | |||||
|---|---|---|---|---|---|---|---|---|
| Lat. | Lon. | Mean (mm) | Max (mm) | Min (mm) | Median (mm) | St.D | ||
| Beian | 270 | 48.28 | 126.52 | 523 | 785 | 312 | 499 | 123 |
| Keshan | 235 | 48.05 | 125.88 | 497 | 901 | 252 | 492 | 110 |
| Fuyu | 163 | 47.80 | 124.48 | 438 | 748 | 285 | 418 | 125 |
Table 3.
Classifications of droughts for different DIs.
| Classifications | Extreme Drought | Severe Drought | Moderate Drought | Mild Drought | Normal-Wet Condition |
|---|---|---|---|---|---|
| 4 | 3 | 2 | 1 | 0 | |
| PN (%) | ≤40 | 40~55 | 55~80 | 80~100 | ≥100 |
| Z-Score | ≤−2.00 | −1.90~−1.50 | −1.49~−1.00 | −0.99~0.99 | ≥1 |
| SPI | ≤−2.00 | −1.90~−1.50 | −1.49~−1.00 | −0.99~0.99 | ≥1 |
| EDI | ≤−2.00 | −1.90~−1.50 | −1.49~−1.00 | −0.99~0.99 | ≥1 |
Table 4.
Correlation coefficients between EDI and other DIs in different timesteps.
| DIs | Timestep | |||||||||||||||||
|---|---|---|---|---|---|---|---|---|---|---|---|---|---|---|---|---|---|---|
| 1 | 2 | 3 | 4 | 5 | 6 | 7 | 8 | 9 | 10 | 11 | 12 | 15 | 18 | 24 | 30 | 36 | 48 | |
| PN | 0.32 | 0.37 | 0.41 | 0.48 | 0.53 | 0.57 | 0.61 | 0.65 | 0.68 | 0.68 | 0.67 | 0.66 | 0.63 | 0.59 | 0.52 | 0.42 | 0.33 | 0.35 |
| Z-Score | 0.33 | 0.41 | 0.47 | 0.52 | 0.57 | 0.63 | 0.68 | 0.73 | 0.76 | 0.79 | 0.78 | 0.76 | 0.66 | 0.60 | 0.51 | 0.43 | 0.35 | 0.33 |
| SPI | 0.33 | 0.42 | 0.47 | 0.54 | 0.60 | 0.66 | 0.73 | 0.76 | 0.78 | 0.81 | 0.80 | 0.78 | 0.71 | 0.64 | 0.52 | 0.43 | 0.35 | 0.32 |
Table 5.
Drought frequency (%) of detected by DIs in Keshan during September 1999 to May 2001.
| EDI | Z-Score9 | SPI9 | Z-Score12 | SPI12 | Z-Score15 | SPI15 | |
|---|---|---|---|---|---|---|---|
| Extreme drought | 0.00 | 0.00 | 4.76 | 0.00 | 0.00 | 0.00 | 0.00 |
| Severe drought | 4.76 | 0.00 | 4.76 | 4.76 | 4.76 | 0.00 | 4.76 |
| Moderate drought | 23.81 | 33.33 | 28.57 | 42.86 | 42.86 | 42.86 | 52.38 |
| Mild drought | 71.43 | 66.67 | 61.90 | 52.38 | 52.38 | 52.38 | 38.10 |
| Normal-wet Condition | 0.00 | 0.00 | 0.00 | 0.00 | 0.00 | 4.76 | 4.76 |
© 2019 by the authors. Licensee MDPI, Basel, Switzerland. This article is an open access article distributed under the terms and conditions of the Creative Commons Attribution (CC BY) license (http://creativecommons.org/licenses/by/4.0/).
Share and Cite
MDPI and ACS Style
Li, F.; Li, H.; Lu, W.; Zhang, G.; Kim, J.-C. Meteorological Drought Monitoring in Northeastern China Using Multiple Indices. Water 2019, 11, 72. https://doi.org/10.3390/w11010072
AMA Style
Li F, Li H, Lu W, Zhang G, Kim J-C. Meteorological Drought Monitoring in Northeastern China Using Multiple Indices. Water. 2019; 11(1):72. https://doi.org/10.3390/w11010072
Chicago/Turabian StyleLi, Fengping, Hongyan Li, Wenxi Lu, Guangxin Zhang, and Joo-Cheol Kim. 2019. "Meteorological Drought Monitoring in Northeastern China Using Multiple Indices" Water 11, no. 1: 72. https://doi.org/10.3390/w11010072
Note that from the first issue of 2016, this journal uses article numbers instead of page numbers. See further details here.