Flash Flood Simulation for Ungauged Catchments Based on the Distributed Hydrological Model
by
Pengfei Jia
1,2, 
Ronghua Liu
1,3,*,
Meihong Ma
2,*,
Qi Liu
1,3,
Yali Wang
1,3,
Xiaoyan Zhai
1,3,
Shuaishuai Xu
1,3 and
Dacheng Wang
4 1
China Institute of Water Resources and Hydropower Research, Beijing 100038, China
2
School of Geographic and Environmental Sciences, Tianjin Normal University, Tianjin 300387, China
3
State Key Laboratory of Simulation and Regulation of Water Cycle in River Basin, Beijing 100038, China
4
Lab of Spatial Information Integration, Institute of Remote Sensing and Digital Earth, Chinese Academy of Sciences, Beijing 100101, China
*
Authors to whom correspondence should be addressed.
Water 2019, 11(1), 76; https://doi.org/10.3390/w11010076
Submission received: 14 November 2018
/
Revised: 21 December 2018
/
Accepted: 27 December 2018
/
Published: 4 January 2019
(This article belongs to the Special Issue Catchment Modelling)
Abstract
:Flash flood is a significant threat to those who live in China and beyond. Reproducing them with distributed hydrological models is an effective measure for preventing flash floods. This paper introduces the China flash flood hydrological model (CNFF-HM); explores its principles, key steps, and applicability; and validates its simulation effects in two typical, small ungauged catchments (UCs), namely, Tiezhuling and Qianyangxi. First, the applicability of the model and the portability of the parameters were verified in Qianyangxi. Then, in Tiezhuling, the model parameters were comprehensively determined based on the measured values and simulation results, and the influence of the reservoir on the simulation effect was analyzed. Using the model’s different parameters in different catchments, the characteristics of the basin were compared and analyzed from the aspects of evapotranspiration, runoff, water distribution, and confluence. Finally, the early warning effect was evaluated. The results indicated the following: (1) The reservoir has a significant impact on model simulation. (2) The two UCs have similarities in evapotranspiration, runoff, and water source, and the difference in convergence is obvious. (3) With better early warning effect, the warning can achieve full coverage. These positive results suggest that this method should be further developed and tested.
1. Introduction
Flash floods, triggered mainly by short-term, high-intensity rainfall, are among the most destructive flood-related hazards, resulting in tremendous economic losses and casualties [1]. It remains a significant threat to those who live in China and beyond. For instance, on 19 July 2016, flash floods caused a total of 217 deaths or missing persons in Hebei Province and Henan Province of China [2]. From 1 October 2007 to 1 October 2015, the U.S. National Weather Service (NWS) reported a total of 28,826 flash flood events, killing 278 people, with 10% of these flash floods resulting in combined crop and property damages exceeding $100,000 per event [3]. Furthermore, heavy precipitation has been on an upward trend at both the continental and global scale [4,5,6], increasing the frequency and impact of flash floods. Hence, there is a rising global awareness about flash flood damage mitigation, and it is imperative to take effective measures to prevent flash floods.
Nowadays, hydrological models are one of the effective measures used to predict and prevent flash floods, and it is also an active topic of research. Hydrological models are mainly divided into three types: lumped hydrological models, semidistributed hydrological models, and distributed hydrological models [7,8]. Lumped hydrological models make uniform and mandatory assumptions, whereas distributed hydrological models can incorporate with distributed forcing data (e.g., rainfall, temperature, radiation), which are primarily provided by real-time monitoring (e.g., meteorological radar, satellite) and meteorological models to estimate the initial conditions (e.g., soil moisture distribution) [9]. It can perform hydrological calculations on both time and space, which is more commensurate with flash floods, and have better performance than uncalibrated, lumped models [10]. Zoccatelli et al. confirmed that the simulation effect was significantly improved after including local precipitation, especially the Nash efficiency coefficient, which saw an increase of up to 30% [11]. Anquetin et al. found that the distribution of spatial forcing particularly affected flood dynamics when it interacted with the spatial distribution of soil properties before saturation [12]. However, hydrological calculation is a significant challenge due to the highly variation and nonlinear property of flash floods in time/space, and the uncertainties such as soil moisture, soil types, especially in the ungauged catchments (UCs) that have no stage-discharge stations and relative records [13,14,15].
Generally speaking, hydraulic modeling is affected by many sources of uncertainty (input data, model structure, model parameters), particularly the available supporting data, which determines the simulation results of the model. In UCs, it is common to have supporting flow observations at only one point or to have no response records at all [16]. Such data scarcity (or absence) contributes to uncertainty in model parameter values [17,18,19]. Moreover, hydrologic model parameters often have strong spatial variability depending on geographic indicators (such as rainfall, underlying surface, and slope). Therefore, the parameters often vary from region to region and usually need to be calibrated and verified, which increases the difficulty of application in UCs [14,20]. In short, the lack of data prevents the use of detailed, physical-mechanism-based models, and simple conceptual models with only a few parameters are often the only feasible tool for predicting future flash floods [21,22].
Nowadays, in order to solve the data problem in ungauged or poorly gauged catchments, scientists comprehensively take into account the meteorological, hydrologic, or climatic characteristics of basins, such as the location, drained area, shape, and slope, and then transfer the hydrologic information from gauged catchments to ungauged or poorly gauged ones. Among them, the physical characteristics of UCs (e.g., near-surface soil moisture, topographical characteristics, and land use) can be obtained through remote sensing. When using the distributed hydrological model in UCs, the key is the determination of model parameters. The methods mainly include parameter estimation, parameter transplantation, or parametric regression methods, among which the parameter transplantation method is the most widely used. The principle is that the hydrological model parameters of similar watersheds are similar, and the watershed characteristics can thus be analyzed according to the model parameters [23].
Based on the China National Flash Flood Disaster Investigation and Evaluation (CNFFDIE), this paper validates the applicability of the China flash flood hydrological model (CNFF-HM) in two UCs—Qianyangxi and Tiezhuling—and analyzes the impact of the reservoir on simulation results. Then, the watershed characteristics are compared using the model parameters. Finally, the better warning effect is evaluated. The rest of the paper is structured as follows. Section 2 introduces the study area, data, and method used in this article. In addition, the CNFF-HM to compute the threshold for flash flood warnings and the model validation are also presented. In Section 3, the results are described and discussed. Finally, the major conclusions are drawn in Section 4.
2. Material and Data
2.1. Study Area
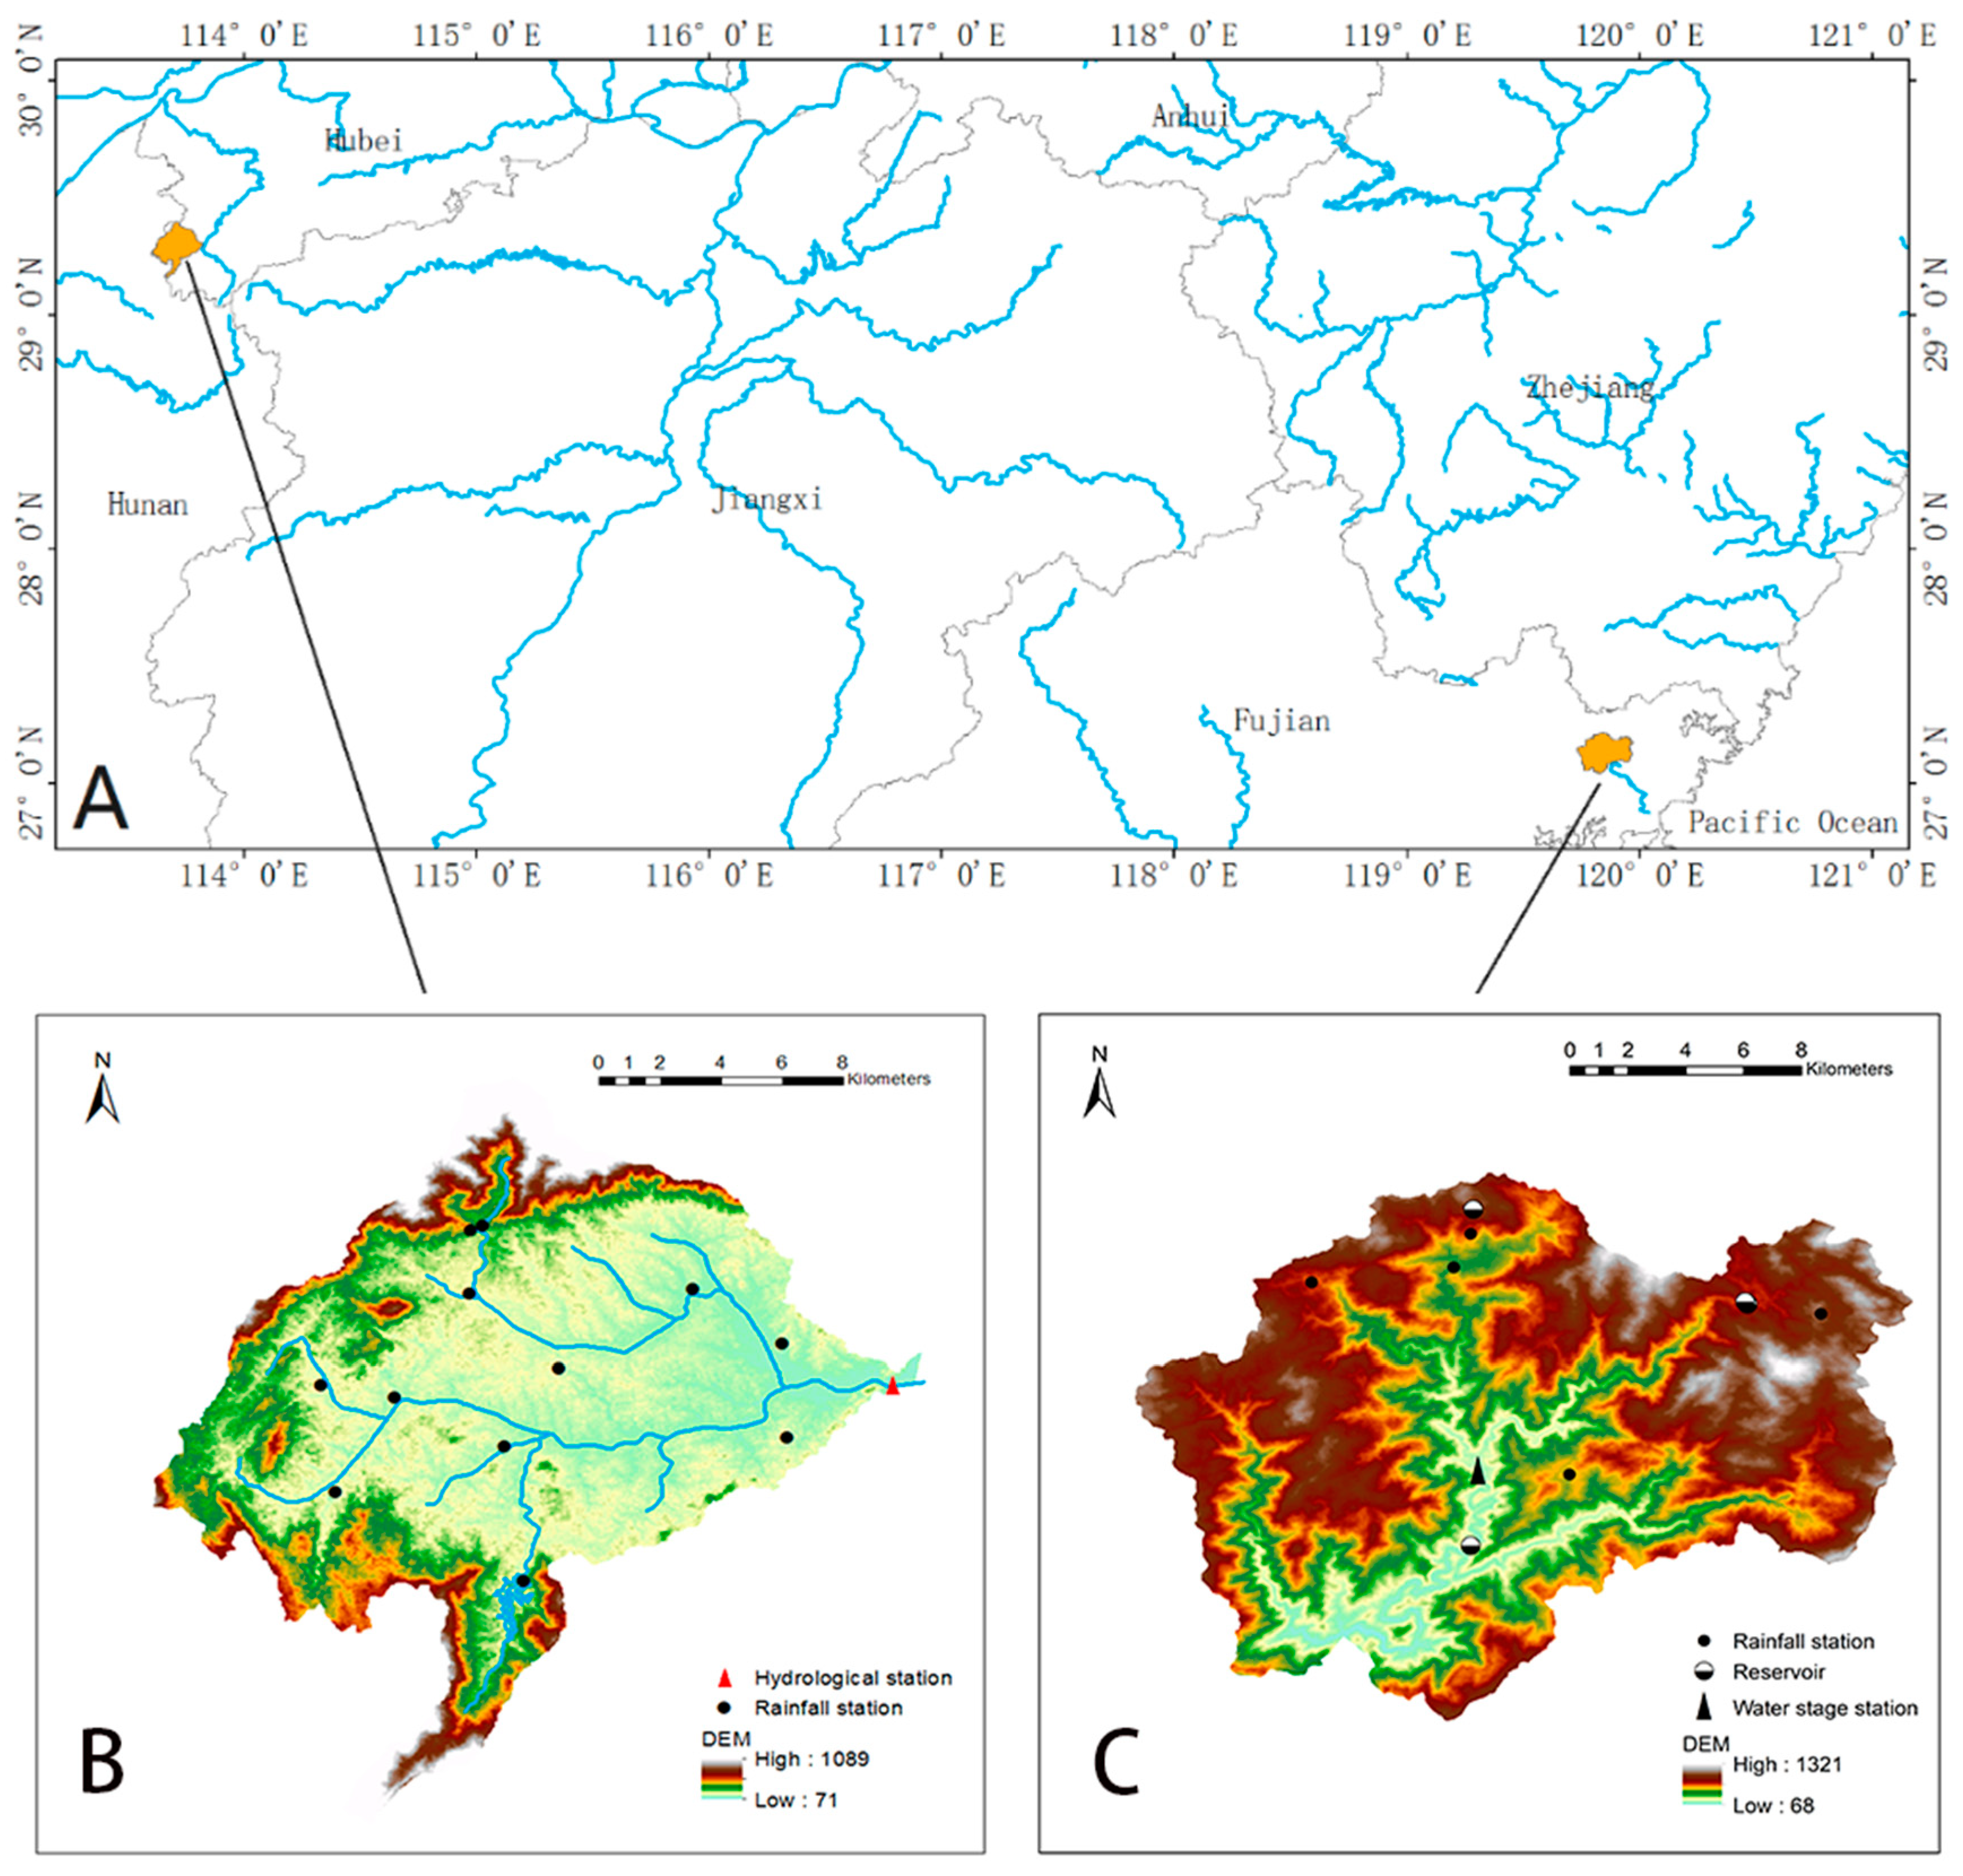
As a tributary of the Yangtze continental water source, Tiezhuling originates in Dajie Ridge located in the western range of Tongcheng County (29°09′13″ N, 113°39′40″ E). Tiezhuling flows into Juanshui River from Jinzhu Village, Tiezhuling Township, with a total length of 28.1 km, a catchment area of 251 km2, an annual runoff of 0.2 billion m3, a basin population of about 10,000 people, and a cultivated area of 5313.3 m2. Therefore, Tiezhuling is a mountainous stream in Tongcheng County. It has the characteristics of short process, large river slope, and rapid rise and fall of the river. Its peak flow is 1056 m3/s, and the annual average flow is 6.14 m3/s.
Originating in Zherong County, Qianyangxi Stream is one of the main tributaries in the lower reaches of the Sai River. It is located between 26°57′–27°4′ N and 119°30′–119°40′30″ E. The Qianyangxi Stream is a subtropical marine climate, with an annual average rainfall of 1480 mm. Influenced by topographic factors, the annual rainfall and annual runoff increase with altitude. The maximum annual rainfall is more than 2 to 2.5 times that of the minimum annual rainfall. The ratio of annual monthly precipitation during the year is 17% from January to March, 35% from April to June, 38% from July to September, and 10% from October to December. The monthly runoff in the flood season (March to September) and the dry season (October to March) accounts for 75% and 25% of the annual runoff, respectively.
These two UCs are prone to flash floods, mainly because of their complex geomorphological type and geological structures as well as poor soil water storage capacity due to unreasonable use of land and destruction of forest resources. When heavy rainfall is encountered, it is easy to trigger flash floods in a short time. The natural geography and spatial distribution of these two catchments are shown in Table 1 and Figure 1.
2.2. Data
The hydrometeorological data mainly comes from the flood excavation data of the hydrological station and the corresponding rainfall excerpt data of the upstream rainfall station in flash flood prevention areas (e.g., rainfall data, runoff data, and evaporation data). The extraction of small catchments features data mainly adopts a 1:50,000 digital elevation model (DEM), drawn by the Ministry of Natural Resources of the People’s Republic of China, with a resolution of 25 m × 25 m. Using seven hydrological units (small watersheds, river sections, reservoirs, nodes, watersheds, water sources, and depressions), the study area is generalized into a distributed watershed hydrological model composed of many hydrological elements in a hydraulic relationship. The data is mainly derived from county-level data issued by the official department. The physical characteristics of the river, including their slopes (SL), river density (RD), lengths, widths, and the cross-sectional shape, are obtained from DEMs or river surveys. For instance, SL is calculated from the DEM data using ArcGIS. RD utilizes China’s basic vector format datasets related to the grid area and the length of the river in the grid, which is calculated from river and lake data in China (Horton, 1945). The land use/coverage data comes from satellite imagery of the China–Brazil Earth Resources Satellite 2 (CBERS-2).
2.3. Methodology
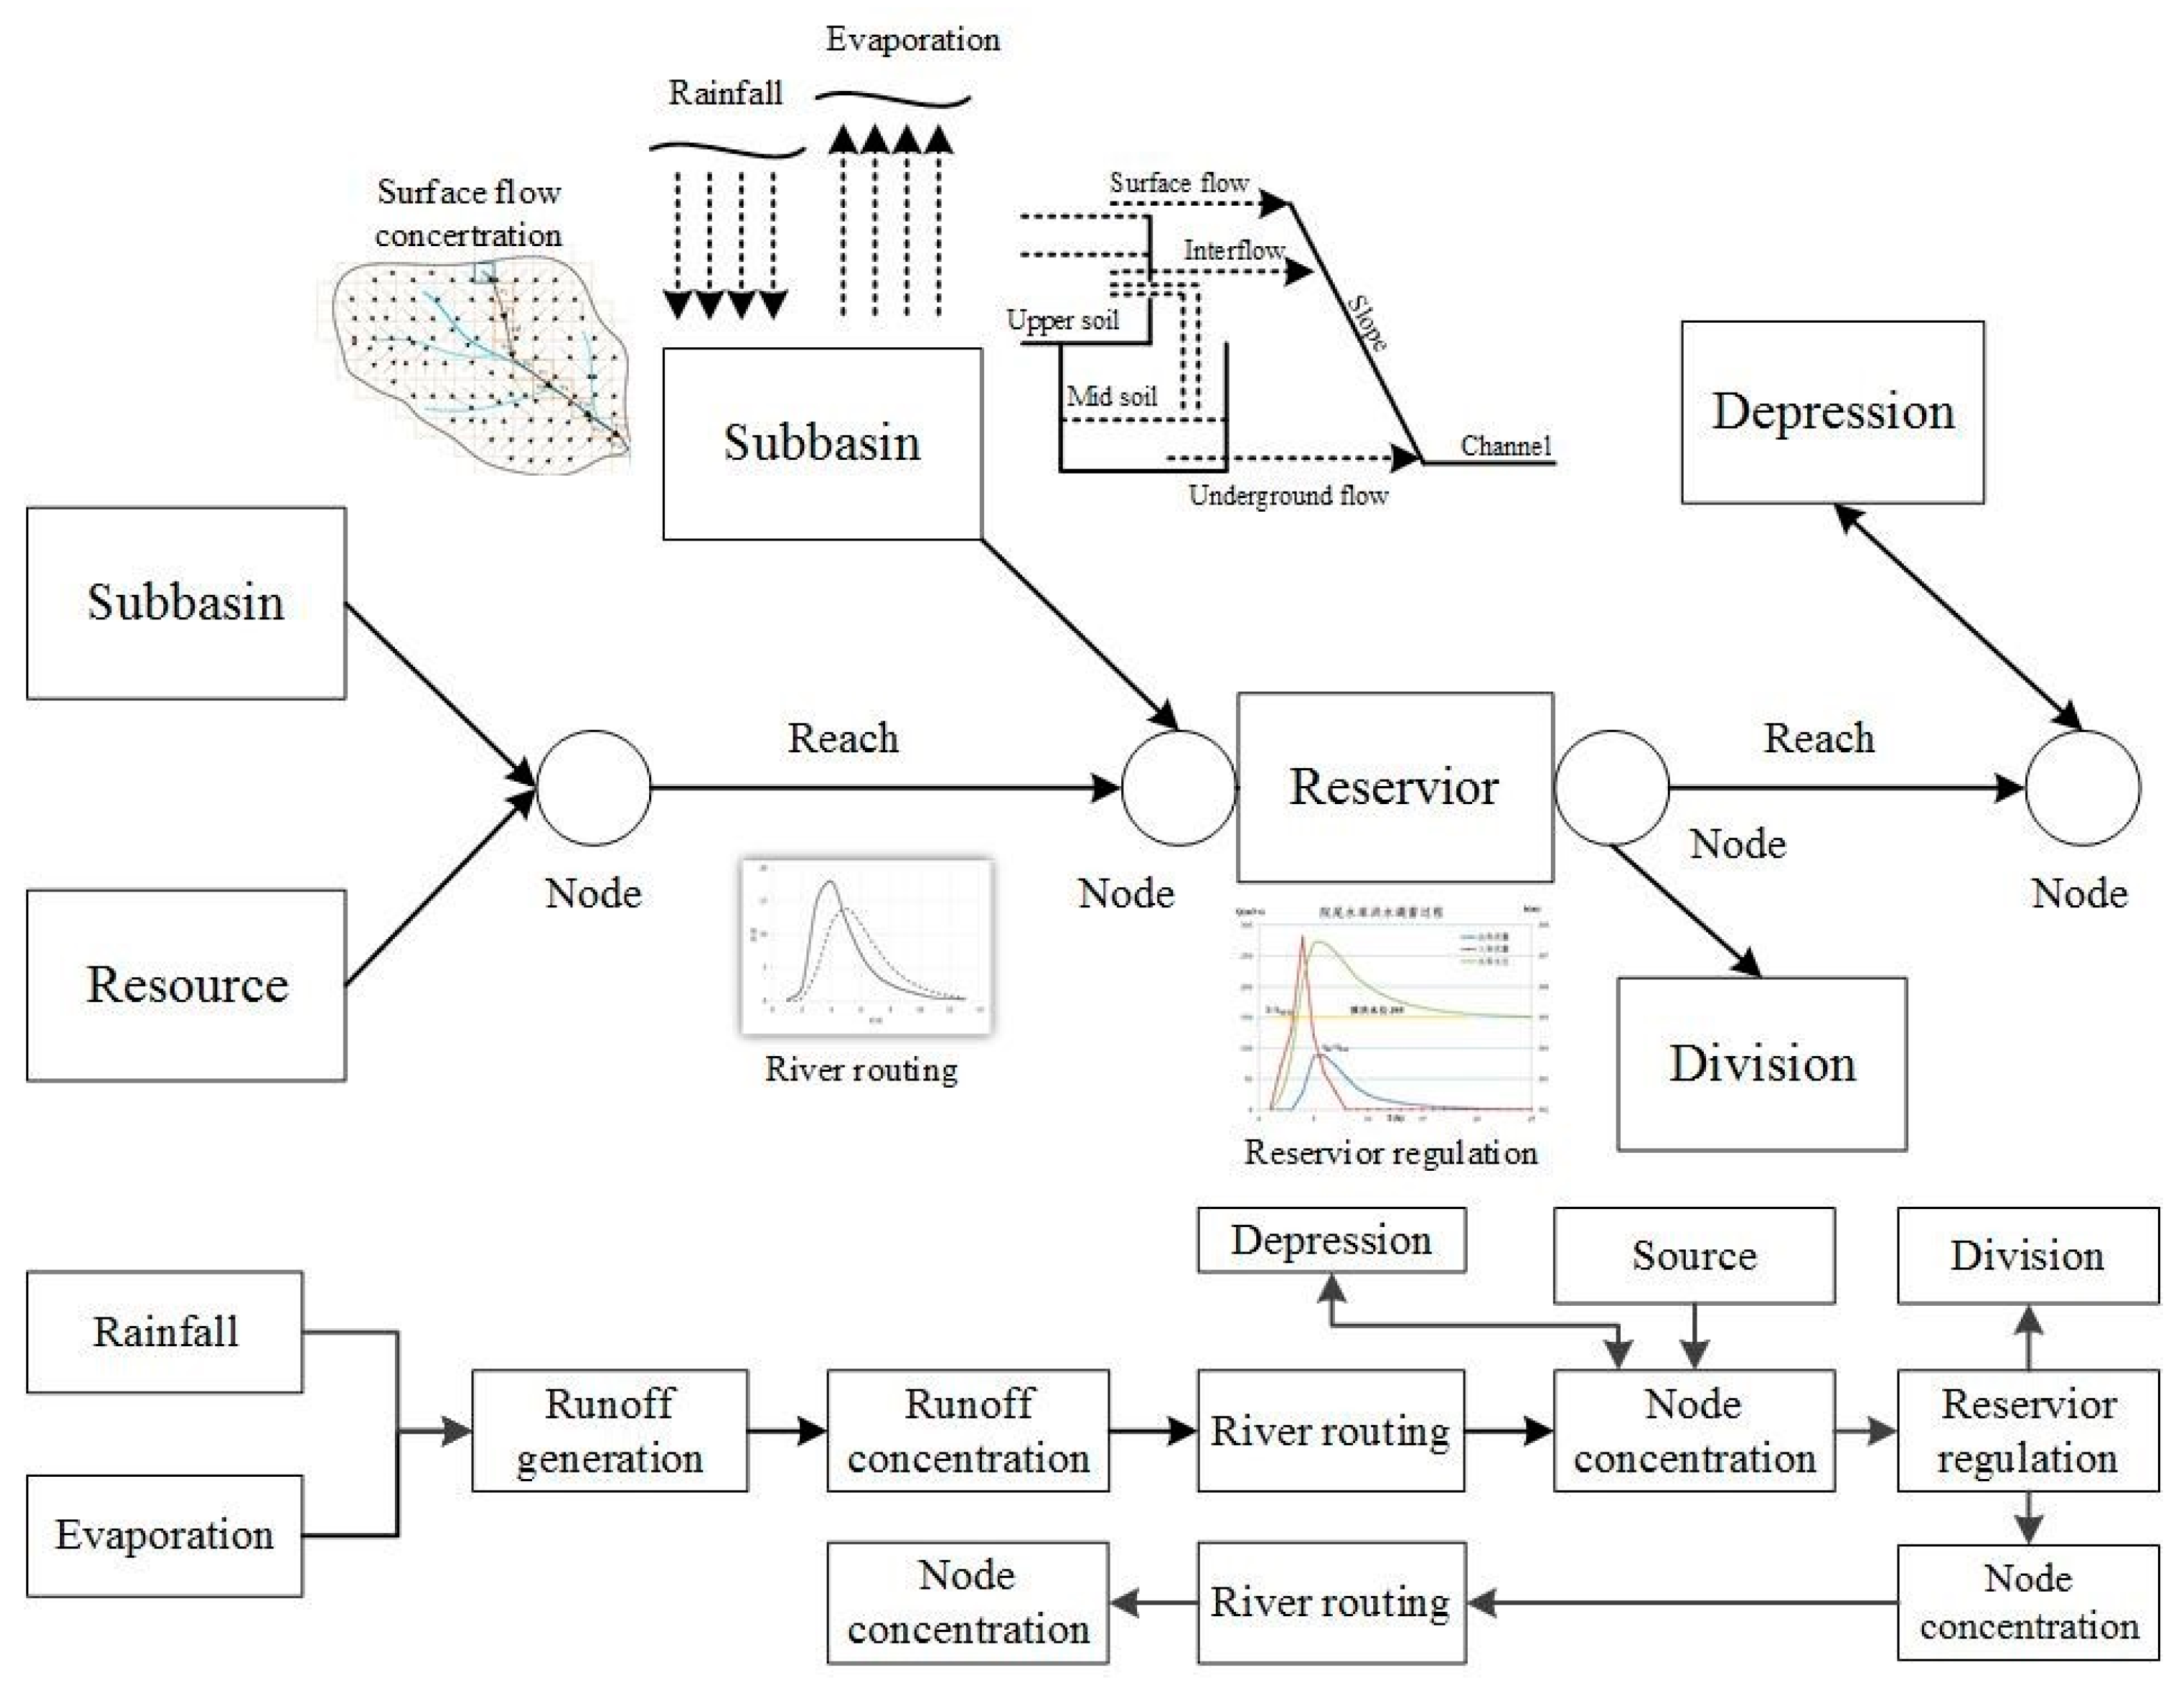
The distributed hydrological model can obtain the runoff process of each small watershed outlet by considering the spatial heterogeneity of climatic factors and underlying surface factors and then accurately simulating the hydrological process of the basin. At present, the distributed hydrological model is the basis for realizing flash flood forecasting, early warning analysis, and risk assessment [24,25]. The CNFF-HM is a distributed hydrological model and mainly includes the production flow calculation, the convergence calculation, the reservoir adjustment calculation, etc. The specific flowchart is shown in Figure 2 [26].
2.3.1. Production Module
After calculating the rainfall in the small catchment using the Tyson polygon or kriging interpolation method, a confluence model suitable for the actual situation is established according to the climatic conditions and topography of the basin. The production flow mechanism mainly includes stored-full, over-infiltration, and mixed runoffs. Both Fujian and Hubei have a subtropical monsoon climate with abundant rainfall, whose flow pattern is a stored-full runoff. The formula can be given as follows:
where A is the current average water storage capacity of the basin, B is the index of the water storage capacity-area distribution curve, R is the total production flow, PE is the rainfall after evaporation, WM is the soil water storage capacity, Wi is the soil moisture, and WMM is the maximum point water storage capacity in the basin.
The free water storage reservoir is used to divide the water source, and the free reservoir has a side outlet and a bottom outlet to separate the intermediate and underground runoff.
2.3.2. Confluence Module
The rainwater in the basin forms a net rain after deducting losses in the production and is injected into the river network through the slope convergence. Different rainfall periods in a rainfall process correspond to different spatial distribution velocity fields, confluence time fields, and unit lines, i.e., distributed time-varying unit lines. The spatial distribution of the underlying surface factors has a clear, physical meaning and is suitable for UCs. The flow rate calculation formula is as follows:
where V is the flow velocity, m/s; S is the slop of the flow direction; i is rainfall intensity; K is flow velocity coefficient, an empirical parameter that mainly reflects the impact of land use characteristics on the velocity friction, which should be determined according to the actual conditions of the catchment, m/s.
Among them, the slope of each grid can be extracted by DEM. Equation (3) is an equation for calculating the runoff based on distributed unit lines. The unit line will consider the influence of different rainfall intensities on runoff and the spatial distribution of multiple factors (e.g., topography, soil, vegetation, and underlying surface). The watershed is divided into small calculation units, and the unit line of the sink is analyzed for each unit. Therefore, it can truly reflect the process of runoff and solve the nonlinear problem of runoff in the basin.
Along the confluence path, the confluence time from the grids to the catchment outlet can be calculated by the following equation:
where is the runoff time in the grid, L is the length of the grid, and m is the number of grids on the runoff path.
(1) River evolution module
The dynamic Muskingum method divides the river section between upper and lower into N sections, establishes the relationship between the river characteristic parameters and the model parameters, and then uses the Muskingum method to calculate section-by-section. The equations are as follows:
where and are the inflows of the beginning and the end of the upper section, respectively; and are the outflows of the beginning and the end of the lower period, respectively; is the calculation period; q1 and q2 are the inflows of the beginning and end of the period, respectively; S1 and S2 are the water storage capacities at the beginning and end of the river, respectively; K is the propagation time of the river under steady flow; and x is the proportion of flow.
The channel section is generally generalized into different cross-sectional shapes, such as a parabola, triangle, and rectangle, and different convergence parameters are obtained. In this paper, the valley section has been generalized into a parabolic section for processing.
where N is the number of segments divided between the upper and lower sections of the river, a is the parameter determined by the shape of the section, L is the length of the river, S is the slope, Q0 is the reference flow, and Vw is the wave velocity.
(2) Reservoir storage module
We used the water balance method to calculate reservoir storage. The reservoir flood control process refers to the process of changing the amount of water in storage, the amount of water discharged from the reservoir, and the amount of water stored in the reservoir during the Δt period. The water balance formula is given as follows:
where Qi1 and Qi2 are the inflows at the beginning and end of the calculation period, respectively; Qo1 and Qo2 are the outflows at the beginning and end of the calculation period, respectively; V1 and V2 are the reservoirs at the beginning and end of the calculation period; and Δt is the length of the period.
2.3.3. Model Accuracy Evaluation Index
According to China’s “Standard for Hydrological Information and Hydrological Forecasting” (GB/T 22482-2008), the accuracy of flood forecasting generally includes flood peak flow (water level), flood volume (run flow), flood peak occurrence time, and flood process [27]. In this paper, the deterministic coefficient (DC), the relative error of the flood peak (QE), the relative error of the runoff depth (RE), and the peak time error (ΔT) were selected as the model accuracy index. The calculation method can be given as follows:
where and are the simulated and observed values, respectively; is the mean of the measured values; n is the length of the data sequence; is the relative error of the flood peak flow; and are the simulated and measured values of the flood peak flow, respectively; is the relative error; and are the simulated value of the runoff depth and the measured value, respectively; is the peak time difference; and and are the simulated and measured values of the peak time, respectively.
3. Results and Discussion
3.1. Simulation Results of Qianyangxi
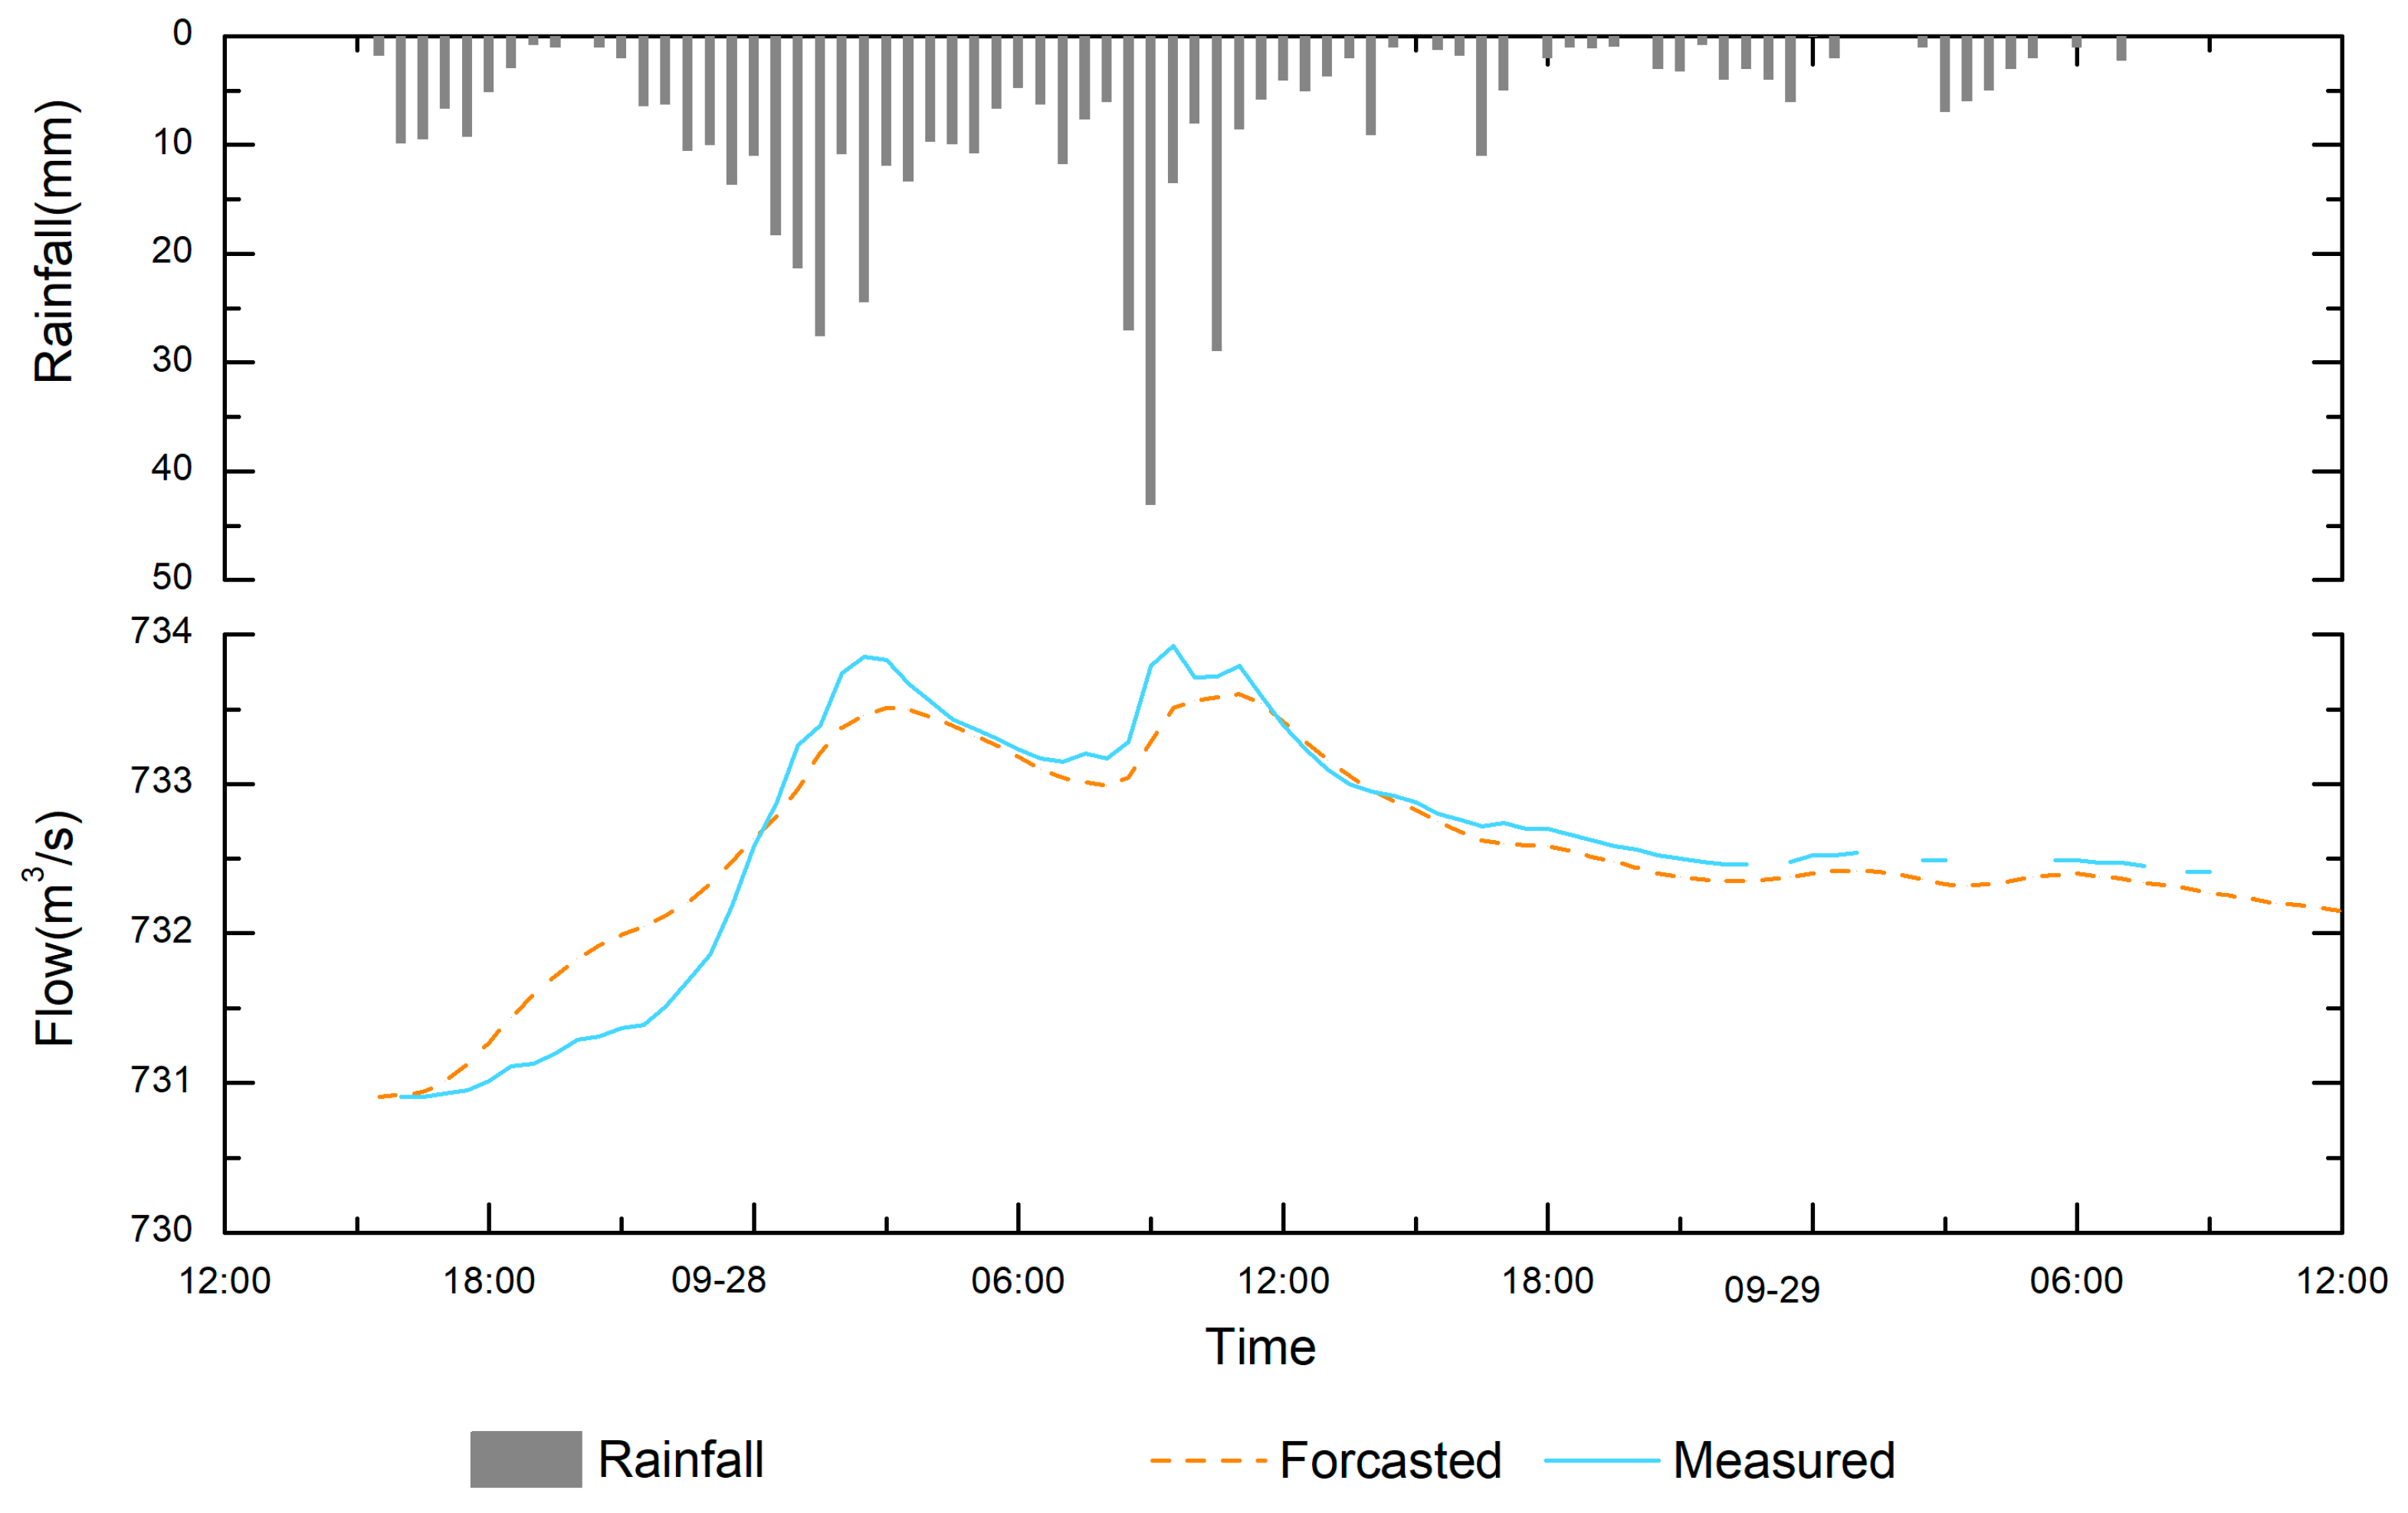
On 28 September 2016, affected by No. 17 Super Typhoon Megi, Zherong County suffered heavy rains with a 24-h rainfall of 558 mm and a 12-h rainfall of 393 mm. Flash floods broke out, resulting in huge economic losses and casualties, and the CNFF-HM played the key role. Since 2015, in the flash flood warning issued by Zherong County, the daily soil moisture content considered is mainly simulated by CNFF-HM, the model-related parameters are mainly obtained based on the parameter migration method, that is, the parameters were calibrated in the gauged basin and then transplanted to the Qianyangxi watershed [28]. Figure 3 shows a simulated flow process. Obviously, the maximum rainfall appears at 1:00 on 28 September, followed by more at 09:00 on the same day, which is a rare bimodal rain. Both the rainfall and the flow have two peaks. When the rainfall exceeds the warning value, the flash flood warning will be carried out within 30 min. In the rising water phase, the simulated flow rate is relatively high. After the peak period is reached, the flow rate is rapidly reduced to a certain extent and then becomes slow, and the simulated flow value is slightly lower. This may be due to random or systematic errors in parameter errors, imperfect model structure, and reservoir regulation (e.g., peak, sand washing), or it may be because the Qianyangxi watershed has many rainfall stations belonging to the flood season (April–October), resulting in annual precipitation being lower than the actual value. Table 2 shows the simulation results of Qianyangxi watershed; the determination coefficient is greater than 0.9. According to China’s “Standard for Hydrological Information and Hydrological Forecasting” (GB/T 22482-2008), the deterministic coefficient is optimal (more than 85%) and the peak time error is 0 h, which is the best accuracy that can be achieved. Combined with Figure 3, in the Zherong watershed, the flow accuracy simulated by the CNFF-HM model is high, and the transplantation parameters are applicable.
3.2. Simulation Results of Tiezhuling
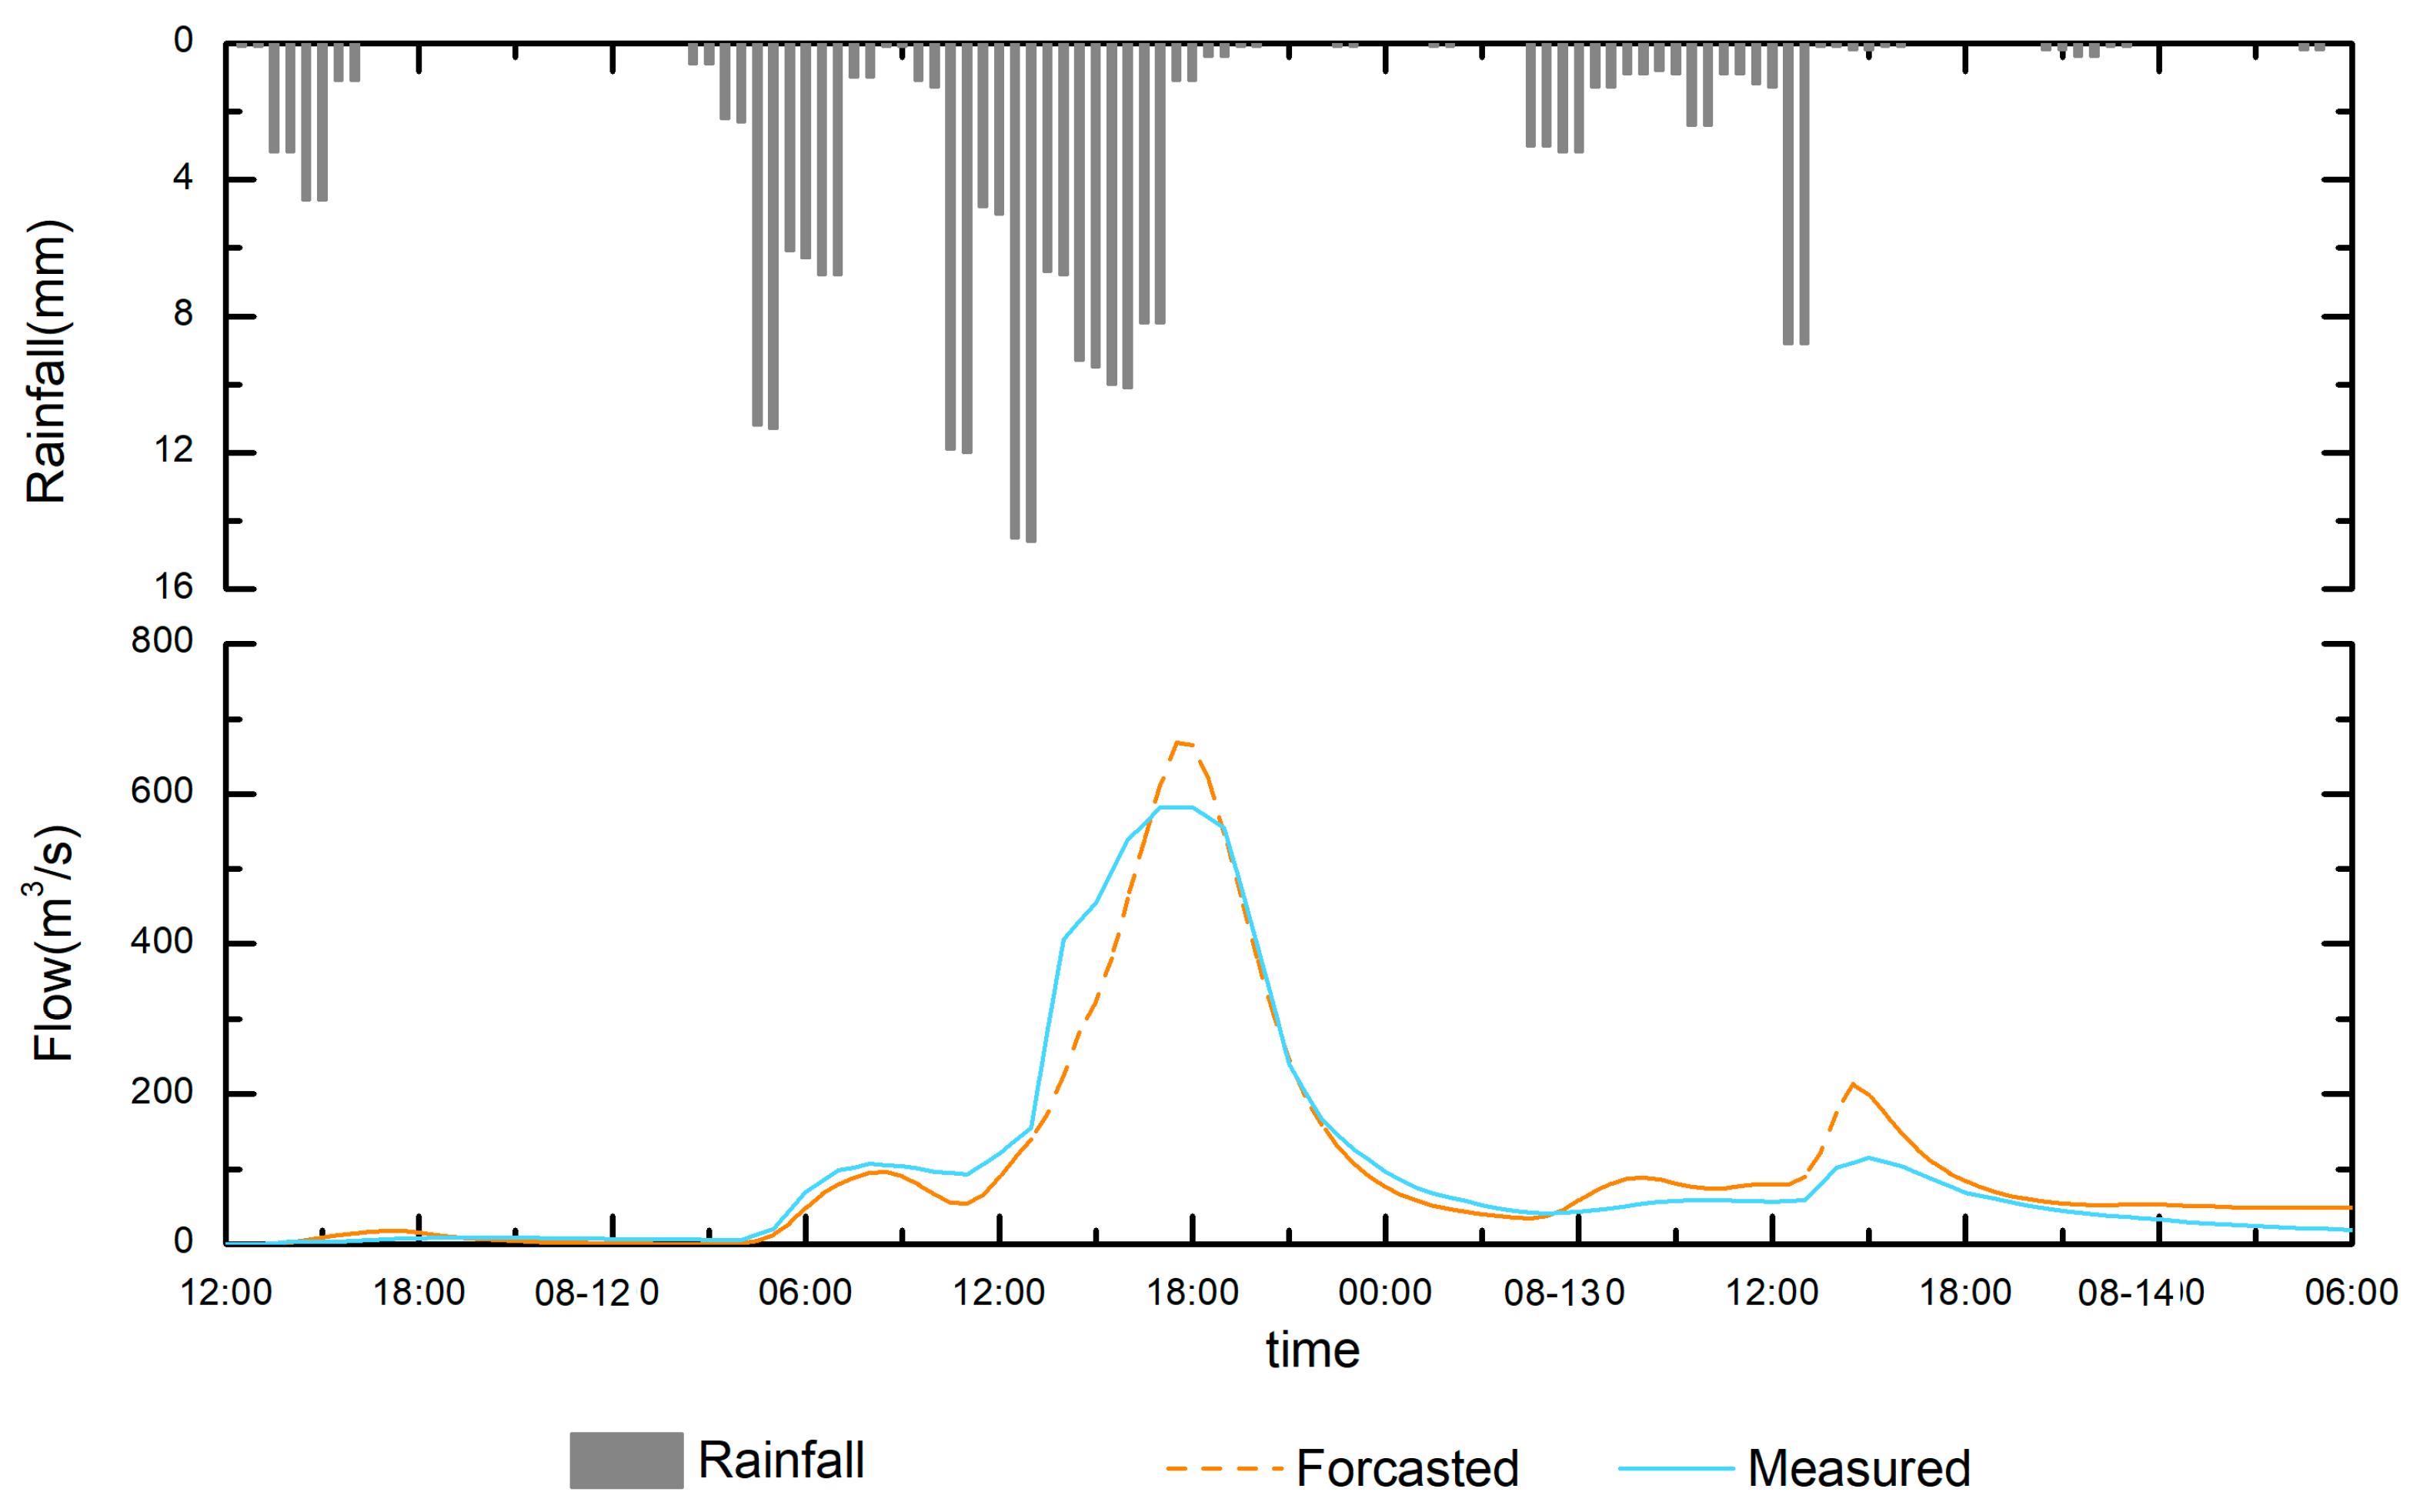
From 11 August to 14 August 2017, Tongcheng County suffered heavy rain with an average rainfall of 186.6 mm. The rainfall at Majing Reservoir was 302 mm and that at Zuogang Reservoir was 217 mm, causing the flash flood. According to incomplete statistics, the torrential rain affected 27,500 people in Tongcheng County, with a direct economic loss of $14.7 million. In the Tiezhuling catchment, the CNFF-HM model was used to simulate the flash flood process, and the model parameters were determined by combining the parameters of Qianyangxi and the measured data. Figure 4 shows that the simulated flood process is very consistent with the measured flood, but shows a subtle difference in the runoff process. In the rising water phase, the simulated flow is less than the measured flow, but it changes rapidly and the flood peak is high. In the water withdrawal stage, the simulated flood peak flow is higher and the retreating process is slower, which may be due to insufficient consideration of human activities or a low resolution of model-related data. (e.g., DEM, underlying surface, and soil moisture). In Table 3, the deterministic coefficient is 0.93, the average relative error of runoff depth and flood peak flow are 13.7% (less than 20%), and the relative error of the peak time is 0.5h. According to China’s “Standard for Hydrological Information and Hydrological Forecasting” (GB/T 22482-2008), the deterministic coefficient, the relative error of the flood peak flow, the relative error of the runoff depth, and the relative error of the peak current time are higher, and the deterministic coefficient reaches the accuracy of the Class A forecast (greater than 90%). Therefore the model has high simulation accuracy, indicating that it has good adaptability in the Tiezhuling watershed, and its production and convergence parameters are also reasonable.
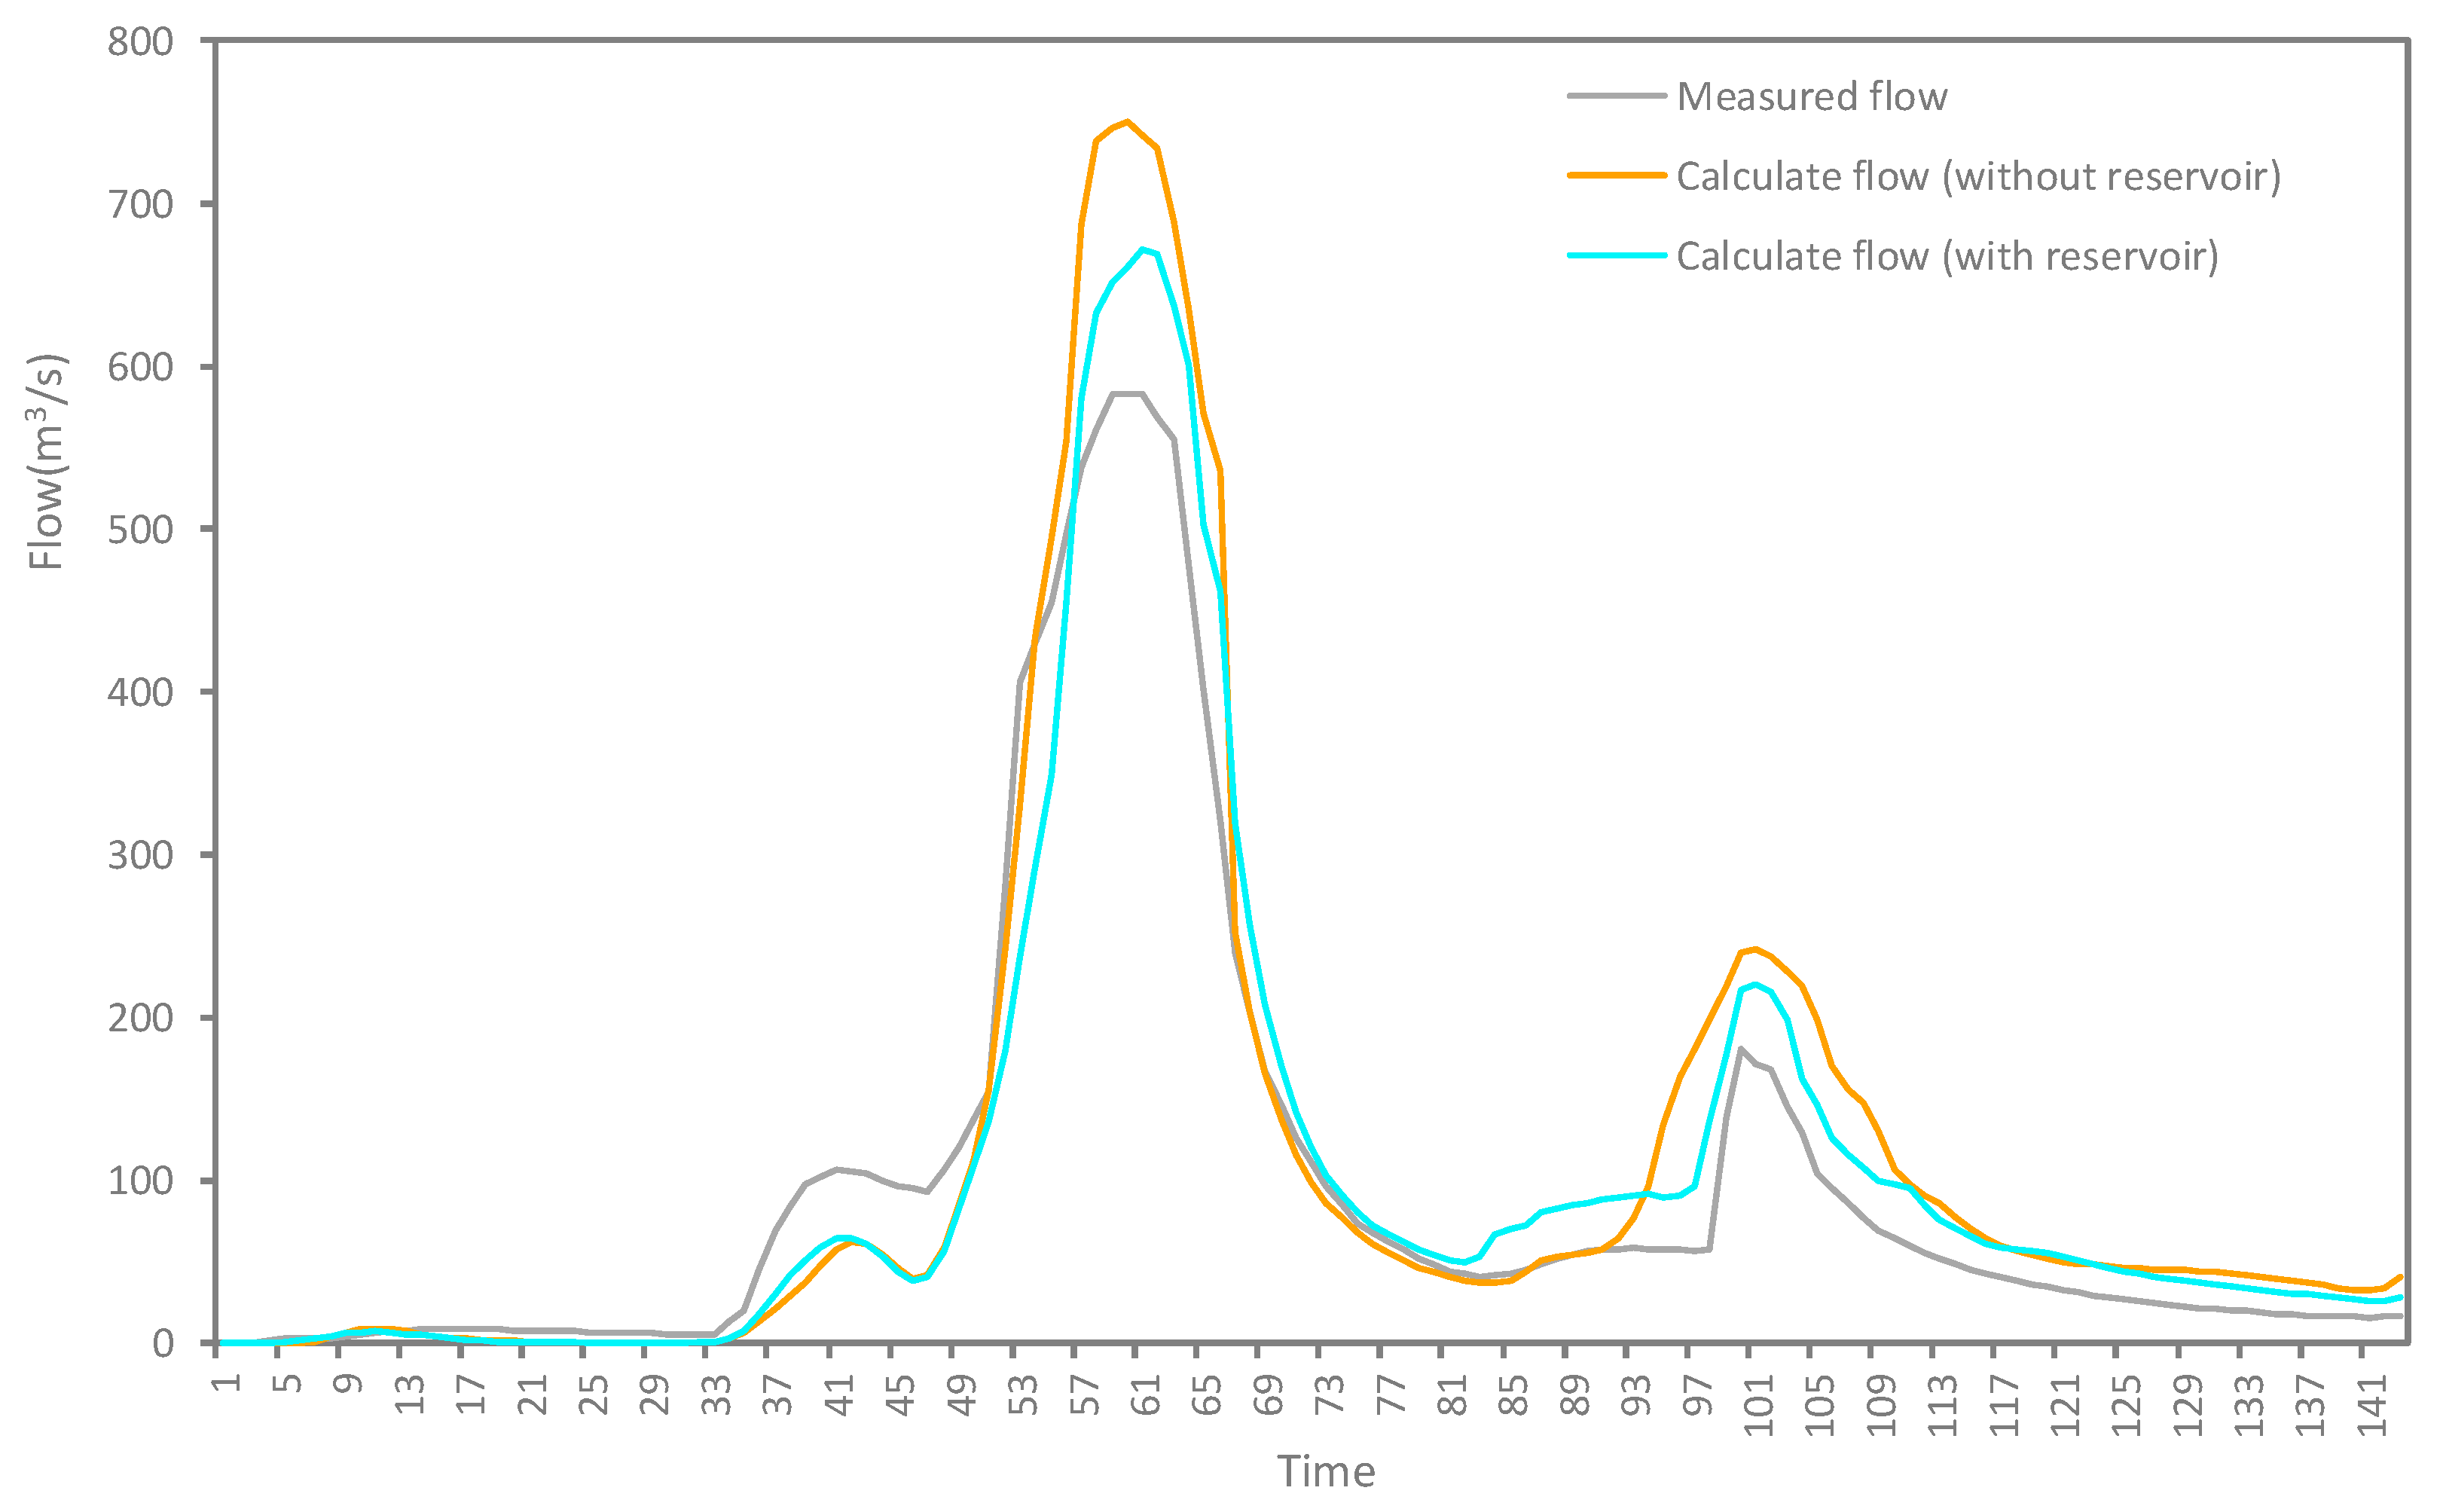
Figure 5 shows the simulation results with and without considering the reservoir impact. If considered, the correlation between the simulated and measured values is 0.82, and if not, the correlation is 0.63. Therefore, when simulating the flood process, if there are reservoirs in the basin, the storage effects of the reservoir should be comprehensively determined according to the actual situation. Similarly, the simulated water rising process and the water withdrawal process are relatively fast, which is consistent with the previous results. CNFF-HM takes into account the spatial characteristics of the climate and underlying surface and can obtain the export process of each small watershed, which can accurately simulate the catchment’s hydrological process. In these two UCs, the CNFF-HM was used to simulate the flash flood process. The parameter of each catchment is shown in Table 4, and their comparison is shown in Figure 6.
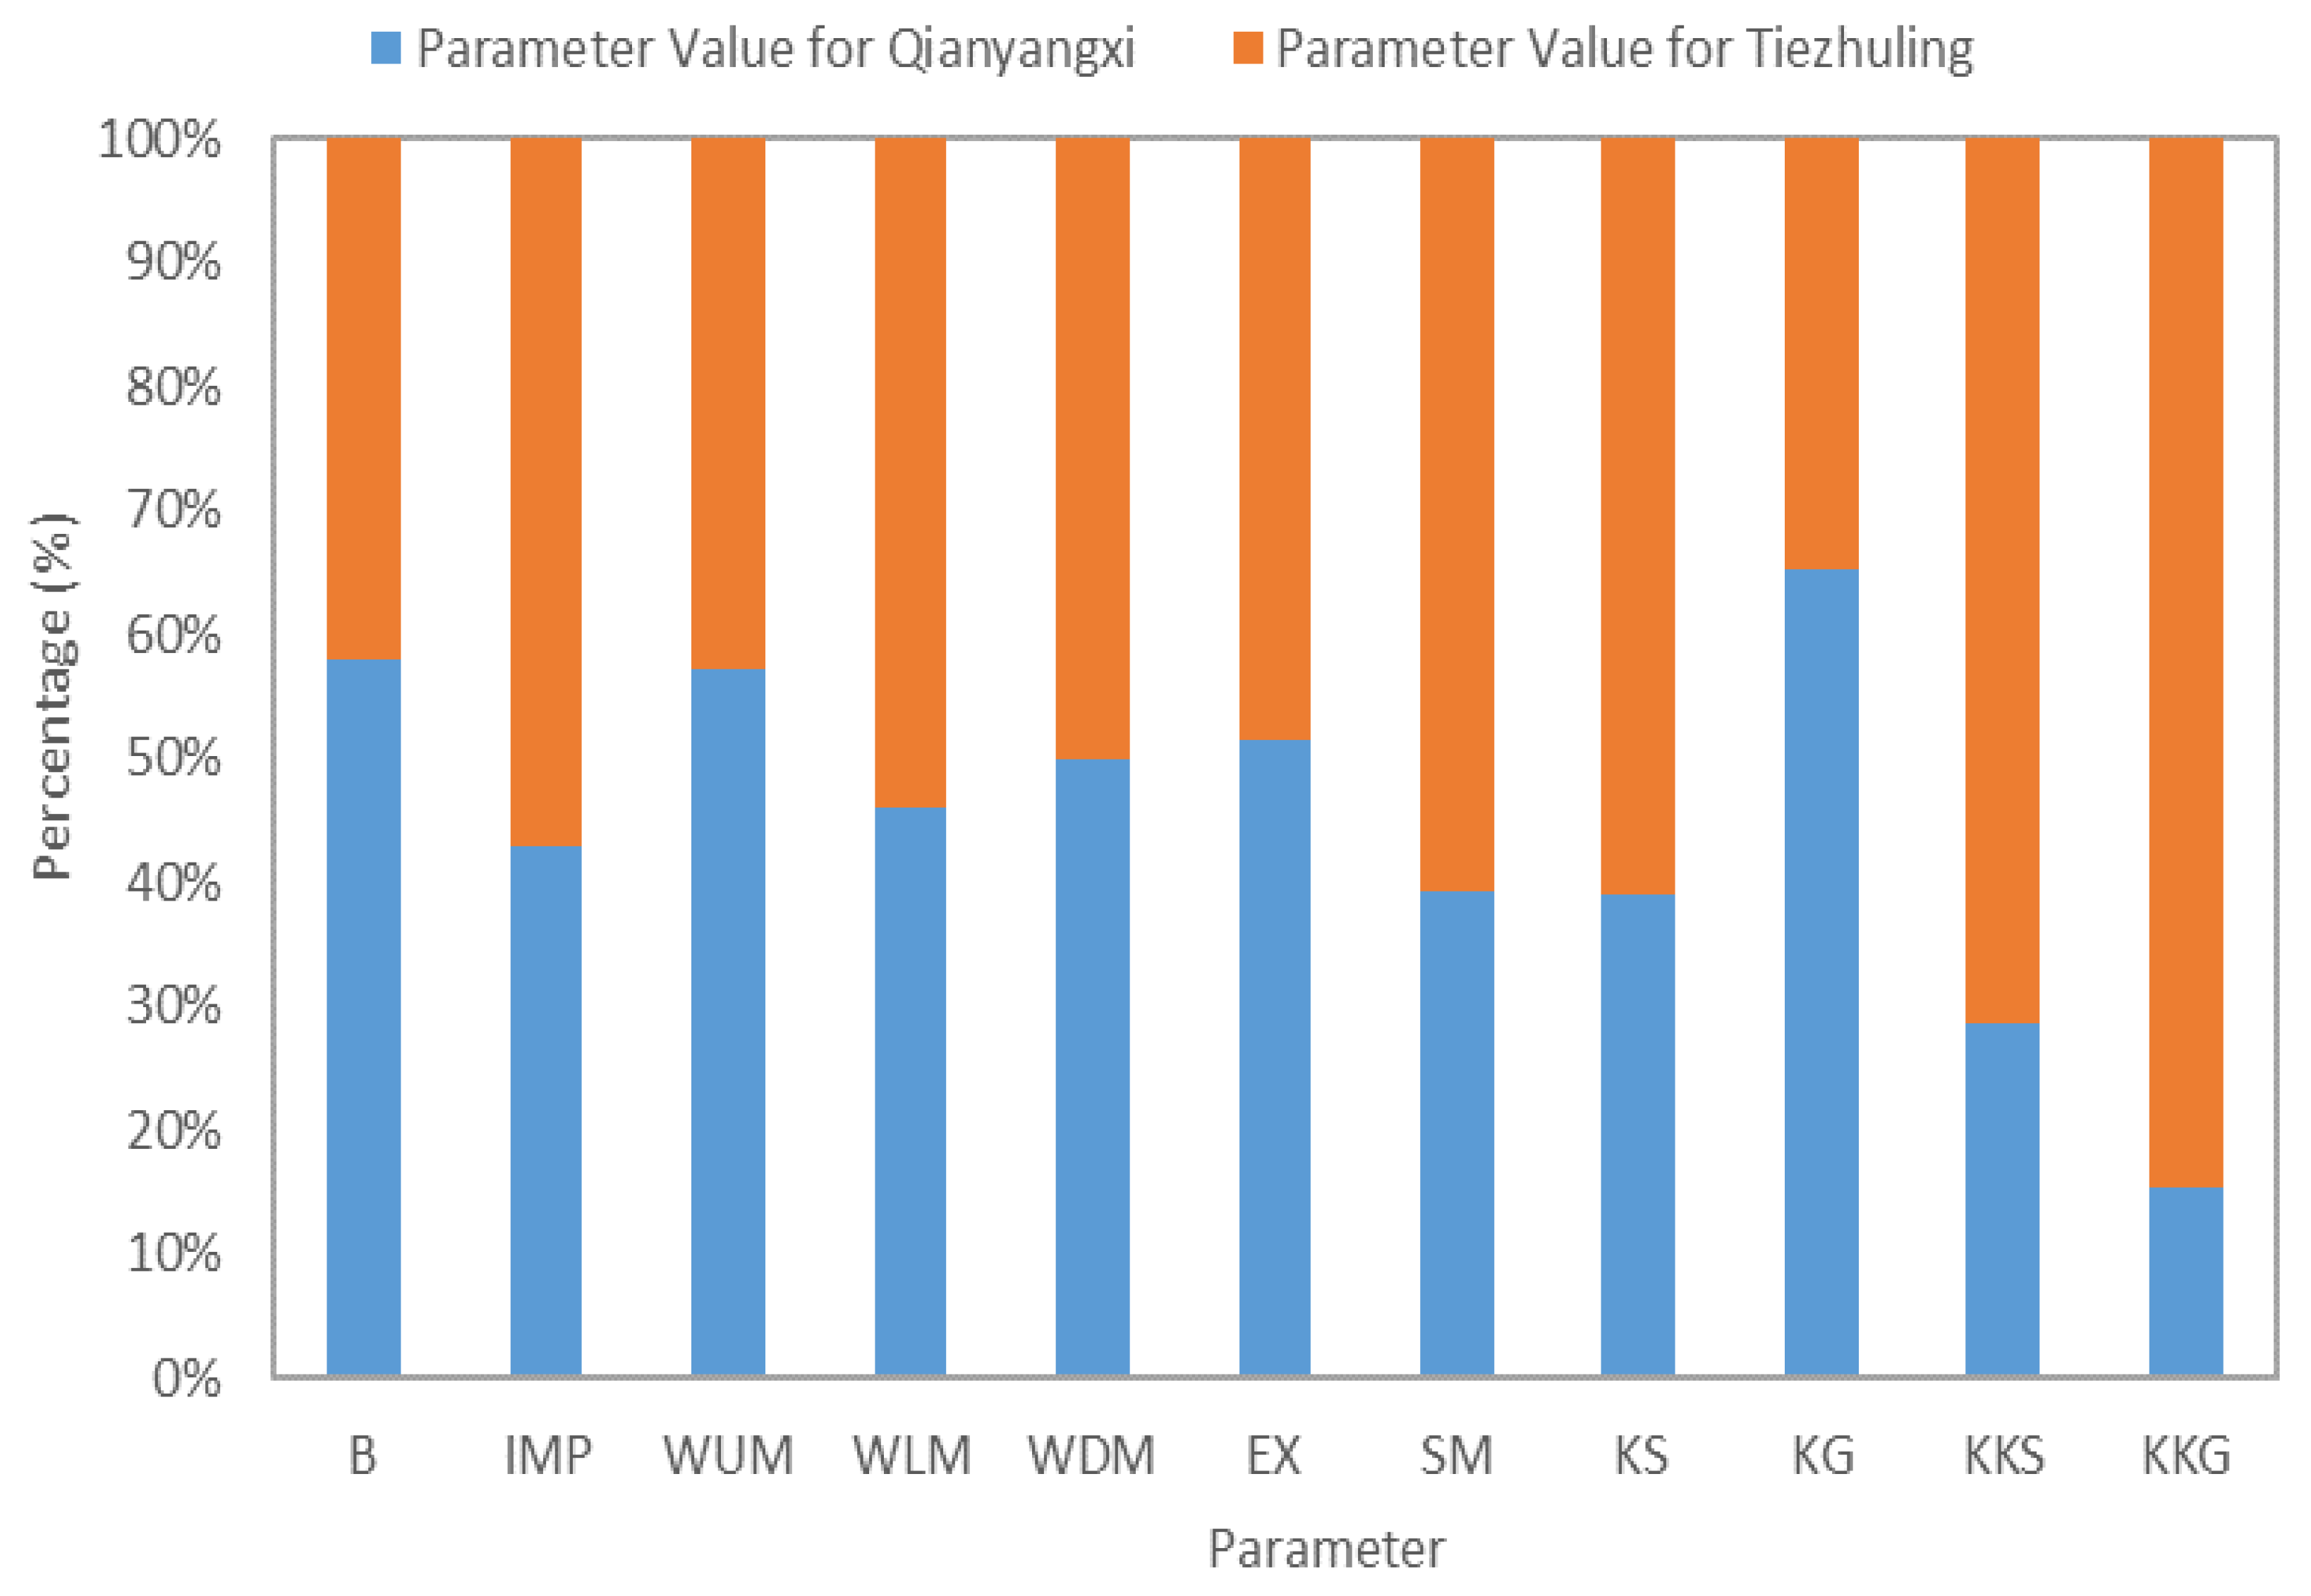
K, WUM, WLM, and C are the parameters for calculating evapotranspiration; K represents the total water balance, and C is the difficulty of evapotranspiration in deep soil. Due to the same meteorological characteristics, the evapotranspiration parameters of the two UCs are the same. WM (WUM, WLM, WDM), B, and IMP are used to calculate the runoff. Overall, the flow capacity of the two watersheds are similar: WM is the highest in the middle, followed by the deep layer, and finally the surface, that is, the soil on the surface of Qianyangxi River is more humid than that of Tiezhuling. SM, EX, KG, and KS are parameters for calculating the water source. SM and KG are sensitive parameters. SM is mainly related to geological conditions, reflecting the shape and height of the flood peaks and determining surface runoff. The SMs of Qianyangxi and Tiezhangling vary with soil composition and forest coverage. KG and KS represent the direct runoff withdrawal durations, which are parallel. Their sum represents the rate at which free water flows out and is constant for a particular watershed. It is mainly used to roughly estimate the value of soil flow and groundwater.
SM has a certain correlation with KG—the larger the SM, the larger is the KG, which mainly reflects hydrological characteristics, such as water storage capacity. Obviously, the two UCs are similar. KKS and KKG are parameters for calculating the convergence, mainly reflecting the regression of groundwater. The corresponding value of Qianyangxi is less than that of Tiezhuling, indicating that the interflow and groundwater of Qianyangxi are richer than Tiezhuling.
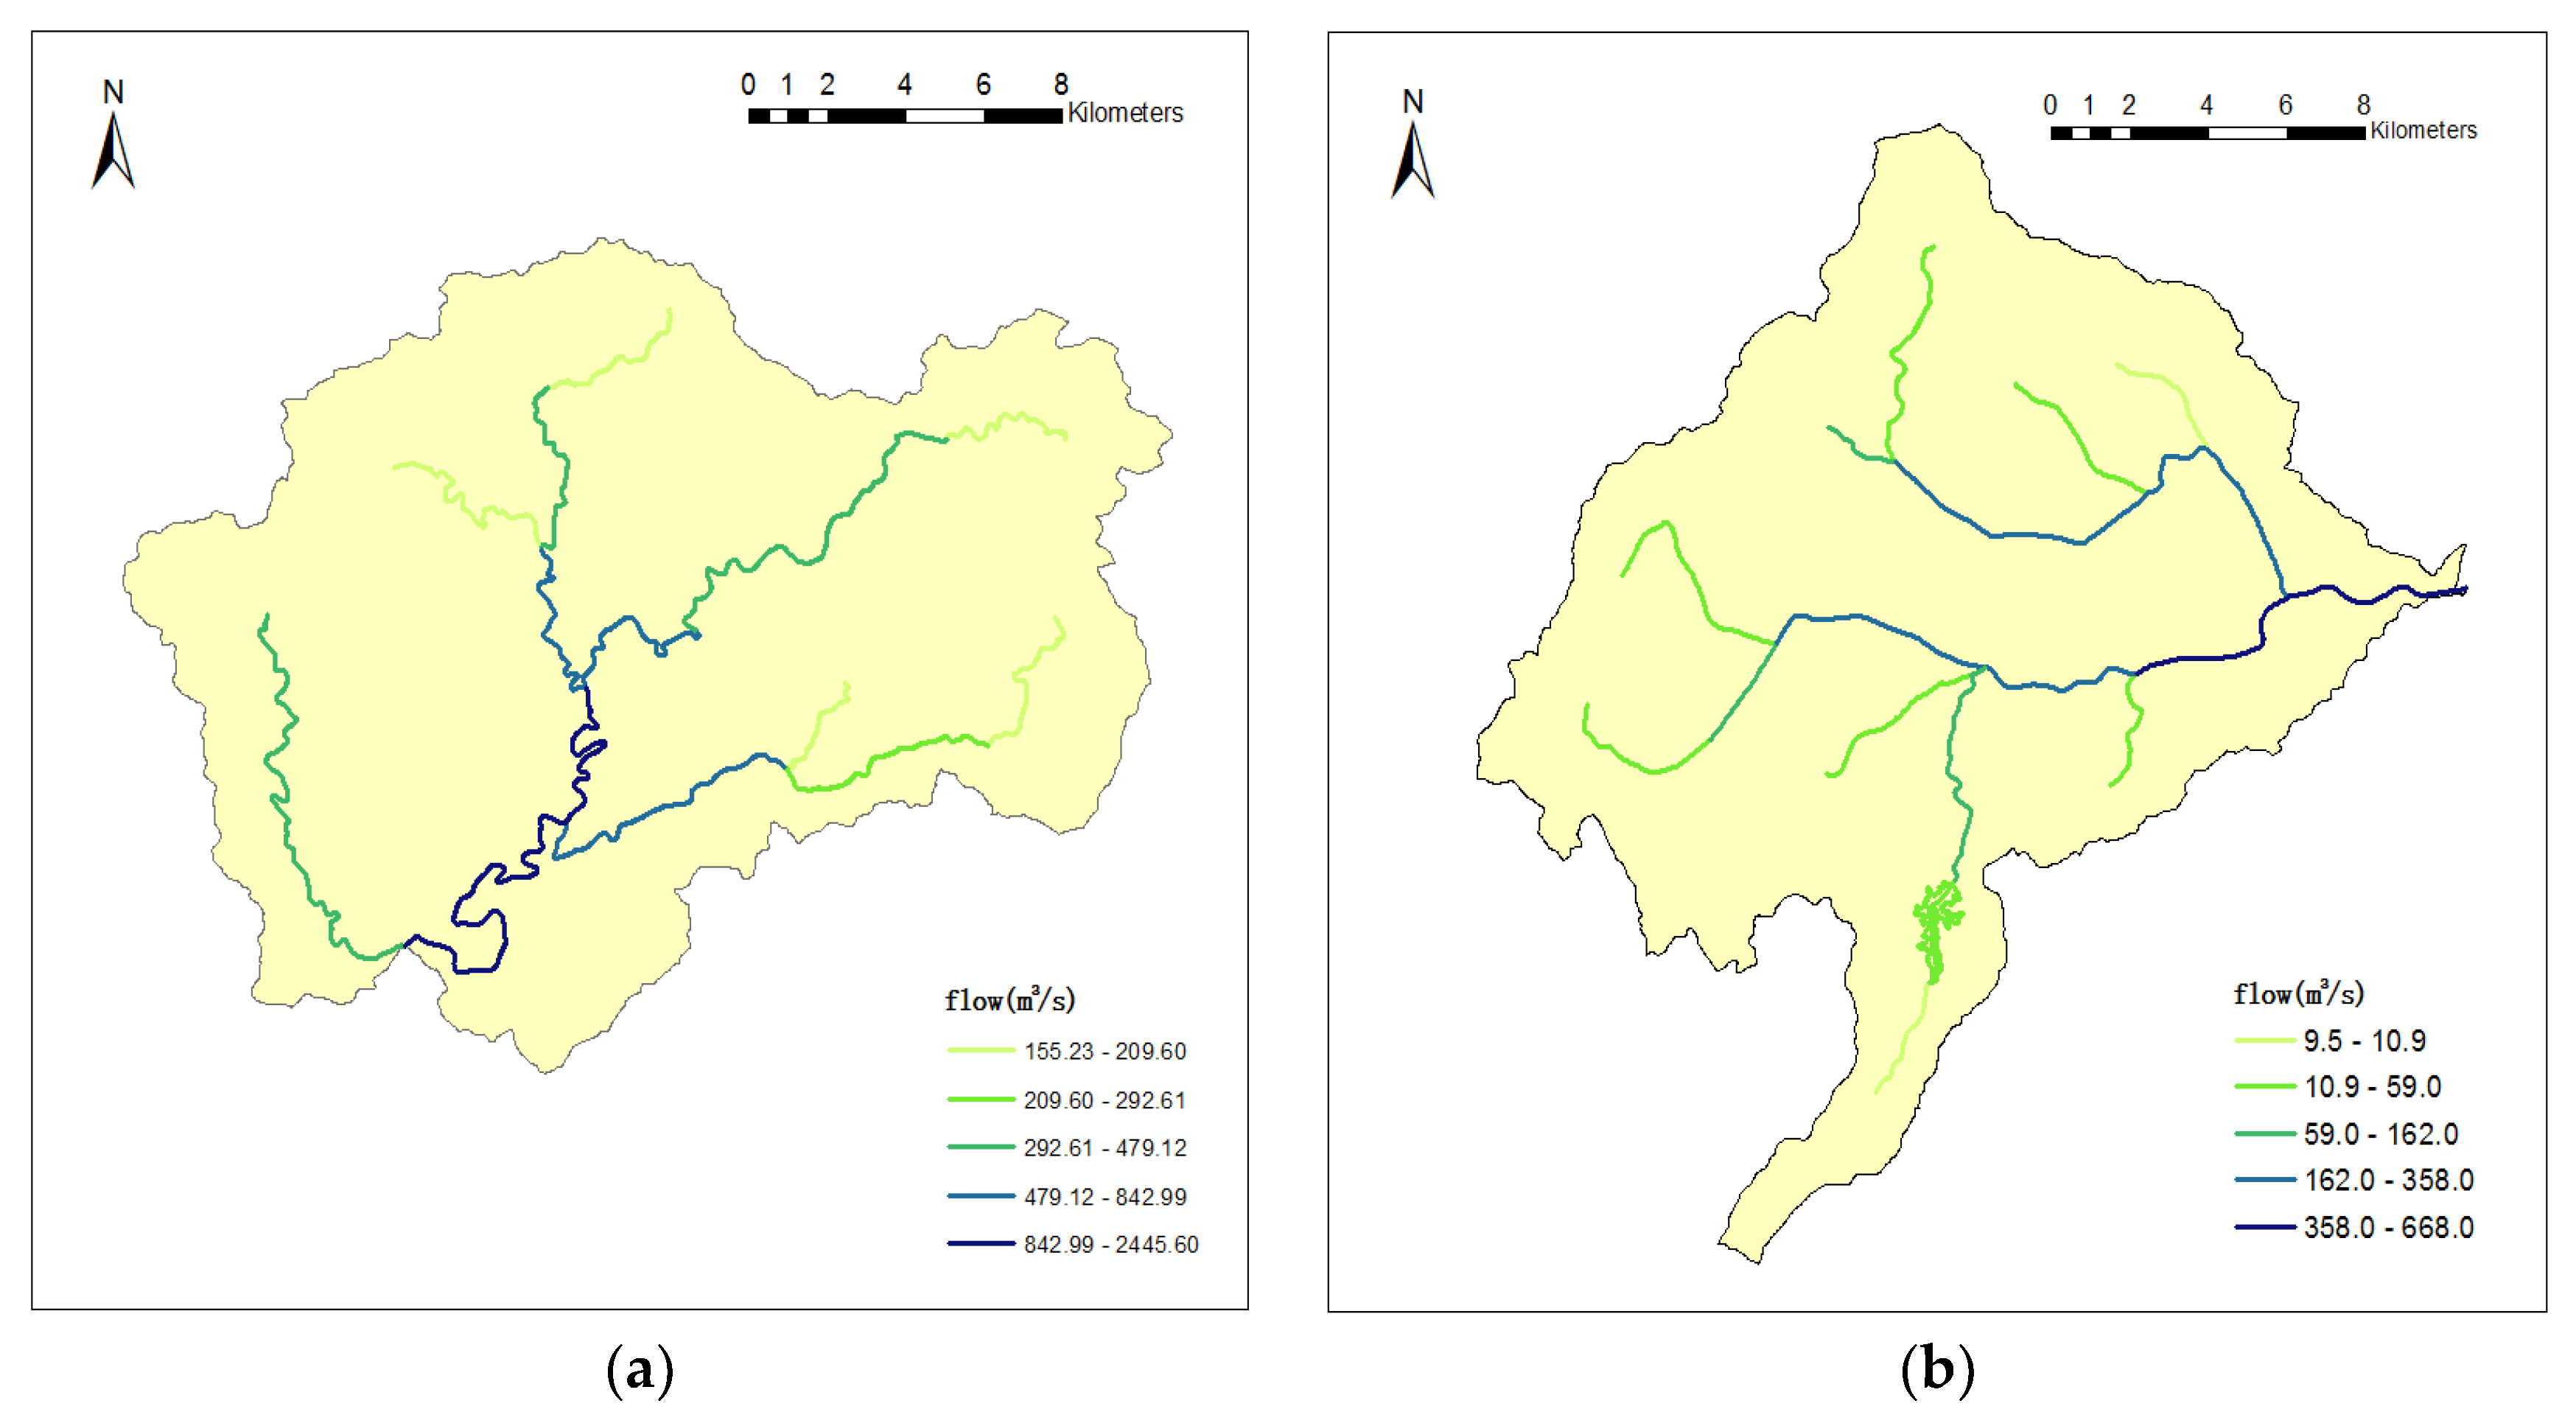
Figure 7 shows the flow distribution of Qianyangxi and Tiezhuling during the simulation. It is almost identical to the actual flood of the survey, and the warning issued also covers all flood areas. Therefore, this model can be applied to flood forecasting in UCs.
4. Conclusions
To realize flash flood early warning in UCs, a dynamic flash flood early warning model was utilized. Main conclusions are as follows:
- (1)
- CNFF-HM is a distributed hydrological model with a physical mechanism. The model takes into account the spatial–temporal characteristics of various factors, covering all hydrological processes, including calculations of surface rainfall, runoff, evapotranspiration, sink, and river evolution.
- (2)
- Using the deterministic coefficient and the relative error of flood peak, runoff depth and peak time as the model accuracy index, we found that CNFF-HM has a good application effect in two UCs. In the Tiezhuling catchment, the model parameters are mainly obtained through parameter migration method, with the peak error of 0.5 h and the deterministic coefficient of 0.9; the corresponding figures for Qianyangxi are 0 h and 0.91, respectively, which contribute to the model’s higher precision parameters and better-predicted results in these two UCs.
- (3)
- Comparing the two watershed characteristic parameters, different soil layers have different WM. The sensitivity parameter SM mainly reflects surface runoff, which varies with soil composition and forest coverage. In addition to the KKS and KKG parameters representing the confluence, the other parameters are similar. Therefore, the two UCs have similarities in evapotranspiration, runoff, and water distribution, and the differences in confluence are significant. The reservoir has a significant impact on flood storage in the Tiezhuling catchment.
Moreover, the coincidence rate of the warning coverage area issued by CNFF-HM and the severe flash flood area is 90%, which has achieved full coverage of the flash flood area.
In conclusion, the CNFF-HM is a distributed hydrological model with the physical mechanism, which can be used for flash flood simulation in UCs. For watersheds with similar properties, the model parameters can be transplanted within a certain range. The watershed characteristics are compared and analyzed by different parameters, which is of great significance for solving the problem of determining hydrological parameters in UCs. However, there are many shortcomings in the current research, first and foremost, the model structure is stored-full runoff, and its core parameters are related to soil characteristics, which have undergone major changes due to human activities. Moreover, the hydrological process is a system involving many complex physical mechanisms, generally with structural errors. Secondly, the basic data required to construct the model (e.g., meteorology, temperature, rainfall, evaporation, infiltration) has the observational errors and scale errors. For example, surface rainfall can only be estimated based on rainfall measured by limited stations, and there is uncertainty in scale conversion. The underlying surface features are generally obtained by remote sensing technology, but the technique is suitable for large-scale research and may not be applicable to small watersheds with strong regional characteristics. Overall, the model and its methods are still not perfect, and the data is also subject to multiple factors. In the future, more data should be tapped to test the model.
Author Contributions
All the authors contributed to the conception and development of this manuscript. P.J. carried out the analysis and wrote the paper. R.L. and M.M. participated in the results analysis and paper correction, developed the CNFF-HM model, and organized the project implementation. Q.L. and Y.W. designed the system framework and developed the project implementation plan. X.Z., S.X., and D.W. provided assistance in performing the calculations and producing the figures.
Funding
This research is funded by the National Key R&D Plan (2017YFC0403606 and 2017YFB0203104); the National Natural Science Foundation of China (Project No. 51579131); Postdoctoral Science Foundation of China (2017M620839); and National Natural Science Foundation of China General Projects (Grant No. 41471430).
Acknowledgments
The authors are grateful to the editors and the anonymous reviewers for their insightful comments and suggestions, which helped to improve the manuscript.
Conflicts of Interest
The authors declare no conflict of interest.
References
- Hall, J.; Arheimer, B.; Borga, M.; Brázdil, R.; Claps, P.; Kiss, A.; Kjeldsen, T.R.; Kriauciuniene, J.; Kundzewicz, Z.W.; Lang, M.; et al. Understanding flood regime changes in Europe: A state-of-the-art assessment. Hydrol. Earth Syst. Sci. 2014, 18, 2735–2772. [Google Scholar] [CrossRef]
- He, B.; Huang, X.; Ma, M.; Chang, Q.; Tu, Y.; Li, Q.; Zhang, K.; Hong, Y. Analysis of flash flood disaster characteristics in China from 2011 to 2015. Nat. Hazards 2017, 90, 1–14. [Google Scholar] [CrossRef]
- Gourley, J.J.; Flamig, Z.L.; Vergara, H.; Kirstetter, P.E.; Clark, R.A., III; Argyle, E.; Arthur, A.; Martinaitis, S.; Terti, G.; Erlingis, J.M.; et al. The Flooded Locations And Simulated Hydrographs (FLASH) project: Improving the tools for flash flood monitoring and prediction across the United States. Bull. Am. Meteorol. Soc. 2016, 98, 361–372. [Google Scholar] [CrossRef]
- Scolobig, A.; Marchi, B.D.; Borga, M. The missing link between flood risk awareness and preparedness: Findings from case studies in an Alpine Region. Nat. Hazards 2012, 63, 499–520. [Google Scholar] [CrossRef]
- Groisman, P.Y.; Karl, T.R.; Easterling, D.R.; Knight, R.W.; Jamason, P.F.; Hennessy, K.J.; Suppiah, R.; Page, C.M.; Wibig, J.; Fortuniak, K.; et al. Changes in the Probability of Heavy Precipitation: Important Indicators of Climatic Change. Clim. Chang. 1999, 42, 243–283. [Google Scholar] [CrossRef]
- Groisman, P.Y.; Karl, T.R.; Knight, R.W.; Stenchikov, G.L. Changes of Snow Cover, Temperature, and Radiative Heat Balance over the Northern Hemisphere. J. Clim. 1994, 7, 1633–1656. [Google Scholar] [CrossRef] [Green Version]
- Refsgaard, J.C.; Knudsen, J. Operational Validation and Intel-comparison of Different Types of Hydrologic Models. Water Resour. Res. 1996, 32, 2189–2202. [Google Scholar] [CrossRef]
- El-Nasr, A.A.; Arnold, J.G.; Feyen, J.; Berlamont, J. Modelling the hydrology of a catchment using a distributed and a semi-distributed model. Hydrol. Processes 2005, 19, 573–587. [Google Scholar] [CrossRef]
- Reed, S.; Schaake, J.; Zhang, Z. A distributed hydrologic model and threshold frequency-based method for flash flood forecasting at ungauged locations. J. Hydrol. 2007, 337, 402–420. [Google Scholar] [CrossRef]
- Wałęga, A.; Cupak AAmatya, D.M.; Drożdżal, E. Comparison of direct outflow calculated by modified SCS-CN methods for mountainous and highland catchments in upper Vistula Basin, Poland and lowland catchment in South Carolina, U.S.A. Acta Scientiarum Polonorum Seria Formatia Circumiectus 2017, 16, 187–207. [Google Scholar]
- Zoccatelli, D.; Borga, M.; Viglione, A.; Chirico, G.B.; Schl, G.B. Spatial moments of catchment rainfall: Rainfall spatial organisation, Catchment morphology, and flood response. Hydrol. Earth Syst. Sci. Discuss. 2011, 8, 5811–5847. [Google Scholar] [CrossRef]
- Anquetin, G.; Horgan, G.; Rawe, S.; Murray, D.; Madden, A.; Macmathuna, P.; Doran, P.; Murphy, P.V. Synthesis of novel macrolactam and macroketone analogues of migrastatin from d-glucal and comparison with macrolactone and acyclic analogues: A dorrigocin a congener is a potent inhibitor of gastric cancer cell migration. Eur. J. Organ. Chem. 2008, 2008, 1953–1958. [Google Scholar] [CrossRef]
- Barthold, F.E.; Workoff, T.E.; Cosgrove, B.A.; Gourley, J.J.; Novak, D.R.; Mahoney, K.M. Improving Flash Flood Forecasts: The HMT-WPC Flash Flood and Intense Rainfall Experiment. Bull. Am. Meteorol. Soc. 2015, 96, 1859–1866. [Google Scholar] [CrossRef]
- Douinot, A.; Roux, H.; Garambois, P.A.; Larnier, K.; Labat, D.; Dartus, D. Accounting for rainfall systematic spatial variability in flash flood forecasting. J. Hydrol. 2016, 541, 359–370. [Google Scholar] [CrossRef] [Green Version]
- Sivapalan, M.; Takeuchi, K.; Franks, S.W.; Gupta, V.K.; Karambiri, H.; Lakshmi, V.; Liang, X.; McDonnell, J.J.; Mendiondo, E.M.; O’connell, P.E.; et al. Iahs decade on predictions in ungauged Catchments (pub), 2003-2012: Shaping an exciting future for the hydrological sciences. Int. Assoc. Sci. Hydrol. Bull. 2003, 48, 857–880. [Google Scholar] [CrossRef]
- Wagner, W.; Scipal, K.; Pathe, C.; Gerten, D.; Lucht, W.; Rudolf, B. Evaluation of the agreement between the first global remotely sensed soil moisture data with model and precipitation data. J. Geophys. Res. 2003, 108. [Google Scholar] [CrossRef] [Green Version]
- Beven, K.J. Rainfall-Runoff Modeling: The Primer; John Wiley & Sons: Chichester, UK, 2012; pp. 84–96. [Google Scholar]
- Beven, K. Runoff Production and Flood Frequency in Catchments of Order n: An Alternative Approach. In Scale Problems in Hydrology; Springer: Dordrecht, the Netherlands, 1986; pp. 107–131. [Google Scholar]
- Kuriqi, A.; Ardiclioglu, M.; Muceku, Y. Investigation of seepage effect on river dike’s stability under steady state and transient conditions. Pollack Periodica 2016, 11, 87–104. [Google Scholar] [CrossRef]
- Moriasi, D.N.; Arnold, J.G.; Van Liew, M.W.; Binger, R.L.; Harmel, R.D.; Veith, T. Model evaluation guidelines for systematic quantification of accuracy in watershed simulations. Trans. ASABE 2007, 50, 885–900. [Google Scholar] [CrossRef]
- Gironas, J. Morphologic Characterization of Urban Watersheds and Its Use in Quantifying Hydrologic Response; Dissertations & Theses-Gradworks; Colorado State University: Fort Collins, CO, USA, 2009. [Google Scholar]
- Khaleghi, M.R.; Gholami, V.; Ghodusi, J.; Hosseini, H. Efficiency of the geomorphologic instantaneous unit hydrograph method in flood hydrograph simulation. Catena 2011, 87, 163–171. [Google Scholar] [CrossRef]
- Kavetski, D.; Kuczera, G.; Franks, S.W. Bayesian Analysis of Input Uncertainty in Hydrological Modeling: 2. Application. Water Resour. Res. 2006, 42, W03407. [Google Scholar] [CrossRef]
- Selenica, A.; Kuriqi, A.; Ardicioglu, M. Risk assessment from flooding in the rivers of Albania. In Proceedings of the International Balkans Conference on Challenges of Civil Engineering, Tirana, Albania, 23–25 May 2013. [Google Scholar]
- Chen, M.; Pang, J.; Wu, P. Flood Routing Model with Particle Filter-Based Data Assimilation for Flash Flood Forecasting in the Micro-Model of Lower Yellow River, China. Water 2018, 10, 1612. [Google Scholar] [CrossRef]
- Liu, R.; Guo, L.; Wang, Y.; Zhang, X.; Liu, Q.; Shang, Y.; Zhai, X.; Tian, J.; Huang, X. A Parallel Flood Forecasting and Warning Platform Based on HPC Clusters. EPiC Ser. Eng. 2018, 3, 1232–1239. [Google Scholar]
- Standardization Administration of the People’s Republic of China. GB/T 22484-2008, Standard for Hydrological Information and Hydrological Forecasting; Standards Press of China: Beijing, China, 2009. (In Chinese) [Google Scholar]
- Wang, Y.; Liu, R.; Guo, L.; Tian, J.; Zhang, X.; Ding, L.; Wang, C.; Shang, Y. Forecasting and Providing Warnings of Flash Floods for Ungauged Mountainous Areas Based on a Distributed Hydrological Model. Water 2017, 9, 776. [Google Scholar] [CrossRef]
Figure 1.
(A) Location of study area. (B,C) Hydrological station including rainfall stations and watershed of Tiezhuling and Qianyangxi, respectively.
Figure 1.
(A) Location of study area. (B,C) Hydrological station including rainfall stations and watershed of Tiezhuling and Qianyangxi, respectively.

Figure 2.
Flowchart of the China flash flood hydrological model (CNFF-HM).

Figure 3.
Simulating the flow process in the Qianyangxi watershed (from 12:00 on 27 September 2017 to 12:00 on 29 September 2017).
Figure 3.
Simulating the flow process in the Qianyangxi watershed (from 12:00 on 27 September 2017 to 12:00 on 29 September 2017).

Figure 4.
Diagram of simulated and measured flood in the Tiezhuling watershed (from 12:00 on 11 August 2017 to 06:00 on 14 August 2017).
Figure 4.
Diagram of simulated and measured flood in the Tiezhuling watershed (from 12:00 on 11 August 2017 to 06:00 on 14 August 2017).

Figure 5.
The flow process in the Tiezhuling watershed (from 12:00 on 11 August 2017 to 00:00 on 15 August 2017).
Figure 5.
The flow process in the Tiezhuling watershed (from 12:00 on 11 August 2017 to 00:00 on 15 August 2017).

Figure 6.
Percentage stacked histogram of each parameter.

Figure 7.
Schematic diagram of the flow distribution of Qianyangxi (a) and Tiezhuling (b) at simulation time.
Figure 7.
Schematic diagram of the flow distribution of Qianyangxi (a) and Tiezhuling (b) at simulation time.


Table 1.
The basic information of typical small watersheds.
| Catchment | Province | County | Area (km2) | Length (km) | Discharge Process (km) | Discharge Time (h) | Slope (‰) | Average Annual Rainfall (mm) | Average Annual Flow (mm) |
|---|---|---|---|---|---|---|---|---|---|
| Tiezhuling | Hubei | Tongcheng | 250.5 | 28.1 | 26 | 19 | 1.5 | 1497.7 | 791.2 |
| Qianyangxi | Fujian | Zherong | 198 | 22 | 52 | 35 | 7.5 | 1680 | 1230 |
Table 2.
Simulation results in the Qianyangxi watershed.
| Order Number | Start and Stop Time | Rainfall (mm) | Net Rainfall (mm) | (%) | T (h) | DC |
|---|---|---|---|---|---|---|
| 170815 | From 12:00 on 27 September 2017 to 12:00 on 29 September 2017 | 467 | 448.8 | 0.41 | 0 | 0.91 |
Table 3.
Simulation results of the Tiezhuling hydrological station.
| Order Number | Start and Stop Time | Rainfall (mm) | Net Rainfall (mm) | Measured Water Level Depth (mm) | (%) | (%) | ∇T (h) | DC |
|---|---|---|---|---|---|---|---|---|
| 170815 | From 12:00 on 11 August 2017 to 06:00 on 14 August 2017 | 292.7 | 123.8 | 106.2 | 13.7 | 11.3 | 0.5 | 0.93 |
Table 4.
Hydrological parameters used in the CNFF-HM.
| Parameter | Parameter Meaning | Parameter Value | |
|---|---|---|---|
| Qianyangxi | Tiezhuling | ||
| B | Exponent parameter | 0.275 | 0.2 |
| IMP | Percentage of impervious areas in the catchment (%) | 0.0075 | 0.01 |
| WUM | Average soil moisture storage capacity of the upper layer (mm) | 20 | 15 |
| WLM | Average soil moisture storage capacity of the middle layer (mm) | 60 | 70 |
| WDM | Average soil moisture storage capacity of the deep layer (mm) | 40 | 40 |
| EX | The exponent of the free water capacity curve | 1.275 | 1.2 |
| SM | Storage of surface free water (mm) | 32.5 | 50 |
| KS | Outflow coefficients of surface free water to interflow relationship | 0.45 | 0.7 |
| KG | Outflow coefficients of surface free water to groundwater relationship | 0.375 | 0.2 |
| KKS | Recession constants of the interflow storage | 0.2 | 0.5 |
| KKG | Recession constants of the groundwater storage | 0.1 | 0.55 |
© 2019 by the authors. Licensee MDPI, Basel, Switzerland. This article is an open access article distributed under the terms and conditions of the Creative Commons Attribution (CC BY) license (http://creativecommons.org/licenses/by/4.0/).
Share and Cite
MDPI and ACS Style
Jia, P.; Liu, R.; Ma, M.; Liu, Q.; Wang, Y.; Zhai, X.; Xu, S.; Wang, D. Flash Flood Simulation for Ungauged Catchments Based on the Distributed Hydrological Model. Water 2019, 11, 76. https://doi.org/10.3390/w11010076
AMA Style
Jia P, Liu R, Ma M, Liu Q, Wang Y, Zhai X, Xu S, Wang D. Flash Flood Simulation for Ungauged Catchments Based on the Distributed Hydrological Model. Water. 2019; 11(1):76. https://doi.org/10.3390/w11010076
Chicago/Turabian StyleJia, Pengfei, Ronghua Liu, Meihong Ma, Qi Liu, Yali Wang, Xiaoyan Zhai, Shuaishuai Xu, and Dacheng Wang. 2019. "Flash Flood Simulation for Ungauged Catchments Based on the Distributed Hydrological Model" Water 11, no. 1: 76. https://doi.org/10.3390/w11010076
Note that from the first issue of 2016, this journal uses article numbers instead of page numbers. See further details here.