Plankton Taxonomic and Size Diversity of Mediterranean Brackish Ponds in Spring: Influence of Abiotic and Biotic Factors

 , , , and
Abstract
:
1. Introduction
2. Materials and Methods
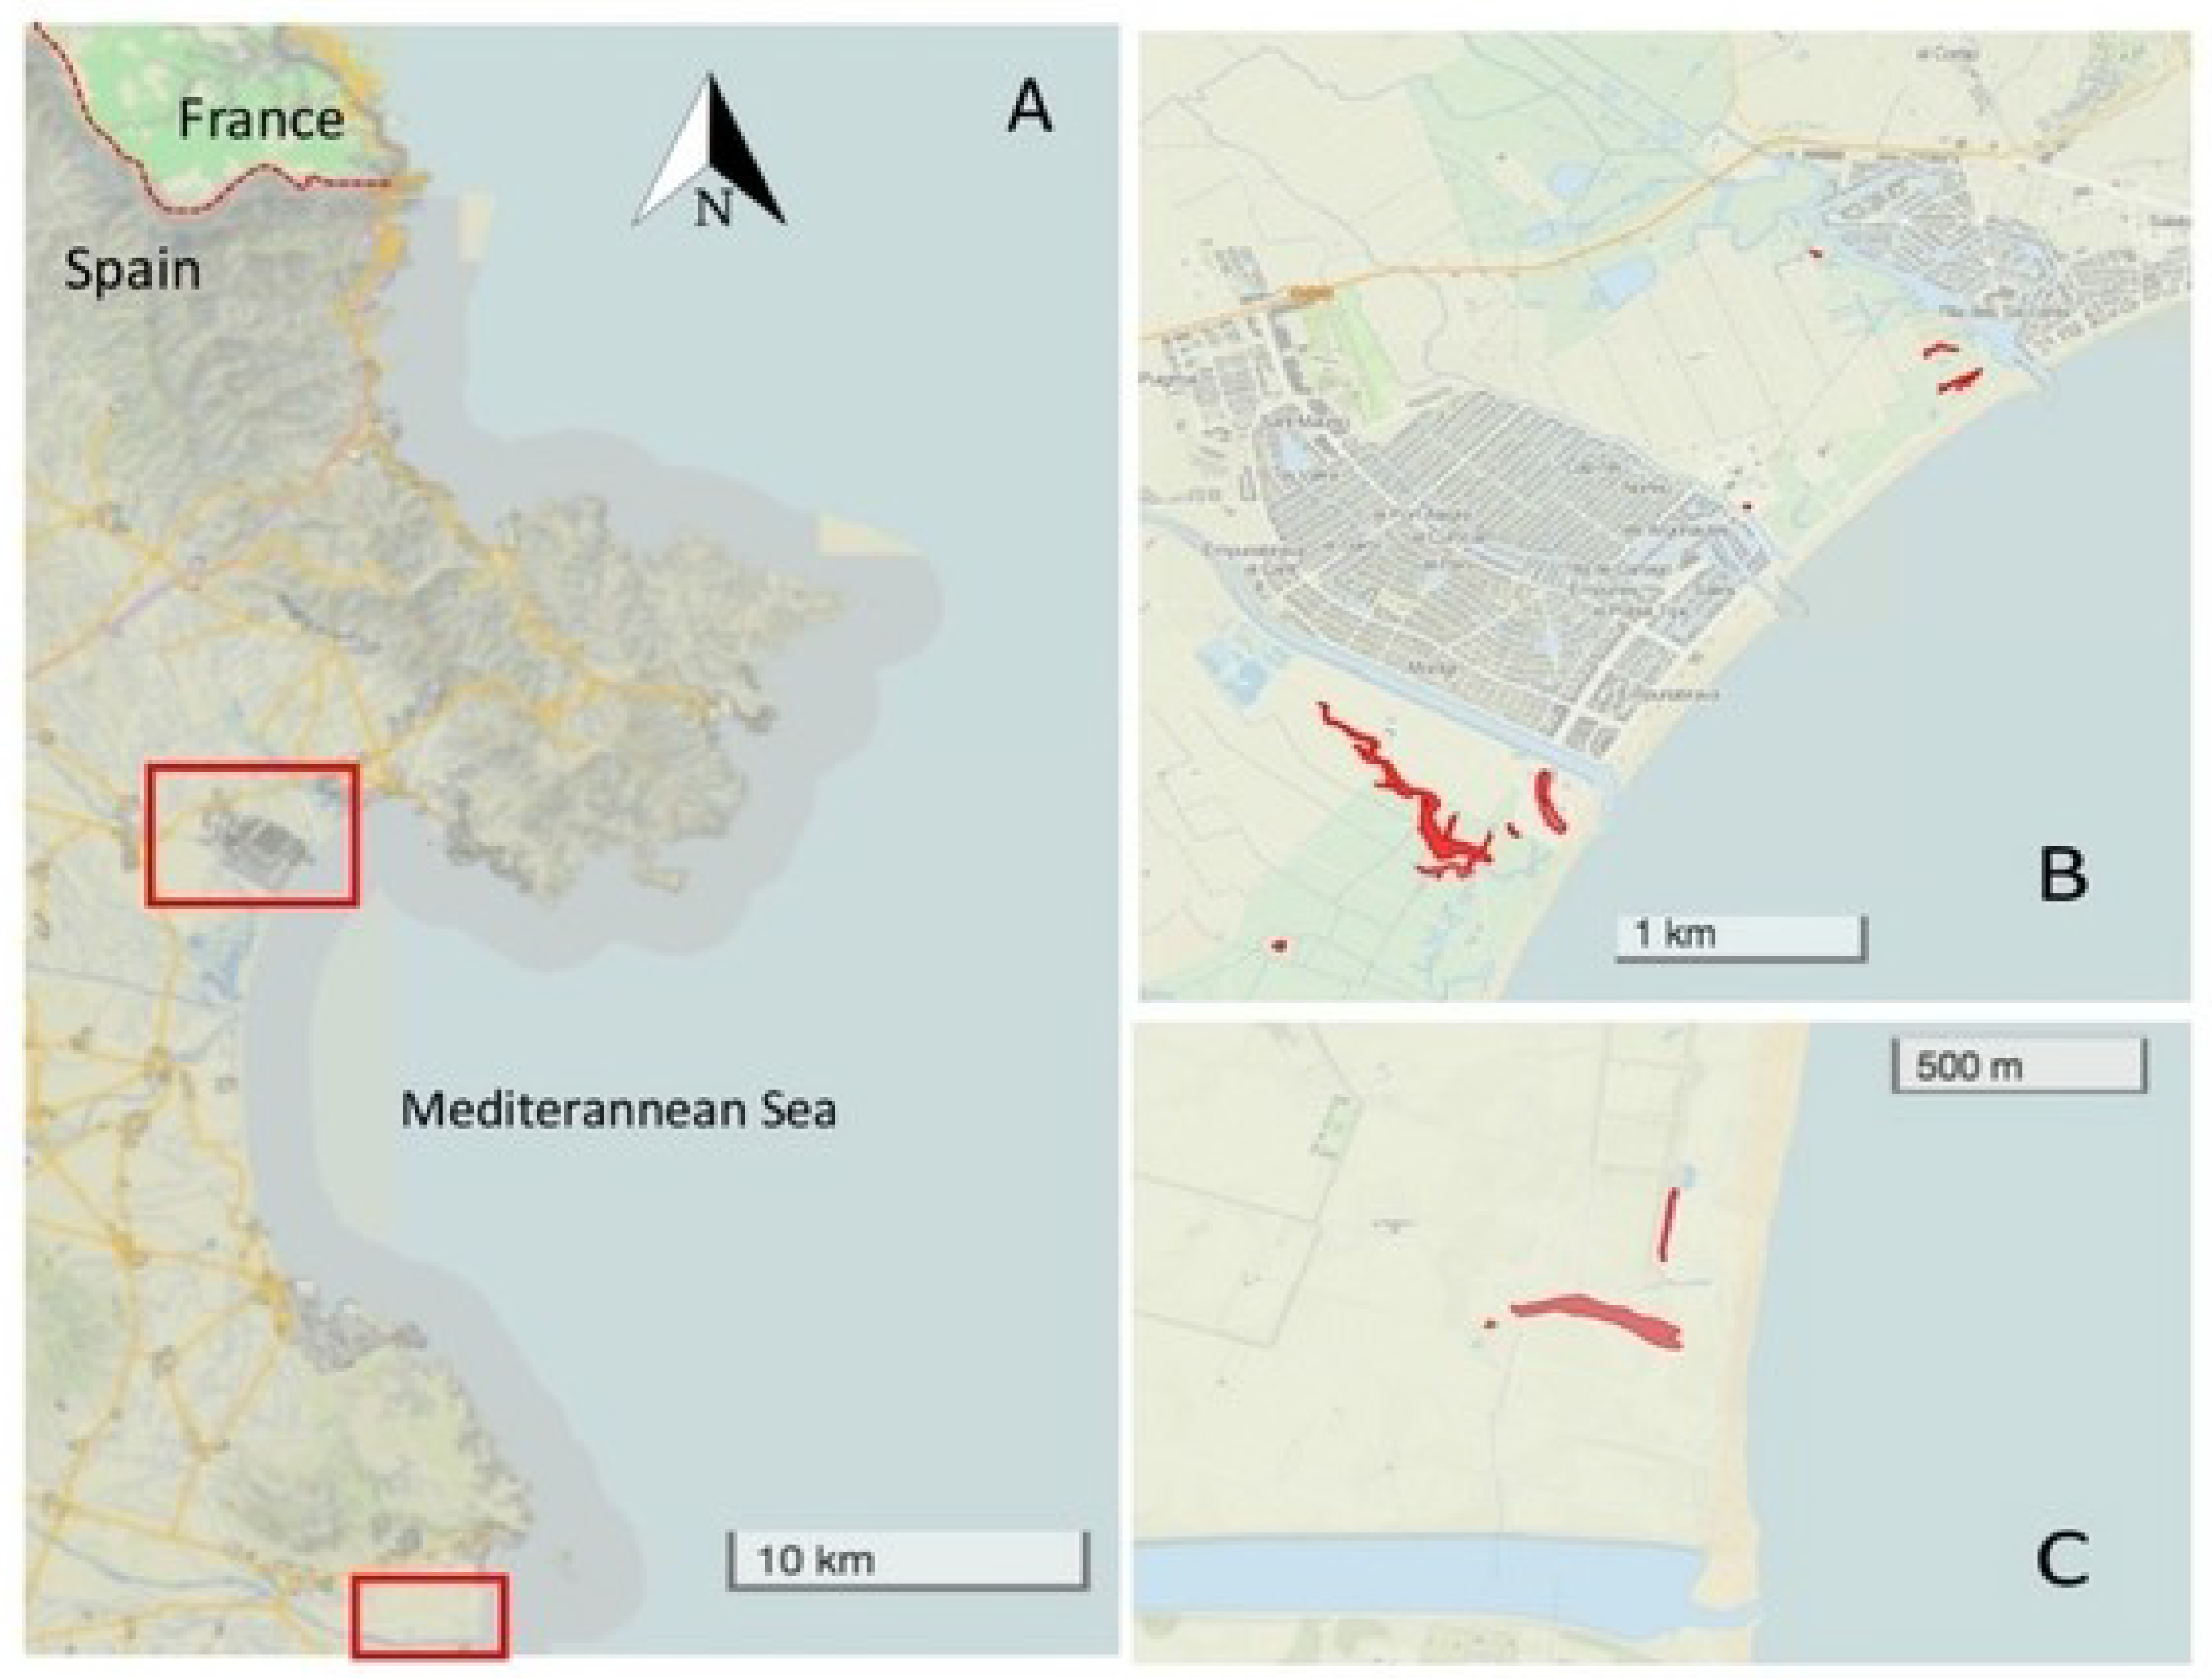
2.1. Study Area
2.2. Sampling and Analysis
Fish Sampling
2.3. Calculation of Diversity Metrics
2.4. Data Analysis
3. Results
4. Discussion
Supplementary Materials
Author Contributions
Funding
Acknowledgments
Conflicts of Interest
References
- Céréghino, R.; Boix, D.; Cauchie, H.M.; Martens, K.; Oertli, B. The ecological role of ponds in a changing world. Hydrobiologia 2014, 723, 1–6. [Google Scholar] [CrossRef]
- Oertli, B.; Biggs, J.; Céréghino, R.; Grillas, P.; Joly, P.; Lachavanne, J.B. Conservation and monitoring of pond biodiversity1: Introduction. Aquat. Conserv. Mar. Freshw. Ecosyst. 2005, 15, 535–540. [Google Scholar] [CrossRef]
- Céréghino, R.; Biggs, J.; Oertli, B.; Declerck, S. The ecology of European ponds: Defining the characteristics of a neglected freshwater habitat. Hydrobiologia 2008, 597, 1–6. [Google Scholar] [CrossRef]
- Biggs, J.; von Fumetti, S.; Kelly-Quinn, M. The importance of small waterbodies for biodiversity and ecosystem services: Implications for policy makers. Hydrobiologia 2017, 793, 3–39. [Google Scholar] [CrossRef]
- Boix, D.; Biggs, J.; Céréghino, R.; Hull, A.P.; Kalettka, T.; Oertli, B. Pond research and management in Europe: “Small is Beautiful”. Hydrobiologia 2012, 689, 1–9. [Google Scholar] [CrossRef] [Green Version]
- Boix, D.; Gascón, S.; Sala, J.; Badosa, A.; Brucet, S.; López-Flores, R.; Martinoy, M.; Gifre, J.; Quintana, X.D. Patterns of composition and species richness of crustaceans and aquatic insects along environmental gradients in Mediterranean water bodies. Hydrobiologia 2008, 597, 53–69. [Google Scholar] [CrossRef]
- Ruhí, A.; Boix, D.; Sala, J.; Gascón, S.; Quintana, X.D. Spatial and temporal patterns of pioneer macrofauna in recently created ponds: Taxonomic and functional approaches. Hydrobiologia 2009, 634, 137–151. [Google Scholar] [CrossRef]
- Brucet, S.; Boix, D.; Nathansen, L.W.; Quintana, X.D.; Jensen, E.; Balayla, D.; Meerhoff, M.; Jeppesen, E. Effects of temperature, salinity and fish in structuring the macroinvertebrate community in shallow lakes: Implications for effects of climate change. PLoS ONE 2012, 7. [Google Scholar] [CrossRef]
- Anton-Pardo, M.; Armengol, X. Effects of salinity and water temporality on zooplankton community in coastal Mediterranean ponds. Estuar. Coast. Shelf Sci. 2012, 114, 93–99. [Google Scholar] [CrossRef]
- Gascón, S.; Boix, D.; Sala, J.; Quintana, X.D. Variability of benthic assemblages in relation to the hydrological pattern in Mediterranean salt marshes (Empordà wetlands, NE Iberian Peninsula). Arch. Hydrobiol. 2005, 163, 163–181. [Google Scholar] [CrossRef]
- Brucet, S.; Boix, D.; López-Flores, R.; Badosa, A.; Moreno-Amich, R.; Quintana, X.D. Zooplankton structure and dynamics in permanent and temporary Mediterranean salt marshes: Taxon-based and size-based approaches. Arch. Hydrobiol. 2005, 162, 535–555. [Google Scholar] [CrossRef]
- Badosa, A.; Boix, D.; Brucet, S.; López-Flores, R.; Quintana, X.D. Nutrients and zooplankton composition and dynamics in relation to the hydrological pattern in a confined Mediterranean salt marsh (NE Iberian Peninsula). Estuar. Coast. Shelf Sci. 2006, 66, 513–522. [Google Scholar] [CrossRef]
- Àvila, N.; López-Flores, R.; Quintana, X.D. Composition of pelagic microbial communities in Mediterranean coastal aquatic ecosystems under extreme drought conditions. Estuar. Coast. Shelf Sci. 2018, 1–9. [Google Scholar] [CrossRef]
- Gascón, S.; MacHado, M.; Sala, J.; Cancela Da Fonseca, L.; Cristo, M.; Boix, D. Spatial characteristics and species niche attributes modulate the response by aquatic passive dispersers to habitat degradation. Mar. Freshw. Res. 2012, 63, 232–245. [Google Scholar] [CrossRef]
- Brose, U.; Jonsson, T.; Berlow, E.L.; Warren, P.; Banasek-Richter, C.; Bersier, L.F.; Blanchard, J.L.; Brey, T.; Carpenter, S.R.; Blandenier, M.-F.C.; et al. Consumer–resource body-size relationships in natural food webs. Ecology 2006, 87, 2411–2417. [Google Scholar] [CrossRef]
- Brucet, S.; Tavşanoğlu, Ü.N.; Özen, A.; Levi, E.E.; Bezirci, G.; Çakıroğlu, A.İ.; Jeppesen, E.; Svenning, J.C.; Ersoy, Z.; Beklioğlu, M. Size-based interactions across trophic levels in food webs of shallow Mediterranean lakes. Freshw. Biol. 2017, 62, 1819–1830. [Google Scholar] [CrossRef]
- Emmerson, M.C.; Raffaelli, D. Predator-prey body size, interaction strength and the stability of a real food web. J. Anim. Ecol. 2004, 73, 399–409. [Google Scholar] [CrossRef] [Green Version]
- Brown, J.H.; Gillooly, J.F.; Allen, A.P.; Savage, V.M.; West, G.B. Toward a metabolic theory of ecology. Ecology 2004, 85, 1771–1789. [Google Scholar] [CrossRef]
- Badosa, A.; Boix, D.; Brucet, S.; López-Flores, R.; Gascón, S.; Quintana, X.D. Zooplankton taxonomic and size diversity in Mediterranean coastal lagoons (NE Iberian Peninsula): Influence of hydrology, nutrient composition, food resource availability and predation. Estuar. Coast. Shelf Sci. 2007, 71, 335–346. [Google Scholar] [CrossRef]
- Quintana, X.D.; Boix, D.; Badosa, A.; Brucet, S.; Compte, J.; Gascon, S.; López-Flores, R.; Sala, J.; Moreno-Amich, R. Community structure in mediterranean shallow lentic ecosystems: Size-based vs. taxon-based approaches. Limnetica 2006, 25, 303–320. [Google Scholar]
- Brucet, S.; Boix, D.; López-Flores, R.; Badosa, A.; Quintana, X.D. Size and species diversity of zooplankton communities in fluctuating Mediterranean salt marshes. Estuar. Coast. Shelf Sci. 2006, 67, 424–432. [Google Scholar] [CrossRef]
- Quintana, X.D.; Brucet, S.; Boix, D.; López-Flores, R.; Gascón, S.; Badosa, A.; Sala, J.; Moreno-Amich, R.; Egozcue, J.J. A nonparametric method for the measurement of size diversity with emphasis on data standardization. Limnol. Oceanogr. Methods 2008, 6, 75–86. [Google Scholar] [CrossRef]
- Gascón, S.; Boix, D.; Sala, J. Are different biodiversity metrics related to the same factors? A case study from Mediterranean wetlands. Biol. Conserv. 2009, 142, 2602–2612. [Google Scholar] [CrossRef]
- Jeppesen, E.; Sondergaard, M.; Kanstrup, E.; Petersen, B.; Eriksen, R.B.; Hammershoj, M.; Mortensen, E.; Jensen, J.P.; Have, A. Does the impact of nutrients on the biological structure and function of brakish and freshwater lakes differ? Hydrobiologia 1994, 275–276, 15–30. [Google Scholar] [CrossRef]
- Jensen, E.; Brucet, S.; Meerhoff, M.; Nathansen, L.; Jeppesen, E. Community structure and diel migration of zooplankton in shallow brackish lakes: Role of salinity and predators. Hydrobiologia 2010, 646, 215–229. [Google Scholar] [CrossRef]
- Brucet, S.; Boix, D.; Gascón, S.; Sala, J.; Quintana, X.D.; Badosa, A.; Søndergaard, M.; Lauridsen, T.L.; Jeppesen, E. Species richness of crustacean zooplankton and trophic structure of brackish lagoons in contrasting climate zones: North temperate Denmark and Mediterranean Catalonia (Spain). Ecography 2009, 32, 692–702. [Google Scholar] [CrossRef]
- Brucet, S.; Boix, D.; Quintana, X.D.; Jensen, E.; Nathansen, L.W.; Trochine, C.; Meerhoff, M.; Gascó, S.; Jeppesen, E. Factors influencing zooplankton size structure at contrasting temperatures in coastal shallow lakes: Implications for effects of climate change. Limnol. Oceanogr. 2010, 55, 1697–1711. [Google Scholar] [CrossRef] [Green Version]
- Quintana, X.D.; Arim, M.; Badosa, A.; Blanco, J.M.; Boix, D.; Brucet, S.; Compte, J.; Egozcue, J.J.; de Eyto, E.; Gaedke, U.; et al. Predation and competition effects on the size diversity of aquatic communities. Aquat. Sci. 2014, 77, 45–57. [Google Scholar] [CrossRef]
- Finlay, K.; Beisner, B.E.; Patoine, A.; Pinel-Alloul, B. Regional ecosystem variability drives the relative importance of bottom-up and top-down factors for zooplankton size spectra. Can. J. Fish. Aquat. Sci. 2007, 64, 516–529. [Google Scholar] [CrossRef]
- García-Comas, C.; Sastri, A.R.; Ye, L.; Chang, C.Y.; Lin, F.S.; Su, M.S.; Gong, G.C.; Hsieh, C.H. Prey size diversity hinders biomass trophic transfer and predator size diversity promotes it in Planktonic Communities. Proc. R. Soc. B Biol. Sci. 2016, 283. [Google Scholar] [CrossRef]
- Ersoy, Z.; Jeppesen, E.; Sgarzi, S.; Arranz, I.; Cañedo-Argüelles, M.; Quintana, X.D.; Landkildehus, F.; Lauridsen, T.L.; Bartrons, M.; Brucet, S. Size-based interactions and trophic transfer efficiency are modified by fish predation and cyanobacteria blooms in Lake Mývatn, Iceland. Freshw. Biol. 2017, 62, 1942–1952. [Google Scholar] [CrossRef]
- Brucet, S.; Compte, J.; Boix, D.; López-Flores, R.; Quintana, X.D. Feeding of nauplii, copepodites and adults of Calanipeda aquaedulcis (Calanoida) in Mediterranean salt marshes. Mar. Ecol. Prog. Ser. 2008, 355, 183–191. [Google Scholar] [CrossRef] [Green Version]
- Muñoz, A.A.; Ojeda, F.P. Guild structure of carnivorous intertidal fishes of the Chilean coast: Implications of ontogenetic dietary shifts. Oecologia 1998, 114, 563–573. [Google Scholar] [CrossRef] [PubMed]
- Marañón, E.; Cermeño, P.; Latasa, M.; Tadonléké, R.D. Resource supply alone explains the variability of marine phytoplankton size structure. Limnol. Oceanogr. 2015, 60, 1848–1854. [Google Scholar] [CrossRef] [Green Version]
- Mouillot, D.; Gaillard, S.; Aliaume, C.; Verlaque, M.; Belsher, T.; Troussellier, M.; Do Chi, T. Ability of taxonomic diversity indices to discriminate coastal lagoon environments based on macrophyte communities. Ecol. Indic. 2005, 5, 1–17. [Google Scholar] [CrossRef]
- Oertli, B.; Joye, D.A.; Castella, E.; Juge, R.; Cambin, D.; Lachavanne, J.B. Does size matter? The relationship between pond area and biodiversity. Biol. Conserv. 2002, 104, 59–70. [Google Scholar] [CrossRef] [Green Version]
- Jeppesen, E.; Jensen, J.P.; Sondergaard, M.; Lauridsen, T.; Landkildehus, F. Trophic structure, species richness and biodiversity in Danish lakes: Changes along a phosphorus gradient. Freshw. Biol. 2000, 45, 201–218. [Google Scholar] [CrossRef]
- Romo, S.; Villena, M.J. Phytoplankton strategies and diversity under different nutrient levels and planktivorous fish densities in a shallow Mediterranean lake. J. Plankton Res. 2005. [Google Scholar] [CrossRef]
- López-Flores, R.; Quintana, X.D.; Romaní, A.M.; Bañeras, L.; Ruiz-Rueda, O.; Compte, J.; Green, A.J.; Egozcue, J.J. A compositional analysis approach to phytoplankton composition in coastal Mediterranean wetlands: Influence of salinity and nutrient availability. Estuar. Coast. Shelf Sci. 2014, 136, 72–81. [Google Scholar] [CrossRef]
- Jeppesen, E.; Meerhoff, M.; Jacobsen, B.A.; Hansen, R.S.; Søndergaard, M.; Jensen, J.P.; Lauridsen, T.L.; Mazzeo, N.; Branco, C.W.C. Restoration of shallow lakes by nutrient control and biomanipulation—The successful strategy varies with lake size and climate. Hydrobiologia 2007, 581, 269–285. [Google Scholar] [CrossRef]
- Alcaraz, C.; Bisazza, A.; García-Berthou, E. Salinity mediates the competitive interactions between invasive mosquitofish and an endangered fish. Oecologia 2008, 155, 205–213. [Google Scholar] [CrossRef] [PubMed]
- Cognetti, G.; Maltagliati, F. Biodiversity and adaptive mechanisms in brackish water fauna. Mar. Pollut. Bull. 2000, 40, 7–14. [Google Scholar] [CrossRef]
- Moss, B. Brackish and Fresh-Water Shallow Lakes—Different Systems or Variations on the Same Theme. Hydrobiologia 1994, 276, 1–14. [Google Scholar] [CrossRef]
- Brönmark, C. Freshwater snail diversity: Effects of pond area, habitat heterogeneity and isolation. Oecologia 1985. [Google Scholar] [CrossRef] [PubMed]
- Brönmark, C.; Herrmann, J.; Malmqvist, B.; Otto, C.; Sjöström, P. Animal community structure as a function of stream size. Hydrobiologia 1984. [Google Scholar] [CrossRef]
- Dodson, S.I. Species richness of crustacean zooplankton in European lakes of different sizes. Verh. Int. Ver. Theor. Angew. Limnol. 1991. [Google Scholar] [CrossRef]
- Dodson, S. Predicting crustacean zooplankton species richness. Limnol. Oceanogr. 1992. [Google Scholar] [CrossRef]
- Fryer, G. Crustacean diversity in relation to the size of water bodies: Some facts and problems. Freshw. Biol. 1985. [Google Scholar] [CrossRef]
- Collos, Y.; Husseini-Ratrema, J.; Bec, B.; Vaquer, A.; Thong, L.H.; Rougier, C.; Pons, V.; Souchu, P. Pheopigment dynamics, zooplankton grazing rates and the autumnal ammonium peak in a Mediterranean lagoon. Hydrobiologia 2005, 550, 83–93. [Google Scholar] [CrossRef]
- Gelós, M.; Teixeira-de Mello, F.; Goyenola, G.; Iglesias, C.; Fosalba, C.; García-Rodríguez, F.; Pacheco, J.P.; García, S.; Meerhoff, M. Seasonal and diel changes in fish activity and potential cascading effects in subtropical shallow lakes with different water transparency. Hydrobiologia 2010. [Google Scholar] [CrossRef]
- Ye, L.; Chang, C.Y.; García-Comas, C.; Gong, G.C.; Hsieh, C. hao Increasing zooplankton size diversity enhances the strength of top-down control on phytoplankton through diet niche partitioning. J. Anim. Ecol. 2013. [Google Scholar] [CrossRef] [PubMed]
- López-Flores, R.; Boix, D.; Badosa, A.; Brucet, S.; Quintana, X.D. Pigment composition and size distribution of phytoplankton in a confined Mediterranean salt marsh ecosystem. Mar. Biol. 2006, 149, 1313–1324. [Google Scholar] [CrossRef]
- Quintana, X.D. Estimation of water circulation in a Mediterranean salt marsh and its relationship with flooding causes. Limnetica 2002, 21, 25–35. [Google Scholar]
- Quintana, X.D.; Baix, D.; Badosa, A.; Brucet, S.; Gascón, S.; Gesti, J.; Trobajo, R. Limnología de los humedales costeros mediterráneos. El caso de Aiguamolls de l ’ Empordà. Ecosistemas 2004, 13, 30–36. [Google Scholar]
- López-Flores, R.; Boix, D.; Badosa, A.; Brucet, S.; Quintana, X.D. Environmental factors affecting bacterioplankton and phytoplankton dynamics in confined Mediterranean salt marshes (NE Spain). J. Exp. Mar. Biol. Ecol. 2009, 369, 118–126. [Google Scholar] [CrossRef]
- Comin, F.A.; Valiela, I. On the Controls of Phytoplankton Abundance and Production in Coastal Lagoons. J. Coast. Res. 1993. [Google Scholar] [CrossRef]
- Quintana, X.D.; Moreno-Amich, R.; Comín, F.A. Nutrient and plankton dynamics in a Mediterranean salt marsh dominated by incidents of flooding. Part 1: Differential confinement of nutrients. J. Plankton Res. 1998. [Google Scholar] [CrossRef]
- Daft Logic Google Maps Area Calculator Tool. 2014. Available online: http://www.daftlogic.com/projects-google-maps-area-calculator-tool.htlm (accessed on 8 January 2019).
- Sen Gupta, R.; Koroleff, F. A quantitative study of nutrient fractions and a stoichiometric model of the Baltic. Estuar. Coast. Mar. Sci. 1973, 1, 335–360. [Google Scholar] [CrossRef]
- Parsons, T.R.; Strickland, J.D.H. Particulate organic matter. III. I. Pigment analysis. III. II. Determination of phytoplankton pigments. J. Fish. Res. Board Can. 1965, 8, 117–127. [Google Scholar]
- Mischke, U.; Thackeray, S.; Dunbar, M.; McDonald, C.; Carvalho, L.; de Hoyos, C.; Jarvinen, M.; Laplace-Treyture, C.; Morabito, G.; Skjelbred, B.; et al. WISER Deliverable D3.1-4: Guidance Document on Sampling, Analysis and Counting Standards for Phytoplankton in Lakes; European Commission: Brussels, Belgium, 2012; pp. 1–51. [Google Scholar]
- Sun, J.; Liu, D. Geometric models for calculating cell biovolume and surface area for phytoplankton. J. Plankton Res. 2003, 25, 1331–1346. [Google Scholar] [CrossRef] [Green Version]
- Fouilland, E.; Fossati, O. Trapping efficiency of plastic bottle “wickertraps” for population assessment of river Macrobrachium (Crustacea: Decapoda). Fish. Res. 1996, 28, 343–351. [Google Scholar] [CrossRef]
- Clavero, M.; Blanco-Garrido, F.; Prenda, J. Monitoring small fish populations in streams: A comparison of four passive methods. Fish. Res. 2006, 78, 243–251. [Google Scholar] [CrossRef]
- European Commettee for Standardization. Water Quality-Sampling of Fish with Multi-Mesh Gillnets; The National Standards Authority of Ireland (NSAI): Dublin, Ireland, 2005. [Google Scholar]
- Pielou, E.C. An Introduction to Mathematical Ecology; Wiley-Interscience: New York, NY, USA, 1969. [Google Scholar]
- Oksanen, J.; Blanchet, F.G.; Kindt, R.; Legendre, P.; Minchin, P.R.; O’hara, R.B.; Oksanen, M.J. Vegan: Community Ecology Package. R Package Version 2.0-9. 2013. Available online: https://www.researchgate.net/publication/301511806_Community_ecology_package’vegan’version_20-9 (accessed on 8 January 2019).
- Jeppesen, E.; Jensen, J.P.; Lauridsen, T.L.; Amsinck, S.L.; Christoffersen, K.; Søndergaard, M.; Mitchell, S.F. Sub-fossils of cladocerans in the surface sediment of 135 lakes as proxies for community structure of zooplankton, fish abundance and lake temperature. Hydrobiologia 2003, 491, 321–330. [Google Scholar] [CrossRef]
- Erdfelder, E.; FAul, F.; Buchner, A.; Lang, A.G. Statistical power analyses using G*Power 3.1: Tests for correlation and regression analyses. Behav. Res. Methods 2009, 41, 1149–1160. [Google Scholar] [CrossRef]
- Wickham, H. ggplot2: Elegant Graphics for Data Analysis; Springer: New York, NY, USA, 2009. [Google Scholar]
- García-Berthou, E.; Moreno-Amich, R. New records of Aphanius iberus (Pisces: Cyprinodontidae) and review of the geographical distribution of Cyprinodontiform fishes in Catalonia (NE-Spain). Sci. Gerund. 1991, 76, 69–76. [Google Scholar]
- Compte, J.; Gascón, S.; Quintana, X.D.; Boix, D. The effects of small fish presence on a species-poor community dominated by omnivores: Example of a size-based trophic cascade. J. Exp. Mar. Biol. Ecol. 2012, 418–419, 1–11. [Google Scholar] [CrossRef]
- MacArthur, R.; Wilson, E. The Theory of Island Biogeography; Princeton University Press: Princeton, NJ, USA, 1967. [Google Scholar] [CrossRef]
- Møller, T.R.; Rørdam, C.P. Species numbers of vascular plants in relation to area, isolation and age of ponds in Denmark. Oikos 1985, 45, 8–16. [Google Scholar] [CrossRef]
- Barbour, C.D.; Brown, J.H. Fish Species Diversity in Lakes. Am. Nat. 1974. [Google Scholar] [CrossRef]
- Eadie, J.M.A.; Hurly, T.A.; Montgomerie, R.D.; Teather, K.L. Lakes and rivers as islands: Species-area relationships in the fish faunas of Ontario. Environ. Biol. Fish. 1986. [Google Scholar] [CrossRef]
- Martinoy, M.; Boix, D.; Sala, J.; Gascón, S.; Gifre, J.; Argerich, A.; De La Barrera, R.; Brucet, S.; Badosa, A.; López-Flores, R.; et al. Crustacean and aquatic insect assemblages in the Mediterranean coastal ecosystems of Empordà wetlands (NE Iberian peninsula). Limnetica 2006, 25, 665–682. [Google Scholar]
- Garzke, J.; Ismar, S.M.H.; Sommer, U. Climate change affects low trophic level marine consumers: Warming decreases copepod size and abundance. Oecologia 2015, 177, 849–860. [Google Scholar] [CrossRef]
- Marañón, E.; Cermeño, P.; Latasa, M.; Tadonléké, R.D. Temperature, resources, and phytoplankton size structure in the ocean. Limnol. Oceanogr. 2012, 57, 1266–1278. [Google Scholar] [CrossRef]
- Sommer, F.; Ståhlman, M.; Ilkayeva, O.; Arnemo, J.M.; Kindberg, J.; Josefsson, J.; Newgard, C.B.; Fröbert, O.; Bäckhed, F. The Gut Microbiota Modulates Energy Metabolism in the Hibernating Brown Bear Ursus arctos. Cell Rep. 2016, 14, 1655–1661. [Google Scholar] [CrossRef] [PubMed] [Green Version]
- Guidi, L.; Stemmann, L.; Jackson, G.A.; Ibanez, F.; Claustre, H.; Legendre, L.; Picheral, M.; Gorsky, G. Effects of phytoplankton community on production, size and export of large aggregates: A world-ocean analysis. Limnol. Oceanogr. 2009, 54, 1951–1963. [Google Scholar] [CrossRef]
- Litchman, E.; Klausmeier, C.A. Trait-Based Community Ecology of Phytoplankton. Annu. Rev. Ecol. Evol. Syst. 2008, 39, 615–639. [Google Scholar] [CrossRef]
- Fox, J.W. Modelling the joint effects of predator and prey diversity on total prey biomass. J. Anim. Ecol. 2004, 73, 88–96. [Google Scholar] [CrossRef] [Green Version]
- López-Flores, R.; Garcés, E.; Boix, D.; Badosa, A.; Brucet, S.; Masó, M.; Quintana, X.D. Comparative composition and dynamics of harmful dinoflagellates in Mediterranean salt marshes and nearby external marine waters. Harmful Algae 2006, 5, 637–648. [Google Scholar] [CrossRef]
- Mehner, T.; Keeling, C.; Emmrich, M.; Holmgren, K.; Argillier, C.; Volta, P.; Winfield, I.J.; Brucet, S. Effects of fish predation on density and size spectra of prey fish communities in lakes. Can. J. Fish. Aquat. Sci. 2016. [Google Scholar] [CrossRef]
- Compte, J.; Gascón, S.; Quintana, X.D.; Boix, D. Top-predator effects of jellyfish Odessia maeotica in Mediterranean salt marshes. Mar. Ecol. Prog. Ser. 2010, 402, 147–159. [Google Scholar] [CrossRef] [Green Version]
- Compte, J.; Gascón, S.; Quintana, X.D.; Boix, D. Fish effects on benthos and plankton in a Mediterranean salt marsh. J. Exp. Mar. Biol. Ecol. 2011, 409, 259–266. [Google Scholar] [CrossRef]
- Oguz, T.; Ducklow, H.W.; Purcell, J.E.; Malanotte-Rizzoli, P. Modeling the responsae of top-down control exerted by gelatinous carnivores on the Black Sea pelagic food web. J. Geophys. Res. 2001, 106, 4543–4564. [Google Scholar] [CrossRef]
- Pitt, K.A.; Kingsford, M.J.; Rissik, D.; Koop, K. Jellyfish modify the response of planktonic assemblages to nutrient pulses. Mar. Ecol. Prog. Ser. 2007, 351, 1–13. [Google Scholar] [CrossRef] [Green Version]
- Post, D.M.; Takimoto, G. Proximate structural mechanisms for variation in food-chain length. Oikos 2007, 116, 775–782. [Google Scholar] [CrossRef]
- Chang, C.W.; Miki, T.; Shiah, F.K.; Kao, S.J.; Wu, J.T.; Sastri, A.R.; Hsieh, C.H. Linking secondary structure of individual size distribution with nonlinear size-trophic level relationship in food webs. Ecology 2014. [Google Scholar] [CrossRef]
- Sherr, E.; Sherr, B. Role of Microbes in Pelagic Food Webs: A Revised Concept. Limnol. Oceanogr. 1988, 33, 1225–1227. [Google Scholar] [CrossRef]
- Persson, L.; Bengtsson, J.; Menge, B.A.; Power, M.E. Food Webs. Integration of Patterns and Dynamics; Springer: New York, NY, USA, 1996; ISBN 1461570077. [Google Scholar]


| Mean | Minimum | Maximum | SD | |
|---|---|---|---|---|
| Mean water column depth (cm) | 55.08 | 16.00 | 150.00 | 37.99 |
| Pond area (m2) | 9457.90 | 147.90 | 68,150.00 | 18,162.80 |
| Water transparency | 0.89 | 0.64 | 1.00 | 0.12 |
| Temperature (°C) | 25.56 | 21.14 | 32.20 | 2.97 |
| pH | 8.47 | 7.39 | 9.97 | 0.72 |
| Conductivity (mS·cm−1) | 42.61 | 10.07 | 69.10 | 18.74 |
| Total dissolved solids (g·L−1) | 0.03 | 0.01 | 0.05 | 0.00 |
| Dissolved oxygen (%) | 115.04 | 41.10 | 262.50 | 56.66 |
| Chlorophyll-a (µg·L−1) | 11.92 | 0.31 | 43.41 | 14.54 |
| Total nitrogen (μmol·L−1) | 97.00 | 58.55 | 234.40 | 47.46 |
| Total phosphorus (μmol·L−1) | 3.19 | 0.44 | 7.57 | 2.15 |
| Nitrate (μmol·L−1) | 0.21 | 0.07 | 0.66 | 0.16 |
| Soluble reactive phosphate (μmol·L−1) | 1.27 | 0.09 | 6.94 | 2.01 |
| Phytoplankton biomass: total nitrogen | 0.35 | 0.09 | 1.58 | 0.42 |
| Mean | Minimum | Maximum | SD | |
|---|---|---|---|---|
| Phytoplankton | ||||
| Size diversity | 1.79 | 0.31 | 2.95 | 0.61 |
| Taxonomic diversity | 0.94 | 0.02 | 2.14 | 0.53 |
| Zooplankton | ||||
| Size diversity | 1.95 | 0.70 | 2.84 | 0.67 |
| Taxonomic diversity | 0.38 | 0.00 | 1.13 | 0.34 |
| Fish | ||||
| Size diversity | 1.42 | 0.72 | 2.08 | 0.37 |
| Taxonomic diversity | 0.08 | 0.00 | 0.40 | 0.14 |
| Response Variable | Predictor | Estimate | S.E. | Beta Coefficients | t-Value | p-Value | df | Global p-Value | R2 | Statistical Power |
|---|---|---|---|---|---|---|---|---|---|---|
| Phytoplankton | ||||||||||
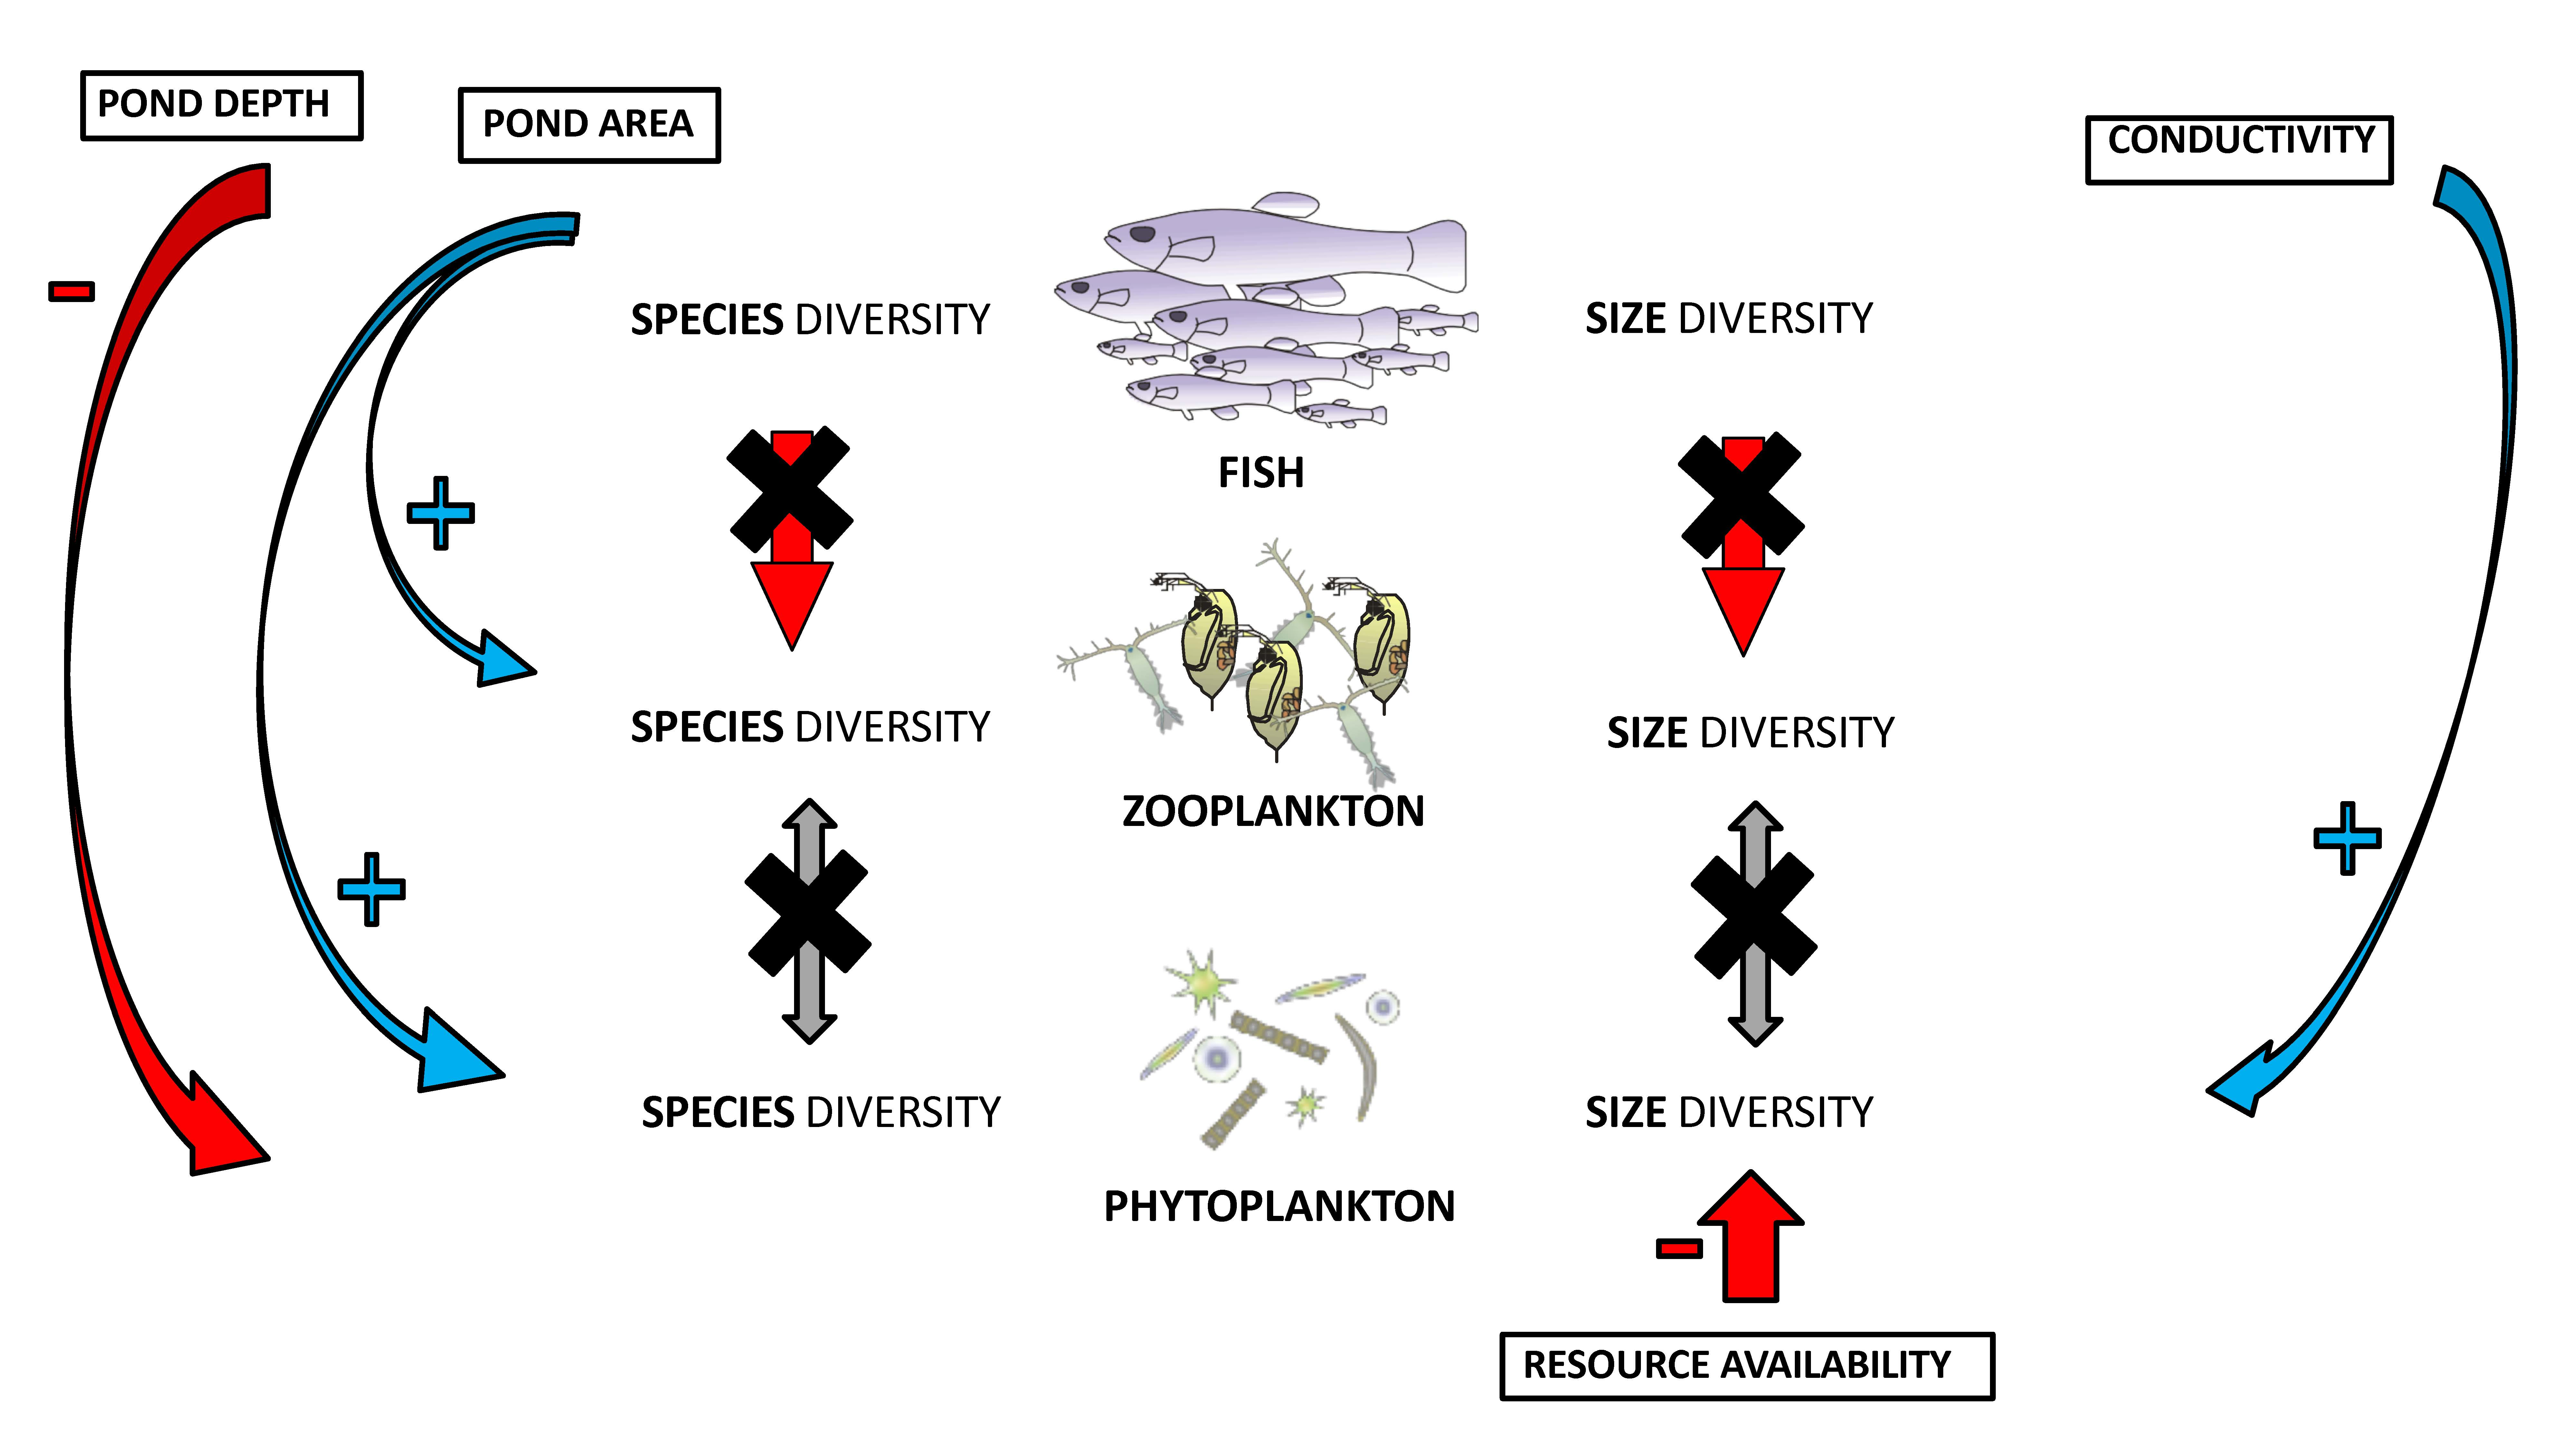
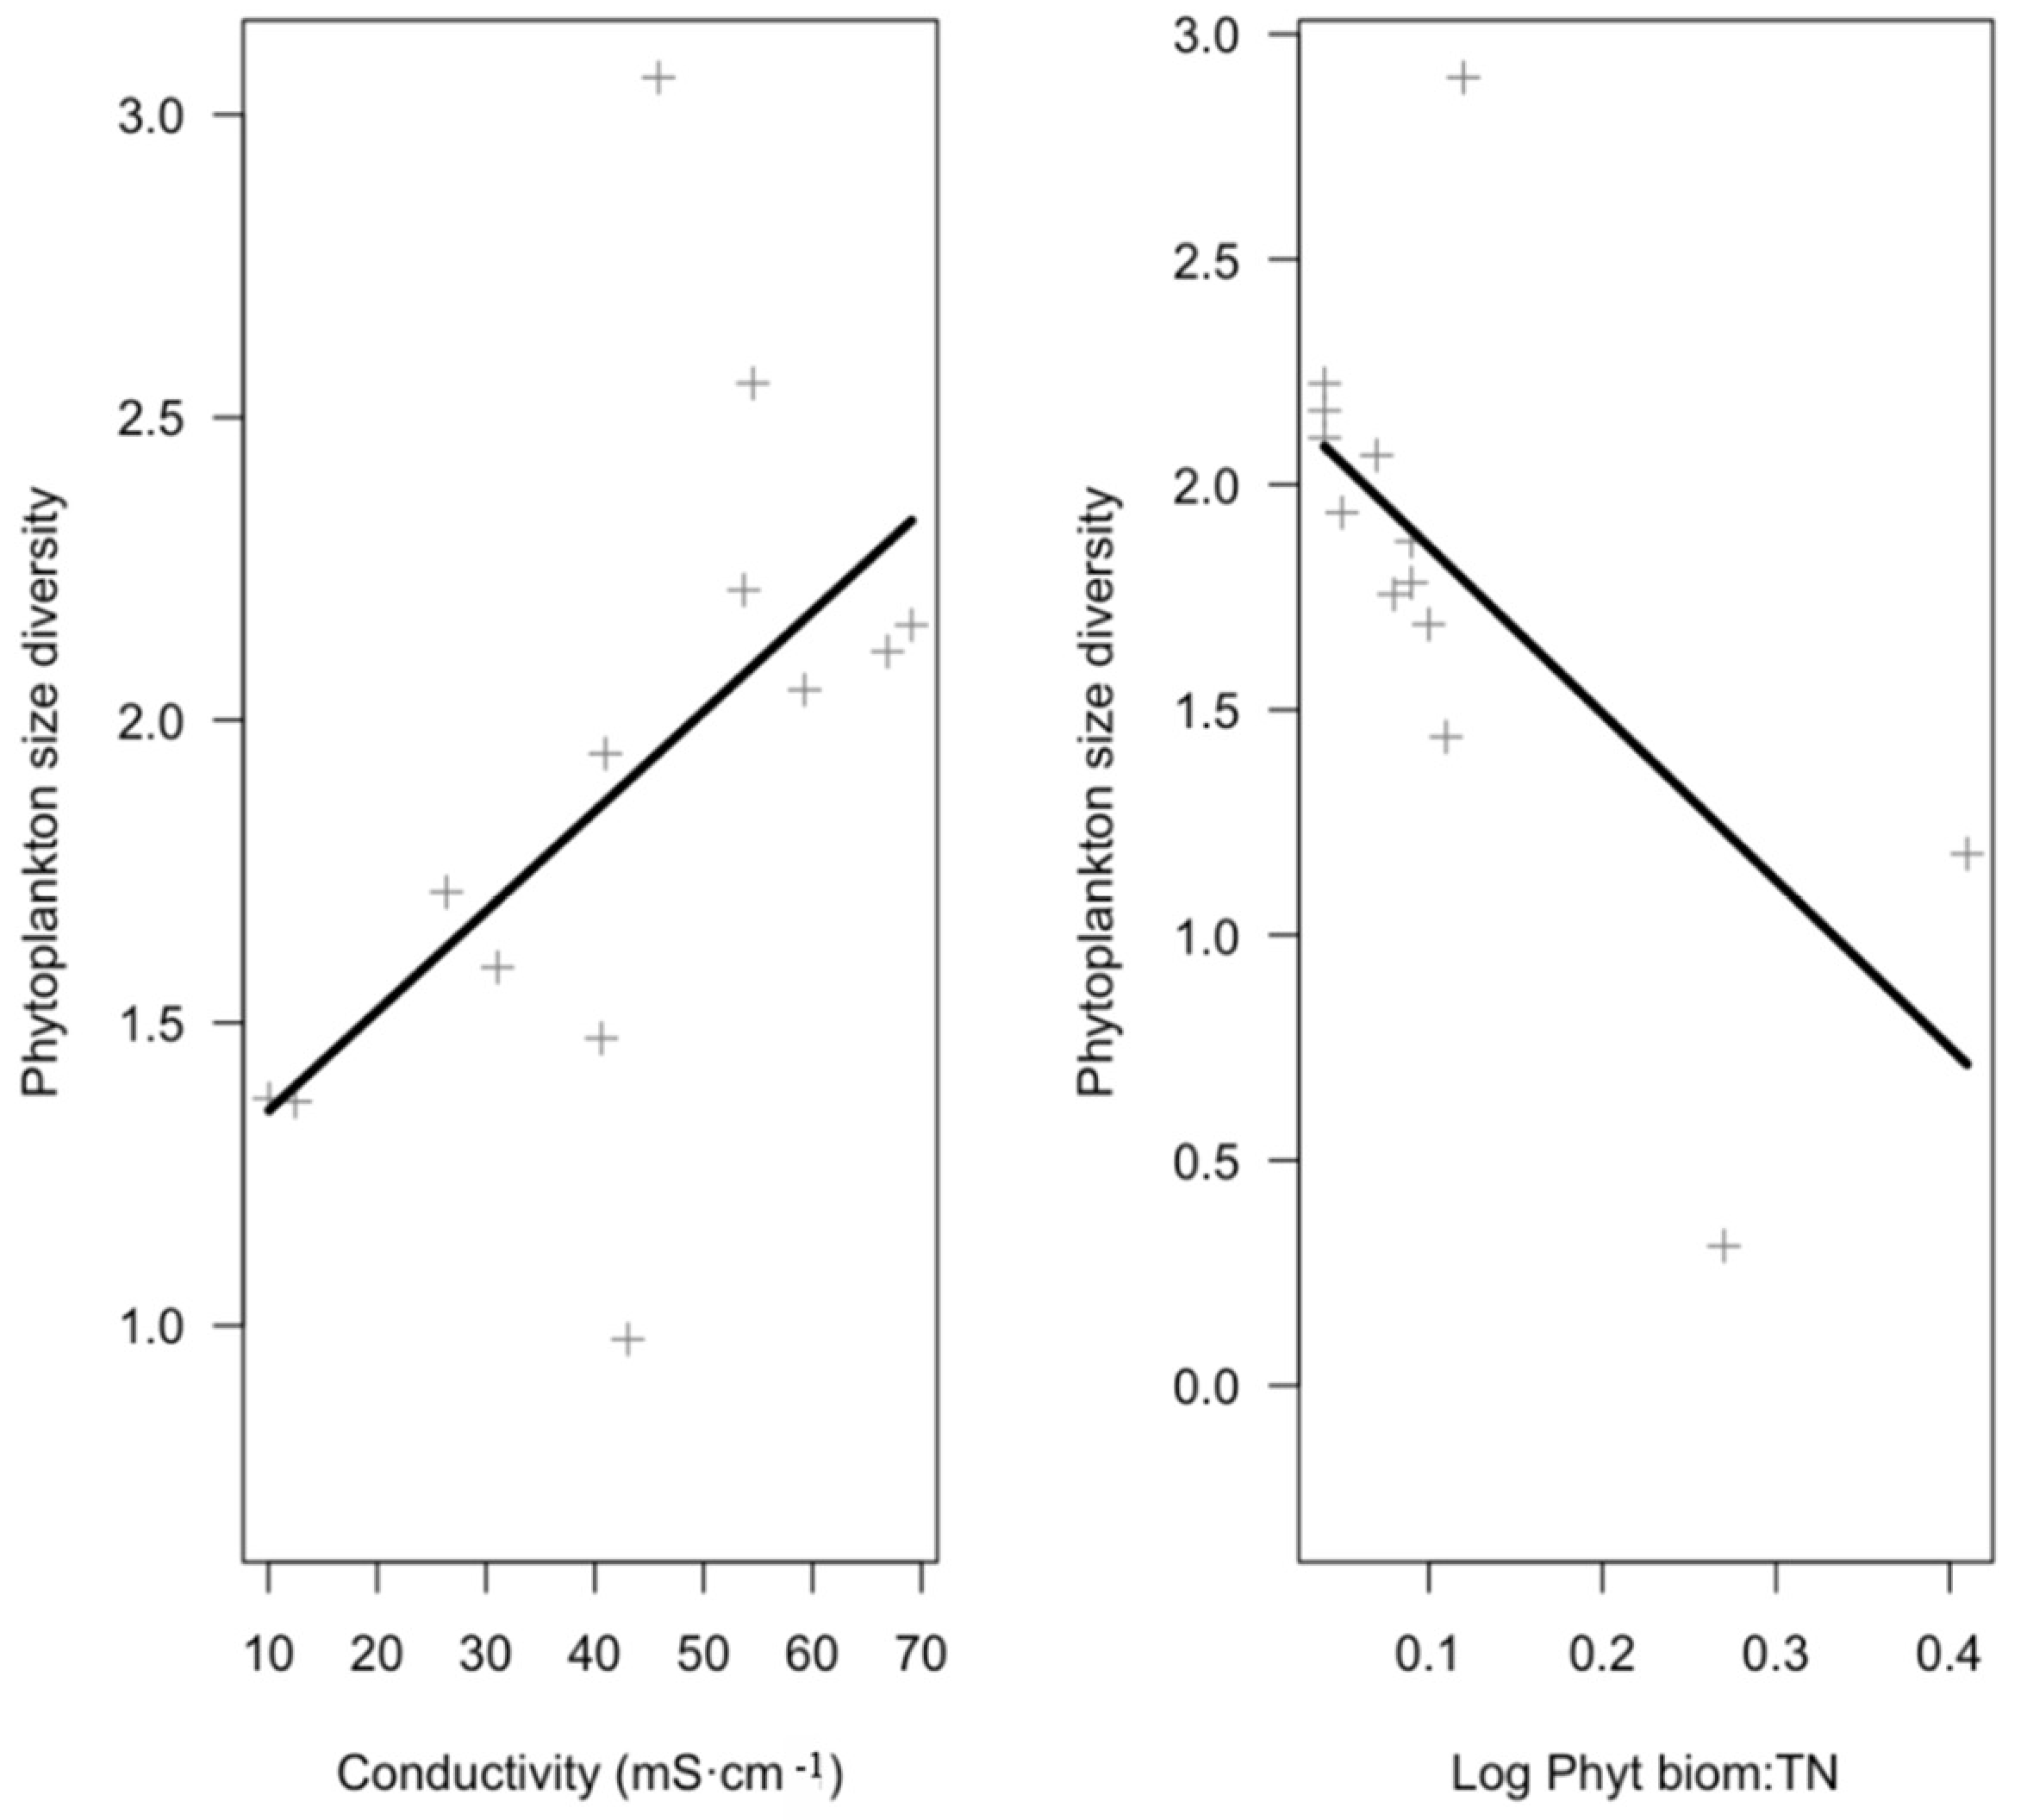
| Size diversity | Conductivity | 0.02 | 0.01 | 0.48 | 2.04 | 0.06 | 11 | 0.04 | 0.47 | 0.55 |
| Log Phytoplankton biomass:TN | −3.71 | 1.42 | −0.62 | −2.62 | 0.02 | |||||
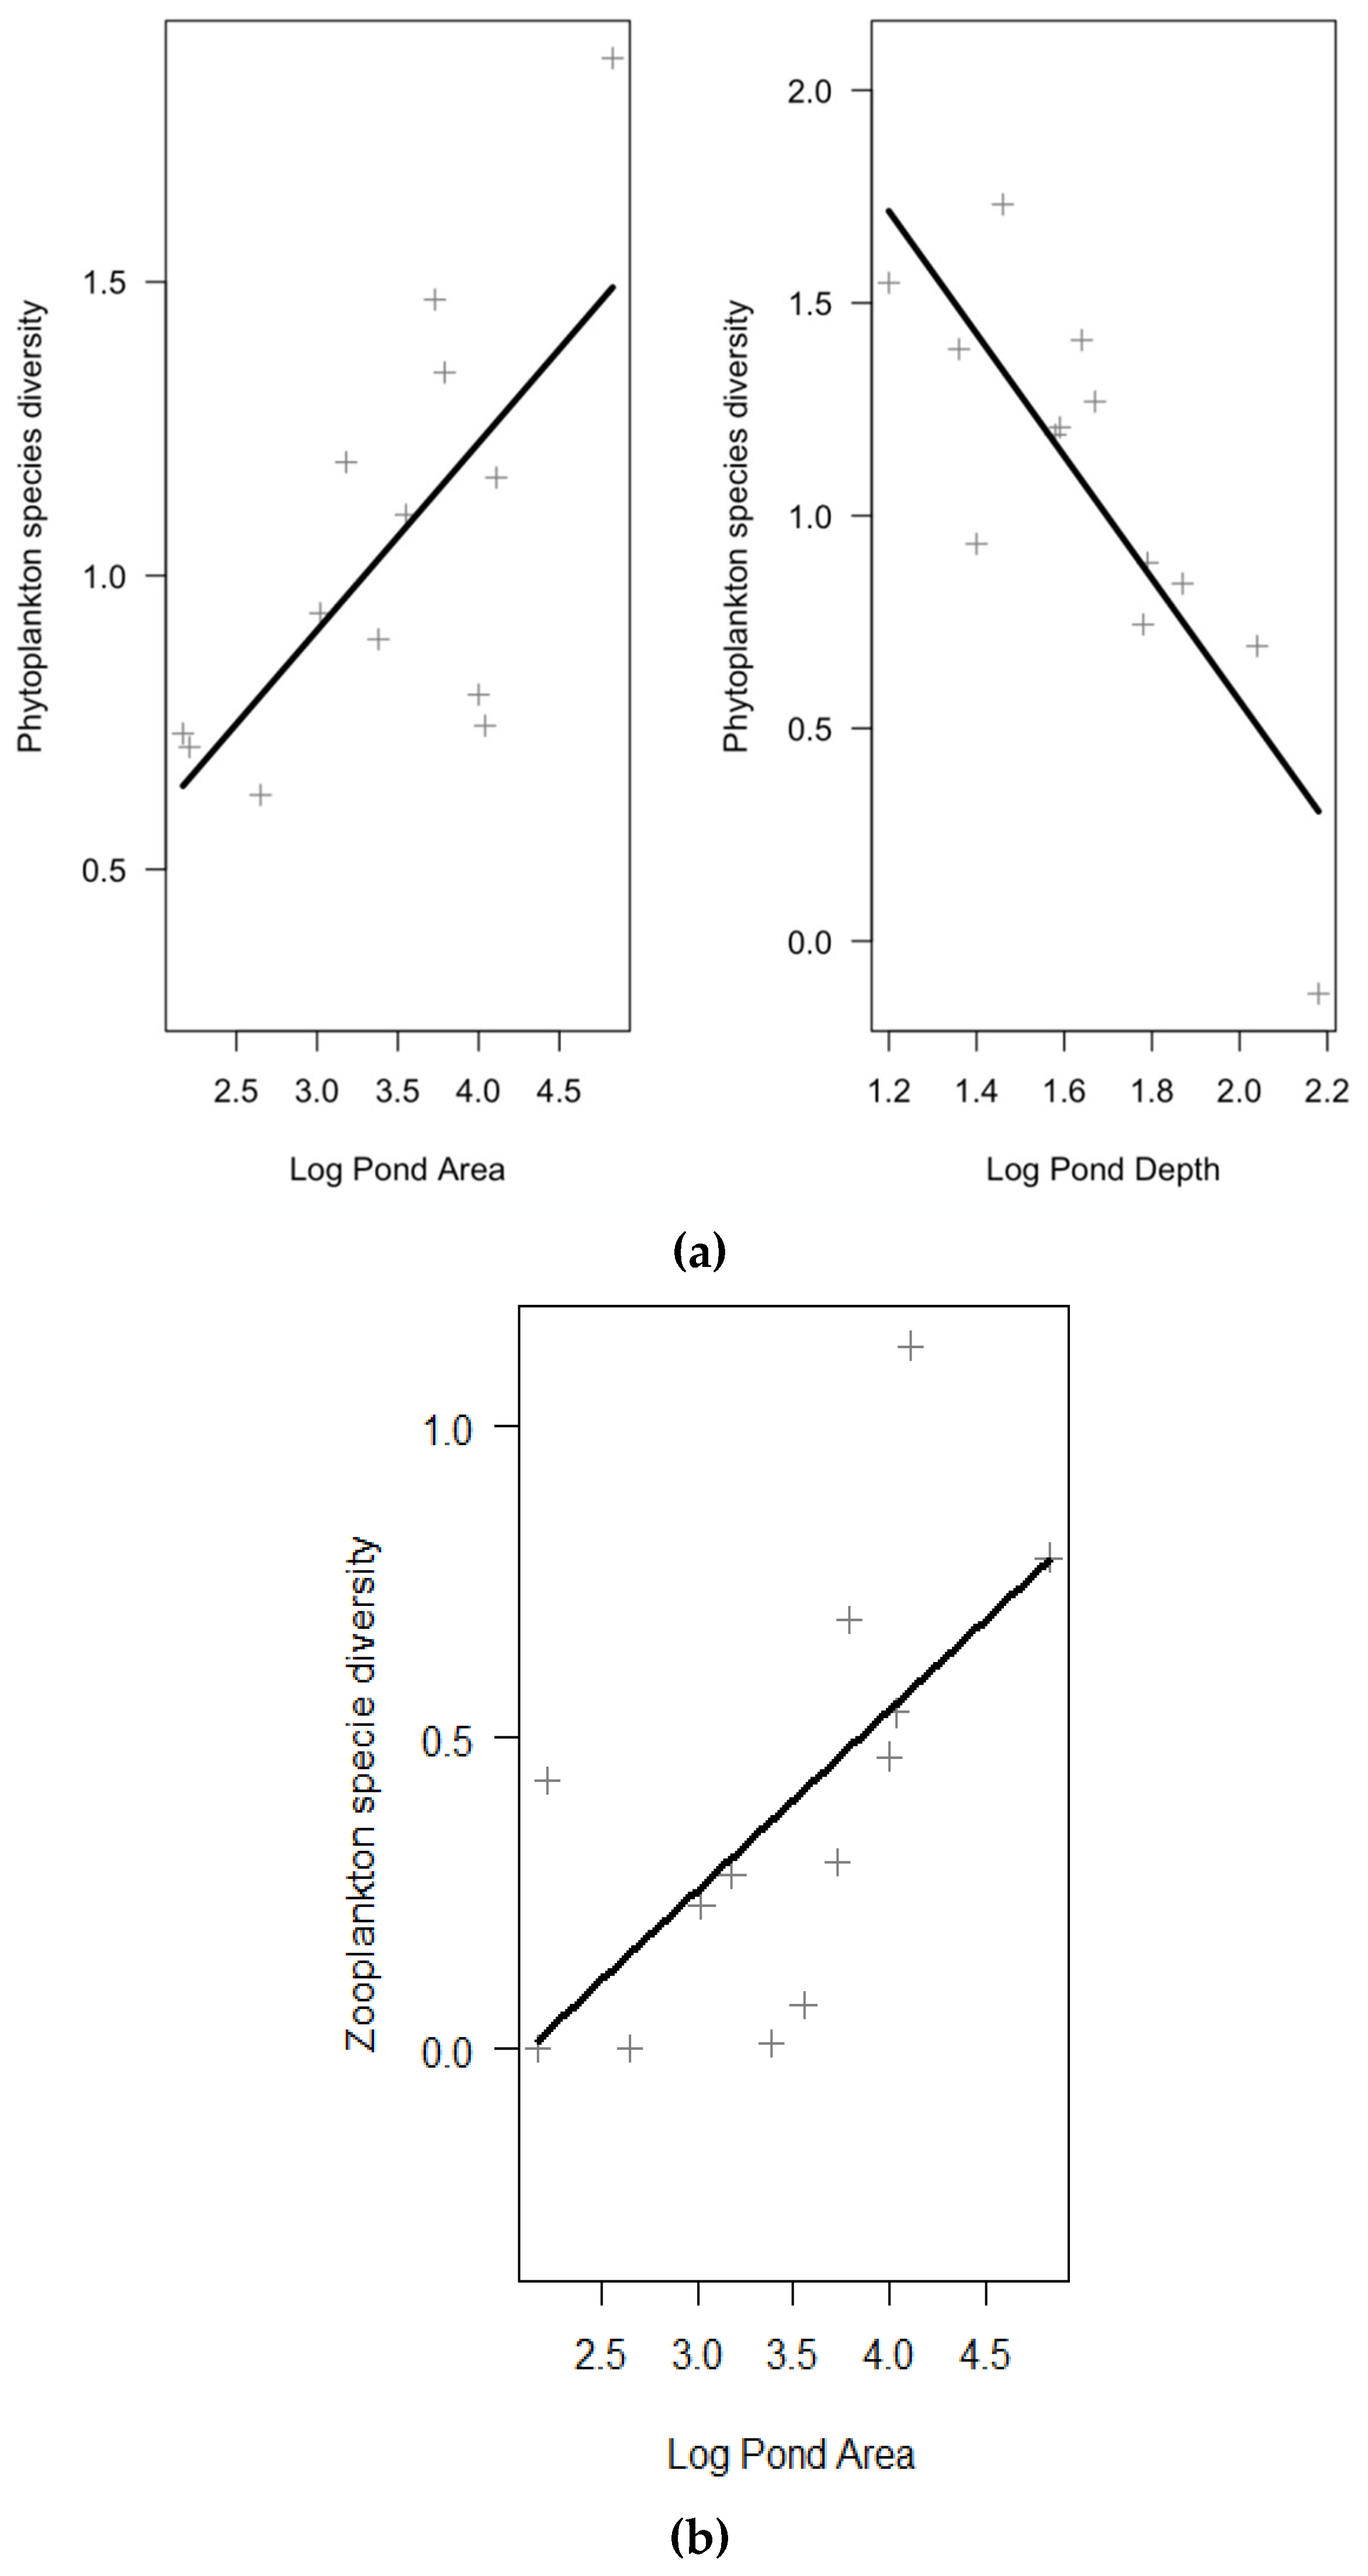
| Species diversity | Log Pond Area | 0.32 | 0.11 | 0.46 | 2.96 | 0.01 | 11 | <0.01 | 0.76 | 0.99 |
| log Mean Depth | −1.44 | 0.31 | −0.73 | −4.73 | <0.01 | |||||
| Zooplankton | ||||||||||
| Species diversity | Log Pond area | 0.29 | 0.10 | 0.65 | 2.86 | 0.02 | 11 | 0.02 | 0.42 | 0.8 |
© 2019 by the authors. Licensee MDPI, Basel, Switzerland. This article is an open access article distributed under the terms and conditions of the Creative Commons Attribution (CC BY) license (http://creativecommons.org/licenses/by/4.0/).
Share and Cite
Sgarzi, S.; Badosa, A.; Leiva-Presa, À.; Benejam, L.; López-Flores, R.; Brucet, S. Plankton Taxonomic and Size Diversity of Mediterranean Brackish Ponds in Spring: Influence of Abiotic and Biotic Factors. Water 2019, 11, 106. https://doi.org/10.3390/w11010106
Sgarzi S, Badosa A, Leiva-Presa À, Benejam L, López-Flores R, Brucet S. Plankton Taxonomic and Size Diversity of Mediterranean Brackish Ponds in Spring: Influence of Abiotic and Biotic Factors. Water. 2019; 11(1):106. https://doi.org/10.3390/w11010106
Chicago/Turabian StyleSgarzi, Serena, Anna Badosa, Àngels Leiva-Presa, Lluís Benejam, Rocío López-Flores, and Sandra Brucet. 2019. "Plankton Taxonomic and Size Diversity of Mediterranean Brackish Ponds in Spring: Influence of Abiotic and Biotic Factors" Water 11, no. 1: 106. https://doi.org/10.3390/w11010106