Five-Year Experimental Study on Effectiveness and Sustainability of a Dry Drainage System for Controlling Soil Salinity


State Key Laboratory of Water Resources and Hydropower Engineering Science, Wuhan University, Wuhan 430072, China
*
Authors to whom correspondence should be addressed.
Water 2019, 11(1), 111; https://doi.org/10.3390/w11010111
Submission received: 5 December 2018
/
Revised: 3 January 2019
/
Accepted: 4 January 2019
/
Published: 10 January 2019
(This article belongs to the Special Issue Innovation Issues in Water, Agriculture and Food)
Abstract
:The dry drainage system (DDS) is an alternative technique for controlling salinization. To quantify its role in soil salinity control, a five-year field observation from 2007 to 2011 was completed in a 2900 ha experimental plot in Yonglian Experimental Station, Hetao Irrigation District, China. Results showed that the groundwater table depth in the fallow areas quickly responded to the lateral recharge from the surrounding croplands during irrigation events. The groundwater electrical conductivity (GEC) of fallow areas increased from 5 mS·cm−1 to 15 mS·cm−1, whereas the GEC below croplands produced small fluctuations. The analysis of water and salt balance showed that the excess water that moved to fallow was roughly four times that moved by an artificial drainage system and with 7.7 times the corresponding salt. The fallow areas act as a drainage repository to receive excess water and salt from surrounding irrigated croplands. Slight salt accumulation occurred in irrigated croplands and salts accumulated, with an accelerating trend over the final two years. The evaporation capability weakened, partly due to the salt crust in the topsoil, and the decrease in soil permeability in the soil column, which was almost impermeable to water. Using halophytes may be an effective method to remove salts that have accumulated in fallow areas, having great economic and ecological value. A DDS may be effective and sustainable in situations where the fallow areas can sustain an upward capillary flux from planted halophytes.
1. Introduction
Salinization is a long-standing problem that has threatened crop production and food security in many arid and semi-arid regions, and has impeded sustainable irrigation over the past 2000 years. Salt accumulation has played a significant role in the abandonment of settlements and in the breakdown of ancient civilizations throughout history [1,2,3,4,5]. The overall loss from groundwater-associated and irrigation-induced salinity in the world was estimated to be $27.3 USD billion/year [6,7]. To alleviate the impact of soil salinity, various technical measures and strategies have been developed since the early 1900s. Irrigation systems can be sustainable if excess salt and drainage water are adequately removed from the subsoil [8]. Many soil-related problems could be minimized by installing various types of drainage ditches. An artificial drainage system (ADS) is a popular method used to drain salt away from the root zone by deliberate flood irrigation events [9,10,11,12,13]. However, conventional drainage methods produce seemingly intractable economic [14] and environmental problems [9,10,11,12,15,16,17].
The dry drainage system (DDS) is a technique that was first proposed in 1992 for areas with a shallow groundwater table depth (GTD), high evaporation, and intensive irrigation [18]. In the DDS operating process, a part of the land that is generally low-lying is permanently or seasonally fallowed to act as a sink for excess water and salts from neighboring irrigated croplands. The GTD in irrigated croplands rises along with the irrigation events, whereas that in the fallow area falls with the aid of evaporation. This produces a hydraulic gradient that induces lateral groundwater migration flow from the croplands to the fallow area. Thus, the excess salt is eventually transported to the fallow areas. As the fallow area is not irrigated and the evaporation in the salinity-hazard area is generally strong, the DDS continuously functions. The salt balance in the irrigated areas can be maintained providing the fallow areas are large enough to evaporate the excess water. The DDS does not need extra investment in the operation and maintenance, and can mitigate various potential environmental concerns compared with ADS, including degrading water quality, destroying wetlands, and increasing drain outfall erosion [9,15,18,19,20].
Previous studies have discussed and tested the effects of DDSs on soil salinity control, for example, the key design technology of the DDS and studies based on field-scale numerical simulations [9,11]. These technologies have contributed to the sustainability of the agro-ecosystem by helping to maintain the water and salt balance in the root zone of irrigated croplands, controlling soil salinity and minimizing environmental threats [12,15,20,21,22]. The long-term effectiveness of the DDS in the Hetao Irrigation District (HID), China, has been studied by various methods (e.g., remote sensing, field experiments, and conceptual/numerical models) [15,19,21,22,23,24]. However, previous studies mainly investigated surface salinity dynamics and did not measure the salt accumulation in the soil profile, especially below the root zone [9,11]. The effects of salt accumulation in fallow areas on the evaporation rate and the sustainability of the DDS are still unclear [9,11,15]. Therefore, the main objective of this study was to quantify the capability of the DDS via the salt balance in specific monitoring wells and to investigate and discuss the sustainability of DDSs on soil salinity control with a five-year field observation. Based on the five-year archived data, the soil salt content (SSC) was measured in the vertical profiles of irrigated and fallow areas, and we analyzed the dynamic change in GTD, groundwater electrical conductivity (GEC), and SSC. We evaluated the effectiveness and sustainability of DDS in the HID, and propose some suggestions for improving the DDS.
2. Materials and Methods
2.1. Brief Description of the HID and YES
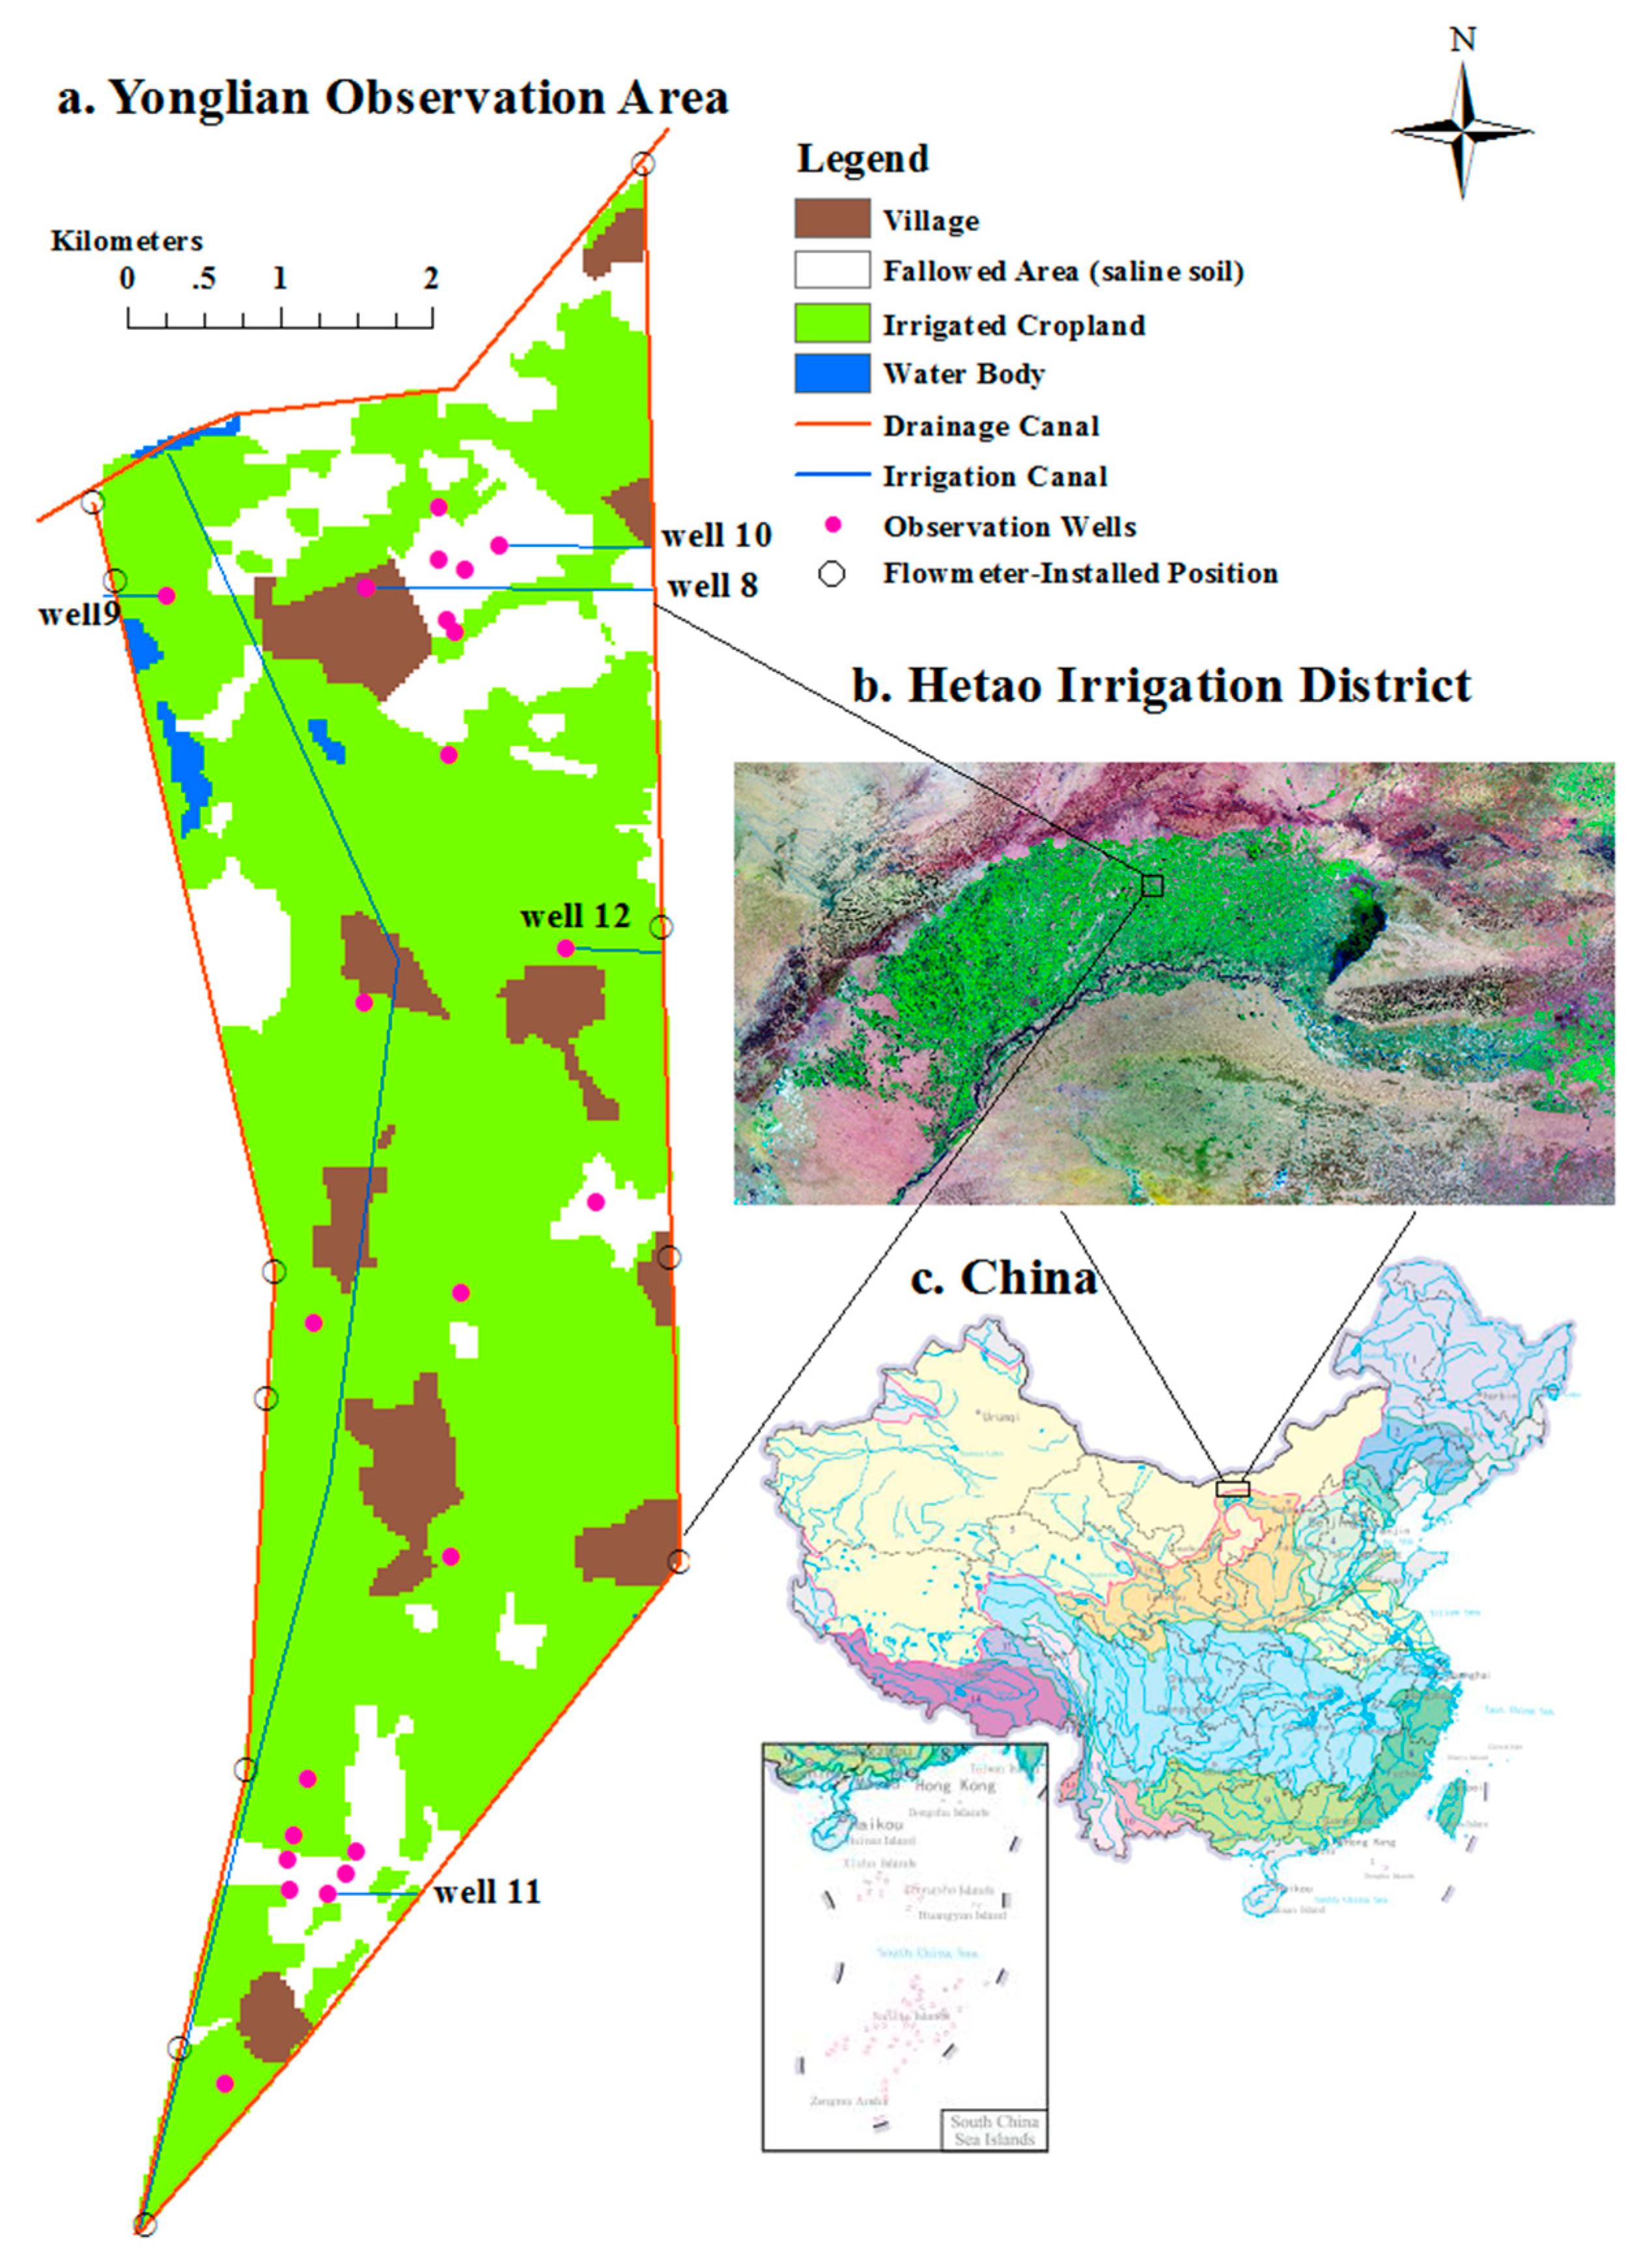
The observations were performed at the Yonglian Experimental Station (YES) (Figure 1a) in the mid-HID, upper Yellow River basin (40°19′–41°20′ N, 106°10′–109°30′ E; Figure 1b), located in the Inner Mongolia Autonomous Region, China (Figure 1c). The area totaled 2900 ha, which included 71.4% irrigated cropland, 17.9% fallowed areas, 9.7% villages, and 1.0% water bodies (detected by Landsat 5 images, date: 1 August 2007 and 30 July 2009). There were four blocks of fallow areas that were randomly distributed, 10 blocks of inhabited areas, and three water bodies. Sunflower and various melon seeds accounted for half of the cropland areas, as the HID is the largest sunflower-growing region in China [25,26]. The predominant soil was silt loam, and the soil texture was comprised of sand (8.91–16.69%), silt (52.32–70.57%), and clay (13.72–35.66%). The bulk density ranged from 1.35 to 1.51 g·cm−3, differing with the soil profile [25].
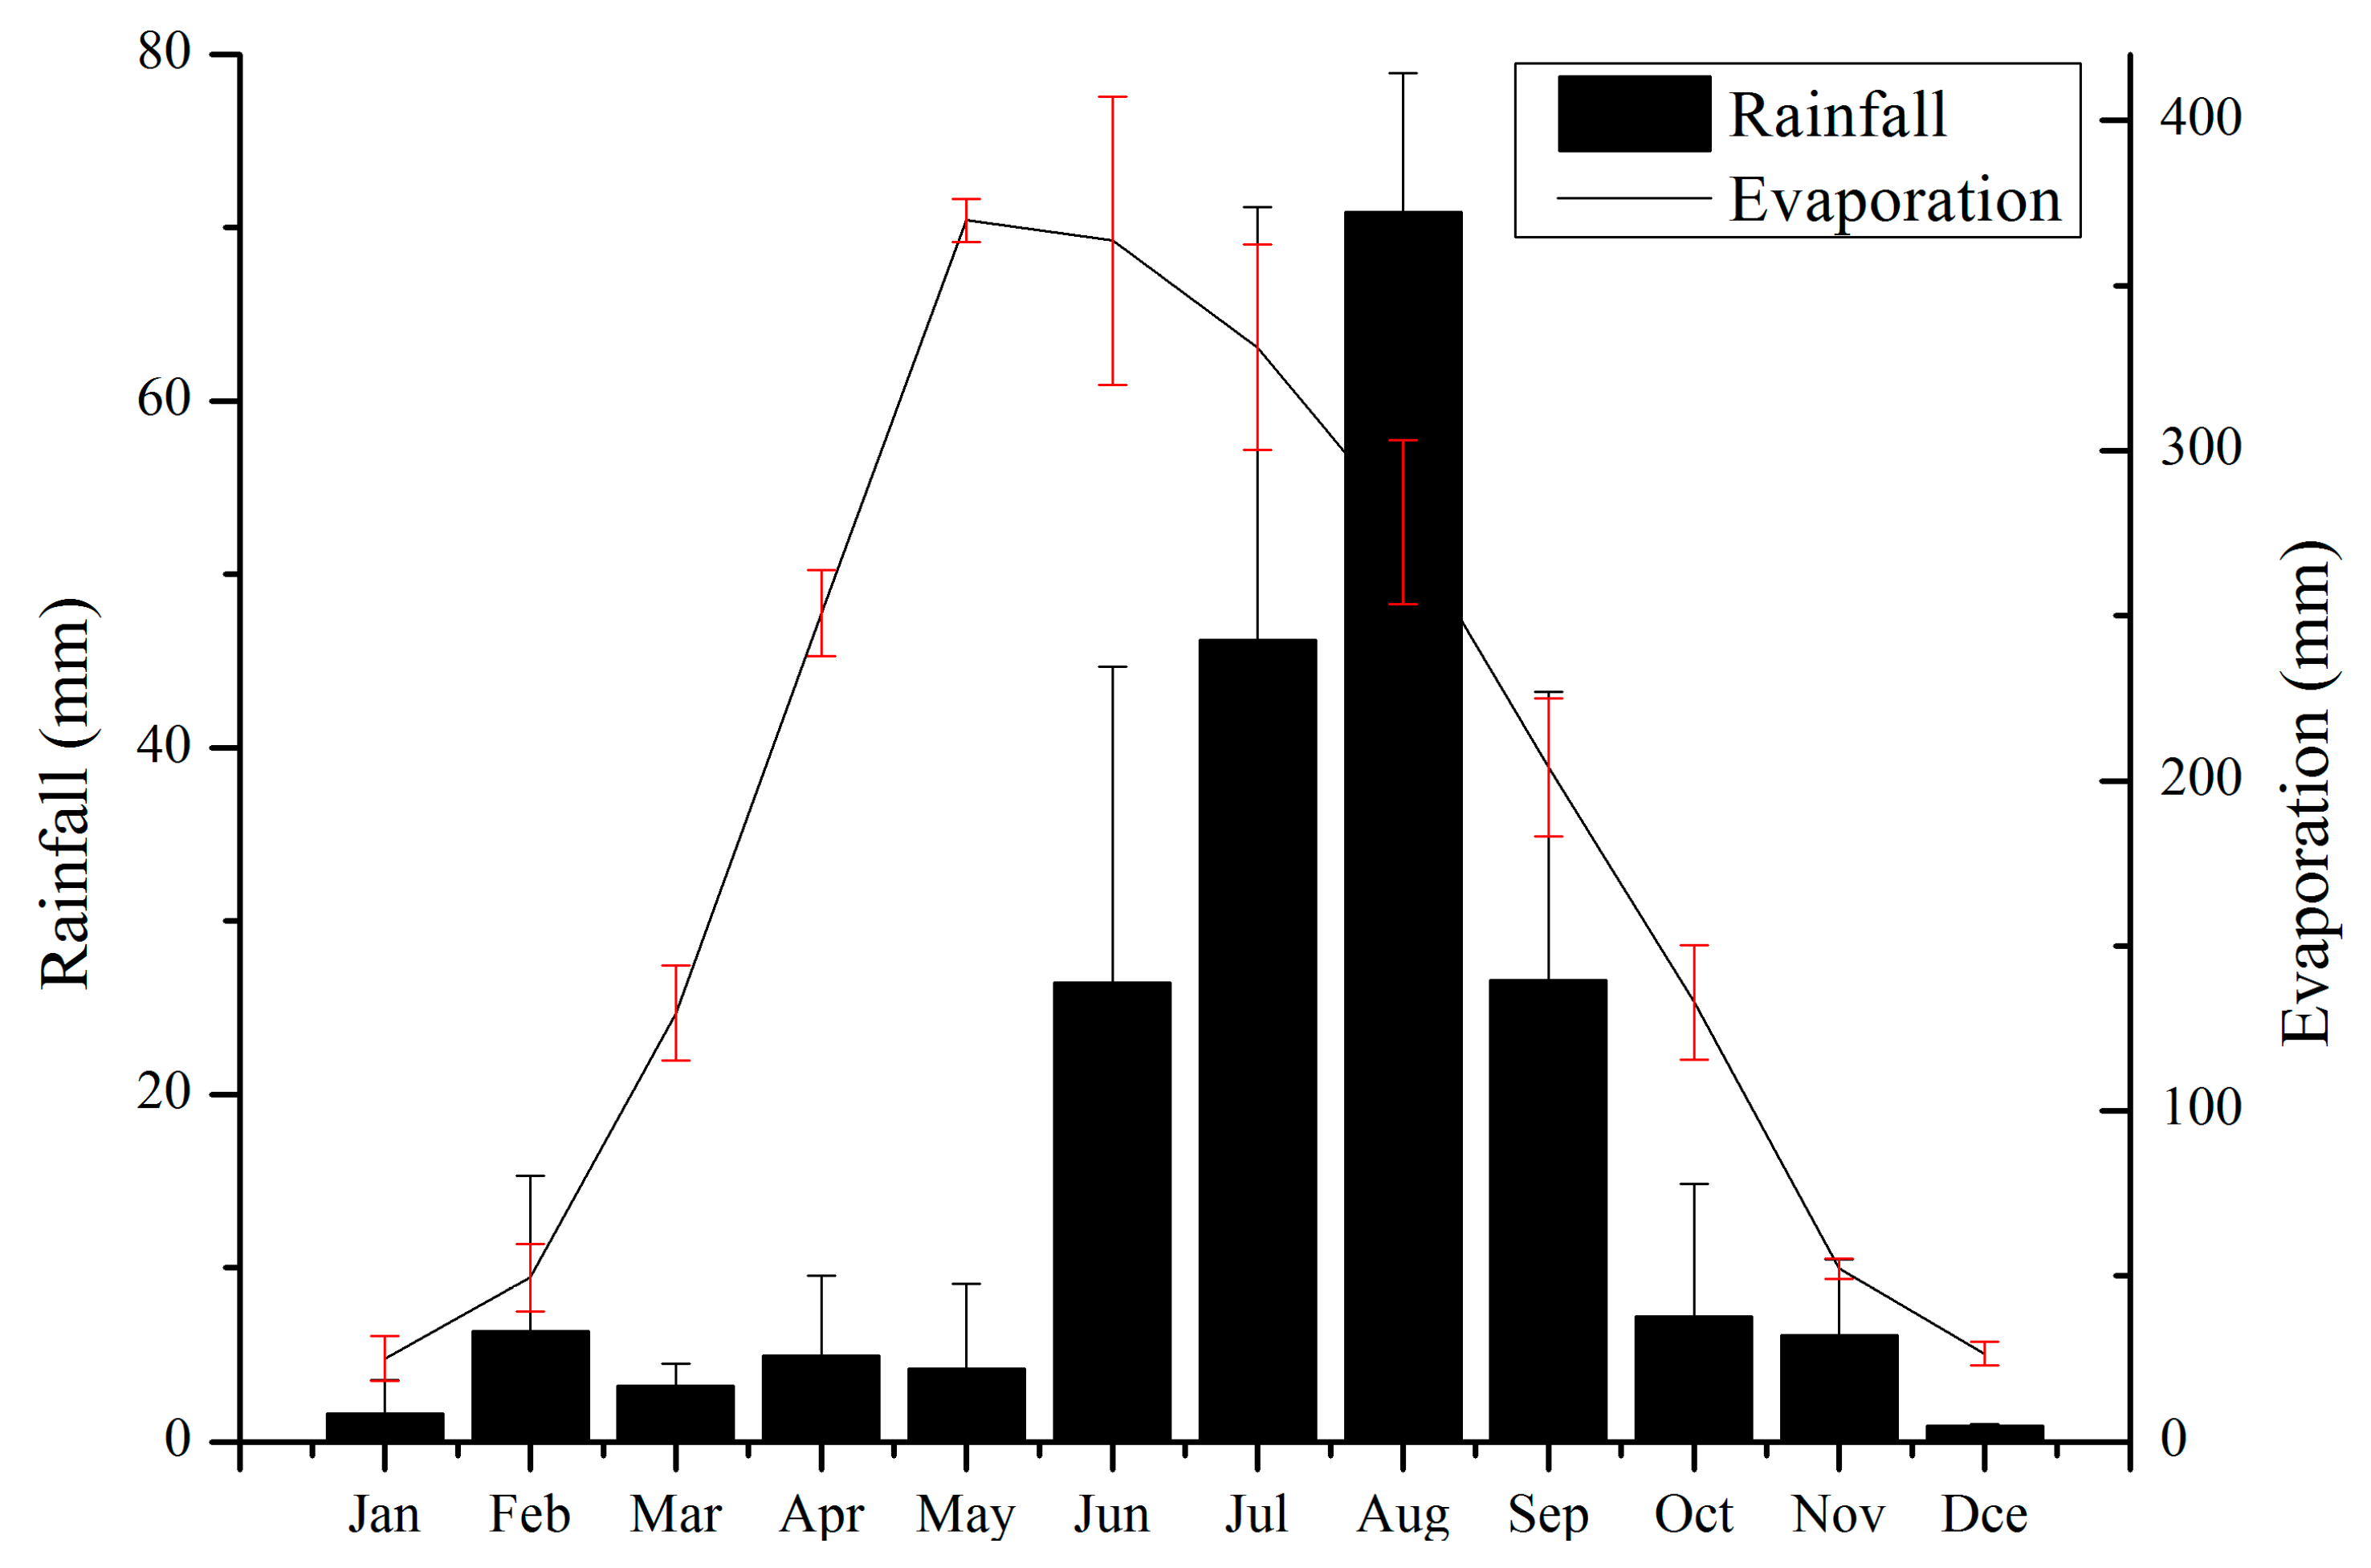
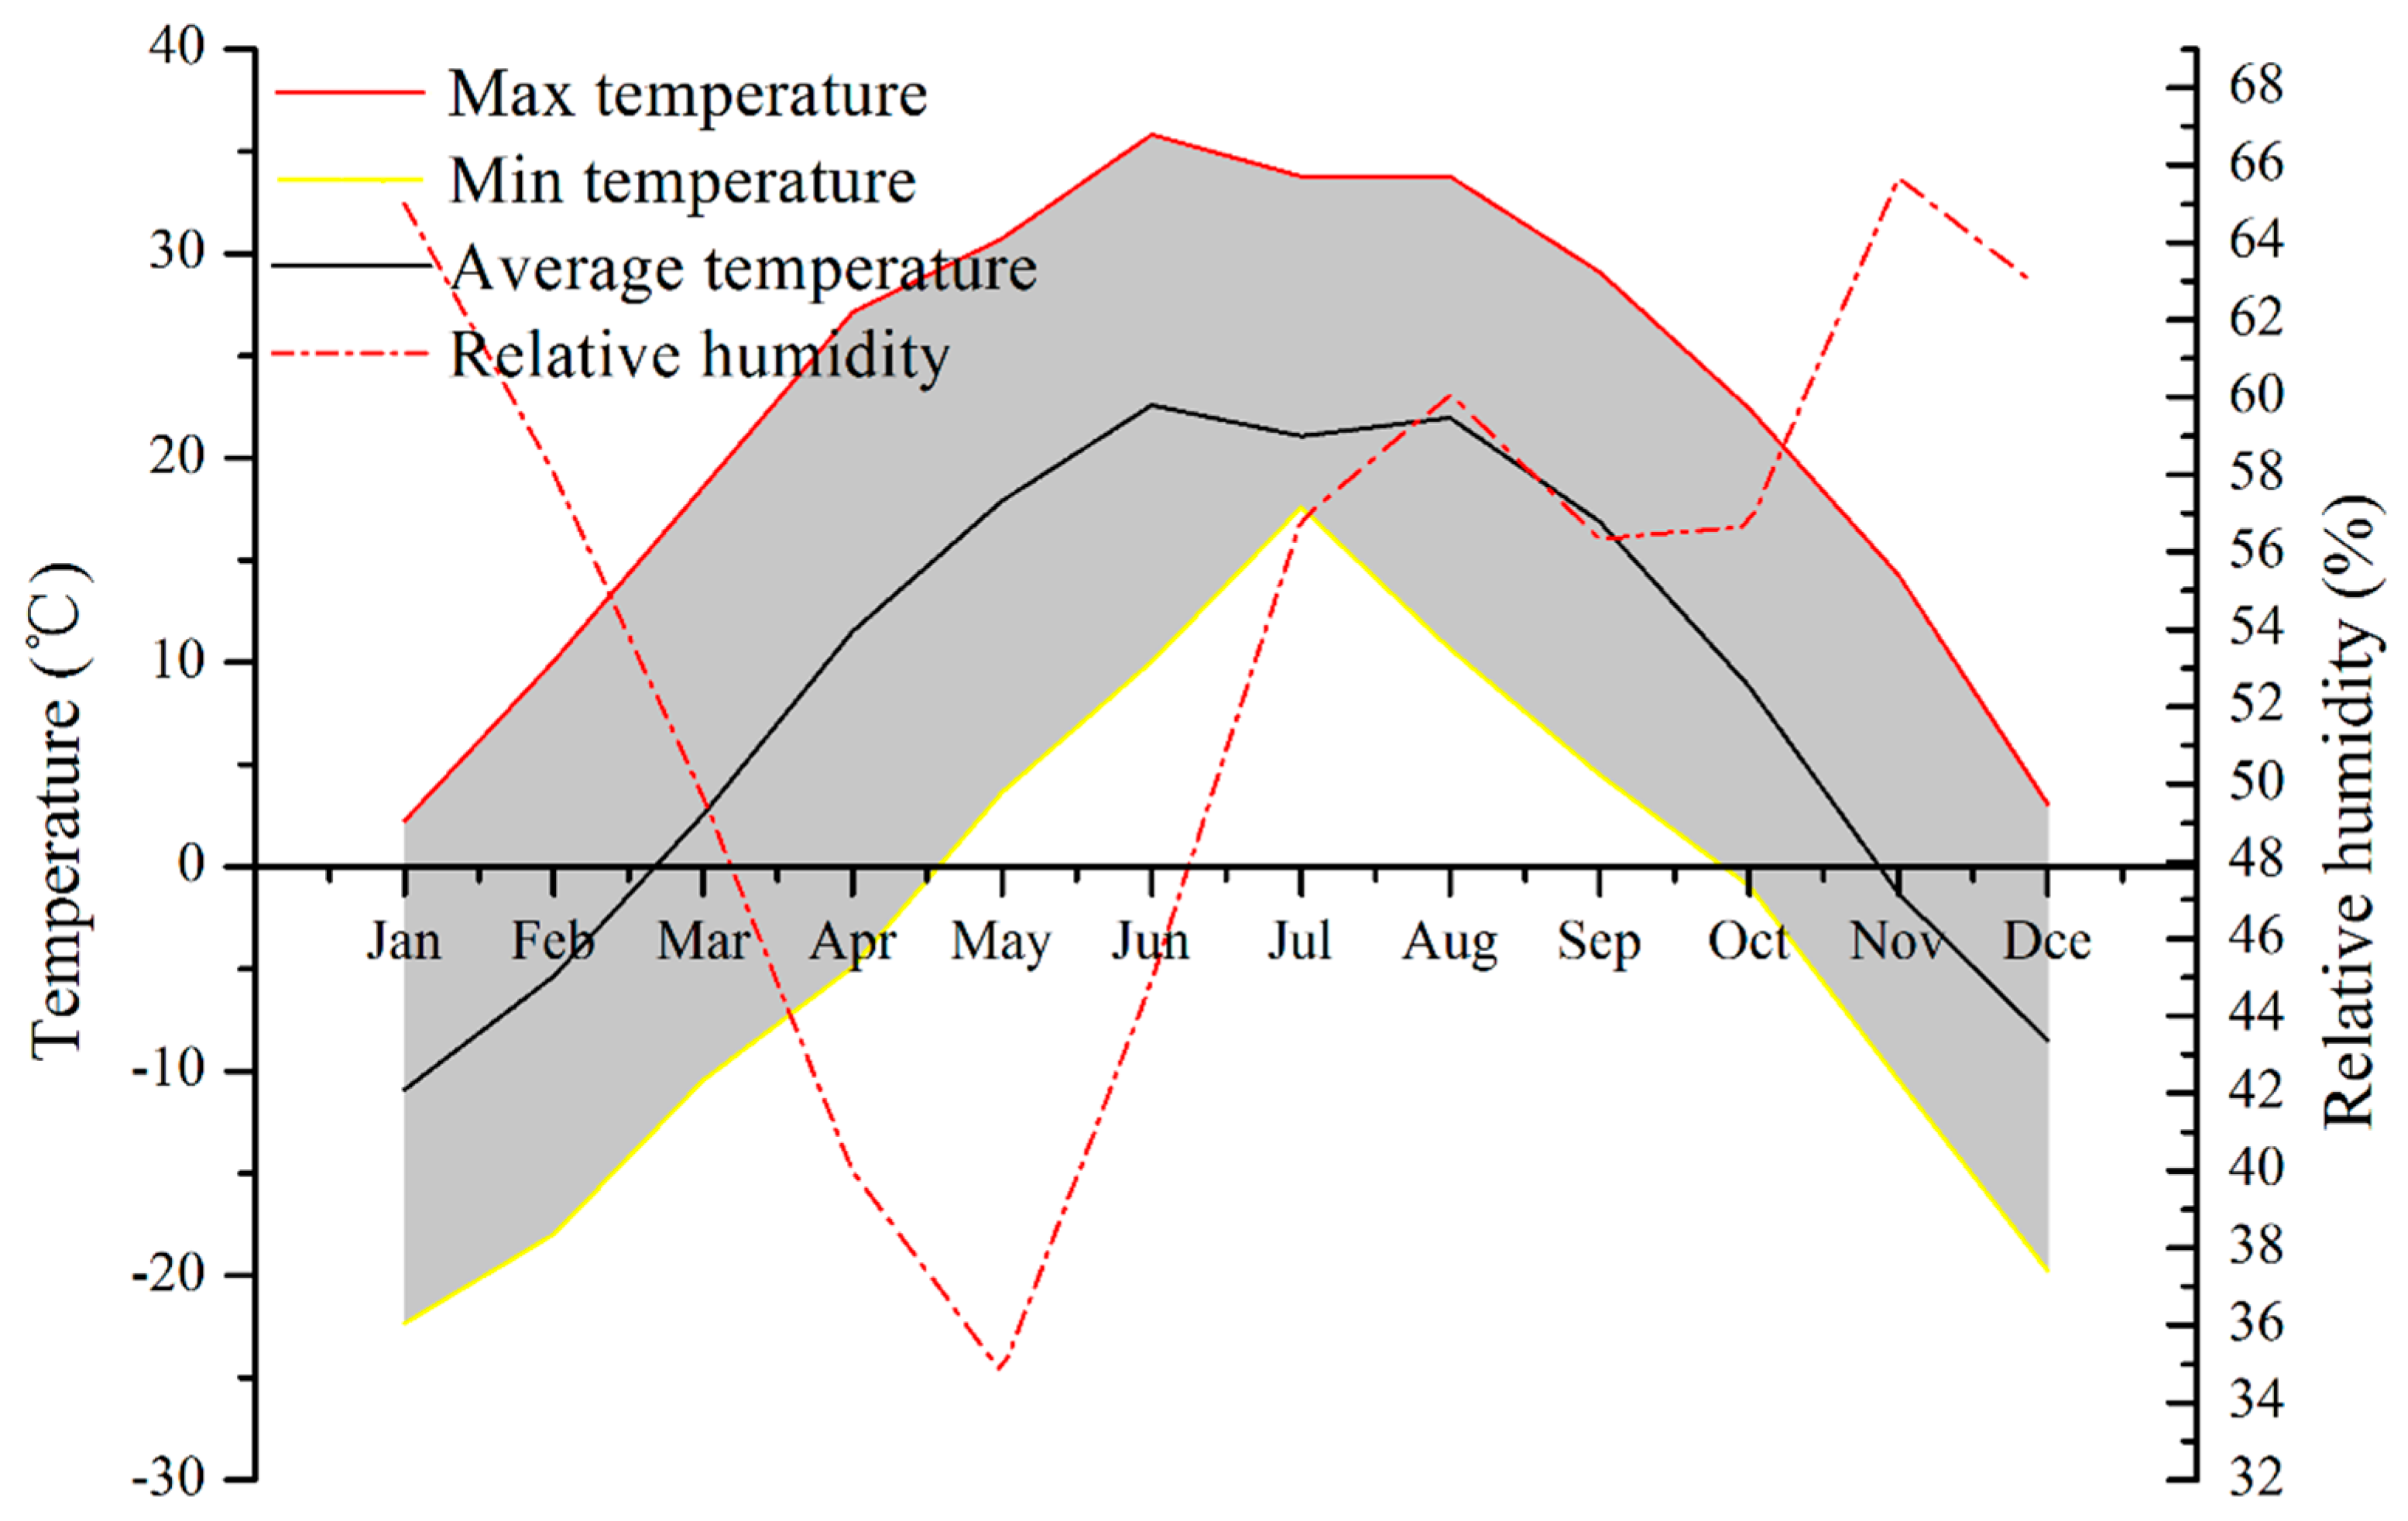
The mean annual potential evapotranspiration was as high as 2200 mm (Φ20 cm evaporation pan), while the average precipitation was only 170 mm annually, mostly (63–70%) during the monsoon season (June to September) (Figure 2). The hydrometeorological data (2007–2011, hourly meteorological data, e.g., P (precipitation), air temperature, the wind speed at a 2 m height above the ground surface, radiation, and relative humidity) were automatically recorded by the meteorological station, and the mean monthly air temperature together with the relative humidity are shown in Figure 3.
2.2. Observations and Data Collection Design
The irrigation and artificial drainage water amounts were measured daily at the inlet and several control points with flowmeters. Eleven flowmeter-installed positions (FIP) were set up along the inlet irrigation and drainage canals (Figure 1, left). The local farmer irrigated the crop with water from the Yellow River by flood (surface) irrigation. The drainage water amount for the observation field was calculated by sectioning according to the controlled areas for each flowmeter with the percentage of the irrigation areas on both sides of the drainage ditches. Observation wells were installed to monitor the groundwater variation, and the wells were placed perpendicular to the water flow. The four wells were chosen to calculate the water/salt balance and to analyze the amount of dry drainage water of the DDS with the distributed locations and cover areas of the fallow area (well 8 and well 10 located in the north fallow, well 12 in middle, and well 11 in the south fallow, the areas of which were 90, 110, 135, and 105 ha, respectively). Well 9 represented irrigated cropland in the north for the comparison of dynamics with fallow areas in the analysis of water and salt transport and salt accumulation in the DDS.
GTD and the corresponding electrical conductivity (EC at 25 °C) were monitored every five days and once per day during an irrigation event. The water samples (e.g., irrigation water, drainage water, and groundwater) were collected in 550 mL clean polyethylene bottles. Soil samples were taken by hand auguring near the observation well at depths of 0–10 cm, 10–30 cm, 30–50 cm, 50–70 cm, 70–100 cm, and 100–140 cm. Soil moisture was determined using a regular gravimetric method (oven-dry) and measured every 10 days. The EC1:5 of the soil water extract and the EC of the water samples were measured using a digital conductivity meter (DDSJ-308A, Leici, Yidian Co., Ltd., Shanghai, China), and the SSC was measured using a drying method.
2.3. Conceptual Model Description
The amount of lateral water migration from irrigated to fallow areas is represented by the dry drainage depth, which was estimated from the water and salt balance in the fallow areas. The water and salt balance was then calculated from the amount of water measured in the inlet and the outlet, and their corresponding salinities. For each fallow block (i), regarded as a balanced unit of soil water and groundwater, the water balance was calculated using the following [15,28]:
where Ddi (mm) is defined as the dry drainage depth for the fallow area (block i, dimensionless), using the wells that were located in the fallow area for presenting the blocks of wells 8, 10, 11, and 12 for calculation in each fallow; ΔS (mm) and μΔH (mm) are the storage capacity change in the soil water and in the groundwater, respectively, with the corresponding time interval from the first irrigation event in May to the autumn irrigation in October every year, which are estimated from the dynamics of soil water content and GTD; μ is the specific yield, measured by the local hydrological bureau with a dimensionless value of 0.033 [15,28]; P is the precipitation of the corresponding time interval (mm), where the daily P is collected from the field meteorological station (self-recording); and Ei (mm) is the total evapotranspiration of the fallow area, which was calculated using the Penman-Monteith equation and the corresponding crop coefficient. As there was no irrigation event in the fallow area, Ei (mm) was mainly due to the groundwater evaporation. We used Block i to verify the result of Ei. The groundwater evaporation was calculated for each block using the empirical equation in Equation (5) as follows [29]:
where C is the groundwater evaporation coefficient defined by the ratio of the evaporation from the free water surface to the evaporative intensity of the groundwater, as shown in Equation (3); Eg is the evaporative intensity of the groundwater (mm); and ε0 is the evaporation from the surface of free water (mm). C is a function of the GTD for the same soil, which was silt loam in the study area, as shown in Equation (4), where Hi is the average GTD for the calculation block (i) with the corresponding period (m).
3. Results and Discussion
3.1. Dynamics of GTD and GEC in the DDS
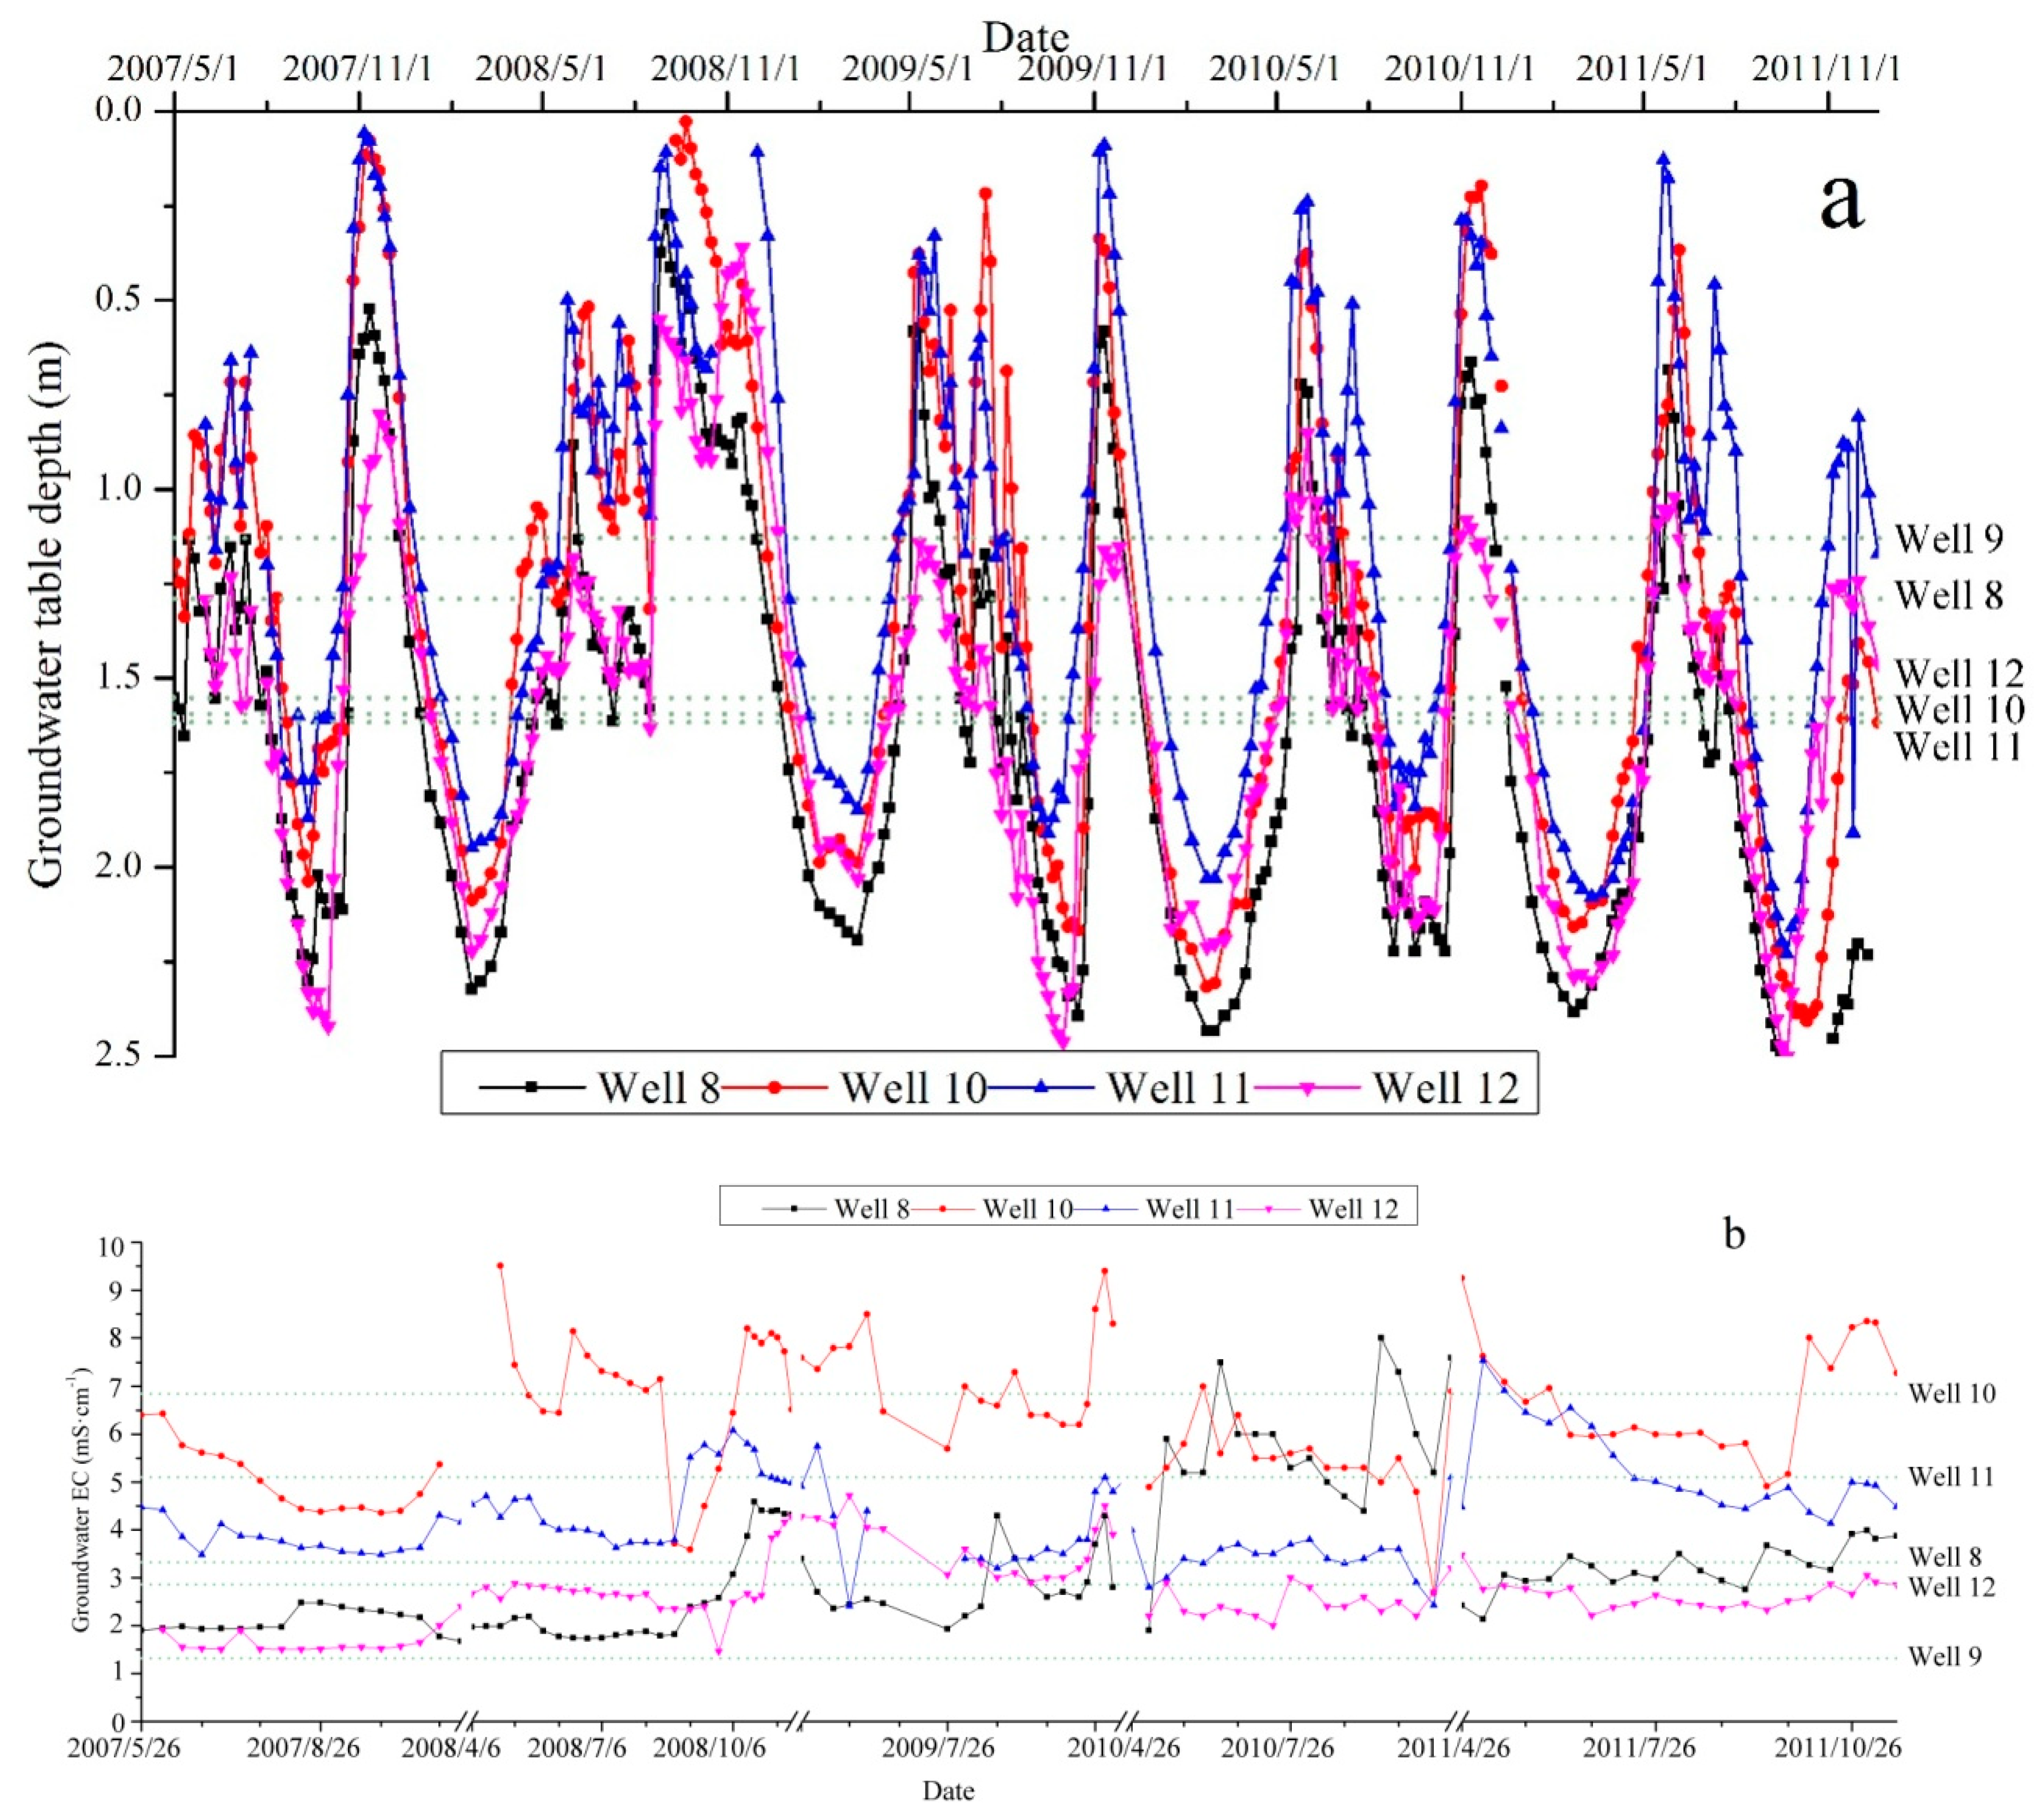
The fluctuations in GTD from May 2007 to December 2011 in the four fallow blocks are shown in Figure 4a, represented by wells 8, 10, 11, and 12, respectively. The average GTD was about 1.6 m during the growing season in the observation area, varying from 2.8 m in February up to the soil surface (less than 0.5 m) in November. The dynamics of the GTD for the four fallow wells fluctuated periodically with the irrigation events from the surrounding cropland. The lateral migration process of groundwater between irrigated and fallow areas was obvious and intense, particularly during the autumn irrigation period, where the duration usually ranged from mid-October to early December. Autumn irrigation was a flood (surface) irrigation event for all cropland in the fallow period, and the irrigation amount was almost two to four times the other irrigation events during the crop growth stages, which were not full irrigations and depended on the water demand of different crop types. Irrigation in May was mainly for sunflower seeding, winter wheat, and melon pre-irrigation, whereas irrigation from June to September was for maize and various pastures.
For a closer examination of the dynamics of the GEC between the irrigated and fallow areas, the GEC from 2007 to 2011 in four fallow blocks is shown in Figure 4b, which indicates that the GEC of the fallow areas always experienced considerable fluctuations following the irrigation events of the surrounding irrigated cropland. The greatest variations in EC ranged from 3.5 mS·cm−1 to more than 10 mS·cm−1. The maximum and minimum values occurred before and after the autumn irrigation, respectively. The dynamics of the GEC were relatively stable during the crop growing stage.
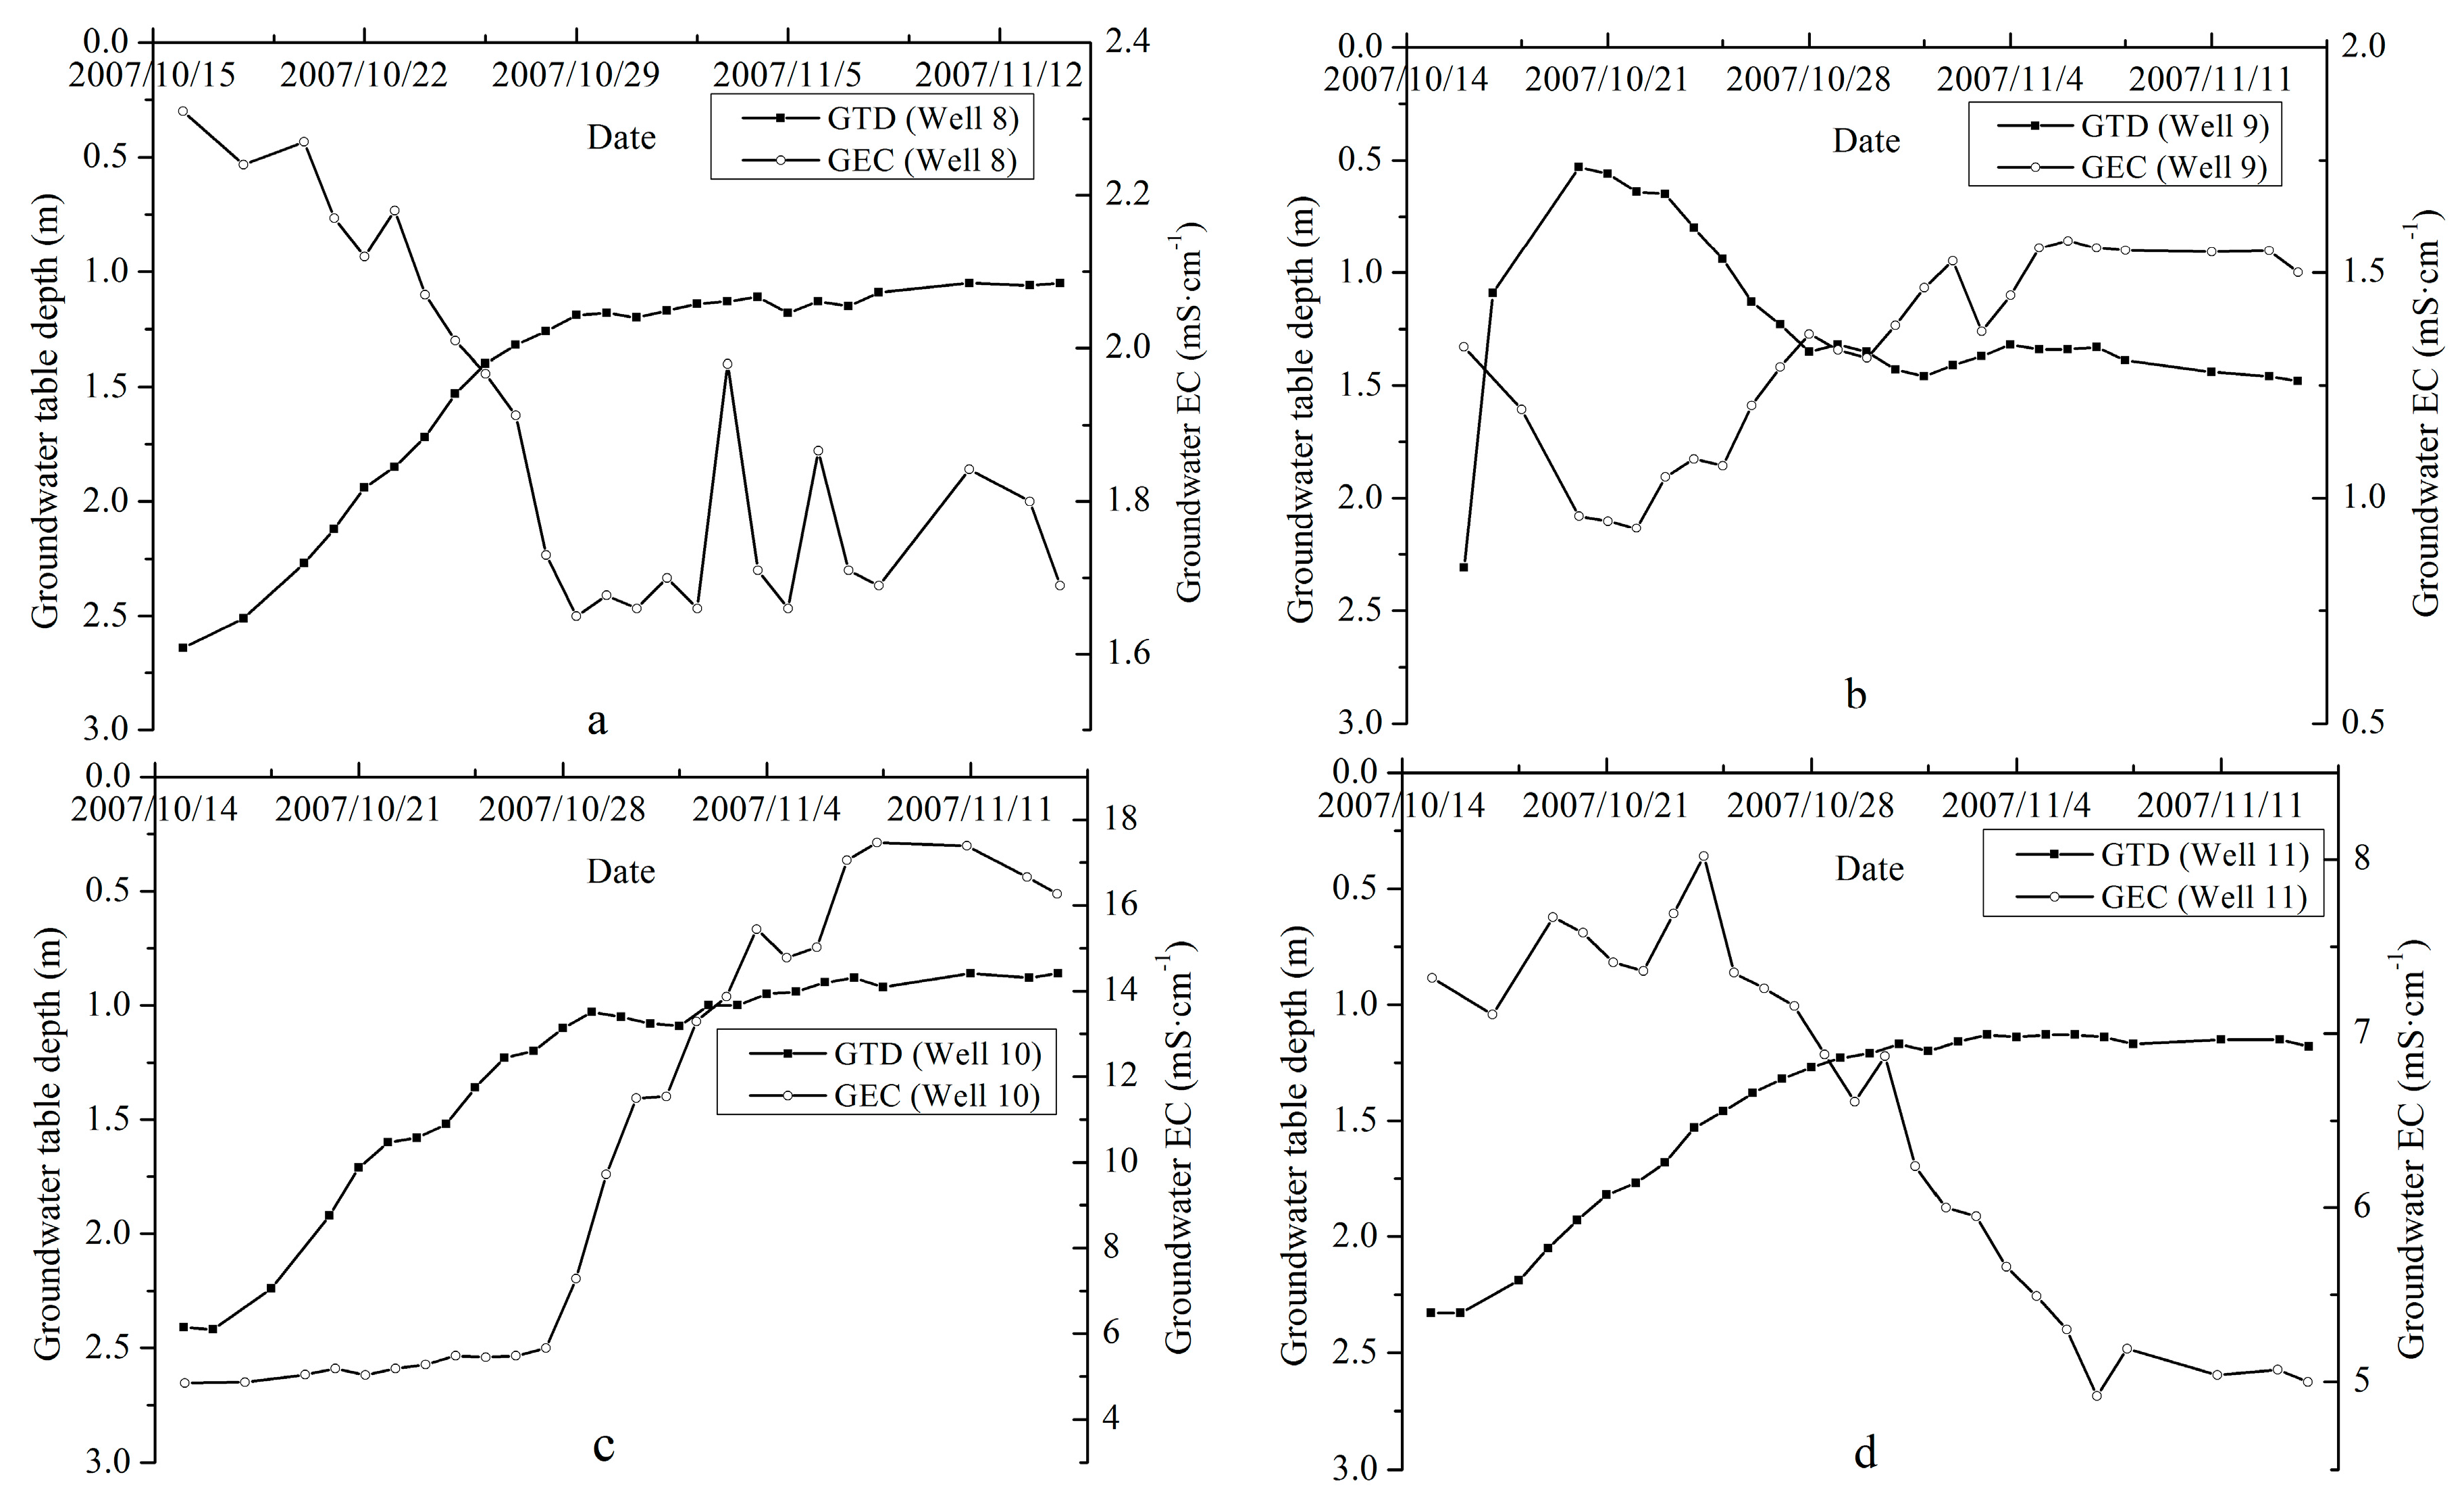
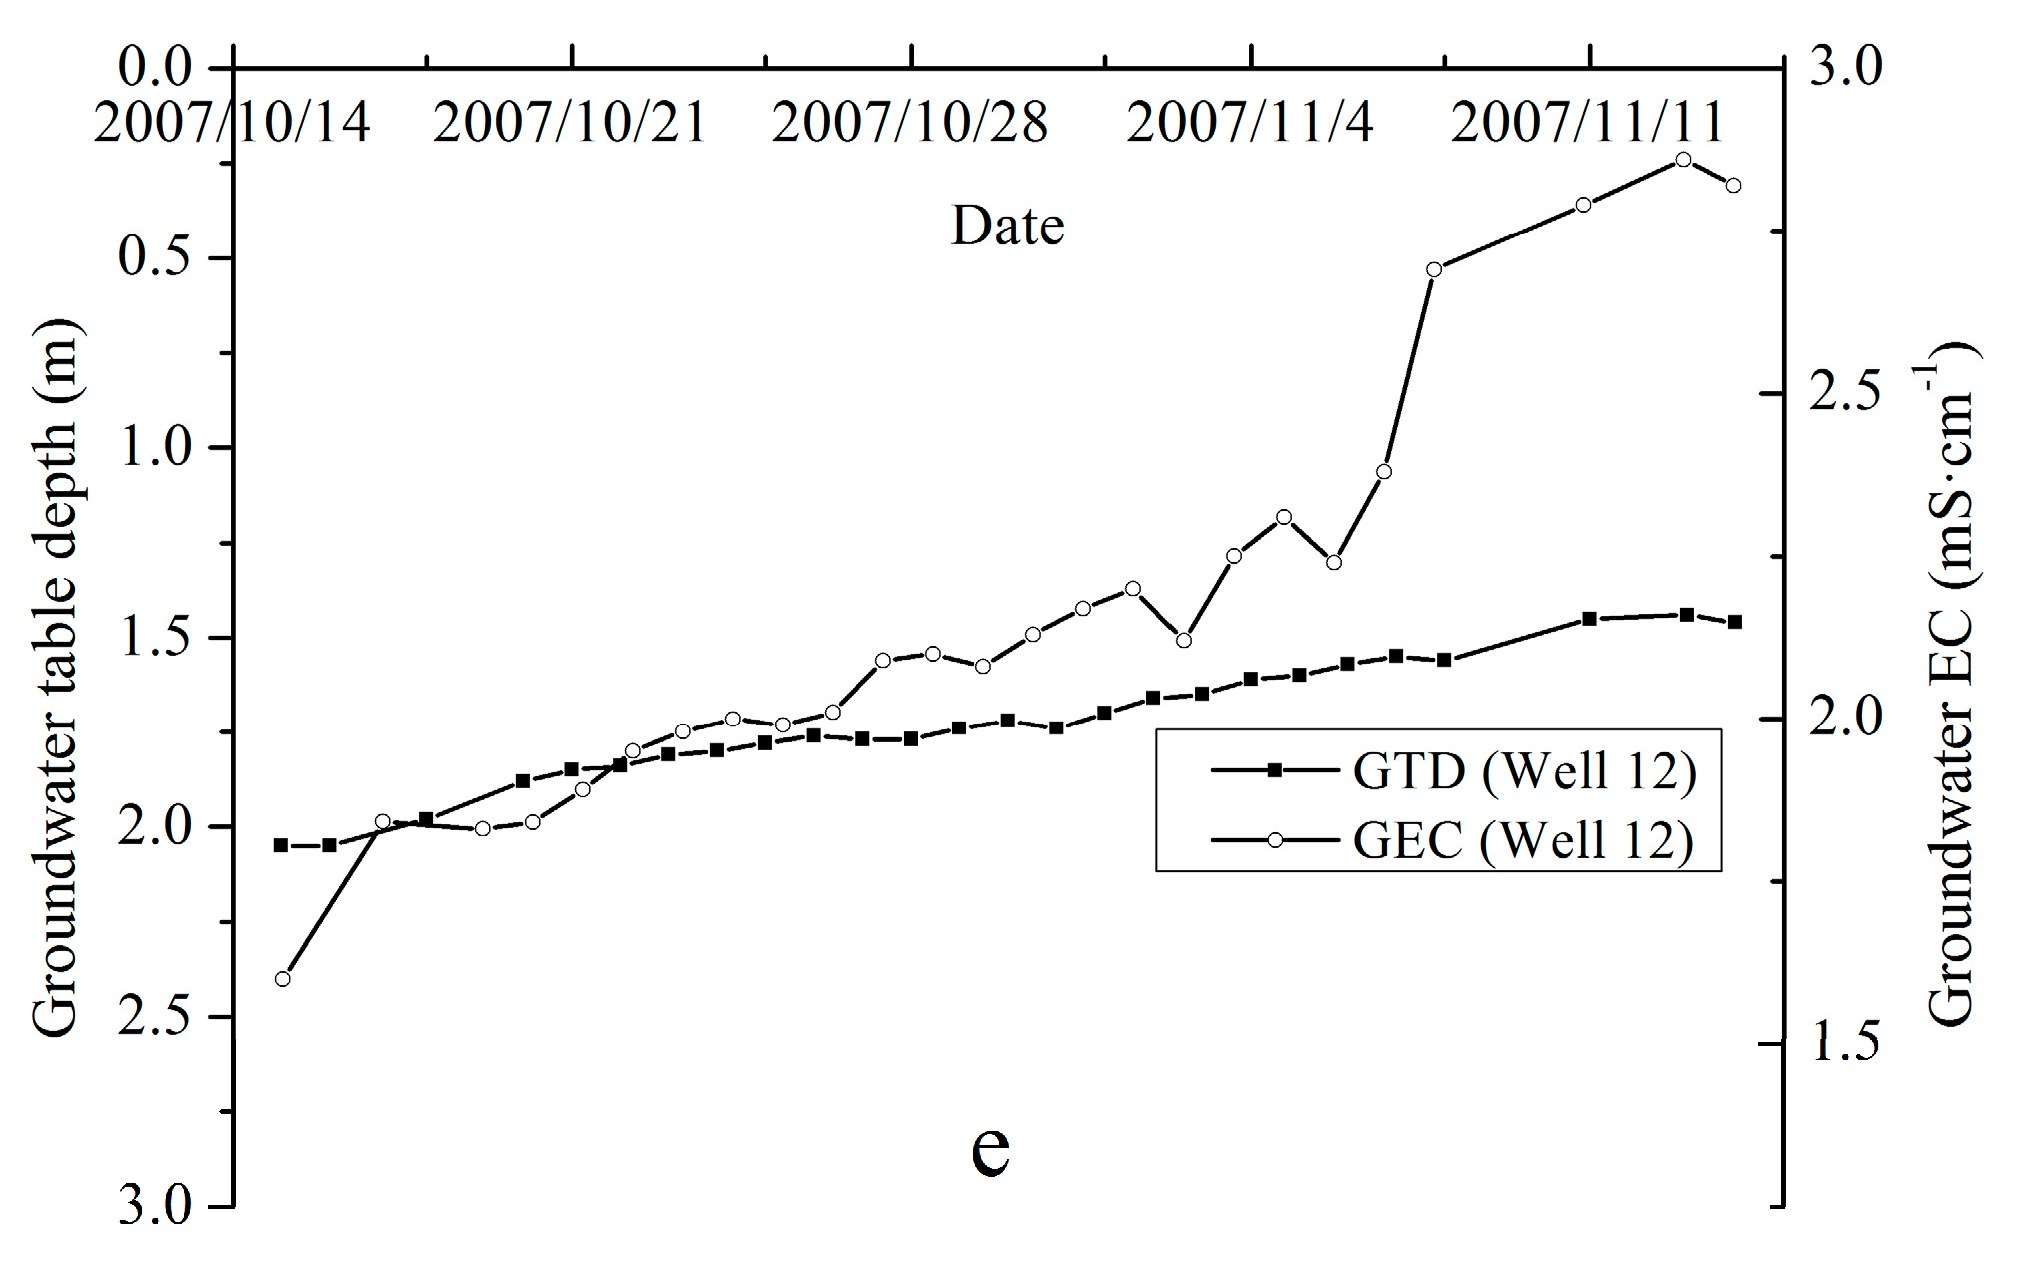
We chose the dynamics of well 9, which was located in irrigated cropland (Figure 5b), and the abovementioned four fallow wells during the autumn irrigation period for a specific description for one month from 14 October to 14 November 2007. Autumn irrigation commenced on October 14 for well 9 and the GTD rose steeply from 2.3 m to the soil surface about two days later, before decreasing to 1.5 m with redistribution and drainage (Figure 5b). The GEC below the irrigated croplands fluctuated with an initial slight decrease, reaching the lowest value of 0.9 mS·cm−1, and finally exceeding the initial value, with little change around the value of 1.5 mS·cm−1. The whole process of GEC below the irrigated croplands varied minimally, showing a trend of slight increase due to the deep percolation and the salt in the root zone leaching out continuously with the end of redistribution. Notably, the GTD in the fallow areas quickly responded to the irrigation from the surrounding cropland without being directly recharged by irrigation (Figure 5a,c–e). The GTD increased in a straight line more slowly compared with the cropland (well 9), and varied from 2.5 m to the soil surface along with the progressive groundwater lateral migration recharge. The increasing process was sustained until the freezing process began, which was different from the croplands. The GEC below the fallow area experienced different variation trends with different initial values, irrigation times, and fallow locations. The GEC below well 8, which was located in the village and adjacent to a road, was not like the other fallow wells located in the middle fallow areas. Well 8 had a decreasing trend and large variations during the final autumn irrigation period (Figure 5a). The other fallow wells continuously increased between the autumn irrigation period, especially for well 10, which increased from 5 mS·cm−1 to 15 mS·cm−1 (Figure 5c). Well 12 demonstrated the same increasing trend to 2.8 mS·cm−1. Well 11 fluctuated with an initial slight increase, reaching a value of 8 mS·cm−1, and finally showing a decreasing trend with redistribution and drainage (Figure 5d).
Another interesting finding was the process of increase in GTD, which presented some differences between irrigated and fallow areas. The increase in GTD below the fallow areas decreased for 10 days after the autumn irrigation event, and then displayed a slightly decreasing trend toward the soil surface, whereas the GEC sharply increased with the end of the water redistribution. The GTD reached the soil surface after two days and 15 days of autumn irrigation in the irrigated croplands and the fallow areas, respectively. During the increase in the GTD below the fallow areas, the salts that had accumulated in the fallow soil profile began to dissolve until the lateral groundwater recharge reached equilibrium. This means that a steeply increasing process for the GEC below the fallow areas occurred. However, the GEC finally decreased if the initial value was larger than the lateral migration flowing water. So, as shown in Figure 5a,d, the dynamic trend depends on the initial value, the location, and distance, and the irrigation management. The salt also drained away from the soil profile of the irrigated and fallow areas during the irrigation and drainage processes. This means that the salt in the soil profile redistributed under the two processes, making room for its storage and accumulation in the next crop growth stage.
As we compared the processes of water diversion and the dynamics of GTD, the fallow areas produced good responses to the irrigation events of the surrounding croplands, and the GTD rose near the ground surface with the recharge of the groundwater transverse flow from cropland irrigation. However, this process had little salt leaching function; the salt accumulation in the observed areas is shown in detail in Table 1. As Table 1 shows, the salt accumulation in the soil profile had an increasing trend from 2007 to 2011. The croplands (we use superscript 1 to represent the Location line of Table 1) have different increasing trends during five years. The dynamic change in GTD in fallow areas indicates that the process of lateral groundwater migration from the irrigation croplands recharges the fallow area continuously and increases the salt content simultaneously.
3.2. Inter-Exchanges of Water Transport of the DDS
The computed water transport of the DDS for each fallow block from May to October over the five-year analysis is shown in Table 2. The computed items in the conceptual model included the changes in soil and groundwater storage, the evapotranspiration in the fallow areas, and the precipitation. The computed period was between May (the first irrigation event) and October (the autumn irrigation) each year. We found that the storage changes in the soil water content and the groundwater during every irrigation event presented considerably variations between each block and time. The former and latter varied from −128 mm to 2 mm and −75 mm to 165 mm, respectively. The comprehensive results together ranged from −109 mm for well 11 in 2011 to 128 mm for well 12 in 2008. Evapotranspiration from the fallow areas of each block was as high as 751 mm during the five-year ongoing data collection, and the lowest degree of evaporation, occurring in well 8 in 2011, was 216 mm. The precipitation was also different: precipitation in 2008 reached twice the annual average. The dry drainage depth was unstable, varying from 60 mm to 557 mm. The average water transport by the DDS for each block varied between 170 mm and 422 mm, demonstrating strong spatio-temporal variability.
The relations between storage change, evaporation, and rainfall and dry drainage depth are displayed in Table 2. All the computed items had positive correlations with the dry drainage depth during the various processes, especially the evapotranspiration in fallow areas, which determined the capability of the DDS in a given block or district. The rainfall and storage changes had weak correlations due to the different soil properties, GTD, soil quality, and the crop type. The synthesis of these numerous factors exerted a considerable influence on the capability of the DDS. The precipitation was discontinuous and heavy intensity rainfall was uncommon. Thus, it may not percolate to the deep soil profile or recharge the groundwater considering the high evaporation rate, so its effect on the DDS was not obvious. In general, the capability of the DDS was relative to a variety of influential factors, such as water table depth and size, the ratio of fallow to irrigated area, the crop species, and the distribution of the fallow lands in the landscape. It was difficult to regularly obtain generalized results and uniform reference criteria for the DDS, so the evaluation should depend on a typical and specific block or district with distinct management strategies.
The distribution type and location of the fallow areas exerted strong influences on the dry drainage depth. The fallow area where well 8 was located is situated in the margin of a village and adjacent to a road; it had the lowest drainage depth among the four blocks. The evaporation rate was mostly constricted by the hard road surface and the varieties of buildings. Observation wells 10 and 11 were located in the center of fallow areas, and the capability of the DDS here was greater than in the other blocks. This indicated that the distribution pattern of the fallow areas was a critical aspect when designing the DDS. However, the DDS is more likely to need a larger drainage area than artificial drainage, especially for subsurface drainage. Thus, whether land is a limiting factor for agricultural applications and for the long-term economic profit of the DDS should be evaluated. The dry drainage depth was one of the main factors for designing the ratio of irrigated to fallow lands for creating a sink area that also depended on other influencing factors mentioned above.
3.3. Water and Salt Balance
The five-year observations of water and salt balance are shown in Table 3. The application of irrigation water had little difference over the five years, and reached over 1000 × 104 m3, except in 2008, when it only reached 856 × 104 m3. The main reason for this was that a substantial precipitation event of 314 mm occurred, which was roughly twice the multi-year average precipitation. The dry drainage water amount was obtained from the multiplication of the DDS depth and block areas, ranging from 199 × 104 m3 (2011) to 296 × 104 m3 (2009). The amount of water transported from irrigated croplands to fallow areas was 1258 × 104 m3 over the five years, which was 4.3 times that which was moved by ADS. The TDS values of the irrigation and drainage water were 0.5 g·L−1 and 1.2 g·L−1, respectively, and the groundwater TDS ranged from 1.6 g·L−1 to 2.43 g·L−1. The salt imported with the irrigation ranged from 4366 t to 7657 t over the five years, and the sum of the imported salt was 33,013 t. The effects of the DDS and the artificial drainage were multiplied by the corresponding salinities of the groundwater and the drainage water, respectively. The corresponding salt movement by the DDS was, on average, 7.7 times that of the artificial drainage, with values of 27,472 t and 3575 t, respectively, and it was as high as 10 times in 2008 and 2010. The residual salt in the irrigated croplands varied over the five-year period according to the balance analysis. In the first three years, salt balance was well maintained. However, over the final two years, more than 30% of the imported salt was left inside the irrigated areas. Considering the 4.9% salt being desalinated from the irrigated croplands according to the five-year balance results, the DDS had an obvious function in maintaining the salt balance of the croplands. The salt balance for quantifying the effectiveness of the DDS was 27,472 t over the five-year timespan.
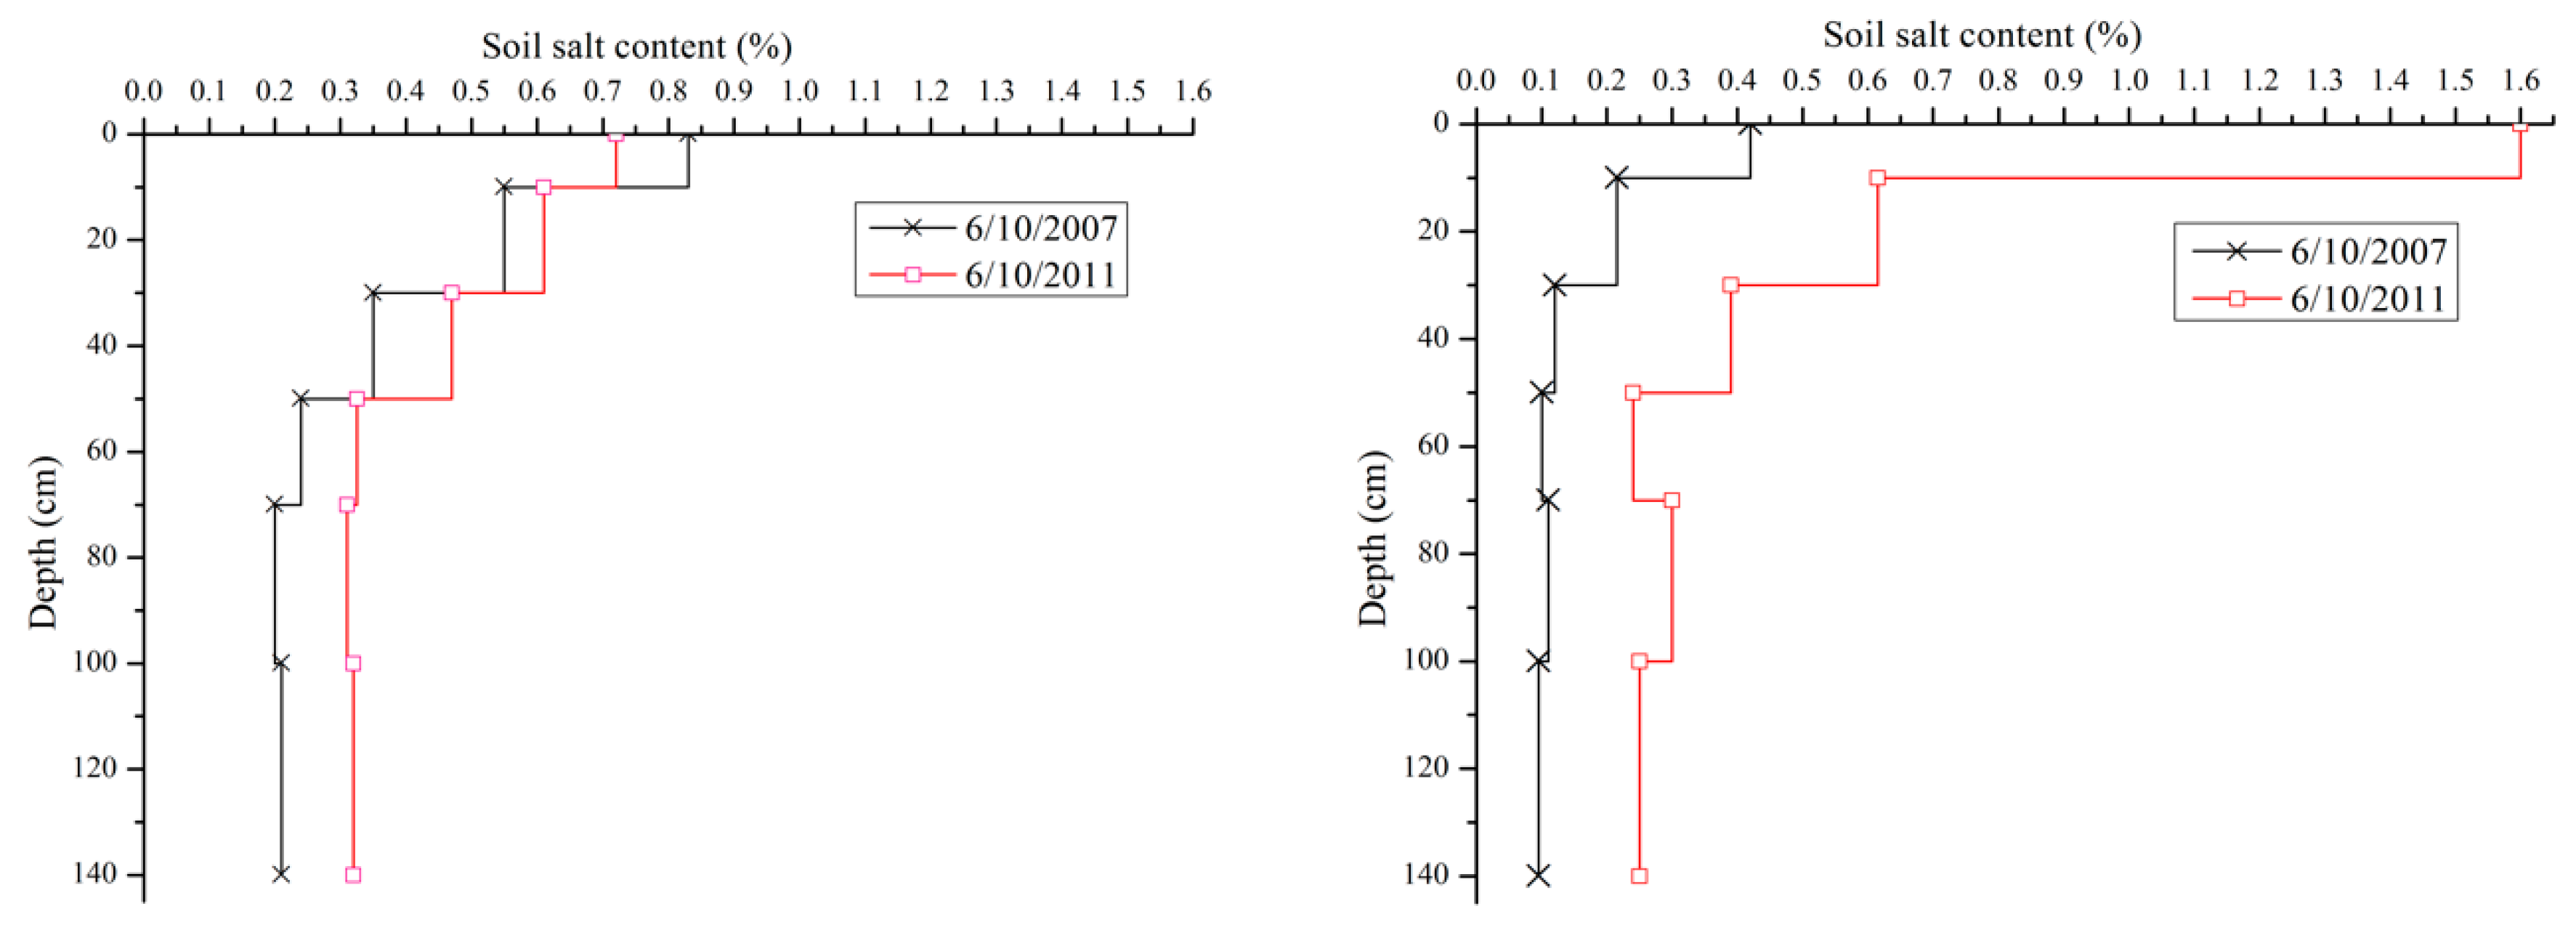
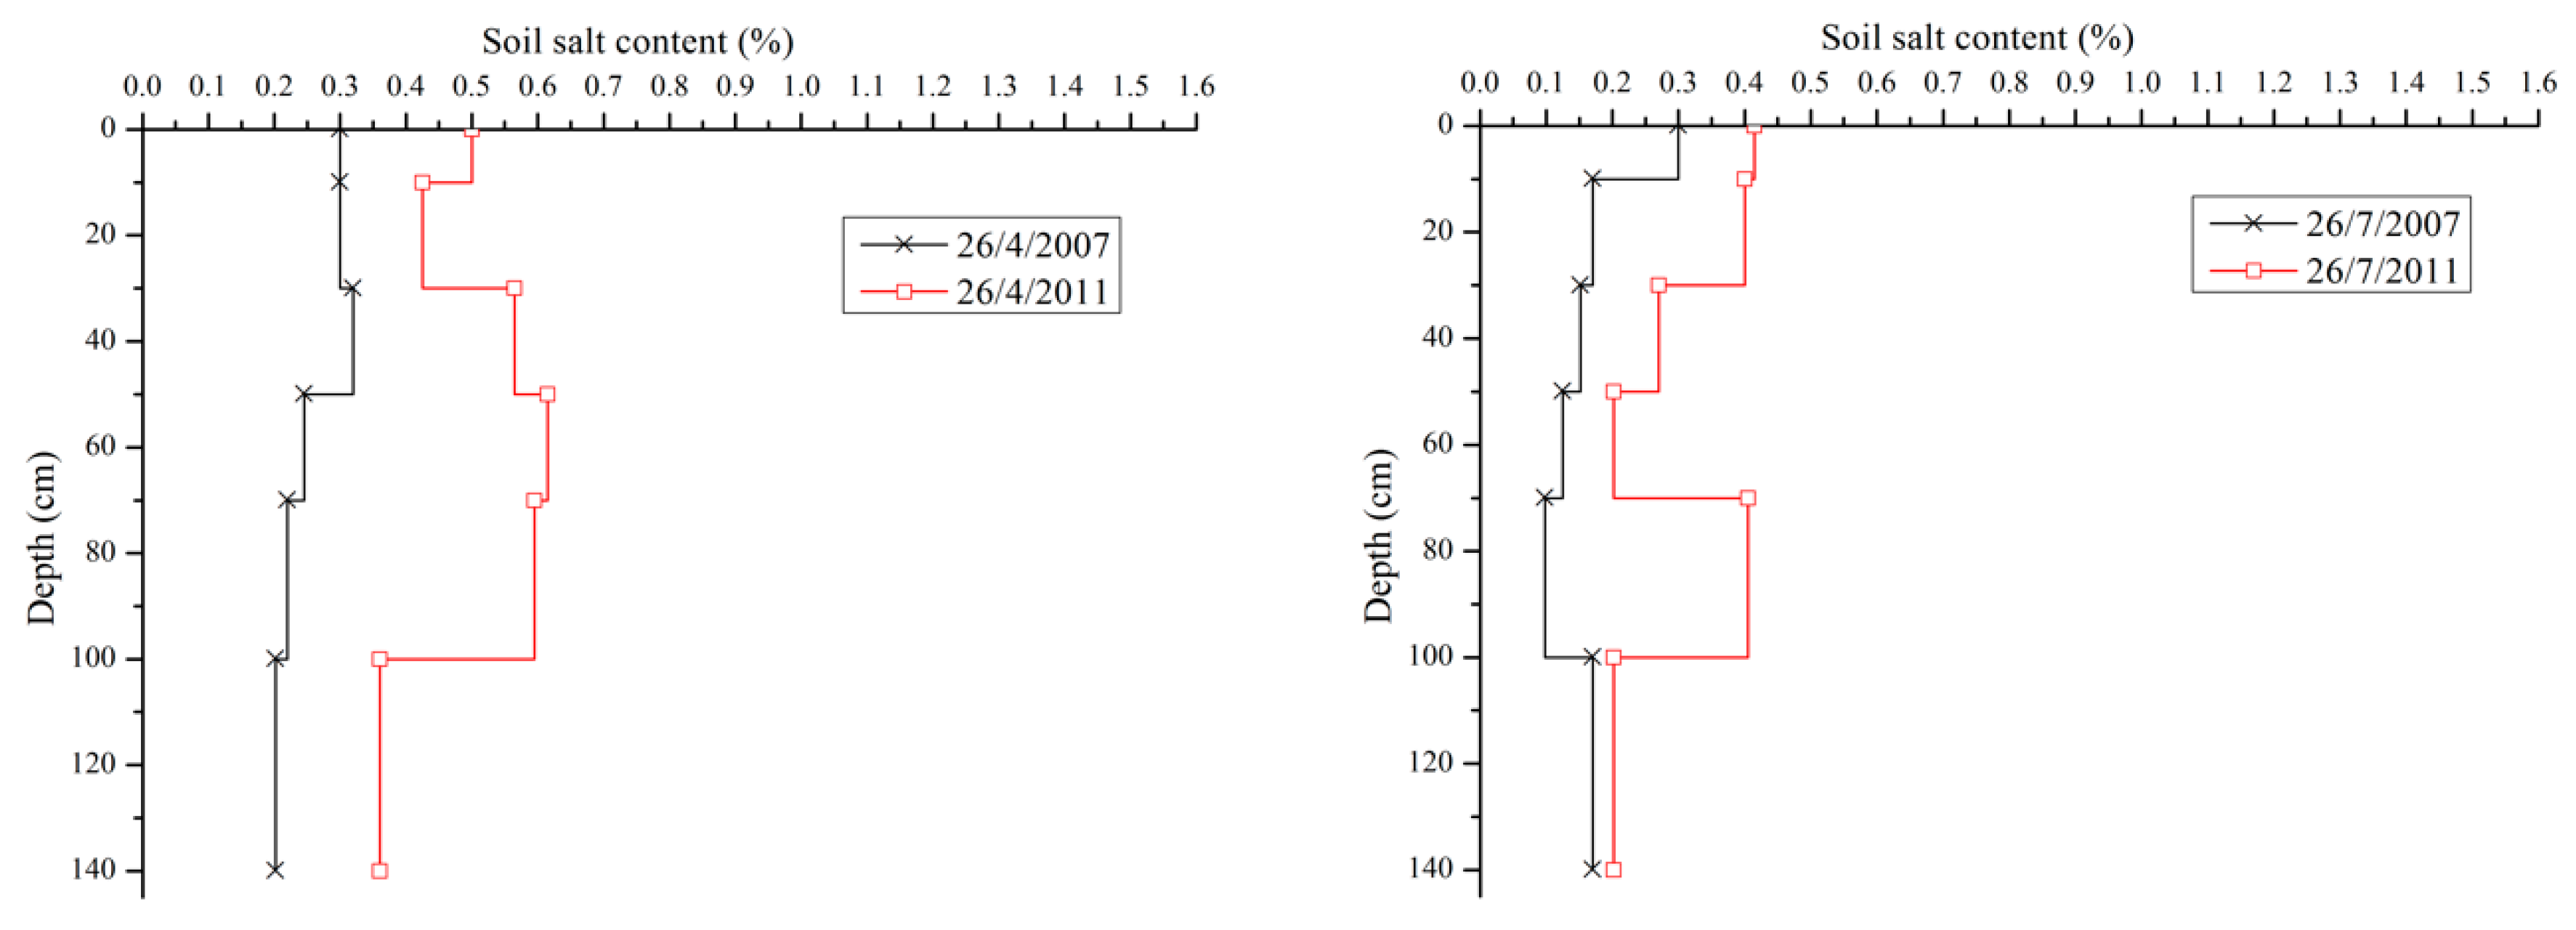
Figure 6 and Figure 7 show the SSC of the soil profile between 0 and 140 cm in the fallow areas and the irrigated croplands, respectively. The SSC increased over the five years, both in the irrigated and fallow lands, and the dynamic change in salt in the fallow areas had similar trends in the 140 cm soil profiles, as all the soil layers had almost equivalent increases, except in the topsoil. The soil salinity of the fallow areas increased four times and the deep soil profile had different degrees of increase (Figure 6). Well 8 was located in the margin of a road, and it had a thick and compact soil profile, so that upward salt movement was difficult, and salt mainly accumulated in the deep soil. Well 10 was located in the middle of the fallowed region; the salt accumulated in the topsoil more obviously. However, a variation in the increasing degree of SSC occurred in the irrigated croplands; this may have been decided by the different crop types and the irrigation plans (especially autumn irrigation). Figure 7 shows the dynamic change in two different seasons’ salt profiles. The irrigated cropland had slight salinity accumulations in the seeding and harvest periods. We concluded, by referring to Table 3, that the residual salt concentration in the irrigated areas was about 950 kg·ha−1. The SSC in the irrigated area reached a balanced state under the drainage effects of the DDS; with other drainage methods, the salinity in the soil profile did not reach this threshold salinity for crops [17]. Table 1 also shows that, although the distribution of SSC was maintained at an appropriate degree, the salinization areas did not increase in the irrigated croplands, but the areas of moderate salinization increased, mostly in the fallow regions. Sunflower, the main economic crop species, is salt tolerant and exhibited a moderate sensitivity to salt. Residual salt in the irrigated areas gradually increased, which was partly due to the intensification of agriculture and massive land reclamation. Farmers irrigated fallow lands with the same scheme as used with irrigated croplands for salt leaching a few years after land reclamation, even though no crops were planted. The quantity of the fallow areas declined steeply with the government management strategy encouraging farmer activities in the reclamation of low-lying natural ponds or natural patches. With a lack of effective and timely management irrigation and drainage measures, more sediment is deposited in the drainage canal bed. Without an adequate outlet to remove leaching salts from irrigation districts, the excess water and salt remain and accumulate in the soil profile and the groundwater.
3.4. Effectiveness and Sustainability of a Dry Drainage System
One of the most important aspects for operating a DDS is the frequent and intense transverse flow of water from irrigated croplands to fallow regions [22]. The main concern with the management of fallow areas in a DDS is how to increase, or at least maintain, the evaporation rate from the bare soil surface and how to improve the efficiency of salt removal to accommodate large-scale intensive agriculture in the future [11]. A DDS would satisfy the water and salt balance demands, which also depend on the acreage of the irrigation district, the hydrogeological and climatic conditions, the ratio of fallow to irrigated croplands, and their distribution pattern [9,11,12,15,21,30]. The ratio of irrigated to fallow areas is a critical aspect for public policy makers when designing a DDS. In previous studies, it varied from 1 to 15, with many variations in influencing factors [9,11,18]. In this study, the ratio is about four. We deem that DDS is effective if the evaporation rates in the fallow areas exceed the lateral migration of water from the croplands. The average volume of transported water from the four blocks was 307 mm during the five-year observation, which was less than the evaporation of 453 mm in the fallow areas, which means that the current ratio could be higher.
To improve the capability of a DDS, a shallow GTD is often adopted. In the HID, natural patches maintain the DDS function, with its distribution regions usually being 30 cm lower than the adjacent croplands [21]. A study in San Joaquin Valley, California, U.S.A., proposed a 30-cm-deep excavation of a depression for achieving only the necessary evaporation flux from the groundwater in fallow areas [11]. However, the appropriate GTD should balance the ecological water demand of crops and vegetation, bare soil evaporation, and salt accumulation in the soil profile. This means that an optimum GTD is critical for leaching practices [9,12] and for agro-ecosystem sustainability [17]. An optimum depth of 1.4–2 m for tamarisk in natural patches obtained a desalination rate of 45–100% compared with the initial salinity. However, 26–48% of bare soil evaporation was reduced [21,22]. Therefore, a suitable GTD helps balance crop growth, regional ecology, and the DDS function.
The fallow areas not only act as an evaporation sink, but also as a salt repository. Water and soluble salts transport upward through capillary action that causes salt capping on the topsoil, deterioration of soil hydraulic properties, and ecological degradation in natural patches [9,21,31,32]. The driving force for capillary rise that is caused by a gradient of vapor pressure near the soil surface decreases since the soil profile is plugged by imported salts, which significantly impacts evaporation in the fallow areas [32,33]. As the salts continuously accumulated in the fallow areas (Table 1), the effectiveness of DDS may be questionable. Therefore, suitable management measures, such as excavation, tillage, or others, are required for maintaining a DDS’s capability. This needs additional costs (i.e., earthwork and machinery expenses) [11]. Recent studies showed that planting halophytes and salt-tolerant crops help mitigate the adverse effects of salt accumulation on soil permeability and porosity in fallow soil [34]. In the HID, natural patches distributed around the croplands, which grow varieties of halophytes, also promote the hydraulic gradient through root water uptake [19,21,22,23].
To summarize, we propose the following for the effective and sustainable use of a DDS. Firstly, intensive irrigation in accordance with leaching requirements (LR), about 0.2 in the local area, and sufficient fallow with an optimal distribution pattern for the DDS, are required to achieve a uniform distribution of salt accumulation. Secondly, a relatively shallow GTD must be carefully selected that satisfies both the LR and the balance as a valuable resource for plant root uptake of water in irrigation croplands with high evaporation rates at fallow [9,11,34]. Thirdly, suitable management measures, such as tillage, excavation, and cultivation with halophytes, are required to sustain the operation of the DDS.
4. Conclusions
The DDS is a potential approach for controlling soil salinity induced by irrigation, and can contribute to attaining and sustaining the salt balance in irrigated lands with insufficient ADS. The GTD in the fallow areas quickly responded to the lateral recharge from the surrounding croplands. The GEC of the fallow areas increased from 5 mS·cm−1 to 15 mS·cm−1, the excess water moving to the fallow lands was roughly four times greater than that moved by an ADS, and it contained 7.7 times more salts. The DDS played a more important role compared to ADS in draining excess water and salt in terms of many impact factors, including environmental and economic factors, and long-term interests. However, a slight salt accumulation occurred in the irrigated croplands and the SSC greatly increased in the fallow land. It is necessary to pay attention to the effectiveness and sustainability of the DDS in the long-term operation, and management practices must be applied to fallow areas, including groundwater table management and land use planning. From an aggregated perspective, more large-scale experiments, observations, and simulations should be performed on the DDS, including adequate demonstrations of both theoretical and practical concepts in multi-scale field tests in future research. The effectiveness and sustainability of DDSs need to be substantially evaluated by a co-operative effort with different expert disciplines in the fields of hydrology, agronomy, physiology, soil, and genomic science before engineering applications are introduced. Then, this alternative method for controlling soil salinity will be economical and more practical.
Author Contributions
The research article presented here was carried out in collaboration with several authors. C.W. and J.W. conceived the article idea and designed this study. C.W. and W.Z. performed the field experiment. C.W. and J.W. analyzed the data and wrote the first draft of the manuscript. W.Z. and Y.Z. modified and improved the manuscript. J.W., J.H., W.Z., and Y.Z. made significant suggestions for the methodology, data analysis, and manuscript writing.
Acknowledgments
This research was jointly supported by the 13th Five-year National Key Research and Development Program of the Chinese Ministry of Science and Technology (Grant Nos. 2017YFC0403304 and 2016YFC0501304), and the National Science Foundation of China (Grant Nos.51790532, 51709175, and 51790533). Authors appreciate Liya Zhao’s help for performing the field experiment.
Conflicts of Interest
The authors declare no conflict of interest.
Abbreviations
| EC | electrical conductivity (mS·cm−1) |
| GEC | groundwater EC (mS·cm−1) |
| TDS | total dissolved solids (g·L−1) |
| P | precipitation (mm) |
| DDS | dry drainage system |
| YES | Yonglian Experimental Station |
| HID | Hetao Irrigation District |
| ADS | artificial drainage system |
| FIP | flowmeter-installed position |
| GTD | groundwater table depth |
| SSC | soil salt content |
| LR | leaching requirement |
References
- Jacobsen, T.; Adams, R.M. Salt and silt in ancient Mesopotamian agriculture. Science 1958, 128, 1251–1258. [Google Scholar] [CrossRef] [PubMed]
- Wichelns, D.; Qadir, M. Achieving sustainable irrigation requires effective management of salts, soil salinity, and shallow groundwater. Agric. Water Manag. 2015, 157, 31–38. [Google Scholar] [CrossRef]
- Liu, Y.; Tian, F.; Hu, H.; Sivapalan, M. Socio-hydrologic perspectives of the co-evolution of humans and water in the Tarim River basin, Western China: The Taiji–Tire model. Hydrol. Earth Syst. Sci. 2014, 18, 1289–1303. [Google Scholar] [CrossRef]
- van Schilfgaarde, J. Irrigation—A blessing or a curse. Agric. Water Manag. 1994, 25, 203–219. [Google Scholar] [CrossRef]
- Rengasamy, P. World salinization with emphasis on Australia. J. Exp. Bot. 2006, 57, 1017–1023. [Google Scholar] [CrossRef] [PubMed] [Green Version]
- Vries, F.; Acquay, H.; Molden, D.; Scherr, S.; Valentin, C.; Cofie, O. Integrated Land and Water Management for Food and Environmental Security; IWMI: Colombo, Sri Lanka, 2003. [Google Scholar]
- Qadir, M.; Quillérou, E.; Nangia, V.; Murtaza, G.; Singh, M.; Thomas, R.J.; Drechsel, P.; Noble, A.D. Economics of salt-induced land degradation and restoration. Nat. Resour. Forum 2014, 38, 282–295. [Google Scholar] [CrossRef] [Green Version]
- FAO. The State of the World’s Land and Water Resources for Food and Agriculture (SOLAW)—Managing Systems at Risk; Food and Agricultural Organization of the United Nations and Earth Scan: Abingdon, UK, 2011. [Google Scholar]
- Konukcu, F.; Gowing, J.W.; Rose, D.A. Dry drainage: A sustainable solution to waterlogging and salinity problems in irrigation areas? Agric. Water Manag. 2006, 83, 1–12. [Google Scholar] [CrossRef]
- Nadeem, A.M. Computer Simulation of Salinity Control by Means of an Evaporative Sink. Ph.D. Thesis, University of Newcastle upon Tyne, Newcastle upon Tyne, UK, 1996. [Google Scholar]
- Khouri, N. Potential of dry drainage for controlling soil salinity. Can. J. Civ. Eng. 1998, 25, 195–205. [Google Scholar] [CrossRef]
- Konukcu, F. Potential of dry drainage as a sustainable solution to waterlogging and salinisation. In Biosaline Agriculture and Salinity Tolerance in Plants; Öztürk, M., Waisel, Y., Khan, M.A., Görk, G., Eds.; Birkhäuser Basel: Basel, Switzerland, 2006; pp. 129–135. [Google Scholar]
- Thayalakumaran, T.; Bethune, M.G.; McMahon, T.A. Achieving a salt balance—Should it be a management objective? Agric. Water Manag. 2007, 92, 1–12. [Google Scholar] [CrossRef]
- Datta, K.K.; Jong, C.D. Adverse effect of waterlogging and soil salinity on crop and land productivity in northwest region of Haryana, India. Agric. Water Manag. 2002, 57, 223–238. [Google Scholar] [CrossRef]
- Wu, J.; Zhao, L.; Huang, J.; Yang, J.; Vincent, B.; Bouarfa, S.; Vidal, A. On the effectiveness of dry drainage in soil salinity control. Sci. China Ser. E Technol. Sci. 2009, 52, 3328–3334. [Google Scholar] [CrossRef]
- Wichelns, D.; Oster, J.D. Sustainable irrigation is necessary and achievable, but direct costs and environmental impacts can be substantial. Agric. Water Manag. 2006, 86, 114–127. [Google Scholar] [CrossRef]
- Ayars, J.E.; Shouse, P.; Lesch, S.M. In situ use of groundwater by alfalfa. Agric. Water Manag. 2009, 96, 1579–1586. [Google Scholar] [CrossRef]
- Gowing, J.W.; Wyseure, G.C.L. Dry-drainage a sustainable and cost-effective solution to waterlogging and salinisation. In Proceedings of the 5th International Drainage Workshop, Vol. 3, ICID-CIID, Lahore Pakistan, 8–15 February 1992; pp. 6–26. [Google Scholar]
- Yu, B.; Jiang, L.; Shang, S. Dry drainage effect of Hetao irrigation district based on remote sensing evapotranspiration. Trans. CSAE 2016, 32, 1–8. [Google Scholar]
- Lei, Z.D.; Shang, S.H.; Yang, S.X.; Qu, J.L.; He, C.D.; Zhu, W.D. Preliminary analysis on the dry drainage effect of low-lying lands in Yerqiang Oasis in Xinjiang. J. Irrig. Drain. 1998, 17, 1–4. [Google Scholar]
- Ren, D.; Xu, X.; Ramos, T.B.; Huang, Q.; Huo, Z.; Huang, G. Modeling and assessing the function and sustainability of natural patches in salt-affected agro-ecosystems: Application to tamarisk (Tamarix chinensis Lour.) in Hetao, upper Yellow River basin. J. Hydrol. 2017, 552, 490–504. [Google Scholar] [CrossRef]
- Ren, D.; Xu, X.; Engel, B.; Huang, G. Growth responses of crops and natural vegetation to irrigation and water table changes in an agro-ecosystem of Hetao, upper Yellow River basin: Scenario analysis on maize, sunflower, watermelon and tamarisk. Agric. Water Manag. 2018, 199, 93–104. [Google Scholar] [CrossRef]
- Yue, W.; Yang, J.; Tong, J.; Gao, H. Transfer and balance of water and salt in irrigation district of arid region. J. Hydraul. Eng. 2008, 36, 623–626. [Google Scholar]
- Wu, J.; Vincent, B.; Yang, J.; Bouarfa, S.; Vidal, A. Remote Sensing Monitoring of Changes in Soil Salinity: A Case Study in Inner Mongolia, China. Sensors 2008, 8, 7035–7049. [Google Scholar] [CrossRef] [Green Version]
- Hong, M.; Zeng, W.; Ma, T.; Lei, G.; Zha, Y.; Fang, Y.; Wu, J.; Huang, J. Determination of growth stage-specific crop coefficients (Kc) of sunflowers (Helianthus annuus L.) under salt stress. Water 2017, 9, 215. [Google Scholar] [CrossRef]
- Zeng, W.; Wu, J.; Hoffmann, M.P.; Xu, C.; Ma, T.; Huang, J. Testing the APSIM sunflower model on saline soils of Inner Mongolia, China. Field Crops Res. 2016, 192, 42–54. [Google Scholar] [CrossRef]
- Burkhalter, J.P.; Gates, T.K. Agroecological impacts from salinization and waterlogging in an irrigated River Valley. J. Irrig. Drain. Eng. 2005, 131, 197–209. [Google Scholar] [CrossRef]
- Yue, W.F. Study on the Mechanism of Consumption in Yichang Irrigation Sub-District of Irrigation District of Inner Mongolia along the Yellow River. Master’s Thesis, Wuhan University, Wuhan, China, 2004. [Google Scholar]
- Wang, L.P.; Chen, Y.X.; Zeng, G.F. Irrigation, Drainage and Salinity Control in Hetao Irrigation District, Inner Mongolia; China Waterpower Press: Beijing, China, 1993; pp. 52–53. [Google Scholar]
- Ren, D.; Xu, X.; Huang, Q.; Huo, Z.; Xiong, Y.; Huang, G. Analyzing the role of shallow groundwater systems in the water use of different land-use types in arid irrigated regions. Water 2018, 10, 634. [Google Scholar] [CrossRef]
- Letey, J. Soil salinity poses challenges for sustainable agriculture and wildlife. Calif. Agric. 2000, 54, 43–48. [Google Scholar] [CrossRef] [Green Version]
- Shi, W.; Shen, B.; Wang, Z. Water and salt transport in sand-layered soil underevaporation with the shallow underground water table. Trans. CSAE 2005, 9, 23–26. [Google Scholar]
- Shimojima, E.; Yoshioka, R.; Tamagawa, I. Salinization owing to evaporation from bare-soil surfaces and its influences on the evaporation. J. Hydrol. 1996, 178, 109–136. [Google Scholar] [CrossRef]
- Singh, A. Soil salinization and waterlogging: A threat to environment and agricultural sustainability. Ecol. Indic. 2015, 57, 128–130. [Google Scholar] [CrossRef]
Figure 1.
Location of the Hetao Irrigation District (HID) and the observation field: (a) observation area; (b) HID; (c) China.
Figure 1.
Location of the Hetao Irrigation District (HID) and the observation field: (a) observation area; (b) HID; (c) China.

Figure 2.
Distribution of the monthly average rainfall and evaporation from 2007 to 2011.

Figure 3.
Distribution of the monthly maximum and minimum temperature and average values of temperature and relative humidity from 2007 to 2011.
Figure 3.
Distribution of the monthly maximum and minimum temperature and average values of temperature and relative humidity from 2007 to 2011.

Figure 4.
The fluctuation of the groundwater table depth (GTD) and groundwater electrical conductivity (GEC) in the fallowed area between 2007 and 2011: (a) GTD dynamics and (b) GEC dynamics. The dashed line represents the average value of four fallow wells (well 8, well 10, well 11, and well 12) and one irrigated well (well 9).

Figure 5.
The GTD and GEC variation in the fallow and irrigated area during autumn irrigation: (a) well 8, (b) well 9, (c) well 10, (d) well 11, and (e) well 12.
Figure 5.
The GTD and GEC variation in the fallow and irrigated area during autumn irrigation: (a) well 8, (b) well 9, (c) well 10, (d) well 11, and (e) well 12.


Figure 6.
Soil salt content (SSC) profile in the fallowed areas (Left: Well 8; Right: Well 10).

Figure 7.
Soil salt content (SSC) profile in the irrigated cropland, well 9 (Left: 26 April; Right: 26 July).
Figure 7.
Soil salt content (SSC) profile in the irrigated cropland, well 9 (Left: 26 April; Right: 26 July).


Table 1.
Different average values in salt profile (%; 2011 minus 2007).
| Location | Soil Profile (cm) | Average | |||||
|---|---|---|---|---|---|---|---|
| 0–10 | 10–30 | 30–50 | 50–70 | 70–100 | 100–140 | ||
| Well11 | 0.06 | −0.01 | −0.02 | 0.03 | 0.32 | 0.32 | 0.07 |
| Well21 | 0.06 | 0.07 | 0.08 | 0.11 | 0.18 | 0.04 | 0.09 |
| Well31 | 0.13 | 0.05 | 0.02 | −0.05 | 0.02 | −0.04 | 0.03 |
| Well41 | 0.05 | 0.09 | 0.02 | 0.07 | 0.15 | −0.05 | 0.06 |
| Well51 | 0.19 | 0.01 | 0.16 | 0.13 | 0.24 | 0.20 | 0.15 |
| Well61 | 0.04 | 0.03 | 0.02 | 0.07 | 0.09 | 0.03 | 0.04 |
| Well71 | 0.02 | 0.02 | 0.05 | 0.11 | 0.12 | 0.07 | 0.06 |
| Well 82 | −0.44 | −0.28 | −0.06 | 0.10 | 0.06 | 0.06 | −0.09 |
| Well 91 | 0.01 | 0.05 | 0.10 | 0.08 | 0.05 | 0.08 | 0.06 |
| Well 102 | 0.85 | 0.10 | 0.13 | 0.12 | 0.12 | 0.17 | 0.25 |
| Well 112 | 0.01 | 0.17 | 0.03 | 0.08 | 0.12 | 0.13 | 0.09 |
| Well 122 | 0.04 | −0.03 | −0.03 | −0.03 | −0.05 | −0.04 | −0.02 |
Note:1 in the table represents croplands and 2 represents fallow lands.
Table 2.
Dry drainage depth from the four fallow blocks (2007–2011).
| Location | Year | ΔS (mm) | μΔH (mm) | Ei (mm) | P (mm) | Ddi (mm) | Average (mm) |
|---|---|---|---|---|---|---|---|
| Well 8 | 2007 | −38 | 119 | 339 | 140 | 280 | 170 |
| 2008 | −7 | 80 | 431 | 314 | 190 | ||
| 2009 | −93 | 75 | 261 | 92 | 152 | ||
| 2010 | −95 | 120 | 319 | 174 | 170 | ||
| 2011 | −101 | 19 | 216 | 74 | 60 | ||
| Well 10 | 2007 | −59 | 122 | 473 | 140 | 396 | 388 |
| 2008 | 1 | 23 | 752 | 314 | 462 | ||
| 2009 | −95 | 109 | 634 | 92 | 557 | ||
| 2010 | −30 | 29 | 433 | 174 | 258 | ||
| 2011 | −55 | −22 | 419 | 74 | 268 | ||
| Well 11 | 2007 | −11 | 43 | 493 | 140 | 385 | 422 |
| 2008 | −12 | 30 | 751 | 314 | 455 | ||
| 2009 | −128 | 139 | 625 | 92 | 545 | ||
| 2010 | −16 | −7 | 545 | 174 | 348 | ||
| 2011 | −38 | −71 | 563 | 74 | 380 | ||
| Well 12 | 2007 | −28 | 25 | 327 | 140 | 184 | 248 |
| 2008 | 2 | 126 | 459 | 314 | 273 | ||
| 2009 | −103 | 63 | 349 | 92 | 218 | ||
| 2010 | −5 | 99 | 340 | 174 | 260 | ||
| 2011 | −117 | 165 | 330 | 74 | 304 |
Note: ΔS (mm) and μΔH (mm) are the storage capacity changes in the soil water and in the groundwater, respectively; Ei is the total evapotranspiration of the fallow area, block i (mm); and P is the precipitation within the calculation period (mm).
Table 3.
Five-year water and salt balance of the observation field.
| Balance Item | 2007 | 2008 | 2009 | 2010 | 2011 | 2007–2011 |
|---|---|---|---|---|---|---|
| Irrigation (104 m3) | 1320 | 856 | 1382 | 1151 | 1418 | 6127 |
| Dry drainage water (104 m3) | 266 | 282 | 296 | 215 | 199 | 1258 |
| Artificial drainage water (104 m3) | 73 | 43 | 69 | 30 | 78 | 293 |
| Irrigation water salinity (g/L) | 0.54 | 0.51 | 0.47 | 0.64 | 0.54 | |
| Groundwater salinity (g/L) | 2.30 | 2.43 | 2.24 | 2.18 | 1.60 | |
| Drainage water salinity (g/L) | 1.20 | 1.20 | 1.25 | 1.28 | 1.20 | |
| Imported salt with irrigation (ton) | 7128 | 4366 | 6495 | 7367 | 7657 | 33,013 |
| Dry drainage salt (ton) | 6118 | 6853 | 6630 | 4687 | 3184 | 27,472 |
| Artificial drainage salt (ton) | 876 | 516 | 863 | 384 | 936 | 3575 |
| Residual salt in the irrigated area (ton) | 134 | −3003 | −998 | 2296 | 3537 | 1966 |
| Residual salt in the irrigated area (kg/ha) | 65 | −1450 | −482 | 1109 | 1708 | 950 |
| Residual ratio | 1.9% | −68.8% | −15.4% | 31.2% | 46.2% | −4.9% |
© 2019 by the authors. Licensee MDPI, Basel, Switzerland. This article is an open access article distributed under the terms and conditions of the Creative Commons Attribution (CC BY) license (http://creativecommons.org/licenses/by/4.0/).
Share and Cite
MDPI and ACS Style
Wang, C.; Wu, J.; Zeng, W.; Zhu, Y.; Huang, J. Five-Year Experimental Study on Effectiveness and Sustainability of a Dry Drainage System for Controlling Soil Salinity. Water 2019, 11, 111. https://doi.org/10.3390/w11010111
AMA Style
Wang C, Wu J, Zeng W, Zhu Y, Huang J. Five-Year Experimental Study on Effectiveness and Sustainability of a Dry Drainage System for Controlling Soil Salinity. Water. 2019; 11(1):111. https://doi.org/10.3390/w11010111
Chicago/Turabian StyleWang, Changshu, Jingwei Wu, Wenzhi Zeng, Yan Zhu, and Jiesheng Huang. 2019. "Five-Year Experimental Study on Effectiveness and Sustainability of a Dry Drainage System for Controlling Soil Salinity" Water 11, no. 1: 111. https://doi.org/10.3390/w11010111
Note that from the first issue of 2016, this journal uses article numbers instead of page numbers. See further details here.