Dynamic Variation Characteristics of Seawater Intrusion in Underground Water-Sealed Oil Storage Cavern under Island Tidal Environment


School of Engineering and Technology, China University of Geosciences (Beijing), Beijing 100083, China
*
Author to whom correspondence should be addressed.
Water 2019, 11(1), 130; https://doi.org/10.3390/w11010130
Submission received: 16 December 2018
/
Revised: 7 January 2019
/
Accepted: 8 January 2019
/
Published: 12 January 2019
(This article belongs to the Special Issue Water Flow, Solute and Heat Transfer in Groundwater)
Abstract
:In the case of constructing underground water-sealed oil storage caverns in island environments, the groundwater seepage characteristics are more complicated under the influence of seawater and tidal fluctuations. It also faces problems such as seawater intrusion. This research is based on multi-physical field coupling theory and analyzed the influence of tidal fluctuation and water curtain systems on the temporal-spatial variations of seawater intrusion in an island oil storage cavern in China using the finite element method. The results show that the operation of an underground water-sealed oil storage cavern in an island environment has a risk of inducing seawater intrusion. The tidal fluctuation has a certain degree of influence on the seepage field of the island. The water curtain system can decrease seawater intrusion and reduce the influence of tidal fluctuation on the seepage field inside the island. The research results provide a theoretical basis for the study of seawater intrusion in underground oil storage caverns under island tidal environments.
1. Introduction
Compared with other oil storage methods, underground water-sealed oil storage caverns have the advantages of using less space, high safety and good economic efficiency, and have become the preferred method of oil storage in the world [1,2]. Most of the underground water-sealed oil storage caverns in the world are built in freshwater areas with good rock integrity and keep a certain distance from the shoreline [3,4,5]. However, sites suitable for the construction of underground water-sealed oil storage caverns are limited [6]. The construction of underground water-sealed oil storage caverns on islands with suitable geological conditions not only provides a new possibility for underground oil storage but also promotes the utilization of island resources. In addition, island environments are convenient for the arrival and departure of oil tankers, facilitating oil transport. At present, there are few cases of building underground water-sealed oil storage caverns in island environments.
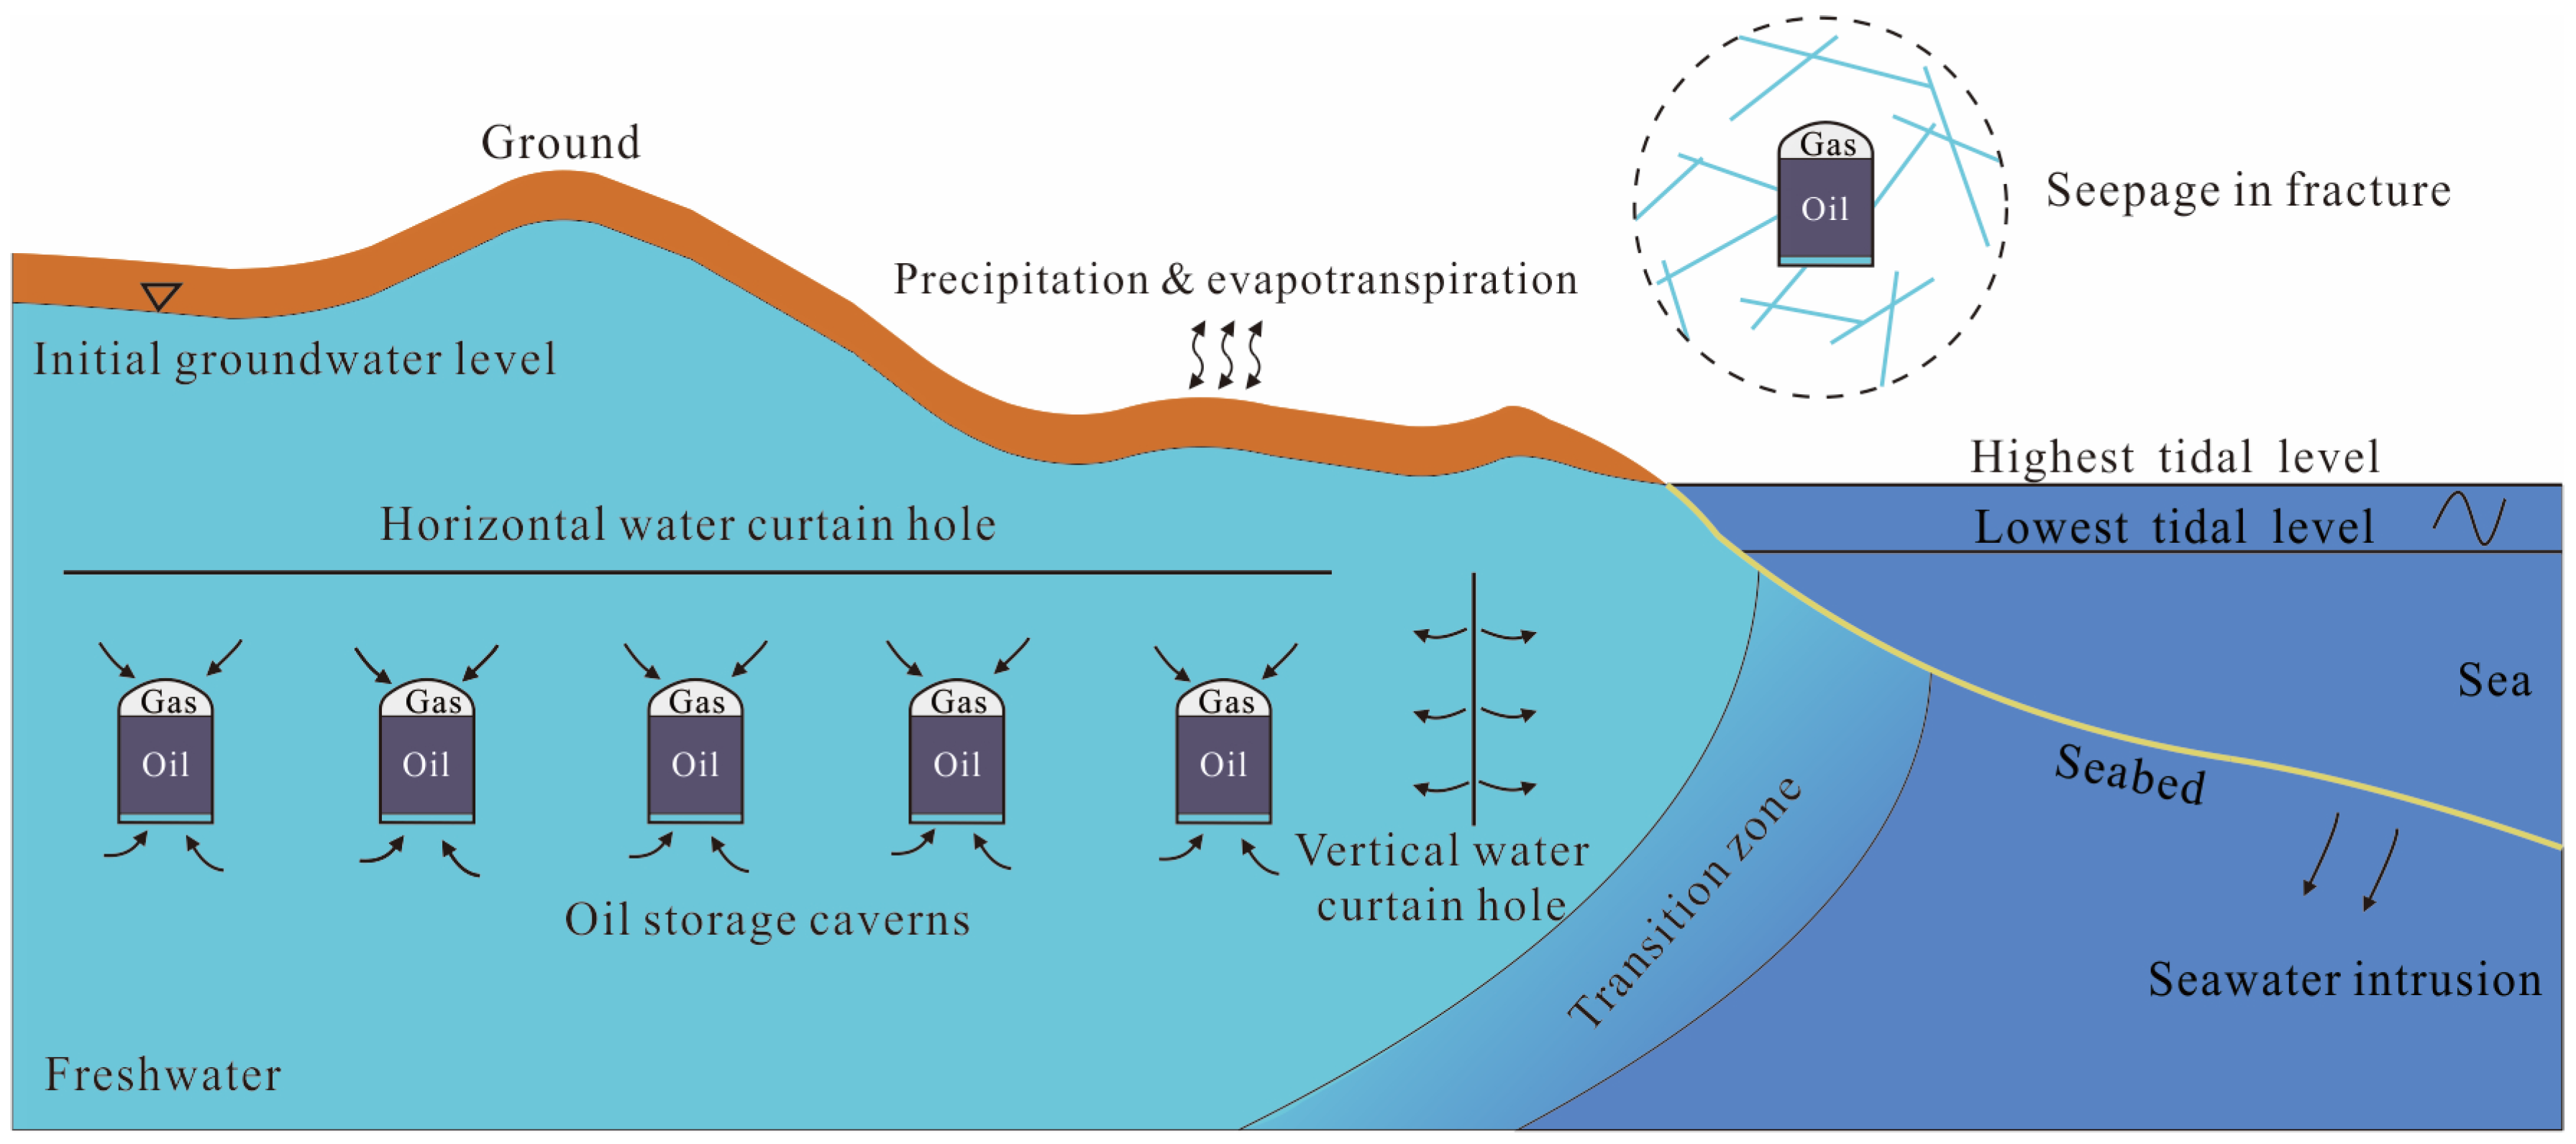
The construction of underground water-sealed oil storage caverns in an island environment will face the problem of seawater intrusion [7]. Surrounded by seawater, the excavation of an underground water-sealed oil storage cavern in an island environment will affect the natural seepage field of the research area, and the groundwater in the surrounding rock will flow into the underground caverns [8]. When the water inflow of the underground caverns exceeds the underground freshwater recharge, the freshwater head will fall. When the freshwater head is lower than the seawater head, the freshwater-seawater interface will push into the island, thus causing seawater intrusion (as shown in Figure 1) [9]. Seawater intrusion will not only corrode the structure of the underground caverns (steel, concrete, etc.) but also affect the quality of the crude oil and underground freshwater on the island [10]. Therefore, seawater intrusion will affect the long-term stability and safety of underground water-sealed oil storage caverns. Worse still, it may even destroy the original ecological balance of the island [11,12,13]. Therefore, more attention should be paid to seawater intrusion in the construction of underground water-sealed oil storage caverns in island environments.
Numerical simulation has become one of the most effective methods for studying seawater intrusion [14]. According to the groundwater aquifer, the numerical models of seawater intrusion can be divided into a porous media model and fracture-karst media model. Research on the porous media model is relatively mature [9]. Fracture-karst media models can be divided into equivalent porous media model, discrete fracture network model, fractured porous media model and discrete-continuum media model [15,16,17,18].
The groundwater seepage field of the island is affected by the tidal fluctuation, but the seepage characteristics are more complicated [19,20] and the groundwater level changes periodically [21,22]. The fluctuation of the groundwater level will affect the hydraulic head differences between the freshwater and seawater in the island environment, which will affect the development and rate of seawater intrusion [23,24,25,26]. Moreover, the fluctuation of groundwater level will affect the water-sealed safety of underground oil storage caverns. However, the amplitudes of the tidal waves are increasingly damped with horizontal distance from the shoreline, and there exists a phase difference at different locations [27,28]. Therefore, the extent of tidal influence is worth studying.
The prevention measures of seawater intrusion are mainly as follows: (a) rational exploitation of groundwater, (b) artificial recharge of groundwater, and (c) setting up barrier wells along the coast [29,30]. Barrier wells located along the coast can effectively decrease seawater intrusion into the underground caverns [31]. In general, a water curtain system needs to be set up to ensure the water-sealed reliability of an underground water-sealed oil storage cavern [32,33,34,35]. The water curtain system is mainly horizontal. Vertical water curtain systems have not been paid much attention because of the problem of excessive water inflow [36]. Vertical water curtain systems can form a water pressure wall on both sides of the underground caverns, with a role similar to barrier wells. Therefore, the effect of vertical water curtain systems should be studied in the process of building an underground water-sealed oil storage cavern in an island environment.
In this paper, the equivalent porous media model was adopted. The influence of fracture anisotropy on groundwater seepage field was not considered. The objective of this paper is to obtain the dynamic characteristics of seawater intrusion in an underground water-sealed oil storage cavern under an island tidal environment using a transient simulation based on the multi-physical field coupling method. By comparing the temporal-spatial variations of seawater intrusion under four conditions (un-excavated, excavated, horizontal water curtain system, vertical water curtain system), the effect of the water curtain system on seawater intrusion was studied. Then, the tidal monitoring data were fitted to a sinusoidal curve, and the influence of the tidal fluctuation on the seawater intrusion was analyzed. Finally, the influence of the water curtain system on the tidal wave propagation to the island was discussed. The research results provide a theoretical basis for the construction of underground water-sealed oil storage caverns under island tidal environments in the future.
2. Research Area
2.1. Project Overview
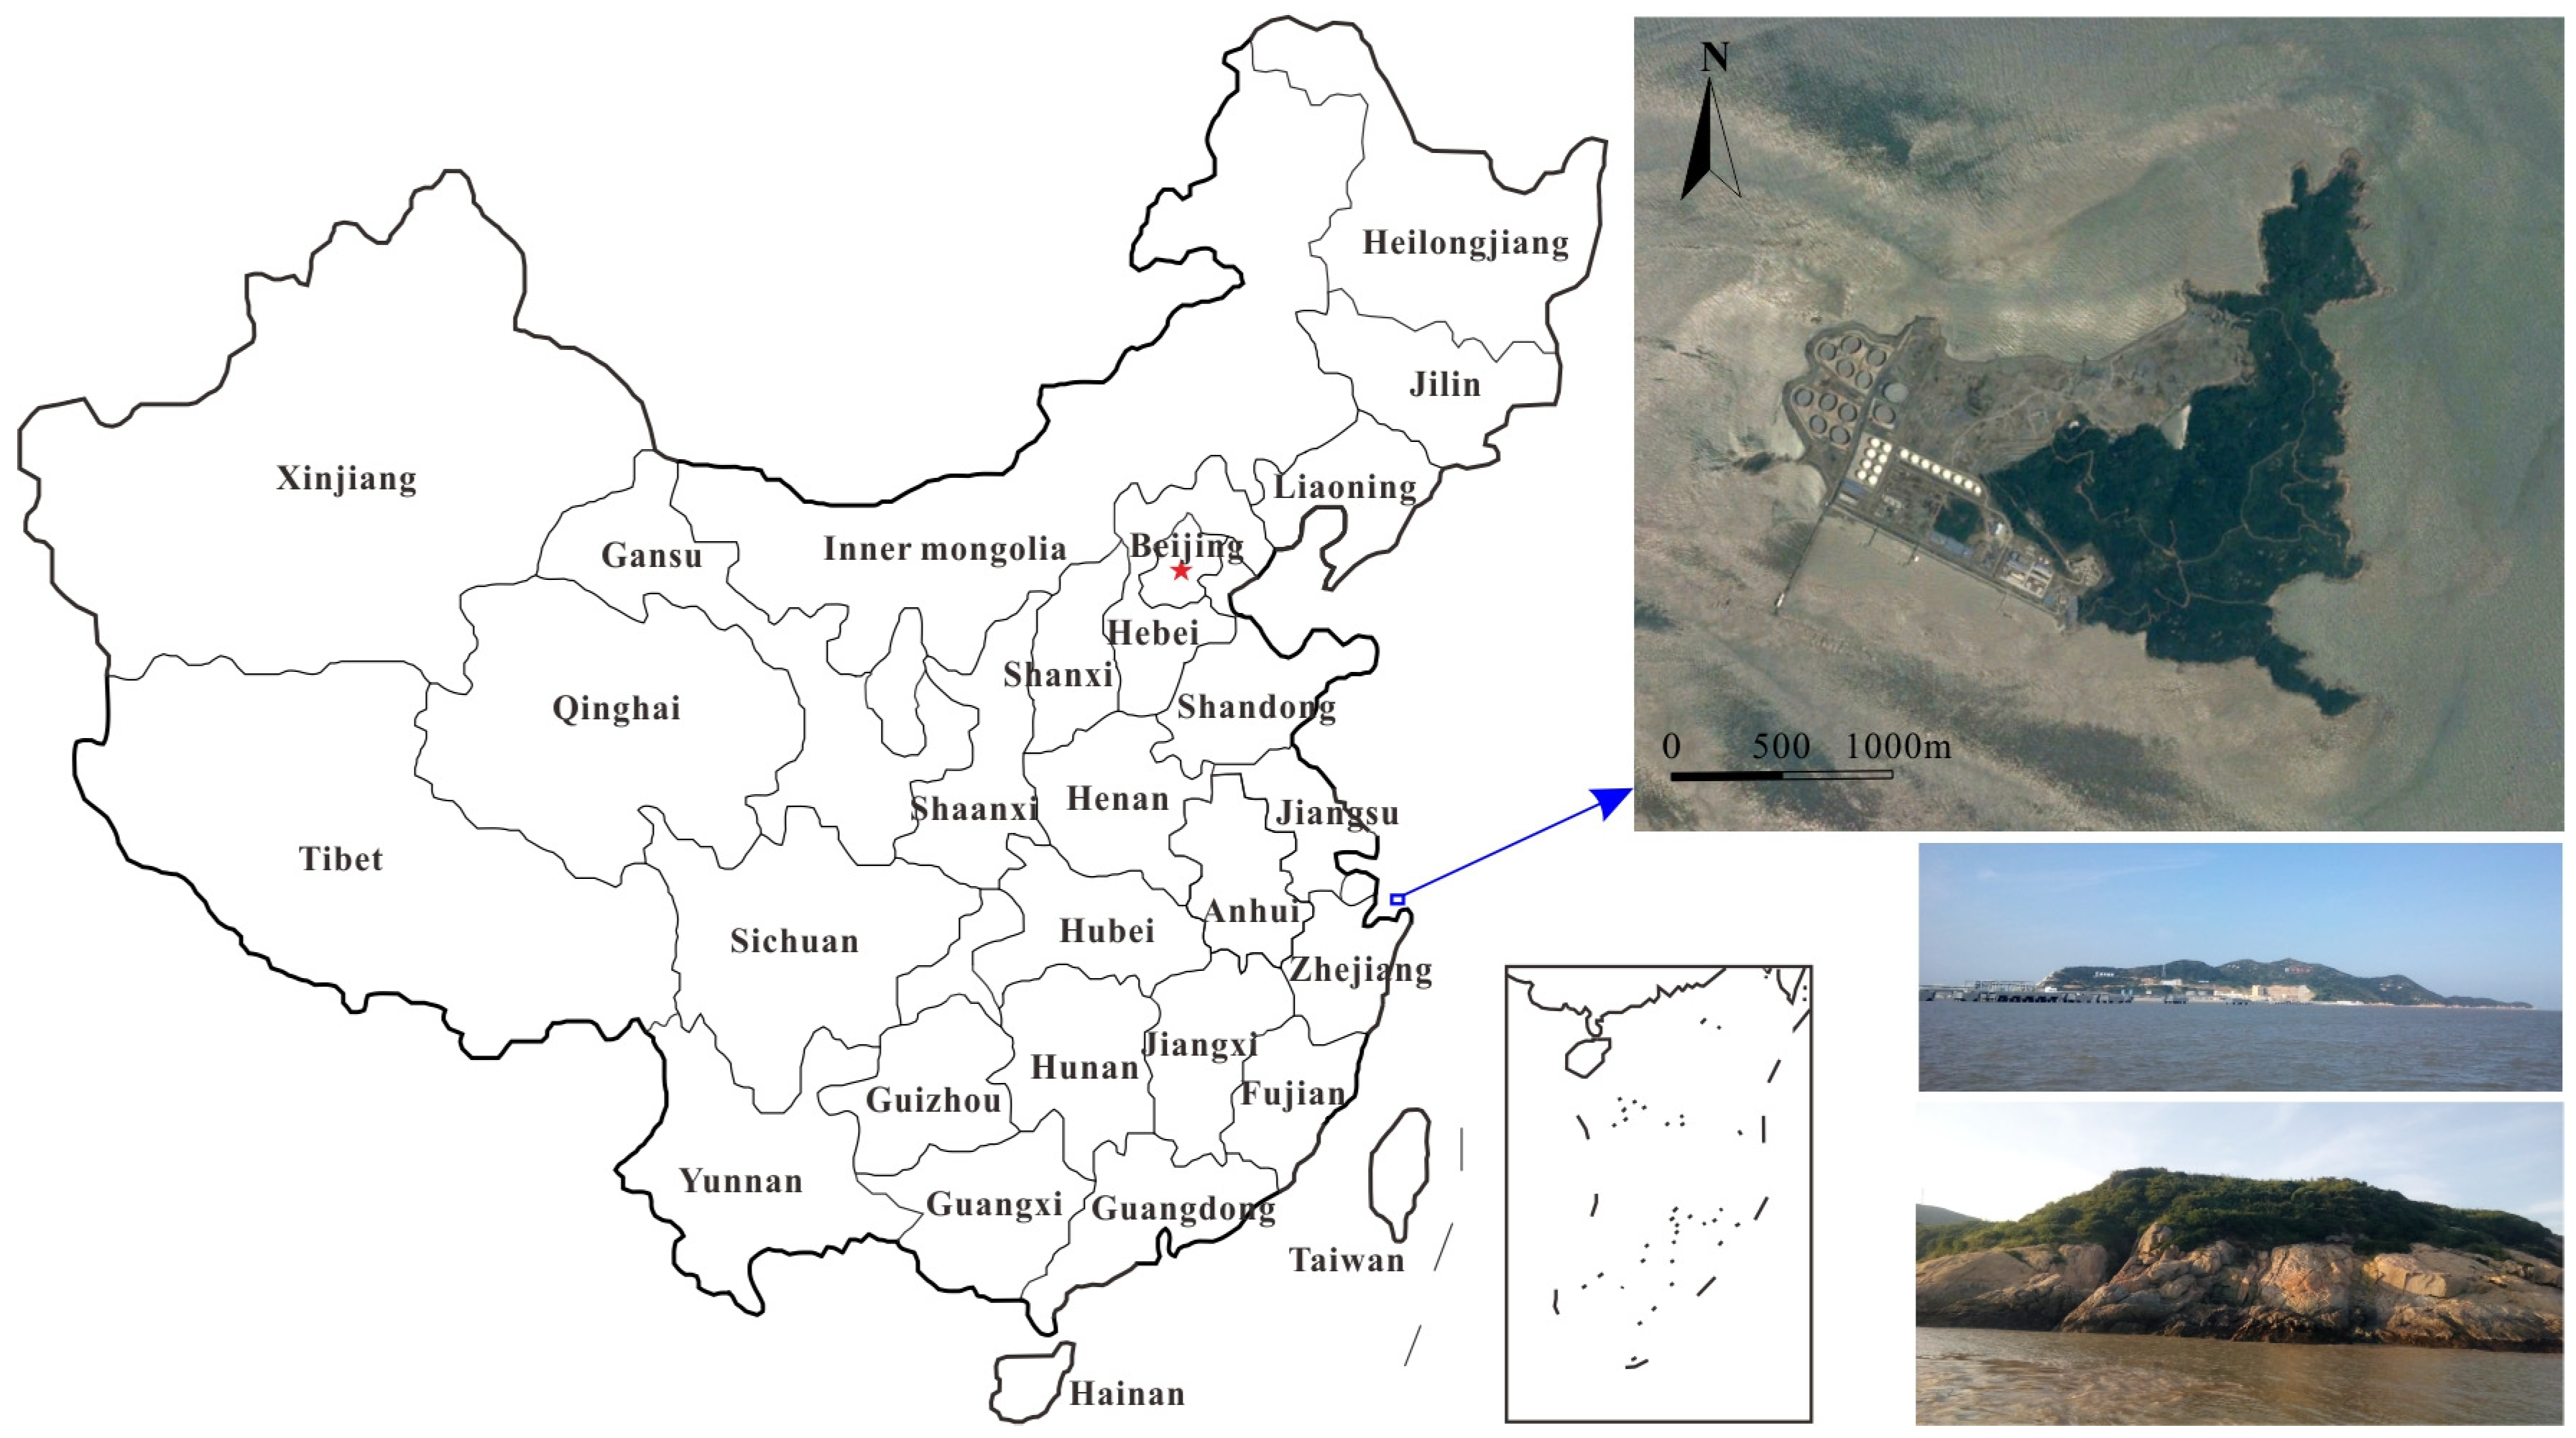
The island is located in Zhejiang Province, China, with an area of approximately 2.53 km2 (as shown in Figure 2). The storage capacity of the proposed underground water-sealed oil storage cavern is approximately 750 × 104 m3, consisting of 16 caverns. According to the island topography, the length of the main caverns can be divided into four types: 1000 m, 930 m, 620 m and 465 m. The main cavern spacing is divided into four cases of 30 m, 50 m, 70 m and 95 m. The underground oil storage cavern cross-section has a horseshoe shape, 20 m wide, 30 m high. The elevation of the top of the cavern is −45 m, and the axis direction of the caverns is NE 80°.
2.2. Engineering Geology
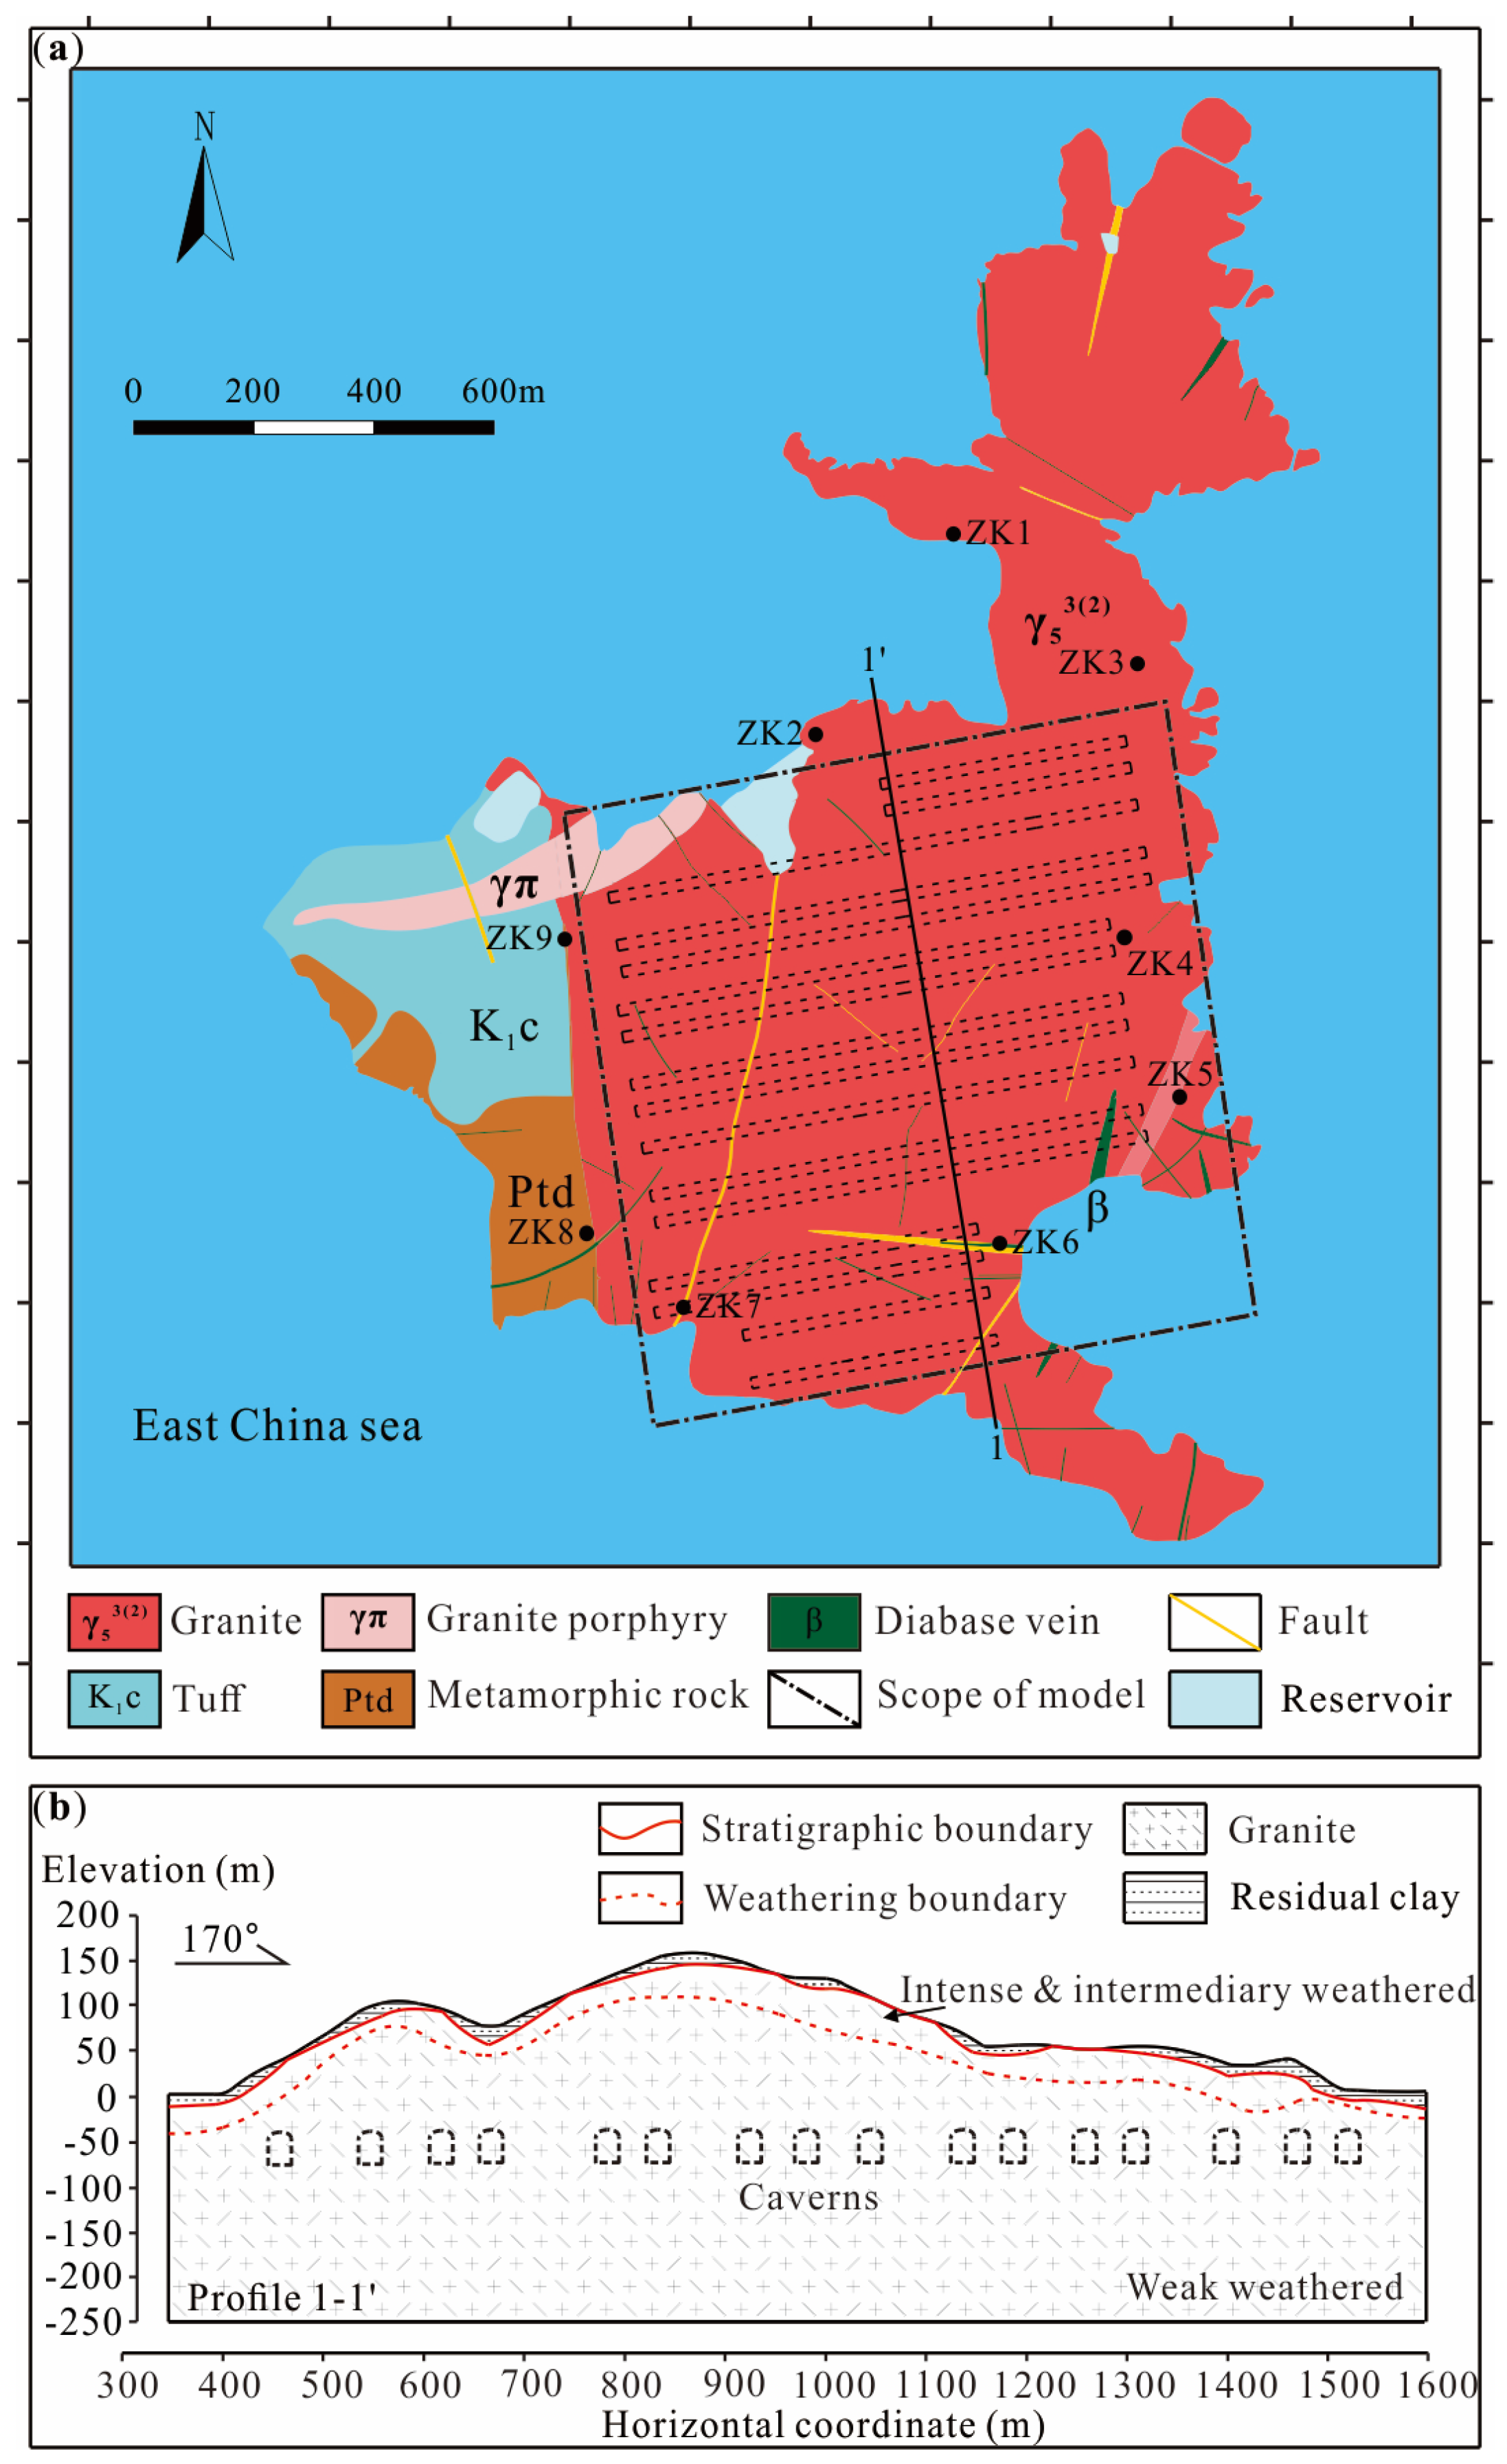
Geologically, the stratum of the research area (as shown in Figure 3a) comprises metamorphic rocks (schist, gneiss and plagioclase amphibolite) of the Mesoproterozoic Chencai Group Mo Jiu Wan Formation ()), medium-acidic and acidic pyroclastic rocks of the Lower Cretaceous System Chawan Group (), granite of the 2nd stage intrusions of Late Yanshanian () and quaternary strata (as shown in Figure 3b). According to the field exploration results, the lithology of the research area along the vertical direction can be divided into the following four types: residual sandy clay, intense weathered granite, intermediary weathered granite, and weak weathered granite. The average thickness of the residual candy clay is 2.80 m, the average thickness of the intense weathered granite is 9.13 m, the average thickness of the intermediary weathered granite is 23.03 m, and the rest is weak weathered granite. All underground caverns are located in the weak weathered granite. The rock mass of the research area has good integrity, and a total of 8 fault zones are found, mainly in NE direction, followed by the NW direction and nearly EW direction. Joint attitude statistics show that the main directions of the joints are NE 60° and NW 306°.
2.3. Hydrogeology
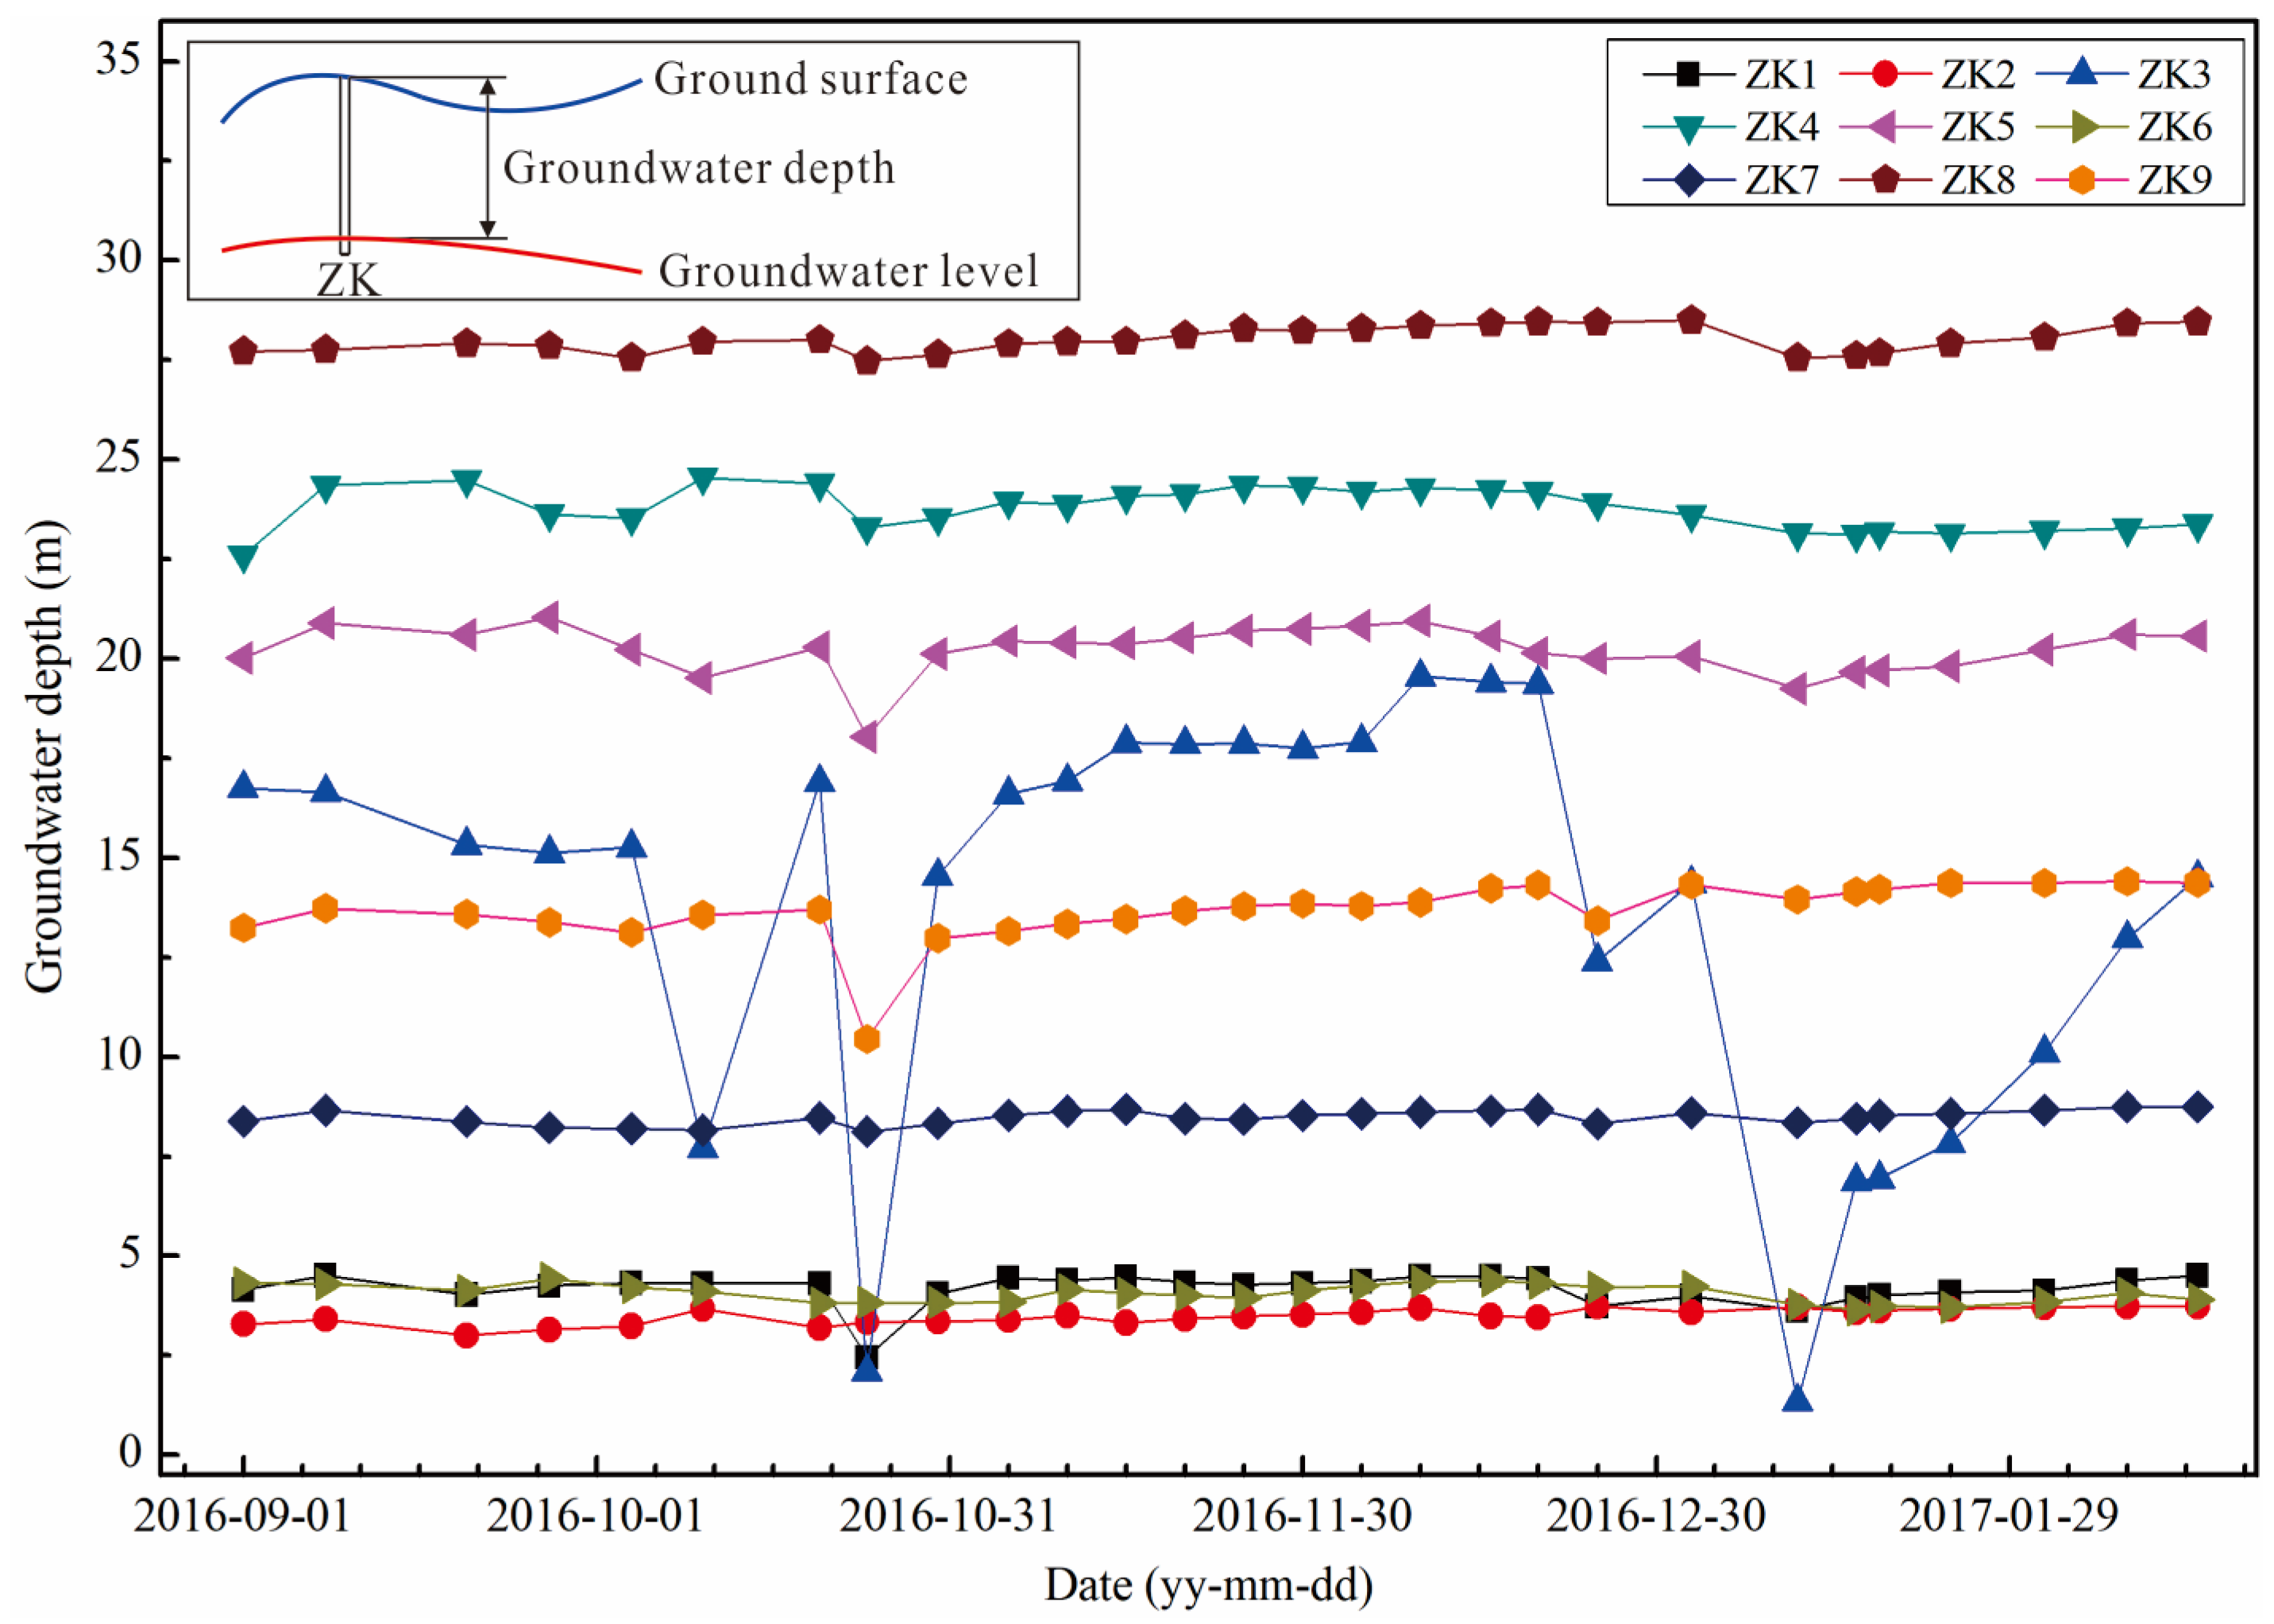
The groundwater in the research area can be divided into 2 types: loose-rock pore water and bedrock fracture water. There are 9 groundwater table monitoring holes arranged in the research area (as shown in Figure 3). By analyzing the monitoring data of the groundwater table, it can be seen that: the groundwater depth is between 1.4 and 28.5 m, and the average groundwater depth is 13.3 m (as shown in Figure 4). According to the research results of relevant scholars and our sensitivity analysis, the hydraulic conductivity and the hydrodynamic dispersion coefficient are the main parameters influencing seawater intrusion. The hydraulic conductivity of rock mass is the most sensitive. The hydrodynamic dispersion coefficient is less sensitive. According to the rock mass permeability test, the hydraulic conductivity of the rock mass in the research area was obtained. The hydraulic conductivity of the rock mass decreases gradually as the depth increases. According to the variation law of hydraulic conductivity of granitic rock masses [37], curve fitting can be carried out, and the fitting formula is as follows:
where k is the hydraulic conductivity (m/s), and h is the depth (m).
According to the sampling analysis of the seawater around the island, it can be seen that: the density of seawater is 1025 kg/m3. The most abundant ions in the seawater are chloride ions and sodium ions. The concentration of chloride ion in the seawater is 0.31 mol/kg, the concentration of sodium ion in the seawater is 0.22 mol/kg.
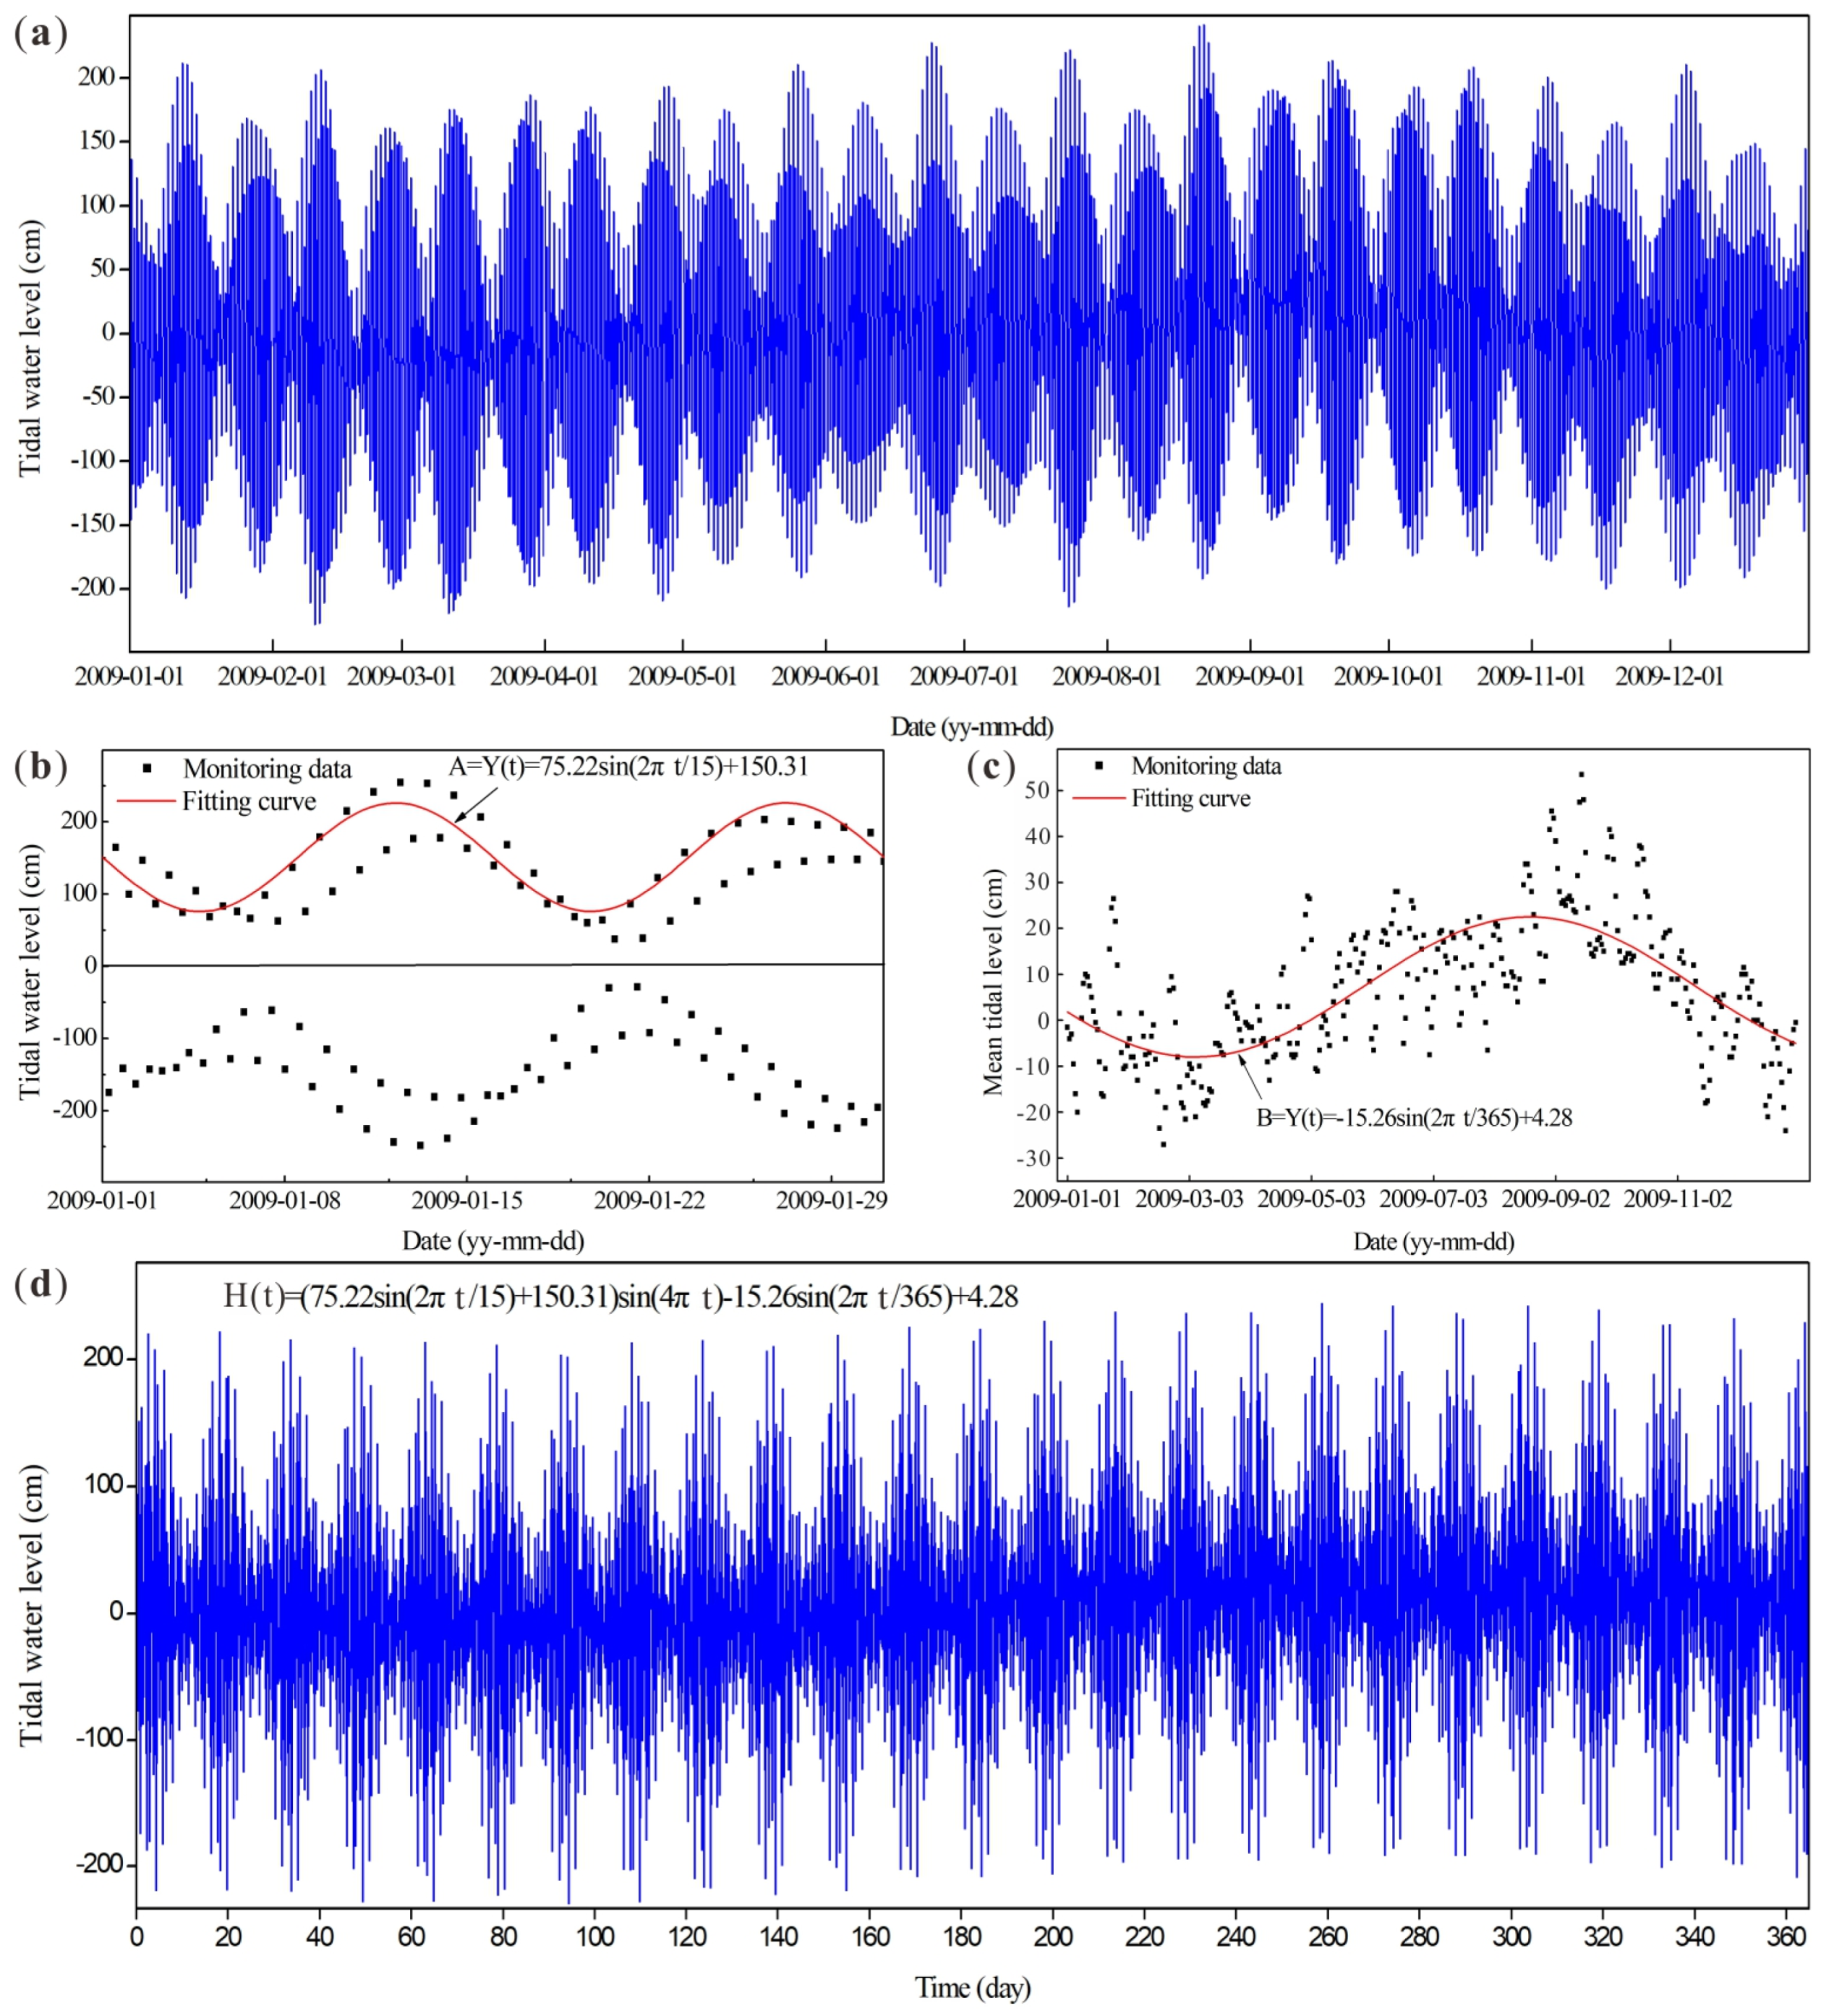
The research area is subjected to an irregular semidiurnal tide [38]. Affected by the relative positions of the Earth, the Moon and the Sun, the tidal cycles show the phenomena of diurnal inequality, semi-menstrual inequality and annual inequality [39]. According to the tidal monitoring data, which are shown in Figure 5a (the monitoring data came from the Navigation Guarantee Department of Chinese Navy Headquarters), the characteristics of the tidal fluctuations include: the highest tidal level is 2.42 m, the lowest tidal level is −2.28 m, two high tidal levels and two low tidal levels occurred in one day, with a maximum tidal fluctuation range of 4.34 m and a minimum range of 0.28 m.
The tidal monitoring data are taken as four values per day, namely higher high water, higher low water, lower high water and lower low water. Therefore, tidal data are discontinuous. To apply a tidal fluctuation boundary to the model, a sinusoidal fitting is performed for the tidal monitoring data. It can be seen from the analysis of the tidal data: (1) the tidal water level fluctuates sinusoidally and the fluctuation period is half a day, (2) the amplitude of the tidal fluctuation also varies sinusoidally, and the fluctuation period is one month, and (3) the deviation of the tidal fluctuation also fluctuates sinusoidally with a period of one year [40]. The fitting equation is as follows.
The equation for the average tidal water level (deviation) is (as shown in Figure 5c):
The equation for the tidal amplitude is (as shown in Figure 5b):
The equation for the tidal water level is:
Substituting Equations (2) and (3) into Equation (4) gives (as shown in Figure 5d):
where t is the time (day), B is the average tidal level (cm), A is the amplitude of the tidal fluctuation (cm), and is the tidal level (cm).
3. Simulation Method
3.1. Numerical Model
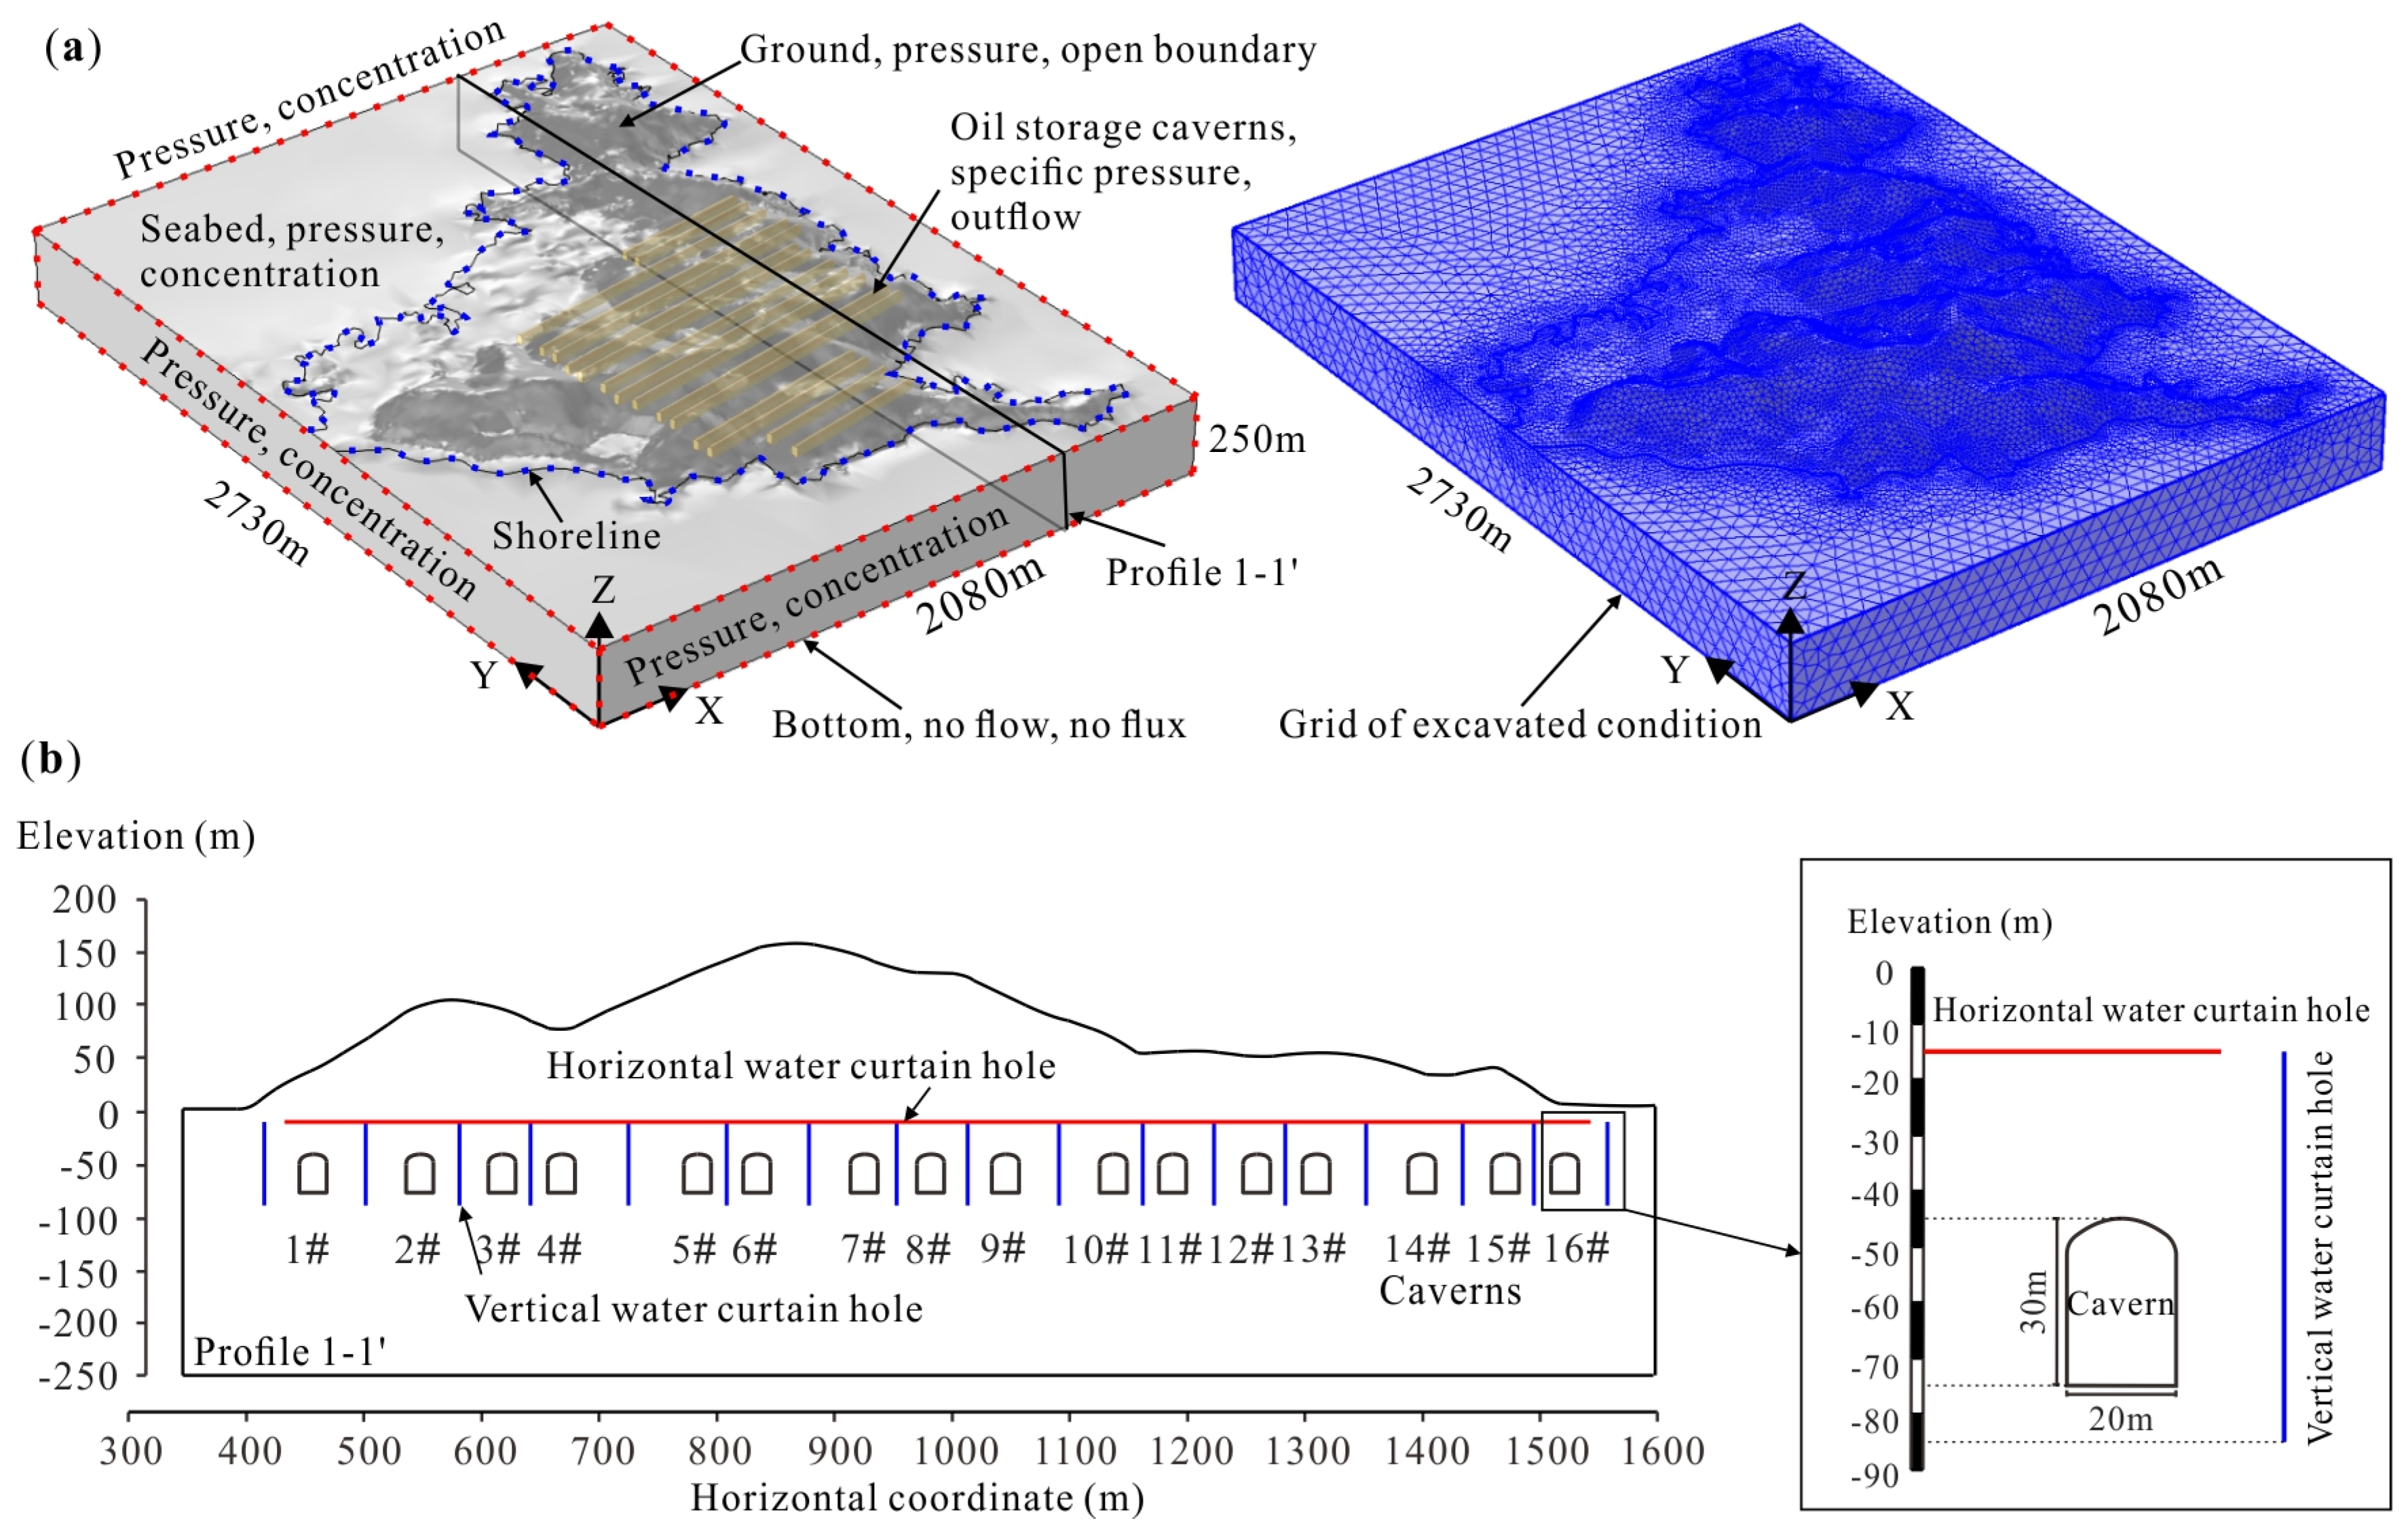
In this paper, the finite element software COMSOL Multiphysics (version 5.3, manufactured by COMSOL Inc. in Stockholm, Sweden) is used to establish a three-dimensional numerical model (as shown in Figure 6). The numerical model set the Y-axis as geographic north, the vertical direction as the Z-axis and the axis of the main caverns and X-axis formed an angle of 10°. The model size is 2080 m × 2730 m × 250 m. The simulation is divided into the following four conditions: the underground caverns are un-excavated, the underground caverns are excavated, the underground caverns are excavated and a horizontal water curtain system is set above the caverns, and the underground caverns are excavated and a vertical water curtain system is arranged on both sides of the caverns. The horizontal water curtain system is set with the horizontal water curtain holes in a parallel arrangement. The bottom elevation of the water curtain hole is −15 m, the diameter is 0.1 m, the separation distance is 10 m, and the water injection pressure is 0.3 MPa. The vertical water curtain system is distributed on both sides of the main cavern. The top elevation of the water curtain hole is −15 m, the hole length is 75 m, the diameter is 0.1 m, and the injection pressure is 0.3 MPa. To facilitate the analysis of the simulation results, profile 1-1’ is set along the direction vertical to the axis of the cavern. The four models are divided into tetrahedral meshes. The computational grid and the size resolution of the four models are shown in Table 1.
3.2. Governing Equation
The study of the dynamic variation characteristics of seawater intrusion is based on the advection-dispersion model. Freshwater and seawater are miscible. Under the influence of hydrodynamic dispersion in the process of seawater intrusion, there is no freshwater–seawater sharp interface. Instead, there is a transition zone. Therefore, the advection-dispersion equation of seawater intrusion is composed of two parts. One part is the Darcy equation and the other part is the solute transport equation. In the numerical simulation, the multi-physical field coupling method is used to couple these two equations.
- (1)
- The underground seepage field is subject to the seepage continuity equation (Equation (6)) and Darcy’s law (Equation (7)) and [41]:where k is the hydraulic conductivity (m/s), n is the porosity, is the rate of recharge to the water table per unit volume of the aquifer (kg/s), v is the Darcy’s flux (m/s), p is the pore water pressure (Pa), z is the vertical coordinate (m), g is the gravitational acceleration (m/s2), is the density of water (kg/m3), is the density of freshwater (kg/m3), is the density of seawater (kg/m3), is the concentration of chlorine ions in water (kg/m3) and is the concentration of chlorine ions in seawater (kg/m3).
- (2)
- In the three-dimensional numerical model, the solute transport equation can be described as follows [42]:where is the concentration of chlorine ions (mol/kg), the concentration of solute in recharged water (mol/kg), x is the flow direction, and y and z are vertical to the flow direction, D is the hydrodynamic dispersion coefficient tensor (m2/s), Dii and Dij are the components of the hydrodynamic dispersion coefficient tensor (m2/s), D* is the diffusion coefficient (m2/s), is the longitudinal dispersity (m), is the transversal dispersity (m), , and are the three components of the seepage velocity (m/s).
3.3. Model Parameters
The numerical model parameters are selected from the Engineering Geological Investigation Report provided by the Zhejiang Engineering Geochemical Prospecting Academy of China. The diffusion coefficient, longitudinal dispersity and transversal dispersity are selected based on engineering experience [43]. The detailed model parameters are shown in Table 2.
3.4. Boundary and Initial Conditions
The seawater intrusion model is divided into the Darcy seepage field and solute transport field, so there are two sets of boundary and initial conditions.
- 1
- There are several types of boundary and initial conditions for the transient seepage of groundwater:
- (1)
- Initial conditions:
- (2)
- The first boundary condition is:
- (3)
- The second boundary condition is:where H* is the hydraulic head (m), q* is the quantity of flow, and is the boundary.
The boundary around the model and the top surface covered by seawater are affected by tidal fluctuation, the pressure value is . The tidal monitoring data given in this paper are within 1 year. In order to simulate the seawater intrusion of the research area in 50 years, we repeated the one-year monitoring data 50 times. The rest of the top surface of the model is set as the pressure boundary. According to the initial groundwater depth in the research area, the value is , z0 is the ground elevation over the position. The bottom of the model is set as the second boundary condition, as a no-flow boundary. The underground cavern is set as the zero-pressure boundary.
- 2
- The boundary conditions of the solute transport field mainly include the following:
- (1)
- Initial conditions:
- (2)
- The first boundary condition, also known as the Dirichlet boundary condition, where the solute concentration is known:
- (3)
- The second boundary condition, also called Neumann boundary condition, which describes the change rate of the solute concentration in normal direction at the boundary:
- (4)
- Input boundary condition. Under the effect of groundwater flow and hydrodynamic dispersion, the solute flux across the boundary is known:where q is the flux through the boundary (kgm−2s−1).
According to the analysis of the borehole water samples, it can be seen that there is no obvious seawater intrusion under the initial condition, so the initial concentration of chloride ion in the model is set to 0. The boundary around the model and the top surface covered by seawater are set as the first boundary, according to the hydrogeological conditions of the research area, the chloride ion concentration is 0.31 mol/kg. The underground cavern is set as the outflow boundary, that is, chloride ions can flow into the cavern with the groundwater. The rest of the top surface is set as the open boundary, the chloride ions concentration outside the surface is 0. The bottom of the model is set as a no-flux boundary.
4. Results
4.1. Validation of the Numerical Model
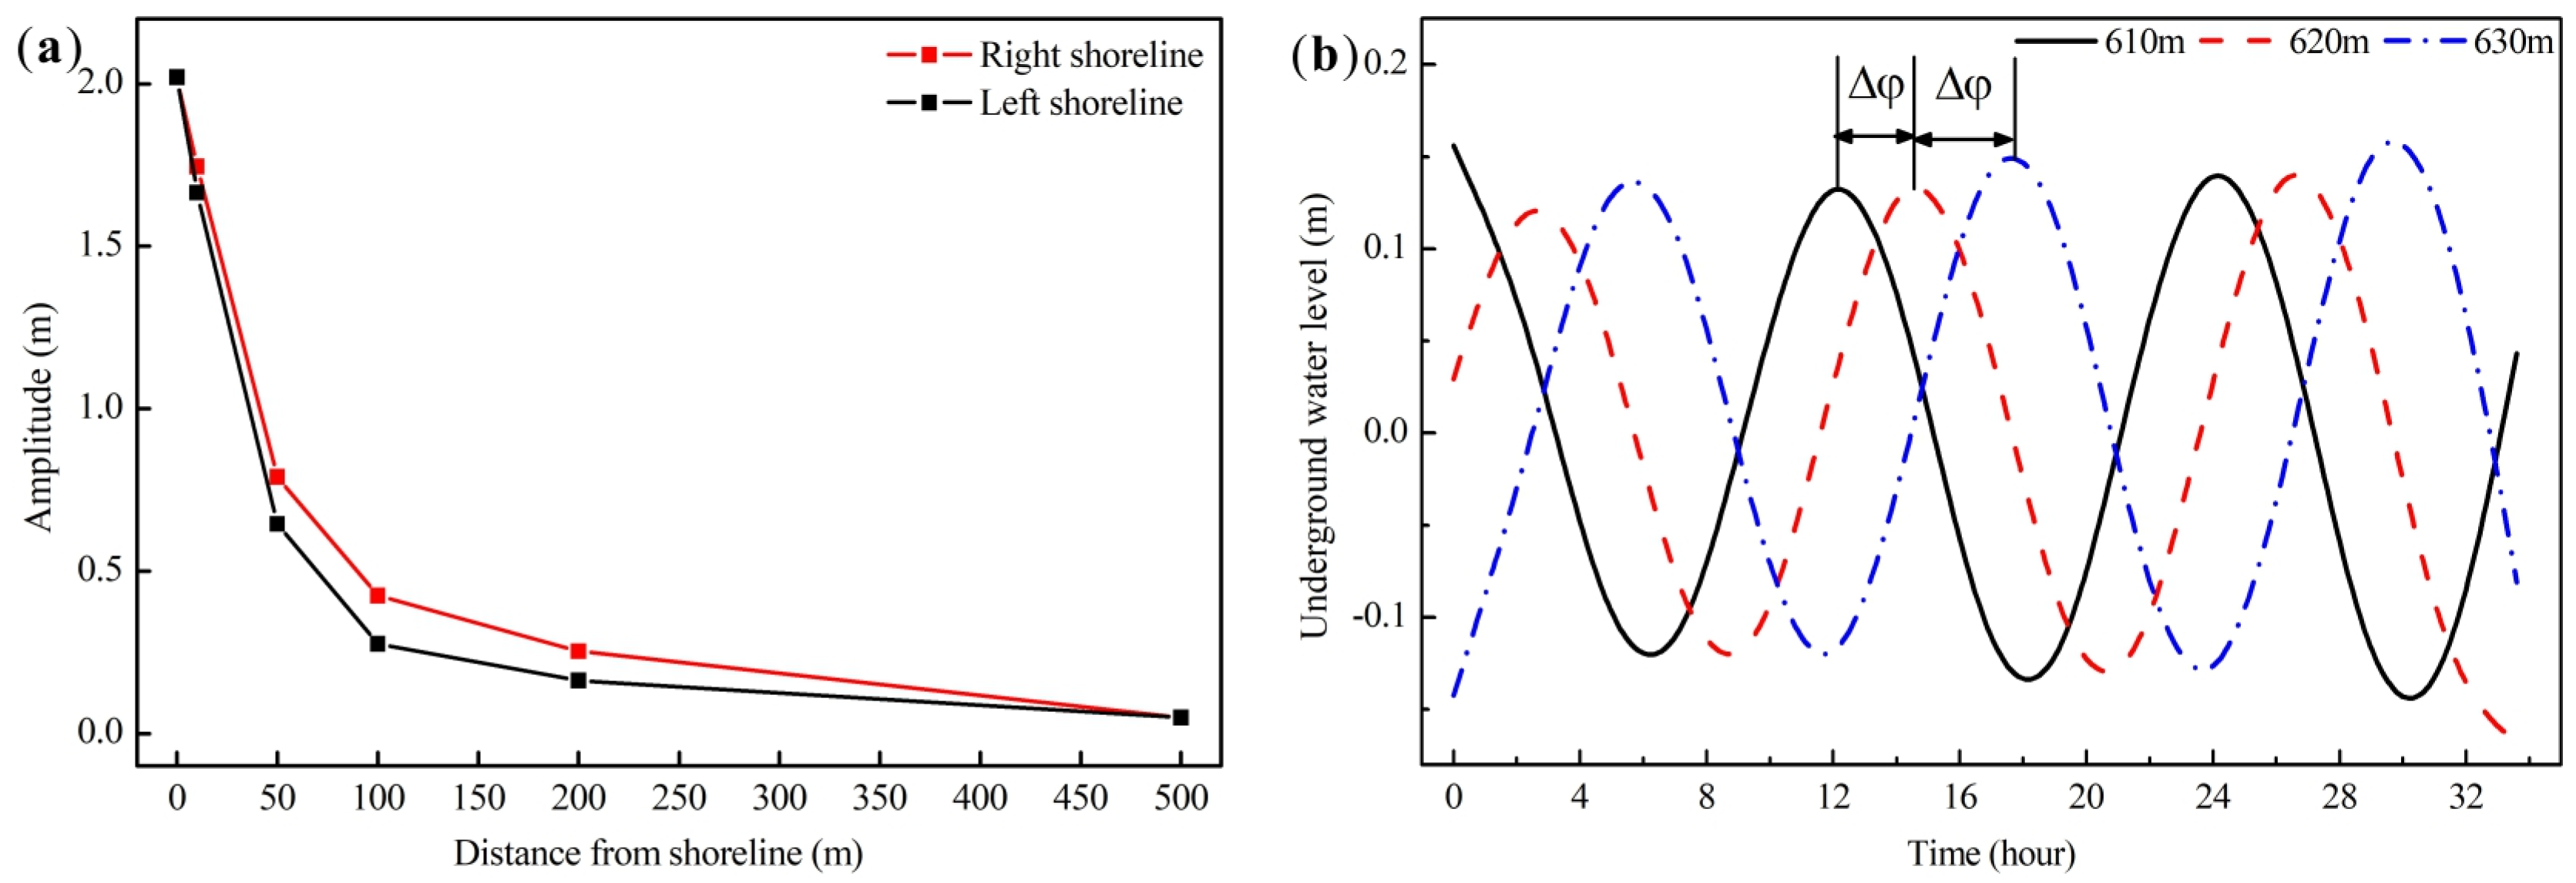
The model is established according to the terrain of the research area. Numerical model parameters are obtained by field monitoring and testing. Boundary conditions are selected according to hydrogeological conditions of the research area. In this paper, the model is verified by the variation of the groundwater level with tidal fluctuation. The amplitude attenuation and phase lag of the groundwater table are observed in the process of tidal fluctuation propagation to the island [28,44,45]. In the un-excavated condition, the groundwater table fluctuation is increasingly damped with the increase of the horizontal distance from the coast. The attenuation is faster in the early stage and slower in the later stage (as shown in Figure 7a). At different locations within the island, the fluctuation phase of the groundwater table is also different. As the distance from the coast increases, the fluctuation phase of the groundwater table changes (as shown in Figure 7b). It can be concluded that the model we have established is reliable.
4.2. Characteristics of Groundwater Seepage
4.2.1. Groundwater Seepage Direction
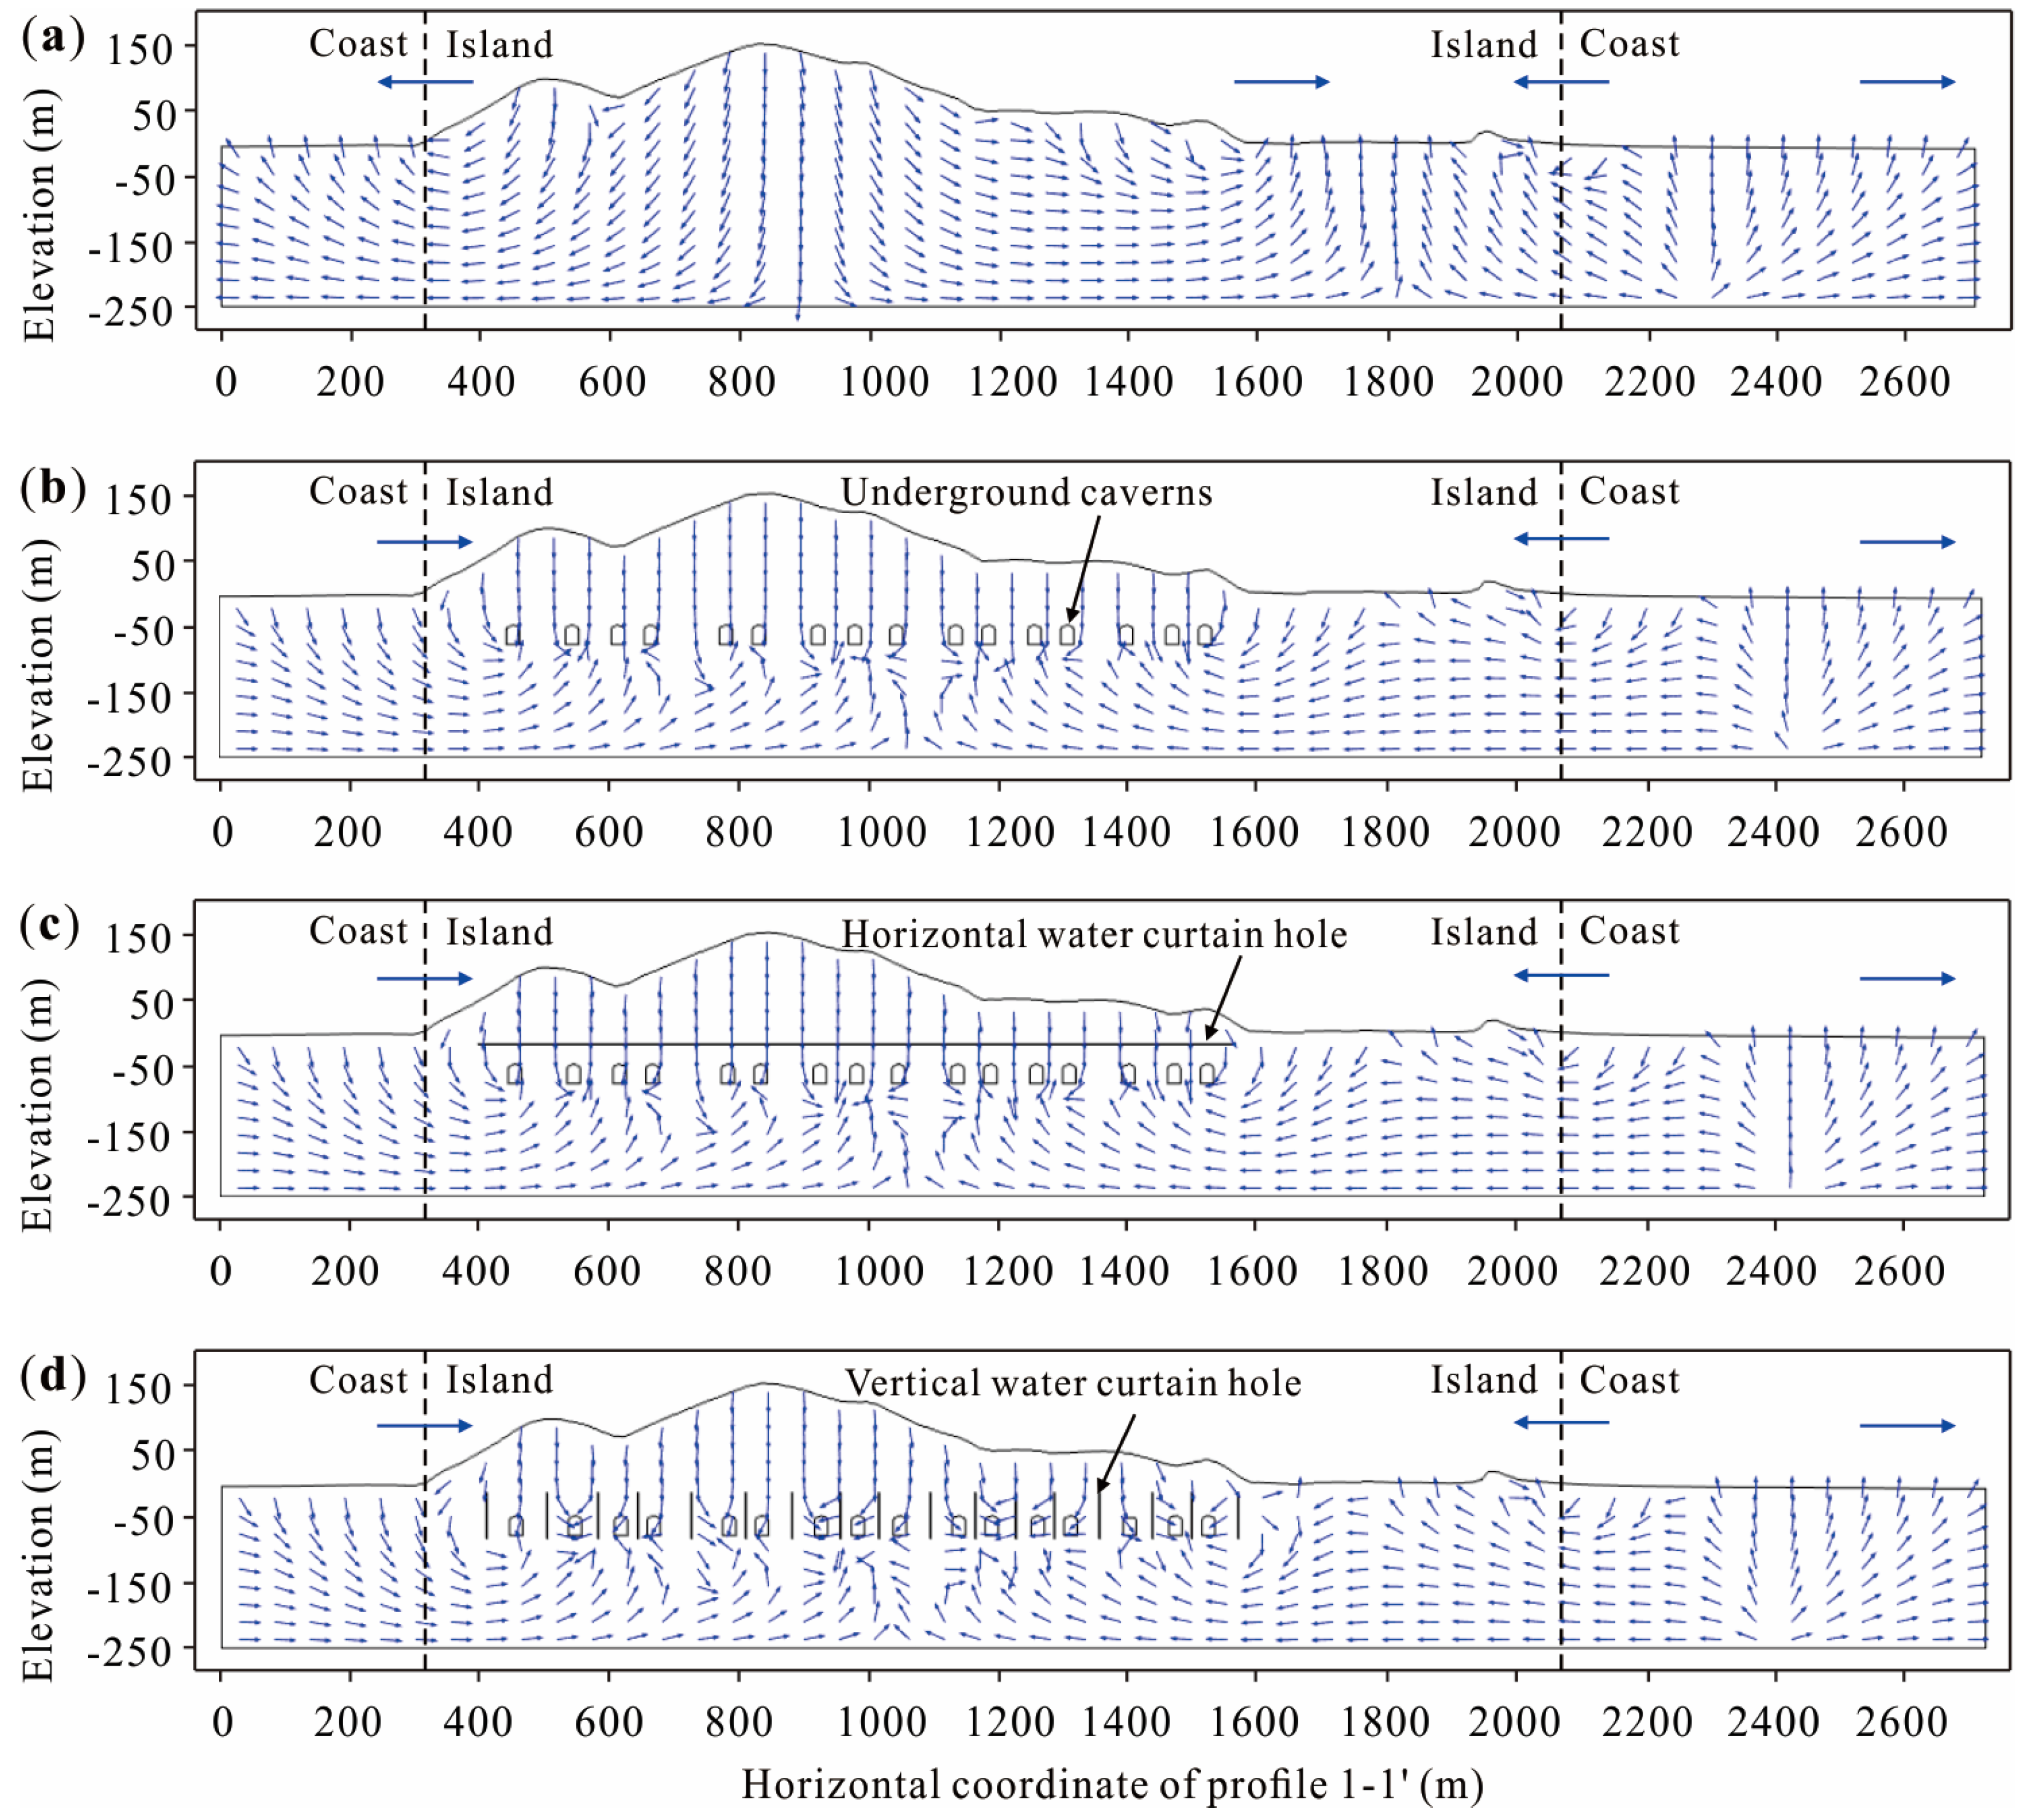
The seepage direction of the groundwater on profile 1-1’ was analyzed. Figure 8 shows the groundwater seepage direction at the maximum tidal water level. Before the excavation of the underground cavern (as shown in Figure 8a), groundwater seepage from the island to the coast occurred under the natural recharge effect. After the excavation of the underground cavern (as shown in Figure 8b), the groundwater in the surrounding rocks seeped into the cavern. On the coast, closer to the underground cavern, the water begins to flow into the island. However, the direction of groundwater seepage is not changed significantly on the coast far from the underground cavern. In the case of setting a horizontal water curtain system (as shown in Figure 8c), the seepage field between the underground cavern and the water curtain hole is supplied by the horizontal water curtain system. Compared with the condition in which no water curtain system is present, the direction of groundwater seepage has not changed significantly. The vertical water curtain system (as shown in Figure 8d) obviously changes the seepage direction of the groundwater around the cavern, that is, the vertical water curtain system greatly changes the seepage field in the underground cavern’s surrounding rock.
4.2.2. Groundwater Seepage Velocity
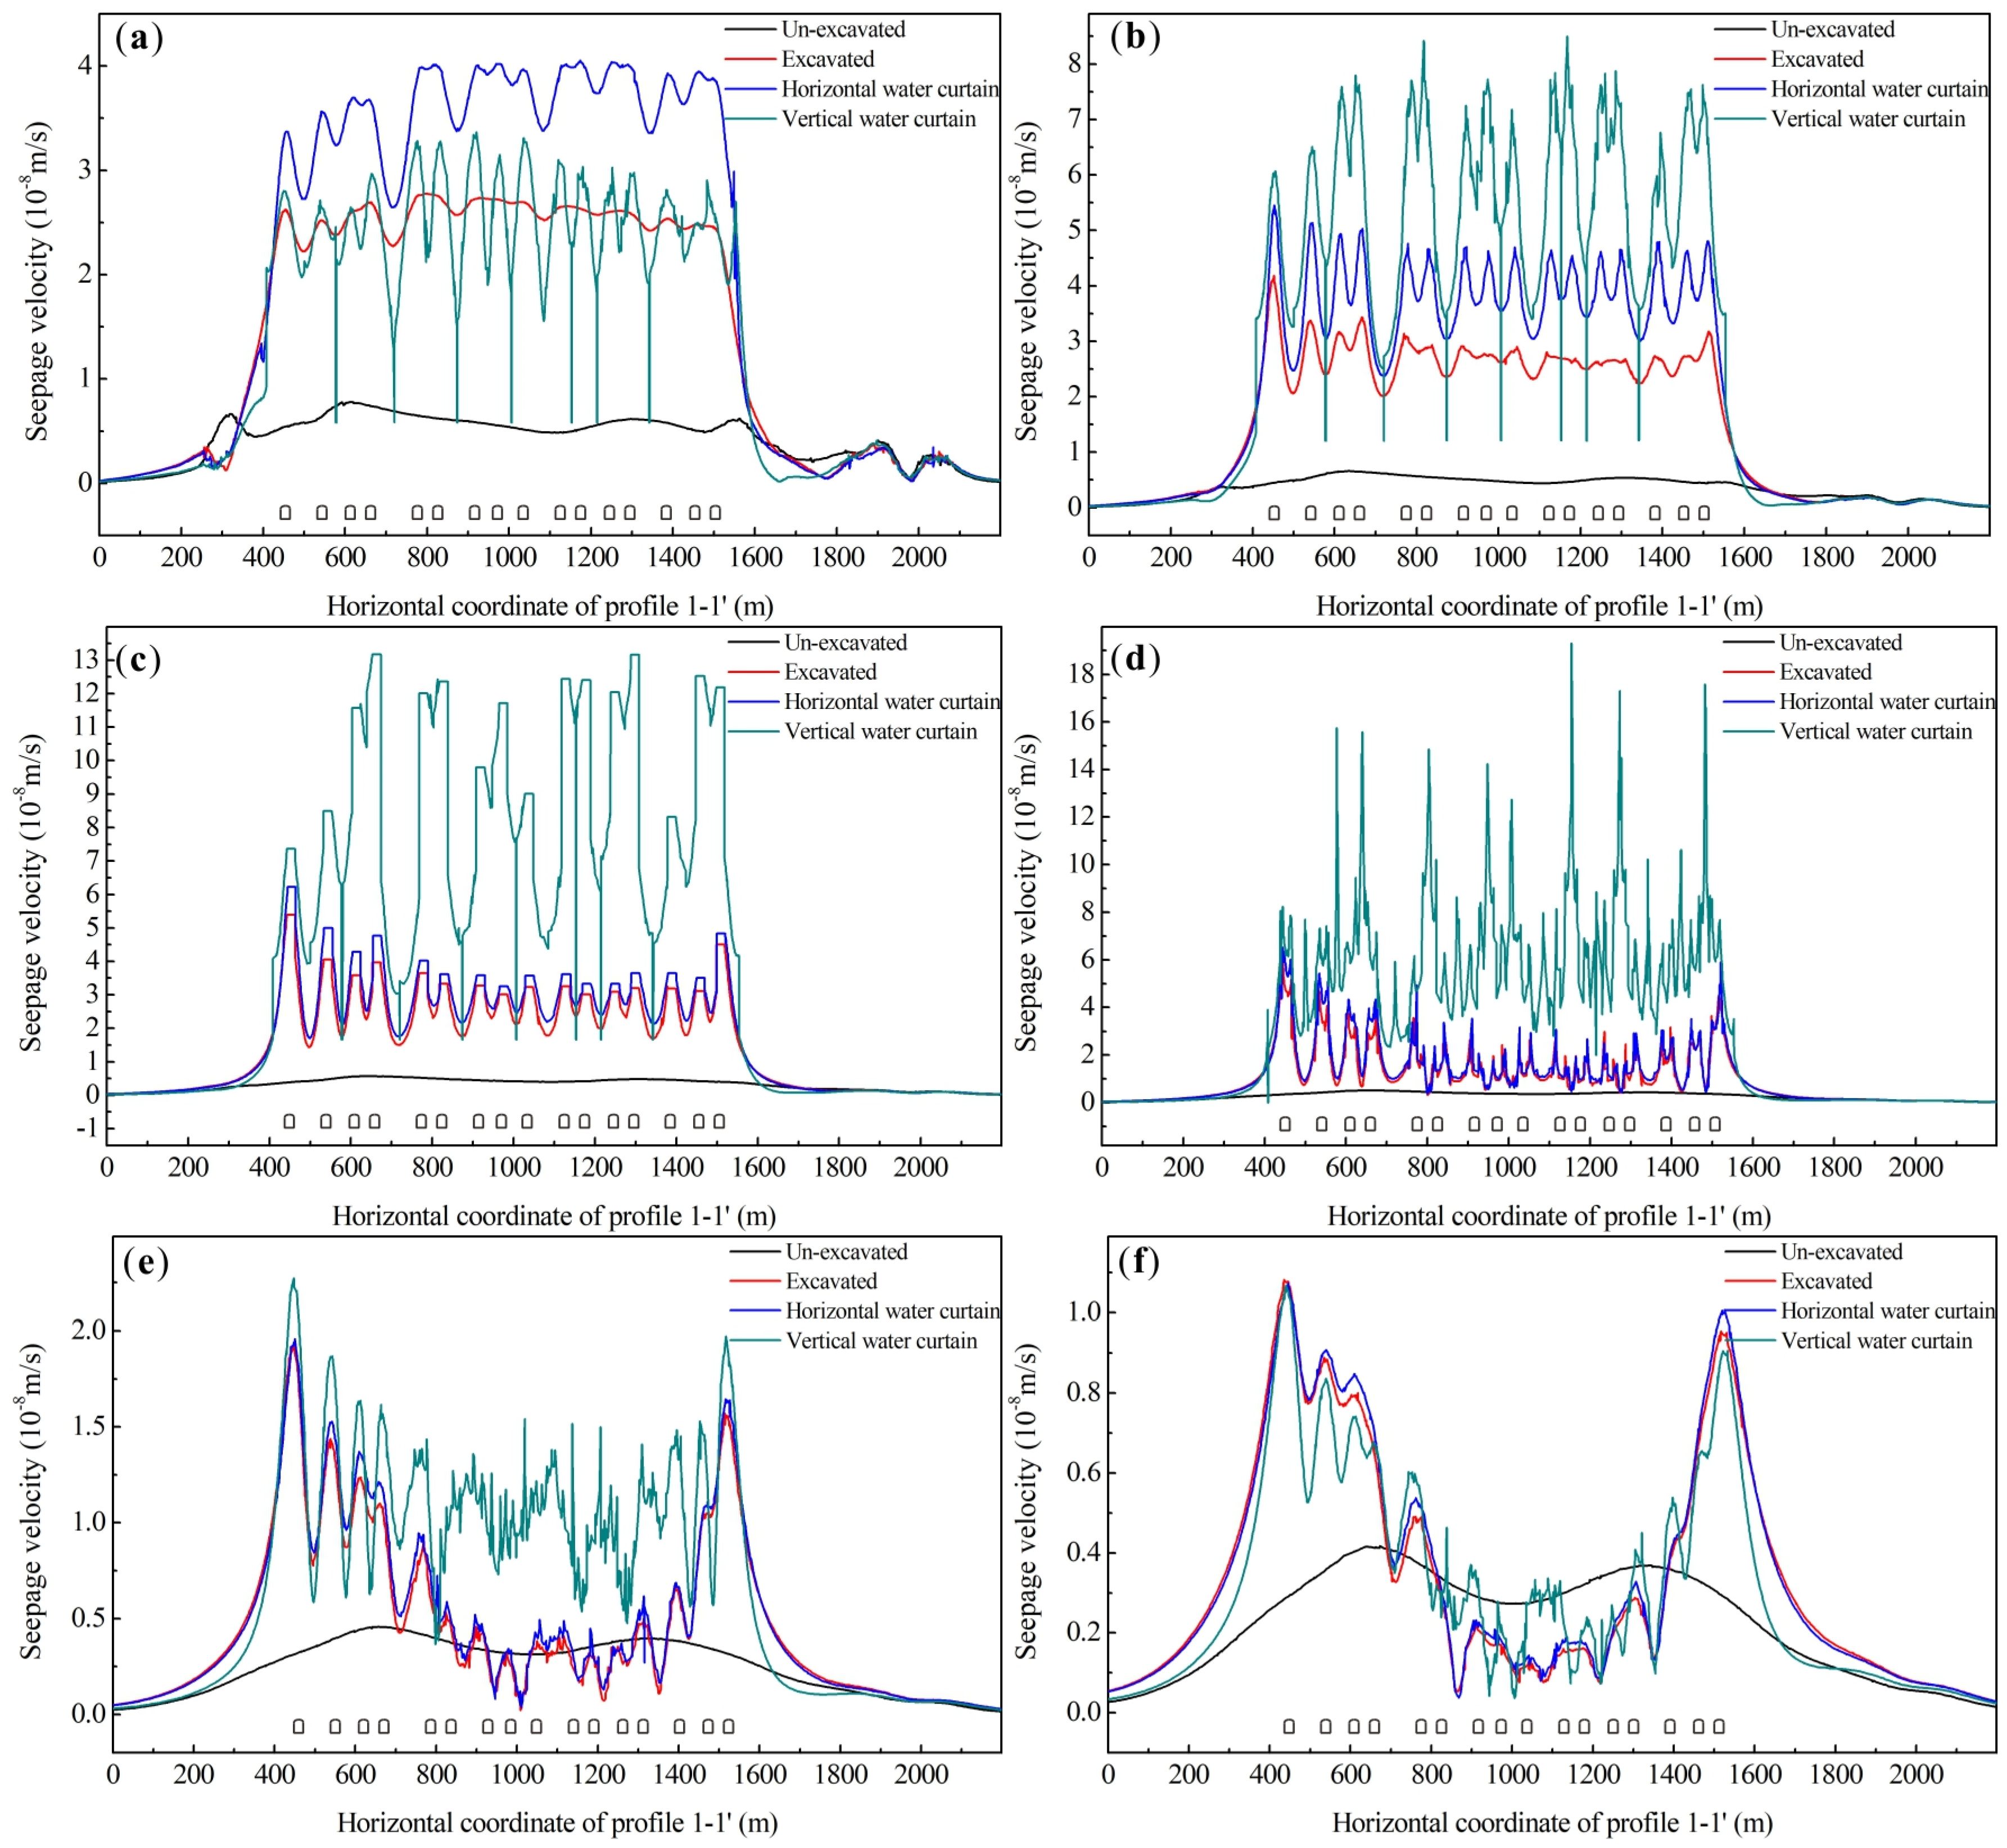
Six horizontal measuring lines were arranged at different elevations (−20 m, −40 m, −60 m, −80 m, −100 m and −120 m) of profile 1-1’. Figure 9 shows the groundwater seepage velocity at the maximum tidal water level. The seepage velocities of the groundwater on the lines were analyzed. Before the excavation of the underground caverns, due to the influence of the terrain, the groundwater seepage velocity inside the island is large, while the groundwater seepage velocity outside the shoreline is relatively small. After the excavation of the underground caverns, the groundwater seepage velocity increases inside the island, especially in the cavern’s area. However, the groundwater seepage velocity outside the shoreline is relatively stable. After setting up the horizontal and vertical water curtain system, the groundwater seepage velocity in the cavern area is further increased as a result of the water curtain system recharge. Within the elevation of 40 m to 80 m, the groundwater seepage velocity of the vertical water curtain system condition is higher than that of the un-excavated condition, the excavated condition and the horizontal water curtain system condition. In the vertical direction, the closer to the storage cavern, the larger fluctuation of the seepage velocity.
At the elevation of −20 m (as shown in Figure 9a), the groundwater seepage velocities of the 4 conditions are less than 4 × 10⁻⁸ m/s. Above the underground caverns, the groundwater seepage velocity of the horizontal water curtain model is the highest. At the elevation of −40 m (as shown in Figure 9b), the groundwater seepage velocities of the four conditions are less than 8.5 × 10⁻⁸ m/s. Compared with the elevation of −20 m, the groundwater seepage velocity under the vertical water curtain system condition increases the most. At the elevation of −60 m (as shown in Figure 9c), the measuring line passes through the underground caverns. The groundwater seepage velocities of the four conditions are less than 13.2 × 10⁻⁸ m/s. The seepage velocity of the groundwater in the location of the underground cavern fluctuates sharply, and the local maximum value of the groundwater seepage velocity is obtained at the location of the underground cavern. Compared with the other 3 conditions, the groundwater seepage velocity of the vertical water curtain system increased significantly. At the elevation of −80 m (as shown in Figure 9d), the measuring line is located below the underground caverns. The groundwater seepage velocity of the un-excavated condition, the excavated condition and the horizontal water curtain system condition decrease slightly compared with −60 m. On the contrary, under the influence of the vertical water curtain, the groundwater seepage velocity increases with a maximum value of 19.3 × 10⁻⁸ m/s. Figure 9e,f show the groundwater seepage velocity on the measuring line at the elevation of −100 m and −120 m respectively. The maximum groundwater seepage velocities decrease to 2.27 × 10⁻⁸ m/s and 1.1 × 10⁻⁸ m/s respectively. And at the elevation of −120 m, the groundwater seepage velocity of the un-excavated condition is higher than the other three conditions between the 4# cavern and the 14# cavern.
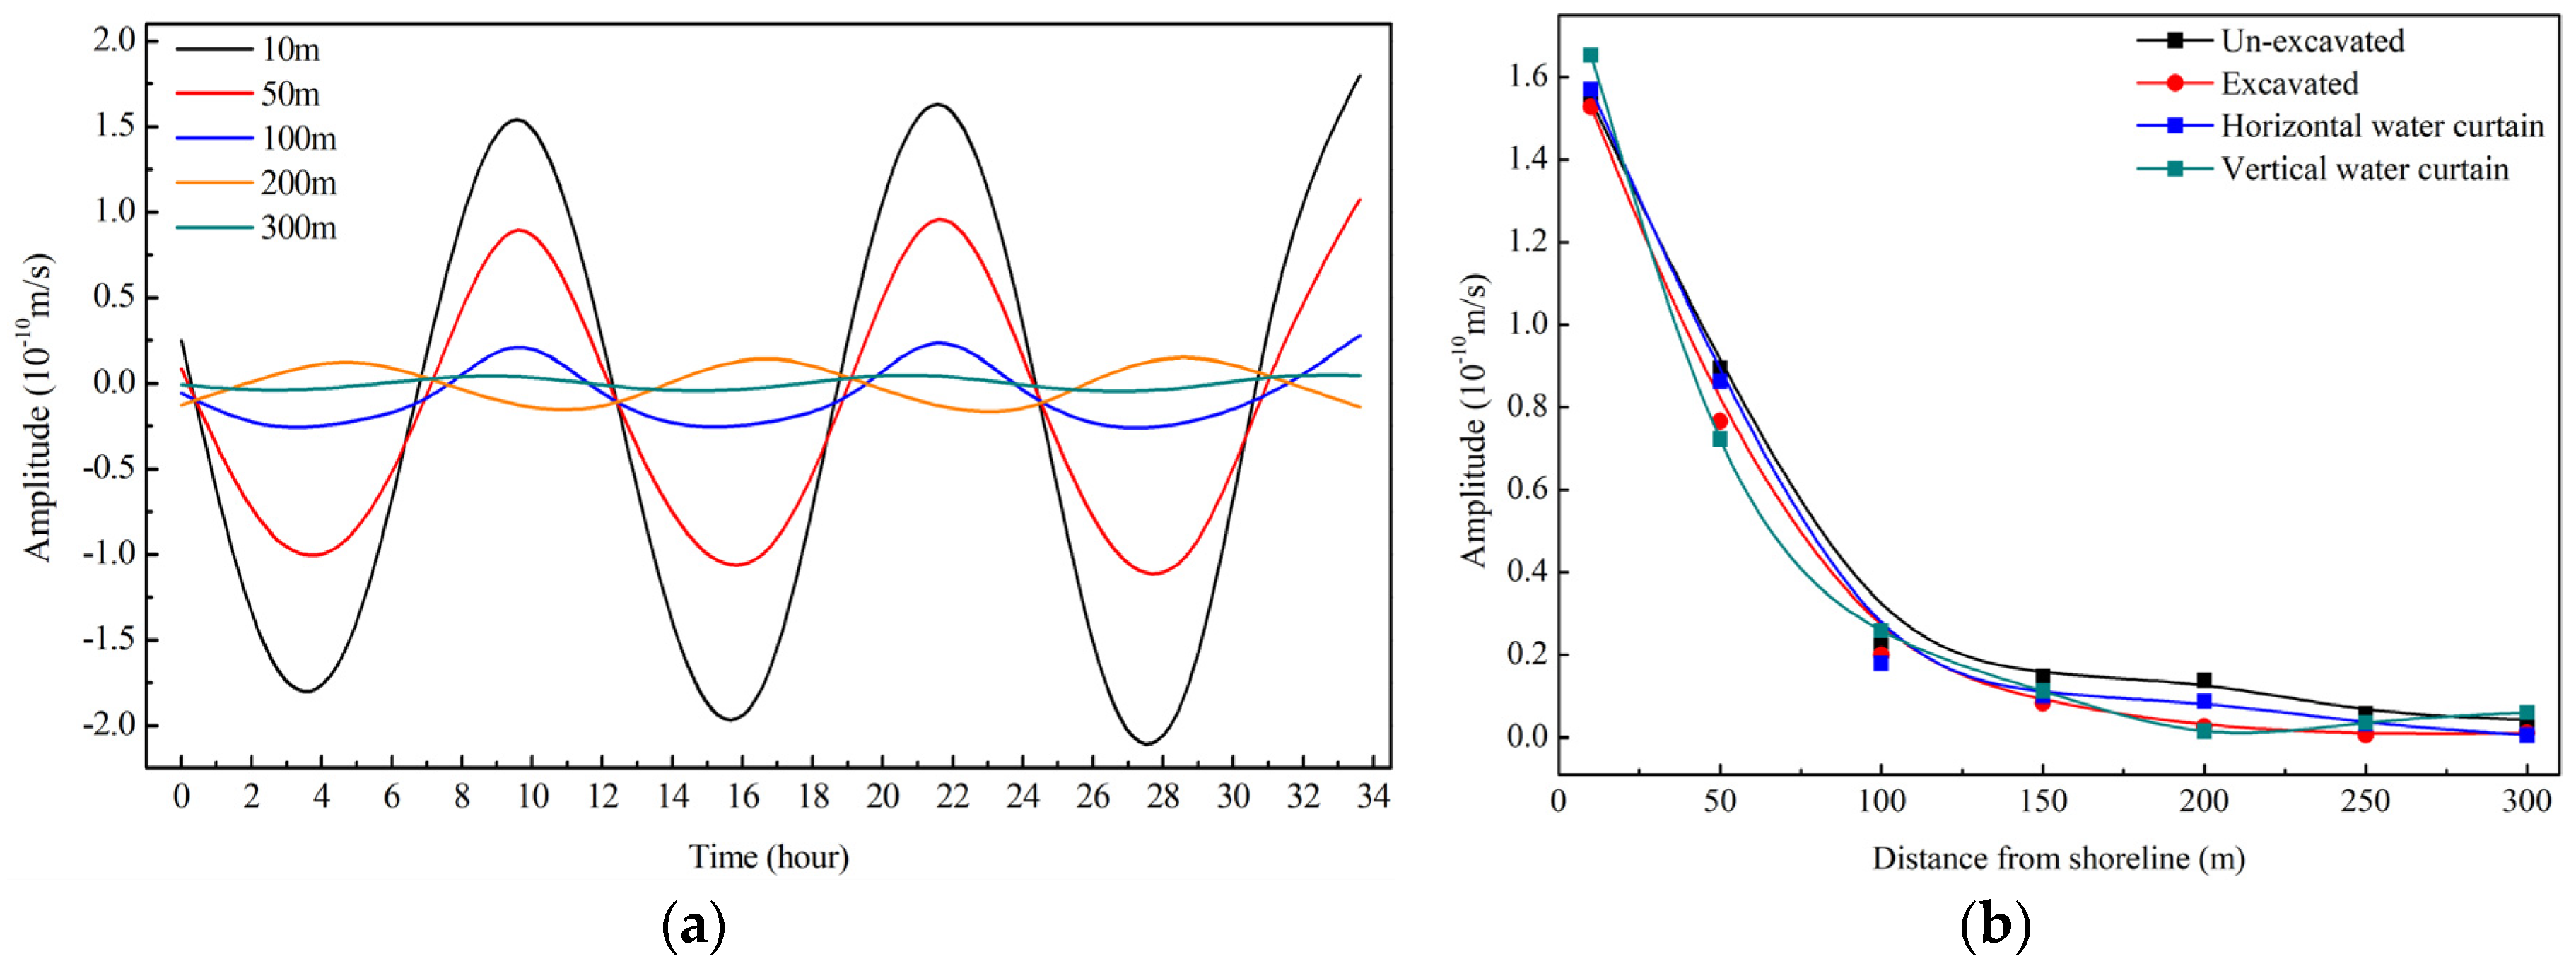
Take the excavated condition as an example. The monitoring points of the groundwater seepage velocity were set on profile 1-1’ at distances of 10 m, 50 m, 100 m, 200 m and 300 m from the shoreline. Under the influence of tidal fluctuation, the groundwater seepage velocity will also fluctuate (as shown in Figure 10a). As the distance from the shoreline increases, the fluctuation range of the groundwater seepage velocity decreases. At the same time, the phase of fluctuation at different positions is also different. By comparing the maximum amplitude of the groundwater seepage velocity under four different conditions, it is found that the fluctuation amplitude of the groundwater seepage velocity decreases exponentially with the increasing distance from shoreline (as shown in Figure 10b). At 200 m from the shoreline, the fluctuation amplitude of the groundwater seepage velocity decreases to 4.3% of the shoreline.
4.2.3. Groundwater Level
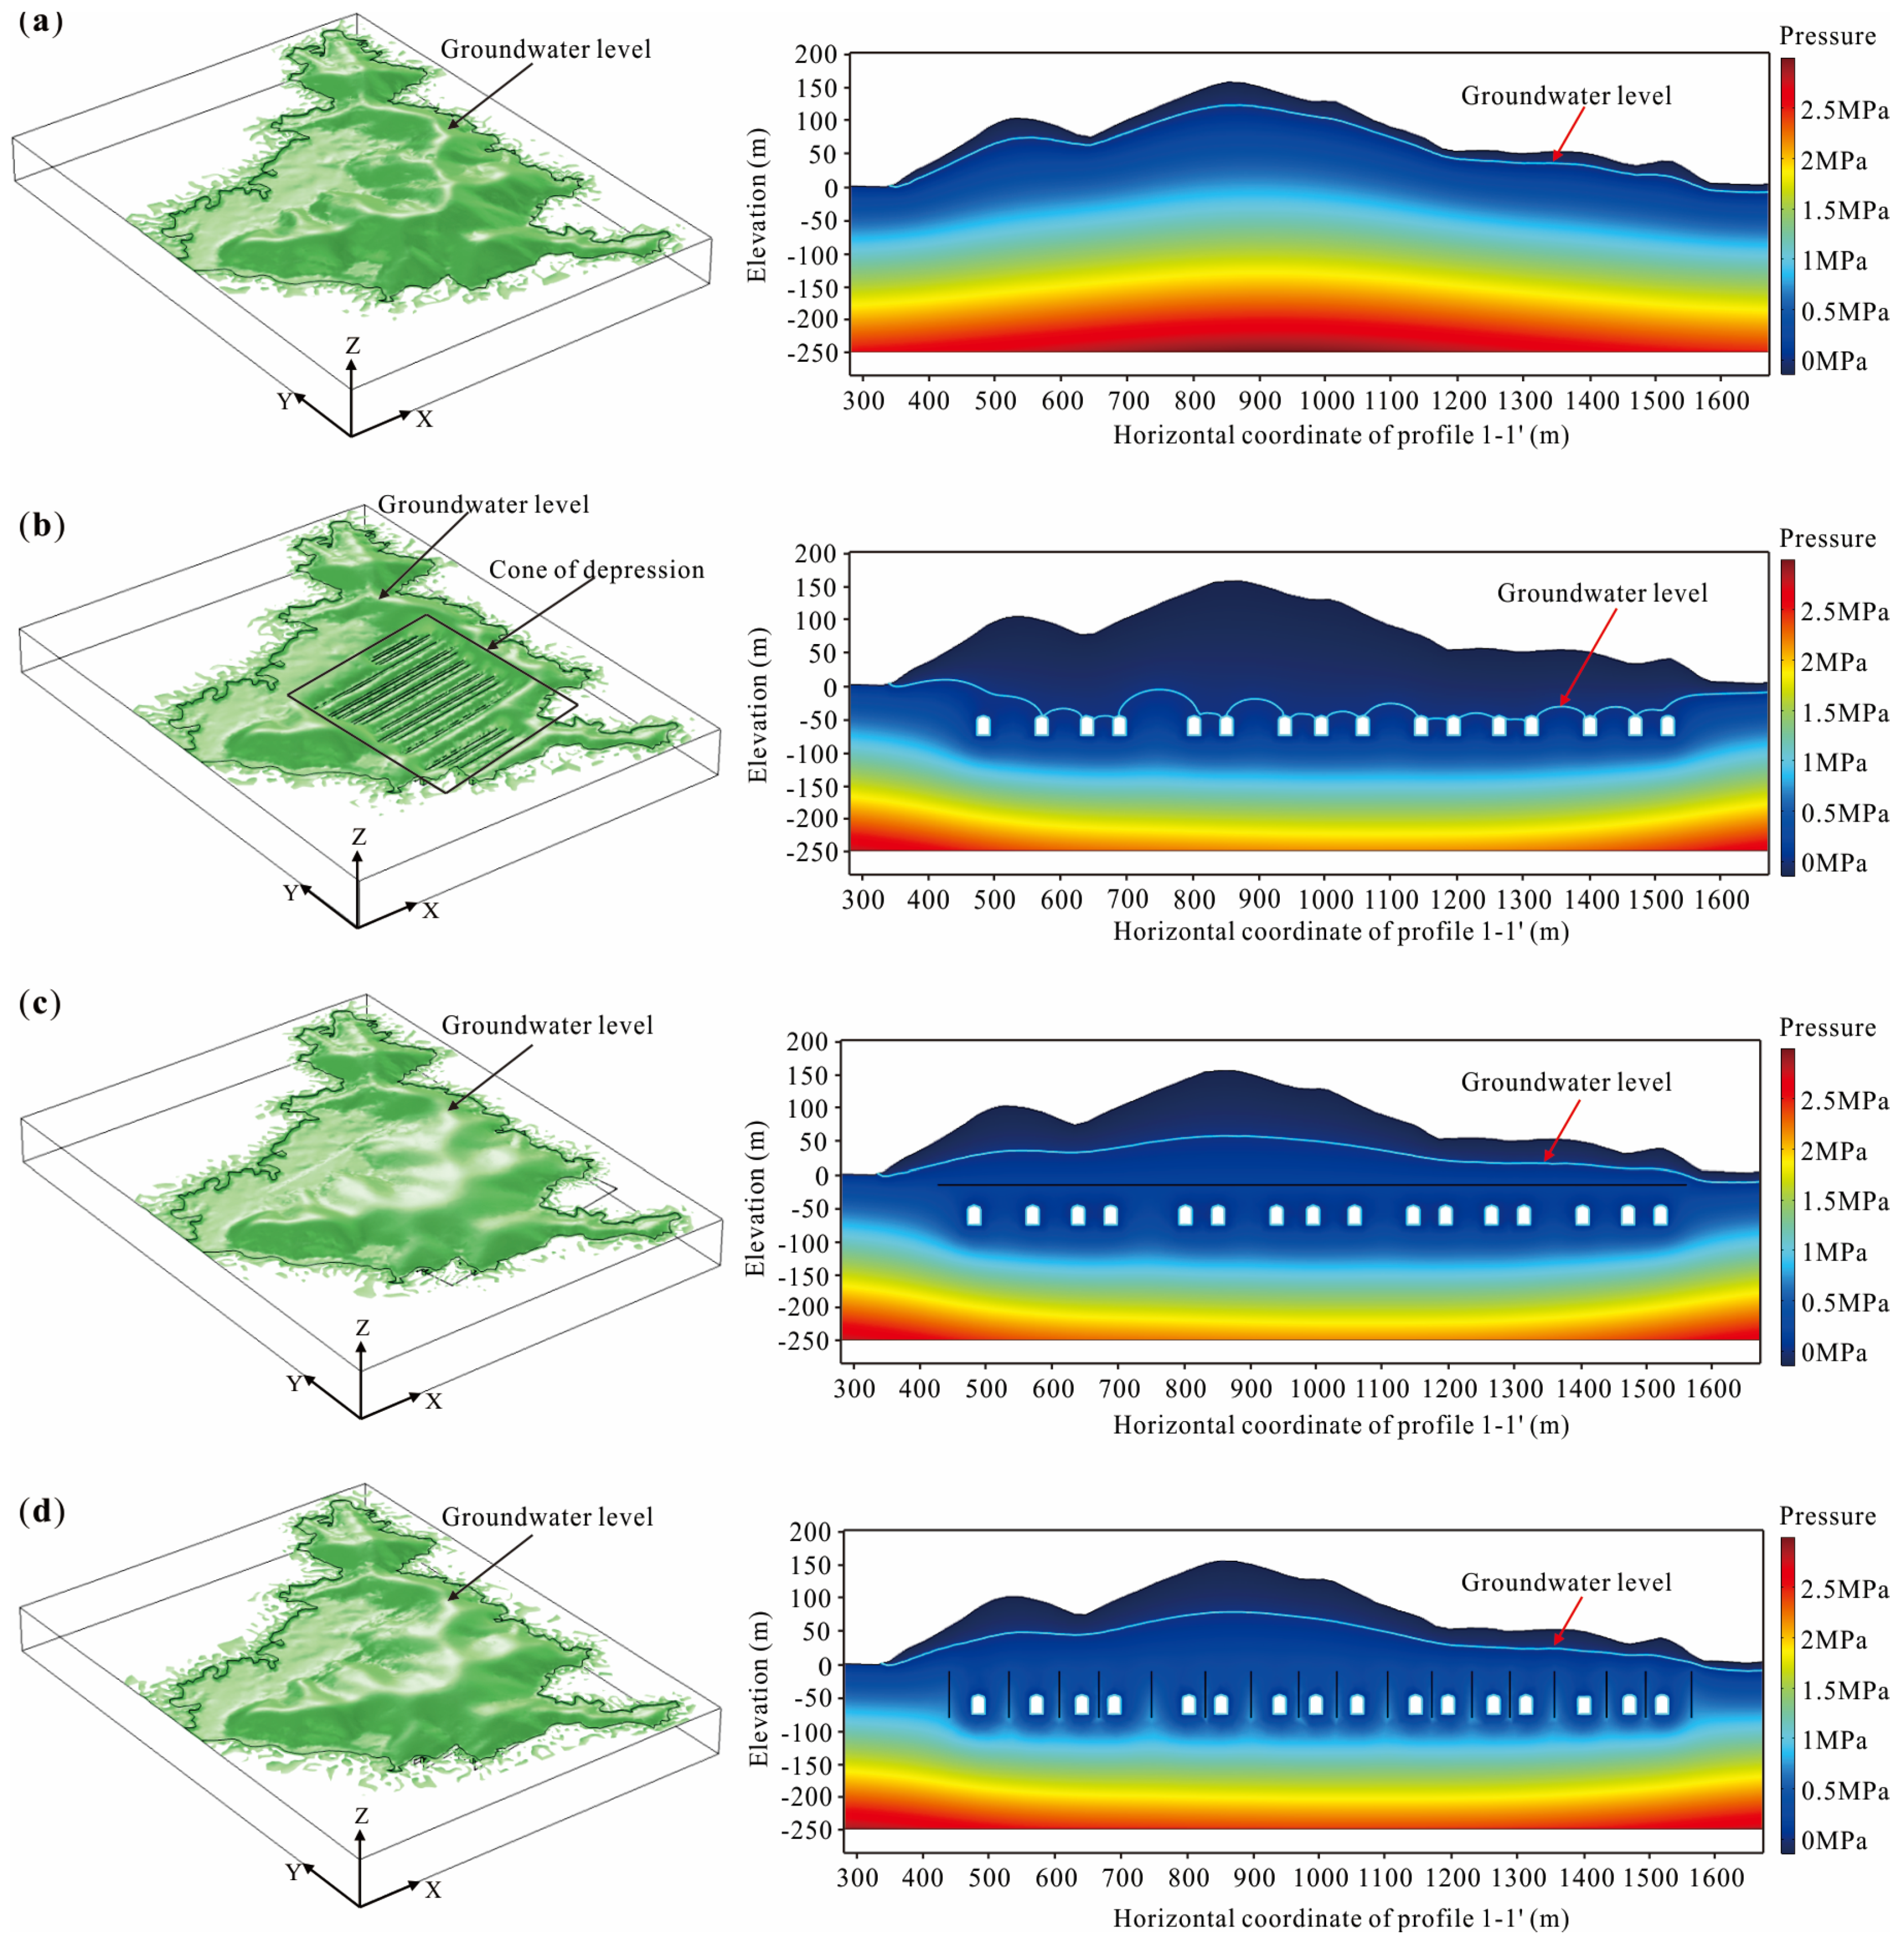
Groundwater level is one of the driving factors of seawater intrusion. The distribution of the groundwater level under four conditions (un-excavated, excavated, horizontal water curtain system, vertical water curtain system) were compared. Taking the maximum tidal water level as the boundary condition, the distribution of the groundwater level under the steady state is calculated (as shown in Figure 11). The variation of the groundwater level is affected by the groundwater seepage direction and the groundwater seepage velocity. Before the underground cavern is excavated (as shown in Figure 11a), the groundwater level is slightly lower than the initial groundwater level. After the underground oil storage cavern is excavated (as shown in Figure 11b), the groundwater level drops sharply within the range of the cavern due to the flow of groundwater from surrounding rocks into the cavern, and a large cone of depression can be formed above the underground cavern. After the horizontal water curtain system is set (as shown in Figure 11c), due to the recharge of the horizontal water curtain system, the groundwater level above the cavern rises. However, the pore water pressure under the cavern shows little change when compared with the excavated condition. After the vertical water curtain system is set (as shown in Figure 11d), the groundwater level above the underground cavern is high, which is similar to the condition where the horizontal water curtain system is set. The pore water pressure under the cavern is higher than the excavated condition, but it is still significantly smaller than the un-excavated condition.
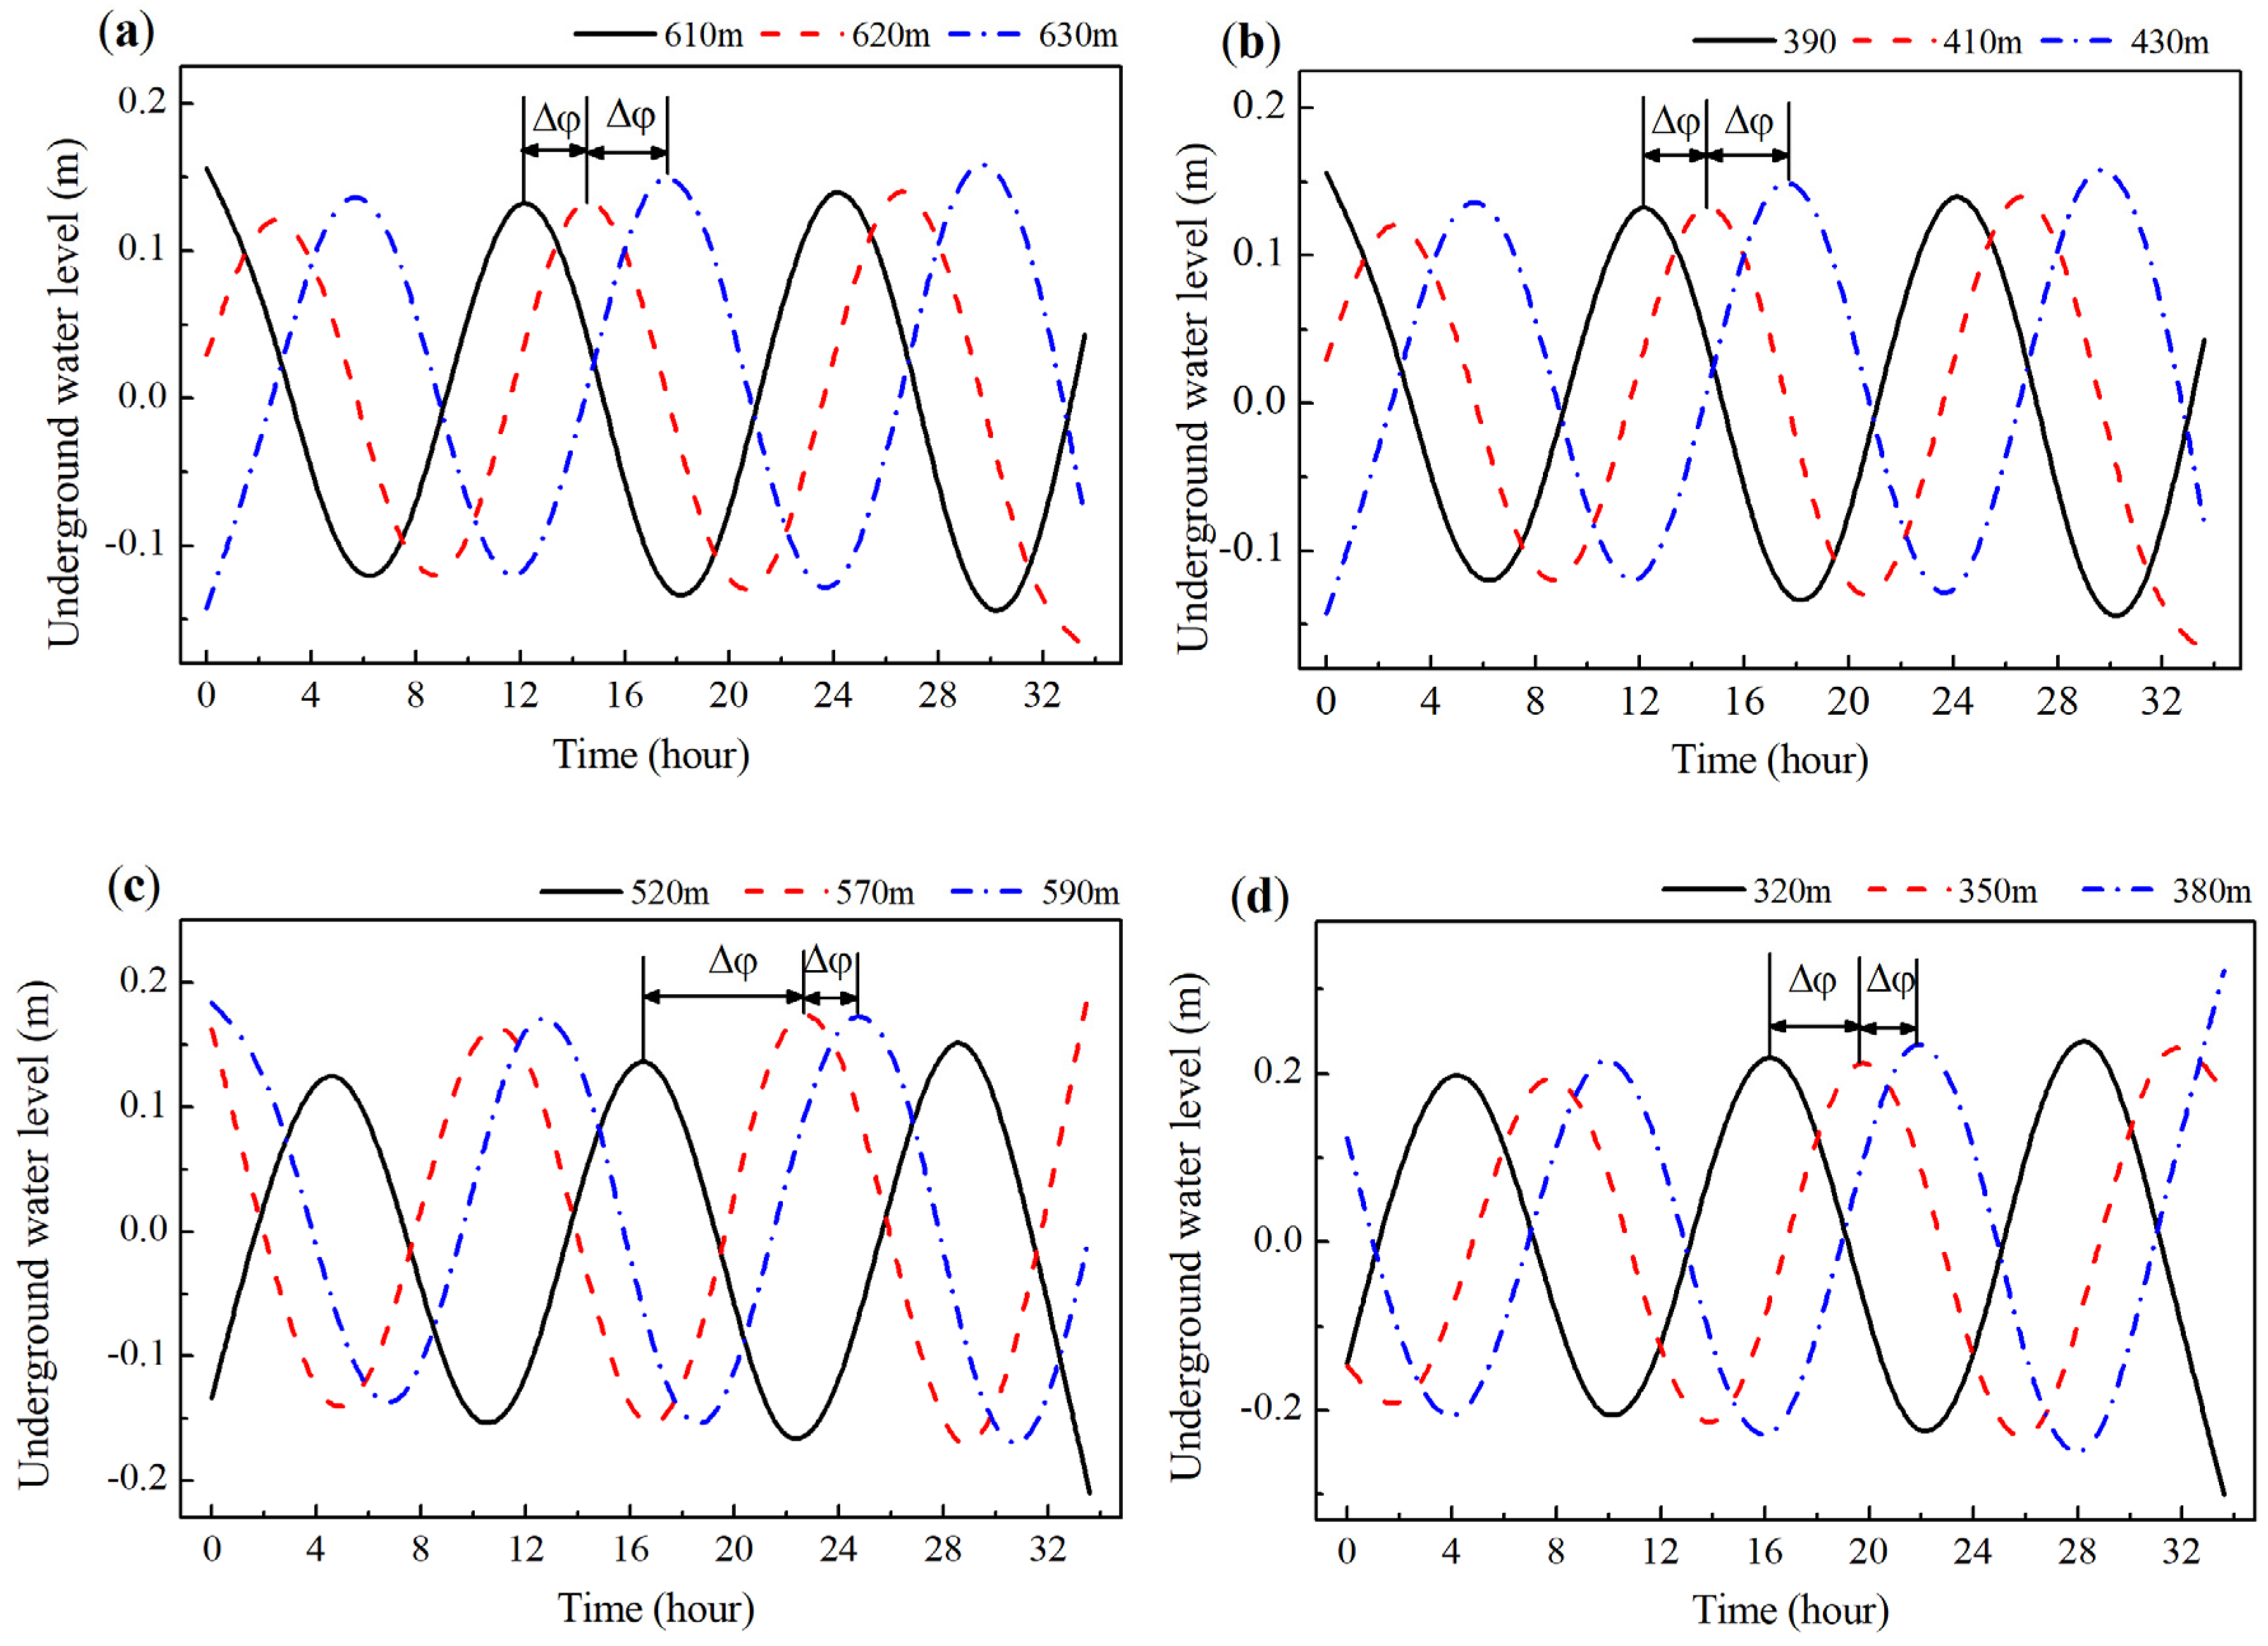
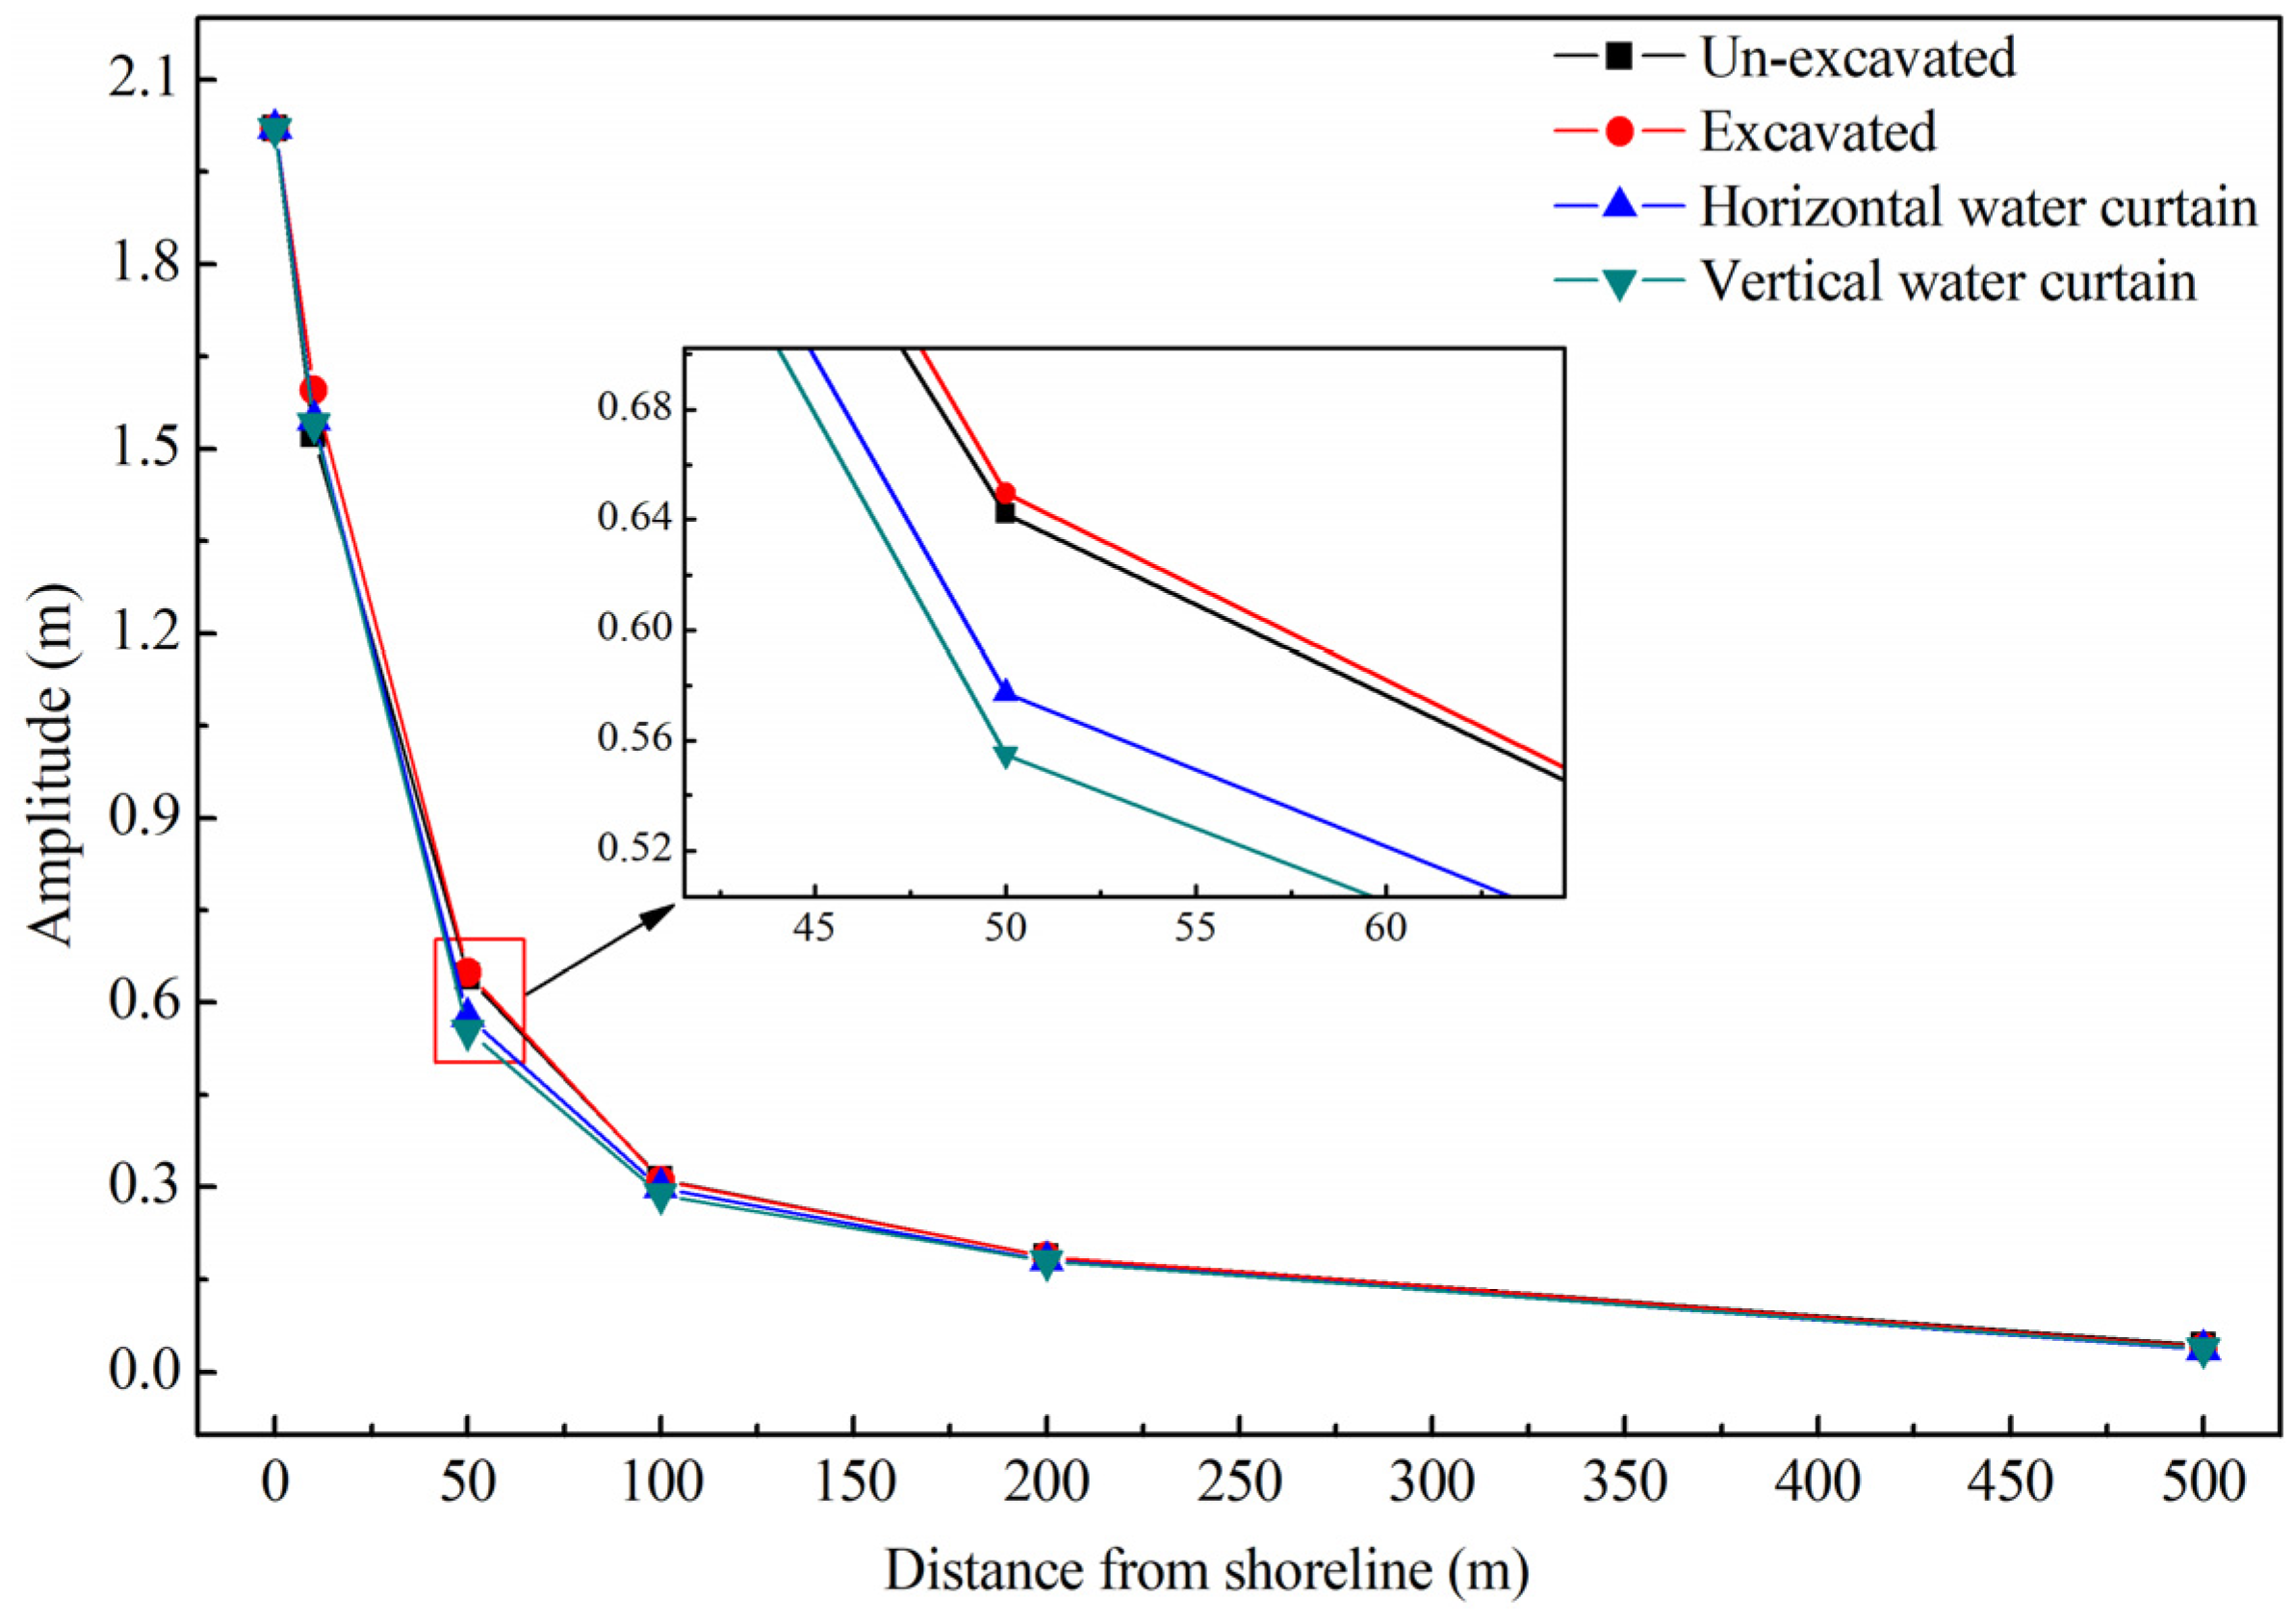
Under the influence of tidal fluctuation, the groundwater level of the island fluctuates regularly. The tides fluctuate sinusoidally. At different distances from the shoreline, the fluctuating phase of the groundwater table varied (as shown in Figure 12). With the increase of the distance from the shoreline, the fluctuating phase of the groundwater table lags. From shoreline to the island, the maximum amplitude of groundwater fluctuation decreases exponentially (as shown in Figure 13). At 200 m from the shoreline, the maximum fluctuation amplitude of the groundwater table decreases to 9.1% of the shoreline. At the same position, the difference in the groundwater fluctuation amplitude under the four conditions is small, and the maximum amplitude ranges from large to small are excavated, un-excavated, the horizontal water curtain system and the vertical water curtain system.
4.3. Characteristics of Seawater Intrusion
4.3.1. Temporal-Spatial Variations of Seawater Intrusion
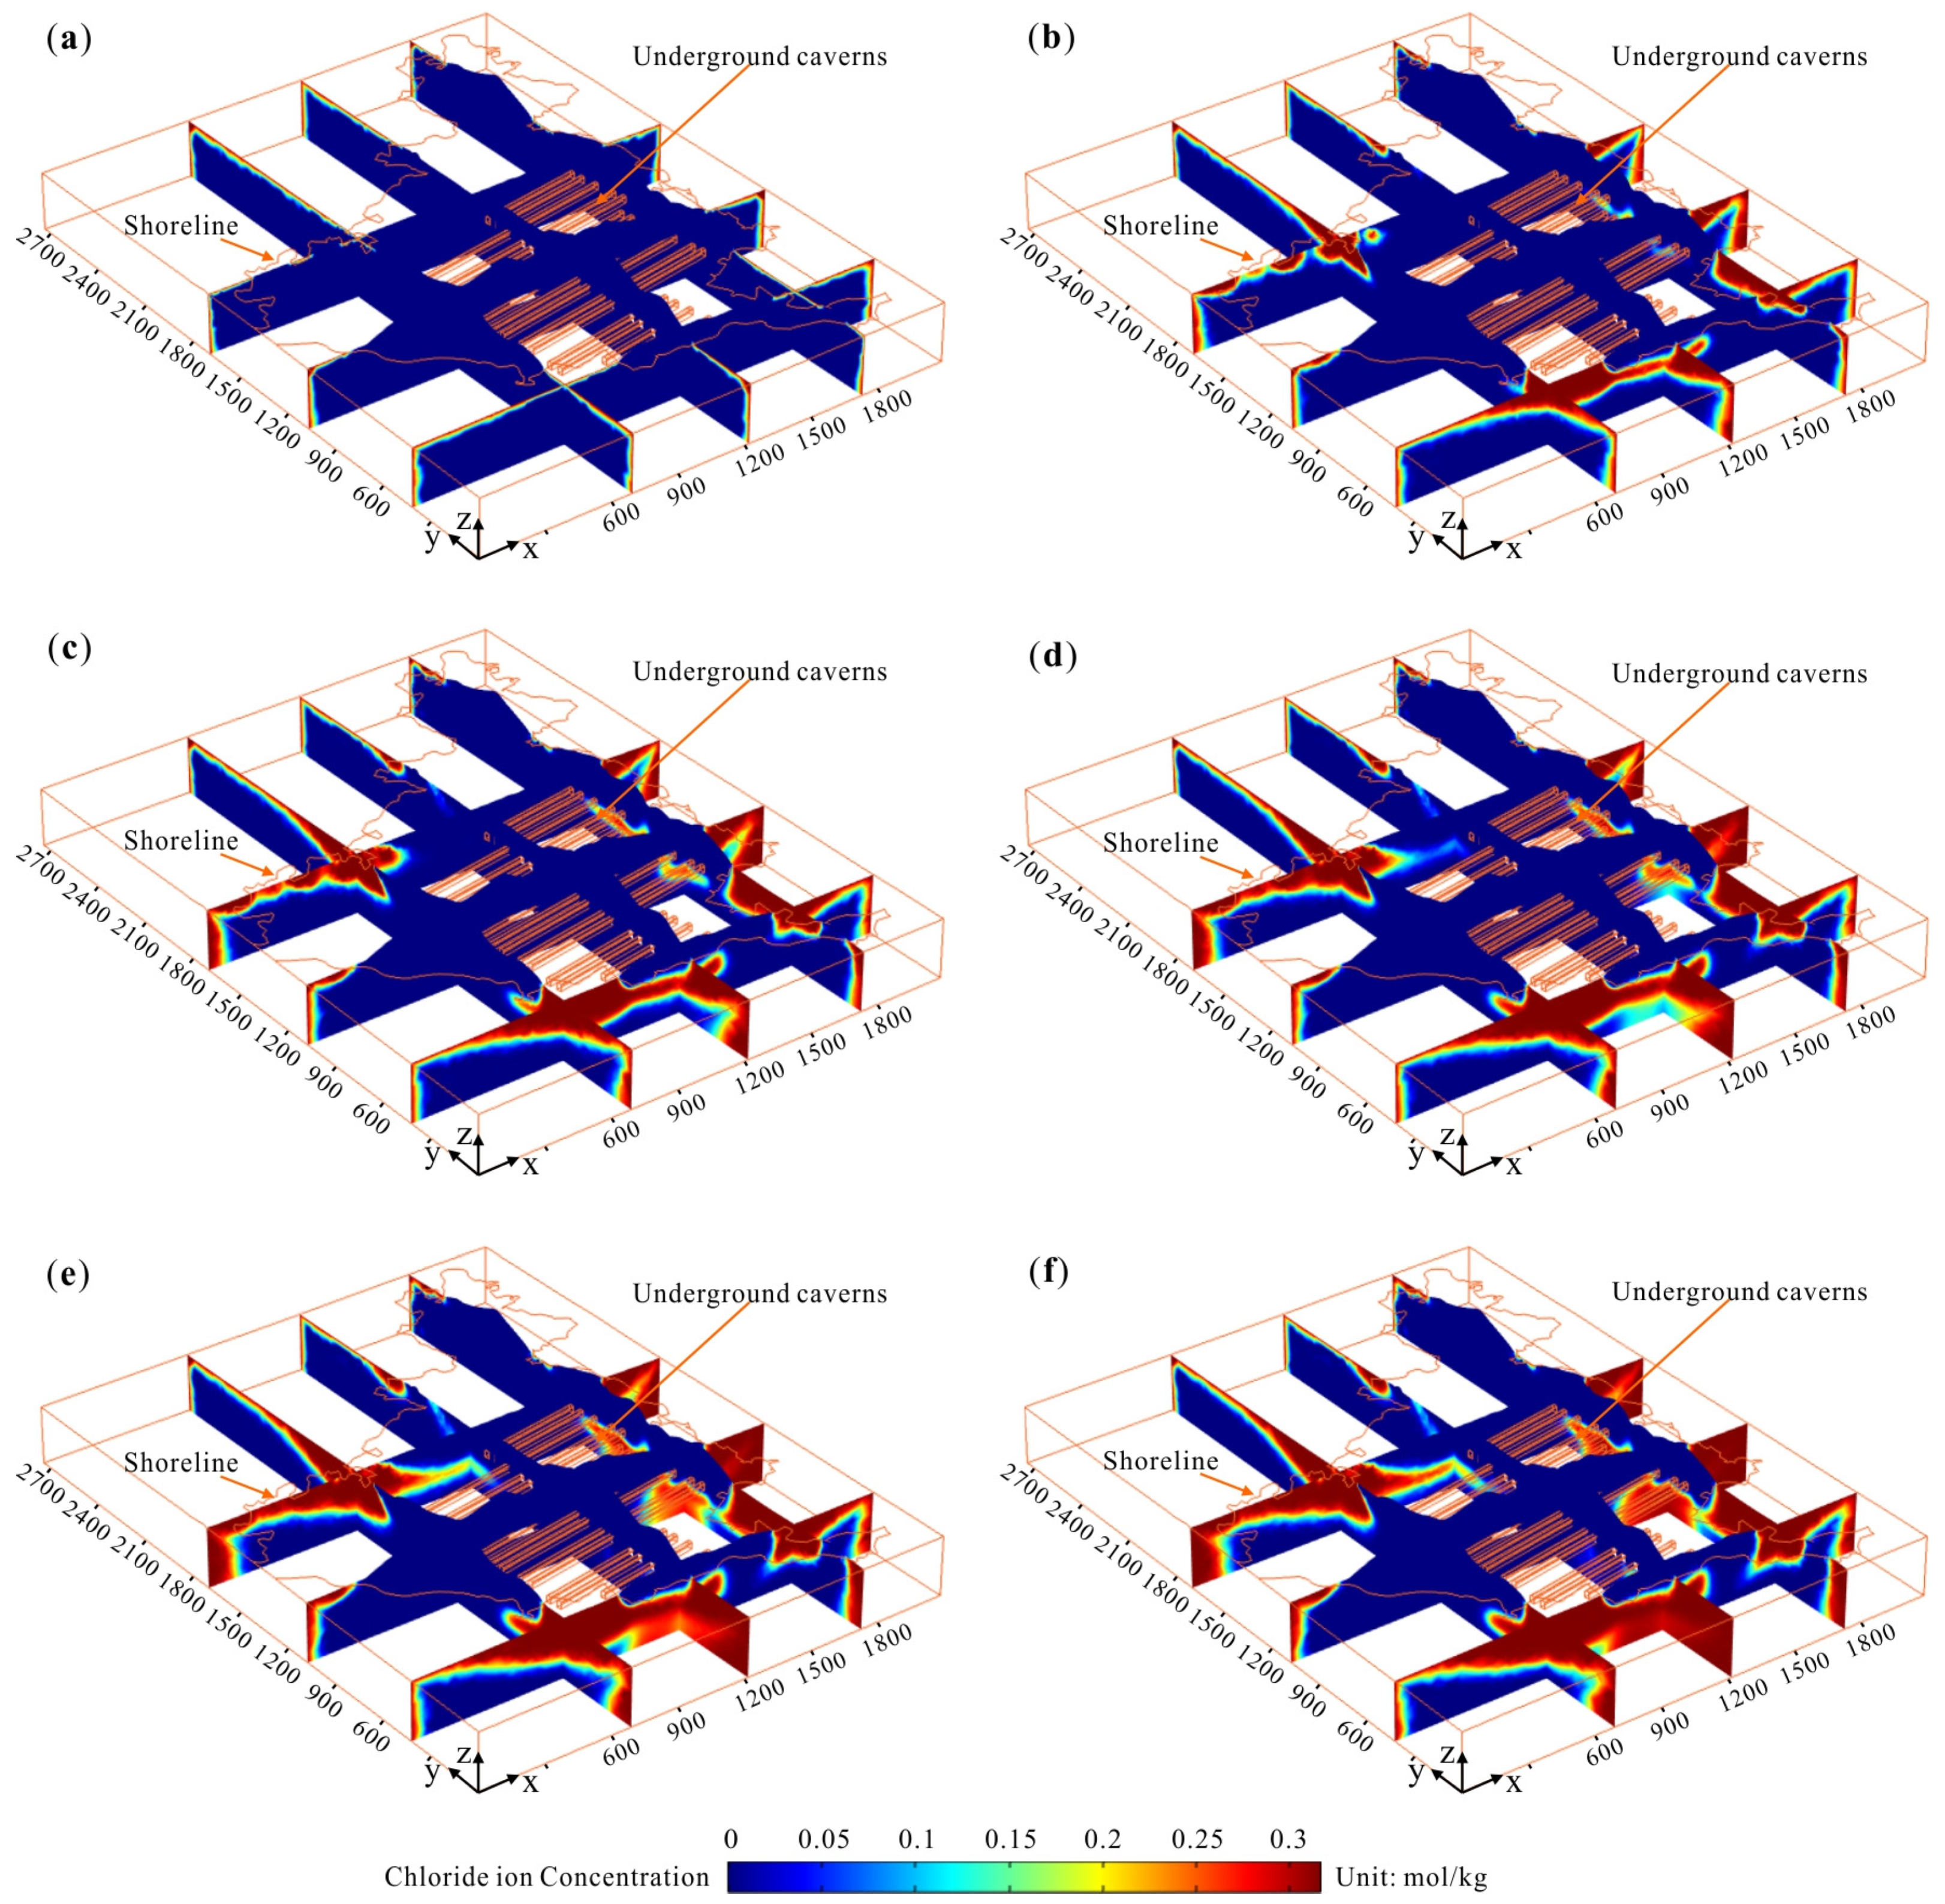
After the underground cavern is excavated, the seawater will gradually intrude into the island. The temporal-spatial variations of seawater intrusion in 50 years after underground cavern excavation were simulated. The simulation results are shown in Figure 14. The temporal-spatial variations of seawater intrusion are different at different locations within the island. Closer to the underground cavern, the seawater intrusion velocity is higher. In terms of this project, the seawater intrusion on the right side and the front of the island develops rapidly. This characteristic is related to the distribution of groundwater seepage velocity in the island. Because the density of seawater is greater than that of freshwater, seawater will intrude into the interior of the underground cavern from below.
4.3.2. Influence of Water Curtain System on Seawater Intrusion
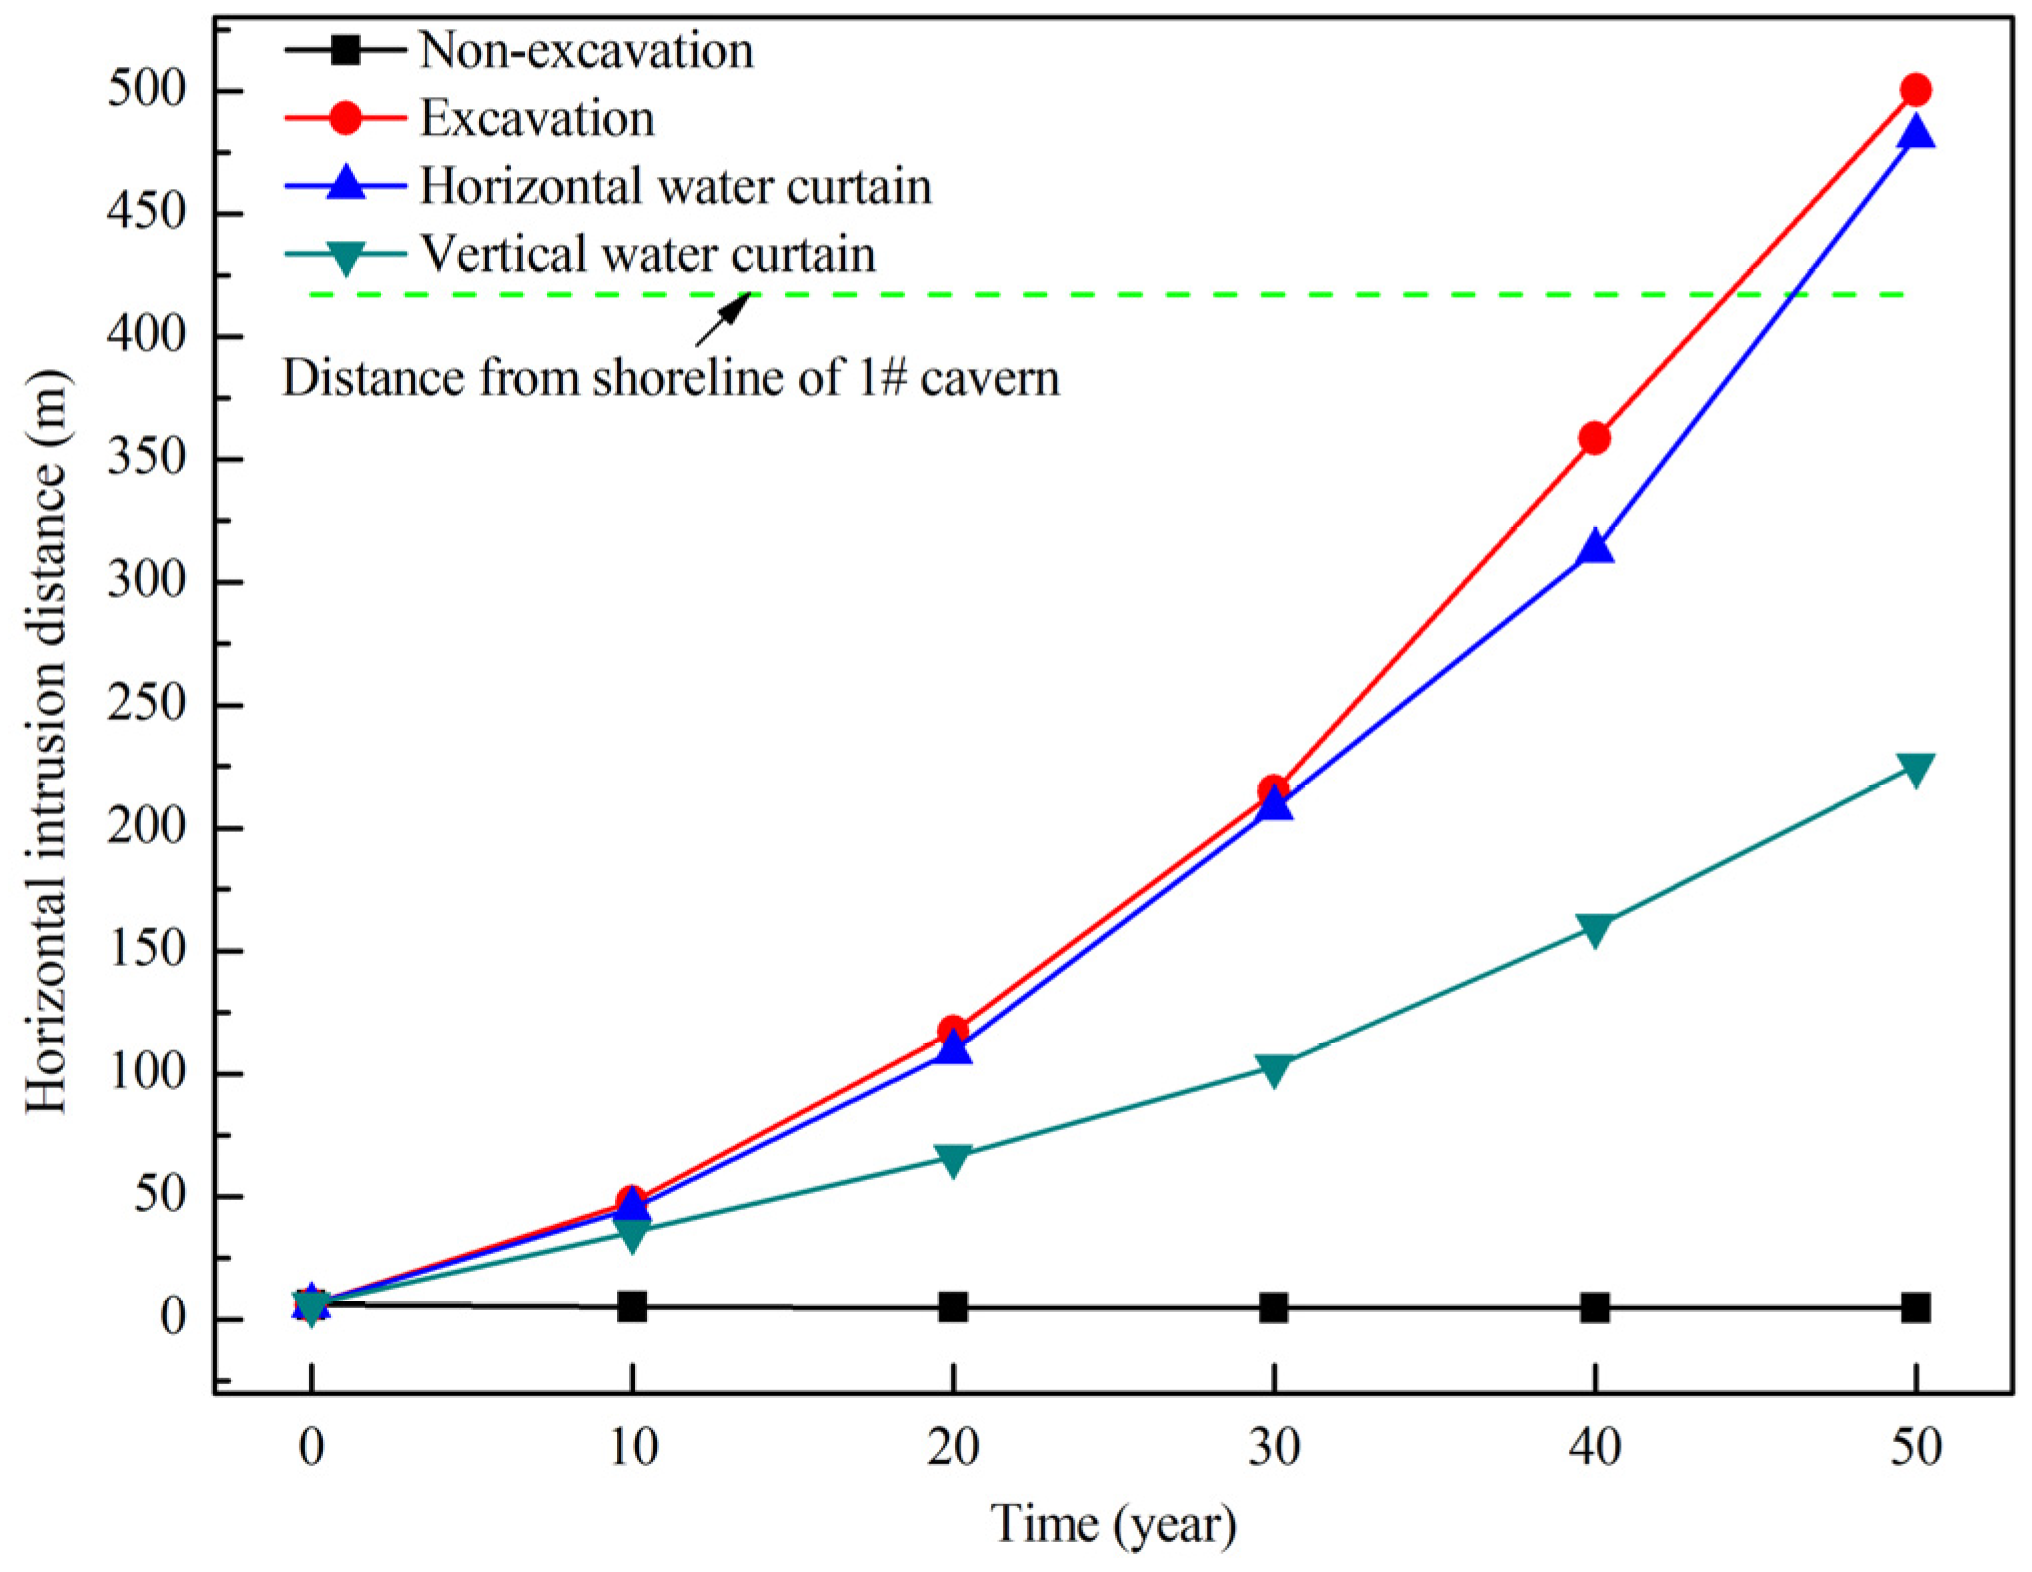
The seawater intrusion on the left side of profile 1-1’ in the horizontal direction was compared in the four tested conditions (as shown in Figure 15). Before the excavation of the underground cavern, the seawater intrusion velocity is quite low and has no tendency to increase. After the excavation of the underground cavern, the seawater intrusion velocity gradually increases with time. After the horizontal water curtain system is set, the rate of seawater intrusion in the early stage changes little. However, within the horizontal water curtain range, the seawater intrusion velocity has significantly reduced. After the vertical water curtain system is set, the seawater intrusion velocity decreases significantly during the entire simulation time.
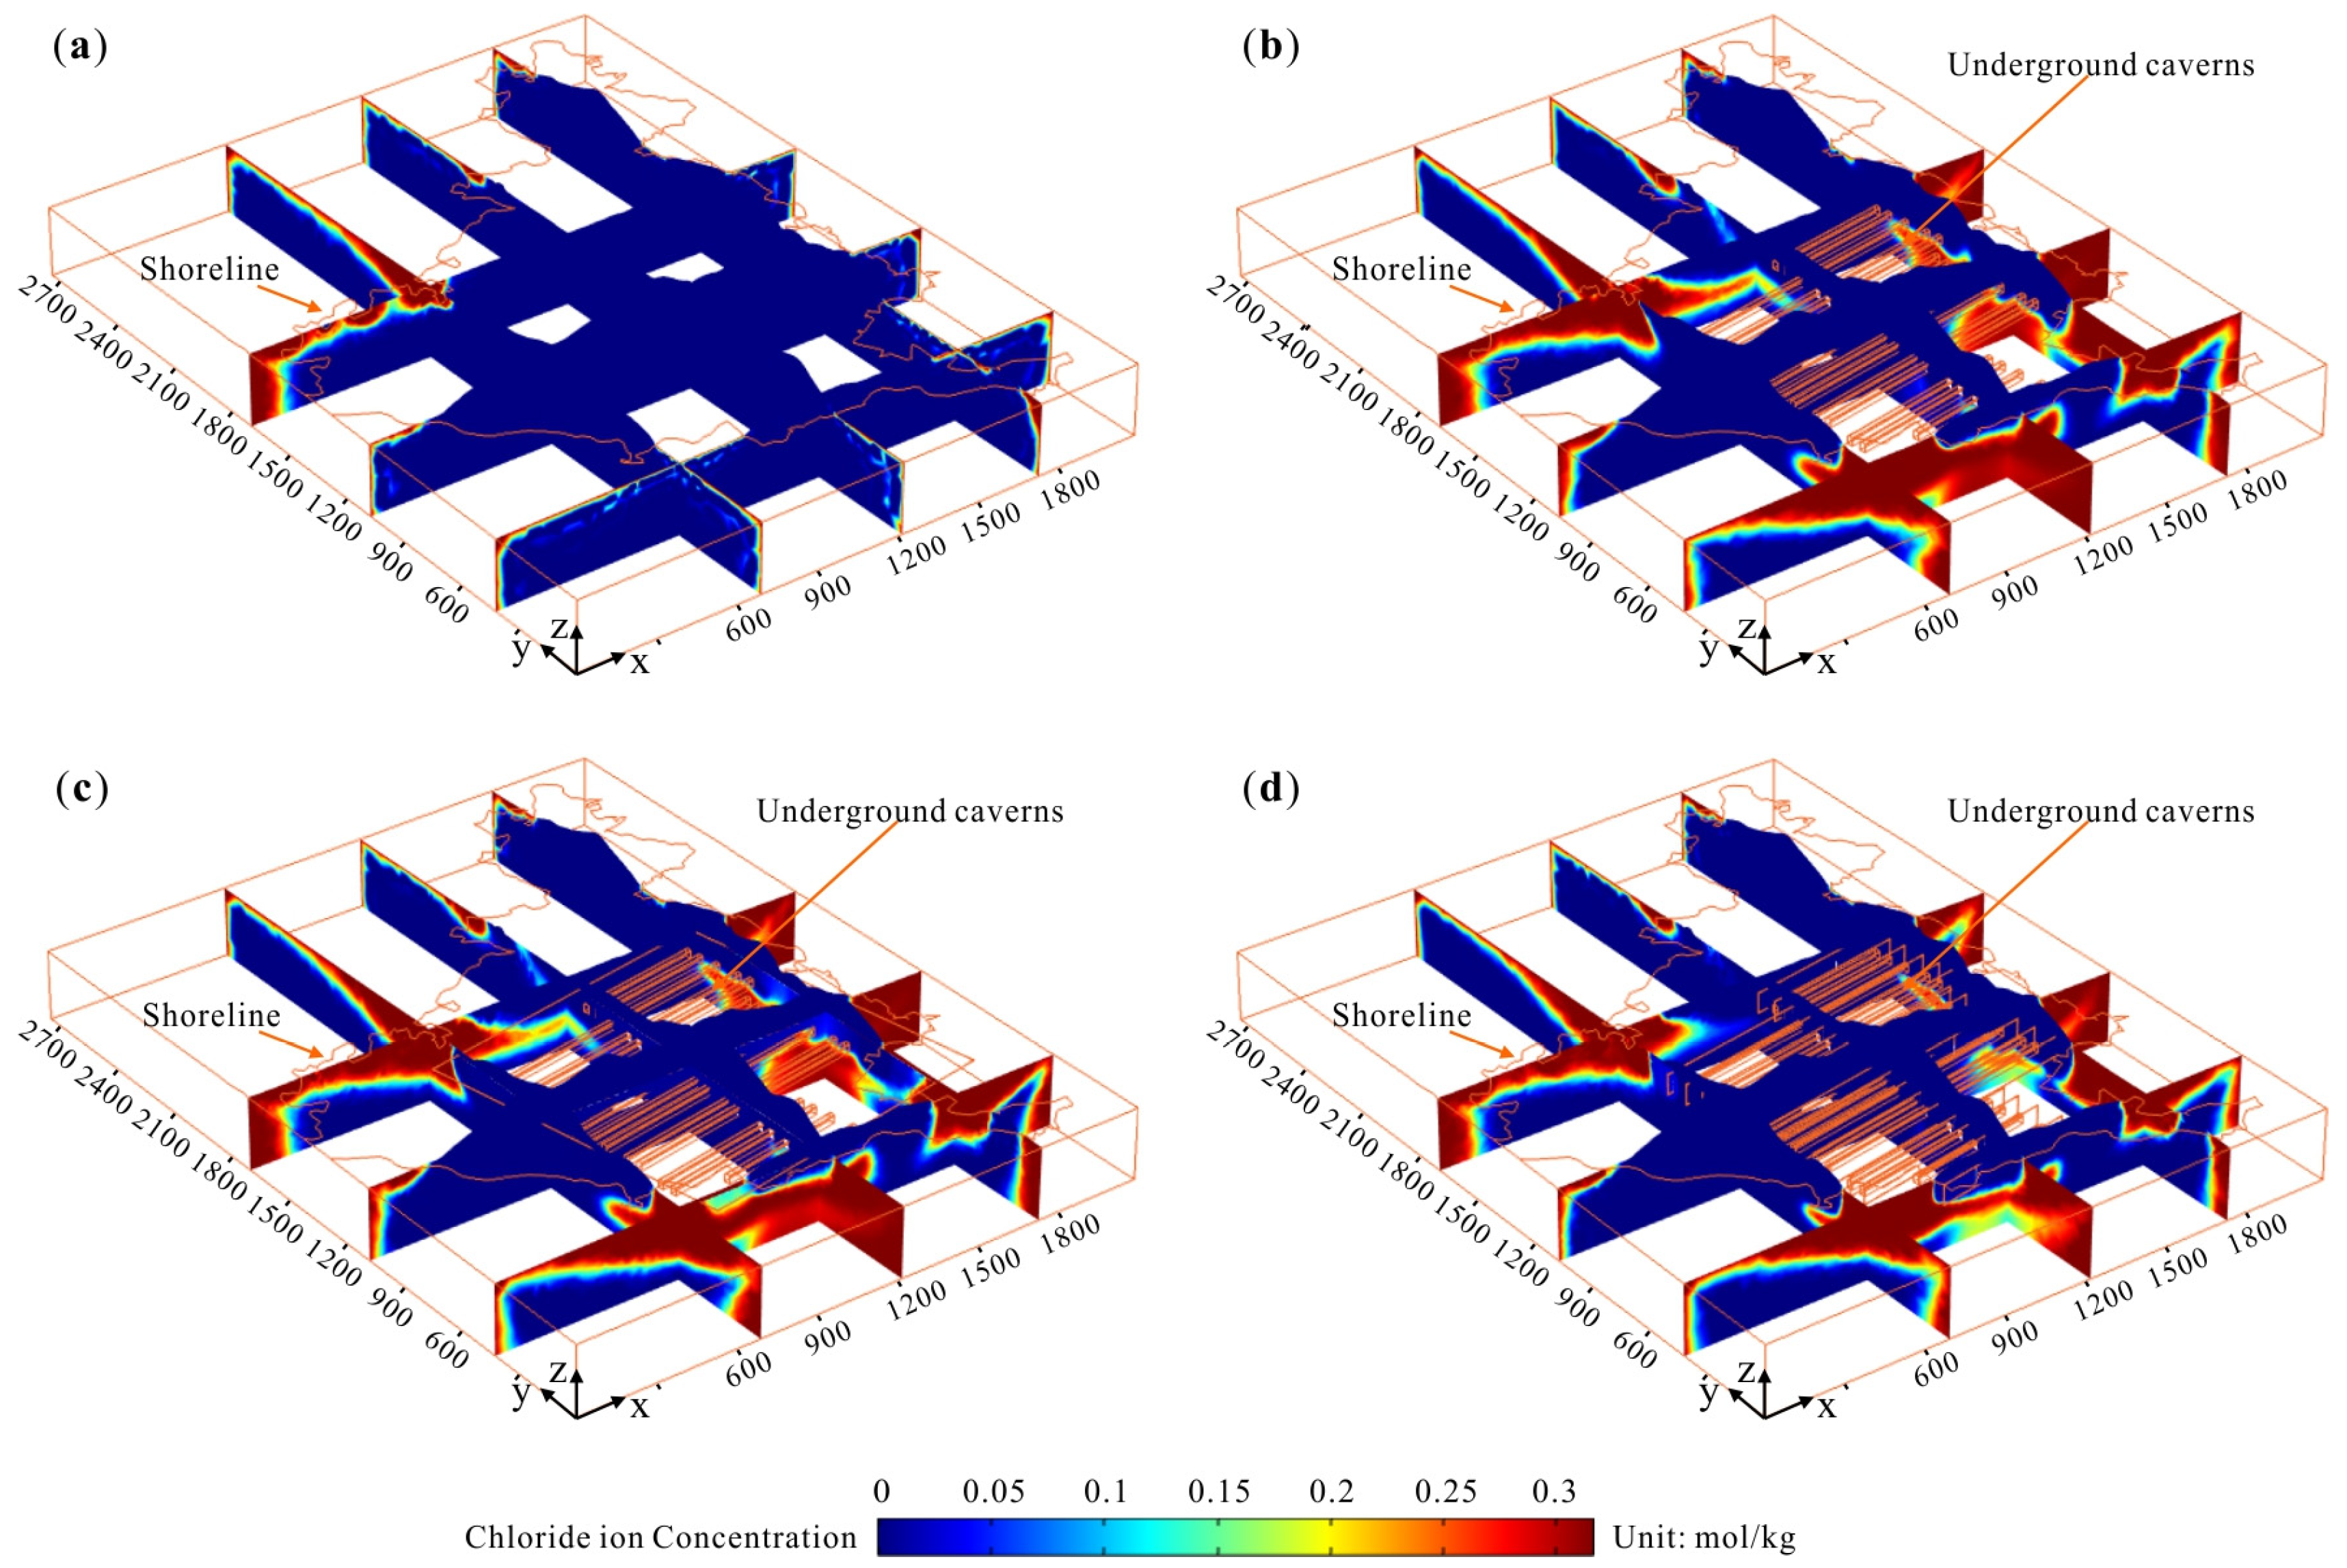
The seawater intrusion at the end of the simulation (50 years) was compared and analyzed. Before the excavation of the underground cavern (as shown in Figure 16a), the seawater will hardly intrude into the island. After the underground cavern is excavated (as shown in Figure 16b), the groundwater seepage field insides the island will be disturbed, and the groundwater will seep from the surrounding rock to the underground cavern. A large extent of seawater intrusion has occurred around the caverns. The underground cavern is closer to the coast, and the seawater intrusion is obviously greater. In addition, seawater intrudes into the underground cavern from the bottom of the cavern. After the horizontal water curtain system is set above the underground cavern (as shown in Figure 16c), the degree of seawater intrusion between the cavern and the horizontal water curtain system decreases. However, there is no significant change in the seawater intrusion outside the range of the underground cavern and horizontal water curtain system. After the vertical water curtain system is set (as shown in Figure 16d), the degree of seawater intrusion around the cavern and the vertical water curtain system is reduced compared to that of the excavated condition.
4.3.3. Tidal Influence on Seawater Intrusion
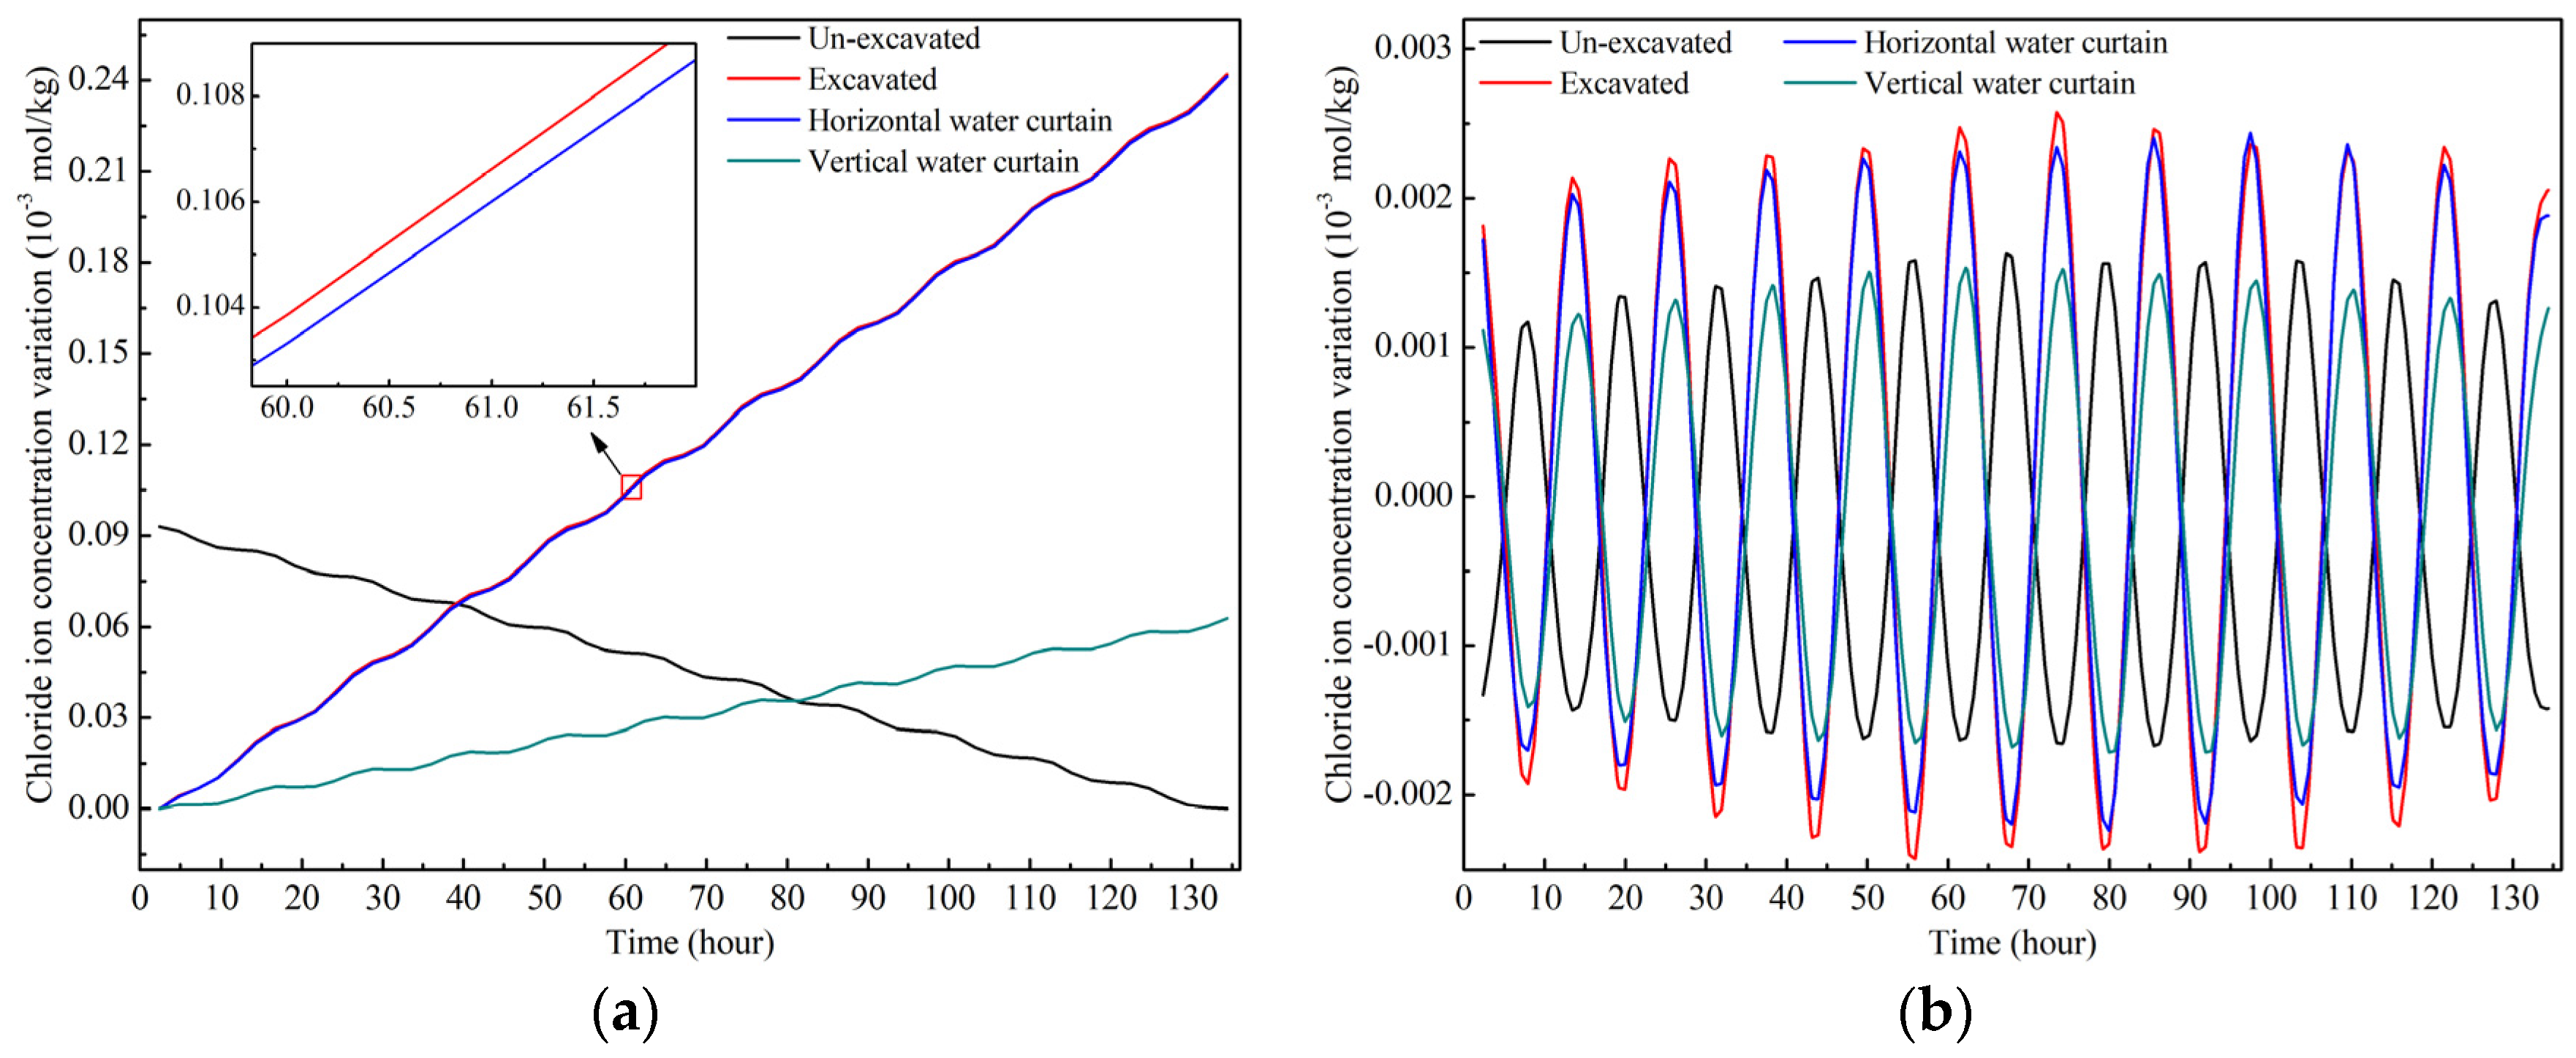
According to the above analysis, after the underground cavern is excavated, the seawater will gradually intrude from the shoreline to the interior of the island regardless of whether the water curtain system is set or not. Under the four conditions, concentration monitoring points are set at an elevation of −100 m, 10 m away from the shoreline on profile 1-1’. The simulation results of the four conditions are shown in Figure 17a. Before the excavation of the underground cavern, the concentration of chlorine ions in the groundwater decreases. After the excavation of the underground cavern, the chloride ion concentration gradually increases. In the case where a horizontal water curtain system was set, the variation in the chloride ion concentration is similar to the excavated condition, and the concentration of chloride ion at this position is slightly less than the excavated condition at the same time. After the vertical water curtain system is set, the chloride ion concentration gradually increases, but the rate of increase is obviously lower than the excavated condition and the horizontal water curtain system condition.
In the process of seawater intrusion, the chloride ion concentration will gradually increase, but be affected by the tidal dynamic fluctuation, and the chloride ion concentration will also fluctuate slightly. To research its fluctuation characteristics, the curve of the chloride ion concentration was filtered (as shown in Figure 17b). The maximum fluctuation amplitude of the chlorine ion concentration of the excavated condition and the horizontal water curtain system condition is approximately 0.0025 mol/m3. The maximum fluctuation amplitude of the chlorine ion concentration of the un-excavated condition and the vertical water curtain system condition is approximately 0.0015 mol/m3. Therefore, the excavation of the underground cavern will increase the influence of tidal fluctuation on seawater intrusion, and a vertical water curtain system can better decrease the influence of the tidal fluctuation on seawater intrusion than horizontal water curtain system.
5. Discussion
Based on the above analysis, it can be seen that the tidal fluctuation causes the groundwater in the island to show fluctuation characteristics. The water curtain system can reduce the seawater intrusion and weaken the influence of tidal fluctuation on seawater intrusion. Characteristics analysis is as follows:
- (1)
- Under the island tidal environment, the groundwater level within the island is affected by tidal fluctuations, which show fluctuation characteristics. When the underground water-sealed oil storage cavern is built in the island, the fluctuation amplitude damping rate of the groundwater level can be successively sorted from low to high: excavated, un-excavated, with a horizontal water curtain system and with a vertical water curtain system (as shown in Figure 13). The tidal wave is transmitted from the shoreline to the island, and the wave energy decreases continually in the process of transmission, so the amplitude damping is generated. After the underground cavern is excavated, the groundwater seeps into the underground cavern, which accelerates the velocity of groundwater flow. Therefore, the amplitude damping velocity of the groundwater level is smaller than that of the un-excavated condition. After the water curtain system is set, the water curtain system recharges the groundwater, and the groundwater seepage around the island is restrained, so the amplitude of the groundwater level damps faster than that without the water curtain system. The amplitude damping velocity under the influence of a vertical water curtain system is greater than that of a horizontal water curtain system, which indicates that the vertical water curtain system has a greater barrier effect on the seepage flow of groundwater into the island. This phenomenon reveals the advantages of vertical water curtain systems in the construction of underground water-sealed oil storage caverns in island tidal environments.
- (2)
- Before the excavation of the underground cavern (as shown in Figure 17a), the chloride ion concentration at the monitoring point shows a decreasing trend. According to the governing equation, seawater intrusion is affected by the groundwater flow and the hydrodynamic dispersion of solute ions. In the case of an un-excavated island, groundwater seeps from the island to the shoreline (as shown in Figure 8). In contrast, solute diffusion is affected by its concentration, from high concentration to low concentration, that is, it diffuses from the shoreline to the island interior. It can be seen from the results that at the location of the monitoring point, the influence of the groundwater flow on seawater intrusion is greater than that of hydrodynamic dispersion.
This paper is a preliminary study on the seawater intrusion in the construction of the underground water-sealed oil storage cavern under the island environment. There are limitations such as limited field-monitoring data. The model built in this research covers the whole island and has a larger size. Therefore, the equivalent hydraulic conductivity method is adopted to study the rock fracture mass as an isotropic medium with a larger hydraulic conductivity. However, in practice, the rock mass of the research area contains complex fracture networks. The groundwater seepage and seawater intrusion also mainly develop along the penetrating fissures [46,47]. In the following research, the fracture should be added into the model for more accurate simulation.
6. Conclusions
Based on the multi-physical field coupling theory, this paper researched the seawater intrusion characteristics of the underground water-sealed oil storage cavern under an island tidal environment using the transient simulation method. Some conclusions were obtained.
Seawater intrusion is mainly controlled by groundwater seepage characteristics (groundwater seepage direction, groundwater seepage velocity and groundwater level). The direction of groundwater seepage is the dominant factor of the direction of seawater intrusion. The influence of hydrodynamic dispersion on the direction of seawater intrusion is small. The velocity of groundwater seepage determines the velocity of seawater intrusion.
The amplitudes of groundwater seepage speed and groundwater level decrease exponentially along the horizontal direction, so the influence of tide on the groundwater seepage field in the island is limited. At 200 m from the shoreline, the fluctuation amplitude of the groundwater seepage velocity and the groundwater level decrease to 4.3% and 9.1% of the shoreline, respectively.
The water curtain system can reduce seawater intrusion caused by underground water-sealed oil storage cavern excavation. In addition, the water curtain system can also reduce the influence of tidal fluctuations on the underground seepage field of the island. In both of these aspects, the effect of a vertical water curtain system is better than that of a horizontal water curtain system.
Author Contributions
This paper was completed under the guidance of B.Z. Y.L. established the numerical model, analyzed the results and completed the writing of most of the manuscripts. L.S. contributed to the concept, thought and organization of the study. Writing—review and editing, Y.Y.
Funding
This research was funded by the National Natural Science Foundation of China (No. 41572301, No. 40902086) and the Fundamental Research Funds for the Central Universities of China (No. 2018CDJSK04XK09, No. 2-9-2017-089).
Acknowledgments
Thanks are due to senior engineer Zhenhua Peng and Junyan Li of Petrochemical Engineering Co., Ltd. for supplying geological data of research area.
Conflicts of Interest
The authors declare no conflict of interest.
References
- Morfeldt, C.O. Storage of petroleum products in man-made caverns in Sweden. Bull. Eng. Geol. Environ. 1983, 28, 17–30. [Google Scholar] [CrossRef]
- Lu, M. Finite element analysis of a pilot gas storage in rock cavern under high pressure. Eng. Geol. 1998, 49, 353–361. [Google Scholar] [CrossRef]
- Makita, T.; Miyanaga, Y.; Iguchi, K.; Hatano, T. Underground oil storage facilities in japan. Eng. Geol. 1993, 35, 191–198. [Google Scholar] [CrossRef]
- Li, Y.; Chen, Y.F.; Zhang, G.J.; Liu, Y.; Zhou, C.B. A numerical procedure for modeling the seepage field of water-sealed underground oil and gas storage caverns. Tunn. Undergr. Space Technol. 2017, 66, 56–63. [Google Scholar] [CrossRef]
- Shi, L.; Zhang, B.; Wang, L.; Wang, H.X.; Zhang, H.J. Functional efficiency assessment of the water curtain system in an underground water-sealed oil storage cavern based on time-series monitoring data. Eng. Geol. 2018, 239, 79–95. [Google Scholar] [CrossRef]
- Xue, Y.G.; Li, S.C.; Qiu, D.H.; Wang, Z.C.; Li, Z.Q.; Tian, H.; Su, M.X.; Yang, W.M.; Lin, C.J.; Zhu, J.Y. A new evaluation method for site selection of large underground water-sealed petroleum storage depots. Sci. China Technol. Sci. 2015, 58, 967–978. [Google Scholar] [CrossRef]
- Lim, J.W.; Lee, E.; Moon, H.S.; Lee, K.K. Integrated investigation of seawater intrusion around oil storage caverns in a coastal fractured aquifer using hydrogeochemical and isotopic data. J. Hydrol. 2013, 486, 202–210. [Google Scholar] [CrossRef]
- Lee, J.Y.; Cho, B.W. Submarine groundwater discharge into the coast revealed by water chemistry of man-made undersea liquefied petroleum gas cavern. J. Hydrol. 2008, 360, 195–206. [Google Scholar] [CrossRef]
- Huyakorn, P.S.; Andersen, P.F.; Mercer, J.W.; White, H.O. Saltwater intrusion in aquifers: Development and testing of a three-dimensional finite element model. Water Resour. Res. 1987, 23, 293–312. [Google Scholar] [CrossRef]
- Lee, J.; Kim, J.H.; Kim, H.M.; Chang, H.W. Statistical approach to determine the salinized ground water flow path and hydrogeochemical features around the underground LPG cavern, Korea. Hydrol. Process. 2010, 21, 3615–3626. [Google Scholar] [CrossRef]
- Mas-Pla, J.; Rodríguez-Florit, A.; Zamorano, M.; Roqué, C.; Menció, A.; Brusi, D. Anticipating the effects of groundwater withdrawal on seawater intrusion and soil settlement in urban coastal areas. Hydrol. Process. 2013, 27, 2352–2366. [Google Scholar] [CrossRef]
- Werner, A.D.; Bakker, M.; Post, V.E.A.; Vandenbohede, A.; Lu, C.H.; Ataie-Ashtiani, B.; Simmons, C.T.; Barry, D.A. Seawater intrusion processes, investigation and management: Recent advances and future challenges. Adv. Water Resour. 2013, 51, 3–26. [Google Scholar] [CrossRef] [Green Version]
- Boschetti, T.; Awaleh, M.O.; Barbieri, M. Waters from the Djiboutian Afar: A Review of Strontium Isotopic Composition and a Comparison with Ethiopian Waters and Red Sea Brines. Water 2018, 10, 1700. [Google Scholar] [CrossRef]
- Sreekanth, J.; Datta, B. Review: Simulation-optimization models for the management and monitoring of coastal aquifers. Hydrogeol. J. 2015, 23, 1155–1166. [Google Scholar] [CrossRef]
- Nocchi, M.; Salleolini, M. Prediction of pollutant remediation in a heterogeneous aquifer in Israel: Reducing uncertainty by incorporating lithological, head and concentration data. J. Hydrol. 2018, 564, 651–666. [Google Scholar] [CrossRef]
- Neuman, S.P. Trends, prospects and challenges in quantifying flow and transport through fractured rocks. Hydrogeol. J. 2005, 13, 124–147. [Google Scholar] [CrossRef]
- Sebben, M.L.; Werner, A.D.; Graf, T. Seawater intrusion in fractured coastal aquifers: A preliminary numerical investigation using a fractured Henry problem. Adv. Water Resour. 2015, 85, 93–108. [Google Scholar] [CrossRef]
- Arfib, B.; Marsily, G.D. Modeling the salinity of an inland coastal brackish karstic spring with a conduit-matrix model. Water Resour. Res. 2004, 40, 417–427. [Google Scholar] [CrossRef]
- Liu, W.C.; Liu, H.M. Assessing the Impacts of Sea Level Rise on Salinity Intrusion and Transport Time Scales in a Tidal Estuary, Taiwan. Water 2014, 6, 324–344. [Google Scholar] [CrossRef]
- Petti, M.; Bosa, S.; Pascolo, S. Lagoon Sediment Dynamics: A Coupled Model to Study a Medium-Term Silting of Tidal Channels. Water 2018, 10, 569. [Google Scholar] [CrossRef]
- Oberle, F.K.J.; Swarzenski, P.W.; Storlazzi, C.D. Atoll Groundwater Movement and Its Response to Climatic and Sea-Level Fluctuations. Water 2017, 9, 650. [Google Scholar] [CrossRef]
- Taniguchi, M. Tidal effects on submarine groundwater discharge into the ocean. Geophys. Res. Lett. 2002, 29. [Google Scholar] [CrossRef] [Green Version]
- Li, L.; Barry, D.A.; Parlange, J.Y.; Pattiaratchi, C.B. Beach water table fluctuations due to wave run-up: Capillarity effects. Water Resour. Res. 1997, 33, 817–824. [Google Scholar] [CrossRef]
- Jeng, D.S.; Li, L.; Barry, D.A. Analytical solution for tidal propagation in a coupled semi-confined/phreatic coastal aquifer. Adv. Water Resour. 2002, 25, 577–584. [Google Scholar] [CrossRef]
- Teo, H.T.; Jeng, D.S.; Seymour, B.R.; Barry, D.A.; Li, L. A new analytical solution for water table fluctuations in coastal aquifers with sloping beaches. Adv. Water Resour. 2003, 26, 1239–1247. [Google Scholar] [CrossRef]
- Huang, F.K.; Chuang, M.H.; Wang, G.S.; Yeh, H.D. Tide-induced groundwater level fluctuation in a u-shaped coastal aquifer. J. Hydrol. 2015, 530, 291–305. [Google Scholar] [CrossRef]
- Levanon, E.; Shalev, E.; Yechieli, Y.; Gvirtzman, H. Fluctuations of fresh-saline water interface and of water table induced by sea tides in unconfined aquifers. Adv. Water Resour. 2016, 96, 34–42. [Google Scholar] [CrossRef]
- Nielsen, P. Tidal dynamics of the water table in beaches. Water Resour. Res. 1990, 26, 2127–2134. [Google Scholar] [CrossRef] [Green Version]
- Siarkos, I.; Latinopoulos, D.; Mallios, Z.; Latinopoulos, P. A methodological framework to assess the environmental and economic effects of injection barriers against seawater intrusion. J. Environ. Manag. 2017, 193, 532–540. [Google Scholar] [CrossRef]
- Huang, P.S.; Chiu, Y.C. A simulation-optimization model for seawater intrusion management at pingtung coastal area, Taiwan. Water 2018, 10, 251. [Google Scholar] [CrossRef]
- Lee, E.; Lim, J.W.; Moon, H.S.; Lee, K.K. Assessment of seawater intrusion into underground oil storage cavern and prediction of its sustainability. Environ. Earth Sci. 2015, 73, 1179–1190. [Google Scholar] [CrossRef]
- Ivars, D.M. Water inflow into excavations in fractured rock—A three-dimensional hydro-mechanical numerical study. Int. J. Rock Mech. Min. 2006, 43, 705–725. [Google Scholar] [CrossRef]
- Li, S.C.; Wang, Z.C.; Ping, Y.; Zhou, Y.; Zhang, L. Discrete element analysis of hydro-mechanical behavior of a pilot underground crude oil storage facility in granite in china. Tunn. Undergr. Space Technol. 2014, 40, 75–84. [Google Scholar] [CrossRef]
- Wang, Z.C.; Li, S.C.; Qiao, L.P.; Zhang, Q.S. Finite element analysis of the hydro-mechanical behavior of an underground crude oil storage facility in granite subject to cyclic loading during operation. Int. J. Rock Mech. Min. 2015, 73, 70–81. [Google Scholar] [CrossRef]
- Ren, F.; Ma, G.W.; Wang, Y.; Fan, L.F. Pipe network model for unconfined seepage analysis in fractured rock masses. Int. J. Rock Mech. Min. 2016, 88, 183–196. [Google Scholar] [CrossRef]
- Wang, Z.C.; Li, W.; Li, S.C.; Qiu, W.G.; Ding, W.T. Development of an optimum forepole spacing (OFS) determination method for tunnelling in silty clay with a case study. Tunn. Undergr. Space Technol. 2018, 74, 20–32. [Google Scholar] [CrossRef]
- Louis, C. Rock Hydraulics; Springer Vienna: New York, NY, USA, 1972; p. 59. ISBN 978-3-7091-4109-0. [Google Scholar]
- Navigation Guarantee Department of Chinese Navy Headquarters. Tide Table: 2009, East China Sea; China Navigation Publications Press: Beijing, China, 2008; pp. 100–102. ISBN 978-7-80224-554-9. [Google Scholar]
- Chen, Z.Y. Ocean Tide; Science Press: Beijing, China, 1979; pp. 18–24. ISBN 13031-946. [Google Scholar]
- Chun, J.A.; Lim, C.; Kim, D.; Kim, J.S. Assessing Impacts of Climate Change and Sea-Level Rise on Seawater Intrusion in a Coastal Aquifer. Water 2018, 10, 357. [Google Scholar] [CrossRef]
- Bear, J. Dynamics of fluids in porous media. Eng. Geol. 1972, 7, 174–175. [Google Scholar] [CrossRef]
- Zhu, X.Y.; Xie, C.H. Transport in Subsurface Flow; China Architecture & Building Press: Beijing, China, 1990; pp. 214–219. ISBN 7-112-01092-6. [Google Scholar]
- Gelhar, L.W.; Welty, C.; Rehfeldt, K.R. A critical review of data on field-scale dispersion in aquifers. Water Resour. Res. 1992, 28. [Google Scholar] [CrossRef]
- Harrison, W.; Fang, C.S.; Wang, S.N. Groundwater flow in a sandy tidal beach: One dimensional finite element analysis. Water Resour. Res. 1971, 7, 1313–1322. [Google Scholar] [CrossRef]
- Li, L.; Barry, D.A.; Pattiaratchi, C.B. Numerical modelling of tide-induced beach water table fluctuations. Coast. Eng. 1997, 30, 105–123. [Google Scholar] [CrossRef]
- Liu, H.J.; Zhang, X.H.; Lu, X.B.; Liu, Q.J. Study on flow in fractured porous media using pore-fracture network modeling. Energies 2017, 10, 17. [Google Scholar] [CrossRef]
- Xu, S.Y.; Zhang, Y.B.; Shi, H.; Wang, K.; Geng, Y.P.; Chen, J.F. Physical Simulation of Strata Failure and Its Impact on Overlying Unconsolidated Aquifer at Various Mining Depths. Water 2018, 10, 650. [Google Scholar] [CrossRef]
Figure 1.
Model diagram of an underground water-sealed oil storage cavern.

Figure 2.
Location map of the research area.

Figure 3.
Geological map of the study area: (a) plane map, ZK1-ZK9 are the number of groundwater table monitoring boreholes; (b) profile map.
Figure 3.
Geological map of the study area: (a) plane map, ZK1-ZK9 are the number of groundwater table monitoring boreholes; (b) profile map.

Figure 4.
Variation in the groundwater depth.

Figure 5.
Tidal monitoring data and the fitting curve: (a) tidal monitoring data; (b) tidal amplitude and its fitting curve; (c) sinusoidal setover and its fitting curve; (d) fitting curve. Data source: The Navigation Guarantee Department of Chinese Navy Headquarters.
Figure 5.
Tidal monitoring data and the fitting curve: (a) tidal monitoring data; (b) tidal amplitude and its fitting curve; (c) sinusoidal setover and its fitting curve; (d) fitting curve. Data source: The Navigation Guarantee Department of Chinese Navy Headquarters.

Figure 6.
Numerical model: (a) three-dimensional numerical model; (b) numerical model profile.

Figure 7.
The amplitude attenuation and phase lag of the groundwater table in the un-excavated condition: (a) the fluctuation amplitude; (b) the fluctuation phase, Δφ phase difference.
Figure 7.
The amplitude attenuation and phase lag of the groundwater table in the un-excavated condition: (a) the fluctuation amplitude; (b) the fluctuation phase, Δφ phase difference.

Figure 8.
Groundwater seepage direction: (a) un-excavated; (b) excavated; (c) horizontal water curtain system; (d) vertical water curtain system.
Figure 8.
Groundwater seepage direction: (a) un-excavated; (b) excavated; (c) horizontal water curtain system; (d) vertical water curtain system.

Figure 9.
Groundwater seepage velocity: (a) elevation of −20 m; (b) elevation of −40 m; (c) elevation of −60 m; (d) elevation of −80 m; (e) elevation of −100 m; (f) elevation of −120 m.
Figure 9.
Groundwater seepage velocity: (a) elevation of −20 m; (b) elevation of −40 m; (c) elevation of −60 m; (d) elevation of −80 m; (e) elevation of −100 m; (f) elevation of −120 m.

Figure 10.
Seepage velocity fluctuation amplitude: (a) different distance from shoreline under excavated condition; (b) fluctuation amplitude damping.
Figure 10.
Seepage velocity fluctuation amplitude: (a) different distance from shoreline under excavated condition; (b) fluctuation amplitude damping.

Figure 11.
Groundwater level: (a) un-excavated; (b) excavated; (c) horizontal water curtain system; (d) vertical water curtain system.
Figure 11.
Groundwater level: (a) un-excavated; (b) excavated; (c) horizontal water curtain system; (d) vertical water curtain system.

Figure 12.
Groundwater level fluctuation with different distance from shoreline: (a) un-excavated; (b) excavated; (c) horizontal water curtain; (d) vertical water curtain; phase difference.
Figure 12.
Groundwater level fluctuation with different distance from shoreline: (a) un-excavated; (b) excavated; (c) horizontal water curtain; (d) vertical water curtain; phase difference.

Figure 13.
Tidal water table fluctuation amplitude damping.

Figure 14.
Temporal-spatial variations of seawater intrusion: (a) 0 year; (b) 10 years; (c) 20 years; (d) 30 years; (e) 40 years; (f) 50 years.
Figure 14.
Temporal-spatial variations of seawater intrusion: (a) 0 year; (b) 10 years; (c) 20 years; (d) 30 years; (e) 40 years; (f) 50 years.

Figure 15.
Horizontal distance seawater intrusion.

Figure 16.
Contrast of seawater intrusion in fifty years: (a) un-excavated; (b) excavated; (c) horizontal water curtain system; (d) vertical water curtain system.
Figure 16.
Contrast of seawater intrusion in fifty years: (a) un-excavated; (b) excavated; (c) horizontal water curtain system; (d) vertical water curtain system.

Figure 17.
Chloride concentration curve: (a) chloride concentration varies over time; (b) chloride concentration fluctuation.
Figure 17.
Chloride concentration curve: (a) chloride concentration varies over time; (b) chloride concentration fluctuation.


Table 1.
The computational grid and the size resolution of the four models.
| Items | Four Conditions | |||
|---|---|---|---|---|
| Un-Excavated | Excavated | Horizontal Water Curtain | Vertical Water Curtain | |
| Number of elements | 440,710 | 970,463 | 1,083,967 | 3,054,415 |
| Minimum element size (m) | 9.45 | 4.26 | 1.54 | 1.29 |
| Maximum element size (m) | 94.75 | 91.65 | 80.72 | 92.452 |
| Average element size (m) | 51.22 | 46.98 | 44.39 | 44.59 |
Table 2.
The model parameters.
| Granite Density | Freshwater Density | Seawater Density | Porosity n | Diffusion Coefficients D* (m2/s) | Longitudinal Dispersity | Transversal Dispersity |
|---|---|---|---|---|---|---|
| 2600 | 1000 | 1025 | 0.015 | 21.3 | 4.2 |
© 2019 by the authors. Licensee MDPI, Basel, Switzerland. This article is an open access article distributed under the terms and conditions of the Creative Commons Attribution (CC BY) license (http://creativecommons.org/licenses/by/4.0/).
Share and Cite
MDPI and ACS Style
Li, Y.; Zhang, B.; Shi, L.; Ye, Y. Dynamic Variation Characteristics of Seawater Intrusion in Underground Water-Sealed Oil Storage Cavern under Island Tidal Environment. Water 2019, 11, 130. https://doi.org/10.3390/w11010130
AMA Style
Li Y, Zhang B, Shi L, Ye Y. Dynamic Variation Characteristics of Seawater Intrusion in Underground Water-Sealed Oil Storage Cavern under Island Tidal Environment. Water. 2019; 11(1):130. https://doi.org/10.3390/w11010130
Chicago/Turabian StyleLi, Yutao, Bin Zhang, Lei Shi, and Yiwei Ye. 2019. "Dynamic Variation Characteristics of Seawater Intrusion in Underground Water-Sealed Oil Storage Cavern under Island Tidal Environment" Water 11, no. 1: 130. https://doi.org/10.3390/w11010130
Note that from the first issue of 2016, this journal uses article numbers instead of page numbers. See further details here.