The Po River Water Isotopes during the Drought Condition of the Year 2017


1
Department of Land, Environment, Agriculture and Forestry, University of Padova, 35020 Padova, Italy
2
Department of Physics and Earth Sciences, University of Ferrara, 44122 Ferrara, Italy
*
Author to whom correspondence should be addressed.
Water 2019, 11(1), 150; https://doi.org/10.3390/w11010150
Submission received: 22 October 2018
/
Revised: 7 January 2019
/
Accepted: 8 January 2019
/
Published: 16 January 2019
(This article belongs to the Special Issue Recent Progress in River Biogeochemistry Research)
Abstract
:The year 2017 was anomalously warm and dry across the whole Italian Peninsula, and the paucity of precipitation was emphasized during the extreme summer drought of the main Italian river, i.e., the Po river, which was characterized by a discharge persistently below 600 m3/s (in spite of the average discharge of 1500 m3/s). During these extreme conditions, the Po river oxygen and hydrogen stable isotopes (δD, δ18O) displayed a relation (δD = 6.1*δ18O − 6.6) significantly different from that recorded in the previous investigation of the years 2012–2014 (δD = 7.5*δ18O + 6.5). The lowering of the slope and the negative intercept clearly reflect the transition toward arid conditions that characterized the investigated period. The difference is expressed by the derivative parameter Line-Conditioned excess (LC-exc), which better describes the compositional difference of Po river water in the year 2017 with respect to that of the period 2012–2014, when the system was less affected by warm or dry conditions and the river discharge was more similar to the historical trends. The isotopic anomaly observed in 2017 throughout the river is even greater in the terminal part of the river, where in the meanders of the deltaic branches, the river flow progressively slows down, suffering significant evaporation. The isotopic signature of the water appears, therefore, an appropriate tool to monitor the watershed response to evolving environmental conditions. These sensitive isotopic parameters could be interpreted as “essential climate variables” (ECV) that are physical, chemical, or biological geo-referenced parameters that critically contribute to the characterization of Earth’s climate. Future research needs to find relationships between ECV (including the water stable isotopes) and the evolution of ecosystems, which especially in the Mediterranean area, appear to be fragile and severely affected by natural and anthropogenic processes.
1. Introduction
Several studies emphasized the link between water stable isotopes and climatic conditions, which in turn regulate the hydrological cycle [1,2,3]. The hypothesis, postulated since the sixties, has been refined in the following decades through the definition of local meteoric lines, i.e., specific relations between the δ18O and δD valid for different geographic areas. In addition, isotopic methods were introduced in catchment hydrology research as a tool to obtain important hydrological information [4,5], also suggesting that large-scale isotopic signatures of rivers potentially preserve that of precipitation and are useful for climate investigation at a regional scale [6,7].
Unfortunately, systematic isotopic studies concerning large-scale catchments [5,8,9,10,11,12,13,14] are unevenly distributed around the world. Consequently, the GNIR database (Global Network of Isotopes in Rivers, [4]) lacks information in some specific areas, including Northern Italy, where the main Italian rivers (Po and Adige) are not taken into consideration. In Northern Italy, systematic isotopic studies of river water were not available before 2015 and have been carried out recently for the Po [15,16,17,18,19] and Adige [20,21] rivers, giving insights on the climatic conditions of the investigated periods. The reiteration of these studies is important to establish relationships between isotopic trends and hydrological processes, which are in turn associated with environmental changes at large-scale catchment.
In this view, this work reports a reappraisal of the isotopic composition of Po river water for the years 2012–2014 [15,16,17,19], and a comparison with new data referring to the hydrological year 2016–2017, in which extreme dry (and warm) climatic conditions affected the whole Mediterranean area. The purpose is to evaluate the sensitivity of the water stable isotopes to environmental changes that can impact water resources and related ecosystems.
2. Material and Methods
2.1. Study Area
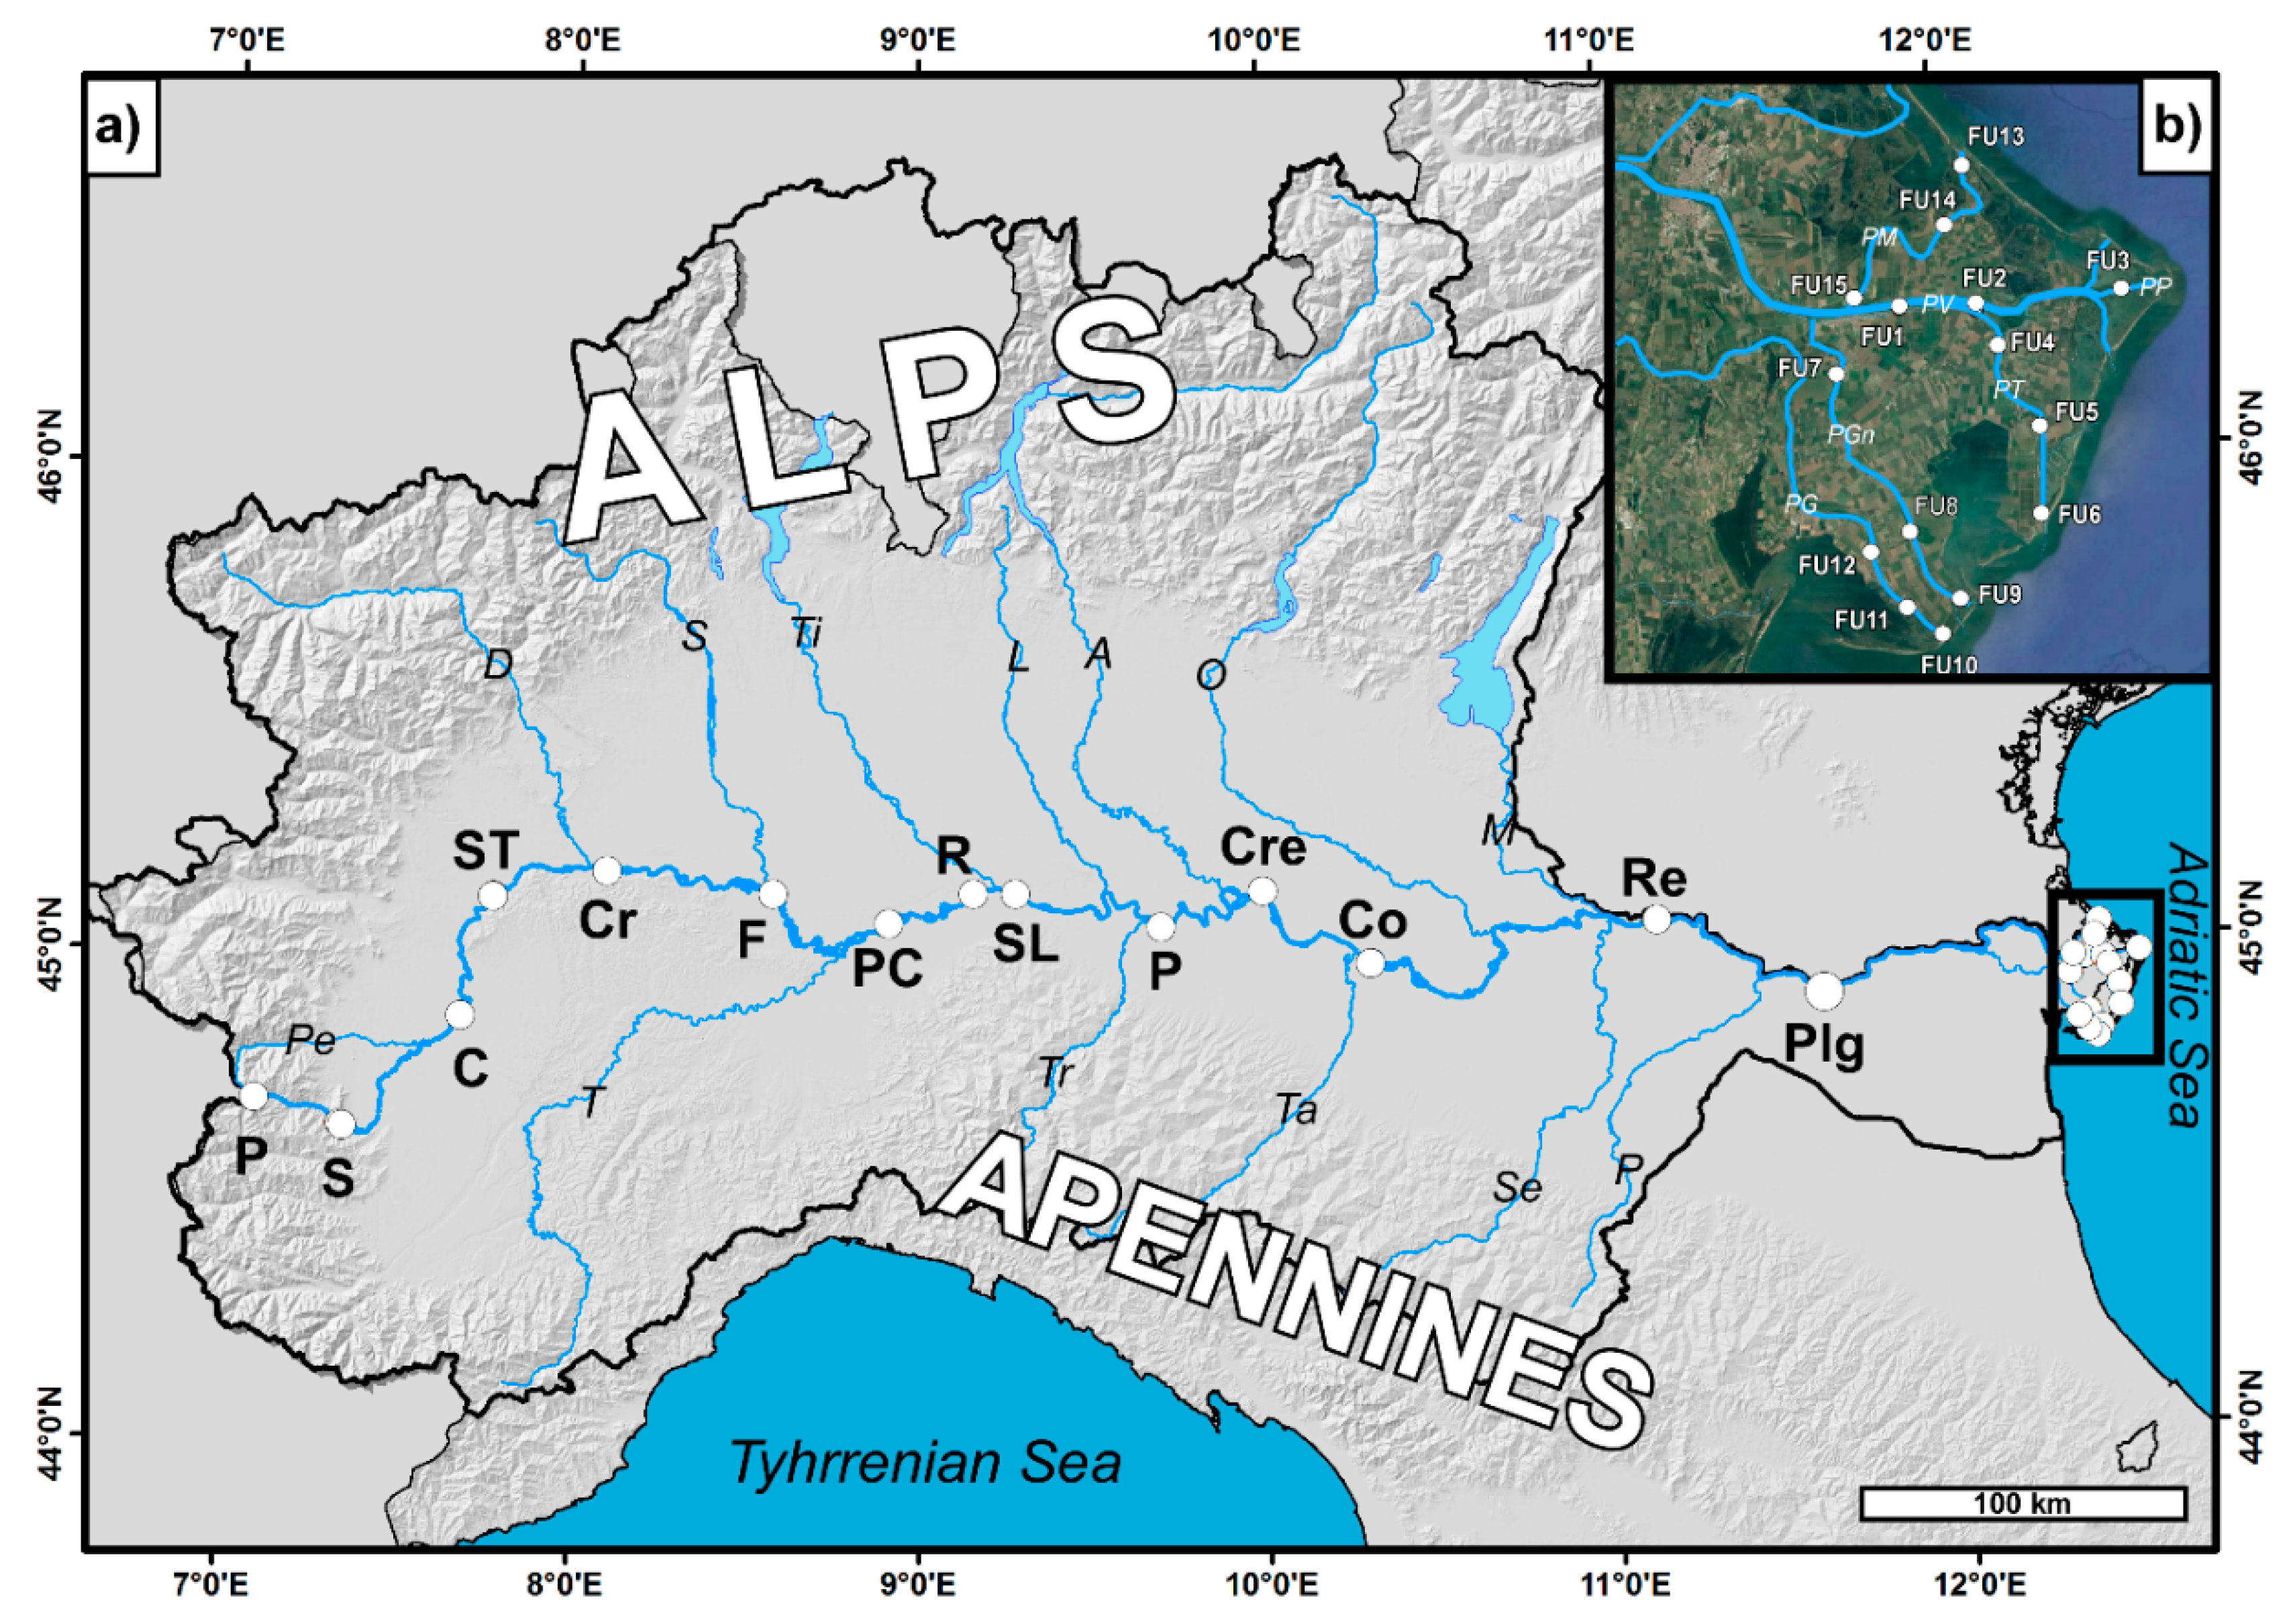
The Po river flows through the Padana plain (Figure 1), a basin located between the Alpine and the Apennine orogenic chains, infilled by alluvial sediments representing the weathering products of the outcropping rocks [22,23,24]. It is the largest hydrological basin in Italy, covering an area of more than 71,000 km2 (about a quarter of the national territory). The Po river originates from the Monviso mountain in the Pian del Re locality (Piemonte) and cross-cuts northern Italy, finally approaching the Adriatic Sea through the Po Delta, one of the largest Mediterranean deltaic systems (covering an of area ~700 km2, [25]) recently included in the UNESCO Man and Biosphere (MAB) Program.
The average discharge rate is 1500 m3/s at Pontelagoscuro, which is located close to city of Ferrara, before the delta inception [26,27,28].
The river is fed by many tributaries from both the Alpine and the Apennine chains. The Alpine streams are mainly fed by snowmelt and accordingly show a seasonal peak flow during the spring to early-summer period, whereas the temporary Apennine streams show a minimum seasonal flow (drought) during the summer, being generally fed by rains. These tributaries, together with groundwater flows, account for the annual regime of the Po river ([15] and references therein), which is characterized by two low-level hydrometric periods (winter and summer) and two flood periods (late fall and spring). In terms of water budget, the main Alpine tributaries (left bank) often display discharge higher than 100 m3/s (Dora Baltea, 110 m3/s, Ticino 290 m3/s, Adda up to 160 m3/s), whereas the Apennine tributaries (right bank) usually show discharge lower than 50 m3/s. The Tanaro river, draining the Maritime Alps (Liguria), is the only right bank tributary with high average discharge (up to 130 m3/s). The tributaries flowing into the Po river progressively increase its discharge from the upper to the lower part of the basin: 1 m3/s after 5 km from the source, 50 m3/s after 90 km from the source, 960 m3/s at Piacenza (300 km from the source), 1115 m3/s at Cremona (350 km from the source), 1500 m3/s at Pontelagoscuro, (560 km from the source, [27,29]). The current hydrographic network has been variably modified by anthropogenic activities, including river embankment for flood management, dam construction for water storage and hydroelectric power, and organization of an artificial canal system to irrigate agricultural fields.
The climatic parameters of the investigated period, retrieved from the database of the Institute of Atmospheric Sciences and Climate, National Research Council (ISAC-CNR), indicate that the Italian peninsula was affected by anomalously warm and dry conditions following the trend already delineated in the year 2015 [18]. In Northern Italy, the annual positive anomaly was of +1.5 °C with respect to the reference time series 1971–2000. In particular, during May and July 2017 (the period in which most water samples have been collected), the temperature anomaly was of +1.6 °C and +1.7 °C, respectively.
On average, the temperature anomaly recorded in the summer 2017 has been overcome only in the year 2003 (http://www.nimbus.it/clima/2017/170914estate2017.htm). As concerns the precipitation, this period was characterized by a remarkable rainfall deficit of at least 30% with respect to the reference time series 1971–2000, classifying the year 2017 as the driest since the 1800. In particular, during May and July 2017, the recorded deficit was of −50% and −43%, respectively. The remarkable drought was confirmed by record of the relative humidity, as the year 2017 was characterized by an annual negative anomaly of −5.1% with respect to the reference time series 1961–1990. This negative anomaly, higher than that recorded in the year 2003 (−3.9%), defined the year 2017 as the driest since 1961.
The above conditions were induced by the persistence of the African anticyclone, causing low discharge of the Po river, reflected by the values recorded at Pontelagoscuro that were persistently below 600 m3/s during the summer season [30].
2.2. Analytical Methods
The isotopic study includes:(a) 22 water samples collected in two different hydrological periods (May and July 2017) along the Po river course in specific sites (see Figure 1) already investigated by Marchina et al. [15,16,19]; (b) 10 water samples collected at the closing section of Pontelagoscuro between October 2016 and September 2017; and (c) 15 water samples collected in different branches of the Po river delta, mainly during August 2017. Sampling locations and abbreviations are explained in Figure 1 and Table 1, Table 2 and Table 3.
The rationale behind the selection of sampling locations was to monitor the water geochemistry along the river path, before and after the confluence of important tributaries, settlements, or zones of important productive activities, but logistical criteria (i.e., accessibility) were also taken into consideration. Each sampling location was geo-referenced by a portable global positioning system (GPS). Surface water was collected at 40–50 cm depth using a bucket, possibly far from the shore (using boats, piers, bridges). Particular attention has been dedicated to the closing section of Pontelagoscuro, where daily discharge data are also available and easily accessible.
Hydrogen and oxygen isotopic ratios were determined using the CRDS Los Gatos LWIA 24-d isotopic analyzer. The isotopic ratios of 2H/1H and 18O/16O were expressed as δ notation (δ = (Rsample/Rstandard − 1) * 1000) with respect to the Vienna Standard Mean Ocean Water (V-SMOW) international standard. Four bracketing standards that cover the whole range of isotopic values of the Po river water were systematically run in the analytical sessions. These standards, obtained from the Los Gatos Research Company, were calibrated with international IAEA standards. Analytical precision and accuracy, based on replicate analyses of standards, were better than 0.3 and 1.0% for δ18O and δD, respectively.
2.3. Derived Parameters: Calculation of D-excess and LC-excess
The relationship between the stable hydrogen and oxygen isotopic ratios of water systems was identified by Craig as δD = 8*δ18O + 10 (Global Meteoric Water Line, GMWL), who characterized this relationship as indicative of waters which have not undergone excessive evapotranspiration. Afterward, Dansgaard [31] defined the concept of deuterium excess (D-exc = δD − 8*δ18O), an index of non-equilibrium in the condensation–evaporation cycle of global precipitation. Values of D-exc between 10 and 11 are indicative of waters approaching quasi-stable conditions at a relative humidity of ~85%.
An additional parameter to evaluate how isotopic signatures of river waters differ from their source was proposed by Landwehr et al. [32,33], who defined the Line-Conditioned excess (LC-exc) as the difference between the δD and a linear transform of the δ18O with the following equation:
where a and b represent the slope and the intercept of the local meteoric water line. This parameter was recently introduced because it takes into account the local precipitation and the relative local meteoric water line, from which the surface waters can deviate due to evaporation fractionation [32,33,34,35].
LC-exc = δD − a*δ18O − b
In this view, to emphasize the variation of Po river water in 2017, LC-exc was calculated with respect to the updated Northern Italy meteoric water line reported by Giustini et al. [36]:
δD = 8.04* δ18O + 11.47
The slope (a = 8.04) and the intercept (b = 11.47) were used to calculate the LC-excess for the isotopic values of 2017 (Table 1, Table 2 and Table 3) and for the historical data (in the Supplementary Materials).
3. Result
3.1. Isotopic Variation Along the Main Course
In the year 2017, water samples collected along the Po river (Table 1) displayed δ18O varying between −12.7‰ and −8.5‰, and δD varying from −85.8‰ and −60.1‰, with an average δ18O = −10.4‰ and δD = −71.0‰ calculated for the data from Pian del Re to Revere.
Isotopic values were more negative in May (average calculated for the samples collected along the main course, −10.8‰ and −72.3‰ for δ18O and δD, respectively) with respect to July (average calculated for the samples collected along the main course, −9.8‰ and −68.6‰ for δ18O and δD, respectively), highlighting different contributions (snowmelt and precipitations) in different seasons.
The D-exc calculated for the year 2017 varied from 4.1‰ and 18.3‰, with an average of 12.1‰. The average D-exc was 14.0‰ and 10.1‰ in May and July, respectively.
The LC-exc varied from −7.0‰ and 7.3‰ with an average value of 1.0‰. It is interesting to note that the LC-exc variations were, on average, −1.0‰ and 3.0‰ in July and May 2017, respectively.
3.2. Isotopic Variation at the Pontelagoscuro Closing Section
In the hydrological year 2017, water samples collected at the closing section (Table 2) displayed δ18O varying between −10.5‰ and −8.2‰, and δD varying from −69.2‰ and −54.5‰, with an average of −8.9‰ and −59.6‰ for δ18O and δD measured in the different months of the 2017. The more negative isotopic values were recorded in June, possibly recording a contribution of waters coming from the western Alpine sector (snowmelt).
The D-exc calculated for the year 2017 varied from 9.1‰ and 14.9‰, with an annual average of 11.7‰, and lowest values were observed during the summer season.
The LC-exc calculated for the year varied from −2.0‰ to 3.8‰, with an annual average of 0.6‰. It is interesting to note a trend with the highest values recorded during May and June and the lowest (negative) values in August and September, before the start of the rainy season.
As reported above, D-exc and LC-exc seasonal decrease is related to the more effective evaporation which occurs during the summer.
3.3. Isotopic Variation in the Po River Delta
In the summer 2017, water samples collected in the Po river delta (Table 3) displayed δ18O varying between −9.5‰ and −3.6‰, and δD varying from −62.3‰ and −33.2‰, with an average of δ18O and δD −8.0‰ and −53.7‰, respectively. Excluding water samples collected close to the mouths, significant differences were observed between distinct deltaic branches: Po di Venezia (the main branch) was characterized by the more negative isotopic values, comparable to those observed in the closing section of Pontelagoscuro. The less negative isotopic values were recorded in the southernmost branch that is Po di Goro.
Excluding water samples collected close to the mouths, the average D-exc in the delta was 10.9‰, with the highest values in the in the Po di Venezia and Po di Gnocca and the lowest in the Po di Goro.
Excluding water samples collected close to the mouths, the average LC-exc was −0.2‰, with the highest values in the Po di Venezia and Po di Gnocca and the lowest (negative) values in the Po di Goro and Po di Maistra.
4. Discussion
4.1. Isotopic Variation along the Main Course
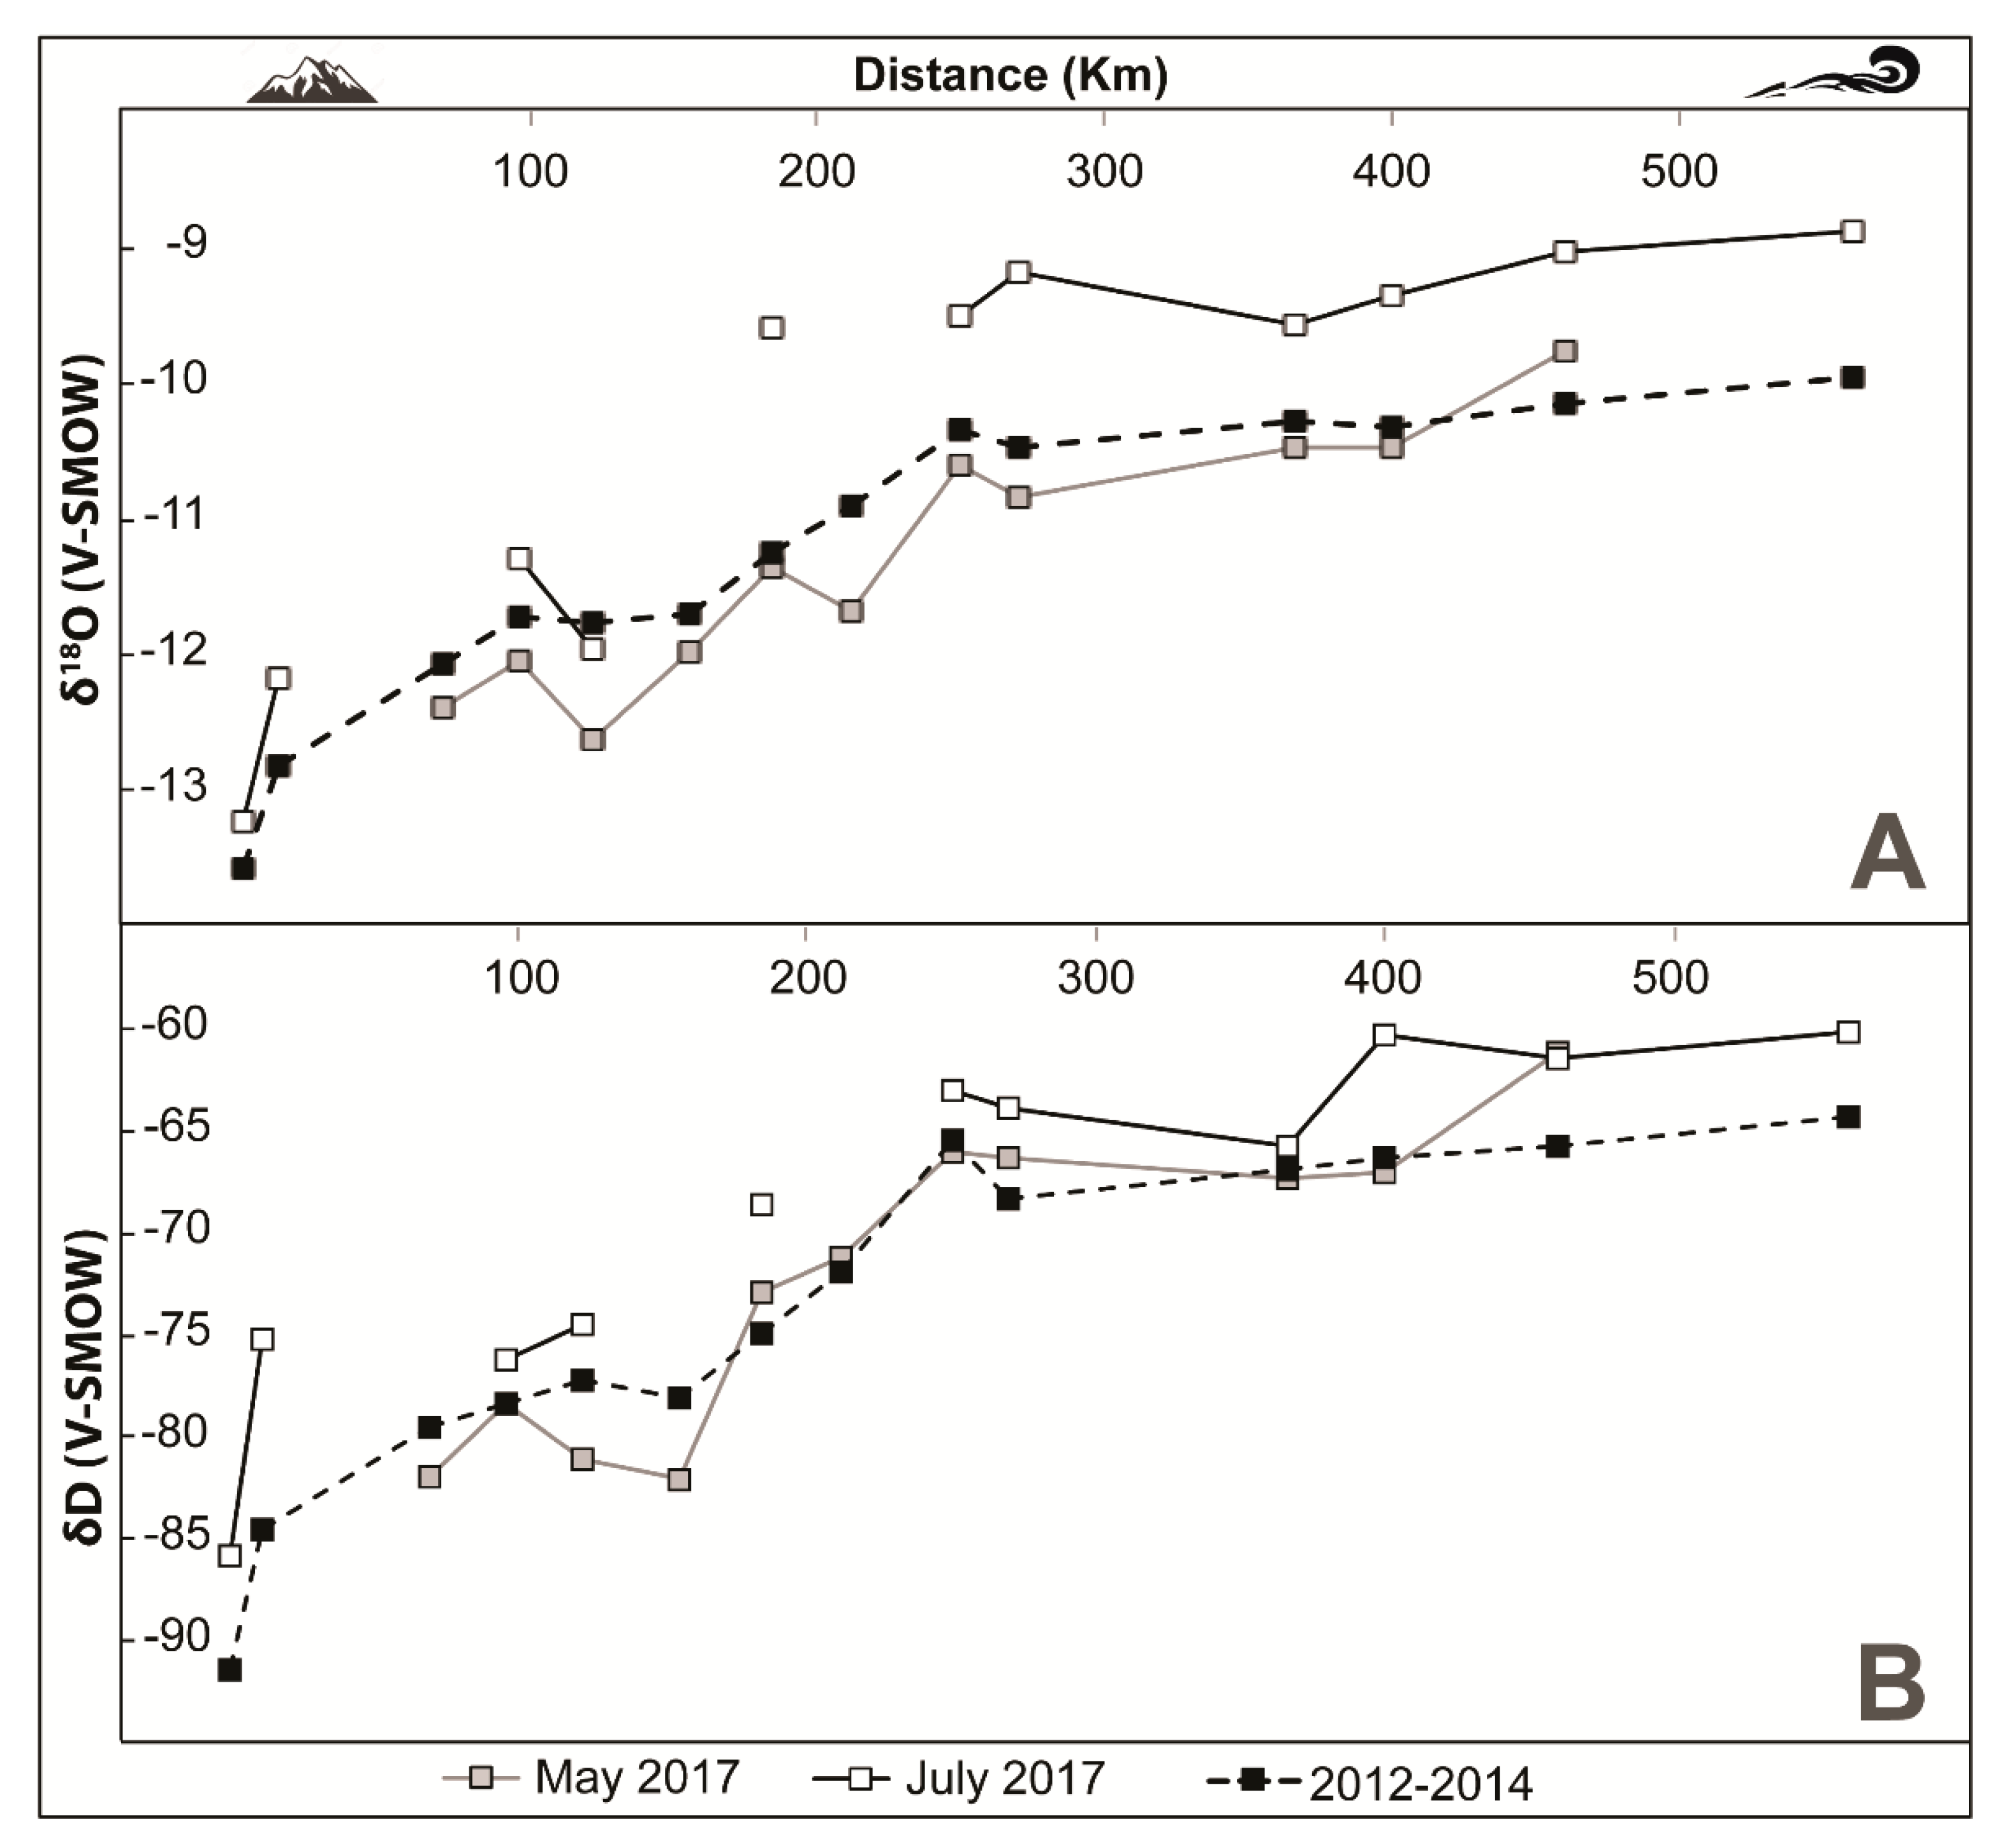
The spatial distribution of δ18O and δD along distinct parts of the stream path from the mountainous sector of the catchment down to the low part of the plain revealed regular gradients with the occurrence of progressively less negative isotopic values seaward. In the δ18O and δD diagrams of Figure 2, which emphasizes the spatial variation of the investigated parameters, sub-parallel trends can be observed in May and July 2017.
The variation trend observed in May 2017 approaches the average of isotopic values observed in the biennia 2012−2014 [15,16,19] (see Supplementary Table S1 in the Supplementary Materials). This means that the 2017 was characterized by a relative depletion of snow, which is generally characterized by extremely negative isotopic compositions [21,39]. The trend observed in July 2017 is characterized by less negative isotopic values with respect to the average observed in the biennia 2012−2014, indicating the occurrence of a cumulative effect of catchment scale evapotranspiration and instream evaporative processes during the summer 2017.
Coherently, D-exc and LC-exc values are generally lower in July 207 with respect to May 2017. Moreover, in the down flow of Piacenza, the D-exc and LC-exc values of July 2017 are comparatively lower than those recorded in the biennia 2012−2014. These features support the fact of Po river water suffered higher evaporation processes in July 2017, with respect to the other investigated periods.
4.2. Isotopic Variation at the Pontelagoscuro Closing Section
On average, the isotopic fingerprint of Po river water at Pontelagoscuro between October 2016 and September 2017 was −8.9 and –60.0‰ δ18O and δD, respectively. If the data set is restricted to the water samples collected in 2017, the average was –8.9 and –60.1‰ for δ18O and δD, respectively. These averages are shifted (enriched in heavy isotopes) from 0.6 and 3.9‰, with respect to the averages of the period 2012–2014 ([15,16,19]; Supplementary Materials). We relate these significant isotopic changes to the observed drought induced by a temperature anomaly and a concomitant deficit of precipitation.
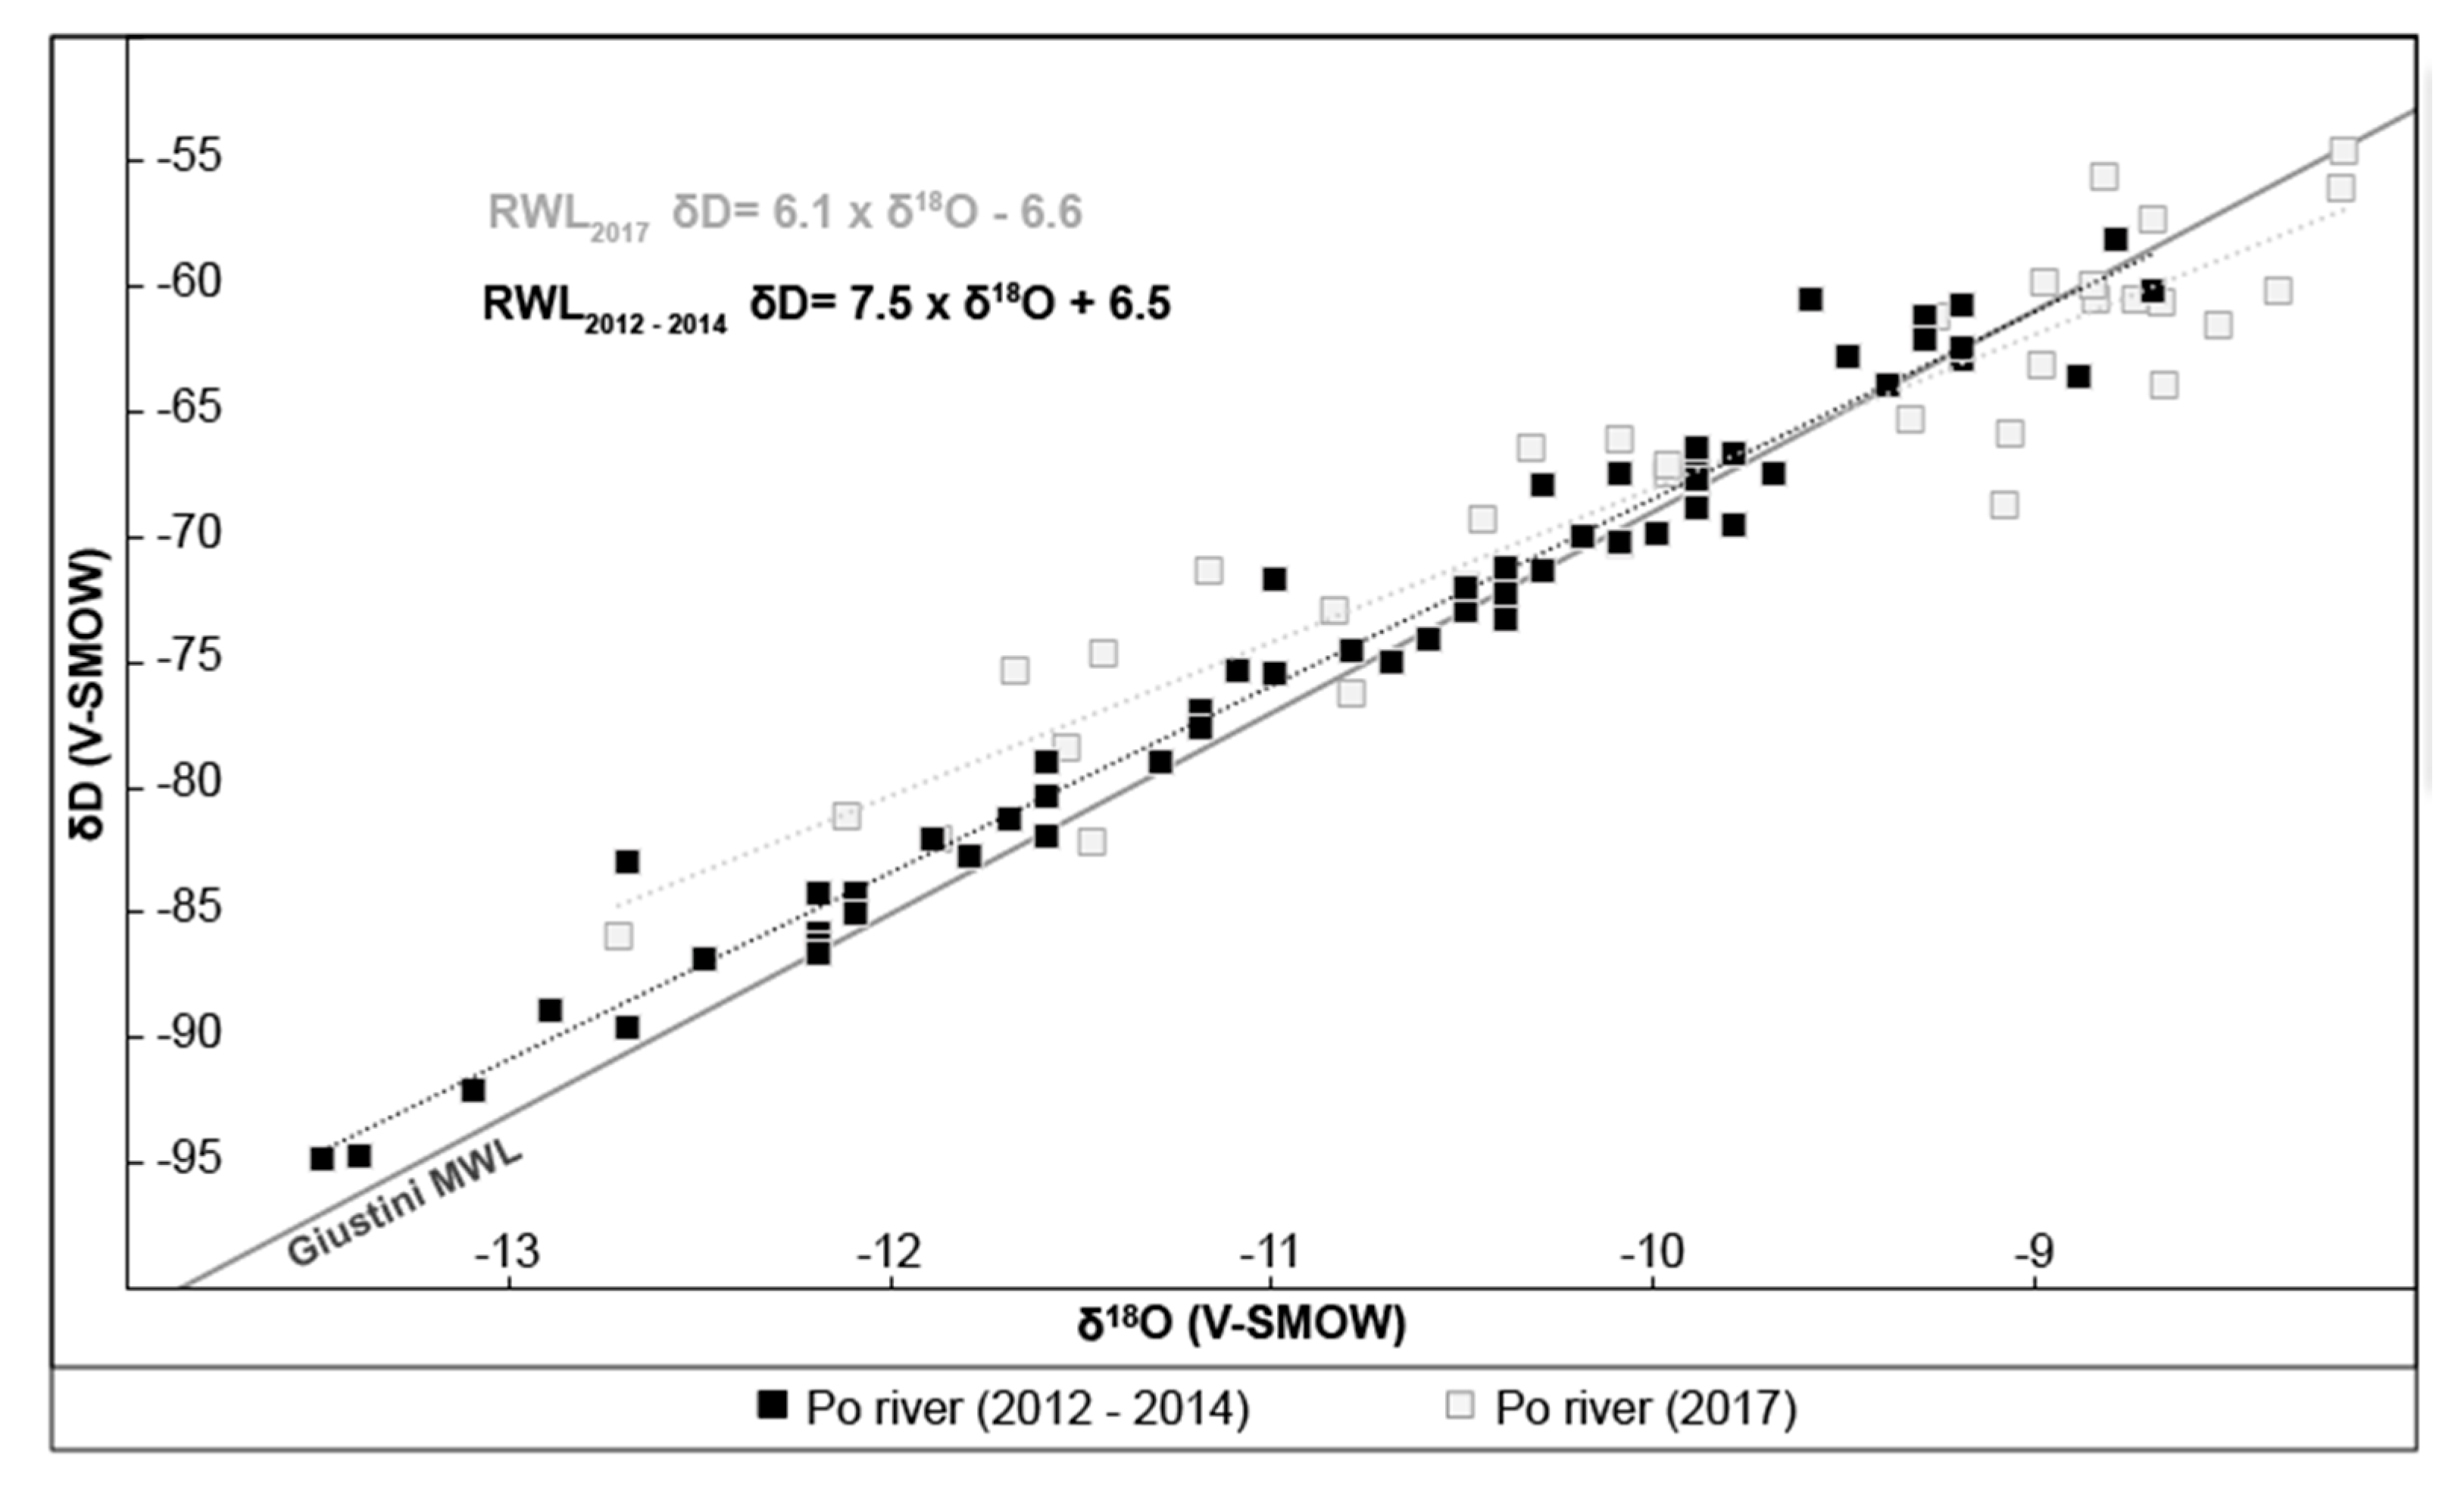
The data of Table 1 and Table 2 are plotted in a δD vs. δ18O diagram (Figure 3), showing a relation that can be classified as RWL (River Water Line), described by the equation δD = 6.1*δ18O − 6.6 (R2 = 0.9). This equation, calculated with the Ordinary Least Square (OLS) regression method, is significantly different from that obtained with the same method on data referring to the period 2012−2014 (δD = 7.5*δ18O + 6.5; R2 = 0.97). The Po RWL2017 is progressively departing from the local meteoric water line (LMWL) of northern, Italy defined by Longinelli and Selmo [40] and refined by Giustini et al. ([36]; δD = 8.0* δ18O + 11.5). Note that the difference is given by both the decrease of the slope and by the negative intercept, which are indicative of arid conditions [8].
Trying to investigate subsets of seasonally comparable data, we observed that the Po RWL calculated with only samples collected in summer 2017 is δD = 5.3*δ18O − 15.9 (R2 = 0.94), drastically different from that calculated with samples of summer 2013 (δD = 8.1 *δ18O + 13.2), suggesting that the isotopic peculiarity of the year 2017 mainly developed in the summer period in connection with the remarkable drought conditions that affected the basin.
4.3. Isotopic Variation in the Po River Delta
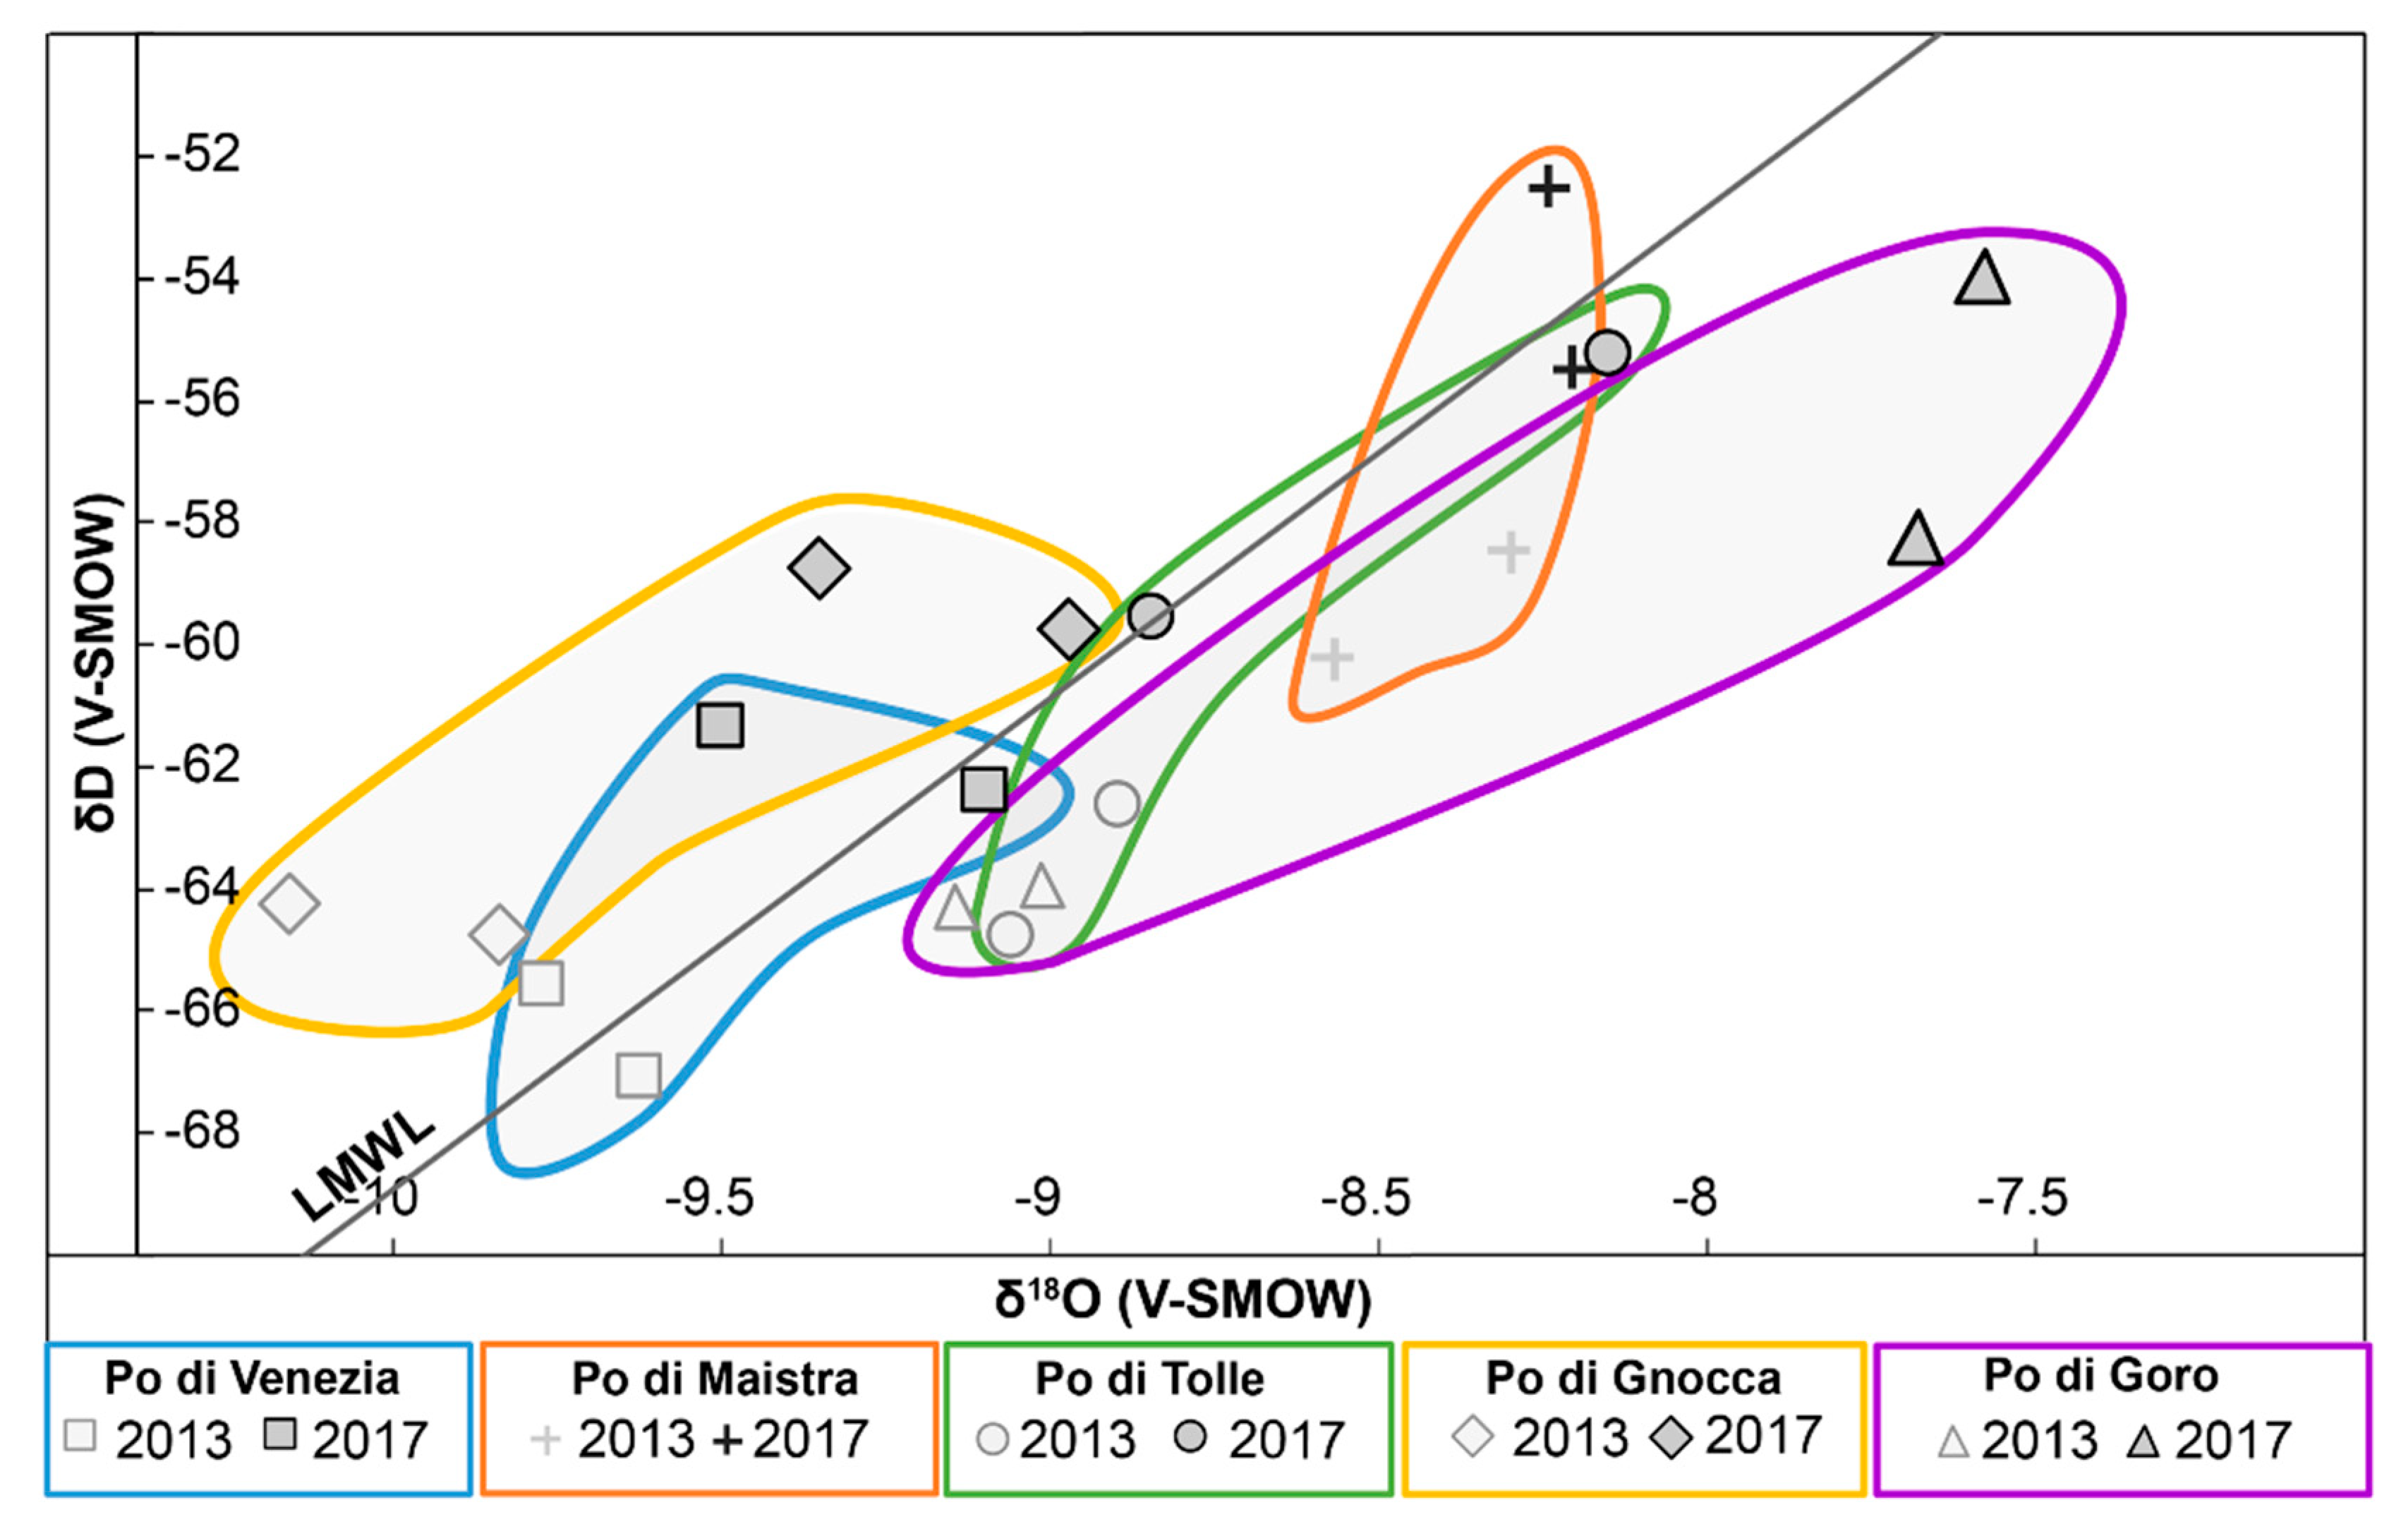
Isotopic variation in the river delta have to be interpreted with caution, as water composition could be directly influenced by mixing with seawater. For this reason, in the discussion, we do not take into consideration water samples collected close to the mouths (Table 3). The results have been compared with data carried out on samples collected exactly in the same sites during the summer 2013 ([17]; the Supplementary Materials). A systematic difference can be noted between the isotopic composition of water samples of August 2017 and those of August 2013 (Figure 4), with the latter being systematically more negative, with differences of 0.1–0.8‰ and 4.4–6.3‰ for δ18O and δD, respectively. The difference between the water samples of August 2017 and August 2013 are even greater, up to 1.4‰ and 8‰ for δ18O and δD, respectively, in the southernmost deltaic branch (Po di Goro). It appears therefore that the isotopic differences observed in the 2017 throughout the river are emphasized in its terminal part, where in the meandering sections of the deltaic branches the river flow progressively slows down, being affected by more efficient evaporation.
4.4. The δD-δ18O Variation and Inferences on Environmental Changes
Previous investigation of Po river water during the years 2012–2014 [15,16,19] highlighted a very good correlation between oxygen and hydrogen isotopic composition, defining a River Water Line (RWL) of δD = 7.5*δ18O + 6.5, calculated using the Ordinary Least Square (OLS) regression method, traditionally used to calculate the meteoric water line [41]. As often observed worldwide [4], the Po RWL2012–2014 has lower slope than the respective LMWL. In any case, both “meteoric″ and “river″ water lines are features that can vary in response to transient climatic variations. Accordingly, during 2017, in relation to anomalously high temperature and deficit of rainfall, the Po RWL was drastically different, being δD = 6.1*δ18O − 6.6 (Figure 3). The use of alternative least squares methods (Crawford et al., 2014), such as the orthogonal regression, also known as reduced major axis (RMA) regression, although giving slightly different parameters (δD = 6.5*δ18O − 3.2), confirms that the Po RWL2017 is characterized by a lower slope with respect to the LMWL and a negative intercept.
The Po RWL resulted to be even more anomalous if calculated only with samples collected during the summer period (δD = 5.4*δ18O − 15.4, calculated by OLS; δD = 5.6 *δ18O − 13.5, calculated by RMA). The lowering of the slope and the negative intercept clearly reflect the transition toward arid conditions that characterized the investigated period. The progressive deviation between the meteoric water and the river water lines can be interpreted as the watershed response to environmental changes (including precipitation and temperature variation, but also evolution in the land use and water consumption), and it would be interesting to reiterate the studies in the future and to evaluate the magnitude of these changes in the following years.
The isotopic anomaly recorded in the year 2017 can be expressed also in terms of LC-exc (calculated as explained in Section 2.3). Noteworthy, this parameter became progressively lower (toward negative values) during the transition between spring and summer, indicating an increase of evaporative effects.
The application of these tracers in the monitoring of environmental changes is of particular importance in the Mediterranean area, where recent studies [42,43,44] emphasized temperature increase and precipitation decrease at a higher magnitude than those observed at global scale. The riverine system taken into consideration in this study is the Po river, the main Italian river, which, as observed in the previous chapters, effectively recorded in the year 2017 an isotopic anomaly linked to a simultaneous increase of temperature and water deficit. The presented data are a snapshot of the Po river system in the droughty year 2017, which compared with previous data and with those of future investigations, will provide useful information on the ongoing hydrological changes. Although to a lesser extent, isotopic anomalies connected to a drought condition have also been recorded in the summer 2017 in the second longest river of Northern Italy, which is river Adige [20], thus confirming the peculiarity of the year 2017 throughout Northern Italy.
In our view, these sensitive isotopic parameters could be introduced as “essential climate variables″ (ECV) that are georeferenced physical, chemical, or biological variables or a group of linked variables that critically contributes to the characterization of Earth’s climate [45].
5. Conclusions
The stable isotopes of river water can be considered an appropriate tool to evaluate watershed response to the environmental changes in large scale basins, such as that of Po river.
Focusing attention on the year 2017, which was particularly prone to drought, we recorded extreme isotopic values emphasized by mutual relationships of oxygen and hydrogen isotopes, expressed by lower slope and intercept values in δD vs. δ18O diagrams with respect to those of local precipitation, in response to marked evaporation processes. The evidence is supported by derivative parameters, such as D-exc and LC-exc, which tend to be lower than those typical of meteoric water. The comparison with the data of the biennia 2012–2014 indicates systematic differences in the isotopic trends of the two investigated periods, which have been characterized by distinct climatic conditions.
Therefore, although aware that the presented hypotheses have to be tested on longer time series, isotopic studies on river water are highly informative and implement those directly made on precipitations for the understanding of environmental changes. Further isotopic investigation at the catchment scale is needed to validate the effectiveness of these tracers as environmental parameters.
Supplementary Materials
Author Contributions
All authors contributed extensively to the work presented in this paper. G.B. conceived and designed the sampling campaign and obtained the funding. C.M. and C.N. supervised the isotopic analyses. G.B. and C.M. wrote the paper that was subsequently polished by C.N.
Funding
This work was supported by the FAR2017 funding given by the University of Ferrara.
Acknowledgments
The Authors are grateful to the constructive suggestion provided by the Editor Y. Jun Xu and by five anonymous reviewers that greatly improved the early version of the manuscript.
Conflicts of Interest
The authors declare no conflict of interest.
References
- Craig, H. Isotopic variations in meteoric waters. Science 1961, 133, 1702–1703. [Google Scholar] [CrossRef] [PubMed]
- Gonfiantini, R. Investigating the hydrological cycle with environmental isotopes. In Proceedings of the Actas II Simposio Sudamericano de Geologia Isotopica, Cordoba, Argentina, 12–16 September 1999; pp. 537–547. [Google Scholar]
- Rozanski, K.; Araguas, L.; Gonfiantini, R. Isotopic patterns in modern global precipitation. In Climate Change in Continental Isotopic Records; American Geophysical Union: Washington, DC, USA, 1993; Volume 78, pp. 1–36. [Google Scholar]
- Halder, J.; Terzer, S.; Wassenaar, L.I.; Araguás-Araguás, L.J.; Aggarwal, P.K. The Global Network of Isotopes in Rivers (GNIR): Integration of water isotopes in watershed observation and riverine research. Hydrol. Earth Syst. Sci. 2015, 19, 3419–3431. [Google Scholar] [CrossRef]
- Ogrinc, N.; Kocman, D.; Miljević, N.; Vreča, P.; Vrzel, J.; Povinec, P. Distribution of H and O stable isotopes in the surface waters of the Sava River, the major tributary of the Danube River. J. Hydrol. 2018, 565, 365–373. [Google Scholar] [CrossRef]
- Kendall, C.; Coplen, T.B. Distribution of oxygen-18 and deuterium in river waters across the United States. Hydrol. Process. 2001, 15, 1363–1393. [Google Scholar] [CrossRef]
- Ogrinc, N.; Kanduč, T.; Stichler, W.; Vreča, P. Spatial and seasonal variations in δ18O and δD values in the River Sava in Slovenia. J. Hydrol. 2008, 359, 303–312. [Google Scholar] [CrossRef]
- Fan, Y.; Chen, Y.; He, Q.; Li, W.; Wang, Y. Isotopic characterization of river waters and water source identification in an inland river, Central Asia. Water 2016, 8, 286. [Google Scholar] [CrossRef]
- Frederickson, G.C.; Criss, R.E. Isotope hydrology and residence times of the unimpounded Meramec River Basin, Missouri. Chem. Geol. 1999, 157, 303–317. [Google Scholar] [CrossRef]
- Martinelli, L.A.; Victoria, R.L.; Silveira Lobo Sternberg, L.; Ribeiro, A.; Zacharias Moreira, M. Using stable isotopes to determine sources of evaporated water to the atmosphere in the Amazon basin. J. Hydrol. 1996, 183, 191–204. [Google Scholar] [CrossRef]
- Rank, D.; Wyhlidal, S.; Schott, K.; Weigand, S.; Oblin, A. Temporal and spatial distribution of isotopes in river water in Central Europe: 50 years experience with the Austrian network of isotopes in rivers. Isotopes Environ. Health Stud. 2018, 54, 115–136. [Google Scholar] [CrossRef]
- Reckerth, A.; Stichler, W.; Schmidt, A.; Stumpp, C. Long-term data set analysis of stable isotopic composition in German rivers. J. Hydrol. 2017, 552, 718–731. [Google Scholar] [CrossRef]
- Yi, Y.; Gibson, J.J.; Hélie, J.F.; Dick, T.A. Synoptic and time-series stable isotope surveys of the Mackenzie River from Great Slave Lake to the Arctic Ocean, 2003 to 2006. J. Hydrol. 2010, 383, 223–232. [Google Scholar] [CrossRef]
- Yang, K.; Han, G.; Liu, M.; Li, X.; Liu, J.; Zhang, Q. Spatial and Seasonal Variation of O and H Isotopes in the Jiulong River, Southeast China. Water 2018, 10, 1677. [Google Scholar] [CrossRef]
- Marchina, C.; Bianchini, G.; Natali, C.; Pennisi, M.; Colombani, N.; Tassinari, R.; Knöller, K. The Po river water from the Alps to the Adriatic Sea (Italy): New insights from geochemical and isotopic (δ18O-δD) data. Environ. Sci. Pollut. R. 2015, 22, 5184–5203. [Google Scholar] [CrossRef] [PubMed]
- Marchina, C.; Bianchini, G.; Knöller, K.; Natali, C.; Pennisi, M.; Colombani, N. Natural and anthropogenic variations in the Po river waters (northern Italy): Insights from a multi-isotope approach. Isot. Environ. Health Stud. 2016, 52, 649–672. [Google Scholar] [CrossRef] [PubMed]
- Marchina, C.; Bianchini, G.; Natali, C.; Knöller, K. Geochemical and isotopic analyses on the Po delta water: Insights to understand a complex riverine ecosystem. Rend. Lincei Sci. Fis. Nat. 2016, 27, 83–88. [Google Scholar] [CrossRef]
- Marchina, C.; Natali, C.; Fazzini, M.; Fusetti, M.; Tassinari, R.; Bianchini, G. Extremely dry and warm conditions in northern Italy during the year 2015: Effects on the Po river water. Rend. Lincei Sci. Fis. Nat. 2017, 28, 281–290. [Google Scholar] [CrossRef]
- Marchina, C.; Natali, C.; Fahnestock, M.F.; Pennisi, M.; Bryce, J.; Bianchini, G. Strontium isotopic composition of the Po river (Northern Italy): Insights into rock weathering at the basin scale. Appl. Geochem. 2018, 97, 187–196. [Google Scholar] [CrossRef]
- Chiogna, G.; Skrobanek, P.; Narany, T.S.; Ludwig, R.; Stumpp, C. Effects of the 2017 drought on isotopic and geochemical gradients in the Adige catchment, Italy. Sci. Total Environ. 2018, 645, 924–936. [Google Scholar] [CrossRef]
- Natali, C.; Bianchini, G.; Marchina, C.; Knöller, K. Geochemistry of the Adige River water from the Eastern Alps to the Adriatic Sea (Italy): Evidences for distinct hydrological components and water-rock interactions. Environ. Sci. Pollut. Res. 2016, 23, 11677–11694. [Google Scholar] [CrossRef]
- Bianchini, G.; Natali, C.; Di Giuseppe, D.; Beccaluva, L. Heavy metals in soils and sedimentary deposits of the Padanian Plain (Ferrara, Northern Italy): Characterisation and biomonitoring. J. Soil. Sediment. 2012, 12, 1145–1153. [Google Scholar] [CrossRef]
- Bianchini, G.; Di Giuseppe, D.; Natali, C.; Beccaluva, L. Ophiolite inheritance in the Po plain sediments: Insights on heavy metals distribution and risk assessment. Ofioliti 2013, 38, 1–14. [Google Scholar]
- Garzanti, E.; Vezzoli, G.; Andò, S. Paleogeographic and paleodrainage changes during Pleistocene glaciations (Po Plain, Northern Italy). Earth Sci. Rev. 2011, 105, 25–48. [Google Scholar] [CrossRef]
- Ninfo, A.; Ciavola, P.; Billi, P. The Po Delta is restarting progradation: Geomorphological evolution based on a 47-years Earth Observation dataset. Sci. Rep. 2018, 8, 3457. [Google Scholar] [CrossRef] [PubMed]
- Kettner, A.J.; Syvitsky, J.P.M. Predicting discharge and sediment flux of the Po River, Italy since the Last Glacial Maximum. Spec. Publ. Int. Assoc. Sedimentol. 2008, 40, 171–189. [Google Scholar]
- Montanari, A. Hydrology of the Po River: Looking for changing patterns in river discharge. Hydrol. Earth Syst. Sci. 2012, 16, 3739–3747. [Google Scholar] [CrossRef]
- Vörösmarty, C.J.; Fekete, B.; Tucker, B.A. River Discharge Database, Version 1.1 (RivDIS v1.0 Supplement); Institute for the Study of Earth, Oceans, and Space, University of New Hampshire: Durham, NH, USA, 1998. [Google Scholar]
- Tarpanelli, A.; Brocca, V.; Lacava, T.; Melone, F.; Moramarco, T.; Faruolo, M.; Pergola, N.; Tramutoli, V. Toward the estimation of river discharge variations using MODIS data in ungauged basins. Remote Sens. Environ. 2013, 136, 47–55. [Google Scholar] [CrossRef]
- Brian, M.; Del Longo, M.; Pecora, S.; Tugnoli, F. La siccità prolungata nel bacino del fiume Po. Ecoscienza 2017, 5, 10–11. [Google Scholar]
- Dansgaard, W. Stable isotopes in precipitation. Tellus 1964, 16, 436–468. [Google Scholar] [CrossRef]
- Landwehr, J.M.; Coplen, T.B. Line-conditioned excess: A new method for characterizing stable hydrogen and oxygen isotope ratios in hydrologic systems. In Proceedings of the International Conference on Isotopes in Environmental Studies Aquatic Forum 2004, Monaco, 25–29 October 2004; IAEA: Wien, Austria, 2006; pp. 132–135. [Google Scholar]
- Landwehr, J.M.; Coplen, T.B.; Stewart, D.W. Spatial, seasonal, and source variability in the stable oxygen and hydrogen isotopic composition of tap waters throughout the USA. Hydrol. Process. 2014, 28, 5382–5422. [Google Scholar] [CrossRef]
- Evaristo, J.; McDonnell, J.J.; Scholl, M.A.; Bruijnzeel, L.A.; Chun, K.P. Insights into plant water uptake from xylem-water isotope measurements in two tropical catchments with contrasting moisture conditions. Hydrol. Process. 2016, 30, 3210–3227. [Google Scholar] [CrossRef]
- Sprenger, M.; Tetzlaff, D.; Tunaley, C.; Dick, J.; Soulsby, C. Evaporation fractionation in a peatland drainage network affects stream water isotope composition. Water Resour. Res. 2017, 53, 851–866. [Google Scholar] [CrossRef] [Green Version]
- Giustini, F.; Brilli, M.; Patera, A. Mapping oxygen stable isotopes of precipitation in Italy. J. Hydrol. Reg. Stud. 2016, 8, 162–181. [Google Scholar] [CrossRef] [Green Version]
- Cui, J.; Tian, L.; Biggs, T.W.; Wen, R. Deuterium-excess determination of evaporation to inflow ratios of an alpine lake: Implications for water balance and modelling. Hydrol. Process. 2017, 31, 1034–1046. [Google Scholar] [CrossRef]
- Scandellari, F.; Penna, D. Gli isotopi stabili nell’acqua fra suolo, pianta e atmosfera. Italus Hortus 2017, 24, 51–67. [Google Scholar]
- Penna, D.; Engel, M.; Mao, L.; Dell’Agnese, A.; Bertoldi, G.; Comiti, F. Tracer-based analysis of spatial and temporal variations of water sources in a glacierized catchment. Hydrol. Earth Syst. Sci. 2014, 18, 5271–5528. [Google Scholar] [CrossRef]
- Longinelli, A.; Selmo, E. Isotopic composition of precipitation in Italy: A first overall map. J. Hydrol. 2003, 270, 75–88. [Google Scholar]
- Crawford, J.; Hughes, C.E.; Lykoudis, S. Alternative least squares methods for determining the meteoric water line, demonstrated using GNIP data. J. Hydrol. 2014, 519, 2331–2340. [Google Scholar] [CrossRef]
- Lionello, P.; Scarascia, L. The relation between climate change in the Mediterranean region and global warming. Reg. Environ. Chang. 2018, 18, 1481–1493. [Google Scholar] [CrossRef]
- Michaelides, S.; Karacostas, T.; Sánchez, J.L.; Retalis, A.; Pytharoulis, I.; Homar, V.; Romero, R.; Zanis, P.; Giannakopoulos, C.; Bühl, J.; et al. Reviews and perspectives of high impact atmospheric processes in the Mediterranean. Atmos. Res. 2018, 208, 4–44. [Google Scholar] [CrossRef]
- Paeth, H.; Vogt, A.; Paxian, A.; Hertig, E.; Seubert, S.; Jacobeit, J. Quantifying the evidence of climate change in the light of uncertainty exemplified by the Mediterranean hot spot region. Glob. Planet. Chang. 2017, 151, 144–151. [Google Scholar] [CrossRef]
- Bojinski, S.; Verstraete, M.; Peterson, T.C.; Richter, C.; Simmons, A.; Zemp, M. The concept of essential climate variables in support of climate research, applications, and policy. Bullet. Am. Meteorol. Soc. 2014, 95, 1431–1443. [Google Scholar] [CrossRef]
- Barredo, J.I.; Caudullo, G.; Dosio, A. Mediterranean habitat loss under future climate conditions: Assessing impacts on the Natura 2000 protected area network. Appl. Geogr. 2016, 75, 83–92. [Google Scholar] [CrossRef]
- Buosi, A.; Sfrisio, A. Macrophyte assemblage composition as a simple tool to assess global change in coastal areas. Freshwater impacts and climatic changes. Sci. Total Environ. 2017, 605–606, 559–568. [Google Scholar] [CrossRef] [PubMed]
- Ochoa-Hueso, R.; Munzi, S.; Alonso, R. Ecological impacts of atmospheric pollution and interactions with climate change in terrestrial ecosystems of the Mediterranean Basin: Current research and future directions. Environ. Pollut. 2017, 227, 194–206. [Google Scholar] [CrossRef] [PubMed]
Figure 1.
(a) Map of the Po river catchment reporting the sampling sites along the Po plain and (b) its delta. Circles and abbreviated labels represent the sampling sites along the Po river. The abbreviation of the sampling sites is explained in Table 1, Table 2 and Table 3 that also includes geographic coordinates. Note that the sampling site of Pontelagoscuro (Plg) is marked by a larger circle to highlight that in this specific site, water sampling and analysis has been repeated several times. The abbreviations of the tributaries are: Pe (Pellice), D (Dora Baltea), S (Sesia), Ti (Ticino), L (Lambro), A (Adda), O (Oglio), M (Mincio), T (Tanaro), Tr (Trebbia), Ta (Taro), Se (secchia), P (Panaro).

Figure 2.
Variation of the δ18O (A) and δD (B) of Po river water (Table 1 and Supplementary Table S1 in the Supplementary Materials) at varying distances from the source, down to the closure section of Pontelagoscuro.
Figure 2.
Variation of the δ18O (A) and δD (B) of Po river water (Table 1 and Supplementary Table S1 in the Supplementary Materials) at varying distances from the source, down to the closure section of Pontelagoscuro.

Figure 3.
The δD vs. δ18O of Po river water (data from Table 1 and Table 2 and Supplementary Tables S1 and S2 in the Supplementary Materials) along the main course and the Pontelagoscuro section. The new data (hydrological year 2017) and the relative regression lines are compared with those recorded in Po river water during the years 2012–2014. Regression lines have been calculated using the Ordinary Least Square (OLS) regression method, traditionally used to calculated the meteoric water line [41]. The Local Meteoric Water Line (LMWL) defined for Northern Italy [36] is also reported in grey for comparison.

Figure 4.
The δD vs. δ18O of Po river water collected during summer 2017 in the deltaic sector of Po river (data from Table 3). Note that the diagram does not include the water samples collected in the deltaic mouths (see Figure 2 and Table 3). Data relative to the summer 2013 on samples collected exactly in the same sites ([17]; see Supplementary Table S3 in the Supplementary Materials) are also reported for comparison.


Table 1.
Hydrogen and oxygen isotopic composition and derivate parameters D-exc and LC-exc of the Po river water collected in the year 2017 (May and July). Coordinates and abbreviations of the sampling sites (cf. Figure 1) are also reported.
Table 1.
Hydrogen and oxygen isotopic composition and derivate parameters D-exc and LC-exc of the Po river water collected in the year 2017 (May and July). Coordinates and abbreviations of the sampling sites (cf. Figure 1) are also reported.
| ID | Site | Latitude | Longitude | Period | δ18O ‰ | δD ‰ | D-exc ‰ | LC-exc ‰ |
|---|---|---|---|---|---|---|---|---|
| P | Pian del Re | 44°42′04.00″ | 07°05′42.00″ | 26 July 2017 | −12.7 | −85.8 | 15.9 | 4.8 |
| S | Sanfront | 44°54′31.37″ | 07°41′29.93″ | 26 July 2017 | −11.7 | −75.2 | 18.3 | 7.4 |
| C | Carignano | 45°07′29.63″ | 07°46′15.37″ | 17 May 2017 | −11.9 | −81.9 | 13.1 | 2.3 |
| ST | Settimo Torinese | 45°10′32.96″ | 08°05′55.61″ | 17 May 2017 | −11.5 | −78.3 | 14.1 | 2.7 |
| 26 July 2017 | −10.8 | −76.2 | 10.2 | −0.8 | ||||
| Cr | Crescentino | 45°08′39.77″ | 08°32′27.29″ | 17 May 2017 | −12.1 | −81.1 | 15.9 | 4.7 |
| 26 July 2017 | −11.5 | −74.6 | 17.1 | 6.4 | ||||
| F | Frassineto Po | 45°2′10.95″ | 08°49′16.20″ | 17 May 2017 | −11.5 | −82.1 | 9.8 | −1.1 |
| PC | Pieve al Cairo | 45°07′27.90″ | 09°09′31.96″ | 17 May 2017 | −10.8 | −72.9 | 13.9 | 2.5 |
| 26 July 2017 | −9.1 | −68.7 | 4.1 | −7.0 | ||||
| R | Rea | 45°07′46.41″ | 09°38′07.16″ | 17 May 2017 | −11.2 | −71.2 | 18.2 | 7.4 |
| SL | Senna Lodigiana | 45°03′41.76″ | 09°41′53.51″ | 17 May 2017 | −10.1 | −66.0 | 14.9 | 3.7 |
| 26 July 2017 | −9.0 | −63.0 | 9.0 | −2.1 | ||||
| P | Piacenza | 45°07′43.34″ | 09°59′45.93″ | 17 May 2017 | −10.3 | −66.4 | 16.3 | 4.9 |
| 26 July 2017 | −8.7 | −63.9 | 5.5 | −5.4 | ||||
| Cre | Cremona | 44°59′03.67″ | 10°18′27.70″ | 17 May 2017 | −10.0 | −67.3 | 12.4 | 1.6 |
| 26 July 2017 | −9.1 | −65.7 | 6.9 | −4.0 | ||||
| Co | Coltaro | 45°03′27.46″ | 11°07′52.80’’ | 17 May 2017 | −10.0 | −67.1 | 12.7 | 1.8 |
| 26 July 2017 | −8.9 | −60.4 | 10.4 | −0.3 | ||||
| Re | Revere | 44°55′04.78″ | 11°34′46.10″ | 17 May 2017 | −9.3 | −61.1 | 13.1 | 2.2 |
| 26 July 2017 | −8.5 | −61.4 | 6.8 | −4.5 |
Table 2.
Hydrogen and oxygen isotopic composition of Po river water at the Pontelagoscuro (Plg in Figure 1) closing section in the hydrological year 2016–2017; D-exc and LC-exc and Po river discharge (data from ARPA Veneto) are also reported. The value of November 2016 represents an average value of 4 samples collected between the 18 November 2016 and 29 November 2016.
| δ18O ‰ | δD ‰ | D-exc ‰ | LC-exc ‰ | Q (m3/s) | |
|---|---|---|---|---|---|
| 26 October 2016 | −9.0 | −59.7 | 12.3 | 1.2 | 825 |
| November 2016 * | −8.7 | −57.3 | 12.3 | 1.2 | 3.298 |
| 2017 | |||||
| 8 February 2017 | −8.3 | −56.7 | 9.7 | −1.4 | 1.850 |
| 6 March 2017 | −9.2 | −61.8 | 11.8 | 0.7 | 980 |
| 5 April 2017 | −8.2 | −54.5 | 11.1 | 0.0 | 1.050 |
| 9 May 2017 | −8.8 | −55.5 | 14.9 | 3.8 | 1.348 |
| 5 June 2017 | −10.5 | −69.2 | 14.8 | 3.7 | 735 |
| 17 July 2017 | −8.9 | −59.9 | 11.3 | 0.2 | 545 |
| 10 August 2017 | −8.8 | −60.4 | 10.0 | −1.1 | 475 |
| 20 September 2017 | −8.7 | −60.5 | 9.1 | −2.0 | 1.190 |
Notes: Plg: Pontelagoscuro, Latitude: 44°55′04.78″; Longitude: 11°34′46.10″.
Table 3.
Hydrogen and oxygen isotopic composition and relative D-exc and LC-exc in waters collected in the distinct branches of the Po Delta (cf. inset of Figure 1). Coordinates of the sampling sites are also reported.
Table 3.
Hydrogen and oxygen isotopic composition and relative D-exc and LC-exc in waters collected in the distinct branches of the Po Delta (cf. inset of Figure 1). Coordinates of the sampling sites are also reported.
| ID | Po River Branches | Latitude | Longitude | Date | δ18O ‰ | δD ‰ | D-exc ‰ | LC-exc ‰ |
|---|---|---|---|---|---|---|---|---|
| FU1 | Po di Venezia | 44°57′25.00″ | 12°21′54.00″ | 23 August 2017 | −9.5 | −61.3 | 14.7 | 3.6 |
| FU2 | 44°57′21.00″ | 12°25′09.00″ | 23 August 2017 | −9.1 | −62.3 | 10.5 | −0.6 | |
| FU3 | 44°57′58.57″ | 12°31′21.10″ | 23 August 2017 | −8.8 | −55.3 | 15.5 | 4.0 | |
| FU4 | Po di Tolle | 44°56′15.50″ | 12°26′04.92″ | 23 August 2017 | −8.9 | −59.6 | 11.6 | 0.5 |
| FU5 | 44°53′50.56″ | 12°27′52.58″ | 23 August 2017 | −8.2 | −55.1 | 10.1 | −0.6 | |
| FU6 | 44°51′14.43″ | 12°27′55.00″ | 23 August 2017 | −7.6 | −48.4 | 12.1 | 1.2 | |
| FU7 | Po di Gnocca | 44°55′25.88″ | 12°19′14.68″ | 21 August 2017 | −9.0 | −60.2 | 11.8 | 0.7 |
| FU8 | 44°50′40.81″ | 12°22′21.10″ | 21 August 2017 | −9.4 | −58.8 | 16.4 | 5.3 | |
| FU9 | 44°48′40.64″ | 12°24′28.69″ | 21 August 2017 | −7.7 | −54.5 | 7.5 | −4.1 | |
| FU12 | Po di Goro | 44°50′04.23″ | 12°20′41.42″ | 21 August 2017 | −7.7 | −58.1 | 3.5 | −7.7 |
| FU11 | 44°48′25.77″ | 12°22′13.08″ | 21 August 2017 | −7.6 | −54.1 | 6.7 | −4.5 | |
| FU10 | 44°47′37.97″ | 12°23′42.52″ | 21 August 2017 | −5.9 | −37.3 | 9.9 | −1.3 | |
| FU15 | Po di Maistra | 44°57′42.44″ | 12°20′01.78″ | 23 August 2017 | −8.2 | −55.4 | 10.2 | −0.9 |
| FU14 | 44°59′53.67″ | 12°23′48.82″ | 9 September 2017 | −8.2 | −52.5 | 13.1 | 2.0 | |
| FU13 | 45°01′40.00″ | 12°24′35.38″ | 9 September 2017 | −3.6 | −33.2 | −4.3 | −15.7 |
© 2019 by the authors. Licensee MDPI, Basel, Switzerland. This article is an open access article distributed under the terms and conditions of the Creative Commons Attribution (CC BY) license (http://creativecommons.org/licenses/by/4.0/).
Share and Cite
MDPI and ACS Style
Marchina, C.; Natali, C.; Bianchini, G. The Po River Water Isotopes during the Drought Condition of the Year 2017. Water 2019, 11, 150. https://doi.org/10.3390/w11010150
AMA Style
Marchina C, Natali C, Bianchini G. The Po River Water Isotopes during the Drought Condition of the Year 2017. Water. 2019; 11(1):150. https://doi.org/10.3390/w11010150
Chicago/Turabian StyleMarchina, Chiara, Claudio Natali, and Gianluca Bianchini. 2019. "The Po River Water Isotopes during the Drought Condition of the Year 2017" Water 11, no. 1: 150. https://doi.org/10.3390/w11010150
Note that from the first issue of 2016, this journal uses article numbers instead of page numbers. See further details here.