Poseidon—Decision Support Tool for Water Reuse


1
Institute for Ecopreneurship, School of Life Sciences, University of Applied Sciences and Arts Northwestern Switzerland (FHNW), Hofackerstrasse 30, 4132 Muttenz, Switzerland
2
Department of Natural Resources Development and Agricultural Engineering, Agricultural University of Athens (AUA), Iera Odos 75, 11855 Athens, Greece
*
Author to whom correspondence should be addressed.
Water 2019, 11(1), 153; https://doi.org/10.3390/w11010153
Submission received: 6 December 2018
/
Revised: 9 January 2019
/
Accepted: 10 January 2019
/
Published: 16 January 2019
(This article belongs to the Section Wastewater Treatment and Reuse)
Abstract
:In an era when many water systems worldwide are experiencing water stress regarding water quantity and quality, water reuse has received growing attention as one of the most promising integrated mitigating solutions. Nevertheless, the plethora of technologies and their combinations available, as well as social, economic, and environmental constraints, often make it complex for stakeholders and especially decision makers to elicit relevant information. The scope of the current study is to develop a decision support tool that supports pre-feasibility studies and aims at promoting water reuse and building capacities in the field. The tool developed currently encompasses 37 unit processes combined into 70 benchmark treatment trains. It also contains information on water quality standards and typical wastewater qualities. It estimates the removal performances for 12 parameters and the lifecycle costs including distribution. The tool and all underlying data are open access and under continuous development. The underlying systemic approach of the tool makes it intuitive also for users with limited prior knowledge in the field to identify most adequate solutions based on a multi-criteria assessment. This should help to promote water reuse and spearhead initiates for more detailed feasibility and design commissioning for implementation of water reuse schemes.
1. Introduction
1.1. Water Reuse and Decision Support Tools (DSTs)
Water reuse (also called water reclamation or water recycling) has received growing attention as one of the most promising integrated solutions to mitigate water stress by improving access to good quality water. It can be an alternative to tapping new water sources (e.g., through seawater desalination), as it performs two fundamental functions that appear to be the primary incentives for implementing water reuse schemes. Treated wastewater can be reused as a water resource for beneficial purposes, and wastewater is kept out of receiving environments and, thus, pollution is reduced [1]. The objective of water reuse is the treatment of wastewater to a stage of purity that can directly be used for specific purposes, such as agriculture, industry, urban, domestic, potable reuse, and surface or groundwater recharge. Producing high purity effluents that are suitable for local reuse applications can be achieved by upgrading existing treatment plants or by designing new treatment plants for this purpose. In this way, the effluents comply with quality requirements for the intended reuse. The first step in the selection and design of the most appropriate treatment option is the investigation of techno-economic feasibility of treatment options for a reuse scheme [2].
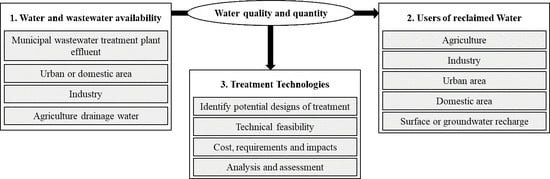
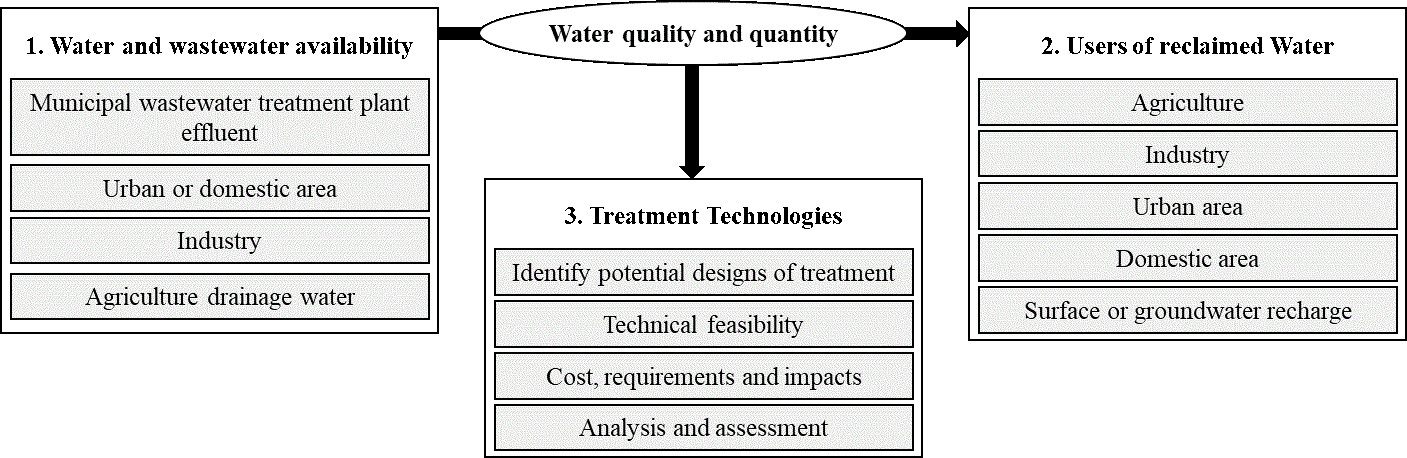
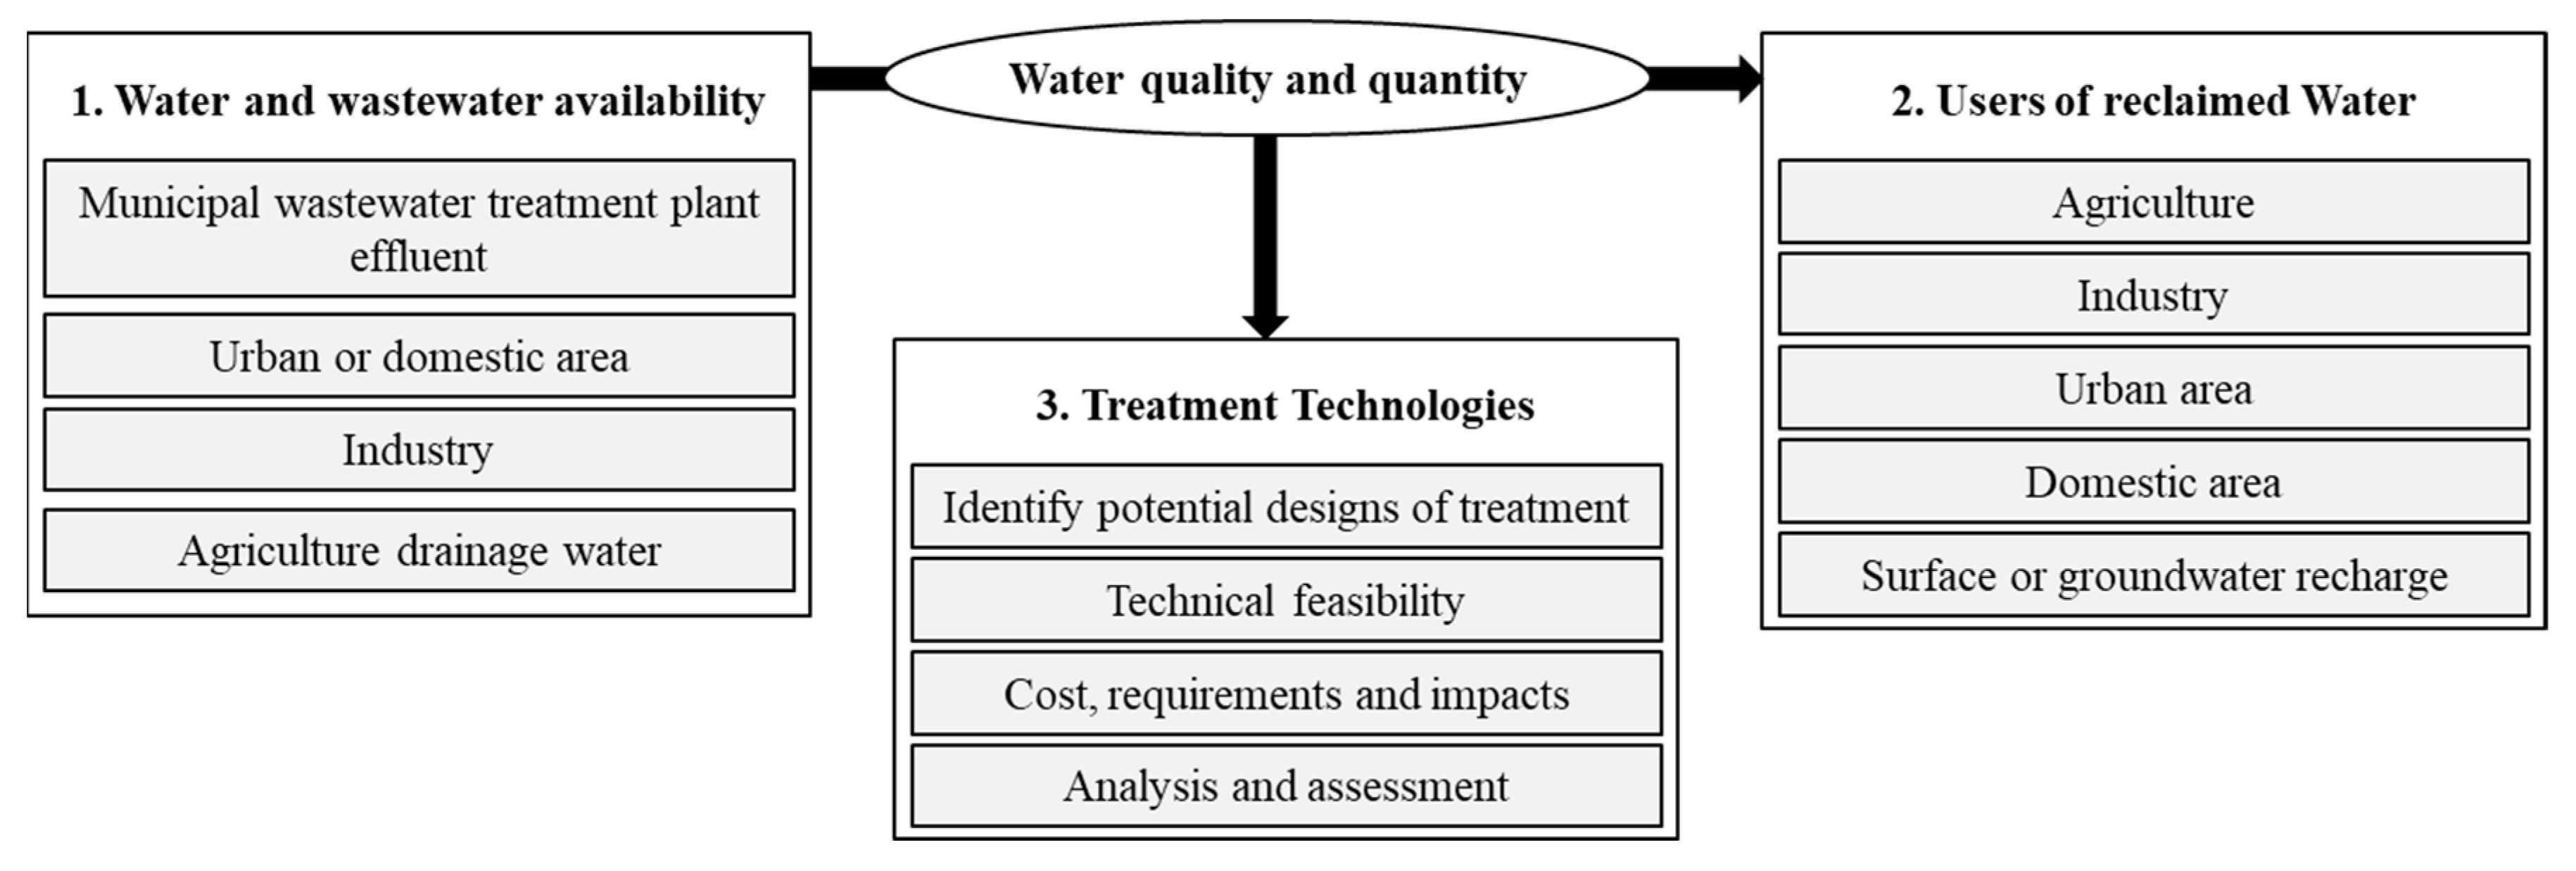
The presented research focuses on the pre-feasibility stage and considers potential water reuse schemes in a systemic approach schematically (Figure 1). This allows determining if an identified area with potential for water reuse could lead to a feasible reclamation scheme with the current resources, technologies, and available information.
A typical pre-feasibility assessment starts with the identification of potential reclaimable water or wastewater (1) and evaluates if this water could be treated and reused for different purposes (2). Depending on quality and quantity of available and required water, adequate treatment technologies can be identified and assessed (3). This can include assessing costs, requirements, and impacts, pollutant removal performance as well as additional technical criteria such as reliability, ease of operation, and maintenance to propose the most promising solutions and support the decision to proceed or abandon reuse options.
There are several decision support tools (DSTs) available for water and wastewater treatment selection and design that have been reviewed by Hamouna et al. [3] (Table 1). Most DSTs usually address planners and designers with a strong focus on technical aspects, usually dominating the logic of the developed systems reviewed [3]. Hamouna et al. [3] also mention that there is a need for integrated decision support tools that are generic, usable, and that consider a system analysis approach. The present paper aims to address this need for a user friendly and comprehensive interface with solid background calculations. A broad range of stakeholders can then apply the DST to facilitate the implementation of water reuse solutions, by applying a multi-criteria assessment. The DST differs from existing tools by proposing a different scope of application, rather than a comprehensive technical design. The different scope consists of the pre-feasibility, capacity building, and promoting the concept of water reuse. The DST’s underlying data and pre-selected information are open access and transparent.
1.2. Objective and Task
The main objective of this study is to develop a DST for pre-feasibility studies to promote water reuse in regions where it is still an emerging concept. The aspiration is that for the every case study, at least one potential for water reuse option with an adequate treatment train that meets the local requirements can be identified. As the number of possible technologies and treatment trains is important and requires expertise, a simplification is needed to offer a clear user interface. In this way, even non-expert users can participate in the assessment and understand the results, while pertinent calculations are being performed in the background. The proposed concept is that the user should only provide data on the quantity and quality of the foreseen input (wastewater to be treated), the foreseen type of reuse, and limited information on the local specificities. Based on this input, the DST should provide options of treatment trains that can meet the local requirements and specificities (Figure 2). As any first application, the DST should be very simple and user-friendly also for non-experts. It should also encompass more advanced application possibilities for experts requiring more detailed analysis. The scope of applying this DST begins with awareness raising and identification of the potential for water reuse. The scope ends before carrying out a detailed feasibility study and design of water reuse schemes. To promote the concept of water reuse and serve training purposes, the DST also includes capacity-building components for users that are not familiar with water reuse technologies. The developed DST composes of several elements in a transparent, widely used spreadsheet software (Microsoft Excel).
In Section 2, materials and methods are presented, which depict the core concepts of the developed DST. Different technologies that are included, water quality parameters, water quality classes, pollutant removal efficiencies, and assessment criteria are listed and presented. The underlying cost curves are presented for every unit process and the calculation of annualized treatment and distribution costs, as well as the screening and assessment algorithms for the options’ identification. In Section 3, the final DST user interface results are presented. This includes a plausibility check as a proof of concept to evaluate the reliability of the results. This is compared with examples from the literature. Finally, guidance is provided on how the DST can be applied to case studies, and how to consider results and their limitations. In Section 4, the findings, applications, and limitations of the DST, as well as future research directions, are discussed in a broader context.
2. Materials and Methods
2.1. Water Reuse Options: Unit Processes and Treatment Trains
To proceed to the intended type of water reuse, a myriad of widespread technology options is available. Usually only experts from the field of wastewater treatment and sanitary engineering can resort upon a wide knowledge and understanding of the whole set of technologies and their combinations. Water reclamation technologies can be classified into primary, secondary, and tertiary treatments, as well as for disinfection. Individual technologies are called unit processes (UP). The 37 selected unit processes in the system are shown in Table 2 (the selection bases on [20,24] and personal communications with water reuse experts).
Often, these unit processes will also be combined commonly referred to as treatment trains (TTs). For each identified case study with a potential for water reuse, plenty of feasible combinations of technologies that can meet the required pollutant removal target at the desired treatment cost might be available. Under the applied concept, a water reuse option has to be composed of a feasible treatment train that fulfills the water quality requirements of the intended uses.
In the implemented DST, the combination of those 37 unit processes can lead to series of maximum 10 unit processes per treatment train. If one considers that every single unit process can be a starting point and that every unit process could be used several times, this statistically leads to about 1016 possibilities. Chen & Beck [25] have noted that if one compiles all possible treatment trains, as many as 50,000 options should be considered as possible trains to identify promising options. Indeed, most of those possibilities are not relevant, and many can be directly eliminated. However, this shows the complexity of the process to establish the ideal treatment train given the local situation.
As the developed DST addresses a broader range of users and aims at promoting water reuse, the approach chosen in the present DST is to propose a list of the most representative treatment trains. This is based on best-practice examples and case studies from the literature, as well as from expert interviews. Local water reuse schemes from Latin America are also included in the DST, due to the geographical focus of the European project COROADO, that partially funded the current research [26]. At the time of writing, the list is composed of almost 70 treatment trains. With this approach, the user does not need to be an expert in wastewater treatment technologies to proceed with an analysis, as the non-exhaustive list already provides an overview of most common possibilities. The system also provides some features for experts, where it is possible to create up to three user-specific treatment trains and assess the calculated results. A review of benchmarks treatment trains led to a list of treatment trains that are examples from global water reuse and reclamation practices presented in detailed tables provided in Supplementary Materials [27]. This includes a list of all treatment trains with the unit processes and the corresponding reference. All treatment trains are categorized in typical basic treatment schemes categories according to van der Graaf, 2005 [28] (Table 3).
2.2. Water Quality Parameters, Water Quality Classes, and Pollutant Removal
2.2.1. Water Quality Parameters
Water quality can be defined by an almost indefinite number of parameters: the topic is immense and the purpose of many books [29,30,31]. The concentration of any substance or constituent potentially present in wastewater could be a parameter to be analyzed, in addition to all physical, chemical, and biological parameters that can be measured. This requires a selection of the most relevant parameters based on the relevance of several parameters, namely, different intended reuse, data availability of removal performance of the different technologies, and the technology’s inclusion in most prominent guidelines for quality standards, recommendations by water reuse experts, as well as the ease to measure and monitor the parameters. After several organized workshops with experts in the field of water reuse [32], 12 key water quality parameters were considered as most appropriate for the identification and initial assessment of the potential of water reuse options, and were integrated in the DST (Table 4). Future versions of the tool might address more specific types of contaminants, such as microplastics, organic contaminants, emerging pollutants, or specific pollutants of industrial wastewater (e.g., dyes and bleach from textile industry, fungicides and pesticides from agricultural food processing)
2.2.2. Water Quality Classes
The user of the DST can specify the values of each parameter for the reclaimable wastewater and the requirements for the intended reuse independently, but if the user is not a specialist or needs support, descriptive water quality classes have been established for the DST. Supplementary Materials [33] include the quality classes with the corresponding parameters (Table 4). Please note that some references do not provide limits of constituents for each of the 12 considered parameters. If no value is specified or if no data could be found, a dummy value of “−1” is set in the tables. Three types of water quality classes are considered (Table 5):
- Typical wastewater quality that is intended for reuse (e.g., effluent from a waste water treatment plant (WWTP))
- Additional guidelines and regulations, such as local legislation from different countries, considered for the water quality required for different types of intended reuse, such as EPA guidelines [36].
2.2.3. Pollutant Removal Efficiencies
Characteristic removal efficiencies (in %) of each unit process (Table 2) for the considered parameters (Table 4) are presented in Supplementary Materials [45]. For each parameter, the minimum removal, average removal, and maximum removal efficiencies (Ri) for the unit processes are provided. The different used percentages are based on literature [20,24] and several meetings that have been conducted with experts in the field of water reuse [32]. Equation (1) can then be used for the calculation of the expected effluent concentrations [20,24]:
where
These input data are used in the DST to calculate the expected water quality after treatment (under minimum, average, and maximal removal efficiencies). Thereby, a unit process is a simplified concept with characteristic average performance values, as many different types of technologies fit in the same unit process, and each technology will all have different performances depending on each supplier and spatial application.
2.3. Cost Estimation
To assess and identify promising options, a typical user initially wants to know if the proposed technology will meet the technical requirements and achieve the required water quality. If the treatment train achieves the water quality, the next piece of information is the costs of treatment and distribution. It is important to include the costs of distribution from the beginning, as these costs are often significantly larger than the treatment costs [46].
For this purpose, a cost component has been developed and results in quantitative figures for the total cost of treatment in local currency per cubic meter of reclaimed water, as well as the distribution costs expressed in the same unit. The user can select or define several local parameters, such as the local currency, electricity costs, land costs, labor costs, and reclaimed water-selling price. On this basis, the DST will estimate overall specific costs automatically.
As costs are sometimes difficult to estimate for such a wide range of technologies considering local specificities and market prices, the uncertainty of the estimation is evidently high (a similar study estimates reasonable accuracy between −30% and +50% of actual costs [47]). Nevertheless, the range of calculated values with the DST already provides first figure approximations, allowing for making comparisons between different options at the pre-feasibility stage.
2.3.1. Elaboration of Cost Curves
In Supplementary Materials [45], the database of the regression coefficients, C and B, for every unit process (Table 2) and every cost component (Table 6) as a function of the average treated flow rate is presented. The cost components are calculated with Equation (2):
where
- Q: average flow [m3/day]
- y: any cost component calculated
- C, B: regression coefficients
The coefficients for the cost component are based on the program WTRNet, developed within the Aquarec Project [24]. The project Aquarec has been funded by the European Commission and many of the project results are publicly available, such as the manual for water reuse [30]. In total, 336 simulations have been conducted (8 different flows ranging from 10 to 20,000 m3/day and 42 unit processes with standard pollutant classes). Data have been collected from the different simulations, classified, and converted to USD from 2006. Power regressions have been applied, as this is justified from an economic perspective (economy of scale). Finally, the overall database has been reviewed and inconsistencies have been removed. Some data have been complemented by additional references, for example, for electro-dialysis, data from ion exchange have been used and electricity requirements of 2.9 kWh/m3 (seawater desalination) have been applied [48]. It has to be noted that the DST calculations take into account the recovery percentage of each unit process.
2.3.2. Community Profiles for Cost Analysis
The developed cost component allows adapting the results to the local conditions by adapting several parameters in so-called “community profiles”. Those parameters are used in the cost calculation to obtain locally specific results. By assembling results obtained with Equation (2) and parameters from Table 7, every cost component for any location can be calculated. For each community, or study site, the following criteria can be specified.
2.4. Calculation of Annualized Treatment Costs
For comparable and easily understandable results, we calculated every cost in the local currency per m3 (CUR/m3) of reclaimed water based on the annual lifecycle costs. For this, we calculated every cost component independently as annual costs, and then summed them to determine the total lifecycle costs for the whole treatment train (TT). The different cost components are calculated for each unit process independently. Then, dividing the “total lifecycle costs for the whole treatment” by the annual volume of reclaimed water, we obtained the annualized treatment costs in (CUR/m3) of reclaimed water (Equation (3)):
where
- = annualized unit cost of treatment per m3 of reclaimed water (CUR/y/m3)
- N = number of unit processes i in the treatment train (TT) considered (-)
- = annualized capital cost of unit process i (CUR/y)
- = annualized operation and maintenance cost of unit process i (CUR/y)
- = annualized land cost of unit process i (CUR/y)
- = yearly energy cost of unit process i (CUR/y)
- = yearly labor cost of unit process i (CUR/y)
- VAnn = volume of reclaimed water produced annually (m3/y)
To calculate the total capital expenditure (CAPEX) for every unit process, the standard capital cost algorithm presented in Table 8 was used.
The resulting total capital costs were annualized based on the expected life span of every considered unit process. The total capital cost multiplied by CRF results in annualized capital costs. For the annual values, the capital recovery factor (CRF) from Equation (4) was used. The same cost recovery factor was applied to annualize the land costs.
where
- CRF = capital recovery factor (y−1)
- r = discount rate (-) i – p (Fischer equation); i = nominal interest rate (-), p = actual inflation rate (-)
- n = expected life span of the unit process (y)
2.5. Distribution Component
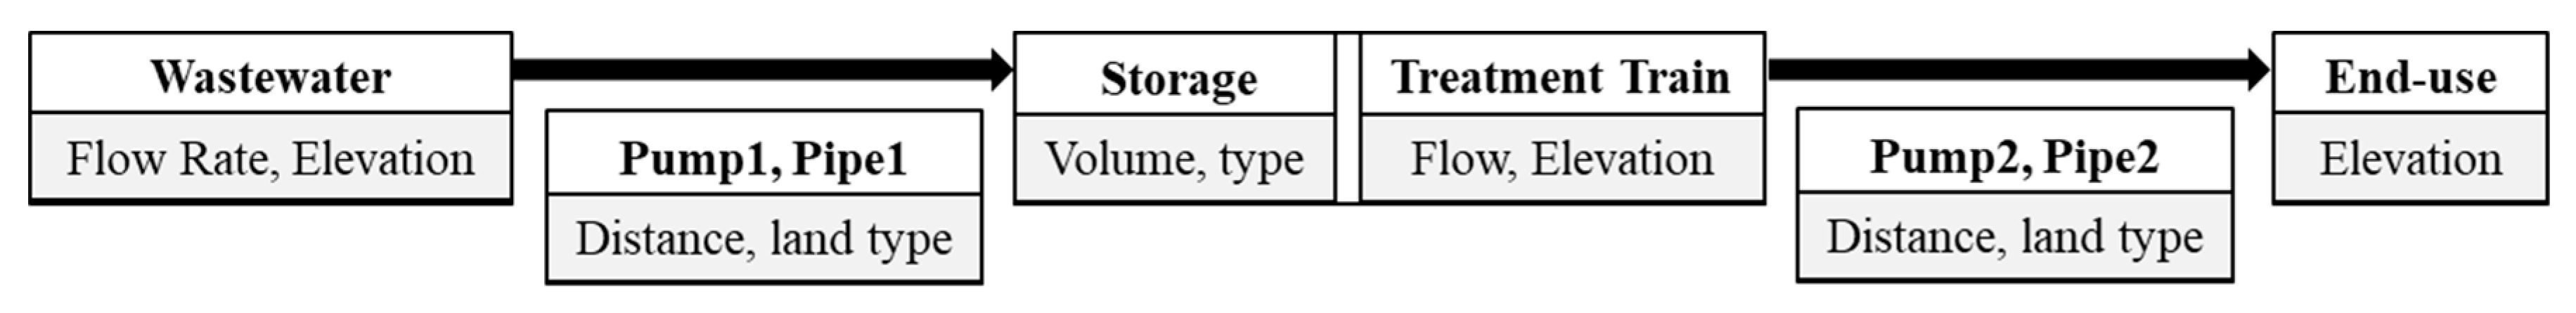
For comparable and easily understandable results, the distribution costs were also calculated in costs per m3 of reclaimed water based on the annual lifecycle costs. The calculation of the total annual distribution of lifecycle costs allows the consideration of one transport pipe from the wastewater source to the treatment scheme, a storage tank, and another transport pipe to the end-use location (Figure 3). The detailed calculation procedure for the different distribution cost components are depicted in Appendix A and requires the different elevations, the flow rate, and the volume for the storage tank. Equation (5) is applied for the calculation of the annualized distribution costs per m3 of reclaimed water.
where
- = annualized unit cost of distribution per m3 of reclaimed water (CUR/y/m3)
- , = annualized pumping costs (CUR/y)
- , = annualized piping costs (CUR/y)
- = annualized storage costs (CUR/y)
- VAnn = volume of reclaimed water distributed annually (m3/y)
2.6. Assessment Criteria
Valid options of treatment trains cannot alone be identified only based on meeting quality requirements of available reuse applications. To propose options adapted to local environmental, economic, and social conditions, different trains should be compared based on a broader scope of criteria. This is important since the pre-feasibility stage normally involves a consultation process between stakeholders.
The database of the technical assessment, requirements, impacts, and cost assessment criteria listed in Table 9, for all the unit processes included in the DST (Table 2), is provided in Supplementary Materials [45]. The qualitative criteria are fixed per unit process based on work by [1], and reviewed in expert workshops. Whereas the semi-quantitative criteria are based on quantitative estimations described in Section 2.3 and therefore depend on the local conditions specified by the user (e.g., volume of water treated, cost of electricity, etc.). Those quantitative values are then normalized to a value between 0 and 3 (to remain consistent with a range of other criteria) within the considered set of treatment trains. Consequently, they result in being semi-quantitative.
Important factors include the following aspects, namely, reliability of the process, ease of upgrading if the wastewater stream increases (e.g., due to population growth), adaptability to varying wastewater flows and qualities (e.g., seasonal differences), ease of construction, operation, management, and demonstration. Significant operational requirements and environmental impacts are evaluated for each unit process. This includes energy demand (which is often the most important operational cost), chemical demand (e.g., chloride, coagulants), land requirement (area needed to install a certain unit process), impact on groundwater, odor generation, and quantity of sludge production (depending on available area and transport infrastructure, generated sludge can lead to significant cost for transport and disposal). The third category considers the costs through annual lifecycle capital costs, land costs, energy costs, labor costs, other operational and maintenance costs (e.g., sludge disposal, chemicals required for operation), and total annualized lifecycle costs (Table 6).
Treatment Train Overall Assessment Score
The calculation of an overall assessment score for different treatment trains was determined by Equation (6). The user can assign different weights Wi to different assessment criteria depending on the local situation. For the calculation of the overall assessment score, all criteria were recalculated to a range between 0 and 1 and the semi-quantitative indicators were normalized. The criteria defined in Table 9 between 0 and 3 were divided by 3, and the semi-quantitative criteria divided by the highest value of the list of treatment trains considered in the DST. For the requirement, impact, and cost (RIC) criteria, for which a higher score was a negative characteristic, the formula 1 − RIC/3 was applied to obtain a final overall assessment score (high score is positive).
where
- = treatment train overall assessment score (-) (range 0–3)
- = weight of criteria i (-) (range 0–4, user-defined)
- N = number of assessment criteria (-)
- = Technical assessment qualitative criteria i score (-) (range 0–3)
- = requirement, impact, and cost qualitative criteria i score (-) (range 0–3)
- = requirement, impact, and cost semi-quantitative criteria i score (-) (range 0–3)
- = maximal value of requirement, impact, and cost semi-quantitative criteria i within the j amount of treatment trains included in the DST (-) (range 0–3)
2.7. Screening of Water Reuse Options: Ranking, Filtering, and Comparison
The chosen approach for the sequential decision optimization is a screening approach. In this approach, information provided by the user on water quality and local parameters did rule out options that did not meet the minimal requirement. The minimal requirements were determined before running an assessment and ranking algorithm for the water reuse remaining options. In short, the DST includes a set of unit processes and treatment trains, and the user can specify certain parameters. The DST does calculate the performance of every unit process and treatment train included in the database for the provided parameters, and does then apply an assessment algorithm to present a ranking of options. These options comply with the minimal requirements and result in the highest overall score.
To analyze each scenario based on the input data provided (available wastewater to be reused, intended reuse, and several locally specific characteristics required for the calculation), the system will calculate the following parameters:
- Pollutant removal performance of every treatment train included in the system
- Specific lifecycle treatment costs
- Overall score of multi-criteria analysis based on normalization and local weighting ()
On this basis, the DST proposes an assessment algorithm that provides a ranking of options while meeting the minimal requirements (Figure 4). The algorithm proposes three different assessment methodologies that derive a ranking from the list. The first method (1) eliminates all treatment trains that do not comply with the quality requirements (based on the maximal removal performance of each unit process). Then, a ranking is made based on the weights for each single indicator, which was defined by the user. The second method (2) first eliminates all treatment trains that do not comply with the required quality, and then ranks only the three options with the lowest lifecycle treatment costs. The user can then evaluate the three options by analyzing the calculated set of assessment criteria. The third method (3) is primarily intended for experts, and enables a targeted selection of the best options. These best options base on a manual or subjective assessment of all presented assessment criteria.
3. Results
3.1. Main Novelties and Approaches in the Resulting DST
From the list of existing DSTs presented in the introduction, WTRNet [16], WAWTTAR, [13] and WASWARPLAMO [20] are the three main tools that inspired this research. Several data and approaches have been adapted from those tools, and they are transparently cited. The main advances of the DST presented in this paper, compared to those existing tools, include:
- Different scope of application. This means the main target of the DST is capacity-building and promoting the concept of water reuse at the pre-feasibility stage, whereas the other tools focus more on technical design. These tools support the creation of treatment trains for engineers and planners.
- Universal approach and user interface. The DST is generic, usable, and considers a system analysis approach for a broad target group. With the current DST, an analysis can be made by specifying three inputs, i.e., quantity and quality of reusable wastewater, and intended reuse.
- Pre-selected information is included in the tool, and the calculations are performed in the background. Benchmark treatment trains, unit process descriptions and specifications, water quality classes, lifecycle cost calculation algorithm, and several data—presented in Supplementary Materials—are included in the tool.
- A multi-criteria assessment is included to compare different options based on different weighting factors that can be defined by the end-user (Table 9).
- The DST and all underlying data are open-access and used by everyone, as the DST is based on Microsoft Excel. Several other tools are not publicly available or use outdated software. The database references are transparently cited, up-to-date, and complete. With the open-access publishing of the outcome, we allow future research to improve and complement both the data and the DST.
3.2. Resulting DST and Guidance for Use
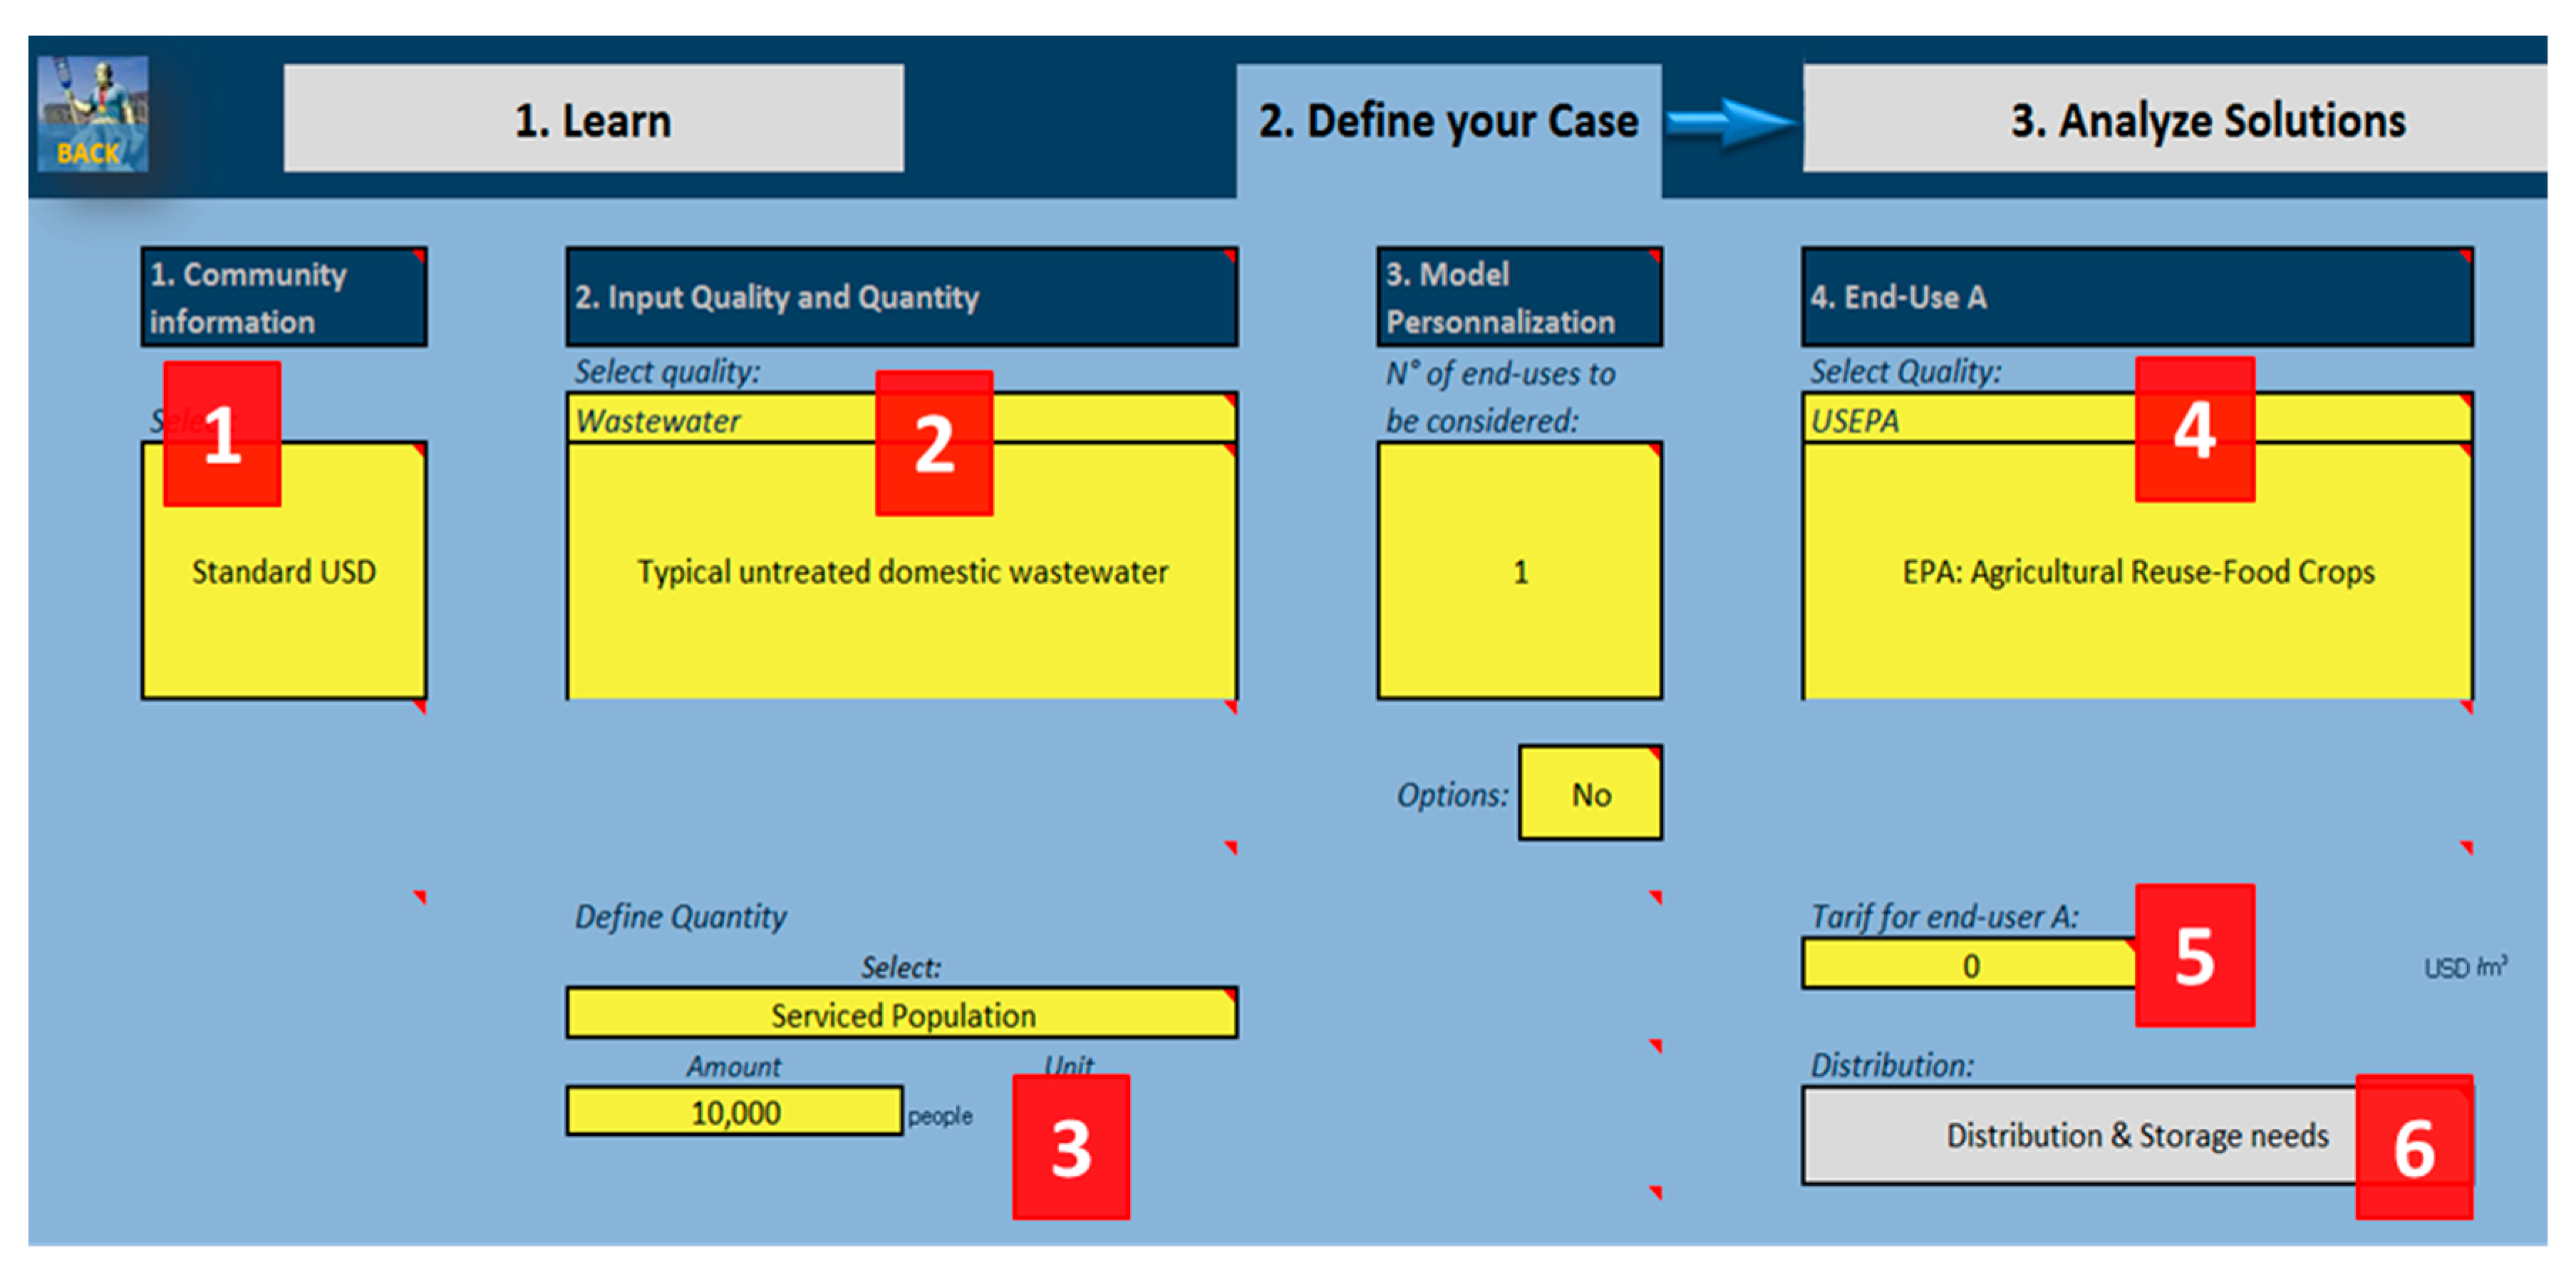
The first version of the resulting DST is open access, and can be found on the Zenodo repository together with a handbook with guidance for use [51]. This handbook provides detailed instructions that are too extensive to be included in this paper. Key features from the DST are presented in Figure 5 and Figure 6. First, the user needs to become familiar with the informative sections describing the unit processes, treatment trains, and water quality classes included in the DST. Secondly, the user needs to enter data for a first assessment, on the starting tab (Figure 5).
- Community information: the user can either select a pre-defined profile or specify a national currency. The exchange rate is USD-2006. There is other information related to labor, electricity, land costs, nominal interest, and inflation rates.
- Input quality: the water or wastewater quality for treating can be specified here, either by selecting from a list of pre-defined types of wastewater or by specifying up to 12 quality parameters manually.
- Input quantity: the quantity of water or wastewater for reuse can be specified.
- End-use quality: The water quality required for the intended end-use after treatment can be specified by choosing from a list of pre-defined quality classes or by indicating the water quality parameters manually.
- Price of reclaimed water: input of the selling price to the intended end-user.
- Distribution and storage needs: the user can indicate the required pipes length, the elevation differences, and the land type to calculate the piping and pumping costs for both the input wastewater and output reclaimed water. The need for storage facility can also be specified and corresponding costs are calculated.
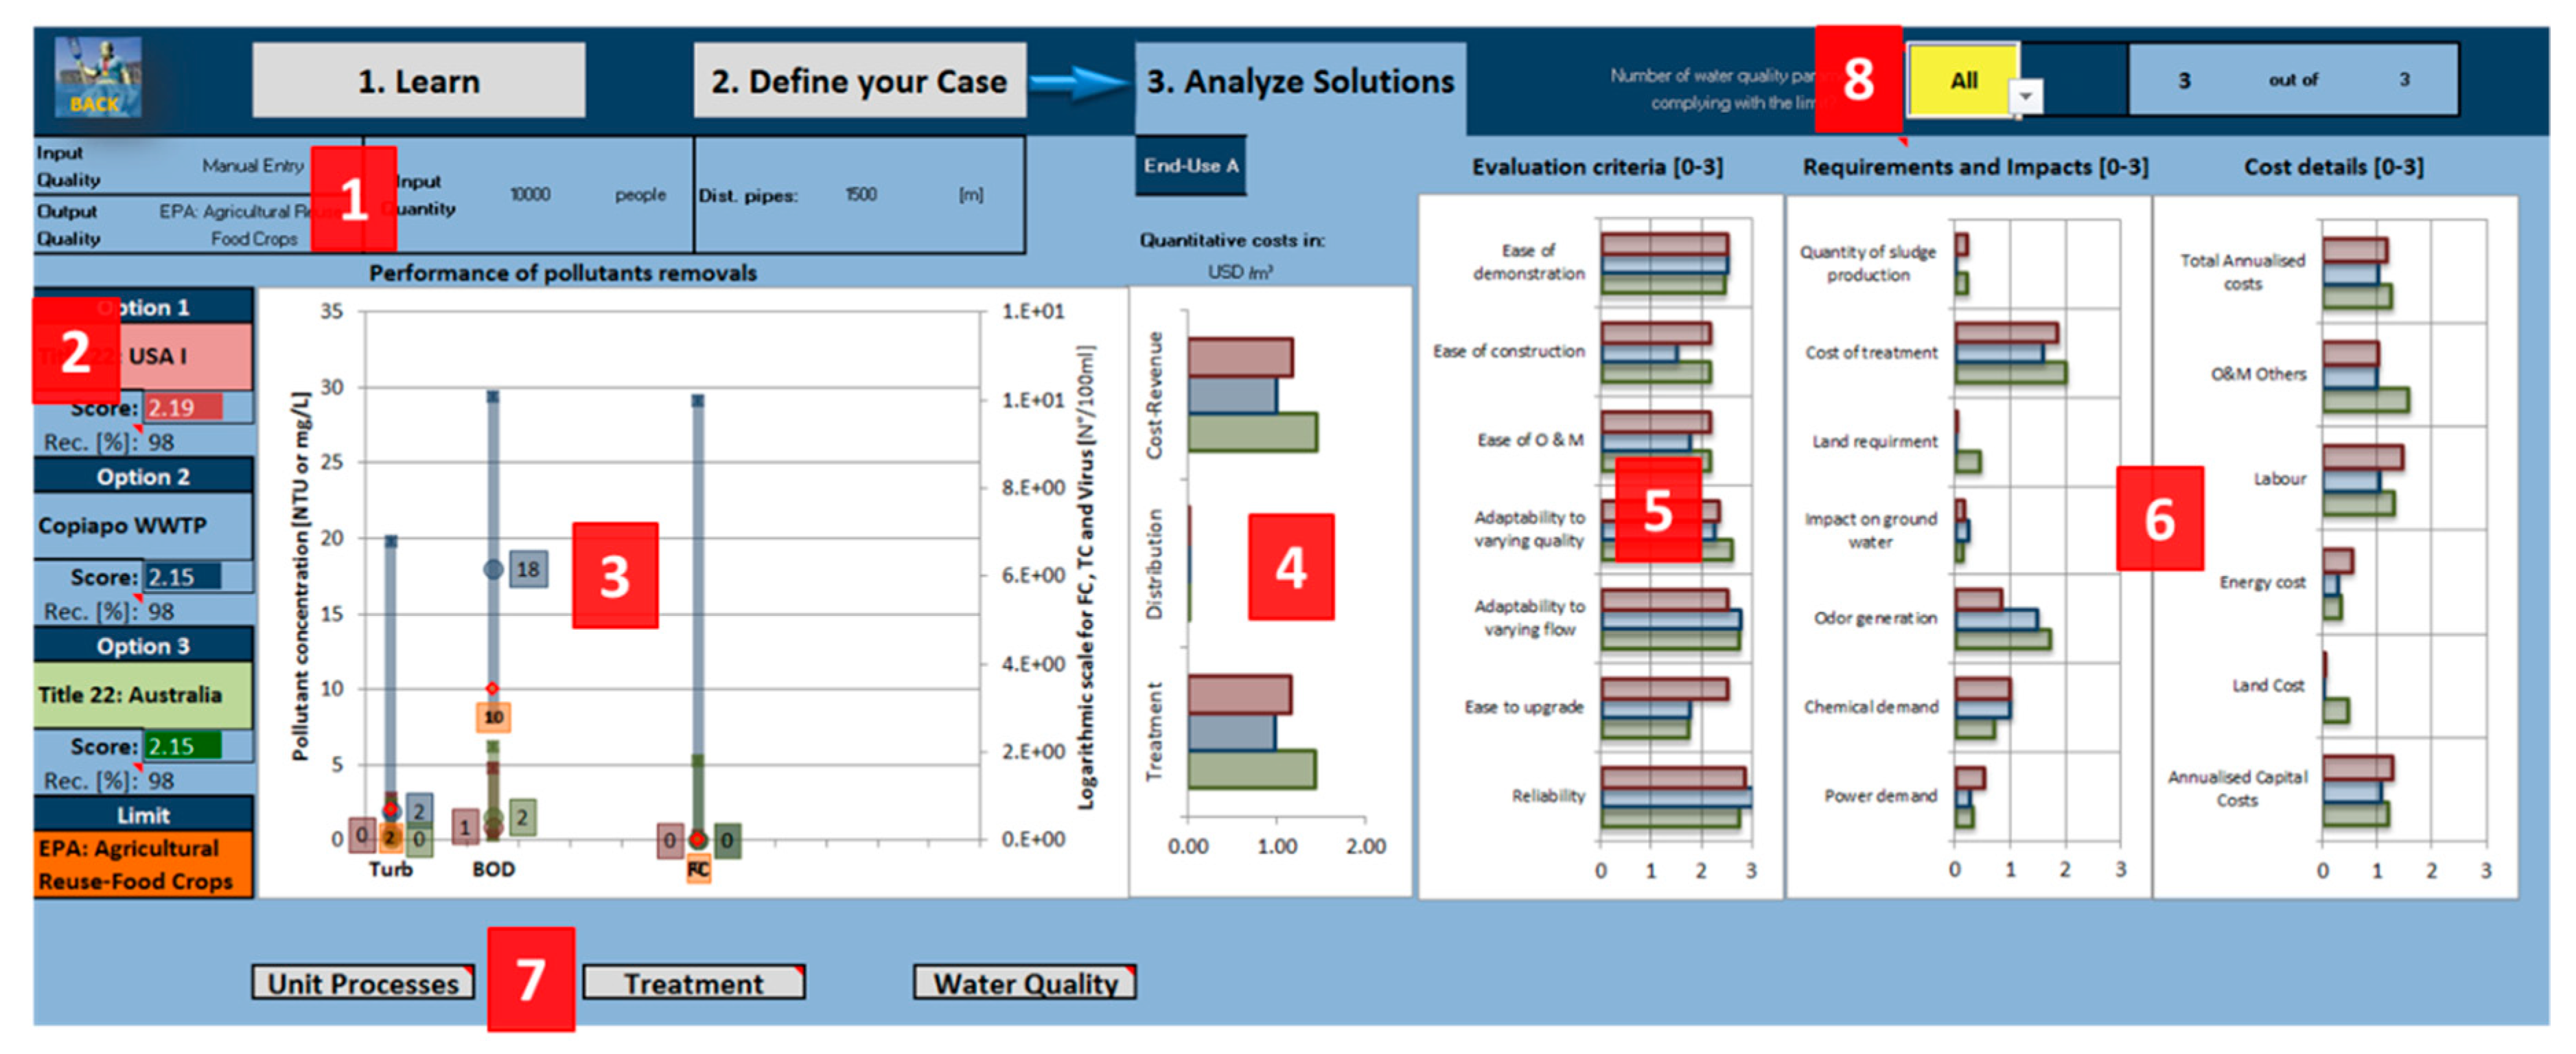
Furthermore, it is possible for the user to manually define three specific treatment trains that are composed of up to 10 unit processes. Additionally, it is possible to add additional unit processes. Based on those input data, the Excel tool calculates the performance, cost, and other assessment criteria for all the treatment trains included in the system (Figure 4). On this basis, it proposes a ranking for valid options. A screenshot of the results is presented in Figure 6. The detailed results are also available in a tabular representation in the DST. In the screenshot of graphical results, a range of information is displayed and can be numbered into the following 8 features (highlighted in red):
- Recapitulation of the data input (input quality and quantity, output quality, and distribution)
- The three best options are displayed in the colors (red, blue, and green). For each option, the name of the treatment train is displayed with the overall treatment train score. This score bases on the assigned weights and the recovery percentage. The chosen limit for the output quality required is indicated in orange.
- The chart displays the pollutant removal performances under minimum, average, and maximal performance. The limit is shown in orange. The user can see how well the three options perform. There are two scales, namely, on the right for most quality parameters in NTU (turbidity) or mg/L, and on the left for logarithmic for fecal coliform, total coliform, and virus (in n°/100 mL).
- The specific costs are presented in the selected currency per cubic meter. Cost − revenue is the cost of treatment and distribution minus the foreseen selling price to the end-user. If this value is negative, the selected option would produce monetary profits. The specific costs are calculated with the lifecycle cost methodology (OPEX, CAPEX, cost of capital through interest rate, electricity costs, labor costs useful life, etc.).
- The assessment of the criteria results is displayed. The values are between 0 and 3: 0 = nil, 1 = low, 2 = medium, and 3 = high. For the criteria, a high value is considered as positive for the calculation of the overall treatment train score. This score bases on the weights, which are displayed under the option name (point 2).
- The results for requirements, impacts, and costs are displayed. The values are between 0 and 3: 0 = nil, 1 = low, 2 = medium, and 3 = high. For those criteria, a high value is considered as negative for the calculation of the overall treatment train score. This score is based on the weights, which are displayed under the option name (point 2).
- The three buttons are links to the “Learn” component. Depending on the option selected, the user can look in the database to understand the details of each treatment train, unit process, and water quality class.
- If no treatment train complies with the required water quality, the user can choose how many water quality parameters should comply with the requirements (e.g., 2 out of 3).
3.3. Plausibility Checks and Proof of Concept
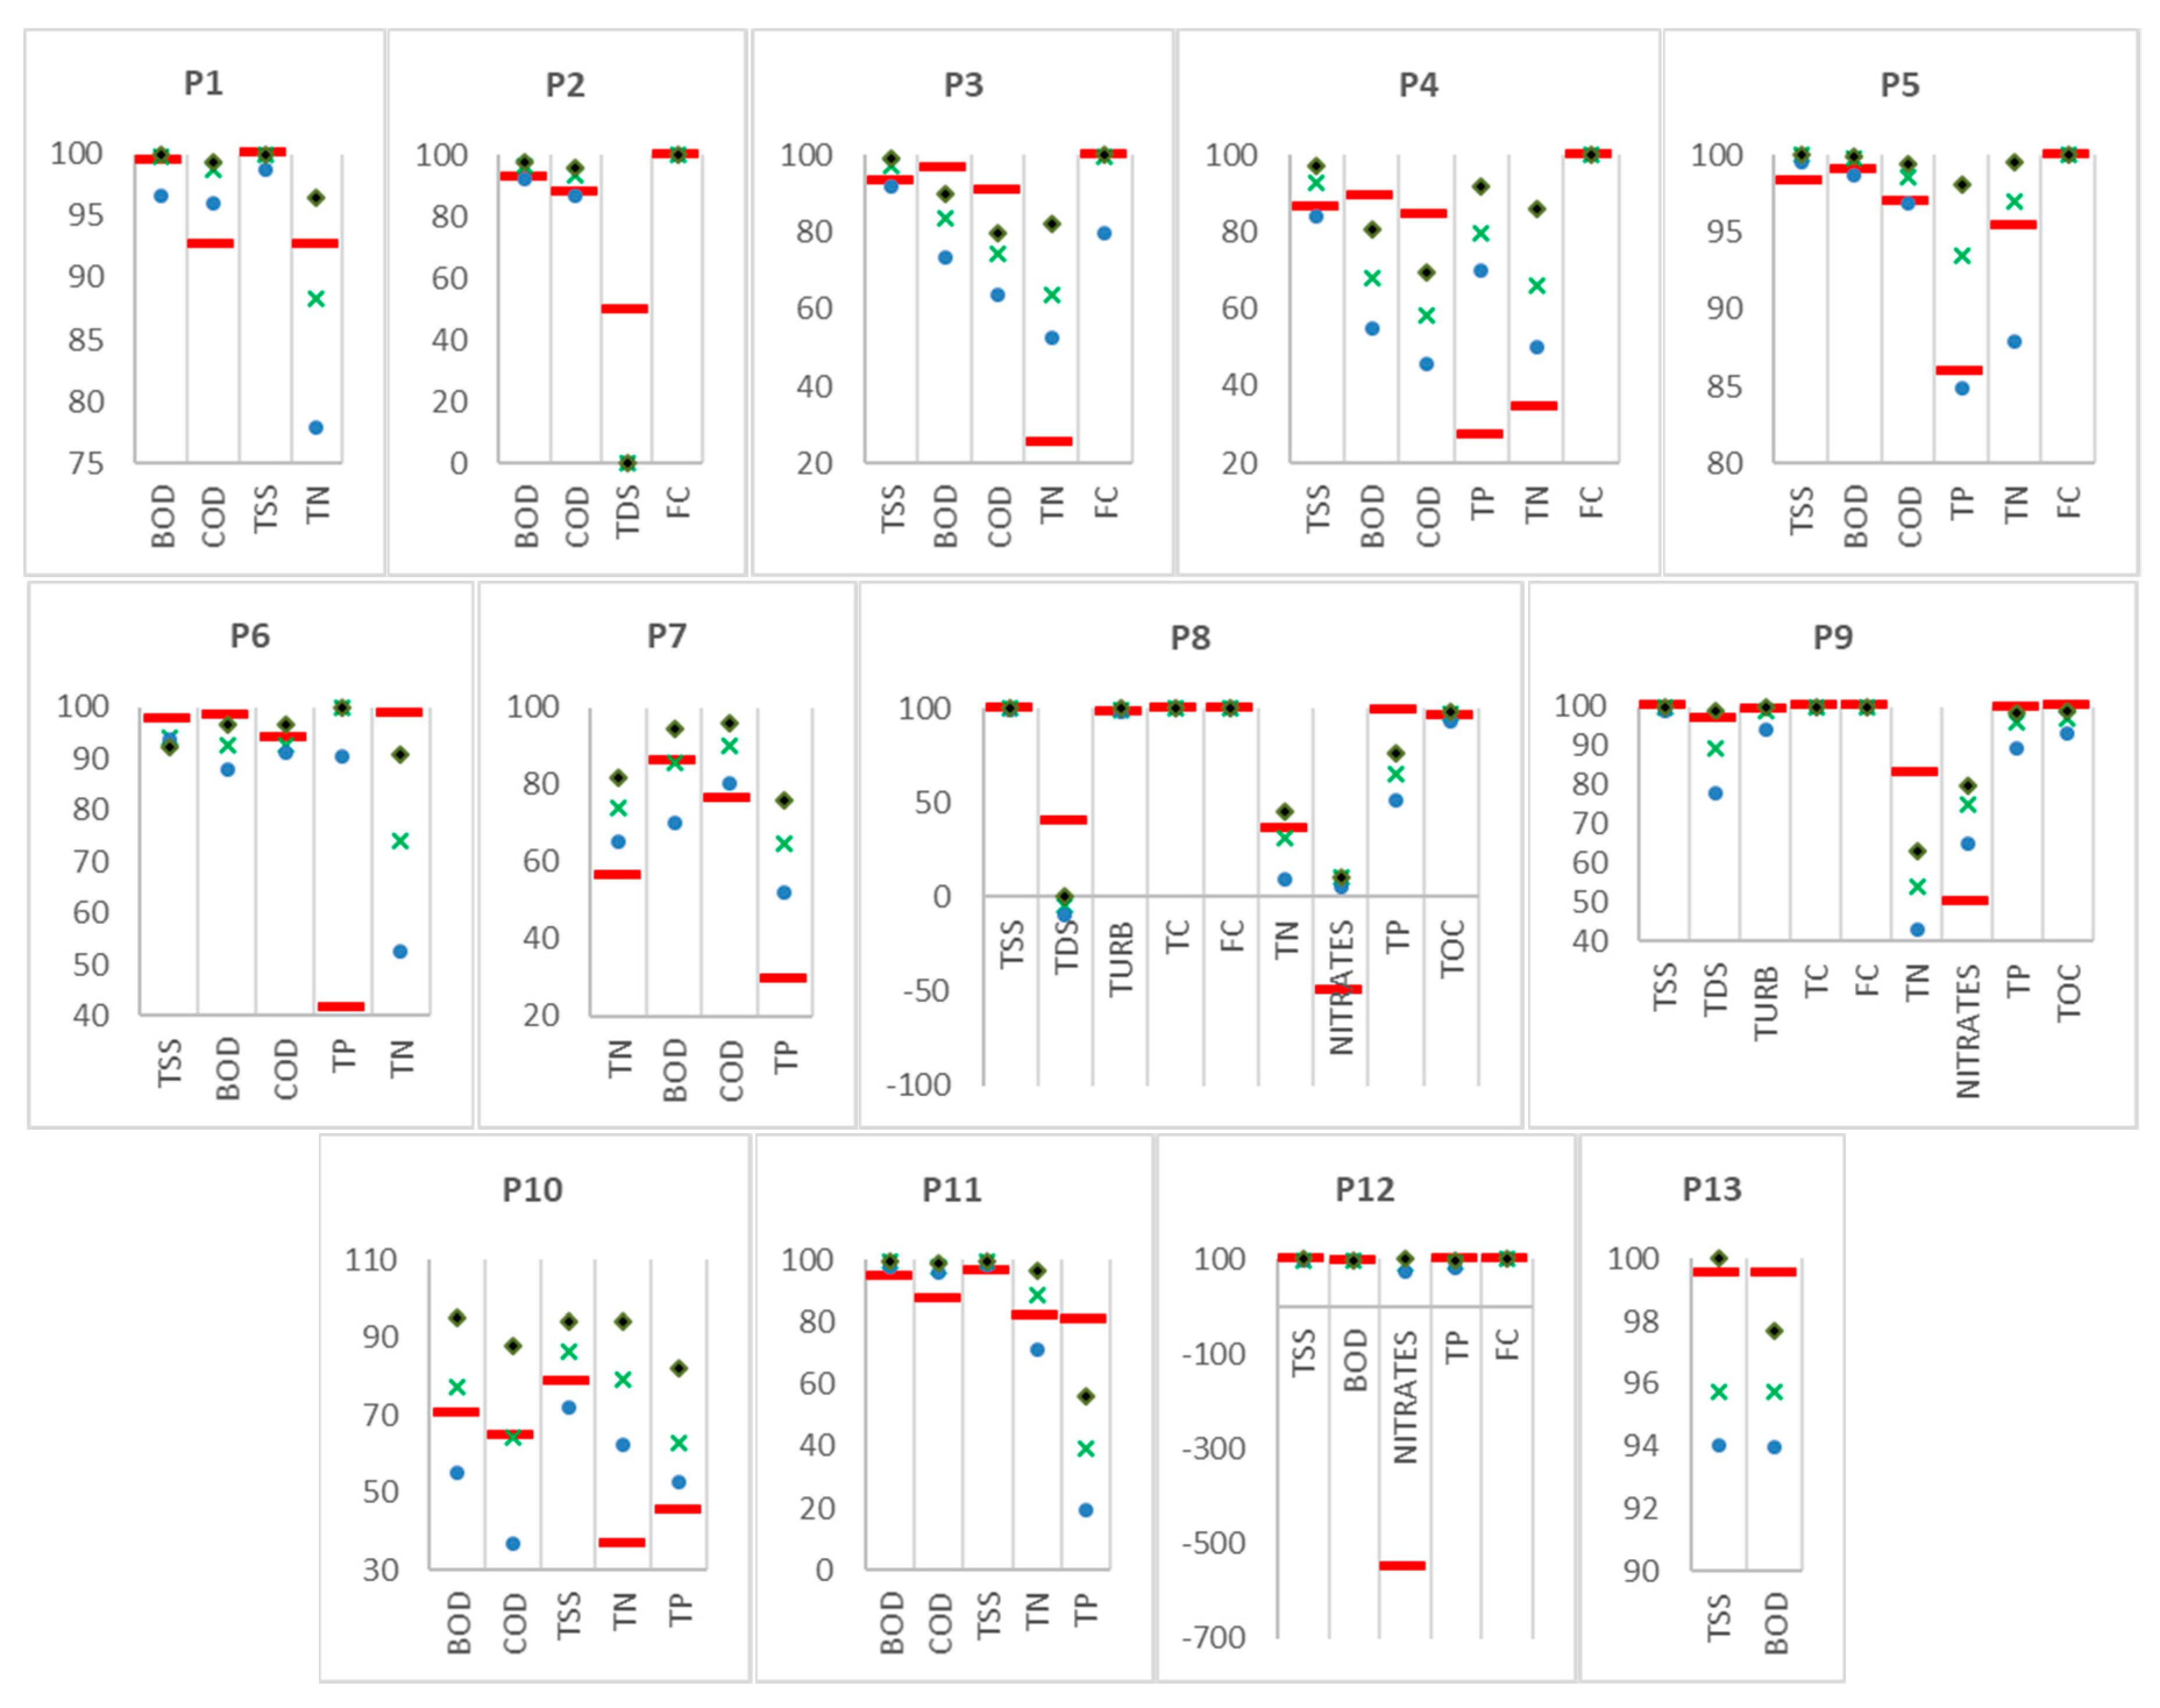
To assess the plausibility of the calculated results with the DST, in the first stage, 13 treatment trains were simulated based on literature information (Table 10) [29,35]. In the second stage, the resulting removal performance of pollutants included in the reference were compared under the same indicated wastewater quality (Figure 7).
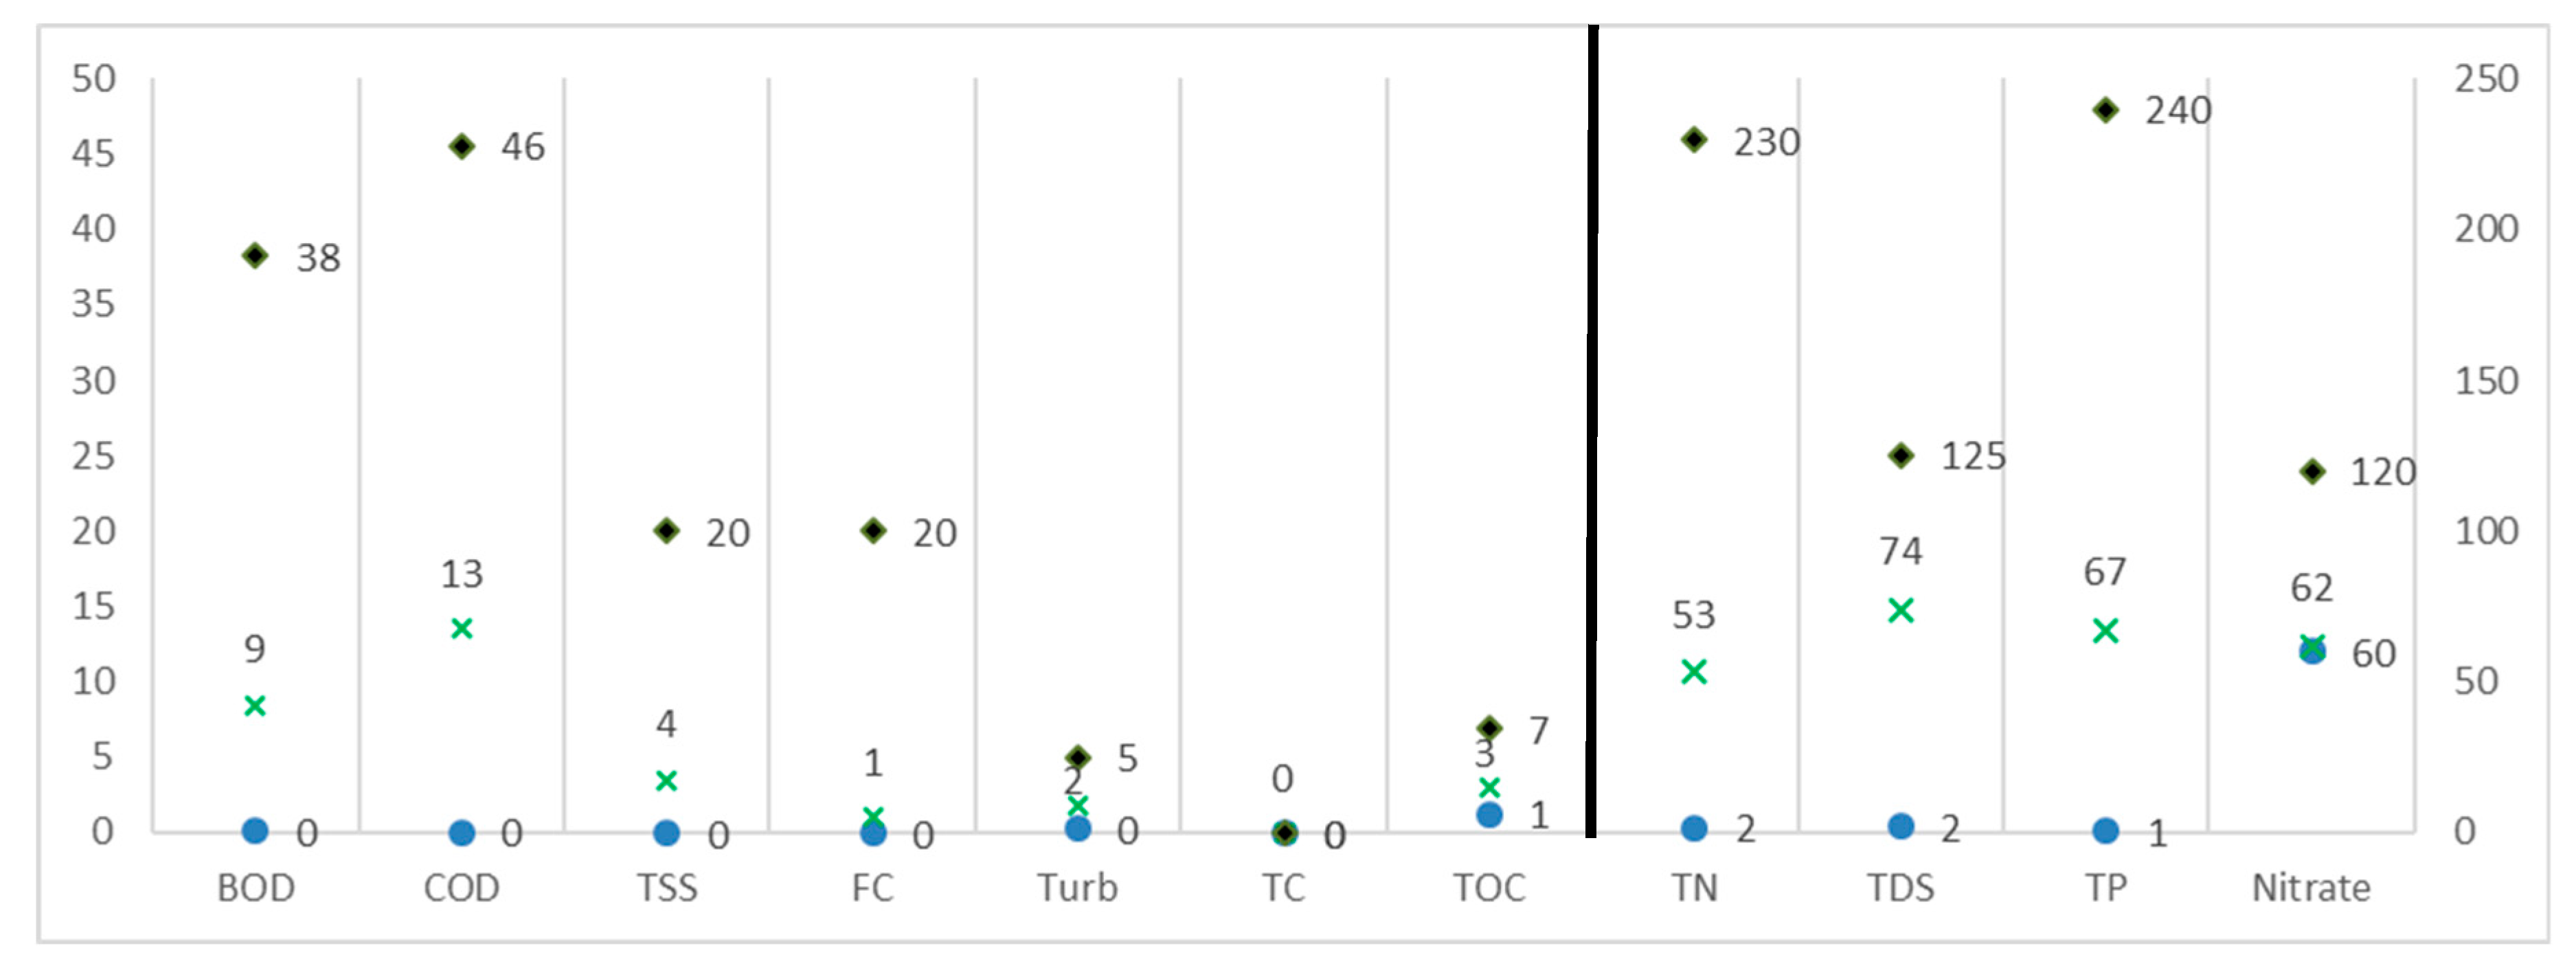
In Figure 7, the simulated pollutant removal efficiencies are compared to the literature values for all included parameters. More than 70% of all considered parameters of removal efficiency have less than 20% difference between the literature value and the simulated results. Nevertheless, the relative error is smaller for seven parameters (BOD, COD, TSS, FC, Turbidity, TC, and TOC), whereas four parameters show a higher relative error (TN, TDS, TP, and Nitrates) (Figure 8). If only the removal efficiency of the first seven parameters are considered, around 90% of all parameters have less than 20% difference between the literature value and the simulated results.
The higher relative error for TDS and Nitrates is because of that in some unit processes, the total dissolved solids (and the conductivity) increases. This applies for the nitrates as well, since their concentration increase after the nitrification processes. These concentrations increase would require a more sophisticated model that is beyond the scope of the present DST. The discrepancy of the TN and the TP results is due to simplifying the modeled process compared to the reference processes, and probably some inaccuracies on the removal performances database for those two parameters.
As a result, those estimated removal performances provide a first estimate for the pre-feasibility stage intended by the DST developed. While applying the DST to a case study, the user should consider the results of the presented plausibility checks and consider the results on TN, TP, TDS, and Nitrate as indicative only. A note is included in the DST and it is advised not to use those four parameters as elimination criteria.
4. Discussion
The developed DST enables a quick screening of options. It can perform a pre-feasibility study and supports the promotion of water reuse in regions, where it is still an emerging concept. The DST enables identifying and comparing possible treatment trains that met the local requirements. If a case study shows a potential for water reuse, the reuse implementation can be fostered. The DST covers a broad range of scenarios for water reuse and diverse stakeholders can understand the results. However, an actual implementation of a water reuse scheme implies additional local specificities and technical information details, which are not covered in the DST. These results enable an identification of potential options that should be considered in a more detailed study.
The key application of the DST is capacity building. This is already implemented in the master curriculum of the University of Applied Sciences and Arts Northwestern Switzerland (FHNW), the Agricultural University of Athens (AUA), and elsewhere internationally (e.g., Morocco, Netherlands). The students can use the DST to investigate different unit process characteristics, their interactions in treatment trains, and gain a systemic understanding of the complex topic of water reclamation. The tool can be used as a “sandbox” for several exercises and scenario comparisons.
Additionally, the DST has been integrated into the COROADO online decision support system. There the technology selection is applied to the Latin American context, and linked with other analyses regarding water vulnerability [52]. This integrated online system will be subject to other publications.
The created underlying datasets are additional central outputs of this research besides the DST itself. The data aggregation, published in open access, allows the estimation of the removal performances, the lifecycle capital, operational costs, and additional assessment indications for most unit processes. This was implemented for wastewater treatment and water reclamation in a simple manner. The cost component is an important piece of information for the viability, comparison, and selection of the different treatment trains, since the cost is often the key aspects. By using costs per cubic meter makes, it them easily comparable and understandable of the influence of different factors. Additionally, the required further costs can be calculated, e.g., the total CAPEX. The equipment costs and, therefore, the total capital cost for every unit process can be calculated independently for every possible flow between 10 and 20,000 m3/day. Similarly, by combining different water quality guidelines together, and by proposing a holistic approach to water reuse, possibilities for future interdisciplinary research can emerge. This could include the use of another support (e.g., online-based tool), the inclusion of additional technologies, the combination with complementary solutions (e.g., irrigation technologies) or the internationalization of concepts.
This DST will be further developed in other projects. It is foreseen to broaden the DST’s application field by adding more technologies and updating the underlying database. It is also important to develop additional training material to allow tool application at a large scale. In this sense, the DST presented in this paper is being upgraded in the European project “MadforWater”. Thereby, integrated technological and managerial solutions for wastewater treatment and efficient reuse in agriculture tailored to the needs of Mediterranean African Countries are being developed [53].
Supplementary Materials
The following are available online on the Zenodo open access repository:
- Poseidon—Decision Support Tool for Water Reuse (Microsoft Excel) and Handbook, doi:10.5281/zenodo.1971933 [51]
- Wastewater Treatment Unit Processes Datasets: Pollutant removal efficiencies, evaluation criteria and cost estimations, doi:10.5281/zenodo.1247434 [45]
- Treatment Trains for Water Reclamation (Dataset), doi: 10.5281/zenodo.1972627 [27]
- Water Quality Classes - Recommended Water Quality Based on Guideline and Typical Wastewater Qualities, doi:10.5281/zenodo.1252341 [33]
Author Contributions
E.O. conceived, designed and conducted the presented research. He developed the presented DST and wrote the paper; C.H., T.W. and C.A.K. provided substantial expertise, input and guidance during the research and reviewed the paper.
Funding
The research leading to these results has received funding from the European Union (EU) Seventh Framework Programme (FP7/2007–2013) under grant agreement No. 283025: Project COROADO “Technologies for WR&R in Latin American Context: Assessment, decision tools and implementable strategies under an uncertain future”. This project has also received funding from the EU Horizon 2020 research and innovation program under grant agreement No. 688320 (MADFORWATER project; www.madforwater.eu). The results presented in this paper reflect only the authors’ views and the EU is not liable for any use that may be made of the information contained therein.
Acknowledgments
Data included in Poseidon is strongly based on Waternet (Dario Joksimovic, Aquarec project, 2007) and Waswarplamo [20], whose authors are acknowledged for their work. The data has been fine-tuned and adapted using several additional references and data from the four study sites of the COROADO project, the whole project team is duly acknowledged. Furthermore, several workshops with experts in water treatment technologies have been organized in order to optimize and update the data included in Poseidon and the participants are strongly acknowledged for their input: Lena Breitenmoser, Christian Kazner, Jan Svotjka, Thomas Gross, José Carlos Mierzwa, Simone Verzandvoort and Sandra Müller.
Conflicts of Interest
The authors declare no conflict of interest. The founding sponsors had no role in the design of the study; in the collection, analyses, or interpretation of data; in the writing of the manuscript, and in the decision to publish the results.
Appendix A. Distribution Costs Calculation
This appendix describes the calculation procedure applied to calculate annualized distribution costs.
Appendix A1. Pumps
The calculation for the distribution component has been taken from [24] that is based on [54,55]. The following two main equations are used for the pumping costs calculation:
Pumping capital costs:
where:
CAPEX = (21,715 × H × Q0.52)
CAPEX = pumping station capital cost [CUR]
H = required pumping head [m]
Q = design flow rate [L/s]
Note: Additionally, 5% of the capital cost is used for annual maintenance. For the annualisation of the capital costs, a life span of 15 years is used and the same procedure with the Capital Recovery Factor is applied.
Pumping costs required:
where:
CE = Annual cost of energy required for pumping [CUR/a]
θhp = conversion factor to kWh (θhp = 0.746)
Ce = unit cost of energy [CUR/kWh]
Vann = volume of water pumped annually [m3/a]
H = pressure head required at the pump [m]
η = pump efficiency [%], (default value of 0.65)
Appendix A2. Storage Facilities
Four different types of storage are considered: reservoir, concrete tank, covered concrete tank and earthen basin. The following equation is applied for the costs calculation:
where:
UCS = Unit cost of storage facility [CUR]
Ci = Cost coefficients from Table A1
V = Storage volume [m3]
Note: Additionally, 0.5% of the capital cost is used for annual maintenance. For the annualisation of the capital costs, a useful life of 30 years is used and the same procedure with the Capital Recovery Factor is applied.

Table A1.
Storage facilities cost coefficients.
| Storage Type | C1 | C2 |
|---|---|---|
| Reservoir | 15,093 | −0.60 |
| Concrete tank | 1238 | −0.19 |
| Covered concrete tank | 5575 | −0.39 |
| Earthen basin | 128 | −0.24 |
Appendix A3. Pipe
The cost curves for the pipe cost also come from [24] that derived the equations from data on the costs of installed pipes provided by UK water companies, reported in [56]. The model proposes pipe costs coefficient for three different types of land use: grassland, rural/suburban and urban. The following equation is applied:
where:
CP = Pipe unit cost [CUR/m]
Ci = Cost coefficients from Table A2
D = Pipe diameter [m]
Note: Additionally, 3% of the capital cost is used for annual maintenance. For the annualisation of the capital costs, a useful life of 50 years is used and the same procedure with the Capital Recovery Factor is applied.
Table A2.
Pipe unit cost coefficients.
| Land Use | C1 | C2 |
|---|---|---|
| Grassland | 47.47 | 3.51 |
| Rural/suburban | 96.19 | 3.07 |
| Urban | 129.42 | 2.72 |
Appendix A4. Required Parameters
Based on the cost curves equations described in previous chapters, the following parameters (Table A3) are required to calculate all incurring distribution costs:
Table A3.
Input parameters required for the calculation of the distribution costs.
| Parameter | Unit | Note |
|---|---|---|
| Length of pipe | m | Defined by the user |
| Pipe Diameter (D) | mm | Calculated by the simple design model presented in Section A7. |
| Total elevation difference (+uphill, −downhill) | m | Defined by the user. Please note that a negative elevation will not bring revenue to the model but will only annihilate the head due to friction and result in costs of zero for pumping. If the user plans to recover the energy, it has to be calculated independently by introduction of a turbine. |
| Volume of pumped water (Vann) | m3/a | Calculated by the system based on the flow (if the distribution is before the treatment, the inflow is used; if it is after the treatment, the flow calculated with the treatment train recovery is used) |
| Pressure head required at the pump (H) | m | Calculated with the Hazen-Williams equation as described in Section A6. |
| Design flow rate (Q) | L/s | Calculated by the system based on the flow (if the distribution is before the treatment, the inflow is used; if it is after the treatment, the flow calculated with the treatment train recovery is used) |
| Storage volume (V) | m3 | Defined by the user |
The biggest challenge in estimating costs for distribution is to estimate the appropriate design, namely the diameter of the pipes that will influence the velocity, pumping costs and piping costs. Once the design is fixed, the head loss can be calculated and added to the elevation to calculate the pressure head required for pumping.
Appendix A5. Calculation of the Frictional Head Loss
To calculate the pressure head required for pumping, the Hazen-Williams equation is used. Note that the Hazen-Williams formula is empirical and lacks a theoretical basis. Be aware that the roughness coefficient are based on "normal" condition with approximately 1 m/s.
where:
hf = head loss over the length of pipe [m]
L = length of pipe [m]
Q = volumetric flow rate [m3/s]
C = pipe roughness coefficient (default value of 140)
d = inside pipe diameter [m]
Note: in the DST the equation with imperial units is used and converted.
Appendix A6. Calculation of the Pressure Head Required for Pumping
H = pressure head required at the pump [m]
hf = head loss over the length of pipe [m]
Elevation = altitude difference between the beginning and end of the pipe, positive or negative. [m]
Appendix A7. Simple Design Model for the Definition of the Pipe Diameter
The only unknown parameter is the inside pipe diameter. To determine this parameter, the assumption has been made that the velocity of the fluid should be 1 m/s. If the water velocity is fixed, the internal diameter can be obtained by using the following equation:
where:
- d = Inside pipe diameter [m]
- Q = Volumetric flow rate [m3/s]
- v = Flow velocity [m/s] (default value of 1)
References
- Urkiaga, A.; de las Fuentes, L.; Bis, B.; Hernández, F.; Koksis, T.; Balasz, B.; Chiru, E.; Wintgens, T.; Melin, T. Handbook on Feasibility Studies for Water Reuse Systems; Gaiker Centro Tecnologico: BI, Spain, 2006. [Google Scholar]
- Dinesh, N.; Dandy, G. A decision support system for municipal wastewater reclamation and reuse. Water Supply 2003, 3, 1–8. [Google Scholar] [CrossRef]
- Hamouda, M.A.; Anderson, W.B.; Huck, P.M. Decision support systems in water and wastewater treatment process selection and design: A review. Water Sci. Technol. 2009, 60, 1757–1770. [Google Scholar] [CrossRef] [PubMed]
- Krovvidy, S.; Wee, W.G.; Summers, R.S.; Coleman, J.J. An AI approach for wastewater treatment systems. Appl. Intell. 1991, 1, 247–261. [Google Scholar] [CrossRef]
- Kao, J.J.; Brill, E.D.; Pfeffer, J.T.; Geselbracht, J.J. Computer-Based Environment for Wastewater Treatment Plant Design. J. Environ. Eng. 1993, 119, 931–945. [Google Scholar] [CrossRef]
- Krovvidy, S.; Wee, W.G. Wastewater Treatment Systems from Case–Based Reasoning. Mach. Learn. 1993, 10, 341–363. [Google Scholar] [CrossRef] [Green Version]
- Krovvidy, S.; Wee, W.G.; Suidan, M.; Summers, R.S.; Coleman, J.J.; Rossman, L. Intelligent sequence planning for wastewater treatment systems. IEEE Expert 1994, 9, 15–20. [Google Scholar] [CrossRef]
- Yang, C.-T.; Kao, J.-J. An expert system for selecting and sequencing wastewater treatment processes. Water Sci. Technol. 1996, 34, 347–353. [Google Scholar] [CrossRef]
- Heller, M.; Garlapati, S.; Aithala, K. Expert membrane system design and selection for metal finishing waste water treatment. Expert Syst. Appl. 1998, 14, 341–353. [Google Scholar] [CrossRef]
- Rodriguez-Roda, I.; Poch, M.; Bañares-Alcántara, R. Conceptual design of wastewater treatment plants using a design support system. J. Chem. Technol. Biotechnol. 2000, 75, 73–81. [Google Scholar] [CrossRef]
- Loetscher, T.; Keller, J. A decision support system for selecting sanitation systems in developing countries. Socioecon. Plann. Sci. 2002, 36, 267–290. [Google Scholar] [CrossRef]
- Wukovits, W.; Harasek, M.; Friedl, A. A knowledge based system to support the process selection during waste water treatment. Resour. Conserv. Recycl. 2003, 37, 205–215. [Google Scholar] [CrossRef]
- Finney, B.A.; Gerheart, R.A. A User’s Manual for WAWTTAR; Environmental Resources Engineering, Humboldt State University: Arcata, CA, USA, 2004. [Google Scholar]
- Sairan, F.M.; Ujang, Z.; Salim, M.R.; Din, M.M. Architecture of decision support system for WASDA: The module for sequencing batch reactor. In Proceedings of the SIAWATER 2004 International Conference on Water and Wastewater: Technology and Management in Asia, The Mines, Kuala, Lumpur, 30–31 March 2004. [Google Scholar]
- Ullmer, C.; Kunde, N.; Lassahn, A.; Gruhn, G.; Schulz, K. WADOTM: Water design optimization—Methodology and software for the synthesis of process water systems. J. Clean. Prod. 2005, 13, 485–494. [Google Scholar] [CrossRef]
- Joksimovic, D.; Kubik, J.; Hlavinek, P.; Savic, D.; Walters, G. Development of an integrated simulation model for treatment and distribution of reclaimed water. Desalination 2006, 188, 9–20. [Google Scholar] [CrossRef]
- Zeng, G.; Jiang, R.; Huang, G.; Xu, M.; Li, J. Optimization of wastewater treatment alternative selection by hierarchy grey relational analysis. J. Environ. Manag. 2007, 82, 250–259. [Google Scholar] [CrossRef] [PubMed]
- Zhu, Z.J.Y.; McBean, E.A. Selection of water treatment processes using Bayesian decision network analyses. J. Environ. Eng. Sci. 2007, 6, 95–102. [Google Scholar] [CrossRef]
- Hidalgo, D.; Irusta, R.; Martinez, L.; Fatta, D.; Papadopoulos, A. Development of a multi-function software decision support tool for the promotion of the safe reuse of treated urban wastewater. Desalination 2007, 215, 90–103. [Google Scholar] [CrossRef]
- Adewumi, J.R. A Decision Support System for Assessing the Feasibility of Implementing Waste Water Reuse in South Africa. Ph.D. Thesis, Department of Engineering and the Built Environment, University of the Witwatersrand, Johannesburg, South Africa, 2011. [Google Scholar]
- Chamberlain, B.C.; Carenini, G.; Öberg, G.; Poole, D.; Taheri, H. A Decision Support System for the Design and Evaluation of Sustainable Wastewater Solutions. IEEE Trans. Comput. 2012, 63, 129–141. [Google Scholar] [CrossRef]
- Castillo, A.; Cheali, P.; Gómez, V.; Comas, J.; Poch, M.; Sin, G. An integrated knowledge-based and optimization tool for the sustainable selection of wastewater treatment process concepts. Environ. Model. Softw. 2016, 84, 177–192. [Google Scholar] [CrossRef] [Green Version]
- Huang, Y.; Dong, X.; Zeng, S.; Chen, J. An integrated model for structure optimization and technology screening of urban wastewater systems. Front. Environ. Sci. Eng. 2015, 9, 1036–1048. [Google Scholar] [CrossRef]
- Joksimović, D. Decision Support System for Planning of Integrated Water Reuse Projects; University of Exeter: Exeter, UK, 2006. [Google Scholar]
- Chen, J.; Beck, M.B. Towards designing sustainable urban wastewater infrastructures: A screening analysis. Water Sci. Technol. 1997, 35, 99–112. [Google Scholar] [CrossRef]
- Coroado Project Website. Available online: http://www.coroado-project.eu/ (accessed on 11 April 2017).
- Oertlé, E. Treatment Trains for Water Reclamation (Dataset). Zenodo 2018. [Google Scholar] [CrossRef]
- Van Der Graaf, J.H.J.M.; De Koning, J.; Ravazzini, A.; Miska, V. Treatment matrix for reuse of upgraded wastewater. Water Sci. Technol. Water Supply 2005, 5, 87–94. [Google Scholar] [CrossRef]
- Asano, T.; Burton, F.; Leverenz, H. Water Reuse: Issues, Technologies, and Applications; Metcalf, E., Ed.; McGraw-Hill: New York, NY, USA, 2007; ISBN 9780471478447. [Google Scholar]
- Bixio, D.; Weemaes, M.; Thoeye, C.; Ravazini, A.; Miska, V.; De Koning, J.; Cikurel, H.; Aharoni, A.; Muston, M.; Khan, S.; et al. Water Reuse System Management Manual. AQUAREC; Bixio, D., Wintgens, T., Eds.; Office for Official Publications of the European Communities: Luxembourg, 2006; ISBN 9279019341. [Google Scholar]
- Tchobanoglous, G.; Stensel, H.D.; Tsuchihashi, R.; Burton, F.L.; Abu-Orf, M.; Bowden, G.; Pfrang, W. Wastewater Engineering: Treatment and Resource Recovery; McGraw-Hill: New York, NY, USA, 2013; ISBN 0073401188. [Google Scholar]
- Wintgens, T.; Kazner, C.; Hochstrat, R.; Gross, T.; Oertlé, E. Expert workshop and personal communication.
- Oertlé, E. Water Quality Classes—Recommended Water Quality Based on Guideline and Typical Wastewater Qualities. Zenodo 2018. [Google Scholar] [CrossRef]
- US-EPA (United States Environmental Protection Agency). Guidelines for Water Reuse 2012; United States Environmental Protection Agency: Washington, DC, USA, 2012.
- US-EPA (United States Environmental Protection Agency). Guidelines for Water Reuse 2004; United States Environmental Protection Agency: Washington, DC, USA, 2004.
- WHO. Guidelines for the Safe Use of Wastewater, Excreta and Greywater—Volume 2—Wastewater Use in Agriculture; World Health Organization: Geneva, Switzerland, 2006; Volume 11. [Google Scholar]
- WHO. Guidelines for the Safe Use of Wastewater, Excreta and Greywater—Volume 4—Excreta and Greywater Use in Agriculture; World Health Organization: Geneva, Switzerland, 2006. [Google Scholar]
- WHO. Guidelines for the Safe Use of Wastewater, Excreta and Greywater—Volume 3—Wastewater and Excreta Use in Aquaculture; World Health Organization: Geneva, Switzerland, 2006. [Google Scholar]
- WHO. Guidelines for the Safe Use of Wastewater, Excreta and Greywater—Volume 1—Policy and Regulatory Aspects; World Health Organization: Geneva, Switzerland, 2006. [Google Scholar]
- WHO. Guidelines for Drinking-Water Quality: Fourth Edition Incorporating the First Addendum; World Health Organization: Geneva, Switzerland, 2017. [Google Scholar]
- International Organization for Standardization ISO. ISO 16075-3:2015—Guidelines for Treated Wastewater Use for Irrigation Projects— Part 3: Components of a Reuse Project for Irrigation; International Organization for Standardization: Geneva, Switzerland, 2015. [Google Scholar]
- Ayers, R.S.; Westcot, D.W. Food and Agriculture Organization of the United Nations. Water Quality for Agriculture; Food and Agriculture Organization: Rome, Italy, 1985; ISBN 9251022631. [Google Scholar]
- Salgot, M.; Huertas, E. D15-Guideline for Quality Standards for Water Reuse in Europe (Aquarec); Office for Official Publications of the European Communities: Luxembourg, 2006. [Google Scholar]
- California Code of Regulations Title 22—Division 4, Chapter 3, Water Recycling Criteria. Available online: https://govt.westlaw.com/calregs/Browse/Home/California/CaliforniaCodeofRegulations?guid=IE8ADB4F0D4B911DE8879F88E8B0DAAAE&originationContext=documenttoc&transitionType=Default&contextData=(sc.Default) (accessed on 16 April 2017).
- Oertlé, E. Wastewater Treatment Unit Processes Datasets: Pollutant removal efficiencies, evaluation criteria and cost estimations. Zenodo 2018. [Google Scholar] [CrossRef]
- Hochstrat, R.; Joksimovic, D.; Wintgens, T.; Melin, T.; Savic, D. Economic considerations and decision support tool for wastewater reuse scheme planning. Water Sci. Technol. 2007, 56, 175–182. [Google Scholar] [CrossRef]
- Stanford, B.; Debroux, J.-F.; Plumlee, M.; Reinert, A. Costs of Advanced Treatment in Water Reclamation. In Proceedings of the Water Environment Federation Conference, Chicago, IL, USA, 5–9 October 2013; pp. 6388–6395. [Google Scholar]
- Lazarova, V.; Choo, K.-H.; Cornel, P. Water—Energy Interactions in Water Reuse; IWA Publishing: London, UK, 2012; ISBN 9781843395416. [Google Scholar]
- European Commission InforEuro. Monthly Accounting Rate of the Euro. Available online: http://ec.europa.eu/budget/contracts_grants/info_contracts/inforeuro/inforeuro_en.cfm (accessed on 1 December 2018).
- US-EPA (United States Environmental Protection Agency). Development Document for the CWT Point Source Category—Chapter 11 Cost of Treatment Technologies; United States Environmental Protection Agency: Washington, DC, USA, 2000.
- Oertlé, E. Poseidon—Decision Support Tool for Water Reuse (Microsoft Excel) and Handbook. Zenodo 2018. [Google Scholar] [CrossRef]
- Stathatou, P.-Μ.; Kampragou, E.; Grigoropoulou, H.; Assimacopoulos, D.; Karavitis, C.; Porto, M.F.A.; Gironás, J.; Vanegas, M.; Reyna, S. Vulnerability of water systems: A comprehensive framework for its assessment and identification of adaptation strategies. Desalin. Water Treat. 2015, 1–13. [Google Scholar] [CrossRef]
- Frascari, D.; Zanaroli, G.; Motaleb, M.A.; Annen, G.; Belguith, K.; Borin, S.; Choukr-Allah, R.; Gibert, C.; Jaouani, A.; Kalogerakis, N.; et al. Integrated technological and management solutions for wastewater treatment and efficient agricultural reuse in Egypt, Morocco, and Tunisia. Integr. Environ. Assess. Manag. 2018, 14, 447–462. [Google Scholar] [CrossRef]
- Heaney, J.P.; Sample, D.; Wright, L. Chapter 10 Cost Analysis and Financing of Urban Water Infrastructure. In Innovative Urban Wet-Weather Flow Management Systems; United States Environmental Protection Agency: Washington, DC, USA, 1999. [Google Scholar]
- Oron, G. Management modeling of integrative wastewater treatment and reuse systems. Water Sci. Technol. 1996, 33, 95–105. [Google Scholar] [CrossRef]
- Stone, S.J.; Dzuray, E.; Meisegeier, D.; Dahlborg, A.; Erickson, M. Decision-Support Tools for Predicting the Performance of Water Distribution and Wastewater Collection Systems; US-EPA: Washington, DC, USA, 2002.
Figure 1.
Water reuse for pre-feasibility in a systemic approach: (1) wastewater for reuse, (2) type of intended reuse, and (3) identification and assessment of technology.
Figure 1.
Water reuse for pre-feasibility in a systemic approach: (1) wastewater for reuse, (2) type of intended reuse, and (3) identification and assessment of technology.

Figure 2.
The architecture of the decision support tool (DST) Poseidon requires limited information from the user to calculate and present most adequate treatment trains according to local conditions.
Figure 2.
The architecture of the decision support tool (DST) Poseidon requires limited information from the user to calculate and present most adequate treatment trains according to local conditions.

Figure 3.
Schematic representation for the distribution components and information required for the cost calculation (grey).
Figure 3.
Schematic representation for the distribution components and information required for the cost calculation (grey).

Figure 4.
Assessment algorithm proposed by the stage II assessment.

Figure 5.
Data input in simple mode.

Figure 6.
Example results sheet.

Figure 7.
Plausibility check of the 13 simulations P1–13 results. The y-axis shows pollutant removal efficiencies (%) for the literature value ( ![Water 11 00153 i009]() ) and for the DST simulation operating under minimal (
) and for the DST simulation operating under minimal ( ![Water 11 00153 i010]() ), average (
), average ( ![Water 11 00153 i011]() ) and maximal (
) and maximal ( ![Water 11 00153 i012]() ) unit processes efficiencies.
) unit processes efficiencies.
 ) and for the DST simulation operating under minimal (
  ), average (
  ) and maximal (
  ) unit processes efficiencies.
Figure 7.
Plausibility check of the 13 simulations P1–13 results. The y-axis shows pollutant removal efficiencies (%) for the literature value ( ![Water 11 00153 i009]() ) and for the DST simulation operating under minimal (
) and for the DST simulation operating under minimal ( ![Water 11 00153 i010]() ), average (
), average ( ![Water 11 00153 i011]() ) and maximal (
) and maximal ( ![Water 11 00153 i012]() ) unit processes efficiencies.
) unit processes efficiencies.
) and for the DST simulation operating under minimal ( ), average ( ) and maximal ( ) unit processes efficiencies.
Figure 8.
The y-axis presents the relative error for different water quality parameters in (%). The first 7 parameters simulation operating under minimal ( ![Water 11 00153 i010]() ), average (
), average ( ![Water 11 00153 i011]() ) and maximal (
) and maximal ( ![Water 11 00153 i012]() ) unit processes efficiencies refer to the primary axis on the left and the last 4 parameters to the secondary axis on the right.
) unit processes efficiencies refer to the primary axis on the left and the last 4 parameters to the secondary axis on the right.
), average ( ) and maximal ( ) unit processes efficiencies refer to the primary axis on the left and the last 4 parameters to the secondary axis on the right.
Table 1.
Selected list of main decision support systems reported in literature ([3]).
Table 1.
Selected list of main decision support systems reported in literature ([3]).
| Name of Tool or Authors | Reference | Scope | Key Methods | Open Source | |
|---|---|---|---|---|---|
| Technical & Economic | System Analysis | ||||
| Krovvidy et al. | [4] | X | Rule-based, heuristic search, neural networks, certainty factors for the developed rules | - | |
| Kao et al. | [5] | X | Process modeling, mathematical programming, solves mass balance on a treatment train, graphical display of designs | - | |
| Krovvidy et al. | [6] | X | Case-based reasoning, heuristic search, define cost per unit removal of contaminant | - | |
| SOWAT | [7] | X | Rule-based, heuristic search, fuzzy logic, fuzzy functions for technology performance, ability to check a user-defined train | - | |
| Yang et al. | [8] | X | Expert system, fuzzy logic, certainty factor for technology treatability, user-defined fuzzy preference of technologies | - | |
| MEMFES | [9] | X | Industrial wastewater, expert system, simulation, analytical hierarchy process, a tutor provides justification for outcome. Surveyed the system’s user-friendliness | - | |
| Rodriguez-Roda et al. | [10] | X | Simulation, issue-based information systems, reports describe the deliberation over a decision, searching design records using keywords | - | |
| SANEX | [11] | X | Conjunctive elimination, multi-attribute utility technique, multi-disciplinary set of sustainability indicators, multi-level amalgamation used for rating | - | |
| Wukovits et al. | [12] | X | Knowledge-based system, heuristic search, easy update of process database, possible communication with other programs | - | |
| WAWTTAR | [13] | X | Modeling and simulation, screening, multi-criteria decision analysis, output: least cost alternative, assesses risk, and more, community specific data considered in the decision | X | |
| WASDA | [14] | X | Technical design, rule-based, design equations, friendly user interface, process design calculation module | - | |
| WADO | [15] | X | Industrial wastewater, rule-based, mixed integer non-linear programming, investigates regeneration opportunities from water used in industrial processes | - | |
| WTRNet | [16] | X | Modeling & simulation, linear & NL programming, genetic algorithm, provides user guidance for treatment train selection through either an expert or a stepwise approach | - | |
| Zeng et al. | [17] | X | Analytical hierarchy process, grey relational analysis, allows comparison between alternatives considering the entire criteria | - | |
| Zhu et al. | [18] | X | Drinking water, Bayesian probability networks, considers performance uncertainty, variables measuring impact on public health | - | |
| MOSTWATAR | [2] | X | Genetic algorithms, fitness score, techno-economic feasibility investigation | - | |
| MEDAWARE | [19] | X | Existing wastewater facilities, online tool, multi-criteria analysis | - | |
| WASWARPLAMO | [20] | X | Modeling & simulation, linear & NL programming, genetic algorithm, provides user guidance for treatment train selection through either an expert or a stepwise approach | - | |
| Chamberlain et al. | [21] | X | Integrated model, logic programming, explicit ontology, selection based on stated values and priorities | - | |
| NOVEDAR_EDSS | [22] | X | Intelligent/expert screening of process technologies | X for academic purposes | |
| Huang et al. | [23] | X | Integrated model, urban wastewater, genetic algorithm, multi-objective optimization, non-dominated sorting | - | |
Table 2.
List of unit processes considered in the DST.
| Primary Treatment | Disinfection |
| Bar screen Coarse screen Equalization basin Grit chamber Sedimentation without coagulant Sedimentation with coagulant | Chlorine gas Chlorine dioxide Ozonation Ultraviolet disinfection |
| Secondary Treatment | Tertiary Treatment |
| Anaerobic stabilization ponds Activated sludge (high loaded with secondary sedimentation) Activated sludge (low loaded with denitrification and with secondary sedimentation) Activated sludge (low loaded without denitrification but with secondary sedimentation) Extended aeration Membrane bioreactor (MBR) Rotating biological contactor (RBC) Stabilization ponds: aerobic Stabilization ponds: facultative Trickling filter with secondary sedimentation | Constructed wetland Activated carbon Advanced oxidation process Dual media filter Electrodialysis Enhanced biological phosphorus removal (EBPR) Flocculation Ion exchange Maturation pond Microfiltration Nanofiltration Post-denitrification P-precipitation Reverse osmosis Soil-aquifer treatment (SAT) Ultrafiltration |
Table 3.
Treatment train (TT) categories, description, and list of treatment trains included in the DST [28].
Table 3.
Treatment train (TT) categories, description, and list of treatment trains included in the DST [28].
| Category | Processes | Possible Applications | Treatment Trains Included in the DST (from Literature and Case Studies) [28] |
|---|---|---|---|
| 1—Title 22 1 |  | The reuse varies from urban applications and green landscaping to industrial usage. | Benchmark Technology, Italy, Australia, Cyprus, Greece, Spain, USA I, Brazil I, Belgium, Brazil II, Mexico, South Africa |
| 2—Soil aquifer treatment (SAT) |  | The final water can be reused for unrestricted irrigation. | Benchmark Technology, Israel, USA |
| 3—Wetlands |  | Reuse can be done in nature conservation or agriculture. | Benchmark Technology, Nicaragua, Peru, Brazil, USA, Spain, Mexico, Senegal |
| 4—Lagooning |  | Reuse of the effluent by (very) restricted irrigation. | Benchmark Technology, Israel, France, Australia I, Australia II, South Africa, Argentina, United Arab Emirates |
| 5—Disinfection only |  | Treated water can be reused for irrigation under restricted conditions. | Benchmark Technology, USA, Chile, Brazil |
| 6—Direct membrane filtration |  | Treated water can be reused for agricultural applications. | Benchmark Technology, USA, Australia |
| 7—Local membrane bioreactor (MBR) |  | Reuse of the water in the direct neighborhood (e.g., as toilet flush water). | Benchmark Technology, USA, Brazil, China, Japan |
| 8—High wastewater quality |  | The treated water is of so high quality that many applications (industrial, households, etc.) are possible. | Benchmark Technology, Belgium, Singapore, Namibia, The Netherlands, United Kingdom, USA I, USA II |
1 The name of this benchmark technology originates from the homonymous Californian regulation.
Table 4.
Water quality parameters included in the DST.
| Parameter | Unit | Parameter | Unit |
|---|---|---|---|
| Biological Oxygen Demand BOD | mg/L | Total Nitrogen, TN | mg/L |
| Chemical Oxygen Demand COD | mg/L | Total Organic Carbon, TOC | mg/L |
| Fecal Coliforms, FC | cfu/100 mL | Total Phosphorous, TP | mg/L |
| Nitrate | mg NO3–N/L | Total Suspended Solids TSS | mg/L |
| Total Coliforms, TC | cfu/100 mL | Turbidity | NTU |
| Total Dissolved Solids, TDS | mg/L | Virus (nonspecific) | PFU/100 mL |
Table 5.
Overview of most prominent international guidelines and standards for treated WW reuse.
| Guidelines with Reference | Description |
|---|---|
| US-EPA, Guidelines for water reuse 2012 [36] | This update from the 2004 US-EPA guidelines [37] is an exhaustive reference report considering all types of water reuse. |
| WHO, Guidelines for the safe use of wastewater, excreta and greywater 2006 [34,38,39,40,41] | In 2006, WHO published four volumes of a third edition of its Guidelines for the safe use of wastewater, excreta, and greywater in agriculture and aquaculture. The revised Guidelines reflect a strong focus on disease prevention and public health principles. |
| WHO, Guidelines for drinking-water quality: Fourth edition [41] | The fourth edition of the World Health Organization’s (WHO) Guidelines for drinking-water quality (GDWQ) builds on over 50 years of guidance by WHO on drinking-water quality, which has formed an authoritative basis for the setting of national regulations and standards for water safety in support of public health. |
| ISO Guidelines for treated wastewater use for irrigation projects 2015 [35] | ISO 16075-3:2015 covers the system’s components needed for the use of treated wastewater for irrigation. |
| FAO Water quality for agriculture 1994 [42] | The FAO suggests various water quality criteria for general irrigation. The guidelines are practical and have been used successfully in general irrigated agriculture. |
| Proposal by the Aquarec project, 2006 [30,43] | The Aquarec project proposes seven quality categories for different types of reuses and compiled microbial and chemical limits for each category. |
| California code of regulation title 22 [44] | California Department of Health Services (DHS) establishes water quality standards and treatment reliability criteria for water recycling under Title 22 and establishes requirements for the use of recycled water not addressed by the uniform statewide [43]. These quality standards are often used as reference or used as a model to establish national water standards in other states or countries. |
Table 6.
Cost components included in the DST.
| Cost Components | Unit | Comment |
|---|---|---|
| Construction cost | 1000 USD 2006 | Capital expenditure (CAPEX) calculation and annualization are described in Section 2.4. |
| Land requirements | ha | Default period of 30 years and same calculation for the annualization as of CAPEX is applied. Residual value after 30 years not considered.These values have to be multiplied by corresponding parameters from Table 7 provided in (CUR/ha) to obtain local costs. |
| Energy requirements | kWh/y | Both values have to be multiplied by corresponding parameters from Table 7 to obtain local costs. |
| Labor requirements | person-hour/month | |
| Other operation & maintenance | 1000 USD 2006/y | As energy and labor are considered separately, this category considers additional operations & maintenance (O&M) costs consisting of [15] maintenance (usually assumed to 4% of total capital costs), and taxes and insurance (usually assumed to 2% of total capital cost). Furthermore, additional costs are individually added to different unit processes: chemicals (lime/calcium hydroxide, polymer, sodium hydroxide, sodium hypochlorite, sulfuric acid, cationic polymer, ferrous sulfate, hydrated lime, sodium sulfide), residual management (technology-specific costs), sludge disposal and concentrate disposal. |
Table 7.
Parameters considered in the community profiles for the calculation of the cost component.
| Parameters | Unit | Default Value | Comment |
|---|---|---|---|
| Currency | CUR | USD | The reference community is based on USD from 2006. |
| Exchange rate to USD 2006 | CUR/USD2006 | 1 | To define the exchange rate, it is recommended to use the exchange rate from 2006 and to include inflation rate or other evolution factors since 2006 [49]. |
| Land cost | CUR/ha | 10,000 USD | Acquisition costs and the unit costs for land have to be merged into this overall land cost factor. |
| Electricity cost | CUR/kWh | 0.05 USD | Average electricity cost should be used. |
| Personal cost | CUR/person-hour | 20 USD | Average labor cost should be used, covering a mix of different types of personnel (blue and white collar). |
| Price of reclaimed water | CUR/m3 | 2 USD | Selling price of the reclaimed water |
| Discount rate (r) | %/a | 8%/a | Real interest rate r = nominal interest rate (i) − actual inflation rate (p) |
| Factor | Used in the System | Default Value |
|---|---|---|
| Equipment cost (EC) | Technology-specific cost from the regressions defined as construction cost (Equation (2)) | EC |
| Construction cost (CC) | Equipment installation (site development), piping, instrumentation, and controls | 39% of EC |
| Indirect cost | Engineering + contingency | 27% of CC |
| Total capital expenditure (CAPEX) | Total construction cost + total indirect cost | CAPEX = EC + 0.39 EC + 0.27 (EC + 0.39 EC) = (1.39 EC) 1.27 = 1.77 EC |
Table 9.
Overview of selected assessment criteria for multi-criteria analysis with information on qualitative or semi-quantitative aspects. The values are normalized between 0 and 3: (0 = nil, 1 = low, 2 = medium, and 3 = high).
Table 9.
Overview of selected assessment criteria for multi-criteria analysis with information on qualitative or semi-quantitative aspects. The values are normalized between 0 and 3: (0 = nil, 1 = low, 2 = medium, and 3 = high).
| Technical Assessment Criteria (TE) | Requirements and Impacts (RI) | Costs (C) |
|---|---|---|
| Reliability (Qualitative) | Power demand (Semi-quantitative) | Annualized capital costs (Semi-quantitative) |
| Ease to upgrade (Qualitative) | Chemical demand (Qualitative) | Land cost (Semi-quantitative) |
| Adaptability to varying flow (Qualitative) | Odor generation (Qualitative) | Energy cost (Semi-quantitative) |
| Adaptability to varying quality (Qualitative) | Impact on groundwater (Qualitative) | Labor (Semi-quantitative) |
| Ease of operation & maintenance (Qualitative) | Land requirement (Semi-quantitative) | Other operation and maintenance cost (Semi-quantitative) |
| Ease of construction (Qualitative) | Quantity of sludge production(Semi-quantitative) | Total annual costs of treatment (Semi-quantitative) |
| Ease of demonstration (Qualitative) |
| Process Type and Location | Unit Processes Used in the DST |
|---|---|
| P1—Jamnagar Export Refinery Project | Equalization basin; low-loaded activated sludge with de-N + seccondary sedimentation; dual media filtration; activated carbon; chlorine dioxide |
| P2—Water resource management V Valley | Chlorine gas; dual media filter; ultrafiltration; activated carbon; chlorine gas |
| P3—Recirculating vertical flow constructed wetland (RVFCW) Israel/Peru | Constructed wetland; dual media filtration; UV-disinfection |
| P4—Mexico San Luis Potosi Agricultural reuse | Grit chamber; sedimentation with coagulant; constructed wetland |
| P5—Mexico San Luis Potosi. Industrial reuse | Grit chamber; sedimentation with coagulant; low loaded activated sludge + secondary sedimentation; dual media filtration; ion exchange |
| P6—Beetham WWTP Trinidad and Tobago | Bar screen; grit chamber; extended aeration; sedimentation without coagulant; UV disinfection |
| P7—Emergency potable reuse in Chanute Kansas | Bar screen; grit chamber; sedimentation with coagulation; trickling filter with secondary sedimentation; chlorine gas |
| P8—Direct potable reuse treatment process Denver: Ultrafiltration | Sedimentation with coagulant; dual media filtration; ultraviolet disinfection; activated carbon; ultrafiltration; ozonation; chlorine gas |
| P9—Direct potable reuse treatment process Denver: Reverse osmosis | Sedimentation with coagulant; dual media filtration; ultraviolet disinfection; activated carbon; reverse osmosis; ozonation; chlorine gas |
| P10—Constructed wetlands Turkey | Anaerobic stabilization pond; constructed wetland |
| P11—Title 22 Greece | Bar screen; grit chamber; sedimentation without coagulant; low loaded activated sludge with de-N + secondary sedimentation; dual media filter; chlorine dioxide |
| P12—Soil Aquifer Treatment Israel | Bar screen; grit chamber; low loaded activated sludge with de-N + secondary. sedimentation; soil aquifer treatment; chlorine gas |
| P13—Building MBR: Japan | Bar screen; grit chamber; MBR; activated carbon; chlorine dioxide |
© 2019 by the authors. Licensee MDPI, Basel, Switzerland. This article is an open access article distributed under the terms and conditions of the Creative Commons Attribution (CC BY) license (http://creativecommons.org/licenses/by/4.0/).
Share and Cite
MDPI and ACS Style
Oertlé, E.; Hugi, C.; Wintgens, T.; Karavitis, C.A. Poseidon—Decision Support Tool for Water Reuse. Water 2019, 11, 153. https://doi.org/10.3390/w11010153
AMA Style
Oertlé E, Hugi C, Wintgens T, Karavitis CA. Poseidon—Decision Support Tool for Water Reuse. Water. 2019; 11(1):153. https://doi.org/10.3390/w11010153
Chicago/Turabian StyleOertlé, Emmanuel, Christoph Hugi, Thomas Wintgens, and Christos A. Karavitis. 2019. "Poseidon—Decision Support Tool for Water Reuse" Water 11, no. 1: 153. https://doi.org/10.3390/w11010153
Note that from the first issue of 2016, this journal uses article numbers instead of page numbers. See further details here.