Hydrology of the Sirba River: Updating and Analysis of Discharge Time Series


1
DIATI, Politecnico di Torino, 10129 Torino, Italy
2
DIST, Politecnico di Torino & Università di Torino, 10129 Torino, Italy
*
Author to whom correspondence should be addressed.
Water 2019, 11(1), 156; https://doi.org/10.3390/w11010156
Submission received: 6 December 2018
/
Revised: 12 January 2019
/
Accepted: 14 January 2019
/
Published: 16 January 2019
(This article belongs to the Special Issue Hydrological Impacts of Climate Change and Land Use/Land Cover Change)
Abstract
:The Sahelian regions are affected by an increasing number of catastrophic floods in recent years as a consequence of climate and land use/land cover changes. River flow data is key to understanding river behavior and develop flood mitigation and prevention strategies. The present study provides a revision and an update of the existing discharge dataset of the Sirba River with the aim of enhancing the reliability of these data. The revision also includes the recalibration of the Garbey Kourou rating curves. The analysis of the revised discharge time series strengthens the previous findings, evidencing a positive trend in flood frequency and intensity over the entire analyzed period of 1956–2018. This positive trend is more pronounced for the last 40 years due to a significant underestimation of the rating curves used. A relevant finding is a new changepoint in the time series, detected for 2008, which represents the beginning of the period in which the highest flood magnitudes were registered. The effect of land use/land cover changes and climate changes on the water resource is depicted using flow duration curves. This research produces a revised and more reliable discharge time series that will be a new starting point for future hydrological analyses.
Keywords:
Middle Niger River Basin; Sirba River; Sahel; floods; discharge time series; rating curves1. Introduction
An increase in the occurrence and magnitude of extreme flooding events in the Niger River Basin has been registered in recent decades, especially during the last 10 years [1,2,3,4,5,6]. These events have stimulated researchers worldwide to shift their efforts to flooding comprehension and hazard evaluation. The first scientific approach to this issue was addressed by Tarhule [7], who introduced extreme floods as a significant problem in addition to the water scarcity affecting African countries.
Focusing on the Sahelian regions, many studies have analyzed the rainfall time series from 1950. A moderate recovery of precipitation has been observed after the severe drought from 1970 to 1990 [8,9,10]. The “return to wet conditions” showed a positive trend for annual rainfall and highlighted the increase in inter-annual variability and the changes in rainfall magnitude [2]. This rainfall pattern might partially explain the increase of streamflow in Sahelian rivers but cannot justify the extreme floods of the past decade, since the amount of precipitation was smaller than that of the wetter period before 1970. This hydrological behavior was called the Sahelian Paradox [11,12]. In the last few years, two different causes were analyzed as possible drivers of the increase in flood magnitude: climate changes and land use/land cover changes. Descroix et al. [4] argued that the uncontrolled deforestation and clarification of the savannah to create agricultural land is leading to soil crusting and to a consequent decrease in soil water holding capacity. These authors extensively observed this phenomenon on the right tributaries of the Middle Niger River (Sirba, Gorouol, and Dargol rivers). This change of land use and land cover enhances the runoff value and decreases the time of concentration of the basin. Therefore, Descroix et al. [4] showed that the increase in river discharge is directly attributed to the increased runoff coefficient.
By contrast, Aich et al. [13] considered that the cause of increasing flood intensity in the Niger River and its tributaries can be connected to climate changes. They found that the return to wet conditions was the driver key for the increased discharge, explained by a direct correlation of precipitation and streamflow trends in the last three decades.
More recent studies have claimed that it is not totally clear what the major driver is and have suggested that the mutual influence between these drivers strongly depends on the local climatic and territorial features [5,14,15]. Thus, each basin or sub-basin should be analyzed carefully to understand which aspect leads to the intensification of the flood regime. In the latest studies, data-based and modeling approaches have been performed [5]. However, reliable data and continuous datasets are needed to achieve robust results. Unfortunately, failures of gauging stations often cause loss of data or cause the rating curves to become obsolete and not representative of the cross-sections of the river reach.
The present research critically examines the existing river flow data of the Sirba River, the largest tributary of the Middle Niger River, and provides a revised dataset for the stream gauge station of Garbey Kourou. Working at the sub-basin scale, an uncertainty in river flow data was noticed due to a significant difference between the current rating curve and the discharge measured in the field. The recalibration of the set of rating curves was necessary to obtain a correct stage/discharge correlation and provide a revised and more reliable discharge time series. This revised time series represents a new milestone for future analysis and answers the demands for data quality, especially for the calibration in the modeling approach. Moreover, the revised time series allowed the recalculation of a number of hydraulic features, enhancing the knowledge of the Sirba River such as the flow duration curve and trends. Our results are a contribution to the scientific debate about whether the increase of river flooding in the Sahelian part of the Niger River can be attributed to climate changes and/or land use/land cover transformation [5,16,17,18,19,20].
The paper is organized as follows:
2. Materials and Methods
To simplify the reading, the acronyms adopted in the research are listed in Table 1.
2.1. Study Area
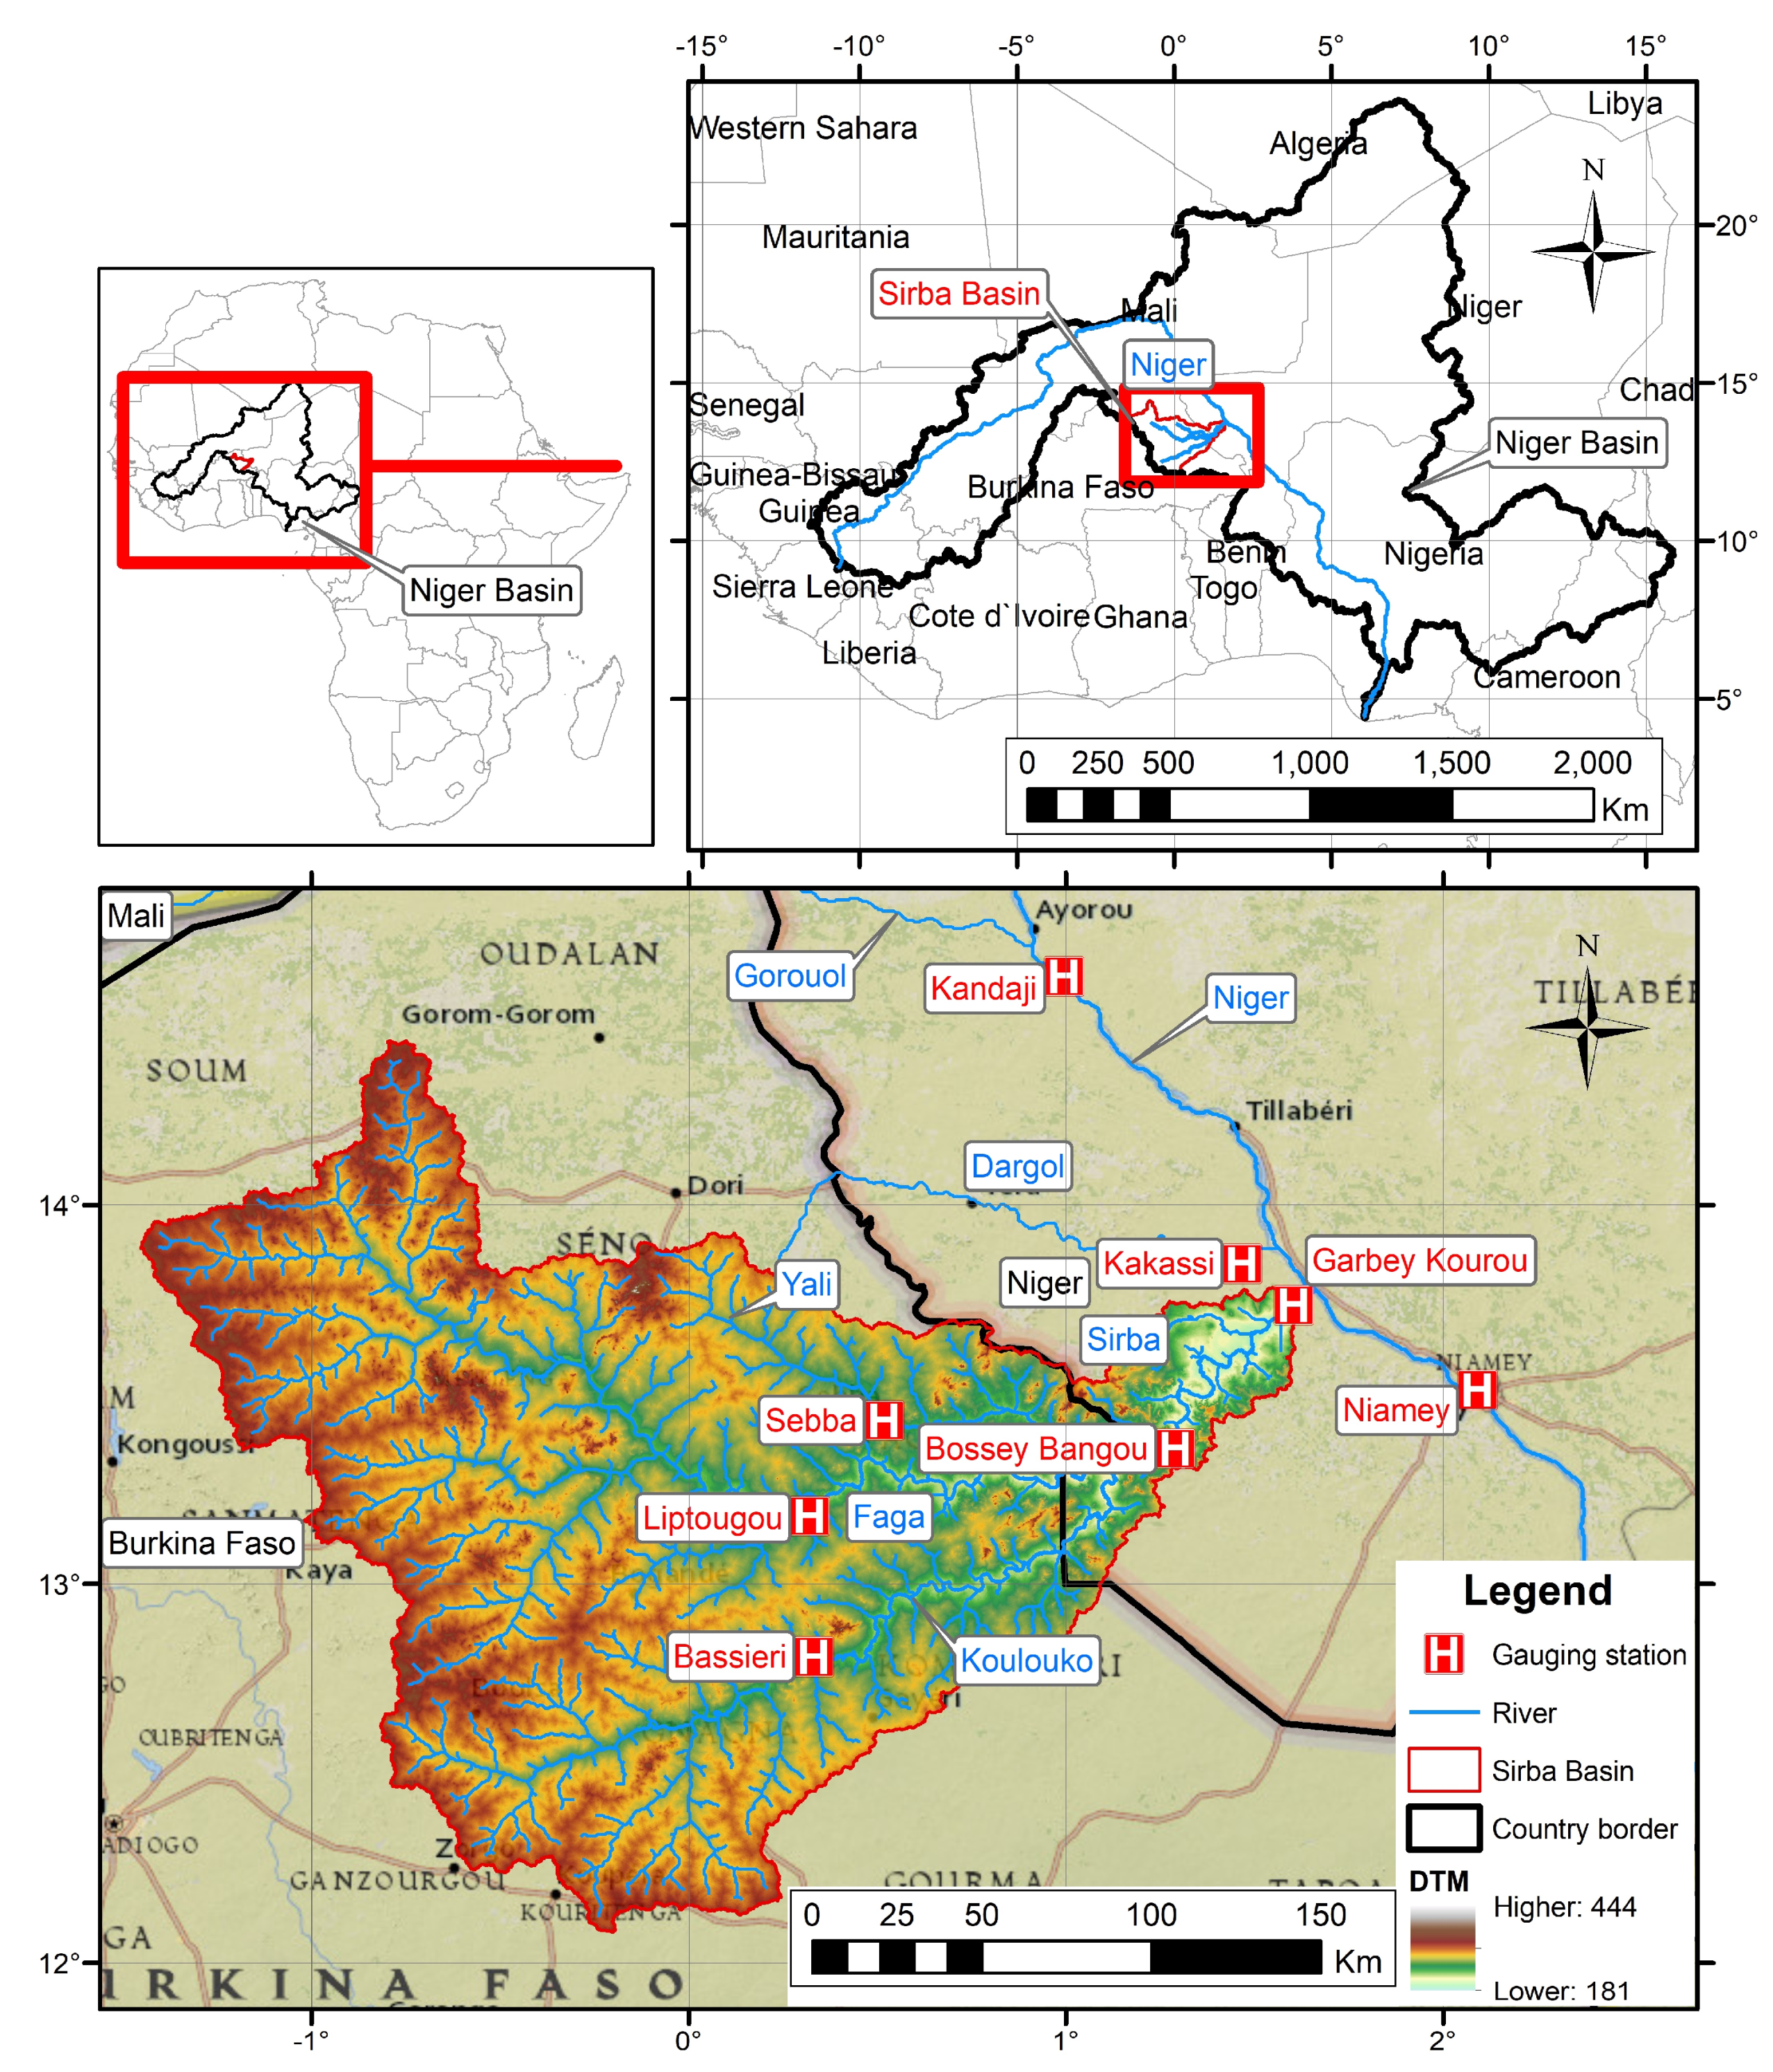
The study was carried out in the Middle Niger River Basin (MNRB), focusing on one of its main tributaries, the Sirba River. The Sirba River basin covers a surface of approximately 39,000 km2 in the central Sahel. The territory is spread over two different countries: 93% in Burkina Faso and the remaining sector in Niger. The flat topography of the basin is characterized by a slight height variation between the upper level of 444 m a.s.l. and the lower level of 181 m a.s.l., without steep slopes. The river flows towards the confluence with a mean bed slope of 0.02%. The natural Sahelian landscape principally consists of a patchwork of shrub bush, fallow savannah, and rain-fed millet fields. Today, the original environment is strongly affected by the fast population growth. In fact, some areas originally covered by the savannah vegetation have been replaced by cultivated and pastoral areas [4,6].
The Nigerien part of the river basin was chosen as the study area. New and detailed hydrological and statistical analyses were conducted. The analyzed reach of the Sirba River was about 100 km from the state border (downstream the confluence of its three main tributaries, Faga, Koulouko, and Yali) to the confluence into the Niger River. There is a manual gauging station on each tributary in Bassieri (Koulouko River), Liptougou (Faga River), and Sebba (Yali River).
The gauging station of Garbey Kourou on the Sirba River was installed in 1956. It is located 8 km upstream of the confluence into the Niger River. The gauging station is equipped with six staff gauges (0–600 cm) and two water pressure measuring devices controlled by the NBA (Niger Basin Authority) and the DGRE (General Water Resources Management) of the Republic of Niger.
A new automatic gauging station was installed in June 2018 as a part of the international cooperation project ANADIA 2.0 for the implementation of an early warning system. The location of the station is in correspondence of the village of Bossey Bangou, a few kilometres downstream the state border with Burkina Faso. This station is equipped with eight staff gauges (0–800 cm) and a water pressure measuring device, controlled by the DGRE.
The gauging stations within the Sirba River basin are summarized in Table 2. This table also contains the most significant gauging stations present in the MNRB: Kandaji and Niamey on the Niger River and Kakassi on the Dargol River. The main watercourses of the investigated area and all the mentioned stations are illustrated in Figure 1.
The study area is located in the Inter-Tropical Convergence Zone (ITCZ) between the isohyets 400 and 700 mm, characterized by a Sahelian semiarid climate. The climatic year is divided into two seasons: the dry season (October–May) and the wet season (June–September) [21,22].
The Sirba River is an intermittent river that is dry for about six months a year. Its hydrology is deeply related to the rainfall variability and the flood magnitude is influenced more by the superficial runoff than by the groundwater flow.
2.2. Dataset
The data used in this study comprise stage and discharge time series of the Garbey Kourou gauging station. The observation period starts from the gauging station installation in 1956 until 30 September 2018. The observed river stages and discharges at the daily resolution were obtained from the database of the NBA and DGRE. After the first examination in which completeness and reliability were analyzed, we decided to keep as reference the stage time series provided by the NBA. The data also comprise the discharge measurements realized on site covering the period 1956–2018. The whole set of 140 measures is constituted by 91 from the NBA, 39 from the Monographie hydrologique du fleuve Niger [23], three from recent measurements of the DGRE, and seven from measurement campaigns that we realized in the international cooperation project ANADIA 2.0. These last seven measures were realized using an Acoustic Doppler Current Profiler (ADCP) and Global Positioning System (GPS) devices in the rainy season of 2018. The data finally include the three rating curves previously used by the DGRE (for the intervals of 1956–1976, 1977–1979, and 1980–current date).
The additional discharge time series for the gauging stations of Kandaji, Kakassi, and Niamey (2006–2017) were provided by the DGRE.
2.3. Methods
2.3.1. Power-Law Stage/Discharge Rating Curve
Recent discharge measurements at Garbey Kourou have shown how the application of the current rating curve (RC) was causing an underestimation of the streamflow. The incongruence with the on-site measures can essentially be explained by the significant changes in the geometry of the cross-sections over time. These changes were observed through the land surveys.
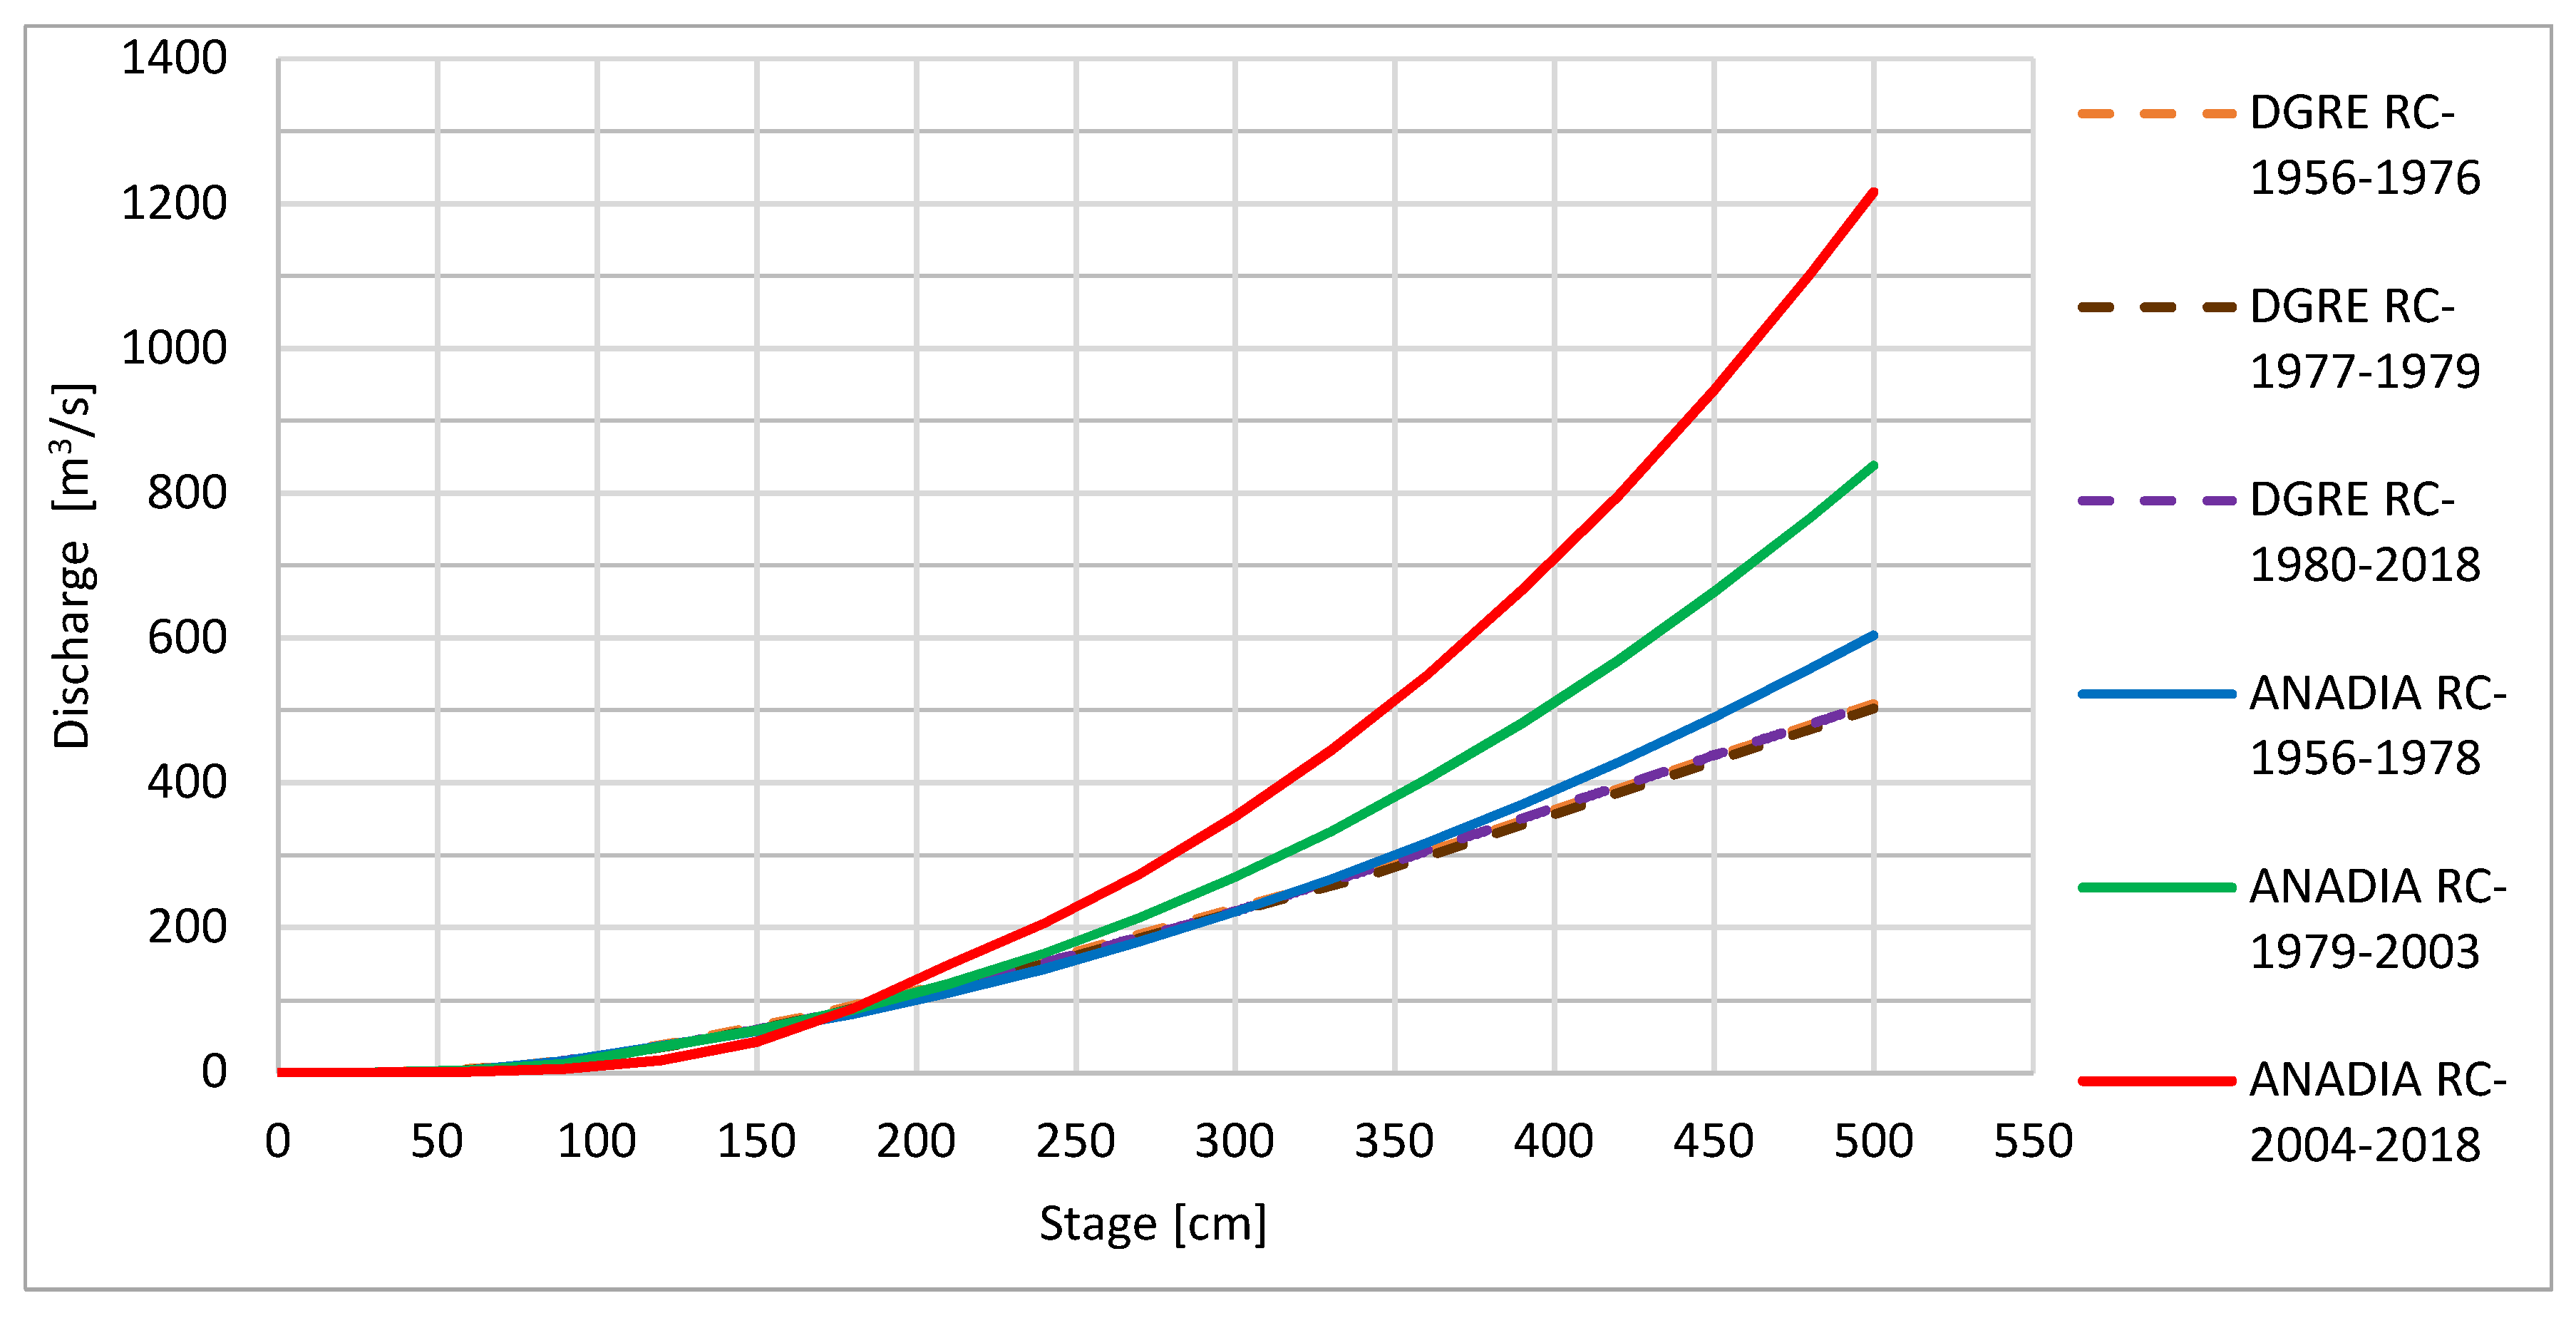
Three different rating curves have been used during the 63 years of measurements and the last RC dates back to 1980. An upgrade was hence necessary. The set of 140 measures allowed the revision of the existing rating curves and the obtention of a new set. The three new curves were calculated using a homogeneous set of data, identifying three intervals of validity: 1956–1978 (based on 84 measures), 1979–2003 (based on 39 measures), and 2004–2018 (based on 17 measures). The breakpoint of each interval was fixed in correspondence to gaps in the measurement set. The decreasing number of on-site measures over the time highlighted the lack of attention paid to river monitoring.
The stage/discharge rating curves were calculated for each interval, following a power-law with two parameters [24].
where a and b are the coefficient and the exponent that define the shape of the curve, respectively; h is the stage height (m); and Q is the discharge (m3/s). Taking the logarithm of each on-site measure, the coefficients were extracted by fitting a linear line to the logarithm plot which maximizes the R2 (coefficient of determination).
Once the different equations for each interval were defined, the successive step was the application of these rating curves to convert the observed river stages into discharge, resulting in a new time series.
For clarity, the updated time series of discharge is called ANADIA time series and the updated rating curves are called ANADIA RCs.
2.3.2. Flow-Duration Curves
As described by Leboutillier and Waylen, “a flow-duration curve represents the annual flow-frequency characteristics of rivers by depicting the cumulative frequencies for average ranked flows in a river” [25].
The shape of the flow-duration curve (FDC) provides information about the basin and the characteristic discharge (Qn) can be extracted for supplementary analyses. The value Qn is defined as the discharge that exceeds the number of days (n) during the year over the entire period of record on which the FDC is based. This physically means that, on average, the discharge should be present at least n days per year.
2.3.3. Statistics
Since the Sahelian area is clearly characterized by a decadal pattern of climate, changepoints in the time series of the discharge were sought in order to recognize whether there is a correspondence to the rainfall pattern. To detect these changepoints, the approach developed by Wang et al. [26,27] based on the PMF (Penalize Maximal Function) test was used.
A comparison between the variability of the annual maximum discharges (AMAX) and their anomalies was performed in order to provide a clear visualization of the time series and its tendencies. The AMAX anomaly was calculated through the use of the Standardized Anomaly Index (SAI) introduced by E.B. Kraus [28,29], which is an index frequently used for climate change studies [30,31].
The local regression-fitting technique LOESS (LOcally Estimated Scatterplot Smoothing) was used in order to identify and visualize the tendencies in data distribution [32]. This is a widely used non-parametric regression method that combines multiple regression models in a k-nearest-neighbor-based meta-model. With this procedure, a smooth curve called the Loess curve is generated through the dataset. In order to better understand the time series pattern, a moving average line was plotted.
Monotonic linear trends of detection and estimation were performed using MAKESENS [33]. This tool is based on the use of two non-parametric methods: the Mann–Kendall (MK) test and the Sen approach. The MK test detects the presence of a monotonic increasing or decreasing trend, rejecting the null hypothesis (H0) with a certain level of significance α. The Sen method computes the slope of the existing linear trend, evaluating its magnitude.
3. Results and Discussion
3.1. The Updated Time Series of Discharge
The results of the linear regression analysis, coefficients, and exponents of the new rating curve equations are summarized in Table 3. The column titled “Ranges” indicates the range of validity of the equation according to the on-site measurement. The upper limit represents the highest stage measured during that interval. The ranges considered are those that have maximized the coefficient of determination R2.
A significant increase in the stage/discharge relation is shown plotting the ANADIA RCs above the adopted rating curves in Figure 2. The old rating curves (dotted lines in Figure 2) are lower than the new curves (solid lines in Figure 2), mainly for the last period. This means that the application of the DGRE RCs led to an underestimation of the DGRE time series of discharges.
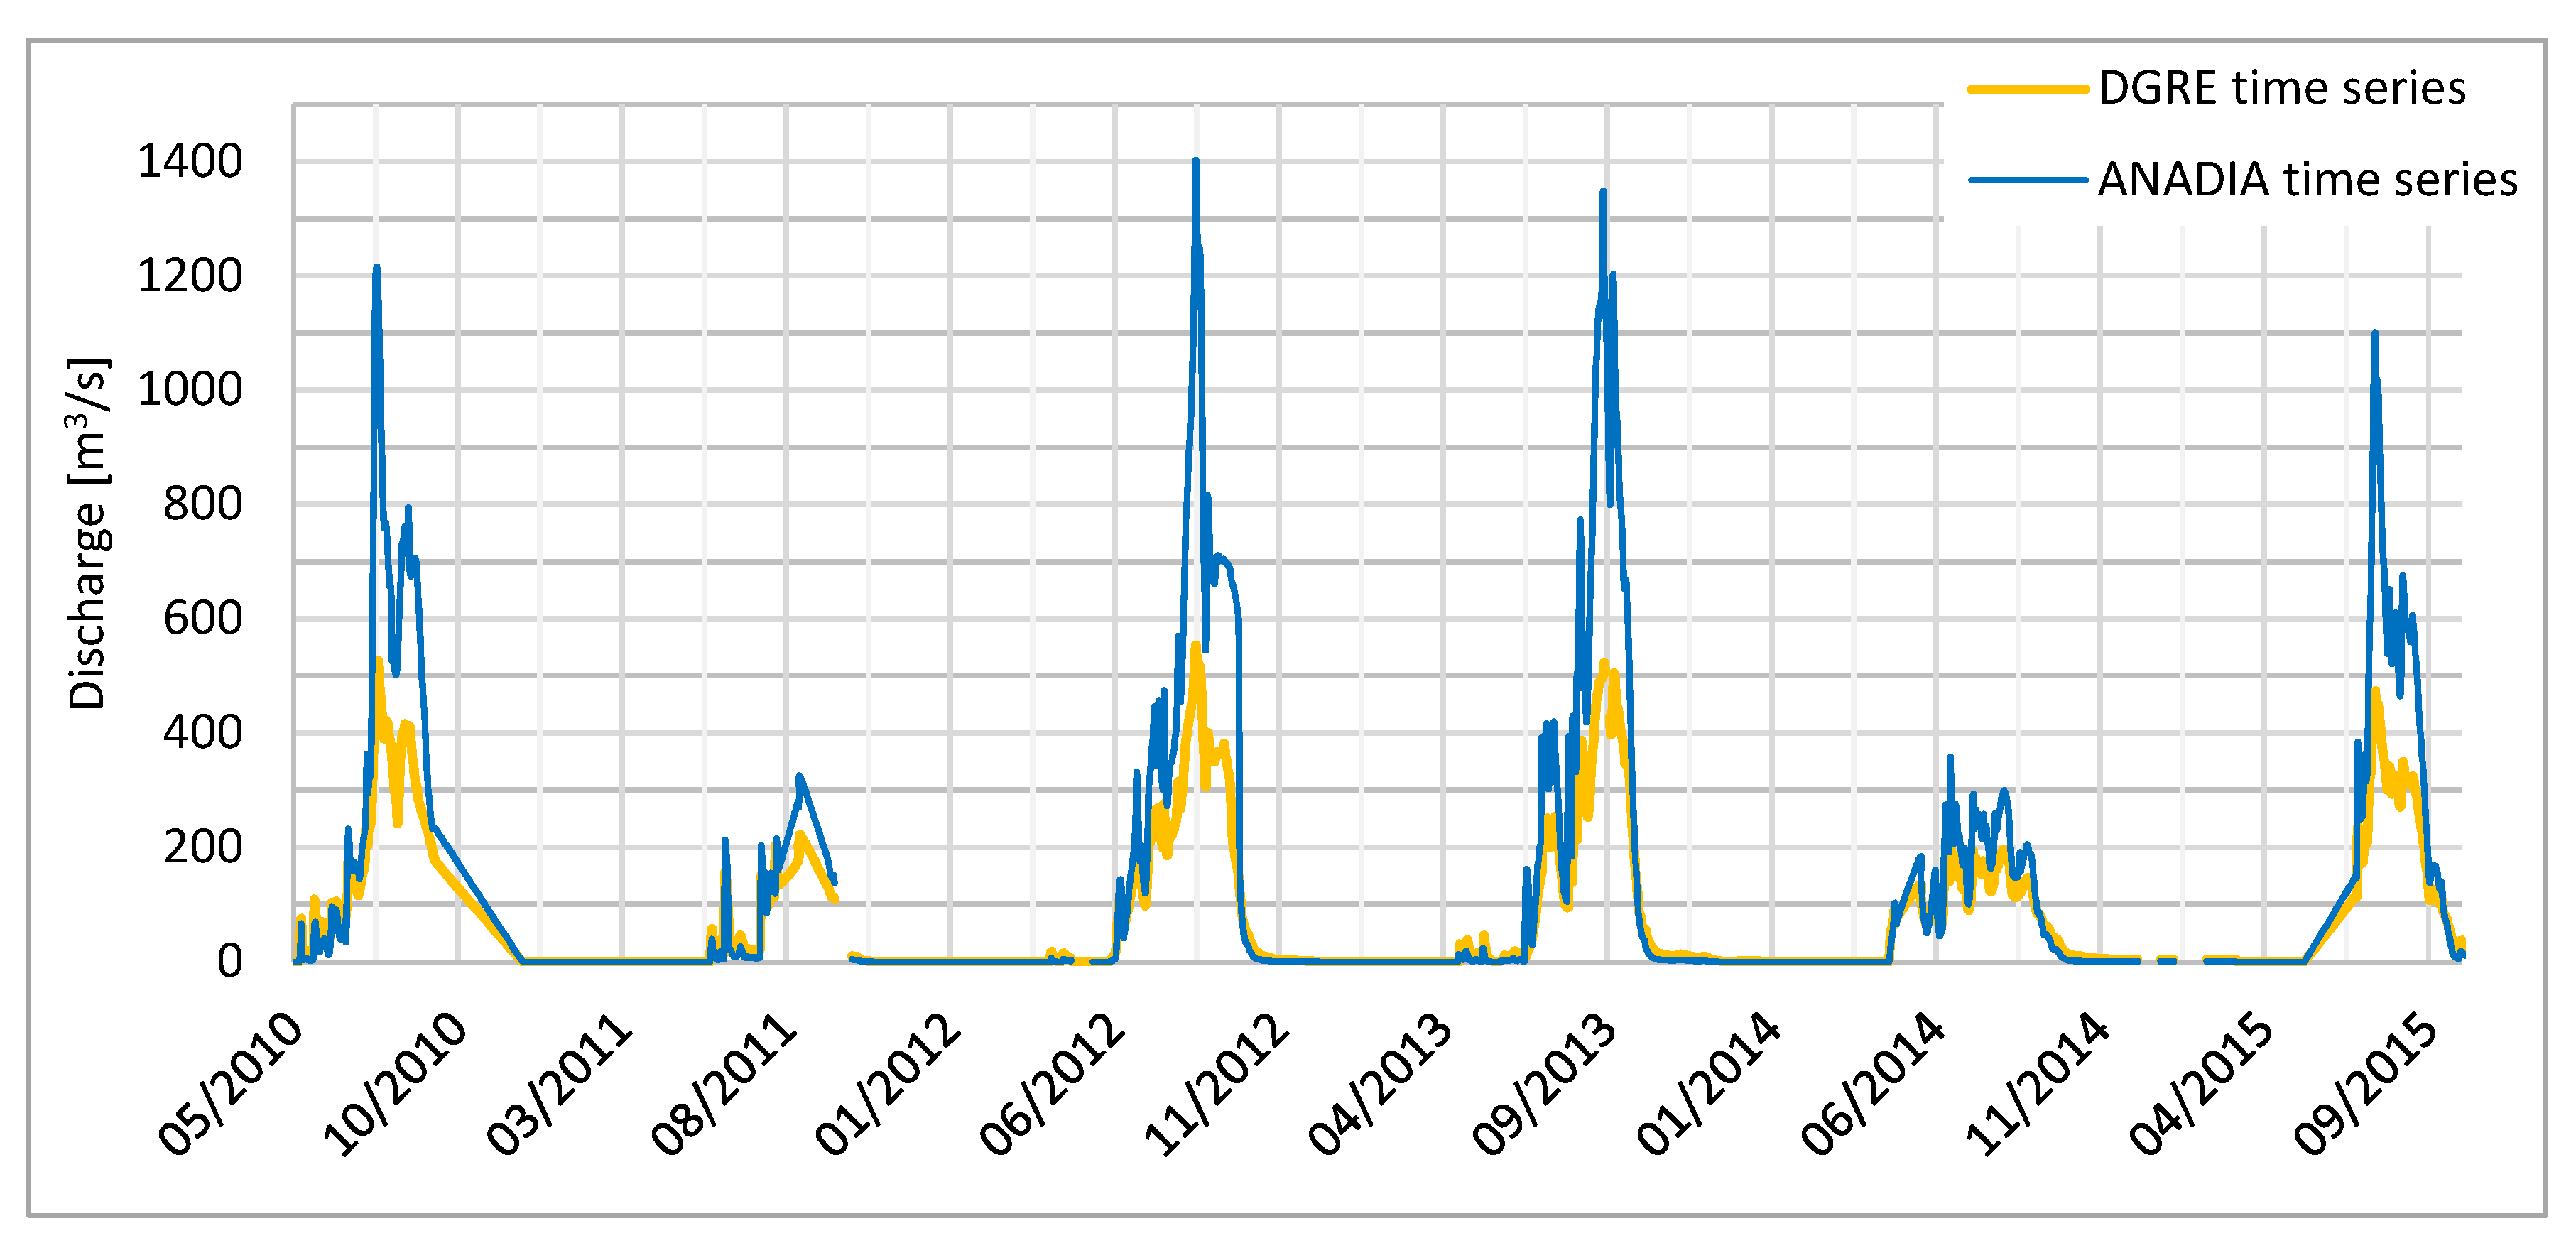
Considering the entire period of 1956–2018, and through the use of the new rating curves, every discharge concerning the observed river stage was recalculated, providing an updated time series of discharge (ANADIA time series). Observing Figure 2, some differences can be noticed. For the first period (1956–1978), the differences are almost negligible, except for stages above 400 cm. As regards the second period (1979–2003), the new rating curve (green solid line) shows a significantly different trend compared to the old curve (violet dotted line). For the last period (2004–2018), the updated RC (red solid line) is totally divergent for stages higher than 200 cm, leading to a marked increase of flow peaks in the updated time series (e.g., Figure 3). The substantial differences between these curves are explained by the consistent changes of the downstream cross-sections of the river. In particular, the progressive enlargement is due to flow erosion and constant digging activities. These morphological modifications affect the hydraulic behavior of the upstream cross-sections since the slight slope of the river bed determines a condition of subcritical flow for each value of discharge (Froude number <1). In the regime of subcritical flow, the behavior of an upstream reach is influenced by the downstream conditions. All these factors were investigated during land surveys and a hydraulic analysis of the project ANADIA 2.0.
The comparison between the two series shows an underestimation of more than 600 m3/s during the last four flood events in 2010, 2012, 2013, and 2015.
3.2. Discharge Verification: The Niger River Hydrograph
In order to assess the reliability of the previous results, a hydrological analysis outside of the study area was performed.
The recalibration of RCs led to an increase in flow calculation. This partially answered the question raised by the NBA of why the water balance between Kandadji and Niamey was positive after subtracting the discharge of the two main tributaries (Dargol and Sirba). This incongruence was also investigated by Descroix et al. [11], who identified the cause in a strong increase of runoff coefficients in the middle Niger River tributaries after the great drought.
A revision was carried out in the water balance of the last 11 years using the ANADIA time series. The analysis was performed considering the main gauging stations in the MNRB, where the mean discharge and the mean annual volume were computed for the period of 2007–2017. The water balance was calculated as the difference between the annual volume (Vannual) that flows at Niamey and the cumulative volume that flows through the upstream gauging stations of the Niger (Kandaji), Dargol (Kakassi), and Sirba (in Garbey Kourou) rivers. Table 4 shows the difference between the inflow volumes (evaluated with the DGRE and ANADIA time series) and the outflow volume at Niamey station. This difference changes from 3.04 km3 to 1.86 km3, i.e., 9.96% to 6.11% of the annual volume of the Niger River at Niamey, respectively.
Figure 4 displays the comparison between the water balance calculated with the DGRE and with the ANADIA discharge time series of the Sirba River for each year. The water balance remains positive, confirming an excess of volume at Niamey, except in 2013 when a weak deficit is detected. The reduction of the remaining water balance indicates how influential the revision of the Sirba River streamflow is. The major differences correspond to those years when extreme flooding events occurred, underlining the underestimation of those floods.
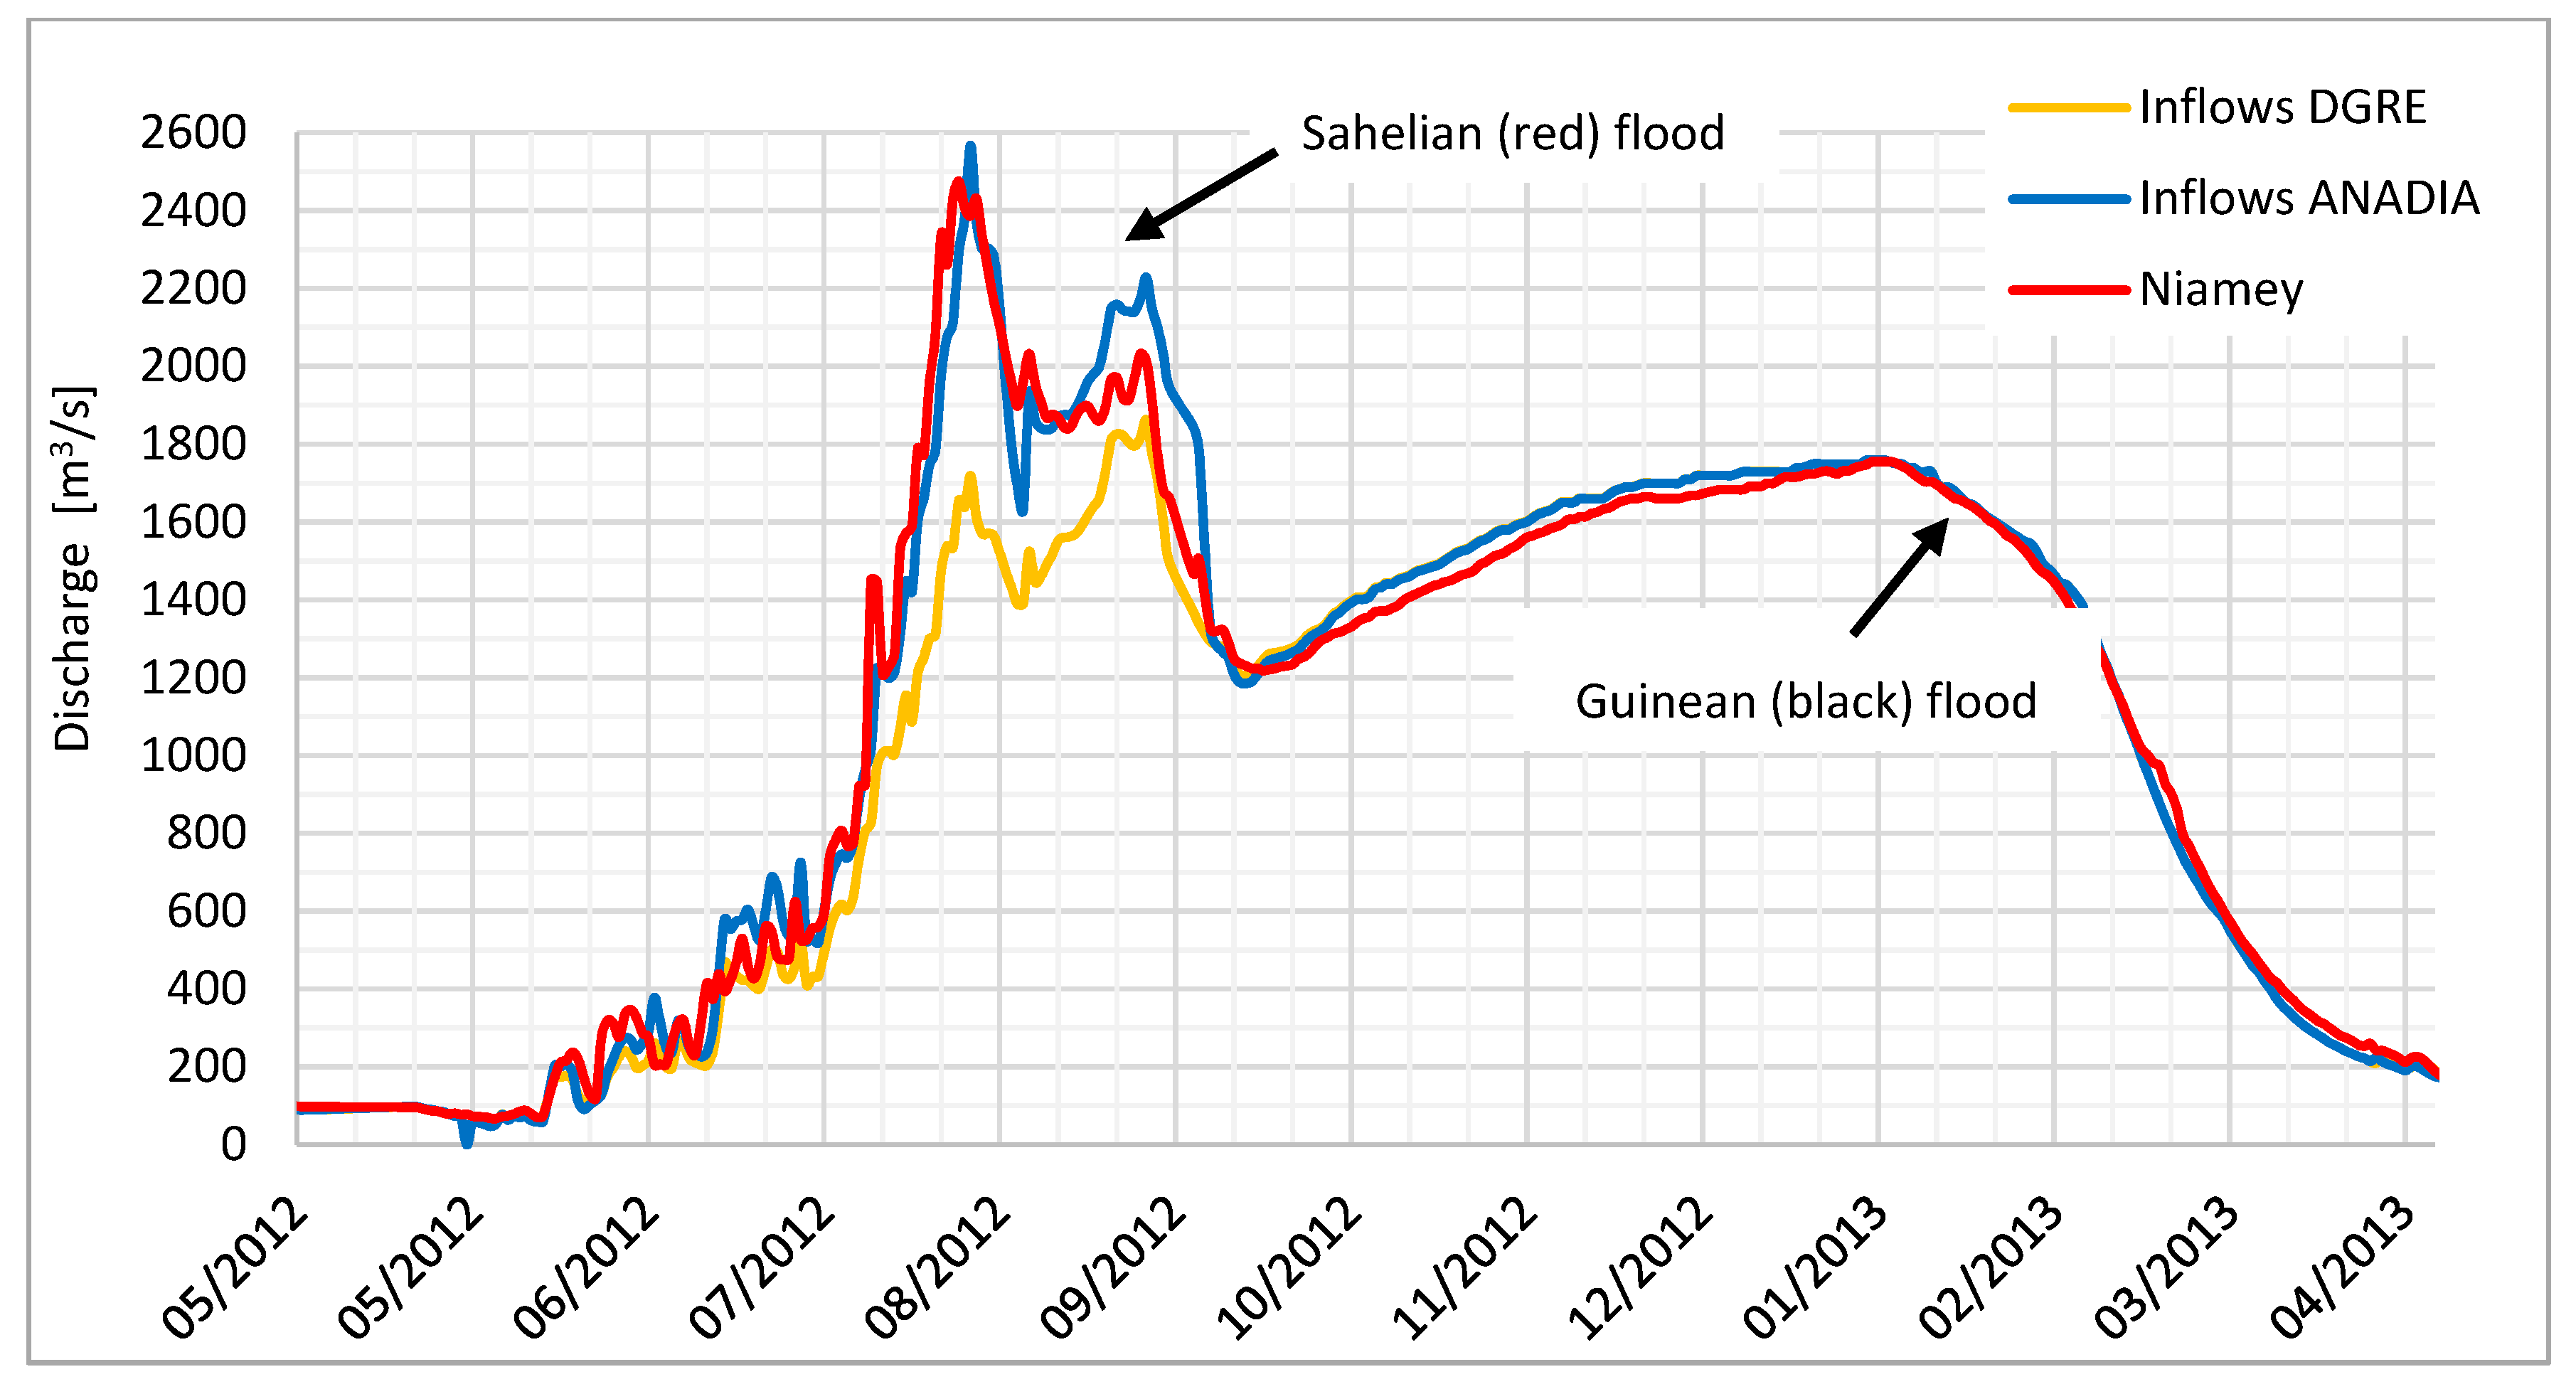
A further confirmation of the validity of the updated time series can be seen in Figure 5. This figure shows the correct correlation between the sum of the updated discharge deriving from the Niger Basin upstream from Niamey and the discharge measured at the capital city. The updated series fill the gap of the old time series, especially for the Sahelian flood (July–September), which becomes more clearly dependent on the upstream gauging stations. Possible deviations are attributed to losses (infiltration and evapotranspiration), discharges from small tributaries along the left bank of the Niger River, and the effect of flood retention areas. In Figure 5 it is possible to appreciate that in the Niamey gauging station, the effects of losses and flood retention are clearer during the Guinean flood, while the effects of other tributaries are predominant during the Sahelian flood.
Further work should involve an in-depth analysis of the rating curves in the other MNRB gauging stations, to investigate whether discrepancies affect the discharge calculation and to evaluate the significance of runoff due to minor tributaries.
3.3. River Flow Regime
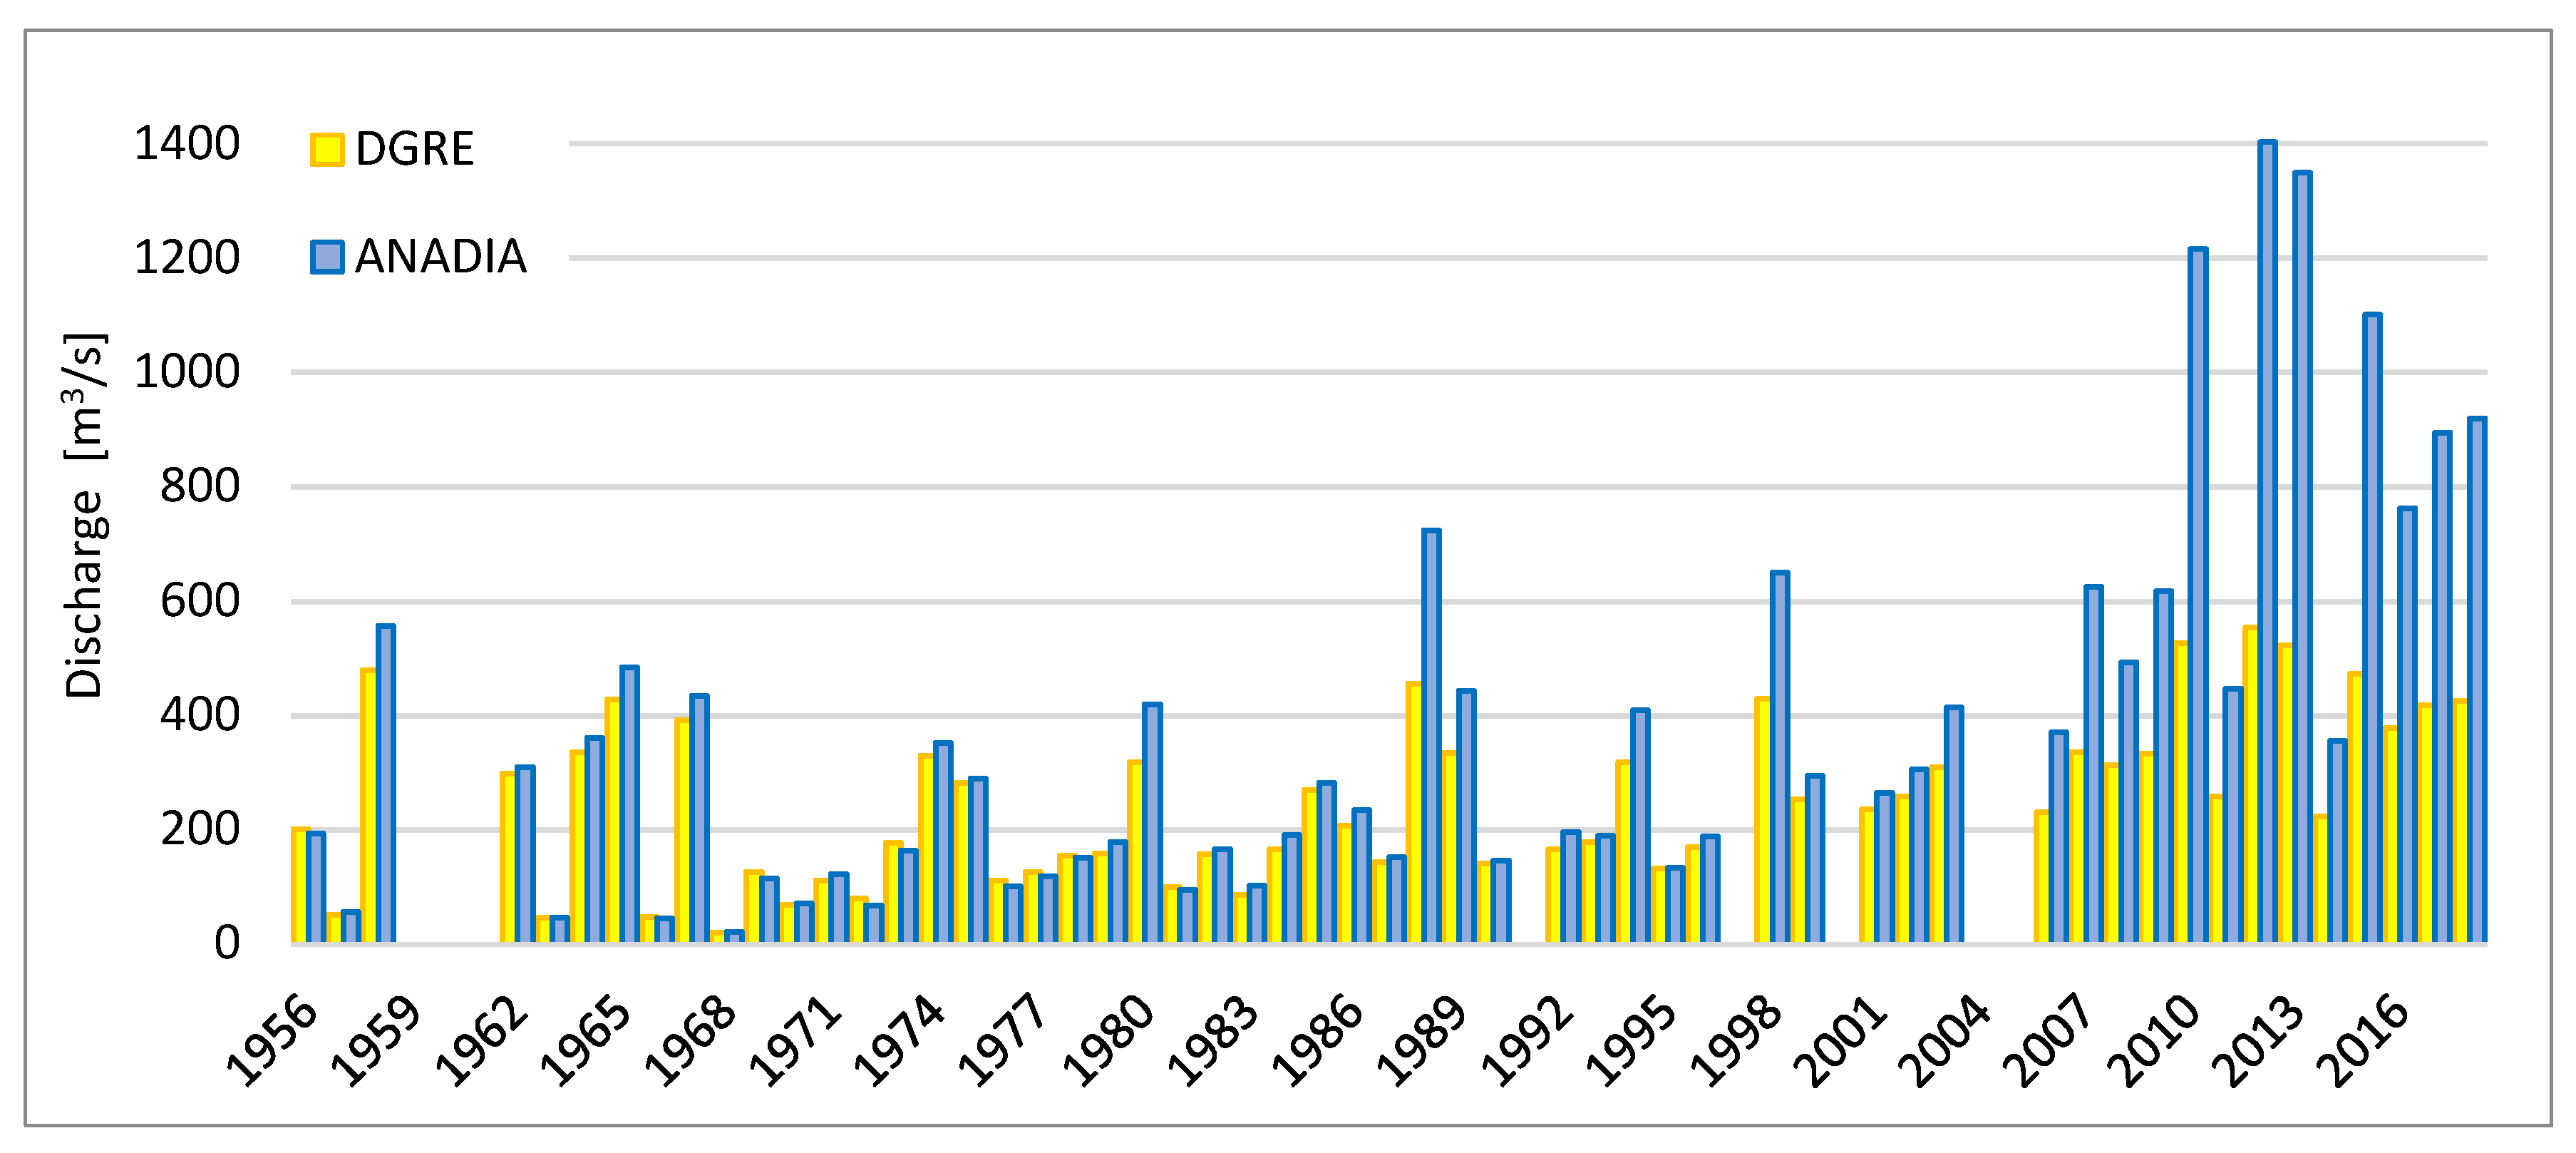
The new AMAX distribution is plotted in Figure 6 with the updated time series. This graph highlights the marked evolution of the flood magnitude over time.
The AMAX values were selected only from those years with no measurement gaps in the months from July to September. This evaluation makes the selection robust since flood peaks generated by rainfall events occur on average between the months of August and September [34]. Therefore, only 8 years were removed from the entire time series (1959–1961, 1991, 1997, 2000, 2004–2005).
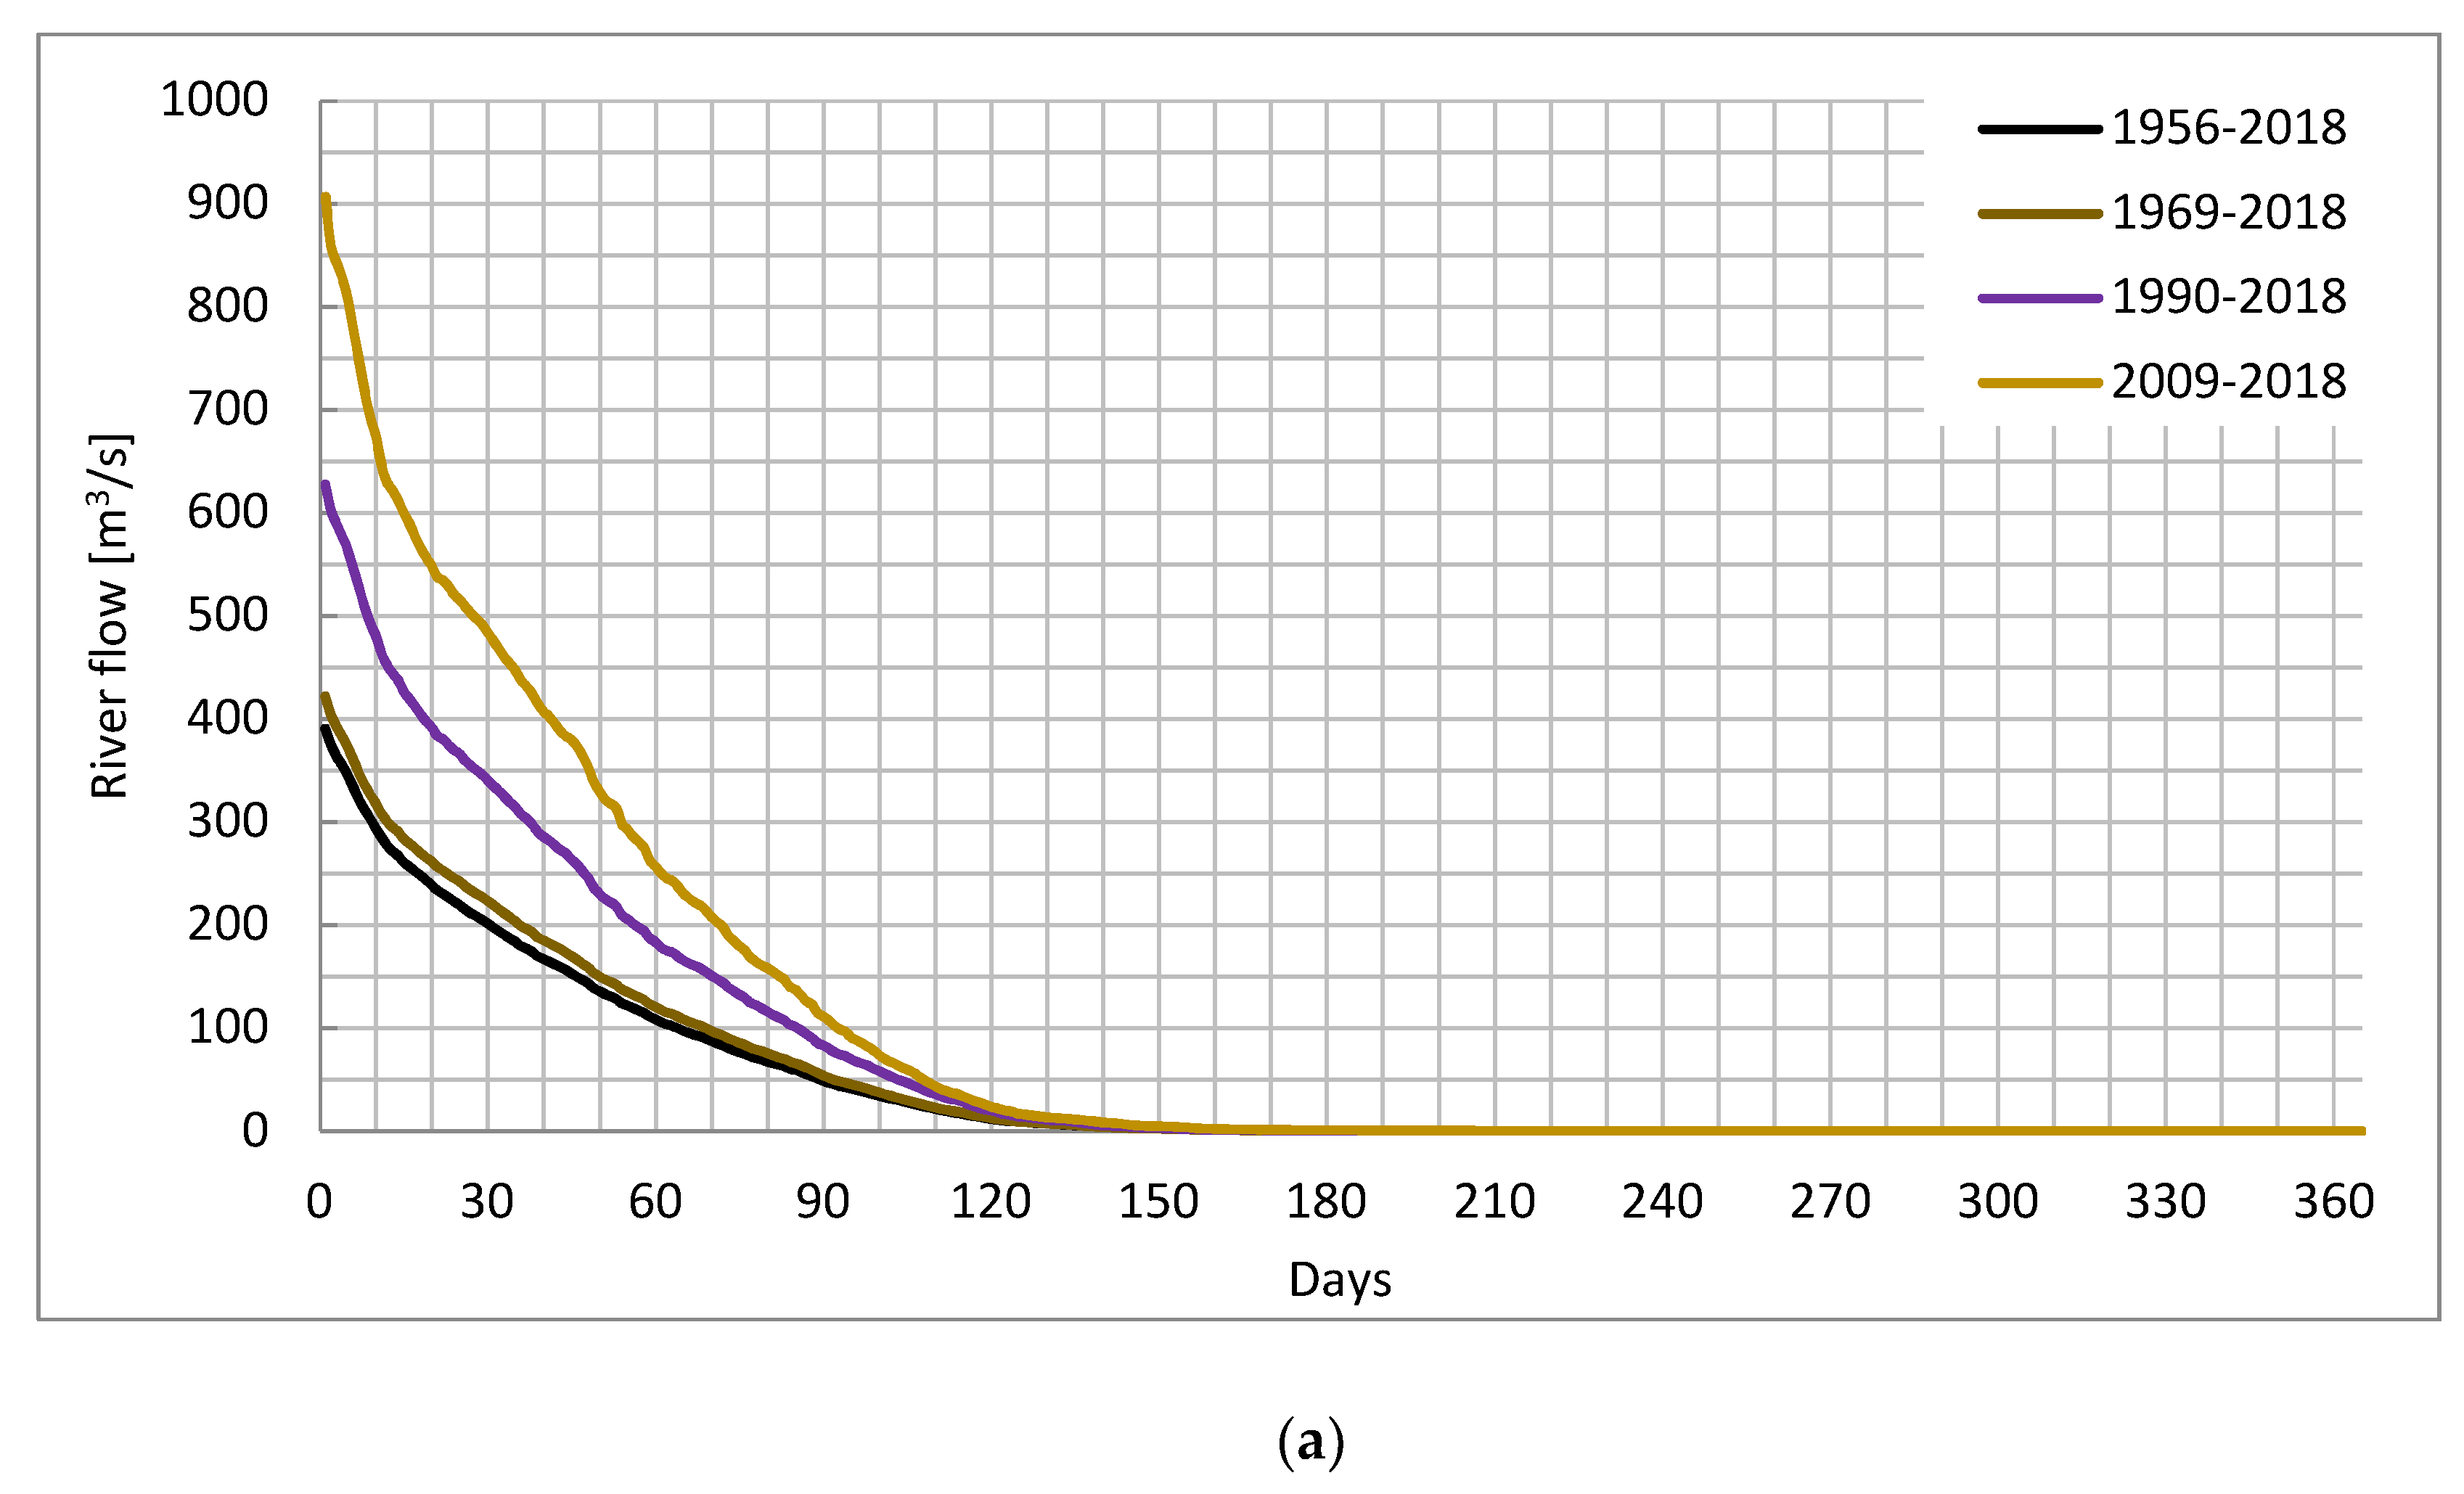
The AMAX series presents a clear non-stationary distribution with a markedly positive trend; in fact, three changepoints were detected in 1968, 1989, and 2008. These outcomes reflect those of Aich et al. and Bigi et al. [5,21], who found very similar changepoints from the wet period to the dry period (1968) and from the dry period to the recovery period (1989) both in the discharge and rainfall time series. Most notably, a new changepoint was detected (2008), representing the beginning of a new epoch where a dense series of extreme floods was observed. This point represents a new change in the discharge pattern, in line with the increase of extreme daily rainfall occurrence [18]. The study of Panthou et al. [2] analyzed the rainfall regime and discovered an increase in extreme and heavy rainfall frequency over the last three decades, essentially due to the climate changes after the great drought. The increment in discharge amount is also supported by the increasing runoff coefficient in the Sirba basin, which is directly correlated to the transformation of land use and land cover over the entire analyzed area [4]. In order to better understand the variability of the Sirba streamflow, the updated time series was used to evaluate the water resource variability through the FDC. Since the FDC is extremely influenced by the period of record chosen to calculate it, in this work we calculated a set of FDCs with different ranges of recorded discharges (Table 5). The analysis was performed with a twofold aim:
- To assess the evolution over time—the first FDC was calculated for the entire period of analysis while other curves cover different periods in accordance with the detected changepoints;
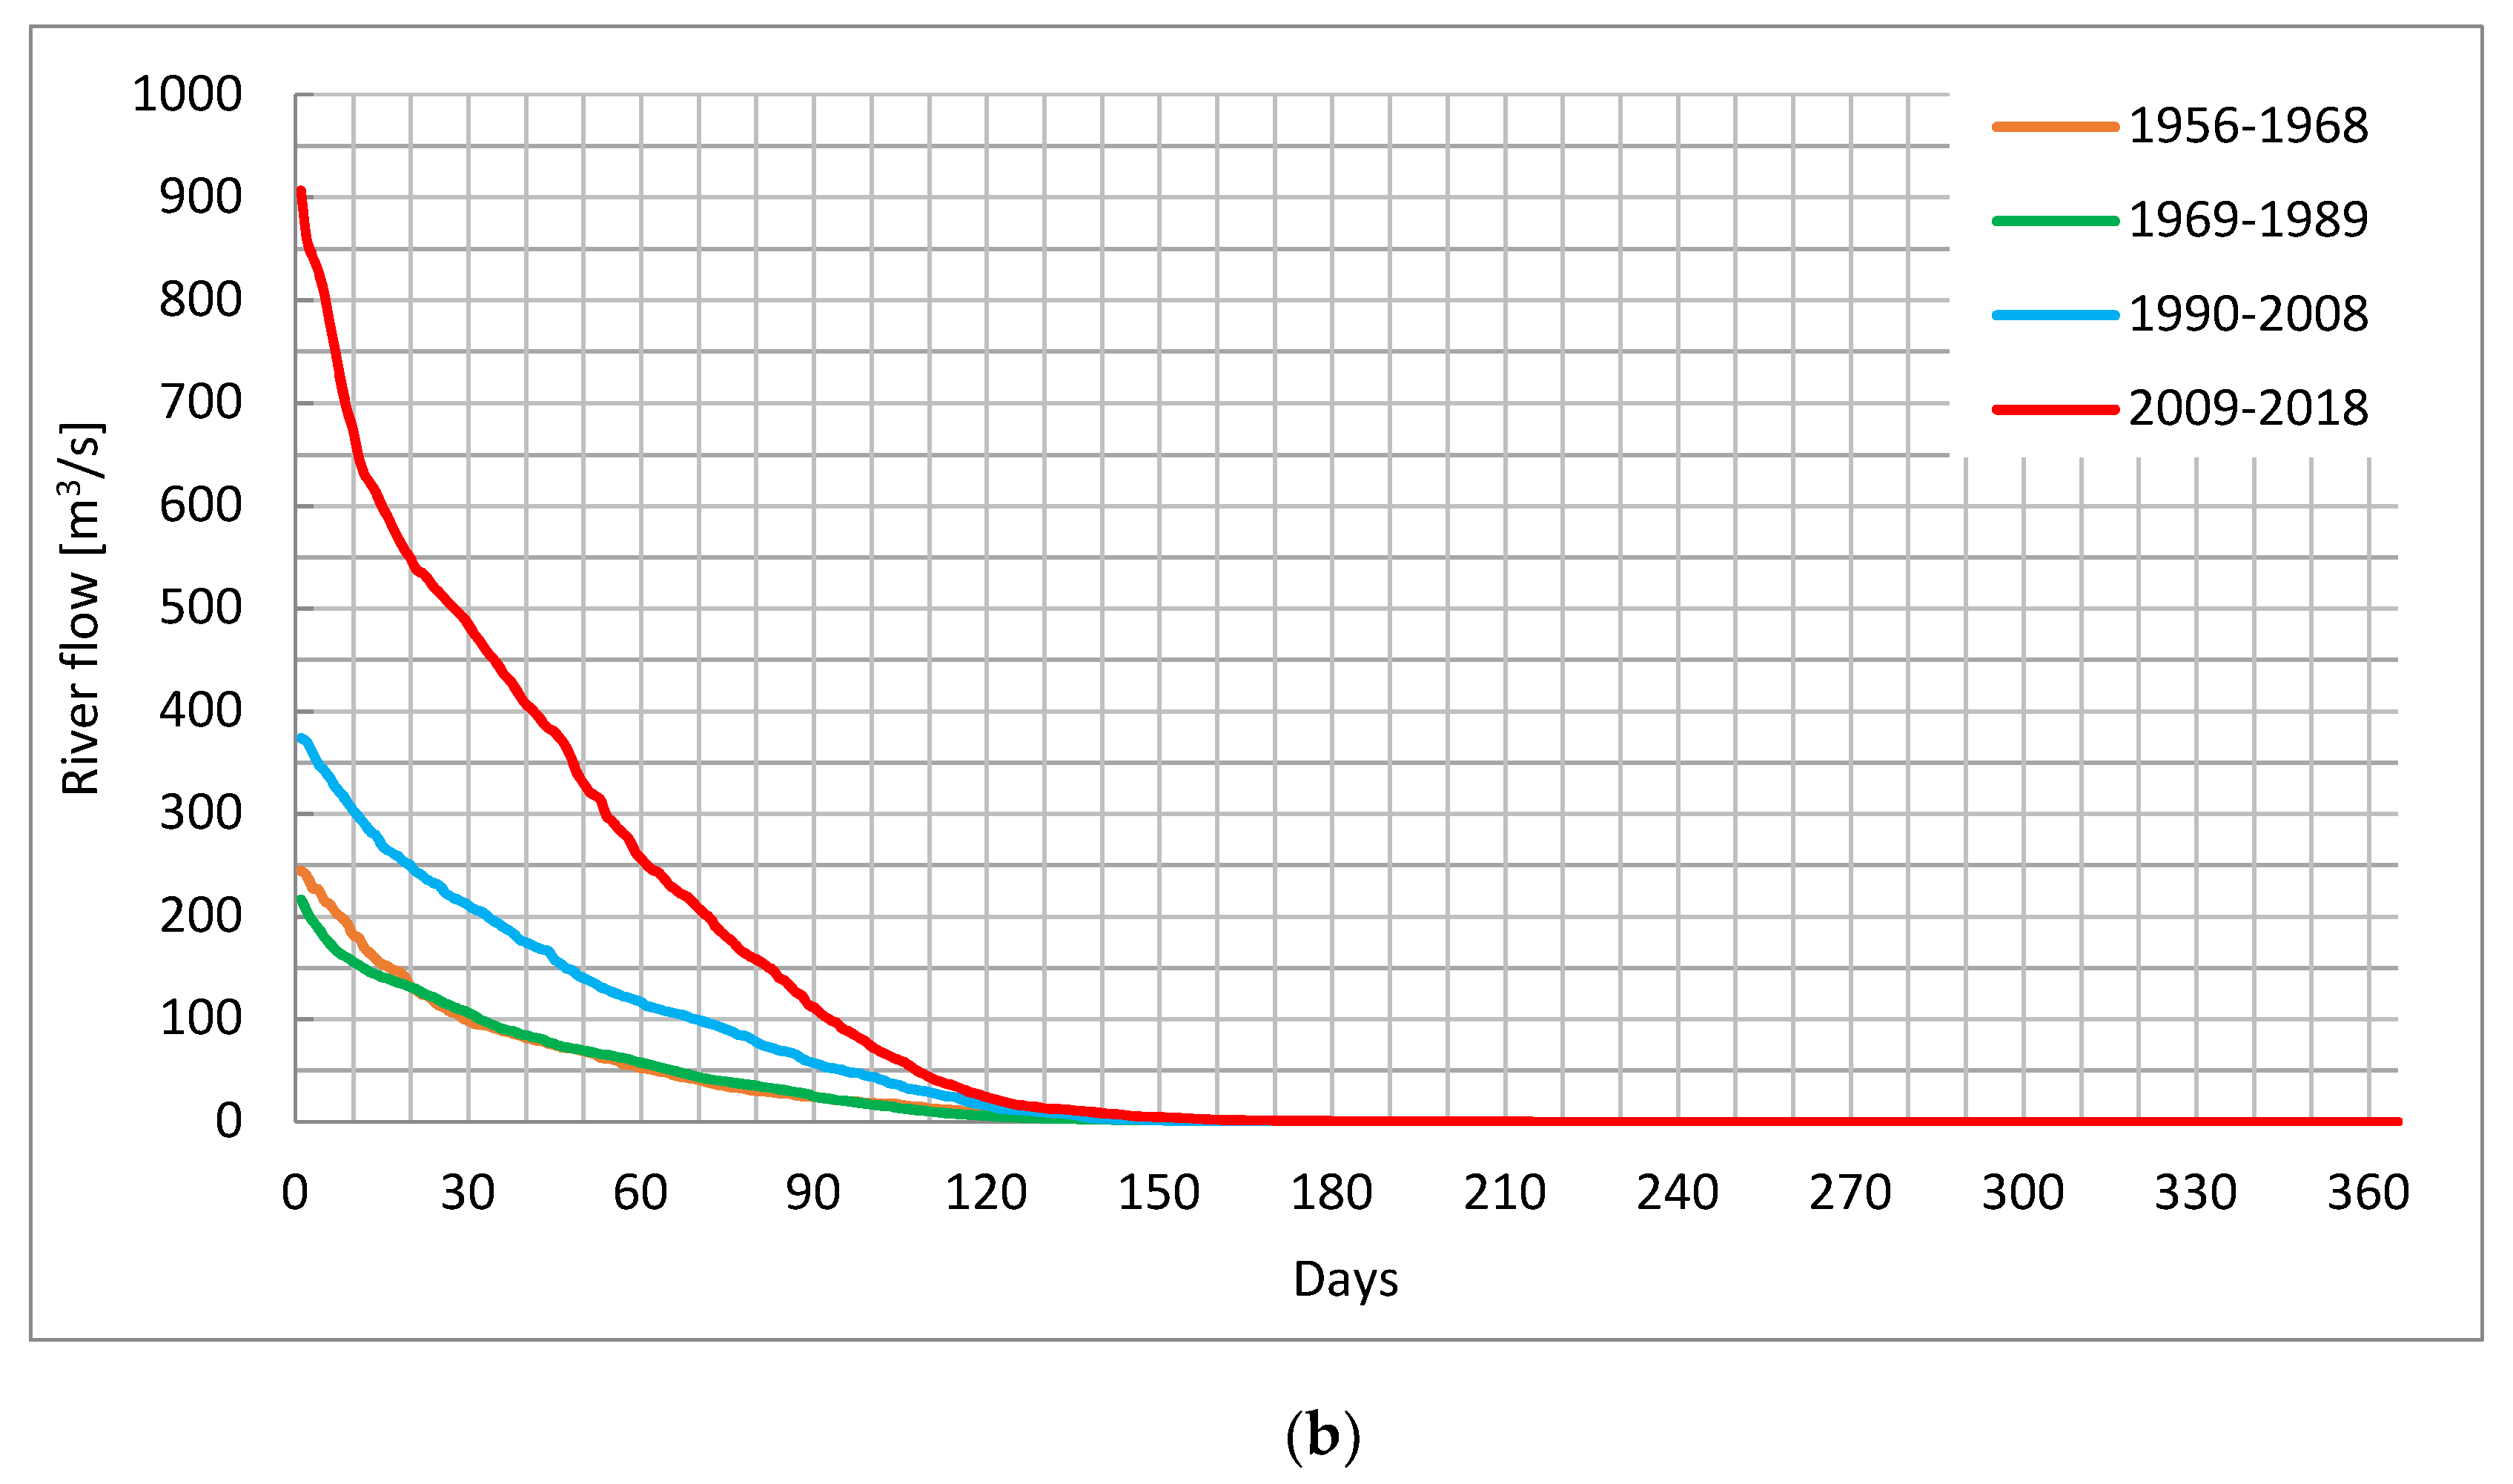
- To assess the river behavior during each period.
The evolution depicted in Figure 7a shows a significant increase in the magnitude and frequency of high discharge in the past decades, which is consistent with other recent studies [1,4]. The value of Qn changed drastically over the different periods due to the relevant changes in the discharge pattern.
Figure 7b evidences that the differences between the wet period (until 1968) and the dry period (the following 30 years) can be observed mainly for a high Qn with n < 20. The lowest curve of the dry period is fully in line with the dry period rainfall pattern. An increase of almost 240% over the last three decades was noticed when comparing the average of the annual maximum discharge (see Q1 in Table 6). This trend reflects the increasing occurrences of extreme flood that affect an exponential number of people in the whole Middle Niger region [6].
3.4. Trend Analysis
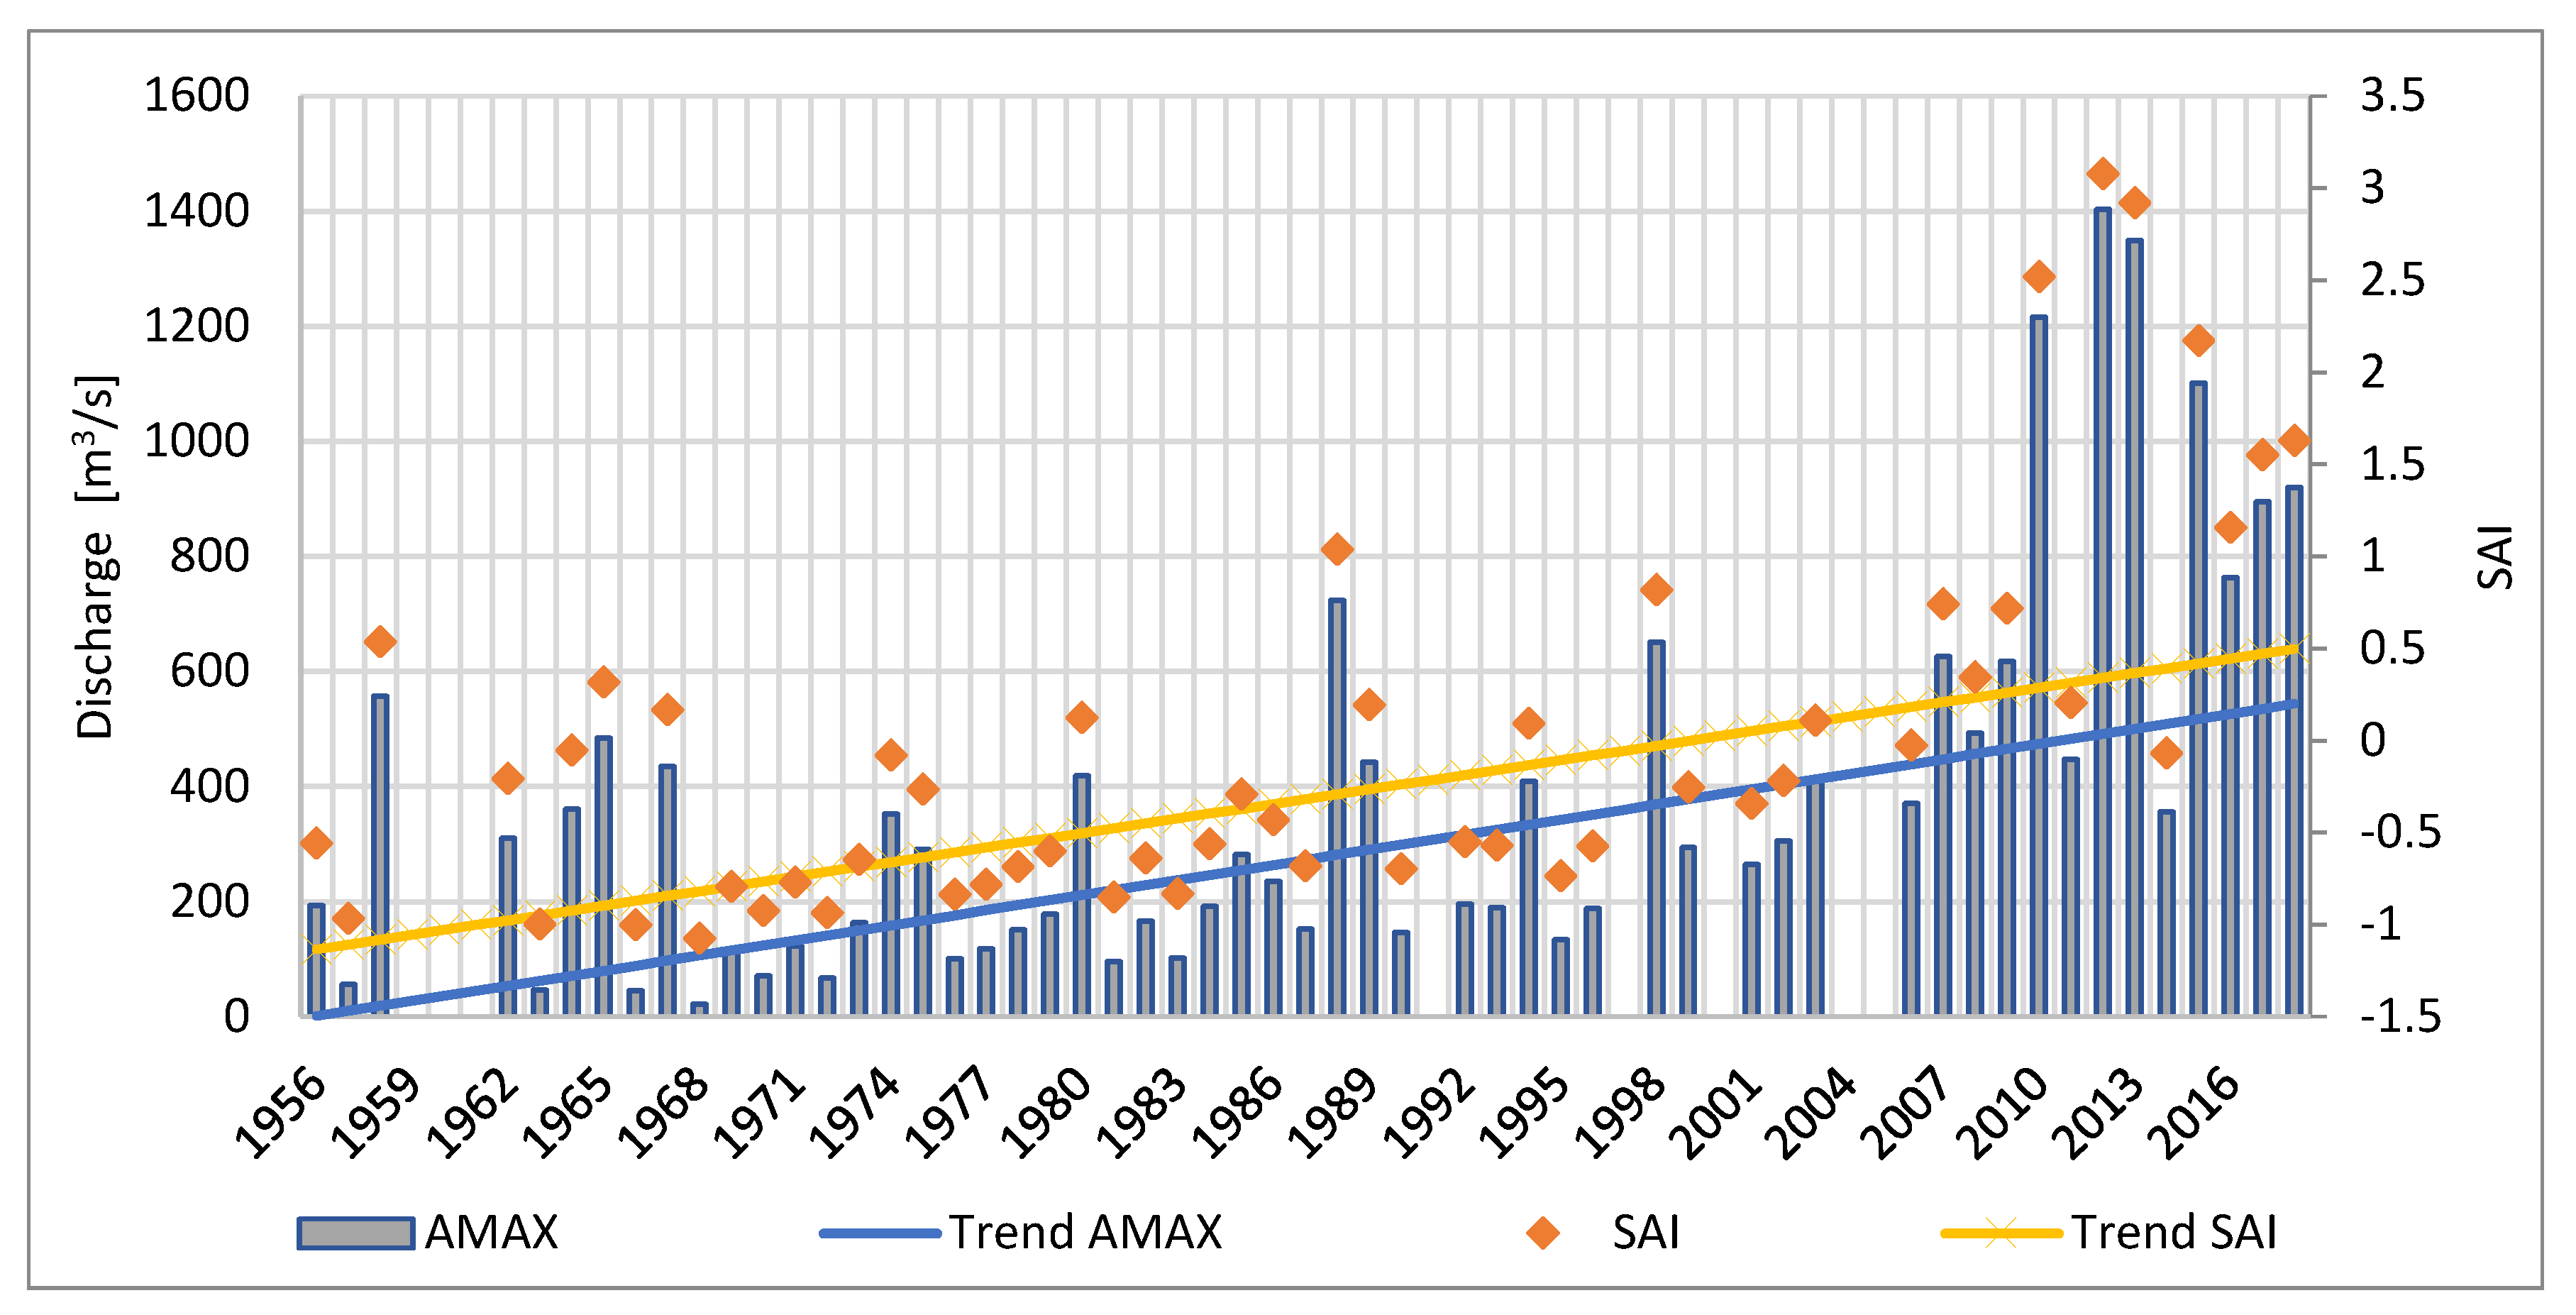
A positive monotonic linear trend in the AMAX series was detected and a slope of 8.75 was estimated with the Sen approach (statistical significance α = 0.001). A similar result was obtained with the anomaly series with a positive slope of 0.03 (Figure 8). This positive trend over the entire period evidences that the increase in flood magnitude is not in line with the rainfall trend, given that a decrease in total precipitation over the last 70 years has been observed. This opposite pattern is referred to as the Sahelian Paradox.
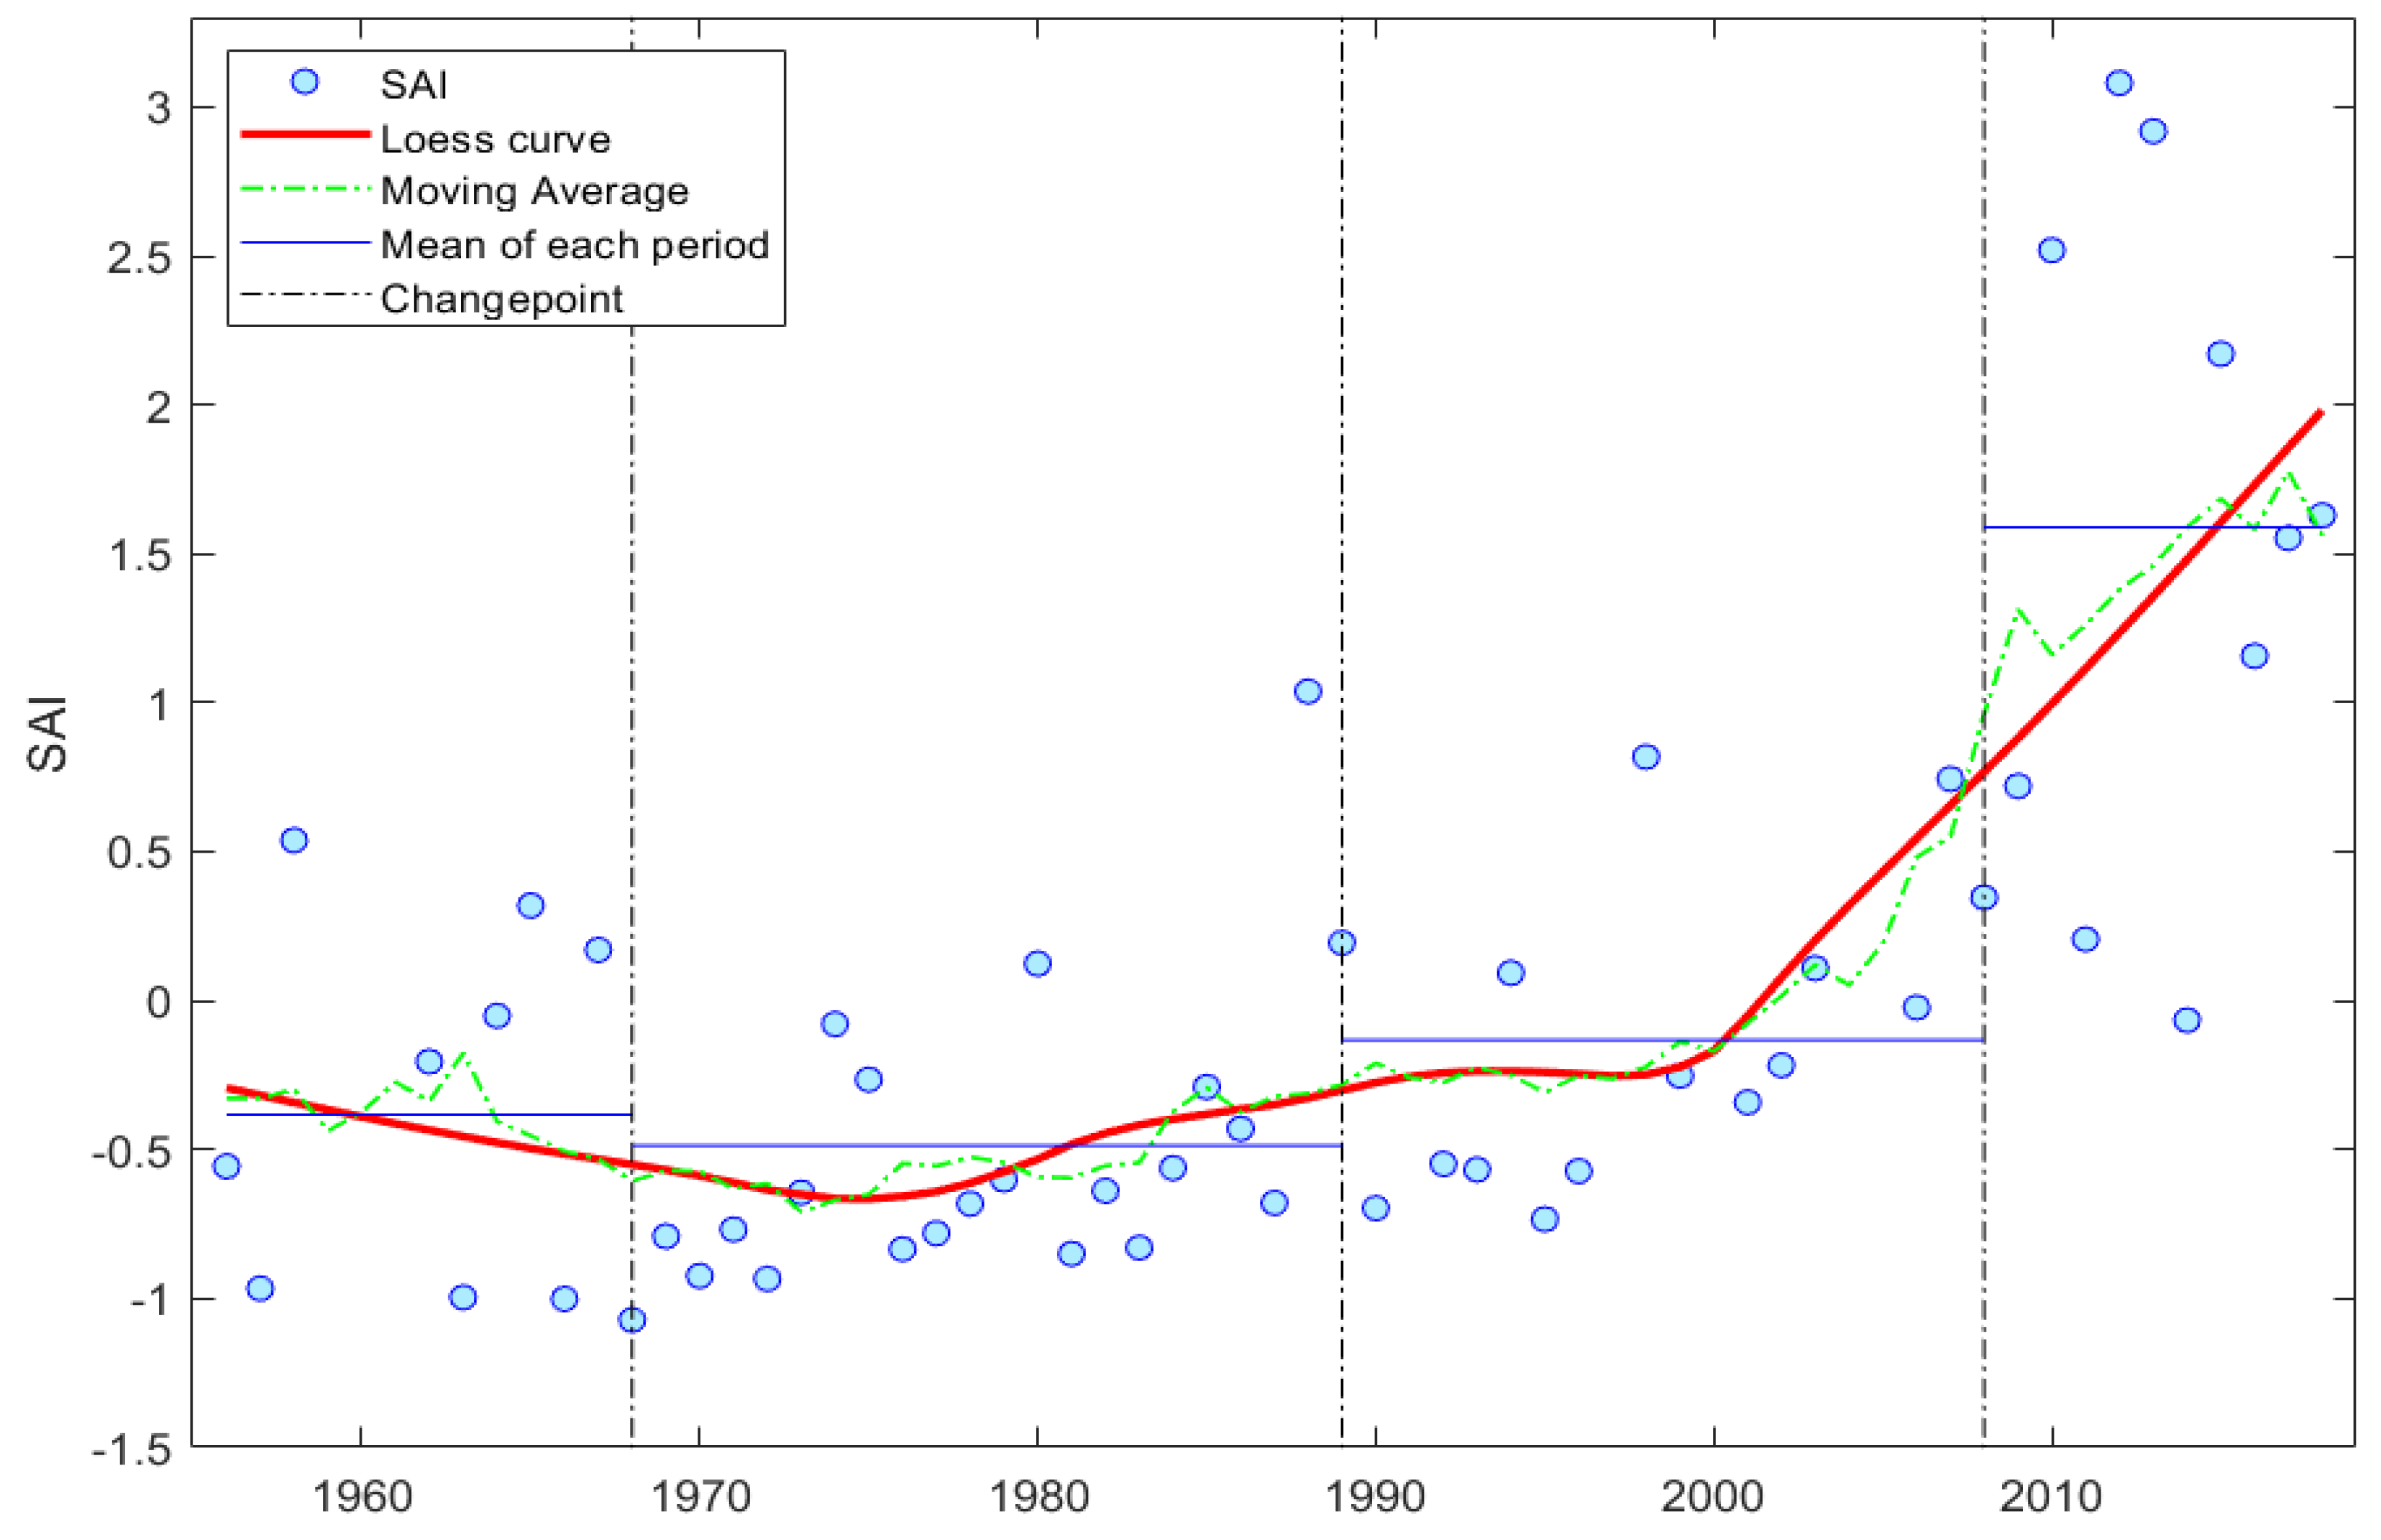
Considering the distribution of anomalies, a marked difference with previous studies can be found. In fact, even the SAI figures of the wet period are negative, since the mean discharge strongly increases when the AMAX of the last years are taken into account, which are the highest recorded discharges over the entire analyzed period [1].
The Loess curve in Figure 9 shows a fluctuation between −0.7 and −0.2 until the end of the last century, followed by a significant positive trend. The high frequency of the extreme floods in the last years delineates a new flood pattern. This pattern is also confirmed by superimposing the moving average line on the Loess curve.
4. Conclusions
Considering the great attention that flood hazard and flood risk management in Sahelian countries have attracted, the present study was designed to enhance the reliability of flood information by revising discharge data of the Sirba River, the main tributary of Niger River in the MNRB. The present work identified a lack of accuracy in the transformation from the hydraulic stage to streamflow. A set of reviewed rating curves were first calculated for the gauging station of Garbey Kourou. Secondly, a new discharge time series was provided, which allowed the update of the existing databases managed by the NBA and DGRE. The updated time series will be the starting point for future hydraulic and hydrological researches in the central Sahel. Reliable data are also the key point to improve hydrological modeling accuracy and provide significant results by the analyses performed at regional and sub-regional scales. A hydrological evaluation was carried out to analyze the water balance at Niamey, which became more consistent with the measurements of the upstream gauging stations.
Moreover, this study highlighted the importance of verifying the quality of datasets both for decision-makers and the scientific community. More effort should be made to strengthen the reliability of data, in order to increase on-site measurements and keep control systems updated (e.g., rating curves).
The FDC evaluation in the river flow regime analysis showed a greater amount of streamflow since 1990, mainly explained by the increasing surface runoff in the whole area. This result is associated with the annual rainfall recovery of the past decades and with the reduction of the infiltration capacity of the soil [18]. Unfortunately, the higher magnitude of AMAX in recent years has led to many problems in terms of flood disasters as well as to an increase in the number of people affected by flooding events. We confirmed the positive trend in flood magnitude and flood occurrence, contributing to the existing literature with an updated time series analysis of discharges.
The results of the trend analysis emphasized how the annual maximum discharge trend is clearly positive and is likely to increase in frequency and intensity in coming years. This thesis is supported by the ongoing land cover transformation due to the high population growth rate and the resulting necessity to modify the territory to produce more food. Furthermore, since climate change is one of the drivers of this phenomenon, certain studies have found that climatological projections predict a slight increase in future precipitation [21]. Thus, these results should be used to develop targeted interventions aimed at flood mitigation and prevention.
Author Contributions
P.T.: methodology, on-site measurements, analysis and elaboration of data, writing—original draft; G.M.: methodology, data collection, on-site measurements, analysis and elaboration of data, writing—review and editing; M.R.: methodology, supervision, validation, writing—review and editing; A.P.: supervision, validation, writing—review and editing.
Funding
This research was funded by the ANADIA-Niger Project (Adaptation to climate change, disaster prevention and agricultural development for food security) by the Italian Agency for Development Cooperation, the Institute of Biometeorology of the National Research Council of Italy (IBIMET_CNR), the Interuniversity Department of Regional and Urban Studies and Planning of the Polytechnic and University of Turin (DIST-POLITO), the Directorate National for Meteorology of Niger (DMN), and the Directorate for Hydrology of Niger (DH).
Acknowledgments
The authors would like to thank the Italian Agency for Development Cooperation for supporting the ANADIA 2.0 project and the actions that allowed the development of this assessment. We are thankful to Vieri Tarchiani (Ibimet CNR) and Maurizio Tiepolo (DIST Politecnico di Torino) for supporting field activities. We would like to express our deepest gratitude to Mohamed Housseini Ibrahim (Directorate for Hydrology, Ministry of Hydraulics and Sanitation) for the data collection and datasets provision and the Niger Basin Authority, who provided data.
Conflicts of Interest
The authors declare no conflict of interest.
References
- Aich, V.; Koné, B.; Hattermann, F.F.; Paton, E.N. Time series analysis of floods across the Niger River Basin. Water Switz. 2016, 8, 165. [Google Scholar] [CrossRef]
- Panthou, G.; Vischel, T.; Lebel, T. Recent trends in the regime of extreme rainfall in the Central Sahel. Int. J. Climatol. 2014, 34, 3998–4006. [Google Scholar] [CrossRef] [Green Version]
- Amogu, O.; Descroix, L.; Yéro, K.S.; Le Breton, E.; Mamadou, I.; Ali, A.; Vischel, T.; Bader, J.-C.; Moussa, I.B.; Gautier, E.; et al. Increasing River Flows in the Sahel? Water 2010, 2, 170–199. [Google Scholar] [CrossRef] [Green Version]
- Descroix, L.; Genthon, P.; Amogu, O.; Rajot, J.L.; Sighomnou, D.; Vauclin, M. Change in Sahelian Rivers hydrograph: The case of recent red floods of the Niger River in the Niamey region. Glob. Planet. Chang. 2012, 98–99, 18–30. [Google Scholar] [CrossRef]
- Aich, V.; Liersch, S.; Vetter, T.; Andersson, J.C.M.; Müller, E.N.; Hattermann, F.F. Climate or land use?—Attribution of changes in river flooding in the Sahel zone. Water Switz. 2015, 7, 2796–2820. [Google Scholar] [CrossRef]
- Fiorillo, E.; Crisci, A.; Issa, H.; Maracchi, G.; Morabito, M.; Tarchiani, V. Recent Changes of Floods and Related Impacts in Niger Based on the ANADIA Niger Flood Database. Climate 2018, 6, 59. [Google Scholar] [CrossRef]
- Tarhule, A. Damaging Rainfall and Flooding: The Other Sahel Hazards. Clim. Chang. 2005, 72, 355–377. [Google Scholar] [CrossRef]
- Lebel, T.; Ali, A. Recent trends in the Central and Western Sahel rainfall regime (1990–2007). J. Hydrol. 2009, 375, 52–64. [Google Scholar] [CrossRef]
- Le Barbé, L.; Lebel, T. Rainfall climatology of the HAPEX-Sahel region during the years 1950–1990. J. Hydrol. 1997, 188–189, 43–73. [Google Scholar]
- Nicholson, S. On the question of the “recovery” of the rains in the West African Sahel. J. Arid Environ. 2005, 63, 615–641. [Google Scholar] [CrossRef]
- Descroix, L.; Bouzou, I.; Genthon, P.; Sighomnou, D.; Mahe, G.; Mamadou, I.; Vandervaere, J.-P.; Gautier, E.; Faran, O.; Rajot, J.-L.; et al. Impact of Drought and Land–Use Changes on Surface–Water Quality and Quantity: The Sahelian Paradox. Curr. Perspect. Contam. Hydrol. Water Resour. Sustain. 2013. [Google Scholar] [CrossRef]
- Descroix, L. Processus et Enjeux d’eau en Afrique de l’Ouest Soudano-Sahélienne; Editions des archives contemporaines: Paris, France, 2018; ISBN 978-2-8130-0314-0. [Google Scholar]
- Aich, V.; Koné, B.; Hattermann, F.F.; Müller, E.N. Floods in the Niger basin — analysis and attribution. Nat. Hazards Earth Syst. Sci. Discuss. 2014, 2, 5171–5212. [Google Scholar] [CrossRef]
- Casse, C.; Gosset, M.; Vischel, T.; Quantin, G.; Tanimoun, B.A. Model-based study of the role of rainfall and land use-land cover in the changes in the occurrence and intensity of Niger red floods in Niamey between 1953 and 2012. Hydrol. Earth Syst. Sci. 2016, 20, 2841–2859. [Google Scholar] [CrossRef]
- Leblanc, M.J.; Favreau, G.; Massuel, S.; Tweed, S.O.; Loireau, M.; Cappelaere, B. Land clearance and hydrological change in the Sahel: SW Niger. Glob. Planet. Chang. 2008, 61, 135–150. [Google Scholar] [CrossRef]
- Séguis, L.; Cappelaere, B.; Milési, G.; Peugeot, C.; Massuel, S.; Favreau, G. Simulated impacts of climate change and land-clearing on runoff from a small Sahelian catchment. Hydrol. Process. 2004, 18, 3401–3413. [Google Scholar] [CrossRef]
- Sighomnou, D.; Descroix, L.; Genthon, P.; Mahé, G.; Moussa, I.B.; Gautier, E.; Mamadou, I.; Vandervaere, J.P.; Bachir, T.; Coulibaly, B.; et al. La crue de 2012 à Niamey: Un paroxysme du paradoxe du Sahel? Sci. Chang. Planetaires-Secheresse 2013, 24, 3–13. [Google Scholar]
- Descroix, L.; Guichard, F.; Grippa, M.; Lambert, L.; Panthou, G.; Mahé, G.; Gal, L.; Dardel, C.; Quantin, G.; Kergoat, L.; et al. Evolution of Surface Hydrology in the Sahelo-Sudanian Strip: An Updated Review. Water 2018, 10, 748. [Google Scholar] [CrossRef]
- Mamadou, I.; Gautier, E.; Descroix, L.; Noma, I.; Bouzou Moussa, I.; Faran Maiga, O.; Genthon, P.; Amogu, O.; Malam Abdou, M.; Vandervaere, J.P. Exorheism growth as an explanation of increasing flooding in the Sahel. Catena 2015, 131, 130–139. [Google Scholar] [CrossRef]
- Nka, B.N.; Oudin, L.; Karambiri, H.; Paturel, J.E.; Ribstein, P. Trends in floods in West Africa: Analysis based on 11 catchments in the region. Hydrol. Earth Syst. Sci. 2015, 19, 4707–4719. [Google Scholar] [CrossRef]
- Bigi, V.; Pezzoli, A.; Rosso, M. Past and Future Precipitation Trend Analysis for the City of Niamey (Niger): An Overview. Climate 2018, 6, 73. [Google Scholar] [CrossRef]
- Tiepolo, M.; Tarchiani, V. Risque et Adaptation Climatique Dans la Région Tillabéri, Niger; L’Harmattan: Paris, France, 2016; ISBN 978-2-343-08493-0. [Google Scholar]
- Brunet-More, Y.; Chaperon, P.; Lamagat, J.P.; Molinier, M. Monographie Hydrologique Du Fleuve Niger; Food and Agriculture Organization: Rome, Italy, 1986; ISBN 2709907909. [Google Scholar]
- Herschy, R.W. Streamflow Measurement; Chapman & Hall: London, UK, 1995. [Google Scholar]
- Leboutillier, D.W.; Waylen, P. Regional variations in flow-duration curves for rivers in British Columbia, Canada. Phys. Geogr. 1993, 14, 359–378. [Google Scholar] [CrossRef]
- Wang, X.L.; Wen, Q.H.; Wu, Y. Penalized Maximal t Test for Detecting Undocumented Mean Change in Climate Data Series. J. Appl. Meteorol. Climatol. 2007, 46, 916–931. [Google Scholar] [CrossRef]
- Wang, X.L. Accounting for Autocorrelation in Detecting Mean Shifts in Climate Data Series Using the Penalized Maximal t or F Test. J. Appl. Meteorol. Climatol. 2008, 47, 2423–2444. [Google Scholar] [CrossRef]
- Kraus, E.B. Subtropical Droughts and Cross-Equatorial Energy Transports. Mon. Weather Rev. 1977, 105, 1009–1018. [Google Scholar] [CrossRef] [Green Version]
- Katz, R.W.; Glantz, M.H. Anatomy of a Rainfall Index. Mon. Weather Rev. 1986, 114, 764–771. [Google Scholar] [CrossRef] [Green Version]
- Jaranilla-Sanchez, P.A.; Wang, L.; Koike, T. Modeling the hydrologic responses of the Pampanga River basin, Philippines: A quantitative approach for identifying droughts. Water Resour. Res. 2011, 47. [Google Scholar] [CrossRef] [Green Version]
- Babatolu, J.S.; Akinnubi, R.T. Surface Temperature Anomalies in the River Niger Basin Development Authority Areas, Nigeria. Atmos. Clin. Sci. 2013, 3, 532–537. [Google Scholar] [CrossRef]
- Cleveland, W.S.; Devlin, S.J. Locally Weighted Regression: An Approach to Regression Analysis by Local Fitting. J. Am. Stat. Assoc. 1988, 83, 596–610. [Google Scholar] [CrossRef]
- Salmi, T.; Määttä, A.; Anttila, P.; Ruoho-Airola, T.; Amnell, T. Detecting trends of annual values of atmospheric pollutants by the Mann-Kendall test and Sen’s slope estimates—The Excel template application MAKESENS. Air Qual. 2002, 31. [Google Scholar]
- Wilcox, C.; Vischel, T.; Panthou, G.; Bodian, A.; Blanchet, J.; Descroix, L.; Quantin, G.; Cassé, C.; Tanimoun, B.; Kone, S. Trends in hydrological extremes in the Senegal and Niger Rivers. J. Hydrol. 2018, 566, 531–545. [Google Scholar] [CrossRef]
Figure 1.
Geographical location of the Niger and Sirba River catchments. Enlargement: Sirba River hydrography, topography, and the location of the discharge gauging stations indicated in Table 2.
Figure 1.
Geographical location of the Niger and Sirba River catchments. Enlargement: Sirba River hydrography, topography, and the location of the discharge gauging stations indicated in Table 2.

Figure 2.
Overlapping of the DGRE RCs (dotted lines) and ANADIA RCs (solid lines) for the different periods.
Figure 2.
Overlapping of the DGRE RCs (dotted lines) and ANADIA RCs (solid lines) for the different periods.

Figure 3.
Hydrograph 2010–2015 at Garbey Kourou: DGRE (yellow line) and ANADIA (blue line) discharges.
Figure 3.
Hydrograph 2010–2015 at Garbey Kourou: DGRE (yellow line) and ANADIA (blue line) discharges.

Figure 4.
Water balance (2007–2017) at Niamey computed with DGRE (yellow bars) and with ANADIA (blue bars) discharge time series.
Figure 4.
Water balance (2007–2017) at Niamey computed with DGRE (yellow bars) and with ANADIA (blue bars) discharge time series.

Figure 5.
The hydrologic year 2012–2013. Hydrograph at Niamey (red line), cumulative hydrographs of Niger (measured at Kandaji), Dargol (measured at Kakassi), and Sirba (measured at Garbey Kourou) with the ANADIA discharge (blue line) and with the discharge from the DGRE (yellow line).
Figure 5.
The hydrologic year 2012–2013. Hydrograph at Niamey (red line), cumulative hydrographs of Niger (measured at Kandaji), Dargol (measured at Kakassi), and Sirba (measured at Garbey Kourou) with the ANADIA discharge (blue line) and with the discharge from the DGRE (yellow line).

Figure 6.
Comparison between the DGRE (yellow bars) and ANADIA (blue bars) time series of annual maximum discharge.
Figure 6.
Comparison between the DGRE (yellow bars) and ANADIA (blue bars) time series of annual maximum discharge.

Figure 7.
(a) The evolution of the FDC over time; (b) flow duration curves for the different periods, from one changepoint to the next.
Figure 7.
(a) The evolution of the FDC over time; (b) flow duration curves for the different periods, from one changepoint to the next.


Figure 8.
Monotonic linear trends estimated with the Sen approach. Annual maximum discharge and anomalies (SAI) time series.
Figure 8.
Monotonic linear trends estimated with the Sen approach. Annual maximum discharge and anomalies (SAI) time series.

Figure 9.
Distribution of the Standardized Anomaly Index of annual maximum discharge (blue points). Each period is indicated by the detected changepoints (dash-dot black lines). Trends are depicted using a Loess curve (red line) and a moving average line (dash green line). The mean of each period was added to highlight the significant increase in the last period.


Table 1.
The glossary of acronyms used in the text.
| Acronyms | Full Names |
|---|---|
| MNRB | Middle Niger River Basin |
| NBA | Niger Basin Authority |
| DGRE | General Water Resources Management |
| FDC | flow-duration curve |
| AMAX | annual maximum discharge |
| SAI | Standardized Anomaly Index |
| DGRE RC | rating curves used by DGRE |
| ANADIA RC | updated rating curves of this study |
| ANADIA time series | updated time series of discharge of this study |
Table 2.
Gauging stations in the analyzed area.
| Name | Coordinates | River | Country | Basin Area (km2) | Installation Date | |
|---|---|---|---|---|---|---|
| Latitude (°) | Longitude (°) | |||||
| Kandaji | 14.6103 | 0.9906 | Niger | Niger | 633,000 | 1975 |
| Niamey | 13.5106 | 2.1069 | Niger | Niger | 700,000 | 1929 |
| Kakassi | 13.85 | 1.4667 | Dargol | Niger | 6940 | 1957 |
| Sebba | 13.4333 | 0.5167 | Yali | Burkina Faso | 2280 | 1981 |
| Liptougou | 13.1840 | 0.3256 | Faga | Burkina Faso | 15,700 | 1973 |
| Bassieri | 12.8 | 0.33 | Koulouko | Burkina Faso | 8000 | 2010 |
| Bossey Bangou | 13.3538 | 1.2874 | Sirba | Niger | 37,000 | 2018 |
| Garbey Kourou | 13.7319 | 1.5984 | Sirba | Niger | 38,750 | 1956 |
Table 3.
Coefficients of the ANADIA rating curves equations of the Garbey Kourou gauging station.
| Rating Curves | Validity | Ranges (m) | a | b | R2 |
|---|---|---|---|---|---|
| 1 | 1956–1978 | [0–1) | 23.769 | 3.684 | 0.958 |
| [1–5] | 25.684 | 1.962 | 0.973 | ||
| 2 | 1979–2003 | [0–1.2) | 17.94 | 3.6 | 0.911 |
| [1.2–3.5] | 23.602 | 2.218 | 0.985 | ||
| 3 | 2004–2018 | [0–1.9) | 8.238 | 4.025 | 0.972 |
| [1.9–4] | 24.769 | 2.419 | 0.986 |
Table 4.
Mean discharge and mean annual volume for the different gauging stations over the period of 2007–2017.
Table 4.
Mean discharge and mean annual volume for the different gauging stations over the period of 2007–2017.
| Gauging Station | River | Qmean (m3/s) | Vannual (km3) | ||
|---|---|---|---|---|---|
| DGRE | ANADIA | DGRE | ANADIA | ||
| Niamey | Niger | 970 | 30.58 | ||
| Kandaji | Niger | 794 | 25.04 | ||
| Kakassi | Dargol | 15 | 0.46 | ||
| Garbey Kourou | Sirba | 65 | 102 | 2.04 | 3.22 |
| Upstream sum (Kandaji + Kakassi + Garbey Kourou) | 27.54 | 28.72 | |||
| Difference (Niamey – upstream sum) | 3.04 | 1.86 | |||
Table 5.
Periods of record for FDCs.
| FDC | Period-Evolution | Period-Behavior |
|---|---|---|
| 1 | 1956–2018 | 1956–1968 |
| 2 | 1969–2018 | 1969–1989 |
| 3 | 1990–2018 | 1990–2008 |
| 4 | 2009–2018 | 2009–2018 |
Table 6.
Characteristic discharge (m3/s) for the FDC set of Figure 7b.
Table 6.
Characteristic discharge (m3/s) for the FDC set of Figure 7b.
| Qn | 1956–1968 | 1969–1989 | 1990–2008 | 2009–2018 |
|---|---|---|---|---|
| Q1 | 244.8 | 216.4 | 373.7 | 906.9 |
| Q5 | 215.9 | 180.5 | 342.3 | 807.9 |
| Q10 | 182.3 | 155.9 | 304.0 | 674.4 |
| Q30 | 98.6 | 106.5 | 210.9 | 484.2 |
| Q60 | 52.4 | 57.6 | 116.8 | 256.7 |
| Q91 | 23.9 | 23.7 | 55.5 | 107.2 |
| Q135 | 4.9 | 2.9 | 6.7 | 11.2 |
| Q182 | 0.6 | 0.2 | 0.1 | 1.0 |
| Q274 | 0.0 | 0.0 | 0.0 | 0.1 |
| Q355 | 0.0 | 0.0 | 0.0 | 0.0 |
© 2019 by the authors. Licensee MDPI, Basel, Switzerland. This article is an open access article distributed under the terms and conditions of the Creative Commons Attribution (CC BY) license (http://creativecommons.org/licenses/by/4.0/).
Share and Cite
MDPI and ACS Style
Tamagnone, P.; Massazza, G.; Pezzoli, A.; Rosso, M. Hydrology of the Sirba River: Updating and Analysis of Discharge Time Series. Water 2019, 11, 156. https://doi.org/10.3390/w11010156
AMA Style
Tamagnone P, Massazza G, Pezzoli A, Rosso M. Hydrology of the Sirba River: Updating and Analysis of Discharge Time Series. Water. 2019; 11(1):156. https://doi.org/10.3390/w11010156
Chicago/Turabian StyleTamagnone, Paolo, Giovanni Massazza, Alessandro Pezzoli, and Maurizio Rosso. 2019. "Hydrology of the Sirba River: Updating and Analysis of Discharge Time Series" Water 11, no. 1: 156. https://doi.org/10.3390/w11010156
Note that from the first issue of 2016, this journal uses article numbers instead of page numbers. See further details here.