The Evaluation of Regional Water-Saving Irrigation Development Level in Humid Regions of Southern China


1
State Key Laboratory of Hydraulics and Mountain River Engineering & College of Water Resource and Hydropower, Sichuan University, Chengdu 610025, China
2
Provincial Key Laboratory of Water-Saving Agriculture in Hill Areas of Southern China, Chengdu 610066, China
3
International School of Technical Education, Sichuan College of Architectural Technology, Deyang 618000, China
4
Key Laboratory of Agricultural Soil and Water Engineering in Arid and Semiarid Areas, Ministry of Education, Northwest A & F University, Yangling 712100, China
*
Author to whom correspondence should be addressed.
Water 2019, 11(1), 172; https://doi.org/10.3390/w11010172
Submission received: 20 December 2018
/
Revised: 12 January 2019
/
Accepted: 14 January 2019
/
Published: 18 January 2019
(This article belongs to the Special Issue Advances in Hydraulics and Hydroinformatics)
Abstract
:Water-saving irrigation development level (WIDL) refers to reasonably and accurately judging a water-saving area based on the analysis of all factors affecting the water-saving irrigation development. The evaluation of regional WIDL is the premise of scientific planning guidance to irrigation work. How to select reasonable evaluation indexes and build a scientific and comprehensive model to evaluate WIDL is of great significance. In this study, the comprehensive evaluation index system of WIDL in 21 cities (states) of the Sichuan province in China (a typical humid region in southern China) was constructed, and the TOPSIS (Technique for Order Preference by Similarity to an Ideal Solution) method was improved to evaluate WIDL. Results showed that the overall development level of water-saving irrigation was “poor” in Sichuan province. The water-saving irrigation level turned out to be “good” in three regions with advantageous geographical conditions and developed economies, “general” in four regions with good economic levels where agronomy water saving has been popularized, and “poor” in fourteen regions of mountainous and hilly areas, especially Ganzi, Aba, and Liangshan, located in the Northwest plateau of Sichuan province, with poor natural resources and insufficient economies. The evaluation results were in good agreement with the actual situation, and in this area, there is enormous potential for the development of water-saving irrigation strategies. This study provides an important technical approach for the evaluation of water-saving irrigation development in humid regions of Southern China.
1. Introduction
Water scarcity has become a major restraint factor for social and economic development among many regions, especially in semiarid and arid regions [1,2]. Agriculture consumes the largest amount of water resources among human activities: Irrigation water withdrawals represent 70% of the total human use of renewable water resources [3,4,5,6]. About 18% of croplands worldwide, or about 2% of the total land surface, are irrigated and meet 40% of the global food demand [7].
There are various available measures to solve global water scarcity, such as water re-pricing, water re-use, desalination, water diversion and distribution, improvements in water delivery systems, alternative plants, and water conservation through efficient irrigation, among which water-saving irrigation is one of the most feasible and effective measures attributing to significant water-savings [8,9,10,11]. The factors affecting water-saving irrigation mainly feature engineering (drip irrigation, micro-irrigation, etc.), agronomy (regulated deficit irrigation, water-saving varieties, etc.) and management (water price, government police, etc.) measures [12,13,14,15,16,17,18].
The natural conditions, such as hydrogeology, channel soil, irrigation soil, crop species, the management and maintenance level of irrigation districts, farmer’s habits of water use, and water price policy vary in different regions, which will lead to different engineering technologies, economic benefits, environmental benefits, and development level of water-saving irrigation in various regions. Although many studies have focused on the evaluation of water-saving irrigation technology or comprehensive benefits [19,20,21,22,23], less research has been conducted on the comprehensive evaluation of the regional water-saving irrigation development level (WIDL). WIDL refers to reasonably and accurately judging a water-saving or high-efficiency water-saving area based on the analysis of all factors affecting water-saving irrigation development. It is an objective summary of past achievements and also a judgment of the current starting point. In most cases, we used the agricultural integrated gross irrigation quota to express water-saving irrigation development level. However, the regional WIDL is the organic embodiment of engineering, agronomy, and management the water-saving level under the conditions of optimal allocation of water resources. WIDL has never been reported in the humid regions of Southern China. Although water resources in these regions are relatively abundant, with annual precipitation greater than 1000 mm, seasonal drought often occurs, combined with serious engineering water shortages, leading to more serious droughts. Therefore, it is necessary to develop water-saving irrigation in the humid regions of Southern China. With the continuous enrichment of multi-index comprehensive evaluation methods such as the fuzzy comprehensive evaluation method [24], analytic hierarchy process method [25,26], set pair analysis [27], TOPSIS method [28] and so on, the comprehensive evaluation of WIDL is worthy of study and improvement.
Attaining the weights of indexes is a prerequisite for a comprehensive evaluation since the weight of the index represents the relative importance of the index in the evaluation system, and the accuracy of the weight directly affects the final evaluation results [29]. There are two kinds of methods to judge weight. One is the subjective method (such as analytic hierarchy process). Weights of indexes are obtained by the subjective judgment of experts. This method reflects the knowledge and experience of experts but easily leads to deviations due to personal subjective elements. The other is the objective weighting method (such as entropy weight method). Weights are judged according to the relationship among the original data with a strong mathematical theoretical basis. In order to make the evaluation results more convincing, in this study weights were obtained by combining the subjective and objective methods.
Sichuan province is a typical humid region of Southern China, with annual precipitation of 1000–1200 mm. The objective of this paper is to evaluate WIDL in 21 cities (states) of Sichuan province. How could we evaluate the development level of water-saving irrigation strategies? First, we established a comprehensive evaluation index system of WIDL from three aspects of engineering, agronomy, and management. Second, in order to simplify the evaluation indexes and enhance the accuracy of index weight, the principal component analysis (PCA) was used to extract the principal indexes, and the combined weight method was used to judge the relative importance of each index. Third, the TOPSIS method was improved to evaluate WIDL in 21 cities (states) of Sichuan province.
2. Materials and Methods
2.1. Study Area
Sichuan province, covering 21 cities (states), is the main producing area of grain in China (Figure 1). In this area, 500,000 small and medium-sized irrigation districts were built up until 2013. The effective irrigation area and water-saving irrigation area are 2647 thousand hm2 and 1125 thousand hm2, respectively. High-efficiency water-saving irrigation areas, with sprinkler irrigation, micro-irrigation, and pipe conveying irrigation of 37.9, 9.5, and 50 thousand hm2 respectively, account for only 8% of the water-saving irrigation area. The demand for irrigation water in Sichuan province is 5595 m3 per hm², the per capita income of the agriculture population is 5239 CNY, and the generalization area of agriculture water-saving technology is 667 thousand hm2. A total of 3540 water user associations have been built to control 714.1 thousand hm2 of irrigation croplands. A property rights system reform has been implemented in 380 thousand small water conservation projects. The current agriculture water price standard is 50% of the average water supply. The agricultural irrigation water fee in Sichuan province is supposed to be 320 million CNY, but the actual yield is less than 80%.
2.2. Methods
2.2.1. Principal Components Extracting of Evaluation Indexes
The principal component analysis (PCA) is one of the most widely applied tools which allows researchers to manipulate more variables [30,31,32,33,34]. The aim of the PCA algorithm is to reduce the dimensionalities of variables and meanwhile keep much information about the variables. When m principal components whose cumulative contribution rate ≥85% are selected in the real issue, this indicates that the first m principal components contain the total information of all indexes. In the paper, the indexes with the highest correlation with m principal components were chosen, which reduced the number of evaluation indexes and provided convenience for practical problems analysis.
2.2.2. Weight Assignments for the Indexes
The analytic hierarchy process (AHP) is a non-structure decision theory built by operational research experts Saaty [35]. It is applied perfectly to complex problems which are difficult to fully address with quantitative indexes for analysis. The basic idea is that the decision maker decomposes the complex problem into several levels and elements. A simple comparison, judgment, and calculation were carried out for the elements in order to get the weights of the different elements and the pending program. The entropy weight method (EWM) is found to be very useful in multi-attribute problems [36]. The smaller the value of the information entropy of the given parameter is, the larger the amount of contribution it will provide for the comprehensive evaluation.
We multiply the weights of the j-th index calculated by the above two methods, and normalize the product to obtain the combination weight ωj:
where αj, βj are the weights of the j-th index determined by AHP and EWM, separately.
2.2.3. The Improved TOPSIS Method
TOPSIS (Technique for Order Preference by Similarity to an Ideal Solution), first developed by Hwang and Yoon (1981), is a simple ranking method which attempts to choose alternatives in the shortest distance from the positive ideal solution and the farthest distance from the negative ideal solution simultaneously [37,38]. The TOPSIS method can be summarized in a series of steps.
Step 1 involves the construction of the original performance rating matrix. A set of cases (M = (M1, M2, …, Mm)) are compared with respect to a set of attributes (C = (C1, C2, …, Cn)). The performance matrix can be obtained as follows:
Step 2 involves the construction of the normalized performance rating matrix.
Step 3 is the construction of the weighted normalized decision matrix. Attribute weights (wj) have to be determined to indicate their relative importance and to calculate the weighted normalized values (rij) through:
where wj is the index weight determined by both AHP and EWM.
Step 4 indicates the determination of the positive ideal solution (PIS) and negative ideal solution (NIS).
where J1 and J2 are the benefit and the cost attributes, and rj+(x) and rj−(x) are the maximum and minimum values for the j-th attribute.
Step 5 involves the calculation of the separation from the PIS and the NIS between alternatives. The determining distances Si+, Si− of each scheme away from the PIS and the NIS are as given as:
Step 6 involves the calculation of the similarities to the ideal solution. The scheme decision and relative closeness between kinds of schemes and ideal solution are as follows:
Scheme Mi is sequenced according to εi. The larger the value of εi, the closer scheme Mi is to the ideal solution, which is better. In the opposite case, the scheme is worse.
The above TOPSIS method (traditional method) is only a ranking method. It cannot judge the level of the scheme Mi according to εi. In the study, the corresponding classification thresholds (the number of classification standard is k) of each index were seen as k schemes, which were evaluated together with the original program using the TOPSIS method. ε,j (j ≤ k) is the relative closeness between the k schemes and ideal solution. Then, the relative closeness was graded as (ε,1~(ε,1 + ε,2)/2), …, (ε,k−2 + ε,k−1)/2)~(ε,k−1 + ε,k)/2, (ε,k−1 + ε,k)/2), by which we can determine which level the scheme Mi is in.
3. Results
3.1. Construction of Evaluation System
The regional water-saving strategies were divided into three categories: Engineering, agronomy, and management water-saving. The indexes selected and the relationships among them were used as the foundation to establish the comprehensive evaluation index system of WIDL.
3.1.1. Engineering Water-Saving Evaluation Indexes
Engineering construction is the foundation of water-saving irrigation, and the contents are selected from the perspective of advanced and economic technology and reducing losses caused in the course of water transportation. Considering the present operation level and factors influenced by the engineering in the irrigation area, this research selected 12 indexes (Table 1) based on technical specifications for water-saving irrigation engineering (Chinese National Standard GB/T 50363-2006), and a detailed description of the following indexes was presented:
L1 represents the ratio of the water-saving irrigation area to the effective irrigation area. This ratio indirectly reflects the water-saving level. The effective irrigation area refers to those areas of farmland, equipped with water sources and irrigation engineering subsidiaries, and their ability to conduct irrigation in normal years.
L2 represents the ratio of the established high-efficiency water-saving irrigation area to the total water-saving irrigation area. High-efficiency water-saving engineering is also named as pressure irrigation, normally including some advanced irrigation methods such as sprinkler irrigation, micro-irrigation, drip irrigation, etc. Applying high-efficiency water-saving irrigation technology greatly increases water utilization efficiency.
L3 represents the water efficiency of irrigation. This refers to the ratio of irrigated water available to crops in the field to the volume of water transported from the canal head. Since 2005, calculation of the water efficiency of irrigation has been performed all over China.
L4 represents the economic benefits per hm2 of water-saving irrigation. This is a comprehensive index used to evaluate the effects of water-saving irrigation. A complicated calculation method is required to figure out the value of it, and a lot of factors should be taken into consideration. On one hand, the comprehensive benefits of water-saving irrigation for economic crops vary a lot from food crops; on the other hand, the costs of economic crops and food crops vary greatly because of the use of different indexes such as operation costs, water-saving costs, and energy-saving costs, etc., used in the different engineering projects.
L5 represents the water usage amount per hm2 for irrigation. Water usage amount refers to the water consumed for the growth of crops, including loss amount in water delivery. It varies a great deal in different areas for different crops and in different weather conditions. The water usage amount equals the sum of irrigation water consumption in each growth periods of crops while considering the water loss caused by the irrigation system.
L6 represents the ratio of water-saving irrigation area to cultivated area. Cultivated area refers to the field for growing crops and includes irrigation paddy fields, upland fields, and irrigated land. The cultivated area is larger than the irrigation area. The ratio of water-saving irrigation area to cultivated area, on the one hand, objectively reveals the local agricultural irrigation development level, and on the other hand, it reflects the present development level of water-saving agriculture.
L7 represents the main crops yield per unit. This index significantly reflects the production benefit as well as the scientific development of the planting industry. The usual method used to increase the per unit yield of the main crops is the rational close planting method which provides relatively large space for sunlight and helps control organic consumption in respiration within a relatively small amount at the same time; an optimum density is selected by considering those two factors to increase the organic accumulation.
L8 represents per capita GDP. Per capita GDP significantly reflects economic development and people’s living standards. Water-saving irrigation commences with a rather late start, a large scale of engineering projects is under construction, and heavy investment for water-saving engineering construction is eagerly demanded. Investing capacity is closely related to regional economic development, so per capita GDP is considered as one index in engineering the water-saving evaluation.
L9 represents the percentage of canal lining. This refers to the ratio of the calculated area of canal seepage proof to the maximum flow section area.
L10 represents the percentage of working lining channels Restrained by a depressed economy and poor technology during the period of construction, most channels were built below the construction standard in the irrigation area. Furthermore, after working for years, the channels have suffered some degree of damage. Therefore, maintenance for the channel system is needed. The percentage of working lining channels is significant to reflect the maintenance of damaged channels.
L11 represents the water usage amount for agriculture. This covers the water used for field irrigation, fishery, and forestry and fruit industries. Water used for forestry and the fruit industry belongs to the classification of agricultural irrigation water. Water used for agriculture is less likely to increase because of water shortage. Sichuan province measures the water usage amount for agriculture, and thus the amount can be directly obtained.
L12 represents agriculture investment. Agriculture investment reflects local economic development level as well as the degree of attention paid to agriculture. Funds invested in water-saving irrigation construction and agricultural investment come from various sources such as national finance, local finance, credit funds, collective economy, individual investment, or even foreign investment. With rapid economic development, the amount of funds invested in water-saving irrigation construction from local finance, collective agricultural economic organizations, and individual investments tends to increase year by year.
3.1.2. Agronomy Water-Saving Evaluation Indexes
Agronomy water-saving refers to a certain comprehensive agricultural technology which integrates the resources of water, soil, and crops by optimizing the cropping and farming system to effectively reduce soil evaporation and luxury transpiration of crops, and further improves water efficiency with regards to water-saving and productivity. The main features of the agronomy water-saving strategy are the rational layout of farm crops and the improvement of planting methods. Five indexes were selected from the contents to establish the evaluation system and a detailed description of the following indexes was presented as follows.
M1 refers to the ratio of the rice dry nursery seedling area to the rice planting area. The rice dry nursery seedling ratio is distinctive with a short seedling stage and convenience of management, with the advantages including saving field planting resources, water conservation, high economic benefit, disease resistance, cold resistance, and so on. Compared with the water-raised seedling, the rice dry nursery seedling saves roughly 50–90% of water use.
M2 represents the ratio of the area with the “Thin-Shallow-Wet-Dry” technique to the rice cultivated area. The “Thin-Shallow-Wet-Dry” irrigation technology is a scientific water-saving method used to plant rice. “Thin” means that a thin layer of water is needed for seedlings to take root when planting. “Shallow” means that rice seedlings turn green in shallow water. “Wet” refers to the practice of keeping the water-holding seedlings at an early tilling stage. “Dry” means stopping irrigation and adapting the seedlings to an external environment to train the seedlings at a late tilling stage. This technology is consistent with the water demand of the rice growth at different stages, which helps to save irrigation water as well as to invigorate its physiological activities to save water and increase production.
M3 refers to the per capita income of the agriculture population. The development and popularization of water-saving irrigation technology has much to do with the economic development level, as applying a series of measures and technologies is concerned with the agronomy water-saving demand investment. So far, government finance-oriented investment has not been established in the application of agronomy technology. Therefore, the application of this technology is closely related to the income of the local population.
M4 refers to the ratio of the drought-tolerant crops cultivated area to the cultivated area of all crops. The outstanding advantage of drought-tolerant crops is the water-saving advantage, hence one of the effective measures to solve water shortages in dry farming areas is to grow drought-tolerant crops. This practice has been popularized in Northwest of China; however, more efforts should be made to implement this in Sichuan province.
M5 refers to water use efficiency. Water use efficiency (WUE) refers to the quantity of economic product yielded by water consumption and it is significant as a reflection of the water-saving irrigation efficiency. At present, WUE is the major economic index used to evaluate water-saving irrigation benefits.
3.1.3. Management Water-Saving Evaluation Indexes
Management water-saving includes all management and maintenance work after the completion of a water-saving construction project. Sixteen indexes, which were divided into 6 qualitative indexes and 10 quantitative indexes, were included in this section. Six indexes, i.e., the establishment of subsidiary policies and regulations (N1), the degree of support from the government (N4), propaganda and education level (N5), water-saving engineering design level (N7), the rationality of the irrigation system (N10), and the sound level of the water-saving incentive mechanism (N14), which are difficult to evaluate with data-measurement, were obtained using the investigation method. We described the 16 indexes as follows:
N1 refers to the establishment of subsidiary policies and regulations. The perfection of legal systems and regulations is effective for the practice of irrigation water management. Thus, for the local government, promoting water-saving technology is a top priority in compiling an agricultural development plan, and much attention should be paid to develop, demonstrate, and extend key water-saving technologies.
N2 refers to the reform execution situation of the property system. The reform execution situation of the property system refers to the proportion of the number of identified property rights and identified management and maintenance of main body projects to the number of small-scale agricultural water conservancy projects.
N3 refers to the construction level of the technology popularizing system. This refers to the proportion of existing technical service institutions to the technical service institutions which are supposed to be established.
N4 refers to the degree of support from the government. The attention paid to water saving strategies from governments is of benefit for the earlier execution of related water-saving regulations, measures, and funding.
N5 refers to the propaganda and education level. Propaganda promoting water saving targets both government officials and citizens, especially farmers and other irrigation water users. Improving the public’s water-saving consciousness is a long-term task. Water saving habits and consciousness should be cultivated among the public, and water saving knowledge should be popularized as well.
N6 refers to the user participation level. This indicates the proportion of user-based management irrigation areas to total irrigation areas.
N7 refers to the water-saving engineering design level. It is key to the promotion of water-saving irrigation to guarantee engineering quality, as well as ensure good operation of the system across long periods of time.
N8 refers to the degree of perfection of engineering subsidiaries. This indicates the proportion of existing canal-attached facilities to attached facilities which are supposed to be constructed according to statistical data from the irrigation region.
N9 refers to the management and maintain level of water-saving engineering. This indicates the proportion of the maintenance expense of irrigation engineering to the required maintenance cost.
N10 refers to the rationality of irrigation system. With the enforcement of the rationality of the irrigation system, the optimum design of water-saving irrigation systems has become increasingly important. The irrigation system design should be developed on the basis of comprehensive technologies of agricultural water-saving irrigation and experimental data, which underlies the basic research foundation of this method.
N11 refers to monitoring the coverage rate of soil moisture. The monitoring coverage rate of soil moisture refers to the proportion of existing monitoring stations to the total number of planned soil moisture monitoring stations.
N12 refers to the degree to which water measurement is popularized, indicating the proportion of practicing water measurement areas to total irrigation areas.
N13 refers to the ratio of planned water use irrigation areas to total irrigation areas.
N14 refers to the sound level of water-saving incentive mechanisms. Establishing water rights-based optimal water dispatching and allocation is the core of the water-saving incentive mechanism. It is urgent to accelerate the confirmation of agricultural irrigation water rights, to develop the water right trade market, and to establish agricultural water saving incentive mechanisms.
N15 refers to the popularity rate of the measurement charges of water, indicating the proportion of practicing water measurement charges areas to total irrigation areas.
N16 refers to the rationality of the water price. The rationality of the water price refers to the proportion of the collected price for agricultural irrigation water to the cost.
3.1.4. The Comprehensive Evaluation Index System of WIDL
The hierarchy of the comprehensive evaluation index system was classified into three layers: The target layer, system layer, and index layer. According to the actual situation in Sichuan province and available data, 12, 5, and 16 indexes were adopted for engineering, agronomy, and management WIDL, respectively. The target layer (first-class index) was the evaluation result of WIDL, the system layer (second-class index) contained engineering, agronomy and management WIDL, and the index layer (third-class index) included the 33 specific evaluation indexes (Table 1). The 33 indexes were divided into 2 categories according to the method of data acquisition. One included the 6 qualitative indexes using the questionnaire method, and the other included the 27 quantitative indexes from the 2014 Sichuan province Provincial Water Conservancy Statistical Yearbook, the 2014 Sichuan province Water Management Yearbook, and the 2014 Sichuan province Agricultural Yearbook.
3.2. Index Quantification
We adopted a questionnaire method among the staff in the water administration department in Sichuan province and 21 cities (states) to quantify the 6 qualitative indexes. The staff had ample knowledge of water-saving irrigation management and were very familiar with the conditions of Sichuan province. Therefore, they could give a proper judgment or assessment for each index. Their work provided reliable information for our research. The current survey data of 6 qualitative indexes were quantified as follows:
where M1~M5 (M1 = 10, M2 = 8, M3 = 6, M4 = 4, M5 = 2) were the quantitative index values corresponding to “better, good, general, poor, poorer”. f1~f5 were the sample numbers in the corresponding class and N is the total sample numbers.
Q = (f1 × M1 + f2 × M2 + f3 × M3 + f4 × M4 + f5 × M5)/N
Taking Sichuan province as an example, 20 qualified staff from the water administration department of Sichuan province were invited to the survey to quantify the 6 indexes. The staff had ample knowledge of water-saving irrigation and were very familiar with the conditions of Sichuan province. Therefore, they could give a proper judgment or assessment for each index. Their work provided reliable information for our research. The quantitative values of the 6 indexes in Sichuan province were obtained by Equation (10) as seen in Table 2.
Similarly, 6 qualitative evaluation indexes of WIDL in 21 cities (states) of the Sichuan province were quantified, and 33 indexes of WIDL in the Sichuan province and 21 cities (states) were shown in Table 3.
3.3. Principal Component Extracting
Although the 33 evaluation indexes contained more comprehensive information on the development level of water-saving irrigation, they will increase the complexity of the evaluation process. We therefore chose PCA to simplify the engineering, agronomy, and management evaluation indexes, respectively. The principal components of engineering WIDL in Sichuan province and 21 cities (states) were analyzed using PCA in the DPS program. The eigenvalues and contribution rates of the principal components were shown in Table 4. From Table 4, the accumulative contribution rate of the first 5 principal components was up to 89.64% and above 85%. Therefore, the first 5 principal components can represent all the information of the 12 engineering WIDL.
The weights of coefficients between each index and the five principal components (F1–F5) were then shown in Table 5. The indexes with maximum weight coefficients were selected as the simplified principal indexes. Thus, the engineering WIDL evaluation indexes were simplified to 6 indexes as the water efficiency of irrigation (L3), the economic benefits per hm2 of water-saving irrigation (L4), the ratio of water-saving irrigation area to cultivated area (L6), the percentage of canal lining (L9), and the agriculture investment (L12).
Similarly, three indexes, including per capita income of agriculture population (M3), water use efficiency (M5), and the ratio of the area with the technique of “Thin-Shallow-Wet-Dry” to the rice cultivated area (M2) were extracted from five indexes of agronomy WIDL using PCA with the accumulative contribution rate of 88.6%. The evaluation indexes of management WIDL could be simplified to six items as follows: the degree of support from the government (N4), the degree of popularizing water measurement (N12), the sound level of water-saving incentive mechanisms (N14), the construction level of technology popularizing systems (N3), the monitoring coverage rate of soil moisture (N11), and the water-saving engineering design level (N7). So, 33 evaluation indexes were simplified to 14 indexes, which greatly facilitated our evaluations (Table 6).
The grading standard of each index is the basis for determining the WIDL grade. Five grades of evaluation standards were established for each index of the regional WIDL according to the mean and standard deviation grading method and the actual situation of Sichuan province. These standards, (better, good, general, poor, and poorer) correspond to the I–V levels shown in Table 6 [39]. Although this standard will be further improved or updated in the future, at this stage we established a relatively objective evaluation system to ensure the accuracy of the evaluation results.
3.4. Weight Determination
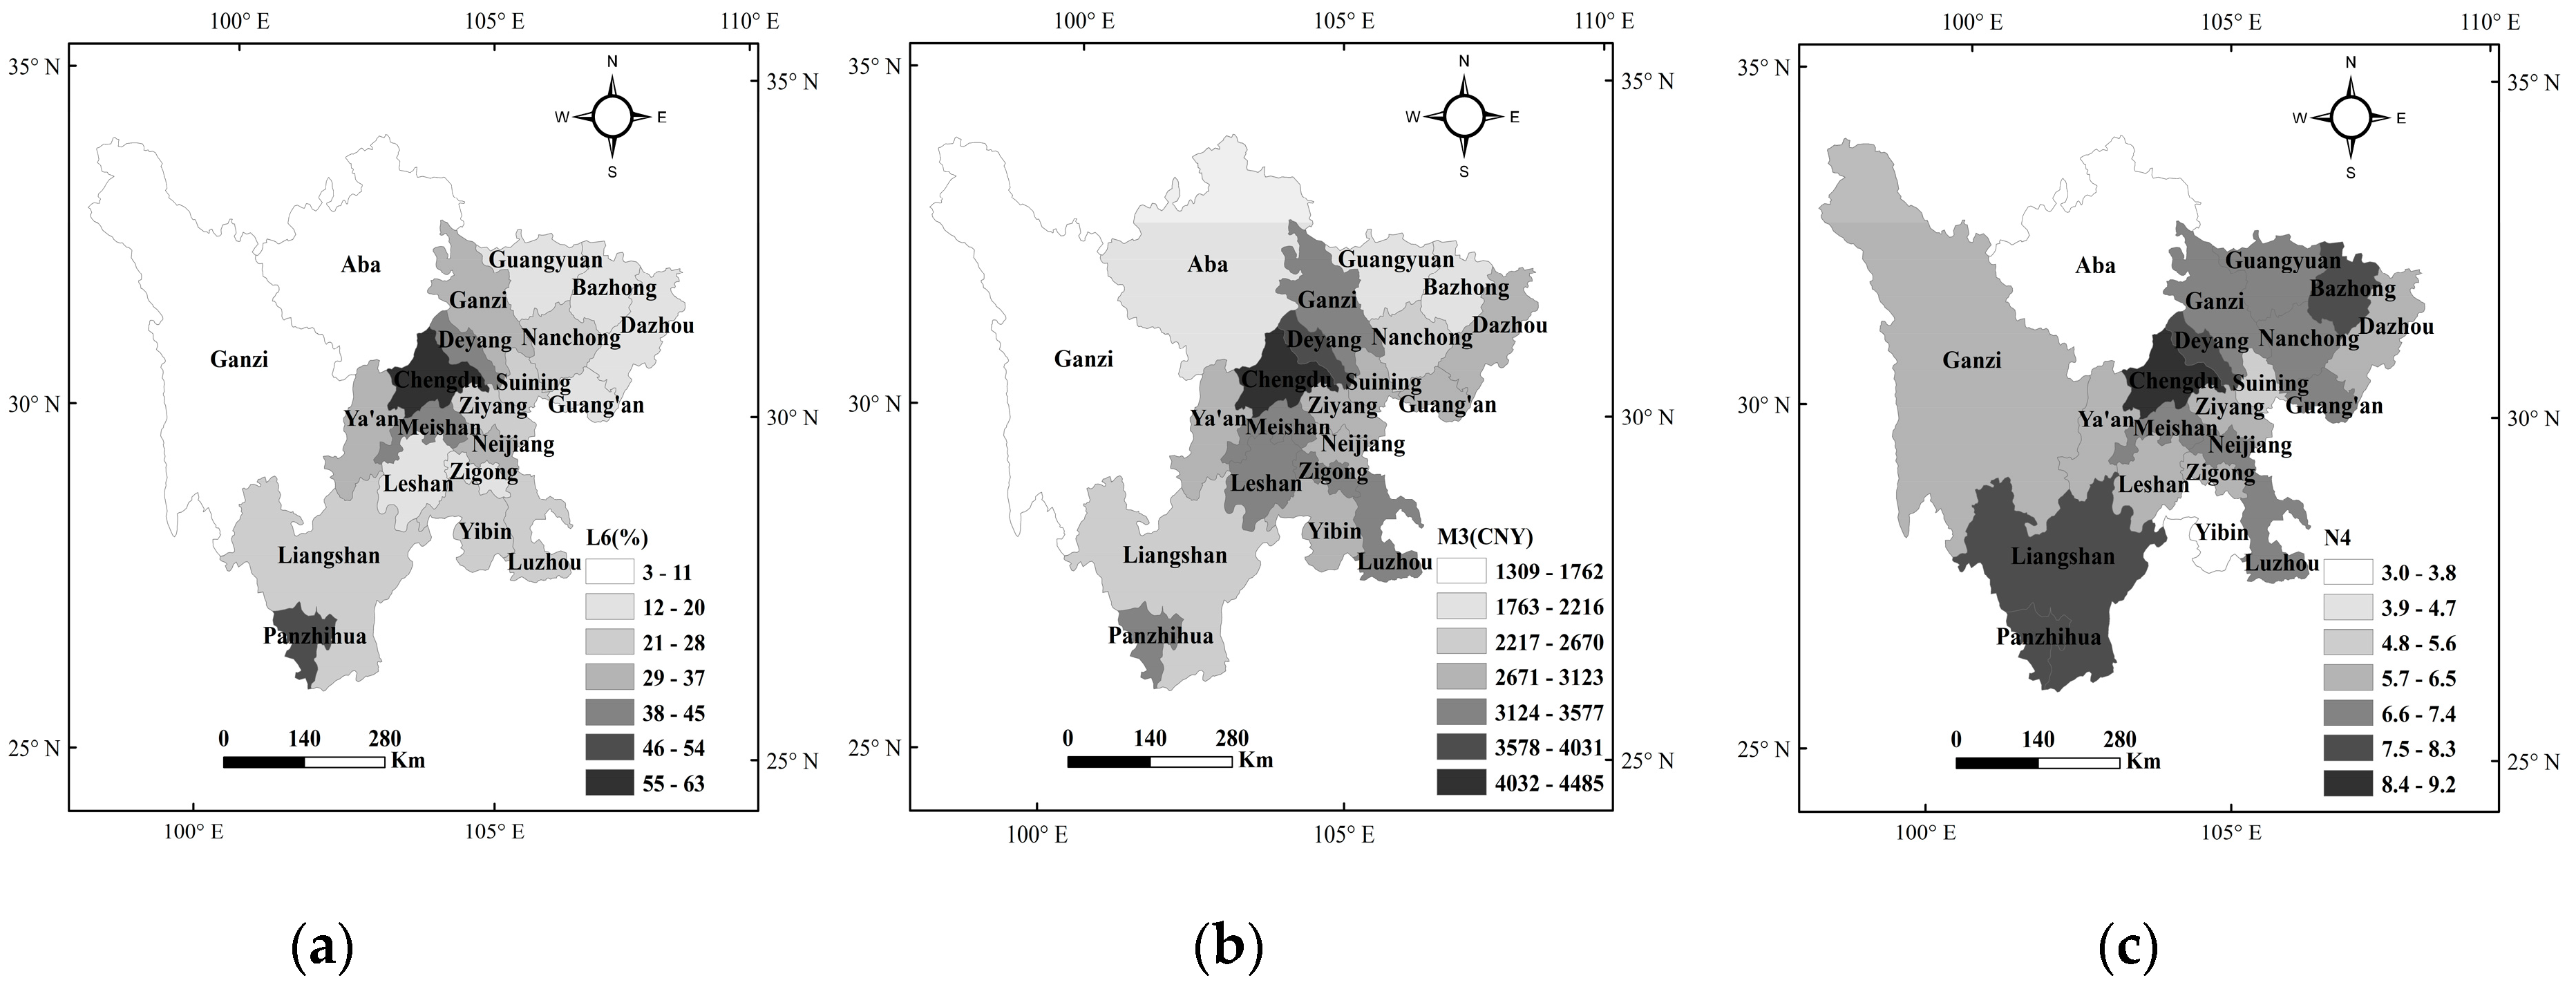
Assigning weights to the 14 indexes was a key step in our evaluation. The weight vector of the second-class indexes determined by AHP was α = (0.395, 0.262, 0.344), which passed the consistency test. The weights of the third-class indexes were determined considering both subjective weights vector α by AHP and objective weights vector β by EWM, and the combined weight ω was acquired by Equation (9). The final weights of each index were shown in Table 7, and the distributions of several indexes with high weights in 21 regions were shown in Figure 2. From Table 7, the ratio of water-saving irrigation areas to cultivated land area (L6), which was the direct reflection of the development level of water-saving irrigation, had the highest weight of 0.132, followed by the per capita income of the agriculture population (M3), the water use efficiency (M5), the degree of support from government (N4), and the water-saving engineering design level (N7) with higher weights of about 0.1. The construction level of technology popularizing system (N3), the monitoring coverage rate of soil moisture (N11), the degree of popularizing water measurement (N12), and the sound level of water-saving incentive mechanisms (N14) had the smallest weights (<0.05).
3.5. The Calculation of Relative Closeness
In the study, we made some improvements when adopting TOPSIS method. Firstly, the corresponding classification thresholds of 14 indexes were seen as 5 schemes. Based on the classification thresholds in Table 6 and the principal indexes in the 21 cities (states) and in Sichuan province, decision matrix Z was constructed as follows. In matrix Z, the first 5 lines were the thresholds of the 14 indexes corresponding to the five categories (better, good, general, poor, and poorer), and the next 22 lines were the values of the 14 indexes in Sichuan province and 21 cities (states).
The standard decision matrix V was then obtained using the dimensionless method in Equation (3). The weight decision matrix R was established by multiplying the standard decision matrix V and weights w (Table 7) according to Equation (4). Finally, according to the 14 benefit indexes based on principal component analysis, the positive ideal solution (PIS) was obtained using Equation (5), and the negative ideal solution (NIS) was obtained using Equation (6). We calculated the distance S+, S− of 27 schemes to PIS and NIS using Equations (7) and (8), and further obtained the relative closeness ε between the 27 schemes and the ideal solution.
S+ = (0.0055, 0.0267, 0.0523, 0.0737, 0.1023, 0.0571, 0.0432, 0.0627, 0.0437, 0.0601, 0.046, 0.0562, 0.0582, 0.057, 0.0554, 0.0661, 0.0593, 0.0523, 0.0598, 0.0622, 0.0561, 0.0626, 0.063, 0.0602, 0.0791, 0.0771, 0.0663);
S− = (0.0991, 0.0763, 0.0525, 0.0334, 0, 0.0517, 0.0774, 0.0472, 0.0706, 0.0518, 0.0662, 0.0567, 0.0549, 0.0488, 0.0509, 0.0461, 0.0539, 0.0572, 0.0467, 0.0496, 0.053, 0.0506, 0.0493, 0.0499, 0.0339, 0.0385, 0.0474);
ε = (0.9125, 0.6301, 0.5498, 0.4124, 0, 0.4754, 0.6418, 0.4294, 0.6174, 0.4627, 0.5900, 0.5022, 0.4855, 0.4610, 0.4789, 0.4110, 0.4762, 0.5224, 0.4388, 0.4437,0.4858, 0.4470, 0.4389, 0.4535, 0.2996, 0.3328, 0.4168);
The first 5 relative closeness (ε) values were 0.9125, 0.6301, 0.5498, 0.4124, and 0, respectively. So, the grading standard was (>(0.9125 + 0.6301)/2, (0.6301 + 0.5498)/2~(0.9125 + 0.6301)/2, (0.5498 + 0.4124)/2~(0.6301 + 0.5498)/2, (0.4124 + 0)/2~(0.5498 + 0.4124)/2, 0~(0.382 + 0)/2), that (>0.7713, 0.5899~0.7713, 0.4811~0.5899, 0.2062~0.4811, 0~0.2062), corresponding to the 5 categories (better, good, general, poor, and poorer). The WIDL in each region was judged using the grading standard, and the evaluation results are shown in Table 8 and Figure 3.
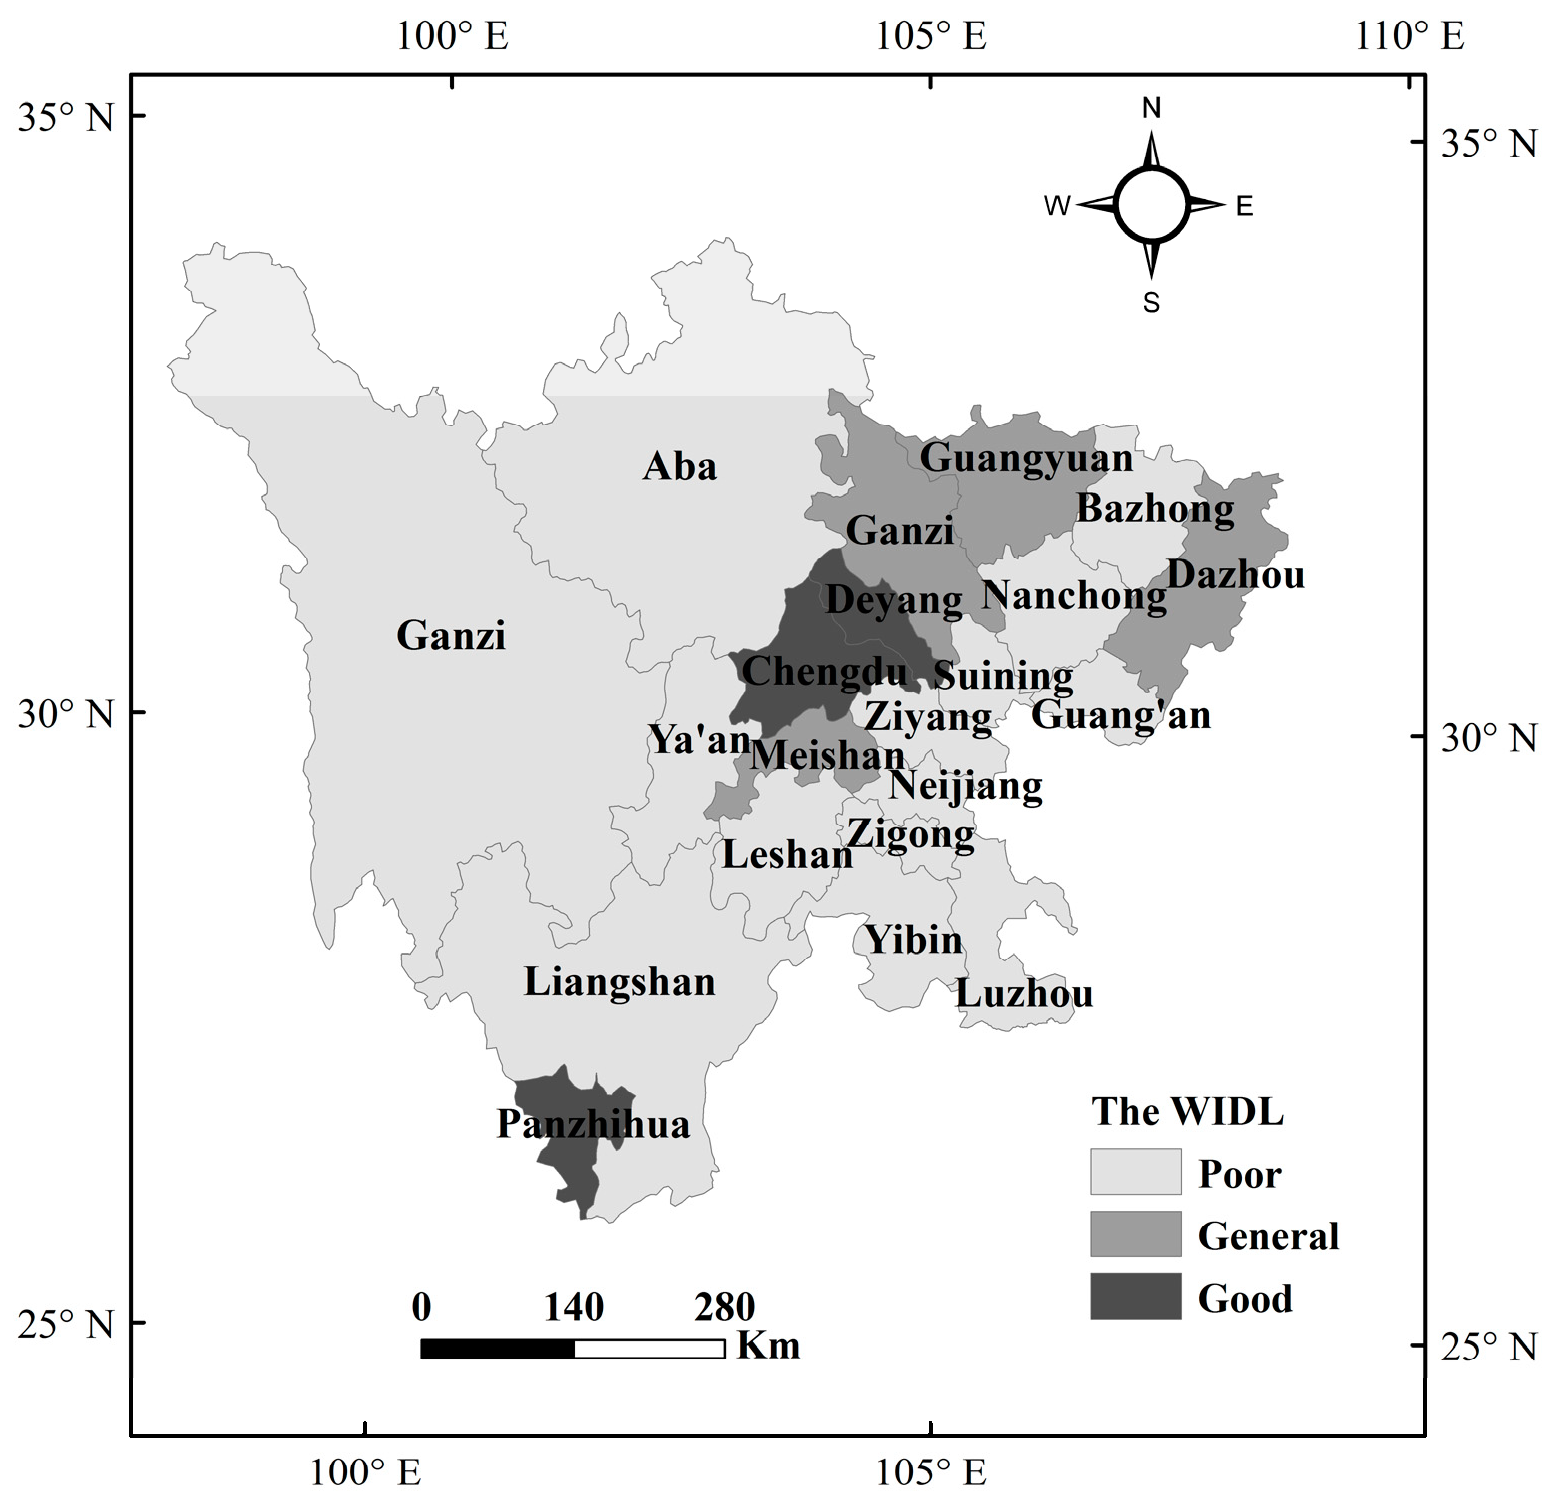
From Table 8, the overall development level of water-saving irrigation was “poor” in Sichuan province with a ε value of 0.4754. Only 3 regions were in “good”, 4 regions were “general”, and the other 14 regions were “poor”. By consulting experts or relevant managers from the Sichuan province Water Conservancy Bureau, we determined that this result was consistent with the general situation of Sichuan province and was consistent with the previous reports of Lou [39].
Only Chengdu, Panzhihua, and Deyang were at the “good” level, with ε values of about 0.6. The economic development levels in these regions were higher; the per capita GDP of Chengdu and Panzhihua was in the top 3 of Sichuan province, more than 60 thousand CNY higher than the average of 32.5 thousand CNY of Sichuan province. The per capita income of the agriculture population was relatively higher, so local people had a strong awareness of water conservation. The ratio of water-saving irrigation area to total cultivated land in those 3 regions ranks in the top 3. With better economic development level than other regions in Sichuan province and more funds invested to water-saving irrigation engineering maintenance in these regions, the existing lining canals were in better conditions than in the other 18 regions. The same was true with information management in irrigation areas. In 2004, Panzhihua was listed as the “national agricultural water-saving demonstration city”, and it made a lot of exploration in engineering and management construction. The government attached great importance to water-saving irrigation development, leading to the improvement of water-saving incentive mechanisms.
The four regions of Meishan, Guangyuan, Dazhou, and Mianyang were at the “general” level, with a ε value of about 0.5. In these regions, the engineering and agronomy water-saving development level was higher than the average level of Sichuan province. The per capita GDP of these regions were up to or exceeding the average level of Sichuan province. With strong support by local government, the indexes of water use efficiency, the percentage of working lining canals, and the ratio of water-saving irrigation area to the total cultivated area were better in these 4 regions than in the other regions in Sichuan province. In GuangYuan, the agriculture planting structure was adjusted according to the differences of the water demand and drought resisting characteristics in different kinds of crops. The "Thin-Shallow-Wet-Dry" area of the rice was relatively high.
Fourteen regions were in “poor” condition, such as Neijiang, Bazhong, Ganzhi, and Aba, with ε values of less than 0.48. Most of these regions are located in mountainous and hilly areas of Sichuan province, especially Ganzi, Aba, and Liangshan, which are located on the Northwest plateau of Sichuan province, with poor natural resources and insufficient economies. This led to a lack of investment in country public utilities and a funds shortage for the construction and maintenance of water-saving engineering. With the water efficiency of irrigation below 0.4 in these regions, the ratio of the water-saving irrigation area to the total cultivated area is at the inadequate–average level in Sichuan province, only reaching around 5% in Ganzi and Aba. Agronomy water-saving and management water-saving levels were also relatively poor in these regions. Moreover, information management for irrigation (soil moisture content supervision and measurement technology) was hardly conducted in Ganzhi, Aba, and Liangshan.
4. Discussion
The shortage of water resources has become an important factor restricting the sustainable development of regional economies. The development of water-saving irrigation methods to improve the utilization efficiency of water resources is an important way to deal with the engineering water shortage and seasonal drought conditions in the humid regions of Southern China. A reasonable and accurate assessment of WIDL is not only a basis for further scientific planning and construction to promote the development of regional water-saving irrigation, but also a basis to promote and guarantee the sustainable development of agricultural production. Therefore, the objective evaluation of regional WIDL has great significance to promote the development of water-saving irrigation along a scientific, healthy, and positive track, and to ensure sustainable development of the national economy.
According to the evaluation results, great efforts should be made to increase water-saving irrigation levels in Sichuan province. Firstly, more focus should be placed on increasing the investment in agricultural water-saving irrigation and promoting water-saving engineering. The governmental authority should implement the policy that 10% of land transaction fees are extracted to invest into farmland water conservancy construction in order to solve problems such as the inadequate service of necessary facilities for key projects in the irrigation region, the low qualified canal (channel) number, the aging canal system structures, and so on. On the other hand, investment and financial reform should increase, and diversified investment should be established to play the role of the financial fund, and to fully utilize preferential policy, incentive measures, and credit aid to attract new major participants in agricultural operations such as leading enterprises, major planting farmers, and cooperatives to invest in water-saving efficiency.
Secondly, more focus should be placed on adjusting agricultural industry distribution and extending water-saving technologies. It is necessary to establish the agricultural industry layout so that it is appropriate for local water resources, land, and ecosystems, and to adjust the agricultural water utilization structure. Highly efficient water-saving irrigation strategies in accordance with water resources, planting structure, and geographic conditions, land management should be adopted. In hilly regions with water scarcity and poor water conservancy facilities, such as Guangyuan, Bazhong, and Nanchong, etc., the principle of exploring water sources combined with saving water should be conducted to plan water conservancy engineering in a scientific way. In plains and large-scale agricultural management areas, such as Chengdu and Deyang, high water-saving irrigation efficiency should be practiced with the assistance of a traceability system in agricultural production chains and a brand marketing system for agricultural products. Internet-accelerated speed must be introduced to advance the development of high-efficiency water-saving technologies. Efforts should be made to practice information management in agricultural water saving engineering, extend efficient water-saving technology in irrigation, and enhance the transformation of the achievements made in agricultural water-saving technology. Advanced water-saving technology from both at home and abroad should be assimilated and utilized.
Thirdly, more focus should be placed on amplifying the water price system and creating incentives for water-saving irrigation. Legislative, economic, and administrative incentives should be executed to reform the total agricultural water consumption and water quota. Firstly, an index system of water allocation and permits of water-withdrawal volume control in the administrative districts at the provincial, municipal, and county level ought to be established respectively, which would be convenient for decomposing the index throughout the three levels from the top-down. Secondly, water pricing for agricultural use should be reformed to encourage volumetric pricing, improve terminal water pricing, and enhance the ratio of agricultural water use. Meanwhile, compensation and incentive mechanism for saving water should be established to encourage local officials and individual farmers to actively practice water-saving irrigation.
Finally, more focus should be placed on enhancing management and maintenance capabilities. It is important to perfect the management and maintenance system by clearly defining the responsibilities of project property owners and water administrative supervisors. Meanwhile, technological guidance should be provided to constitute regulations and standards for highly-efficient water-saving irrigation and to compile standardized management manuals. Furthermore, integrated institutions of water conservancy services, professional teams, water users associations, and village-level water management should be established to guarantee long-term water use efficiency.
5. Conclusions
Regional WIDL evaluation is a task which involves multi-target and multi-attribution methods. In the paper, we choose 3 second-class indexes of engineering, agronomy, and management water-saving along with 33 third-class indexes to establish a comprehensive evaluation index system for WIDL. The principal components analysis method was adopted for simplifying the water-saving indexes of engineering, agronomy, and management, and the number of third-class indexes was simplified into 14. The combined weight which considered both objective weight and subjective weight was applied to judge the relative importance of each index. The combination weight offset the deficiency of the evaluation index weights determined only by expert subjective experience or indexes of sample data. Moreover, the TOPSIS method was improved to evaluate WIDL in 21 cities (states) of Sichuan province.
Results showed the overall development level of water-saving irrigation was “poor” in Sichuan province with a ε value of 0.4754. The water-saving irrigation level turned out to be “good” in the following three regions with advantageous geographical conditions and developed economies: Chengdu, Panzhihua and Deyang. The water-saving irrigation level was “general” in the following four regions with good economic levels where agronomic water saving has been popularized: Meishan, Guangyuan, Dazhou, and Mianyang. Water-saving irrigation level was and “poor” in fourteen regions of mountainous and hilly areas in Sichuan province, especially in Ganzi, Aba, and Liangshan. Located on the Northwest plateau of Sichuan province, these areas feature poor natural resources and insufficient economies. According to the evaluation results, efforts should be made to increase the water-saving irrigation level in Sichuan province. We should increase the investment in agricultural water-saving irrigation and enhance management and maintenance, especially in “poor” regions. Besides, we should adjust the agricultural industry distribution and extend water-saving technology to be more appropriate for local water resource, land, and ecosystem conditions. Furthermore, we should amplify the water price system and create new incentives for the promotion of water-saving irrigation strategies.
This paper also has limitations and shortcomings. The evaluation of the data collection needs to be broader to fully represent the actual conditions of the studied areas. In the meantime, the evaluation standard can only be adapted in Sichuan province, and more evaluation methods should be used to verify the results. Although water-saving irrigation policies, technologies, agronomy measures, and evaluation criterion vary in other areas, the evaluation of WIDL in Sichuan province established a demonstration of the potential effect of these strategies in other humid regions of southern China.
Author Contributions
All authors were involved in designing and discussing the study. L.Z. (Lu Zhao) performed the calculation, result analysis, and wrote the article; C.L. and Y.F. contributed data collection and result calculation and analysis; N.C. and L.Z. (Lili Zhang) contributed to the article’s discussion and edition.
Funding
This work was also supported by the National Key Research and Development Program of China (No. 2016YFC0400206), the National Natural Science Foundation of China (51779161), the Central University special fund basic research and operating expenses (2018CDPZH-10, 2016CDDY-S04-SCU, 2017CDLZ-N22) and the National Key Technologies R&D Program of China (No. 2015BAD24B01).
Acknowledgments
We would like to thank the National Climatic Centre of the China Meteorological Administration for providing the climate database used in this study. Thanks are extended to the editors and anonymous reviewers for their valuable comments.
Conflicts of Interest
The authors declare no conflict of interest.
References
- Salinas, J.G.; Pinto, M.; Pinto, M. Water security as a challenge for the sustainability of La Serena-Coquimbo conurbation in northern Chile: Global perspectives and adaptation. Mitig. Adapt. Strateg. Glob. Chang. 2016, 21, 235–1246. [Google Scholar] [CrossRef]
- Niu, G.; Li, Y.P.; Huang, G.H.; Liu, J. Interactive Fuzzy-Boundary Interval Programming for Water Resources Management of the Hetao Basin, China. J. Irrig. Drain. Eng. 2016, 142, 04016056. [Google Scholar] [CrossRef]
- Piedad, M.; Lin, H.; David, D.; Chen, C.D. The impact of on-farm water saving irrigation techniques on rice productivity and profitability in Zhanghe Irrigation System, Hubei, China. Paddy Water Environ. 2004, 2, 207–215. [Google Scholar]
- Fisher, G.; Tubiello, F.N.; van Velthuizen, H. Climate change impacts on irrigation water requirements: Effects of mitigation, 1990–2080. Technol. Forecast. Soc. 2007, 74, 1083–1107. [Google Scholar] [CrossRef] [Green Version]
- Sun, S.K.; Wang, Y.B.; Liu, J.; Wu, P.T.; Cai, H.J. Sustainability Assessment of Regional Water Resources Under the DPSIR Framework. J. Hydrol. 2016, 532, 140–148. [Google Scholar] [CrossRef]
- Lee, S.H.; Yoo, S.H.; Choi, J.Y.; Engel, B.A. Effects of climate change on paddy water use efficiency with temporal change in the transplanting and growing season in South Korea. Irrig. Sci. 2016, 34, 443–463. [Google Scholar] [CrossRef]
- UNCSD. Comprehensive Assessment of the Freshwater Resources of the World. United Nations Commission on Sustainable Development. 1997. Available online: http://www.un.org/esa/documents/ecosoc/cn17/1997/ecn171997-9.htm/ (accessed on 25 February 2016).
- Ket, P.; Garré, S.; Oeurng, C.; Hok, L.; Degré, A. Simulation of Crop Growth and Water-Saving Irrigation Scenarios for Lettuce: A Monsoon-Climate Case Study in Kampong Chhnang, Cambodia. Water 2018, 10, 666. [Google Scholar] [CrossRef]
- Cai, X.M.; Rosegrant, M.W. Irrigation technology choices under hydrologic uncertainty: A case study from Maipo River Basin. Water Resour. Res. 2004, 4, 1–10. [Google Scholar] [CrossRef]
- Tal, A. Rethinking the sustainability of Israel’s irrigation practices in the Drylands. Water Res. 2016, 90, 387–394. [Google Scholar] [CrossRef]
- Tal, A. Seeking sustainability: Israel’s evolving water management strategy. Science 2006, 313, 1081–1084. [Google Scholar] [CrossRef]
- Horst, M.G.; Shamutalov, S.S.; Pereira, L.S.; Gonçalves, J.M. Field assessment of the water saving potential with furrow irrigation in Fergana, Aral Sea basin. Agric. Water Manag. 2005, 77, 210–231. [Google Scholar] [CrossRef]
- Mushtaq, S.; Dawe, D.; Lin, H.; Moya, P. An assessment of the role of ponds in the adoption of water-saving irrigation practices in the Zhanghe Irrigation System, China. Agric. Water Manag. 2006, 83, 100–110. [Google Scholar] [CrossRef]
- Ørum, J.E.; Boesen, M.V.; Jovanovic, Z.; Pedersen, S.M. Farmers’ incentives to save water with new irrigation systems and water taxation-A case study of Serbian potato production. Agric. Water Manag. 2010, 98, 465–471. [Google Scholar] [CrossRef]
- Nyakudya, I.W.; Stroosnijder, L. Effect of rooting depth, plant density and planting date on maize (Zea mays L.) yield and water use efficiency in semi-arid Zimbabwe: Modelling with Aqua Crop. Agric. Water Manag. 2014, 146, 280–296. [Google Scholar] [CrossRef]
- Li, X.L.; Zhang, X.T.; Niu, J.; Tong, L.; Kang, S.Z.; Du, T.S.; Li, S. Irrigation water productivity is more influenced by agronomic practice factors than by climatic factors in Hexi Corridor, Northwest China. Sci. Rep. 2016, 6, 37971. [Google Scholar] [CrossRef] [Green Version]
- Pérez-Sarmiento, F.; Mirás-Avalos, J.M.; Alcobendas, R.; Alarcón, J.J.; Mounzer, O.; Nicolas, E. Effects of regulated deficit irrigation on physiology, yield and fruit quality in apricot trees under Mediterranean conditions. Span. J. Agric. Res. 2016, 14, 1–12. [Google Scholar] [CrossRef]
- Peng, Y.; Zhang, J.M.; Meng, J.P. Second order force scheme for lattice Boltzmann model of shallow water flows. J. Hydraul. Res. 2017, 55, 592–597. [Google Scholar] [CrossRef]
- Jerry, R.W.; Orlan, H.B.; Gary, J.D. A microcomputer model for irrigation system evaluation. South. J. Agric. Econ. 1988, 7, 56–69. [Google Scholar]
- Anagnostopoulosa, K.P.; Petalasb, C. A fuzzy multicriteria benefit-cost approach for irrigation projects evaluation. Agric. Water Manag. 2011, 98, 1409–1416. [Google Scholar] [CrossRef]
- Adusumilli, N.; Davis, S.; Fromme, D. Economic evaluation of using surge valves in furrow irrigation of row crops in Louisiana: A net present value approach. Agric. Water Manag. 2016, 174, 61–65. [Google Scholar] [CrossRef]
- Xue, J.; Ren, L. Evaluation of crop water productivity under sprinkler irrigation regime using a distributed agro-hydrological model in an irrigation district of China. Agric. Water Manag. 2016, 178, 350–365. [Google Scholar] [CrossRef]
- Zhang, Q.W.; Cui, N.B.; Feng, Y.; Gong, D.Z.; Hu, X.T. Improvement of Makkink model for reference evapotranspiration estimation using temperature data in Northwest China. J. Hydrol. 2018, 566, 264–273. [Google Scholar] [CrossRef]
- Luo, Y.F.; Fu, H.L.; Xiong, Y.J.; Xiang, Z.; Wang, F.; Bugingo, Y.C.; Khan, S.; Cui, Y.L. Effects of water-saving irrigation on weed infestation and diversity in paddy fields in East China. Paddy Water Environ. 2017, 15, 593–604. [Google Scholar] [CrossRef]
- Okada, H.; Styles, S.W.; Grismer, M.E. Application of the analytic hierarchy process to irrigation project improvement Part I. Impacts of irrigation project internal processes on crop yields. Agric. Water Manag. 2008, 95, 199–204. [Google Scholar] [CrossRef]
- Okada, H.; Styles, S.W.; Grismer, M.E. Application of the analytic hierarchy process to irrigation project improvement Part II. How professionals evaluate an irrigation project for its improvement. Agric. Water Manag. 2008, 95, 205–210. [Google Scholar] [CrossRef]
- Tan, C.; Song, Y.; Che, H. Application of set pair analysis method on occupational hazard of coal mining. Saf. Sci. 2017, 92, 10–16. [Google Scholar]
- Mao, N.; Song, M.J.; Deng, S.M. Application of TOPSIS method in evaluating the effects of supply vaneangle of a task/ambient air conditioning system on energy utilization and thermal comfort. Appl. Energy 2016, 180, 536–545. [Google Scholar] [CrossRef]
- Sun, H.Y.; Wang, S.F.; Hao, X.M. An Improved analytic hierarchy process method for the evaluation of agricultural water management in irrigation districts of north China. Agric. Water Manag. 2017, 179, 324–337. [Google Scholar] [CrossRef]
- Abazar, S.; Amir, P.; Ramin, B.; Heidar, Z. Pre-processing data using wavelet transform and PCA based on support vector regression and gene expression programming for river flow simulation. J. Earth Syst. Sci. 2017, 126, 65. [Google Scholar] [CrossRef]
- Loucif, B.; Larbi, H. The effect of simple imputations based on four variants of PCA methods on the quantiles of annual rainfall data. Environ. Monit. Assess. 2018, 190, 569. [Google Scholar] [CrossRef]
- Shieh, M.Y.; Chiou, J.S.; Hu, Y.C.; Wang, K.Y. Applications of PCA and SVM-PSO based real-time face recognition system. Math. Probl. Eng. 2014, 2014, 1–12. [Google Scholar] [CrossRef]
- Zhang, J.; Song, W.; Jiang, B.; Li, M. Measurement of lumber moisture content based on PCA and GS-SVM. J. For. Res. 2018, 29, 557–564. [Google Scholar] [CrossRef]
- Lin, T.K. PCA/SVM-based method for pattern detection in a multisensor system. Math. Probl. Eng. 2018, 2018, 1–11. [Google Scholar] [CrossRef]
- Saaty, T.L. How to make a decision: The analytic hierarchy process. Eur. J. Oper. Res. 1990, 48, 9–26. [Google Scholar] [CrossRef]
- Zhang, H.; Polytechnic, W. Application on the entropy method for determination of weight of evaluating index in fuzzy mathematics for wine quality assessment. Adv. J. Food Sci. Technol. 2015, 7, 195–198. [Google Scholar] [CrossRef]
- Hwang, C.L.; Yoon, K. Multiple Attribute Decision Making-Method and Applications, A State-of-the-Art Survey; Springer: New York, NY, USA, 1981. [Google Scholar]
- Aghajani, M.; Mostafazadeh-Fard, B.; Navabian, M. Assessing Criteria Affecting Performance of the Sefidroud Irrigation and Drainage Network Using TOPSIS-Entropy Theory. Irrig. Drain. 2017, 66, 626–635. [Google Scholar] [CrossRef]
- Lou, Y.H.; Kang, S.Z.; Cui, N.B. Application of set pair analysis in the comprehensive water-saving irrigation development level evaluation. J. Sichuan Prov. Univ. (Eng. Sci. Ed.) 2014, 46, 20–27. [Google Scholar]
Figure 1.
Twenty-one cities (states) of Sichuan province.

Figure 2.
The key evaluation indexes between 21 regions of the Sichuan province. (a) The ratio of water-saving irrigation area to cultivated area (%) (L6); (b) the per capita income of the agriculture population (CNY) (M3); (c) the degree of support from the government (N4).
Figure 2.
The key evaluation indexes between 21 regions of the Sichuan province. (a) The ratio of water-saving irrigation area to cultivated area (%) (L6); (b) the per capita income of the agriculture population (CNY) (M3); (c) the degree of support from the government (N4).

Figure 3.
The water-saving irrigation development level (WIDL) in 21 regions of Sichuan province.


Table 1.
The index system of the comprehensive evaluation model for the water-saving irrigation development level (WIDL).
Table 1.
The index system of the comprehensive evaluation model for the water-saving irrigation development level (WIDL).
| Target Layer | System Layer | Index Layer | Source |
|---|---|---|---|
| Water-saving irrigation developing level | Engineering water-saving | Ratio of water-saving irrigation area to effective irrigation area (%) (L1) | B,D |
| Ratio of established high-efficient water-saving irrigation area to the total water-saving irrigation area (%) (L2) | C | ||
| Water efficiency of irrigation (L3) | C | ||
| Economic benefits per hm2 of water-saving irrigation (CNY) (L4) | D | ||
| Water usage amount per hm2 for irrigation (m3) (L5) | B,D | ||
| Ratio of water-saving irrigation area to cultivated area (%) (L6) | B,C | ||
| Main crops yield per unit (kg/hm2) (L7) | B | ||
| Per capita GDP (CNY) (L8) | D | ||
| Percentage of canal lining (%) (L9) | C | ||
| Percentage of working lining channels (%) (L10) | C | ||
| Water usage amount for agriculture (m3/hm2) (L11) | C,D | ||
| Agriculture investment (CNY/hm2) (L12) | B,C | ||
| Agronomy water-saving | Ratio of rice dry nursery seedling area to rice planting area (%) (M1) | B,D | |
| Ratio of area with the technique of “Thin-Shallow-Wet-Dry” to rice cultivated area (%) (M2) | D | ||
| Per capita income of agriculture population(CNY) (M3) | B | ||
| Ratio of drought tolerant crops cultivated area to all crops cultivated area (%) (M4) | B,D | ||
| Water use efficiency (Kg/m3) (M5) | C,D | ||
| Management water-saving | Establishment of subsidiary policies and regulations (N1) | A | |
| Reform execution situation of property system (%) (N2) | B,C | ||
| Construction level of technology popularizing system (N3) | B,C | ||
| Degree of support from the government (N4) | A | ||
| Propaganda and education level (N5) | A | ||
| User participation level (N6) | B,C | ||
| Water-saving engineering design level (N7) | A | ||
| Degree of engineering subsidiaries perfection(N8) | B | ||
| Management and maintained level of water-saving engineering (N9) | C | ||
| Rationality of irrigation system (N10) | A | ||
| Monitoring coverage rate of soil moisture (%) (N11) | C,D | ||
| Degree of popularizing water measurement (%) (N12) | B,C | ||
| Ratio of planned water use (N13) | C | ||
| Sound level of water-saving incentive mechanisms (N14) | A | ||
| Popularity rate of measurement charges of water (%) (N15) | B,C | ||
| Rationality of water price (N16) | C |
Note: A, B, C, and D respectively indicate the qualitative indexes, the 2014 Sichuan province Provincial Water Conservancy Statistical Yearbook, the 2014 Sichuan province Water Management Yearbook, and the 2014 Sichuan province Agricultural Yearbook.
Table 2.
The quantification of the management WIDL indexes in Sichuan province.
| NO. | Qualitative Indexes | Quantitative Value |
|---|---|---|
| 1 | N1 | 6.8 |
| 2 | N4 | 6.7 |
| 3 | N5 | 6.1 |
| 4 | N7 | 7.2 |
| 5 | N10 | 6.2 |
| 6 | N14 | 4.7 |
Table 3.
The thirty-three indexes of WIDL in Sichuan province and 21 regions.
| Region | L1 | L2 | L3 | L4 | L5 | L6 | L7 | L8 | L9 | L10 | L11 | L12 | M1 | M2 | M3 | M4 | M5 | N1 | N2 | N3 | N4 | N5 | N6 | N7 | N8 | N9 | N10 | N11 | N12 | N13 | N14 | N15 | N16 |
|---|---|---|---|---|---|---|---|---|---|---|---|---|---|---|---|---|---|---|---|---|---|---|---|---|---|---|---|---|---|---|---|---|---|
| Sichuan Province | 42.00 | 1.55 | 0.40 | 975 | 5595 | 28 | 5254 | 21,369 | 45.16 | 36.80 | 3121 | 515 | 7.50 | 14.70 | 2802 | 22 | 1.20 | 6.80 | 0.67 | 0.67 | 6.70 | 6.10 | 0.31 | 7.20 | 0.73 | 0.45 | 6.20 | 0.43 | 0.10 | 0.66 | 4.70 | 0.08 | 0.33 |
| Chengdu | 67.50 | 3.00 | 0.43 | 1286 | 7365 | 63 | 6134 | 41,253 | 72.00 | 32.40 | 7550 | 746 | 25.60 | 17.30 | 4485 | 31 | 1.12 | 7.00 | 0.98 | 0.90 | 9.20 | 6.40 | 0.50 | 7.30 | 0.83 | 0.80 | 7.20 | 0.55 | 0.15 | 0.98 | 6.00 | 0.13 | 0.44 |
| Zigong | 29.10 | 0.04 | 0.38 | 630 | 5280 | 19 | 5856 | 23,613 | 41.15 | 38.20 | 1843 | 705 | 2.70 | 0.01 | 3188 | 23 | 1.33 | 6.00 | 0.8 | 0.80 | 5.80 | 5.70 | 0.37 | 5.50 | 0.74 | 0.40 | 5.80 | 0.34 | 0.08 | 0.50 | 3.00 | 0.07 | 0.40 |
| Panzhihua | 66.16 | 0.72 | 0.43 | 1388 | 9690 | 51 | 5459 | 43,959 | 33.29 | 46.60 | 4580 | 510 | 6.50 | 55.60 | 3463 | 19 | 1.28 | 7.60 | 0.68 | 0.65 | 8.00 | 6.80 | 0.39 | 5.80 | 0.96 | 0.36 | 7.20 | 0.60 | 0.08 | 0.72 | 5.80 | 0.08 | 0.60 |
| Luzhou | 35.04 | 0.23 | 0.40 | 837 | 3345 | 21 | 5441 | 16,698 | 45.41 | 31.00 | 1694 | 659 | 2.00 | 1.70 | 3165 | 25 | 1.30 | 6.70 | 0.77 | 0.90 | 6.90 | 6.00 | 0.49 | 8.00 | 0.78 | 0.16 | 6.90 | 0.28 | 0.05 | 0.53 | 3.90 | 0.05 | 0.35 |
| Deyang | 53.49 | 0.07 | 0.41 | 1082 | 9090 | 45 | 6435 | 25,335 | 58.53 | 46.00 | 6944 | 524 | 50.00 | 41.00 | 3585 | 33 | 1.13 | 7.70 | 0.98 | 0.80 | 7.50 | 7.00 | 0.40 | 7.70 | 0.9 | 0.59 | 7.70 | 0.50 | 0.15 | 0.96 | 4.70 | 0.15 | 0.62 |
| Mianyang | 41.53 | 0.80 | 0.40 | 1074 | 6150 | 33 | 5332 | 20,053 | 61.00 | 36.80 | 4430 | 478 | 20.20 | 0.80 | 3179 | 34 | 1.36 | 7.20 | 0.66 | 0.70 | 7.20 | 6.20 | 0.39 | 6.80 | 0.6 | 0.72 | 5.60 | 0.51 | 0.13 | 0.82 | 4.40 | 0.13 | 0.58 |
| Guangyuan | 36.95 | 1.27 | 0.38 | 788 | 4215 | 20 | 5306 | 12,313 | 40.45 | 48.00 | 1696 | 585 | 2.40 | 54.80 | 2000 | 11 | 1.31 | 5.60 | 0.38 | 0.60 | 6.60 | 5.90 | 0.13 | 6.90 | 0.35 | 0.32 | 6.60 | 0.30 | 0.10 | 0.45 | 4.60 | 0.05 | 0.38 |
| Suining | 28.40 | 0.51 | 0.39 | 767 | 3495 | 25 | 5257 | 14,498 | 46.05 | 48.80 | 1992 | 566 | 9.70 | 22.00 | 2828 | 18 | 1.11 | 6.30 | 0.72 | 0.75 | 5.00 | 5.80 | 0.25 | 5.80 | 0.93 | 0.13 | 5.80 | 0.51 | 0.10 | 0.50 | 4.00 | 0.05 | 0.46 |
| Neijiang | 39.81 | 4.14 | 0.39 | 844 | 2700 | 29 | 4923 | 18,022 | 43.85 | 37.60 | 2007 | 579 | 4.70 | 17.10 | 2986 | 25 | 1.21 | 7.20 | 0.79 | 0.70 | 6.60 | 5.40 | 0.24 | 6.00 | 0.78 | 0.32 | 4.60 | 0.40 | 0.02 | 0.49 | 3.40 | 0.02 | 0.50 |
| Leshan | 18.91 | 5.73 | 0.39 | 870 | 9825 | 13 | 4720 | 22,490 | 47.26 | 36.00 | 4269 | 464 | 0.60 | 8.90 | 3241 | 26 | 1.06 | 5.40 | 0.69 | 0.75 | 6.10 | 6.30 | 0.50 | 6.10 | 0.89 | 0.55 | 6.00 | 0.45 | 0.15 | 0.62 | 5.00 | 0.12 | 0.55 |
| Nanchong | 37.59 | 0.05 | 0.37 | 806 | 3060 | 28 | 5589 | 13,212 | 52.59 | 52.60 | 1738 | 479 | 1.40 | 0.80 | 2646 | 29 | 1.41 | 7.30 | 0.91 | 0.50 | 6.60 | 6.60 | 0.30 | 8.40 | 0.74 | 0.88 | 6.90 | 0.38 | 0.13 | 0.78 | 5.10 | 0.11 | 0.70 |
| Meishan | 39.14 | 6.24 | 0.39 | 900 | 7530 | 41 | 5617 | 18,586 | 50.83 | 30.00 | 2987 | 454 | 10.10 | 32.50 | 3284 | 20 | 1.23 | 7.70 | 0.65 | 0.60 | 7.30 | 6.70 | 0.15 | 2.80 | 0.72 | 0.45 | 5.50 | 0.38 | 0.13 | 0.72 | 2.80 | 0.10 | 0.48 |
| Yibin | 51.01 | 0.46 | 0.39 | 854 | 2520 | 26 | 5585 | 19,499 | 55.32 | 32.80 | 2036 | 690 | 6.20 | 6.70 | 3068 | 31 | 1.08 | 5.60 | 0.71 | 0.75 | 3.40 | 5.30 | 0.26 | 3.40 | 0.62 | 0.68 | 5.10 | 0.39 | 0.10 | 0.55 | 4.90 | 0.06 | 0.45 |
| Guang’an | 28.28 | 0.22 | 0.39 | 780 | 2490 | 18 | 5571 | 15,588 | 34.13 | 46.00 | 1790 | 509 | 2.70 | 7.90 | 2915 | 19 | 1.32 | 6.40 | 0.73 | 1.00 | 6.80 | 6.40 | 0.50 | 8.00 | 0.78 | 0.55 | 4.20 | 0.30 | 0.09 | 0.45 | 2.80 | 0.07 | 0.38 |
| Dazhou | 34.19 | 0.01 | 0.38 | 770 | 1710 | 19 | 5221 | 14,623 | 52.04 | 54.00 | 1073 | 812 | 10.30 | 27.60 | 2943 | 29 | 1.43 | 7.70 | 0.74 | 0.70 | 6.20 | 5.50 | 0.24 | 6.80 | 0.79 | 0.50 | 6.00 | 0.31 | 0.06 | 0.46 | 6.00 | 0.06 | 0.33 |
| Ya’an | 38.23 | 0.00 | 0.38 | 714 | 10,200 | 32 | 4243 | 18,881 | 32.03 | 44.40 | 2847 | 431 | 2.10 | 0.01 | 2829 | 10 | 1.14 | 6.10 | 0.8 | 0.80 | 6.30 | 5.60 | 0.25 | 7.80 | 0.77 | 0.42 | 5.50 | 0.35 | 0.06 | 0.45 | 5.30 | 0.06 | 0.30 |
| Bazhong | 27.44 | 0.18 | 0.37 | 819 | 1560 | 14 | 5372 | 8717 | 34.54 | 52.00 | 4479 | 800 | 3.00 | 19.10 | 2031 | 10 | 1.33 | 6.50 | 0.73 | 0.50 | 8.00 | 7.50 | 0.38 | 7.50 | 0.73 | 0.32 | 7.50 | 0.30 | 0.07 | 0.40 | 2.80 | 0.07 | 0.45 |
| Ziyang | 39.99 | 0.82 | 0.38 | 966 | 4065 | 26 | 4318 | 16,644 | 41.79 | 20.00 | 1957 | 500 | 16.10 | 0.01 | 2988 | 23 | 1.29 | 5.80 | 0.56 | 0.50 | 5.80 | 5.30 | 0.37 | 7.50 | 0.87 | 0.33 | 5.00 | 0.40 | 0.05 | 0.55 | 3.50 | 0.05 | 0.50 |
| Aba | 9.65 | 2.49 | 0.36 | 630 | 3540 | 3 | 3100 | 14,662 | 28.43 | 23.60 | 1421 | 439 | 0.01 | 0.01 | 1881 | 5 | 1.01 | 3.10 | 0.001 | 0.001 | 3.00 | 3.20 | 0.001 | 3.20 | 0.35 | 0.001 | 2.80 | 0.001 | 0.001 | 0.001 | 5.30 | 0.001 | 0.001 |
| Ganzi | 16.39 | 0.70 | 0.36 | 602 | 1905 | 6 | 2824 | 11,659 | 27.80 | 46.00 | 590 | 327 | 0.01 | 0.01 | 1309 | 4 | 1.01 | 7.00 | 0.001 | 0.001 | 6.50 | 7.80 | 0.001 | 6.20 | 0.45 | 0.001 | 6.90 | 0.001 | 0.001 | 0.001 | 5.10 | 0.001 | 0.001 |
| Liangshan | 58.16 | 0.05 | 0.37 | 713 | 9600 | 23 | 4358 | 17,560 | 49.82 | 31.00 | 4120 | 302 | 0.01 | 0.01 | 2438 | 28 | 1.25 | 6.10 | 0.41 | 0.30 | 7.80 | 7.20 | 0.12 | 7.20 | 0.94 | 0.13 | 7.00 | 0.001 | 0.02 | 0.24 | 2.90 | 0.001 | 0.25 |
Table 4.
The eigenvalues and contribution rates of the principal components.
| No. | Eigenvalues | Contribution Rate (%) | Cumulative Contribution Rate (%) |
|---|---|---|---|
| F1 | 6.0462 | 50.3852 | 50.3852 |
| F2 | 1.7518 | 14.5984 | 64.9836 |
| F3 | 1.424 | 11.8667 | 76.8504 |
| F4 | 0.7881 | 6.5679 | 83.4182 |
| F5 | 0.7467 | 6.2224 | 89.6406 |
Table 5.
The loading matrix of the principal components.
| Evaluation Indexes | F1 | F2 | F3 | F4 | F5 |
|---|---|---|---|---|---|
| L1 | 0.35 | 0.15 | −0.04 | 0.15 | −0.34 |
| L2 | 0.08 | −0.55 | −0.11 | −0.13 | 0.41 |
| L3 | 0.57 | 0.09 | −0.01 | 0.23 | 0.18 |
| L4 | 0.37 | 0.05 | 0.52 | 0.27 | 0.16 |
| L5 | 0.27 | −0.33 | 0.29 | −0.41 | −0.33 |
| L6 | 0.58 | 0.05 | −0.07 | −0.01 | −0.04 |
| L7 | 0.25 | 0.36 | −0.32 | −0.21 | 0.24 |
| L8 | 0.35 | −0.07 | 0.14 | 0.28 | 0.01 |
| L9 | −0.03 | 0.57 | 0.24 | −0.52 | 0.27 |
| L10 | 0.25 | 0.06 | −0.56 | −0.18 | −0.03 |
| L11 | 0.17 | 0.14 | 0.63 | 0.13 | 0.27 |
| L12 | −0.32 | 0.26 | −0.12 | 0.47 | 0.65 |
Table 6.
The classification standard of the WIDL evaluation indexes.
| Indexes | I | II | III | IV | V |
|---|---|---|---|---|---|
| L3 | >0.6 | 0.5~0.6 | 0.45~0.5 | 0.40~0.45 | ≤0.40 |
| L4 | >2250 | 1650~2250 | 1050~1650 | 450~1050 | ≤450 |
| L6 | >60 | 60~45 | 45~30 | 30~15 | ≤15 |
| L9 | >75 | 60~75 | 50~60 | 35~50 | ≤35 |
| L12 | ≥1500 | 1200~1500 | 600~1200 | 300~600 | <300 |
| M2 | >50 | 35~50 | 15~35 | 5~15 | ≤5 |
| M3 | >8000 | 6000~8000 | 4000~6000 | 2000~4000 | ≤2000 |
| M5 | >1.75 | 1.35~1.75 | 1.0~1.35 | 0.8~1.0 | ≤0.8 |
| N3 | >0.86 | 0.71~0.86 | 0.56~0.71 | 0.40~0.56 | ≤0.40 |
| N4 | 9~10 | 7~9 | 5~7 | 3~5 | 0~3 |
| N7 | >7.94 | 7.02~7.94 | 6.10~7.02 | 5.18~6.10 | ≤5.18 |
| N11 | >0.50 | 0.40~0.50 | 0.30~0.40 | 0.20~0.30 | ≤0.20 |
| N12 | >0.12 | 0.10~0.12 | 0.07~0.10 | 0.04~0.07 | ≤0.04 |
| N14 | >5.41 | 4.78~5.41 | 4.15~4.78 | 3.52~4.15 | ≤3.52 |
Table 7.
The weights of each evaluation index.
| Target Layer | System Layer | Second-Class Weights | Indexes Layer | Third-Class Weights | Final Weights |
|---|---|---|---|---|---|
| Regional water-saving irrigation developing level | Engineering water-saving | 0.395 | L3 | 0.167 | 0.066 |
| L4 | 0.163 | 0.064 | |||
| L6 | 0.334 | 0.132 | |||
| L9 | 0.167 | 0.066 | |||
| L12 | 0.169 | 0.067 | |||
| Agronomy water-saving | 0.262 | M2 | 0.246 | 0.064 | |
| M3 | 0.378 | 0.099 | |||
| M5 | 0.376 | 0.098 | |||
| Management water-saving | 0.344 | N3 | 0.119 | 0.041 | |
| N4 | 0.274 | 0.094 | |||
| N7 | 0.266 | 0.092 | |||
| N11 | 0.116 | 0.040 | |||
| N12 | 0.114 | 0.039 | |||
| N14 | 0.111 | 0.038 |
Table 8.
The relative closeness (ε) of the water-saving irrigation development level in 21 regions of Sichuan province.
Table 8.
The relative closeness (ε) of the water-saving irrigation development level in 21 regions of Sichuan province.
| Region | ε | Level | Region | ε | Level |
|---|---|---|---|---|---|
| Sichuan province | 0.4754 | Poor | Nanchong | 0.4762 | Poor |
| Chengdu | 0.6418 | Good | Meishan | 0.5224 | General |
| Zigong | 0.4294 | Poor | Yibin | 0.4388 | Poor |
| Panzhihua | 0.6174 | Good | Guang’an | 0.4437 | Poor |
| Luzhou | 0.4627 | Poor | Dazhou | 0.4858 | General |
| Deyang | 0.5900 | Good | Ya’an | 0.4470 | Poor |
| Mianyang | 0.5022 | General | Bazhong | 0.4389 | Poor |
| Guangyuan | 0.4855 | General | Ziyang | 0.4535 | Poor |
| Suining | 0.4610 | Poor | Aba | 0.2996 | Poor |
| Neijiang | 0.4689 | Poor | Ganzi | 0.3328 | Poor |
| Leshan | 0.4110 | Poor | Liangshan | 0.4168 | Poor |
© 2019 by the authors. Licensee MDPI, Basel, Switzerland. This article is an open access article distributed under the terms and conditions of the Creative Commons Attribution (CC BY) license (http://creativecommons.org/licenses/by/4.0/).
Share and Cite
MDPI and ACS Style
Zhao, L.; Zhang, L.; Cui, N.; Liang, C.; Feng, Y. The Evaluation of Regional Water-Saving Irrigation Development Level in Humid Regions of Southern China. Water 2019, 11, 172. https://doi.org/10.3390/w11010172
AMA Style
Zhao L, Zhang L, Cui N, Liang C, Feng Y. The Evaluation of Regional Water-Saving Irrigation Development Level in Humid Regions of Southern China. Water. 2019; 11(1):172. https://doi.org/10.3390/w11010172
Chicago/Turabian StyleZhao, Lu, Lili Zhang, Ningbo Cui, Chuan Liang, and Yi Feng. 2019. "The Evaluation of Regional Water-Saving Irrigation Development Level in Humid Regions of Southern China" Water 11, no. 1: 172. https://doi.org/10.3390/w11010172
Note that from the first issue of 2016, this journal uses article numbers instead of page numbers. See further details here.