Technical Note

Study on Applicability of Conceptual Hydrological Models for Flood Forecasting in Humid, Semi-Humid Semi-Arid and Arid Basins in China

1
State Key Laboratory of Simulation and Regulation of Water Cycle in River Basin, Research Center on Flood & Drought Disaster Reduction of the Ministry of Water Resources, China Institute of Water Resources and Hydropower Research, Beijing 100038, China
2
State Key Laboratory of Hydroscience and Engineering, Department of Hydraulic Engineering, Tsinghua University, Beijing 100084, China
3
State Key Laboratory of Simulation and Regulation of Water Cycle in River Basin, China Institute of Water Resources and Hydropower Research, Beijing IWHR Corporation, Beijing 100048, China
4
Department of Civil Engineering and Environmental Science, University of Oklahoma, Norman, OK 73072, USA
*
Authors to whom correspondence should be addressed.
Water 2017, 9(10), 719; https://doi.org/10.3390/w9100719
Submission received: 23 August 2017 / Revised: 6 September 2017 / Accepted: 15 September 2017 / Published: 28 September 2017

Abstract

:
Flood simulation and forecasting in various types of watersheds is a hot issue in hydrology. Conceptual hydrological models have been widely applied to flood forecasting for decades. With the development of economy, modern China faces with severe flood disasters in all types of watersheds include humid, semi-humid semi-arid and arid watersheds. However, conceptual model-based flood forecasting in semi-humid semi-arid and arid regions is still challenging. To investigate the applicability of conceptual hydrological models for flood forecasting in the above mentioned regions, three typical conceptual models, include Xinanjiang (XAJ), mix runoff generation (MIX) and northern Shannxi (NS), are applied to 3 humid, 3 semi-humid semi-arid, and 3 arid watersheds. The rainfall-runoff data of the 9 watersheds are analyzed based on statistical analysis and information theory, and the model performances are compared and analyzed based on boxplots and scatter plots. It is observed the complexity of drier watershed data is higher than that of the wetter watersheds. This indicates the flood forecasting is harder in drier watersheds. Simulation results indicate all models perform satisfactorily in humid watersheds and only NS model is applicable in arid watersheds. Model with consideration of saturation excess runoff generation (XAJ and MIX) perform better than the infiltration excess-based NS model in semi-humid semi-arid watersheds. It is concluded more accurate mix runoff generation theory, more stable and efficient numerical solution of infiltration equation and rainfall data with higher spatial-temporal resolution are main obstacles for conceptual model-based flood simulation and forecasting.

1. Introduction

With the development of community economy, the trend of urbanization is increasing day by day [1,2]. Compared to traditional natural economy, modern cities and human societies are much more fragile when facing with natural disasters such as floods [3,4,5,6,7], droughts and air pollution [8], etc. The requirements of timely flood forecasting with high accuracy and good reliability become more urgent. Hydrological models, which mimic the natural hydrological processes based on physical and/or empirical laws, have played important roles in modern flood forecasting. There are mainly three kinds of hydrological models which including data-driven (or referred to as black-box) models, conceptual models, and physically-based fully-distributed models. Reviewing the development history of hydrological models, the conceptual hydrological models have been recognized as effective and efficient tools for hydrological simulation and flood forecasting. They possess several advantages over other kinds of hydrological models [9,10,11], such as better computational efficiency, simplicity, and applicability than most physically-based fully-distributed hydrological models, and clearer physical meaning of the model parameters than the black-box models [12,13,14,15,16,17,18,19,20,21,22,23,24], etc. Therefore, the conceptual hydrological models have become the mainstream flood forecasting tools in China nowadays.
Flood forecasting was mainly focused on humid areas such as southern areas of the Yangtze River in China many year ago. This is because most severe and frequently happened flood disasters were located in humid areas of China. The demands of humid area flood forecasting hasten the birth of a storage excess runoff generation-based Xinanjiang watershed rainfall-runoff hydrological model (XAJ) [25,26,27,28]. The XAJ model assumes rainfall first satisfies the water storage deficit until the vadose zone water storage is full, after that runoff is generated. The XAJ model has been widely applied in China and many other countries for decades. It has achieved great success in flood simulation and forecasting in humid and semi-humid areas in China for many years.
However, with the further development of community economy, the increasingly urgent demands for flood forecasting in arid areas have become a hot issue in water science. The flood forecasting in arid areas is a completely different scientific and engineering problem compared to its counterpart in humid areas. The storage excess runoff generation mechanism lapses in arid watersheds. The vegetation of the arid area is usually poor and the vadose zone is very thick. Additionally, in arid areas, the rainfall intensity is usually very large however the total rainfall amount and rainfall duration are small. Consequently, water storage deficit of vadose zone usually cannot be satisfied by rainfall during single flood event and there is almost no runoff generated if follows the storage excess theory. Therefore, the simulated peak flows are usually very small if the hydrological models follow the concept of storage excess. In order to solve the problems encountered in arid area flood forecasting, an infiltration excess runoff generation-based Northern Shaanxi watershed rainfall-runoff hydrological model (NS) is proposed [25]. The NS model follows the Hortonian runoff generation concept and describes the rainfall-runoff process using theoretical or empirical infiltration curves such as Horton or Philip curves. The net rainfall is compared with the infiltration capability of the vadose zone at each time step to determine whether to generate runoff or directly infiltrate downward to satisfy the vadose zone water storage deficit. The NS model has been applied in northern areas of Shaanxi province and becomes a useful tool in arid area flood forecasting. Because the infiltration curves are very sensitive to rainfall intensity, the NS model requires as short as possible observation time of the meteorological data such as less than 10 min.
In China, lots of watersheds can be categorized into either storage excess-based watershed or infiltration excess-based watershed, and the flood forecasting usually achieves satisfactory accuracy using XAJ and NS models, respectively. However, further flood forecasting applications reveal that the storage excess and infiltration excess runoff generation mechanisms cannot be considered solely for some watersheds. For these watersheds, the forecasting accuracies of the XAJ and NS models are poor. On the other hand, for a specific typical humid or arid area, although most flood events can be simulated very well, there are some flood events which cannot be satisfactorily simulated by solely using the XAJ or NS model. Due to the complex spatial-temporal variations and heterogeneities of the meteorological forcing, hydrological processes, and geological underlying conditions, the storage excess and infiltration excess mechanisms may interweave with each other. For a specific watershed, storage excess and infiltration excess can successively happen at a specific location for different time or can simultaneously happen at different locations at the same time. This fact urges researchers to develop hydrological models which can simultaneously consider the storage and infiltration excess mechanisms. The invention of the mix runoff generation model alleviates this problem to some extent [29,30,31]. There are generally two kinds of mix runoff generation models which contain vertical mix [32,33,34,35] and area proportional mix models [36]. The vertical mix model considers that the infiltration excess runoff generates immediately after the rainfall drops onto the soil-atmosphere interface. The infiltrated water first satisfies the vadose zone water storage deficit and then generates saturated excess runoff according to the storage excess mechanism. The area proportional mix model describes the proportions of storage excess and infiltration excess runoff generations utilizing an area proportional coefficient Carea. The model assumes that the storage excess runoff happens on Carea area of the watershed and the infiltration excess runoff happens on the remainder 1-Carea area of the watershed. Researchers indicate that the applicability of area proportional mix model is not satisfactory due to the Carea value is usually set to a constant which causes forecast accuracy deterioration. In fact, the proportion of storage excess and infiltration excess usually varies at different locations and time. The constant assumption introduces simulation error and uncertainty [37]. On the other hand, the concept of using dynamic Carea value other than a constant value may contribute to the improvement of simulation accuracy and seems closer to the hydrological-physical processes, however, the dynamic identification of the Carea value is a very hard work which has not been properly solved by now. Therefore, many researchers and hydrologists tend to accept the vertical mix model owe to its parsimonious parameters and easy implementation. Additionally, the vertical mix model is theoretically acceptable to some extent, considering the hydrological-physical processes of the combined infiltration and storage excess runoff generation mechanisms, and the simulation accuracy is satisfactory and acceptable.
Although the success, that achieved by the XAJ, NS, and mix models in flood forecasting around China, has aroused great interests to further investigate hydrological processes using conceptual models, the flood forecasting in various types of watersheds, such as humid, semi-humid semi-arid and arid areas, is still challenging. Especially in semi-humid semi-arid and arid watersheds, flood forecasting with reliable and satisfactory accuracy is still very difficult. The reasons of this hard problem are complicated. Until recently, the mix runoff generation mechanism is still not mature enough to fully and convincingly explain the natural phenomena and hydrological processes in semi-humid semi-arid regions. No conceptual model can perfectly mimic the real hydraulic and hydrological processes in these regions. Therefore, the mix runoff generation model applied by now is still not reliable enough when facing with rainfall-runoff simulations of high complexity and spatial-temporal heterogeneity. For the arid region flood forecasting, it is also very difficult. Although hydrologists and mathematicians have devoted themselves to the theoretical solutions of the Richards equation and Darcy’s law in unsaturated and saturated infiltration problems, the analytic solutions are yet impossible to obtain. Numerical solution methods are not always successful: the iterations may not converge to a stable solution in some occasions. In the case of numerical solutions are obtainable, the computational burden is very high and the convergence speed is too slow. Other researchers switch to the utilization of empirical infiltration curves owe to their simplicity and better computational efficiency. The spatial-temporal resolutions of hydrological-meteorological data are also important impact factors to the flood forecasting in arid areas. When using infiltration curves, it is very sensitive to the rainfall intensity. According to previous real world application experiences, the expected time interval resolution is usually less than 10 min. However, the high resolution data is scarce in most arid watersheds. That is a big obstacle.
In this study, we apply three widely used conceptual rainfall-runoff hydrological models (XAJ, NS, and MIX models) in 9 typical watersheds, which locate in humid, semi-humid semi-arid, and arid regions, to investigate the applicability of everyday utilized conceptual models. Because the everyday obtainable event-based rainfall-runoff data used for real-time flood forecasting is 1-h data in China, we adopted 1-h as our research data time interval. The three conceptual models are applied to all kinds of watersheds to test the applicability and generality of each model to different types of watersheds. Accuracies and stabilities are compared and analyzed among all models and all types of watersheds. Some useful advices will be given to model developers and users as guidelines when building flood forecasting schemes in humid, semi-humid semi-arid, and arid watersheds. Finally, the development trend of conceptual hydrological models is also prospected.

2. Data and Methods

2.1. XAJ Model

The XAJ model [24,25,26,27,28] is proposed in 1973 for the purpose of Xinanjiang reservoir inflow forecast. It is a rainfall-runoff watershed model and is highly suited to the hydrological simulation and forecasting in humid and semi-humid regions. The core of the XAJ model is the concept of saturation excess runoff generation mechanism which describes the runoff generation processes usually happen in humid and semi-humid regions. The XAJ model is a semi-distributed conceptual model. It separates the whole watershed into several sub-basins according to the rainfall stations and Thiessen polygon method. The evapotranspiration, runoff generation, and flow concentration computations are carried out for each sub-basin. The generated runoff is separated into three components, which includes surface runoff, interflow, and groundwater, and then concentrated using multiple linear reservoirs and lag-and-route method, respectively. The above mentioned computations generate the discharge of each sub-basin. The discharges of sub-basins are then routed down the river channels to the whole watershed outlet using the Muskingum successive routing method. Detailed descriptions of principles of the XAJ model can be found in relevant literatures [24,25,26,27,28].

2.2. NS Model

The NS model [25] is developed during 1964~1966 in China. Prof. Renjun Zhao and his colleagues study the rainfall-runoff characteristics of the Zizhou runoff test station in the loess plateau of northern Shaanxi province. They infer that the runoff generation mechanism in the arid regions is mainly infiltration excess and then validate its correctness in northern Shaanxi province. It can be applied to the flood forecasting in arid regions such as the loess plateau. The main principle of the NS model is the concept of infiltration excess runoff generation. The model adopts the Hortonian infiltration curve method to compute the infiltration excess surface runoff and the infiltrated water replenishes the vadose zone water storage deficit. Therefore, there is no interflow and groundwater runoff generated in NS model. The correctness of these assumptions has been verified by the observed rainfall-runoff data and these assumptions are consistent with the physical-hydrological processes of the arid regions. The whole watershed is separated into several sub-basins according to Thiessen polygon method to carry out the evapotranspiration, runoff generation, and flow concentration computations using conceptual evapotranspiration method, Horton infiltration curve method, and lag-and-route method, respectively. The spatial heterogeneity of the infiltration capacity is very important in arid regions. Therefore, the NS model uses a distribution curve to describe the spatial distribution of infiltration capacity in each sub-basin. The generated discharges of sub-basins are then routed down the river channels to the whole watershed outlet using the Muskingum successive routing method. Furthermore, the NS model is very sensitive to the temporal resolution of the rainfall data and usually requires short computational time step. Detailed descriptions of the NS model can be found in relevant literatures [25].

2.3. MIX Model

The MIX model [32,33,34,35] adopted in this research is based on the vertical mix runoff generation mechanism. The vertical mix runoff generation mechanism couples the infiltration excess and saturation excess processes together to describe the runoff generation dynamics of semi-humid semi-arid regions. The rainfall, which falls on the ground surface, is first divided into surface runoff and infiltration flow according to the improved Green-Ampt infiltration excess curve, and then the infiltrated water is accepted by a saturation excess-based module to compute the saturation surface runoff, interflow, and groundwater runoff, respectively. The whole watershed is subdivided into several sub-basins to represent the spatial heterogeneity of the rainfall data. Within each sub-basin, the spatial heterogeneity of the infiltration and water storage capacities are considered adopting distribution curves. The generated discharges of sub-basins are then routed down the river channels to the whole watershed outlet using the Muskingum successive routing method. Detailed descriptions of the model principles can be found in relevant literatures [32,33,34,35].

2.4. SCE-UA Method

In this research, the optimal parameters of the XAJ, NS, and MIX models are obtained using the widely applied SCE-UA global optimization method which is proposed by Duan at the University of Arizona. It can locate the global optimal parameter set precisely and stably, and is highly suited to the hydrological model parameter calibration. Detailed principles of the SCE-UA method can be found in publications of Duan [38,39,40,41].
In this research, the objective functions used for model calibration are chosen as follows. Considering the flood forecasting standard of China, we choose 4 criteria and adopt the weighted value as the final objective function. The 4 criteria are total volume relative error (TVRE), peak flow relative error (PFRE), peak flooding time error (PFTE), and Nash-Sutcliffe coefficient of efficiency (NSCE). Their weights adopt the same value, which means that we think the 4 criteria are of same importance and significance. Therefore, the equation of the objective function is Obj = TVRE + PFRE + PFTE + NSCE.

2.5. Information Theory Based Data Analysis Method

In order to compare the complexity of flood forecasting in different types of watersheds, we analyze the observed rainfall-runoff data by using the information theory based method before the model simulations. Based on the observed rainfall-runoff data, we reconstruct the rainfall-runoff mapping relationship for different types of watersheds at each observation time step t as [17]
Q t = F [ PMI _ IVS ( P t , P t 1 , , P t n P + 1 ) ]
where Qt denotes the observed watershed outlet discharge at time step t; Pt i denotes the observed areal mean rainfall at time step ti; i = 0, 1, …, nP − 1; nP denotes the maximum order of the rainfall; F denotes the mapping relationship which represents the complexity contained in the observed rainfall-runoff data; PMI_IVS denotes partial mutual information (PMI) based input variable selection (IVS) method.
For a given watershed, using the observed rainfall-runoff data, we generate a set of input-output samples according to Equation (1). For time step t, the input variables or features are P t , P t 1 , , P t n P + 1 and the corresponding output is Qt. In order to verify the complexity contained in the observed rainfall-runoff data for a given watershed, we carry out the following three operations:
(a)
We adopt the PMI-based input variable selection method to select the most significant input variables. This operation will determine the minimum set of input variables that can satisfactorily represents the rainfall-runoff mapping relationship contained in the original data set.
(b)
Compute the mutual information (MI) between the selected input variables and the output discharge time series for the study watershed.
(c)
Compare MI of different types of watersheds. A higher MI value indicates that the useful information contained in the rainfall-runoff mapping relationship is sufficient. On the other hand, lower MI value indicates a mapping relationship with insufficient information.
Detailed descriptions of the PMI and MI methods can be found in relevant publications [42,43,44,45,46,47,48,49].

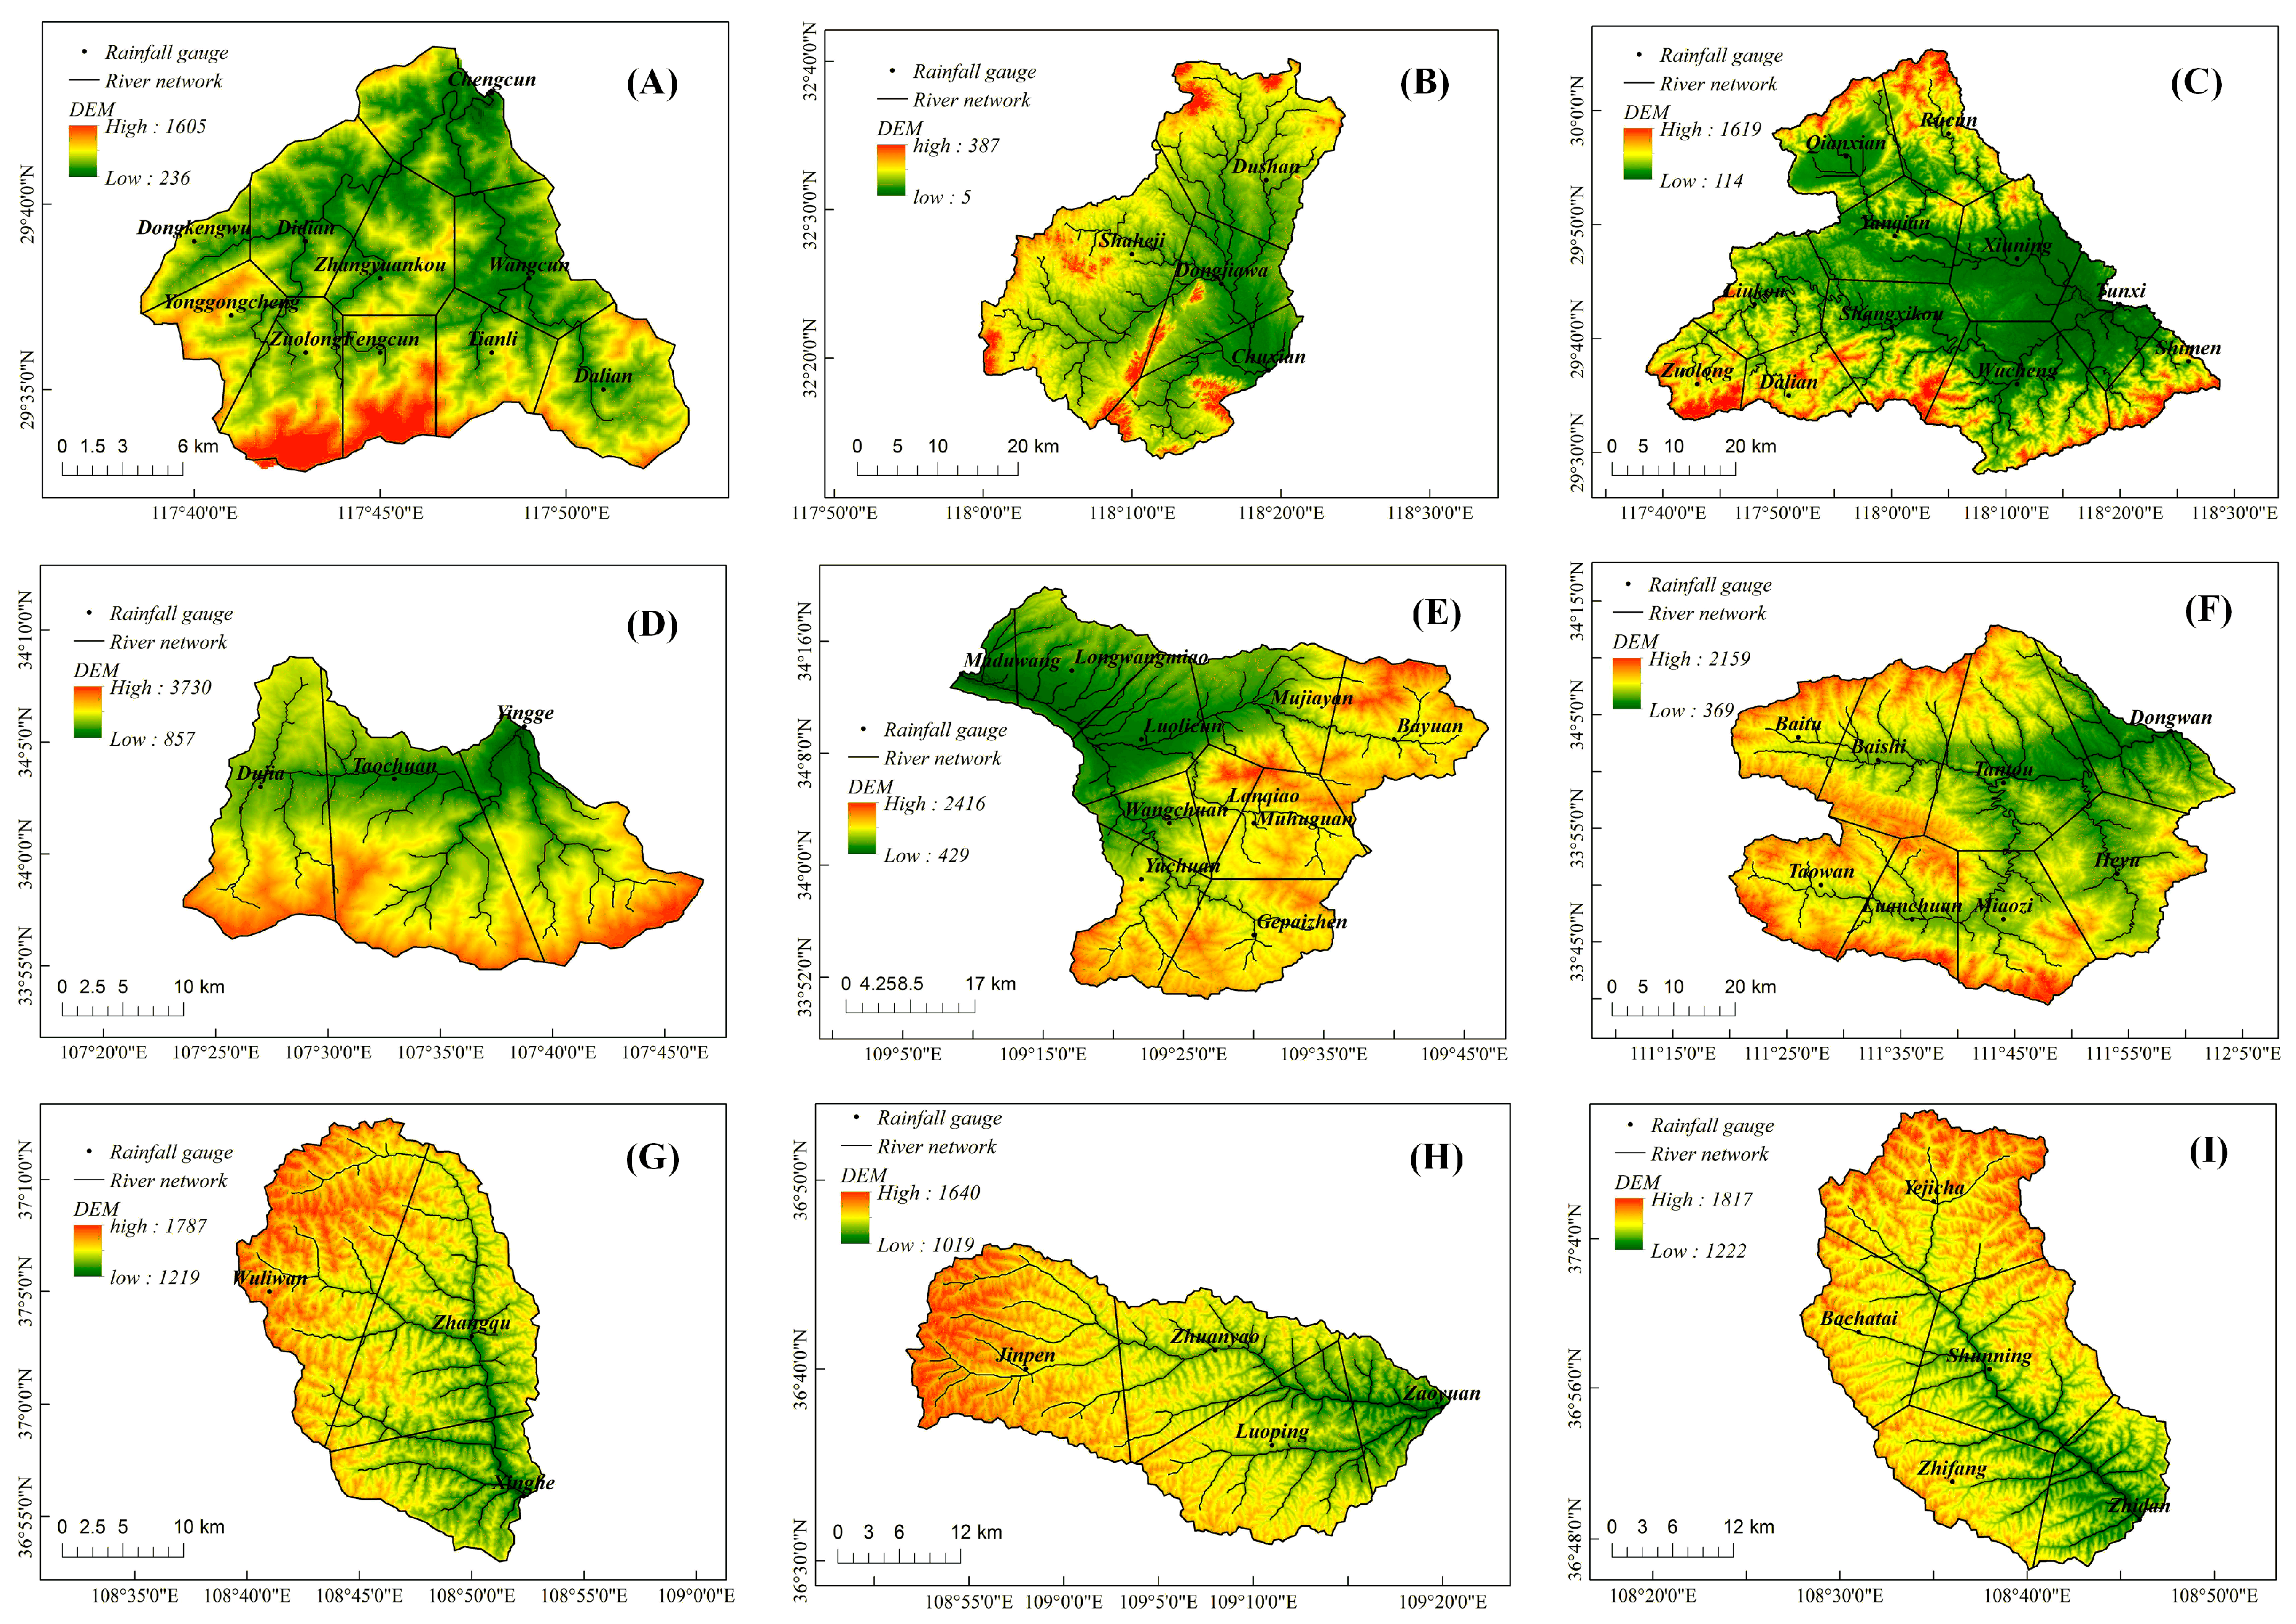
2.6. Descriptions of the Nine Study Watersheds

We selected nine Chinese watersheds for the comparison of conceptual flood forecasting models applied in different types of watersheds. These watersheds contain humid, semi-humid semi-arid, and arid watersheds around China. Detailed characteristics and descriptions of the nine watersheds can be found in Table 1 and the following paragraphs. Watershed map can be found in Figure 1. The rainfall stations and hydrometric stations are marked in Figure 1. The name of the hydrometric station is same with the watershed name.
(1) Chengcun watershed. The Chengcun watershed is located in the Qiantang river watershed and is a typical humid watershed. The flood rises and fades away rapidly and the flash flood frequently happens in this region. 20 flood events of the Chengcun watershed are selected as rainfall-runoff data.
(2) Chuxian watershed. The Chuxian watershed is located in the Chu river watershed and it is between Jiangsu and Anhui provinces. It sits in the transition zone of subtropical and warm humid zone. The climate is mild and the rainfall is moderate. The intra annual rainfall is unevenly distributed. 15 flood events of the Chuxian watershed are selected as rainfall-runoff data.
(3) Tunxi watershed. The Tunxi watershed is located in the mountainous areas of the south Anhui province and sits near southeast coast of China. This region is a subtropical monsoon climate zone. The region has four distinct seasons. The mean slope of the whole watershed is steep and the vegetation is good which include evergreen coniferous forest, deciduous broad-leaved forest, mixed forest, forest land, woodland grassland, pasture land and crop land. 30 flood events of the Tunxi watershed are selected as rainfall-runoff data.
(4) Yingge watershed. The Yingge watershed sits in Taibai county of the Shaanxi province. It is located in the Shitou river watershed. The Shitou river originates from the northern foot of the main ridge of Qinling mountains and runs through the Taibai county. The length of the Shitou river is 68.6 km and the mean slope is 25.0 ‰. The vegetation of the Yingge river watershed is good. The watershed is located in the warm temperate continental monsoon climate zone. 14 flood events of the Yingge watershed are selected as rainfall-runoff data.
(5) Maduwang watershed. The Maduwang watershed is located in the Maduwang village of the Xi’an city and is a typical semi-humid semi-arid watershed. The hydrographs of the Maduwang watershed rise up and go down rapidly and are usually slim. 13 flood events of the Maduwang watershed are selected as rainfall-runoff data.
(6) Dongwan watershed. The Dongwan watershed is located in the Yellow River watershed, China. Climatologically, it is a semi-humid catchment. The floods of Dongwan watershed have characteristics of both saturation excess and infiltration excess runoff generations. 20 flood events of the Dongwan watershed are selected as rainfall-runoff data.
(7) Xinghe watershed. Xinghe watershed is located in the Xinghe town Zhidan county Yan’an city of Shaanxi province. The Xinghe gauge station is the control station of the Xingzi river of Yan river in the Yellow river watershed. The historical maximum discharge is 696 m3/s happened on 26 August 1984. The river bed is full of rock and the peak flows rise and go down rapidly. The flood event duration is very short. 8 flood events of the Xinghe watershed are selected as rainfall-runoff data.
(8) Zaoyuan watershed. Zaoyuan watershed sits in the Shangbiangou village Zaoyuan county of Yan’an city in Shaanxi province. The Zaoyuan gauge station is the control station of Xichuan river of Yan river in the Yellow river watershed. The shape of the rating curves is rope-like. The rating curves of medium and low flows are significantly messy. The erosion and deposition are very severe. The historical maximum discharge is 2460 m3/s happened in 1989. Because the Zaoyuan watershed is very arid, the number of flood events is significantly less than other watersheds. 4 flood events of the Zaoyuan watershed are selected as rainfall-runoff data.
(9) Zhidan watershed. The Zhidan watershed is located in the Yellow River watershed, China. Climatologically, it is an arid catchment. The slope of rivers varies frequently. The vegetation of the watershed is poor and the soil erosion is serious. It lies in the middle temperate arid region and the limate is the continental monsoon climate. 6 flood events of the Zhidan watershed are selected as rainfall-runoff data.

3. Results and Discussion

3.1. Data Analysis of the 9 Study Watersheds

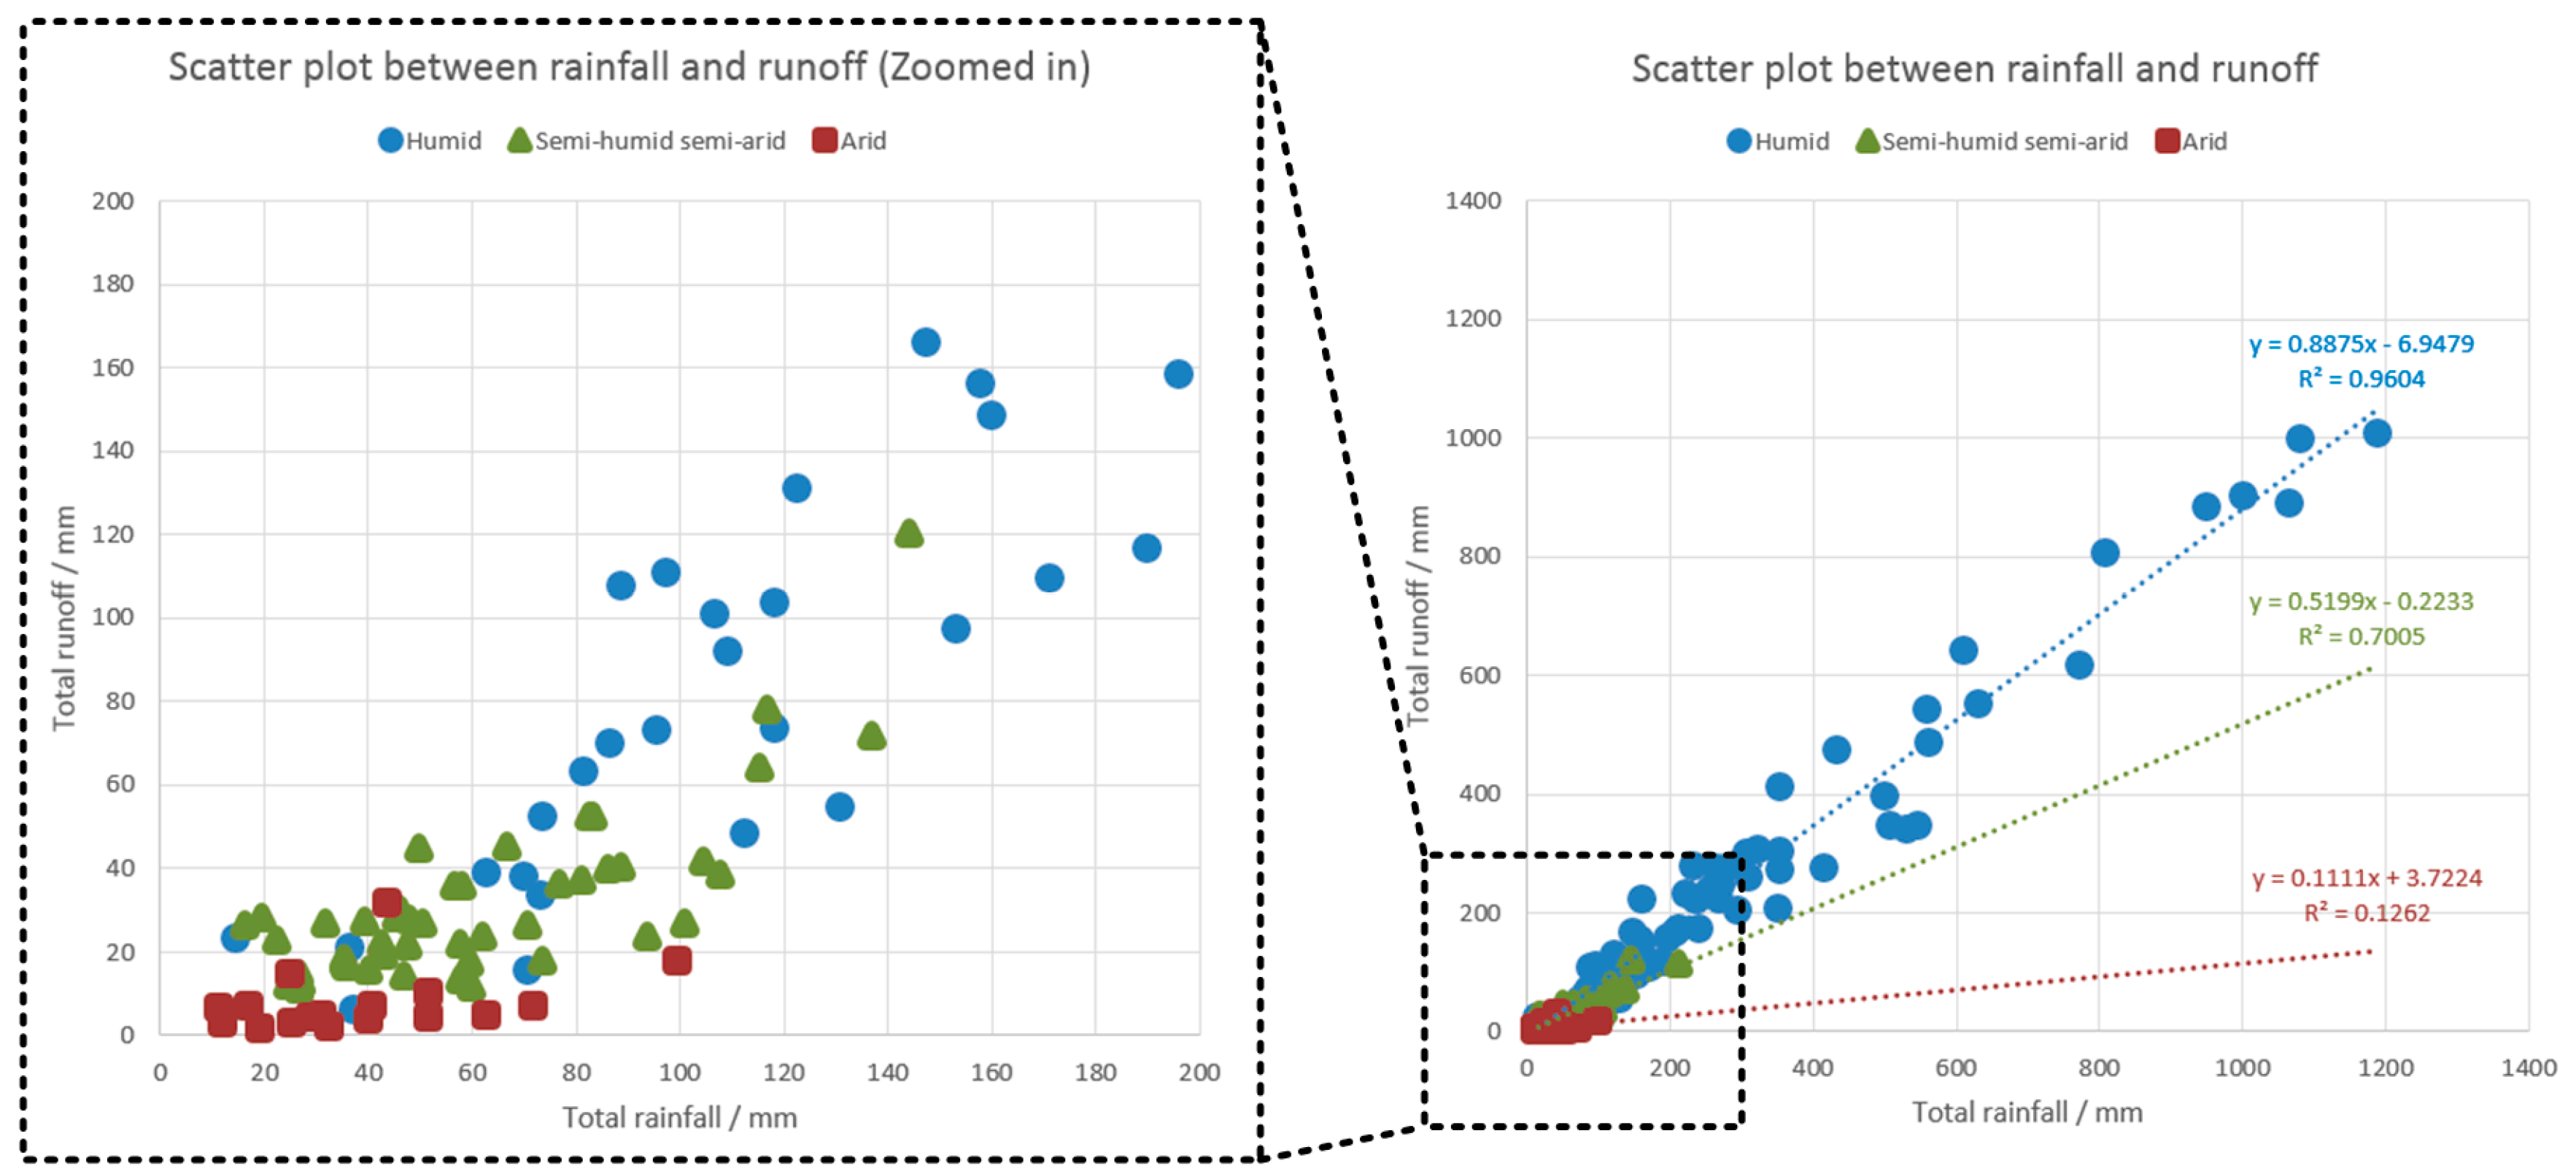
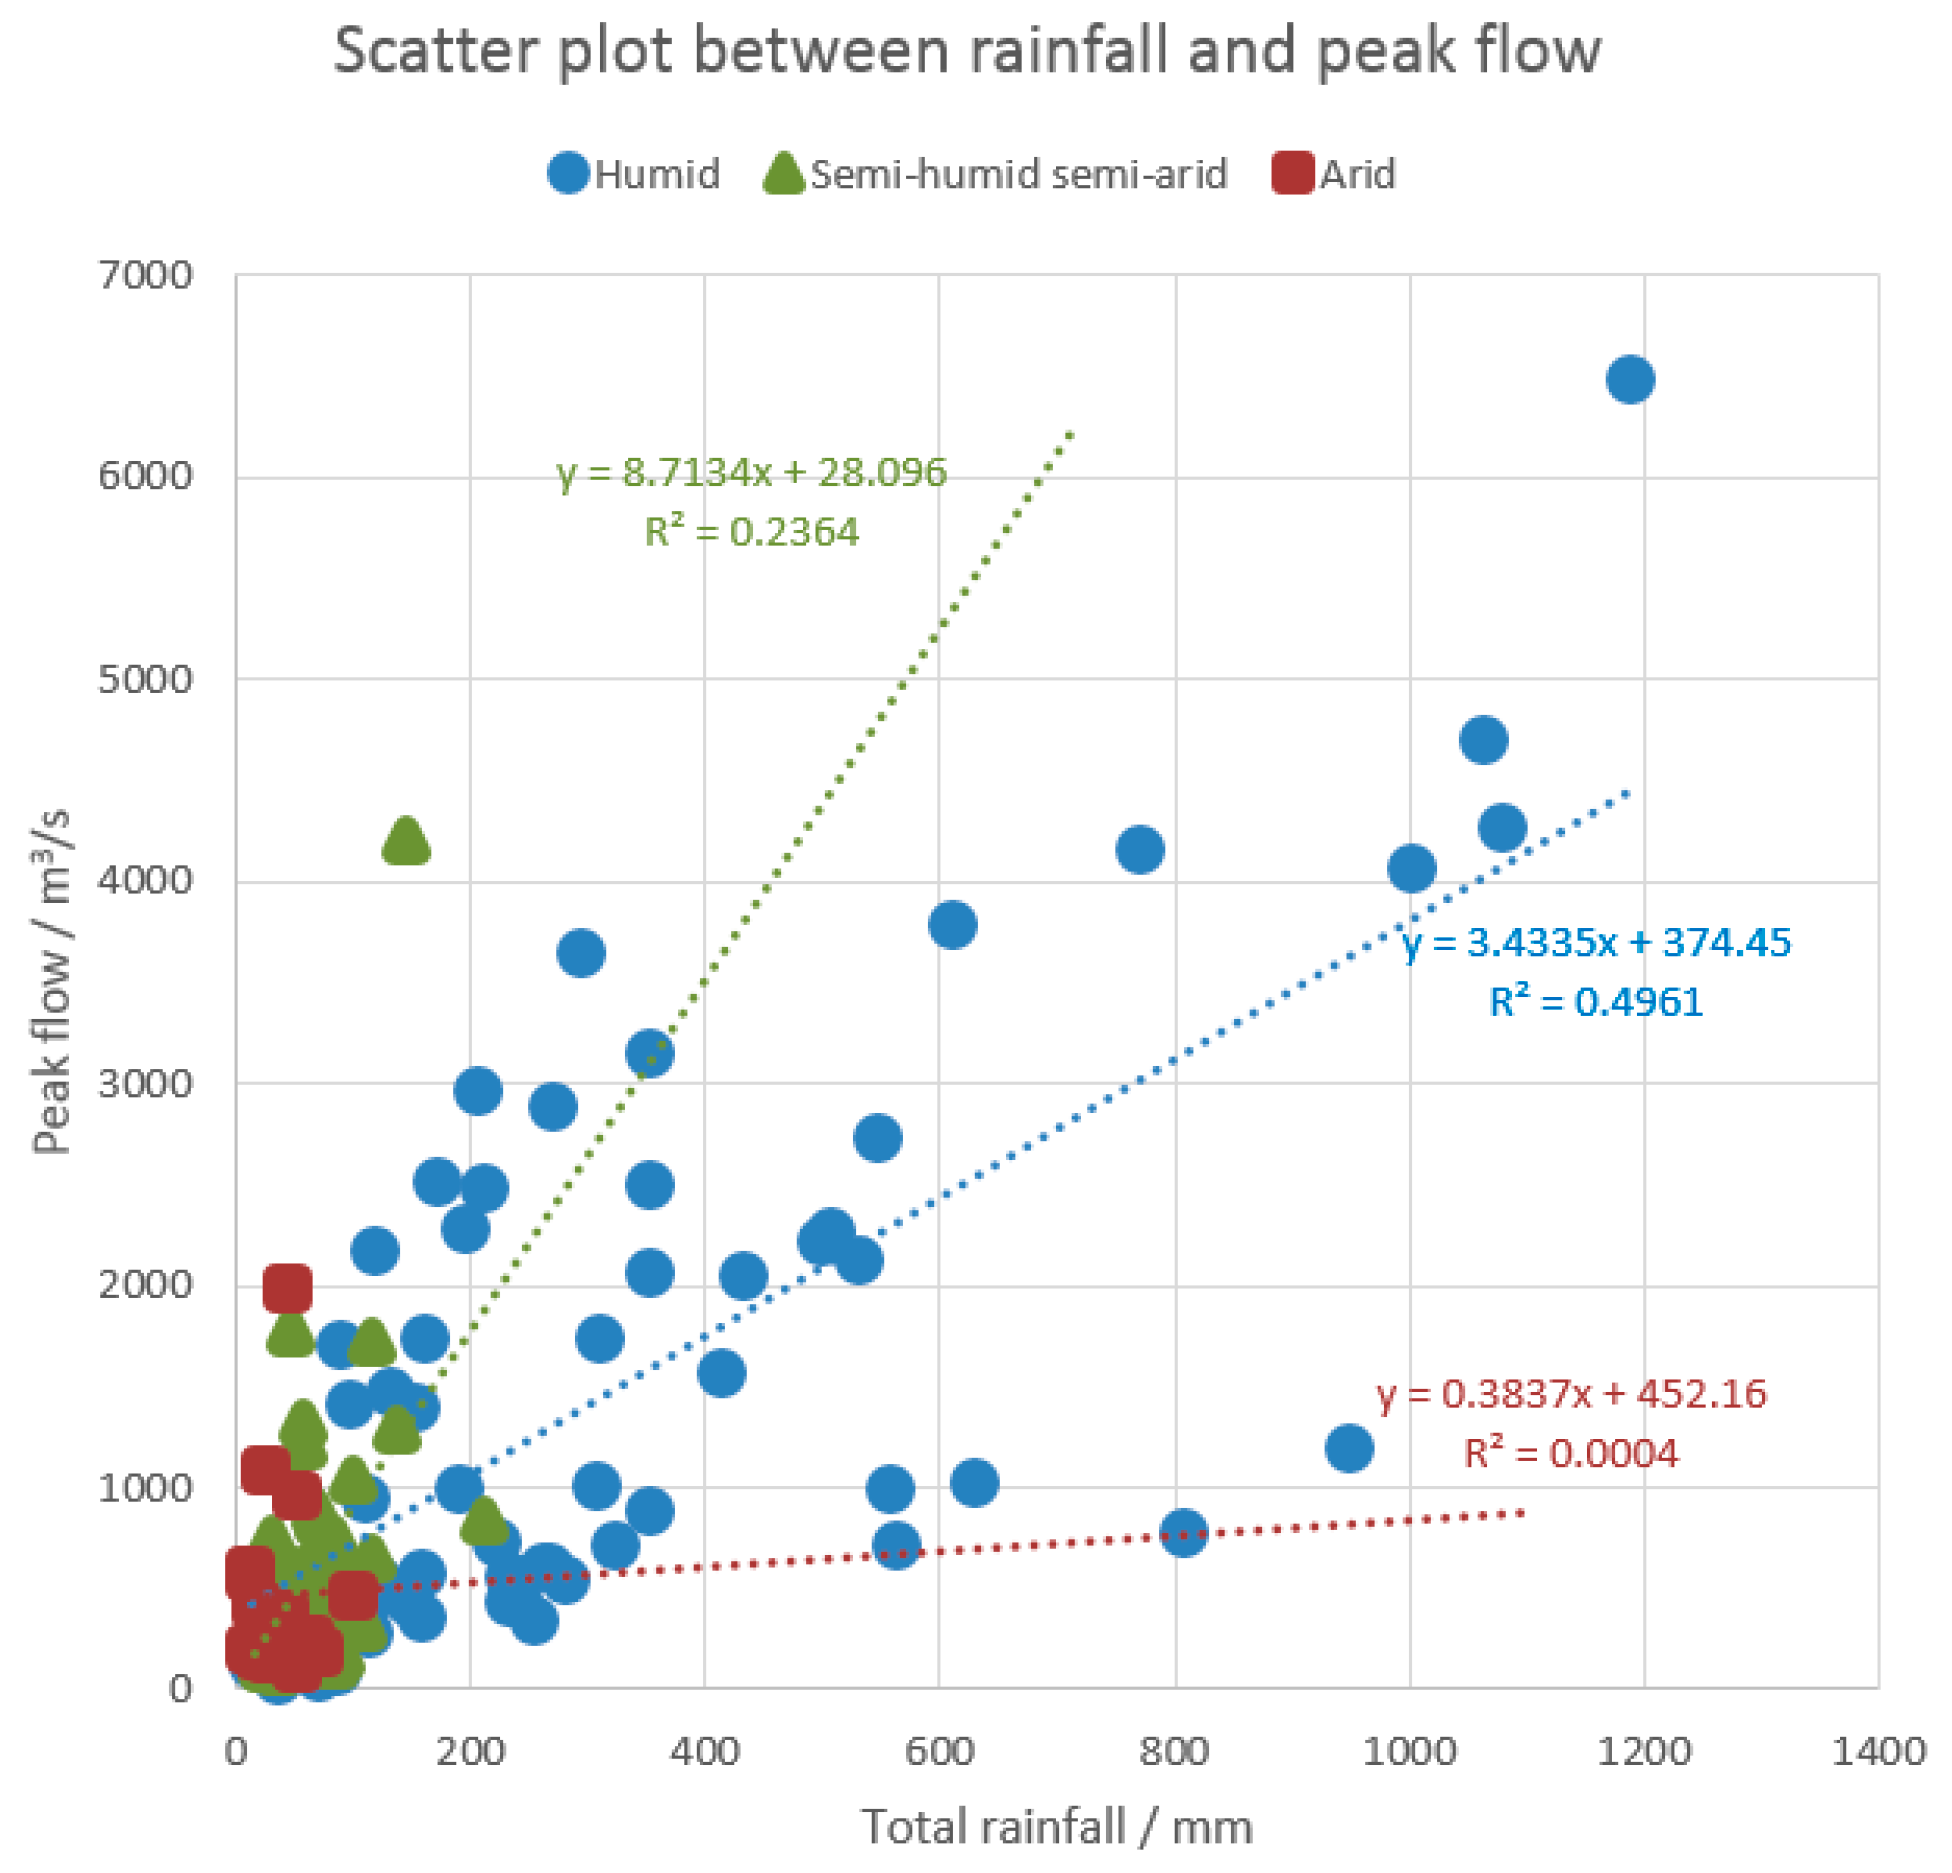
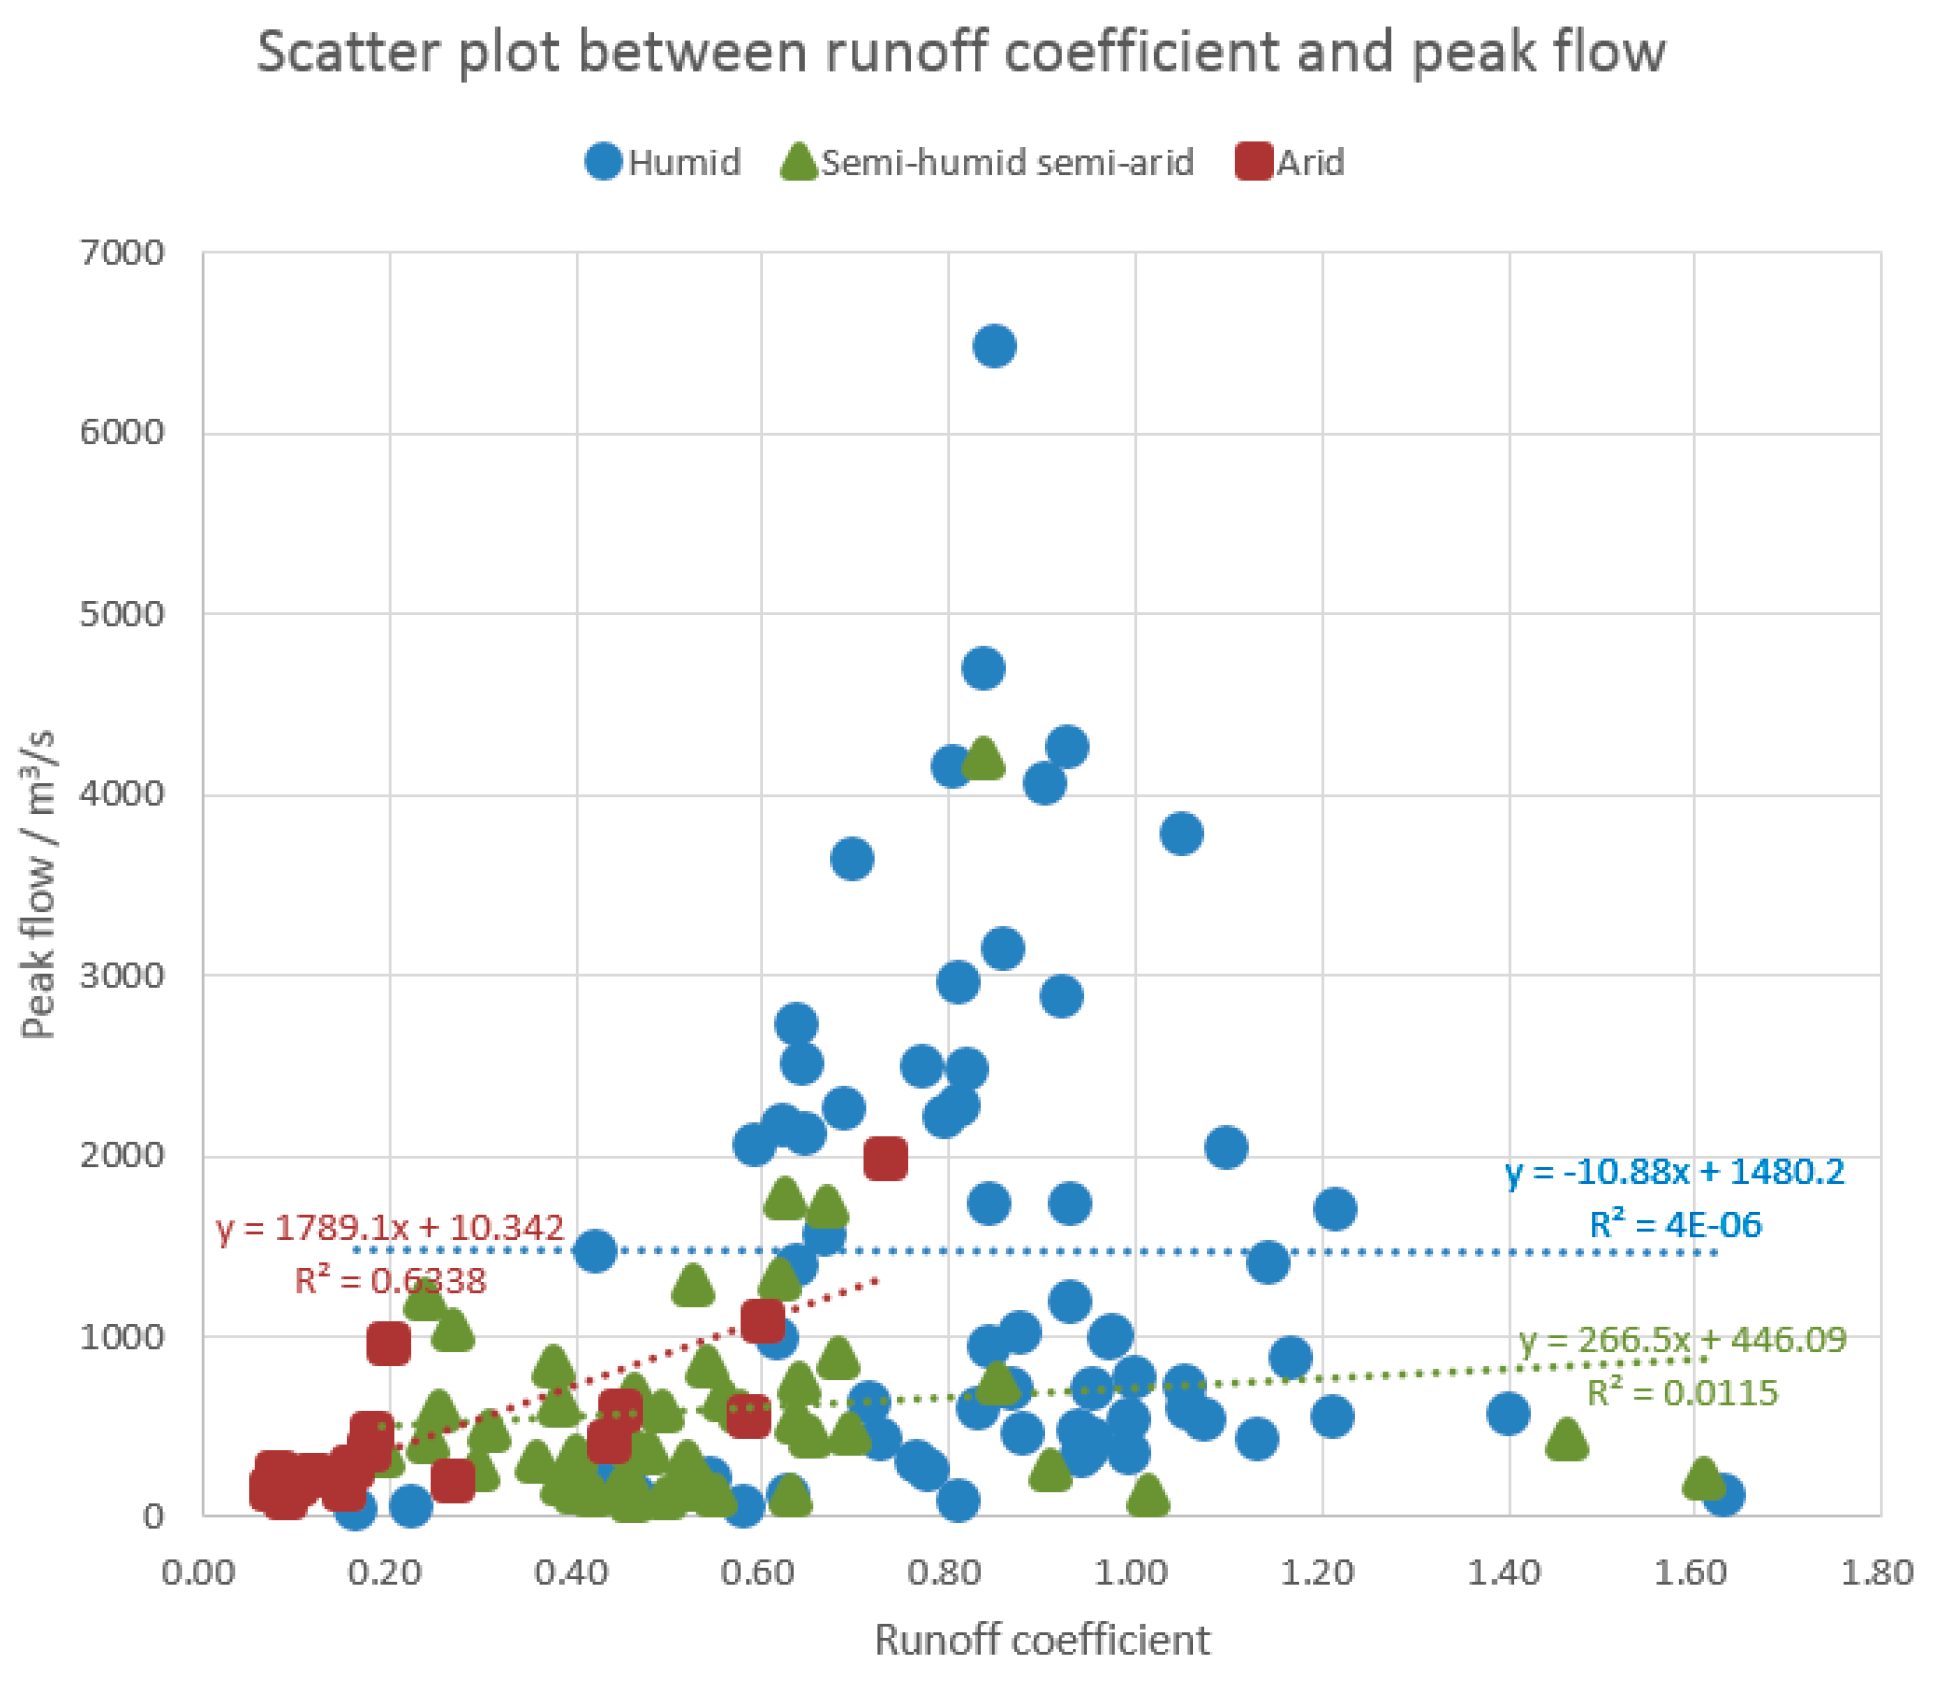
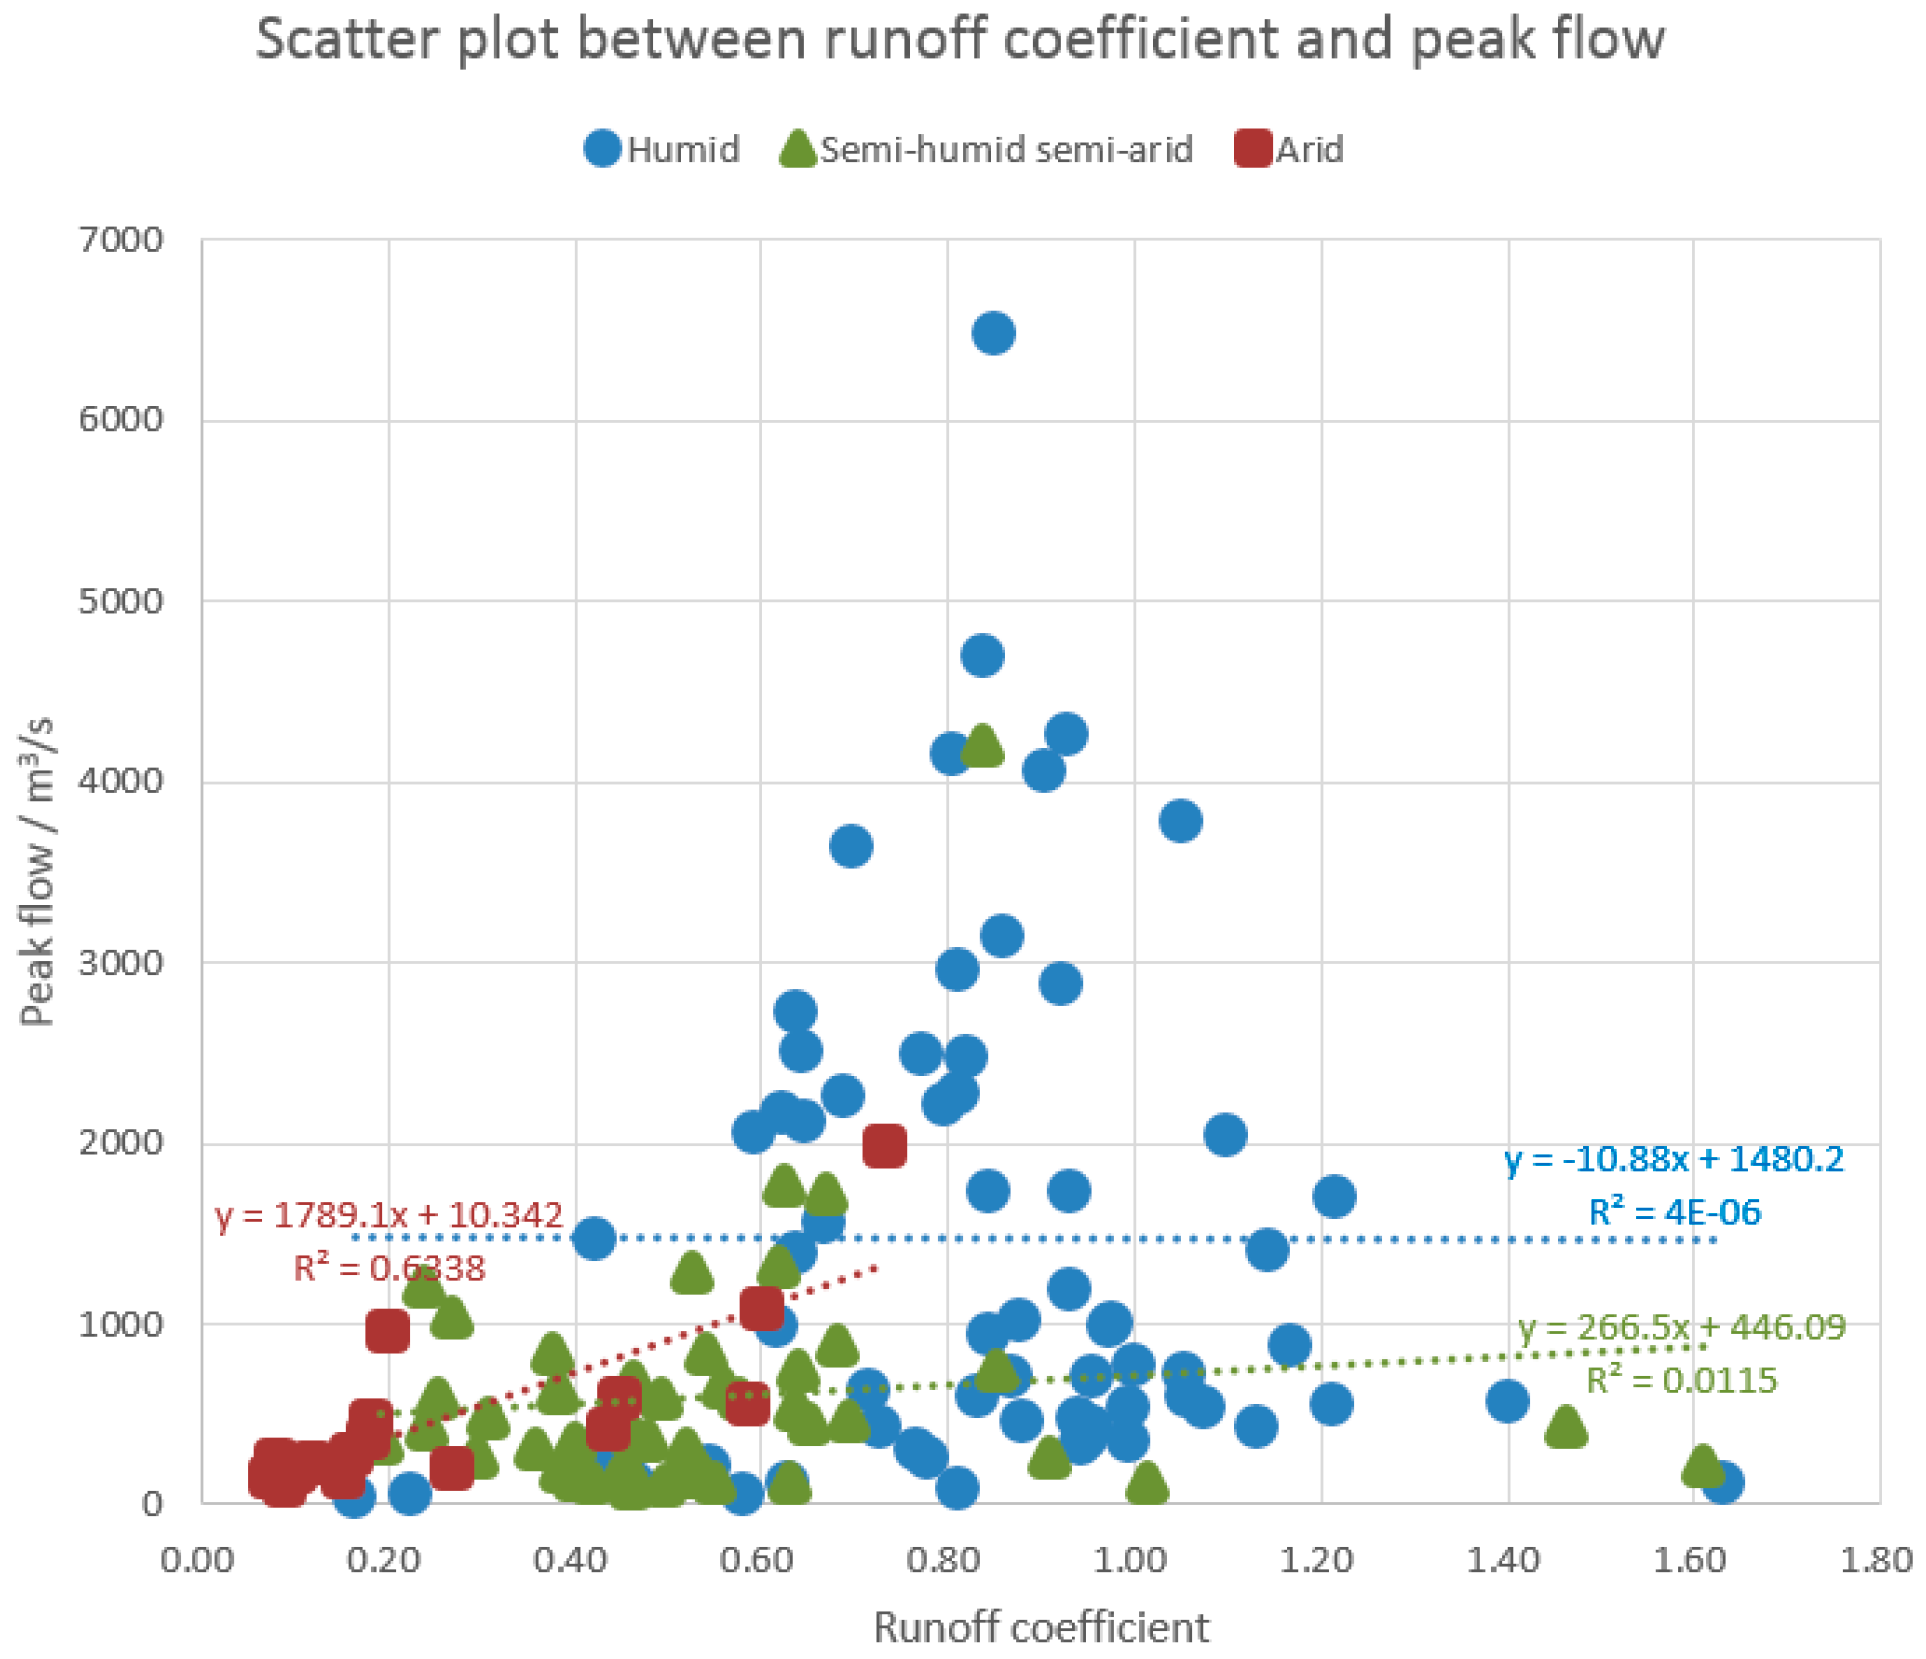
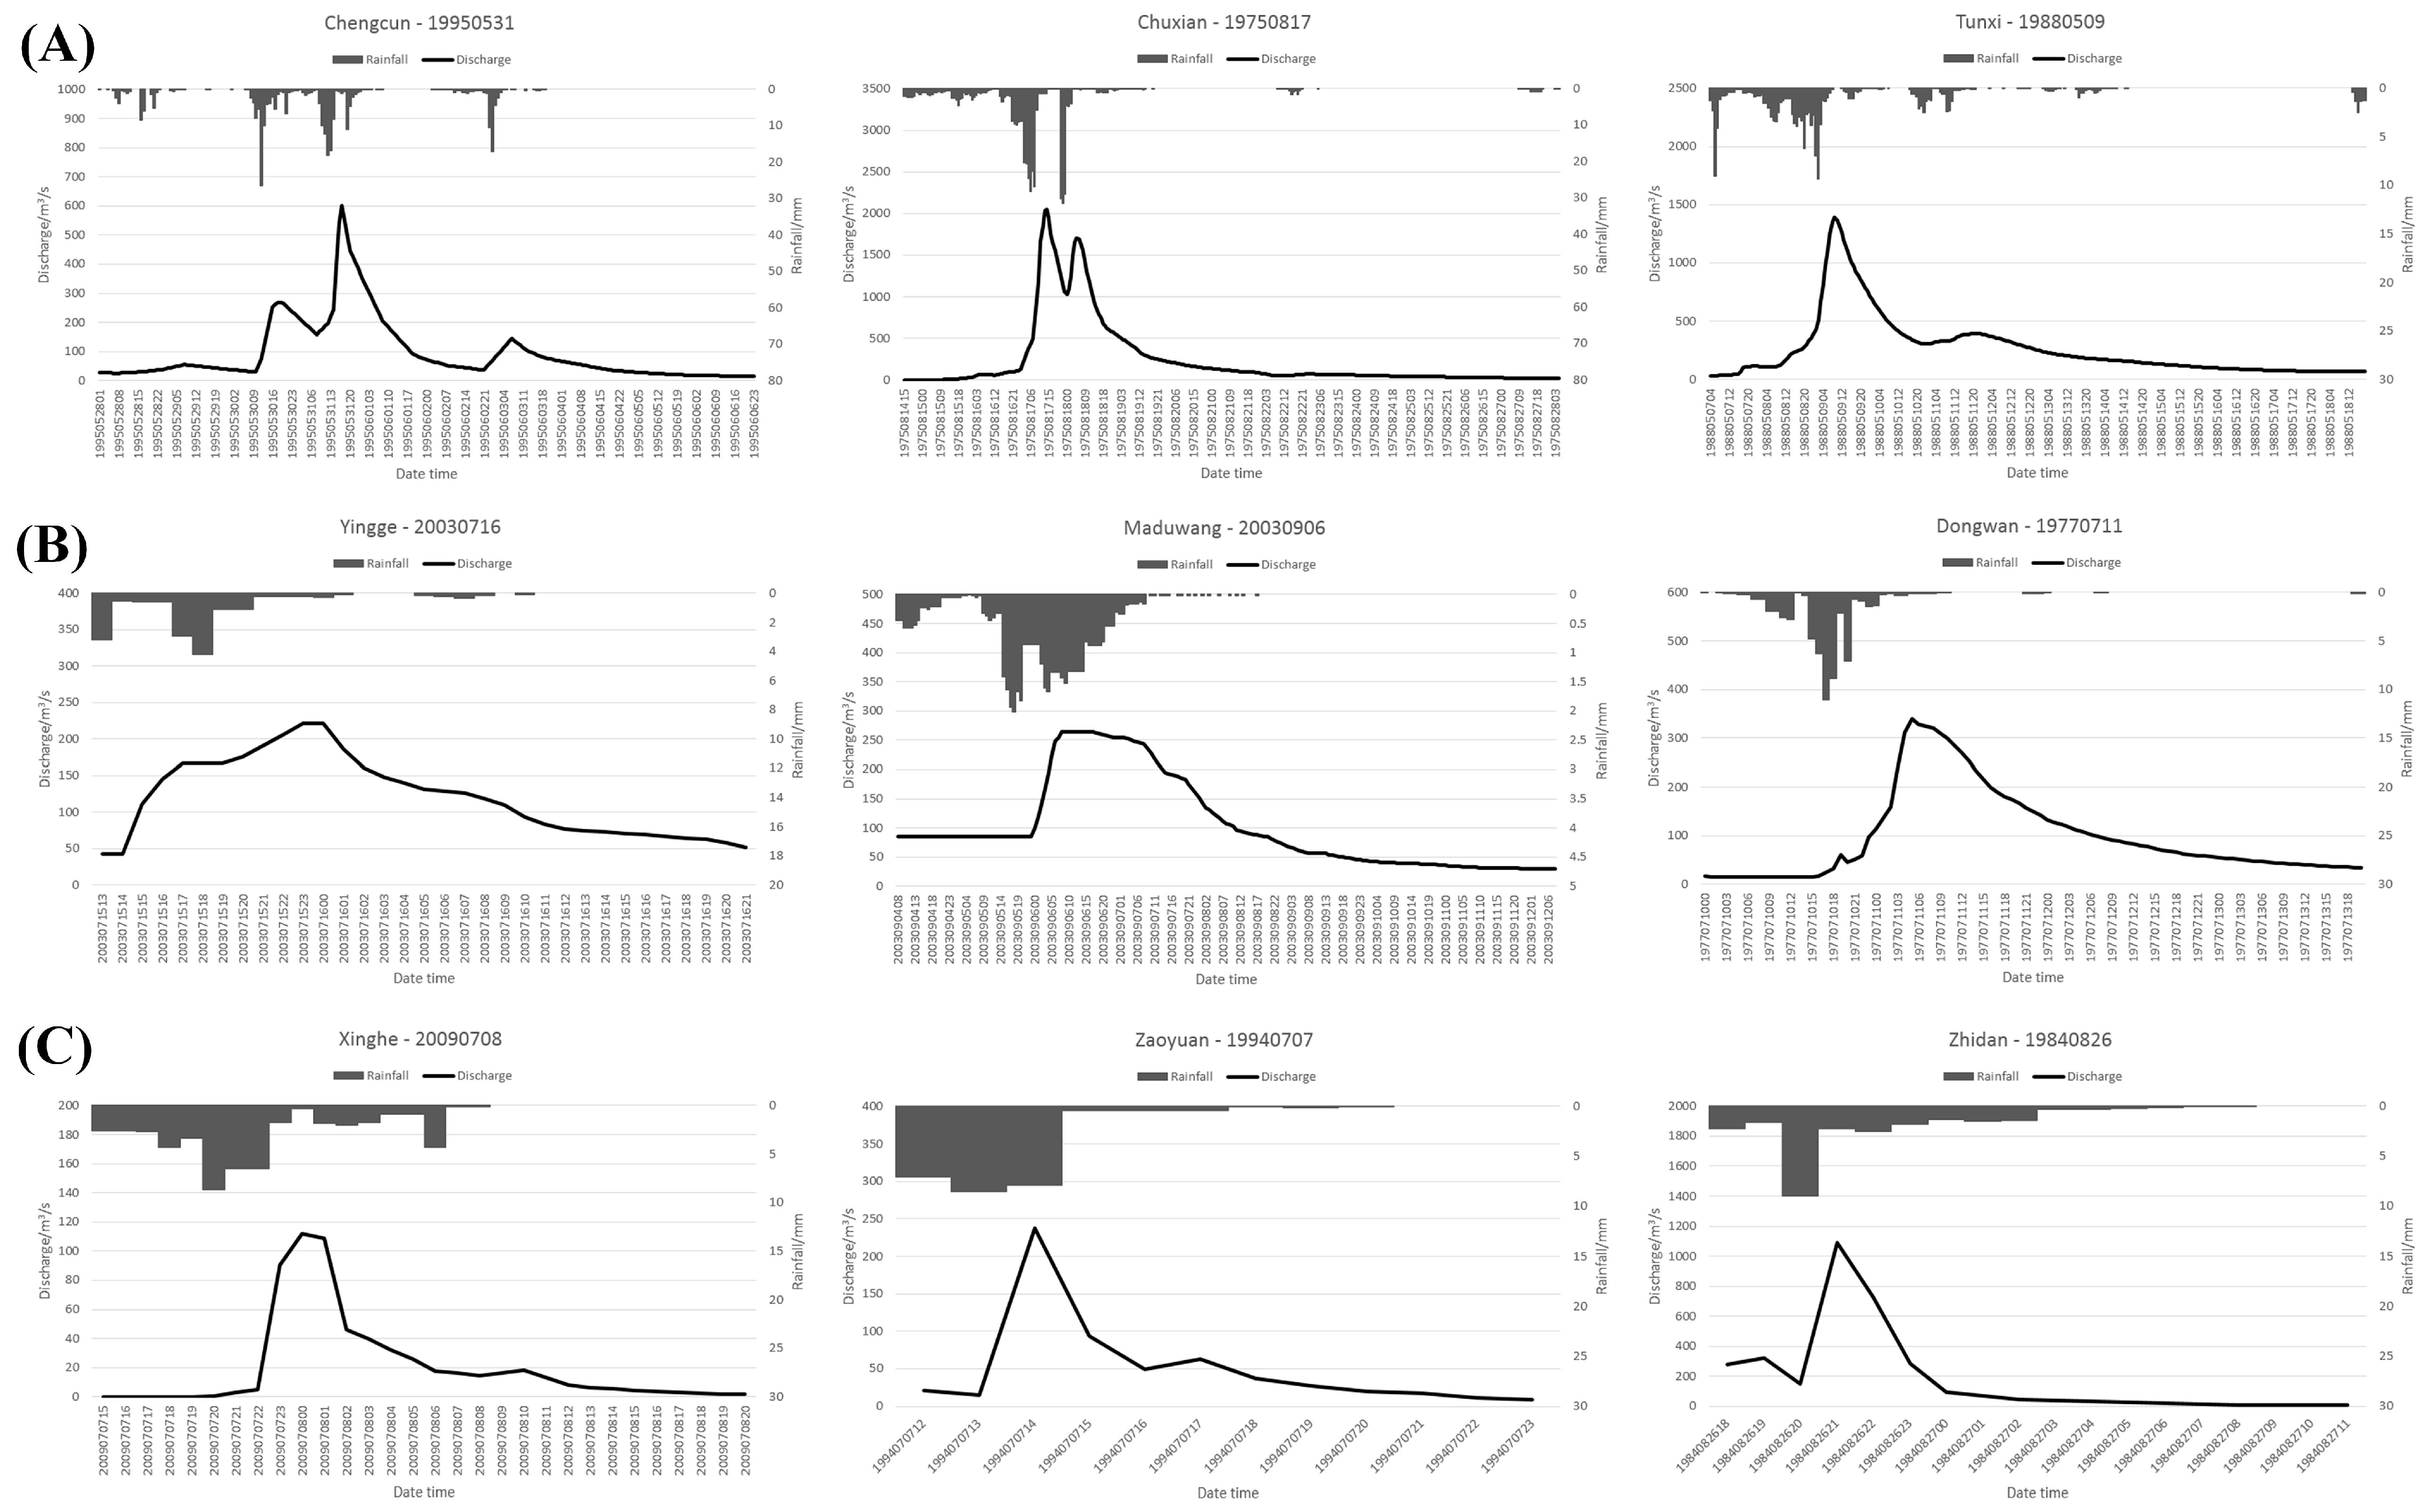
3.1.1. Rainfall-Runoff Data Analysis

Before carrying on the model calibrations and simulations, historical rainfall-runoff data is analyzed to mine the available information underlying the data and to investigate the differences of various types of study watersheds. Figure 2, Figure 3, Figure 4 and Figure 5 show the scatter plots of total rainfall vs. total runoff, total rainfall vs. peak flow, and runoff coefficient vs. peak flow for flood events, respectively. Each point in the scatter plots represents one flood event.
Figure 2 demonstrates the regression relationship between the total rainfall and total runoff for flood events of the humid, semi-humid semi-arid, and arid watersheds. It can be seen from Figure 2 that the scatters of all types of watersheds distribute evenly and the linear regression relationship is steady and good. The humid regions obtain the best regression R2 value of 0.9604. The semi-humid semi-arid regions obtain the medium R2 value of 0.7005. The arid regions obtain the worst R2 value of 0.1262. This fact reflects that the correlation relationships underlying the rainfall-runoff data are quite different for various types of watersheds. The rainfall-runoff relationship of the humid watersheds demonstrates a significant linear correlation. However, for drier watersheds such as the semi-humid semi-arid and arid regions, the linear correlation weakens. These facts indicate that the complexity of rainfall-runoff data of drier watersheds is higher than that of the wetter watersheds. It can be concluded the difficulty of flood simulation and forecasting increases when the watershed changes from a wetter one to a drier one. It can be observed that the total rainfall and total runoff of most wetter watersheds are larger than that of the drier watersheds. This is consistent with the climatic and underlying surface characteristics of different types of watersheds. Furthermore, it can be found the slopes of rainfall-runoff regression lines decline from the wetter regions to drier regions. This implies that for generating the same amount of runoff, drier watersheds require more rainfall than the wetter watersheds for each flood event. This means the runoff coefficients of the drier watersheds decrease compared to the wetter watersheds. The conclusion is consistent with the annual mean runoff coefficient records which have been listed in Table 1 and can be found in previous paragraphs of this paper.
Figure 3 demonstrates the regression scatter plot between the total rainfall and peak flow for each flood event. It can be seen the regression correlation relationships are not as good as the results of Figure 2. The data points of Figure 3 distribute disheveled and messy, especially worse for arid regions. This indicates the linear regression relationship between the total rainfall and peak flow is not as significant as that between the total rainfall and total runoff. For humid regions, the regression R2 value is 0.4961. For semi-humid semi-arid regions, the regression R2 value is 0.2364. For arid regions, the regression R2 value is 0.0004. The R2 value shows a decreasing trend from wetter regions to drier regions. Why do the peak flows have closer relationship with the total rainfall when the watershed becomes wetter? The reason may be attributed to the different runoff generation mechanisms. In humid regions, the saturation excess runoff generation plays the most important role in hydrological processes and the peak flow value has closer relationship with the total runoff, and finally has closer relationship with the total rainfall. However, in arid regions, the infiltration excess mechanism plays the most important role. The peak flow is not only determined by total runoff and total rainfall but also affected significantly by the rainfall intensity. For the same amount of total rainfall, the rainfall duration is an important impact factor which should not be ignored. Therefore, in drier watersheds, the regression correlation relationship between the total rainfall and peak flow weakens compared to the wetter watersheds. In semi-humid semi-arid regions, both of the saturation excess and infiltration excess mechanisms are non-ignorable, therefore, the regression correlation relationship of semi-humid semi-arid regions is medium compared to the humid and arid regions.
Figure 4 shows the scatter plot between the runoff coefficient and peak flow. It can be observed that the regression correlation relationships of the humid and semi-humid semi-arid watersheds are very poor. The regression R2 values of the humid and semi-humid semi-arid regions are 0.000004 and 0.0115, respectively. It can be found the regression R2 of the arid regions obtains the best value of 0.6338. The data points of the arid watersheds distribute well around the regression line. It can be observed the runoff coefficients of some flood events are larger than the theoretical upper boundary of 1 for humid and semi-humid semi-arid regions. This unreasonable phenomenon is especially serious for humid watersheds. This result may be caused by the following reasons. The flood duration and frequency in humid watersheds are usually larger than that of the drier watersheds and flood events often happen continuously one by one. This means when a new flood peak is rising up, the previous flood event may be still in the process of flow recession. Therefore, the next peak flow may be contributed not only by the rainfall of this flood event, but also by the previous flood event recession flow. So total runoff computed from the observed hydrographs, without cutting off the previous flood event recession flow, will be overestimated to some extent and leads to the overestimation of runoff coefficient. Possible solution of this problem is the hydrograph segmentation, which is used to cut off the runoff contributed by the previous flood event. On the other hand, this phenomenon is rare in arid regions because the flood duration and frequency are relatively small in these areas and floods do not happen continuously. Another reason about the unreasonable phenomenon is the observation error of the rainfall and discharge data. The rainfall is computed by using areal mean method and the accuracy is determined by the density of the rainfall stations. Because the density is usually not enough in regions with complex geophysical conditions, the rainfall accuracy may be unsatisfactory.
In order to eliminate the side effects caused by the unreasonable runoff coefficients, we draw another scatter plot (Figure 5) between the runoff coefficient and peak flow without inclusion of flood events whose runoff coefficients are larger than 1. Because there is no runoff coefficient exceeds 1 in the arid regions, the regression R2 value of the arid regions remains 0.6338. By eliminating the unreasonable flood events, the R2 values of the humid and semi-humid semi-arid watersheds become better and achieve 0.0324 and 0.1228, respectively. It can be seen in Figure 5 the distributions of data points of humid and semi-humid semi-arid regions are not as significant as arid regions. This indicates the relationship between the runoff coefficient and peak flow is not significant in wetter watersheds. Figure 5 may reveal a phenomenon that there is some underlying regression correlation relationship (with R2 = 0.6338) between the runoff coefficient and peak flow in arid regions. Maybe researchers and engineers can make use of this relationship to assist the flood simulation and forecasting research and applications in the future.

3.1.2. Areal Mean Rainfall and Runoff Analysis Based on Information Theory

To analyze relationship between rainfall and runoff data, we adopt the information theory-based input variable selection method in this research. The selected input variables and mutual information (MI) between the selected input variables and runoff, i.e., the Q(t) (discharge in time step t), are shown in Table 2. It can be seen the Q(t) is related to rainfall at time step t (P(t)) and/or previous time steps (P(ti), i = 1, 2, …). It can be observed the number of related rainfall at previous time steps is larger in wetter watersheds. This means the lag time between rainfall and runoff is larger in wetter watersheds. This result is consistent with the runoff generation mechanism of different watersheds. In humid watershed, the saturation excess mechanism usually performs as slow discharge generation and longtime flow recession. In arid watersheds, the infiltration excess mechanism usually performs as rapid peak flow generation and fast flow recession. In semi-humid semi-arid watersheds, the characteristic of flood is between the humid and arid watersheds.
It can be seen from Table 2, the MI increases from wetter watersheds to drier watersheds. This means the available information contained in the rainfall-runoff data increases from wetter watersheds to drier watersheds. This indicates, in drier watersheds, the runoff has higher relationship with rainfall data however the lag time and duration of the related rainfall decreases. In wetter watersheds, the relationship between rainfall and runoff decreases. Further analysis of Table 2 indicates the runoff has higher relationship with discharges at previous time steps in wetter watershed than in drier watersheds. This is rational because the flow variation is not so severe in wetter watersheds. In drier watersheds, the flow rises and goes down rapidly and therefore discharge has lower relationship with discharges at previous time steps. Even though discharge has higher relationship with rainfall in arid watersheds, the simulation results are poor in these areas. This indicates the simulation and forecasting capability of the hydrological model cannot make full use of information contained in rainfall data and cannot provide satisfactory results in drier watersheds, and new models with better simulation and forecasting capabilities are urgently needed. The Zaoyuan watershed has the highest MI value. This may be caused by the too few flood events (4 events only).

3.2. Model Performance Comparisons Based on Boxplots

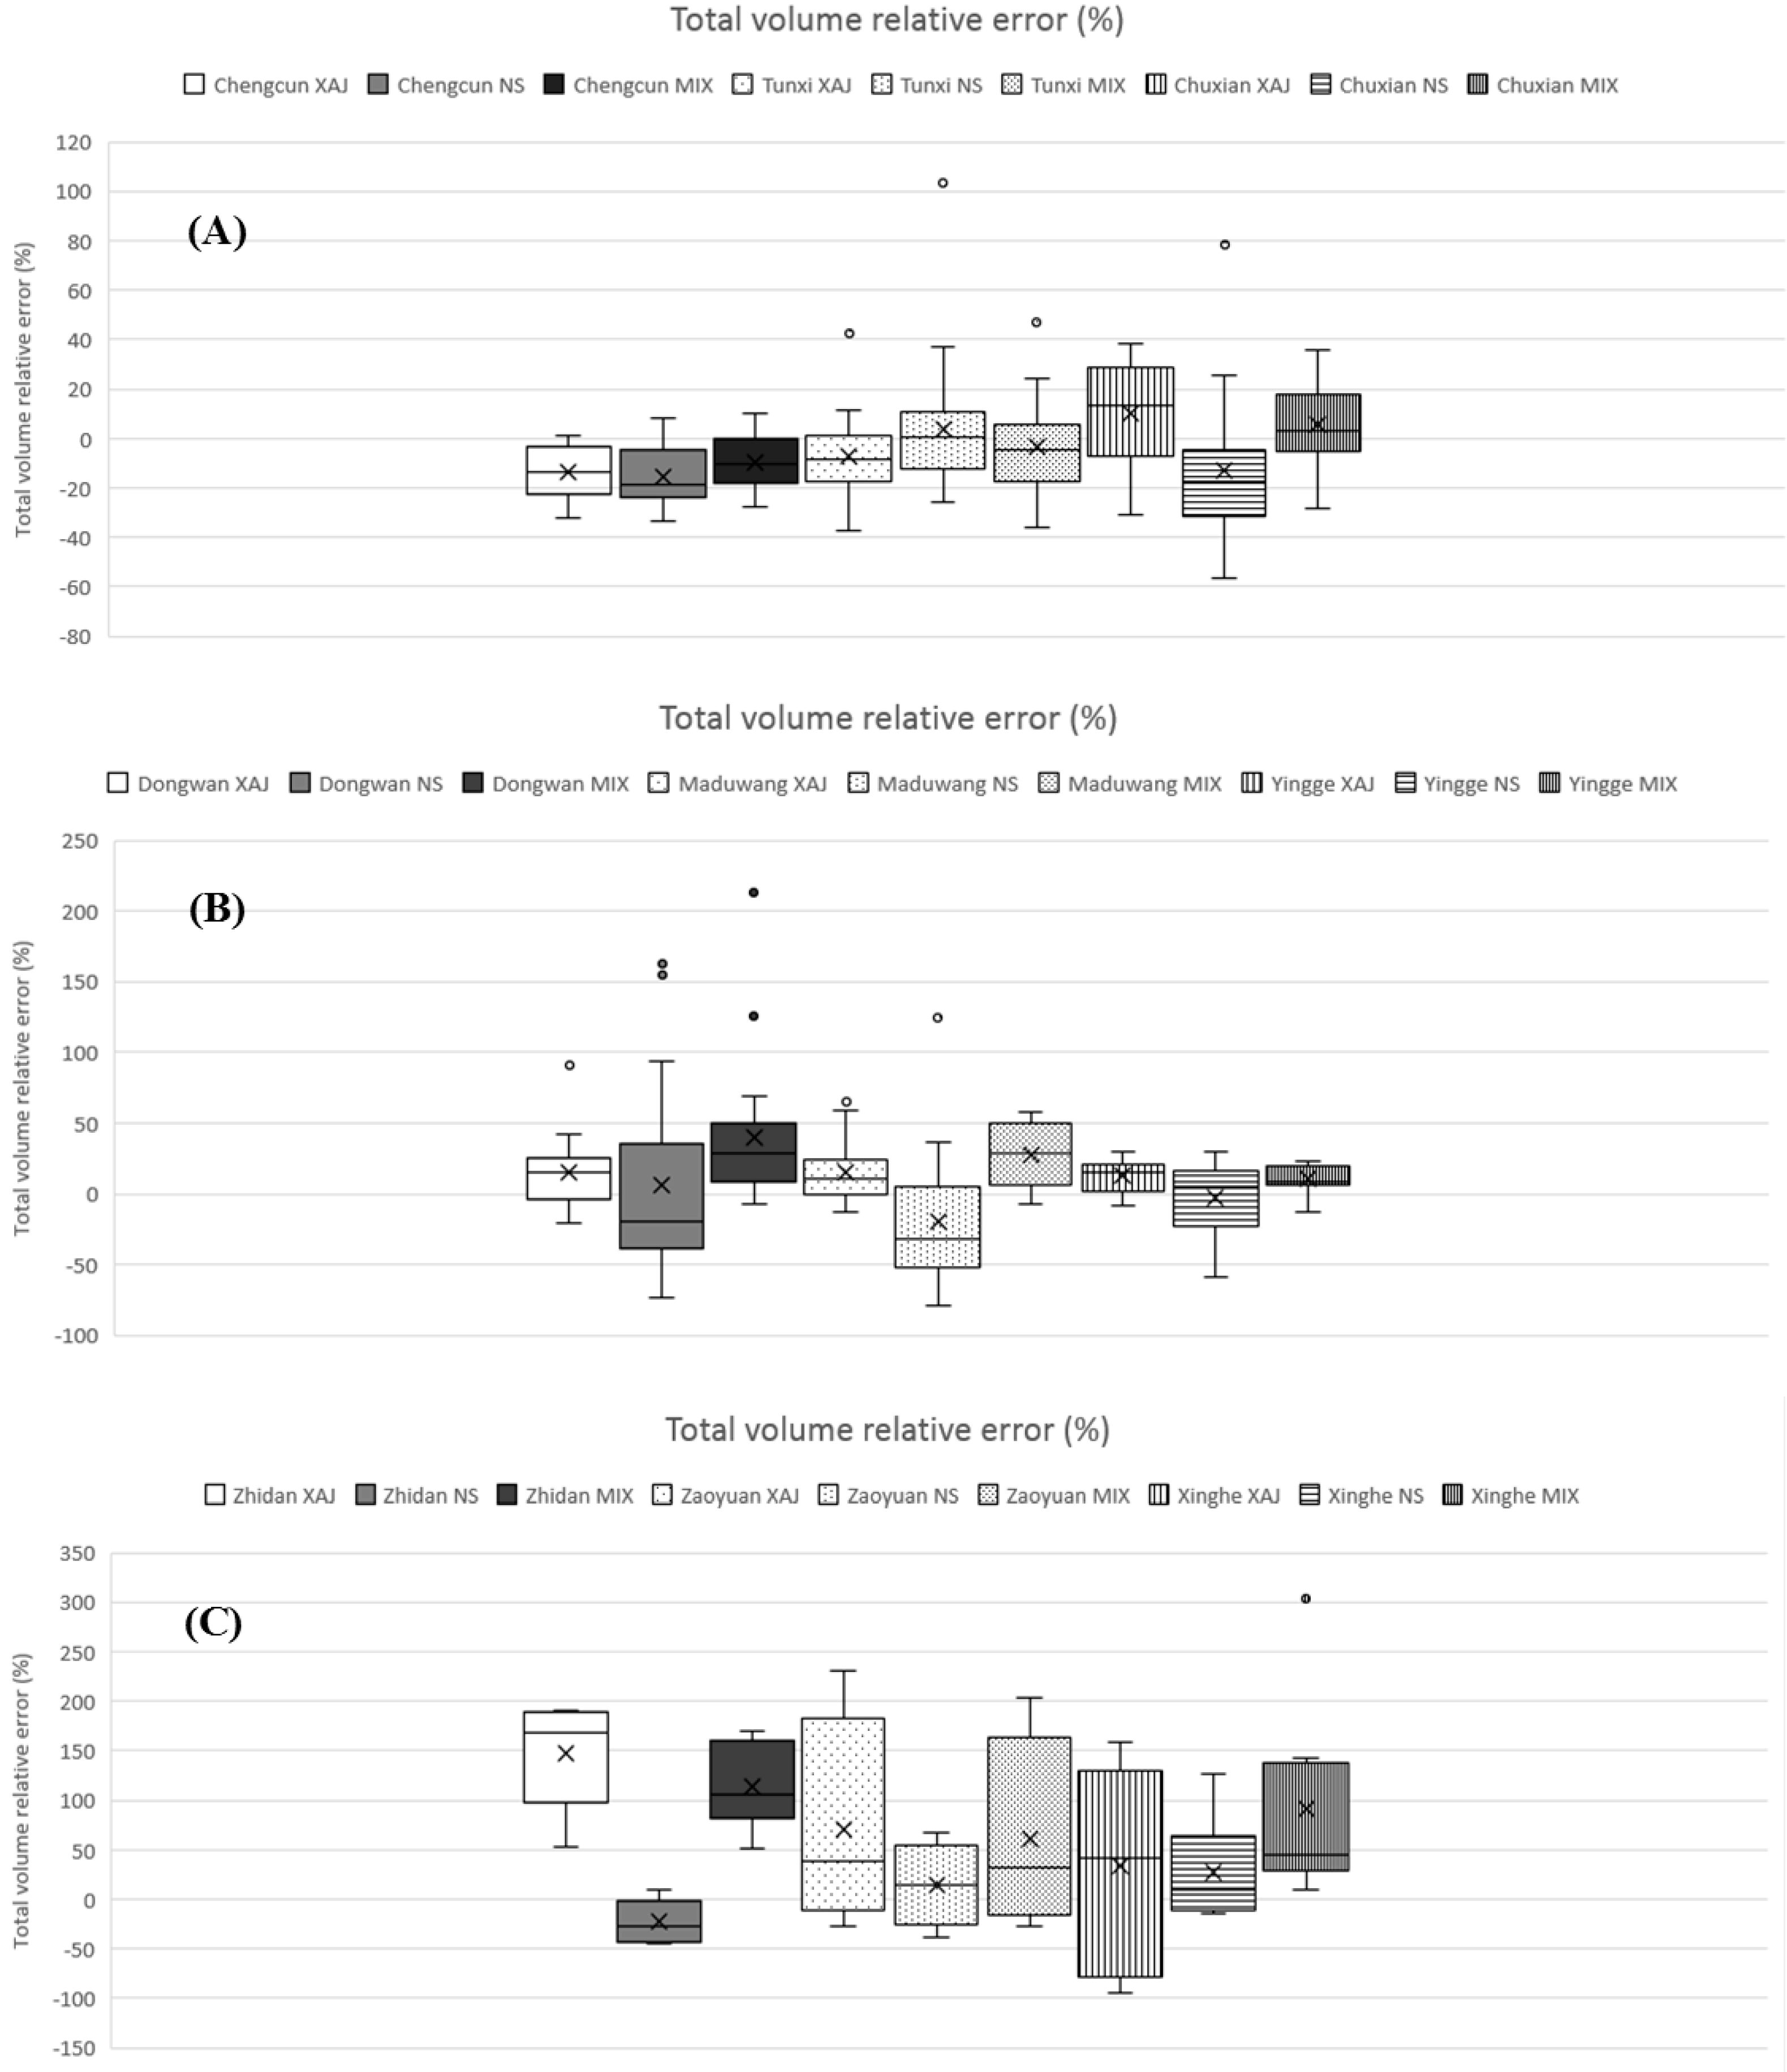
3.2.1. Total Volume Relative Error

As for the model performance comparisons of Section 3.2, Section 3.3 and Section 3.4, all data are used as calibration data. This means that the results presented in the work refer to models calibrated considering all the available flood events.
The boxplots of total volume relative error (TVRE) for the considered flood events of the humid, semi-humid semi-arid, and arid regions are demonstrated in Figure 6. The TVREs of humid regions (Figure 6A) mostly fall into the range of −20% and 20%. The TVREs of semi-humid semi-arid regions (Figure 6B) mostly fall into the range of −50% and 50%. The TVREs of arid regions (Figure 6C) mostly fall into the range of −100% and 200%. Overall speaking, for all models (XAJ, NS and MIX), the model performances in humid regions are the best, the model performances in semi-humid semi-arid regions are medium, and the model performances in arid regions are the worst.
The TVREs of humid watersheds are shown in Figure 6A. For Chengcun and Tunxi watersheds, the differences between performances of the three models are not significant. All models underestimate the water quantity in Chengcun and Tunxi watersheds except for the NS model in Tunxi watershed. For Chuxian watershed, the MIX model performs slightly better than the XAJ model and the NS model is the worst one. The XAJ and MIX models tend to overestimate the water quantity and the NS model tend to underestimate the discharge in Chuxian watershed. Generally speaking, all models simulate floods very well and the regression analysis results are satisfactorily in humid regions and no model overwhelmingly outperforms others in all watersheds.
The TVREs of semi-humid semi-arid watersheds are shown in Figure 6B. It can be observed that the performance of the NS model is the worst. The XAJ model slightly outperforms the MIX model in Dongwan and Maduwang watersheds, however the MIX model generates slightly better results than the XAJ model in Yingge watershed. It can be inferred both the XAJ and MIX models are applicable to semi-humid semi-arid watersheds, and the NS model is not suited to the semi-humid semi-arid regions. The Dongwan (2856 km2) and Maduwang (1601 km2) watersheds are much larger than the Yingge (539 km2) watershed. The runoff generation and flow concentration processes of small watersheds are more sensitive to rainfall intensity. Therefore, in Yingge watershed, the MIX model which considers both the infiltration excess and rainfall intensity, outperforms the XAJ model which is not sufficiently sensitive to the rainfall intensity.
The TVREs of arid watersheds are shown in Figure 6C. It can be seen the NS model generates the best simulation results. The MIX model outperforms the XAJ model in all the three arid watersheds. The crucial runoff component in the arid regions is surface quick flow and there is almost no interflow and groundwater runoff generated. The NS model is specially designed for arid regions and therefore achieves the best results. The model contains both infiltration and saturation excess hybrid modules which can generate infiltration and saturation excess surface runoff. Therefore, it outperforms the XAJ model which only considers the saturation excess runoff generation mechanism.

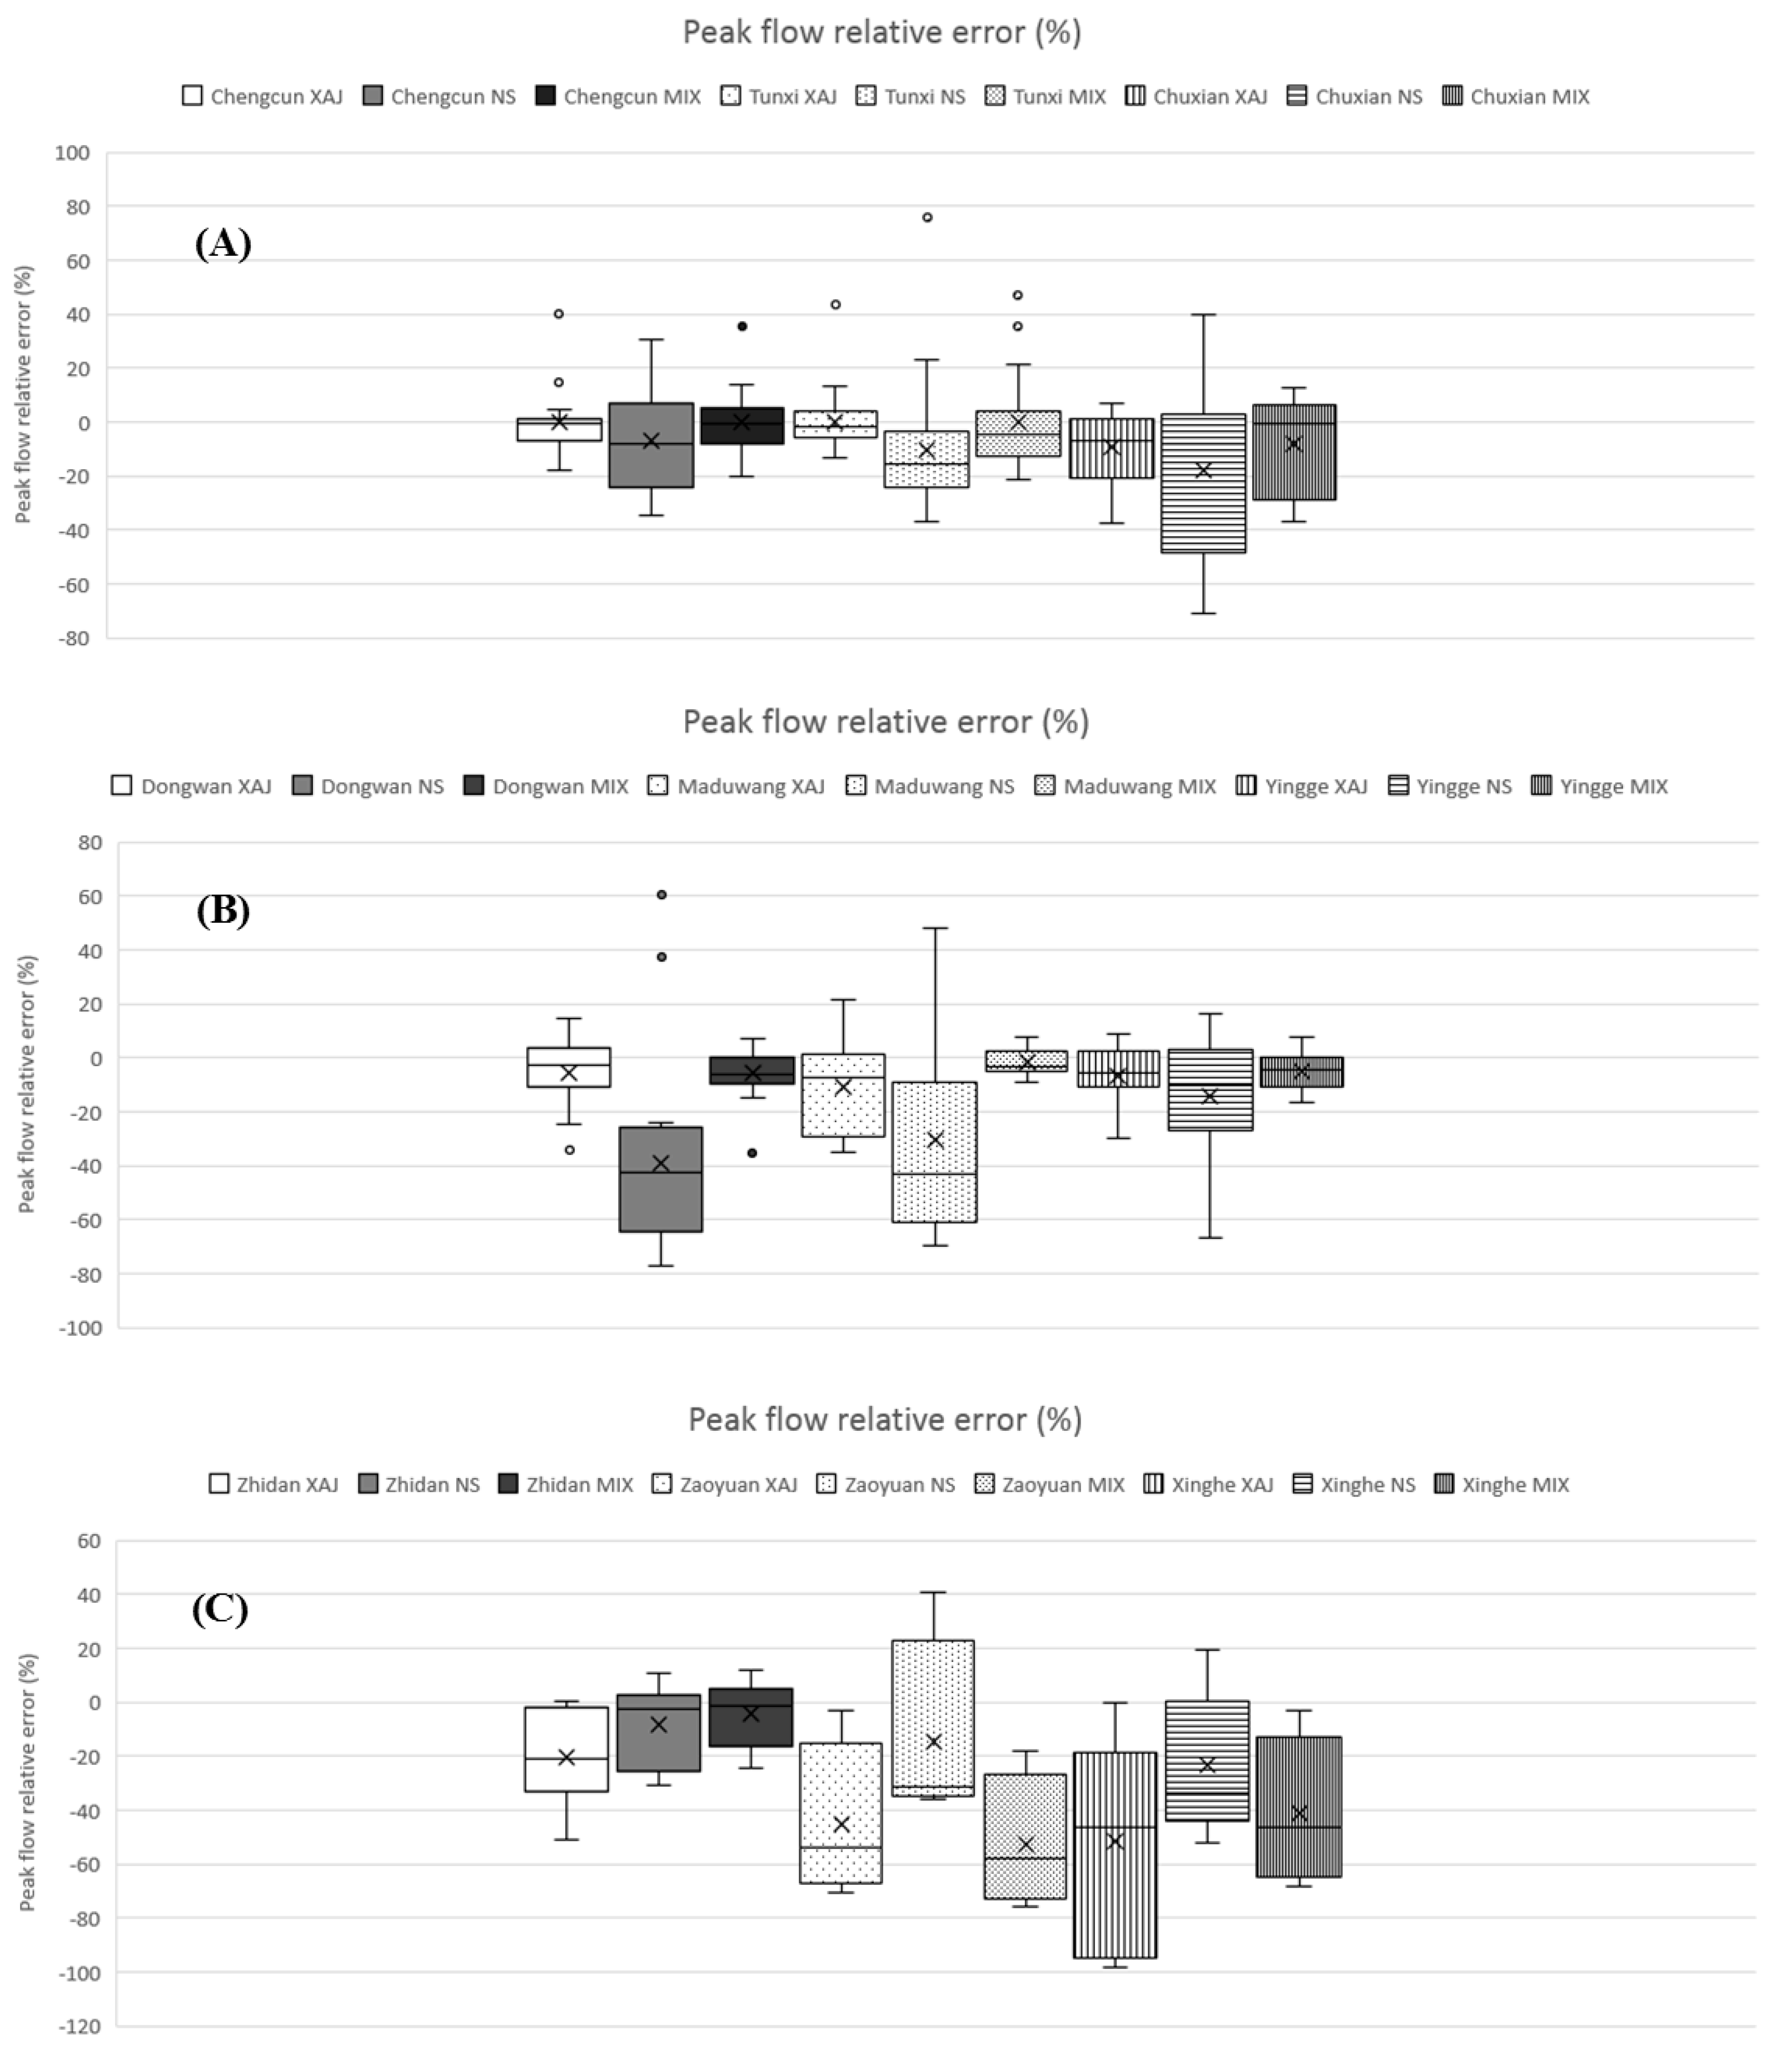
3.2.2. Peak Flow Relative Error

The boxplots of peak flow relative error (PFRE) for flood events of humid, semi-humid semi-arid, and arid regions are demonstrated in Figure 7. The PFREs of humid regions (Figure 7A) mostly fall into the range of −40% and 5%. The PFREs of semi-humid semi-arid regions (Figure 7B) mostly fall into the range of −60% and 5%. The PFREs of arid regions (Figure 7C) mostly fall into the range of −100% and 20%. Overall speaking, for all models (XAJ, NS, and MIX), the model performances in humid regions are the best, the model performances in semi-humid semi-arid regions are medium, and the model performances in arid regions are the worst.
The PFREs of humid watersheds are shown in Figure 7A. It can be seen the performance of NS model is slightly worse than that of the XAJ and MIX models, and the performance of XAJ model is slightly better than the MIX model. From the point view of overall performance, all models generate comparable simulation results. It can be found the PFREs are tend to be less than zero, which indicates all models incline to underestimate the peak flow values.
The PFREs of semi-humid semi-arid watersheds are shown in Figure 7B. The NS model generates the worst results compared to other models and significantly underestimates the peak flow in all three semi-humid semi-arid watersheds. The underestimation of peak flows by the NS model may be due to the low rainfall intensity in the semi-humid semi-arid watersheds and without consideration of the subsurface runoff. Low rainfall intensity cannot sufficiently activate the infiltration excess module of the NS model and leads to generate smaller runoff. The NS model generates no subsurface runoff therefore underestimates the peak flows. The MIX model slightly outperforms the XAJ model in all three semi-humid semi-arid watersheds. These results indicate the MIX model and the mix runoff generation mechanism are the most suitable one for the flood simulation and forecasting in semi-humid semi-arid regions.
The PFREs of arid watersheds are shown in Figure 7C. It can be observed that the NS model significantly outperforms other two models in Zaoyuan and Xinghe watersheds. The NS model performs slightly worse than the MIX model in Zhidan watershed. The MIX model outperforms XAJ model in Zhidan and Xinghe watersheds, and performs slightly worse than the XAJ model in Zaoyuan watershed. In arid watersheds, generally all models underestimate peak flows significantly, except for the NS model in Zaoyuan watershed. The results indicate the peak flow simulation in arid regions is a very difficult task and still challenging. The reason for this may be the long time interval (1 h) of the observed rainfall data which leads to low observed rainfall intensity, and the rainfall stations with low distribution density which leads to not being able to capture the spatial-temporal heterogeneity of the actual rainfall, etc.

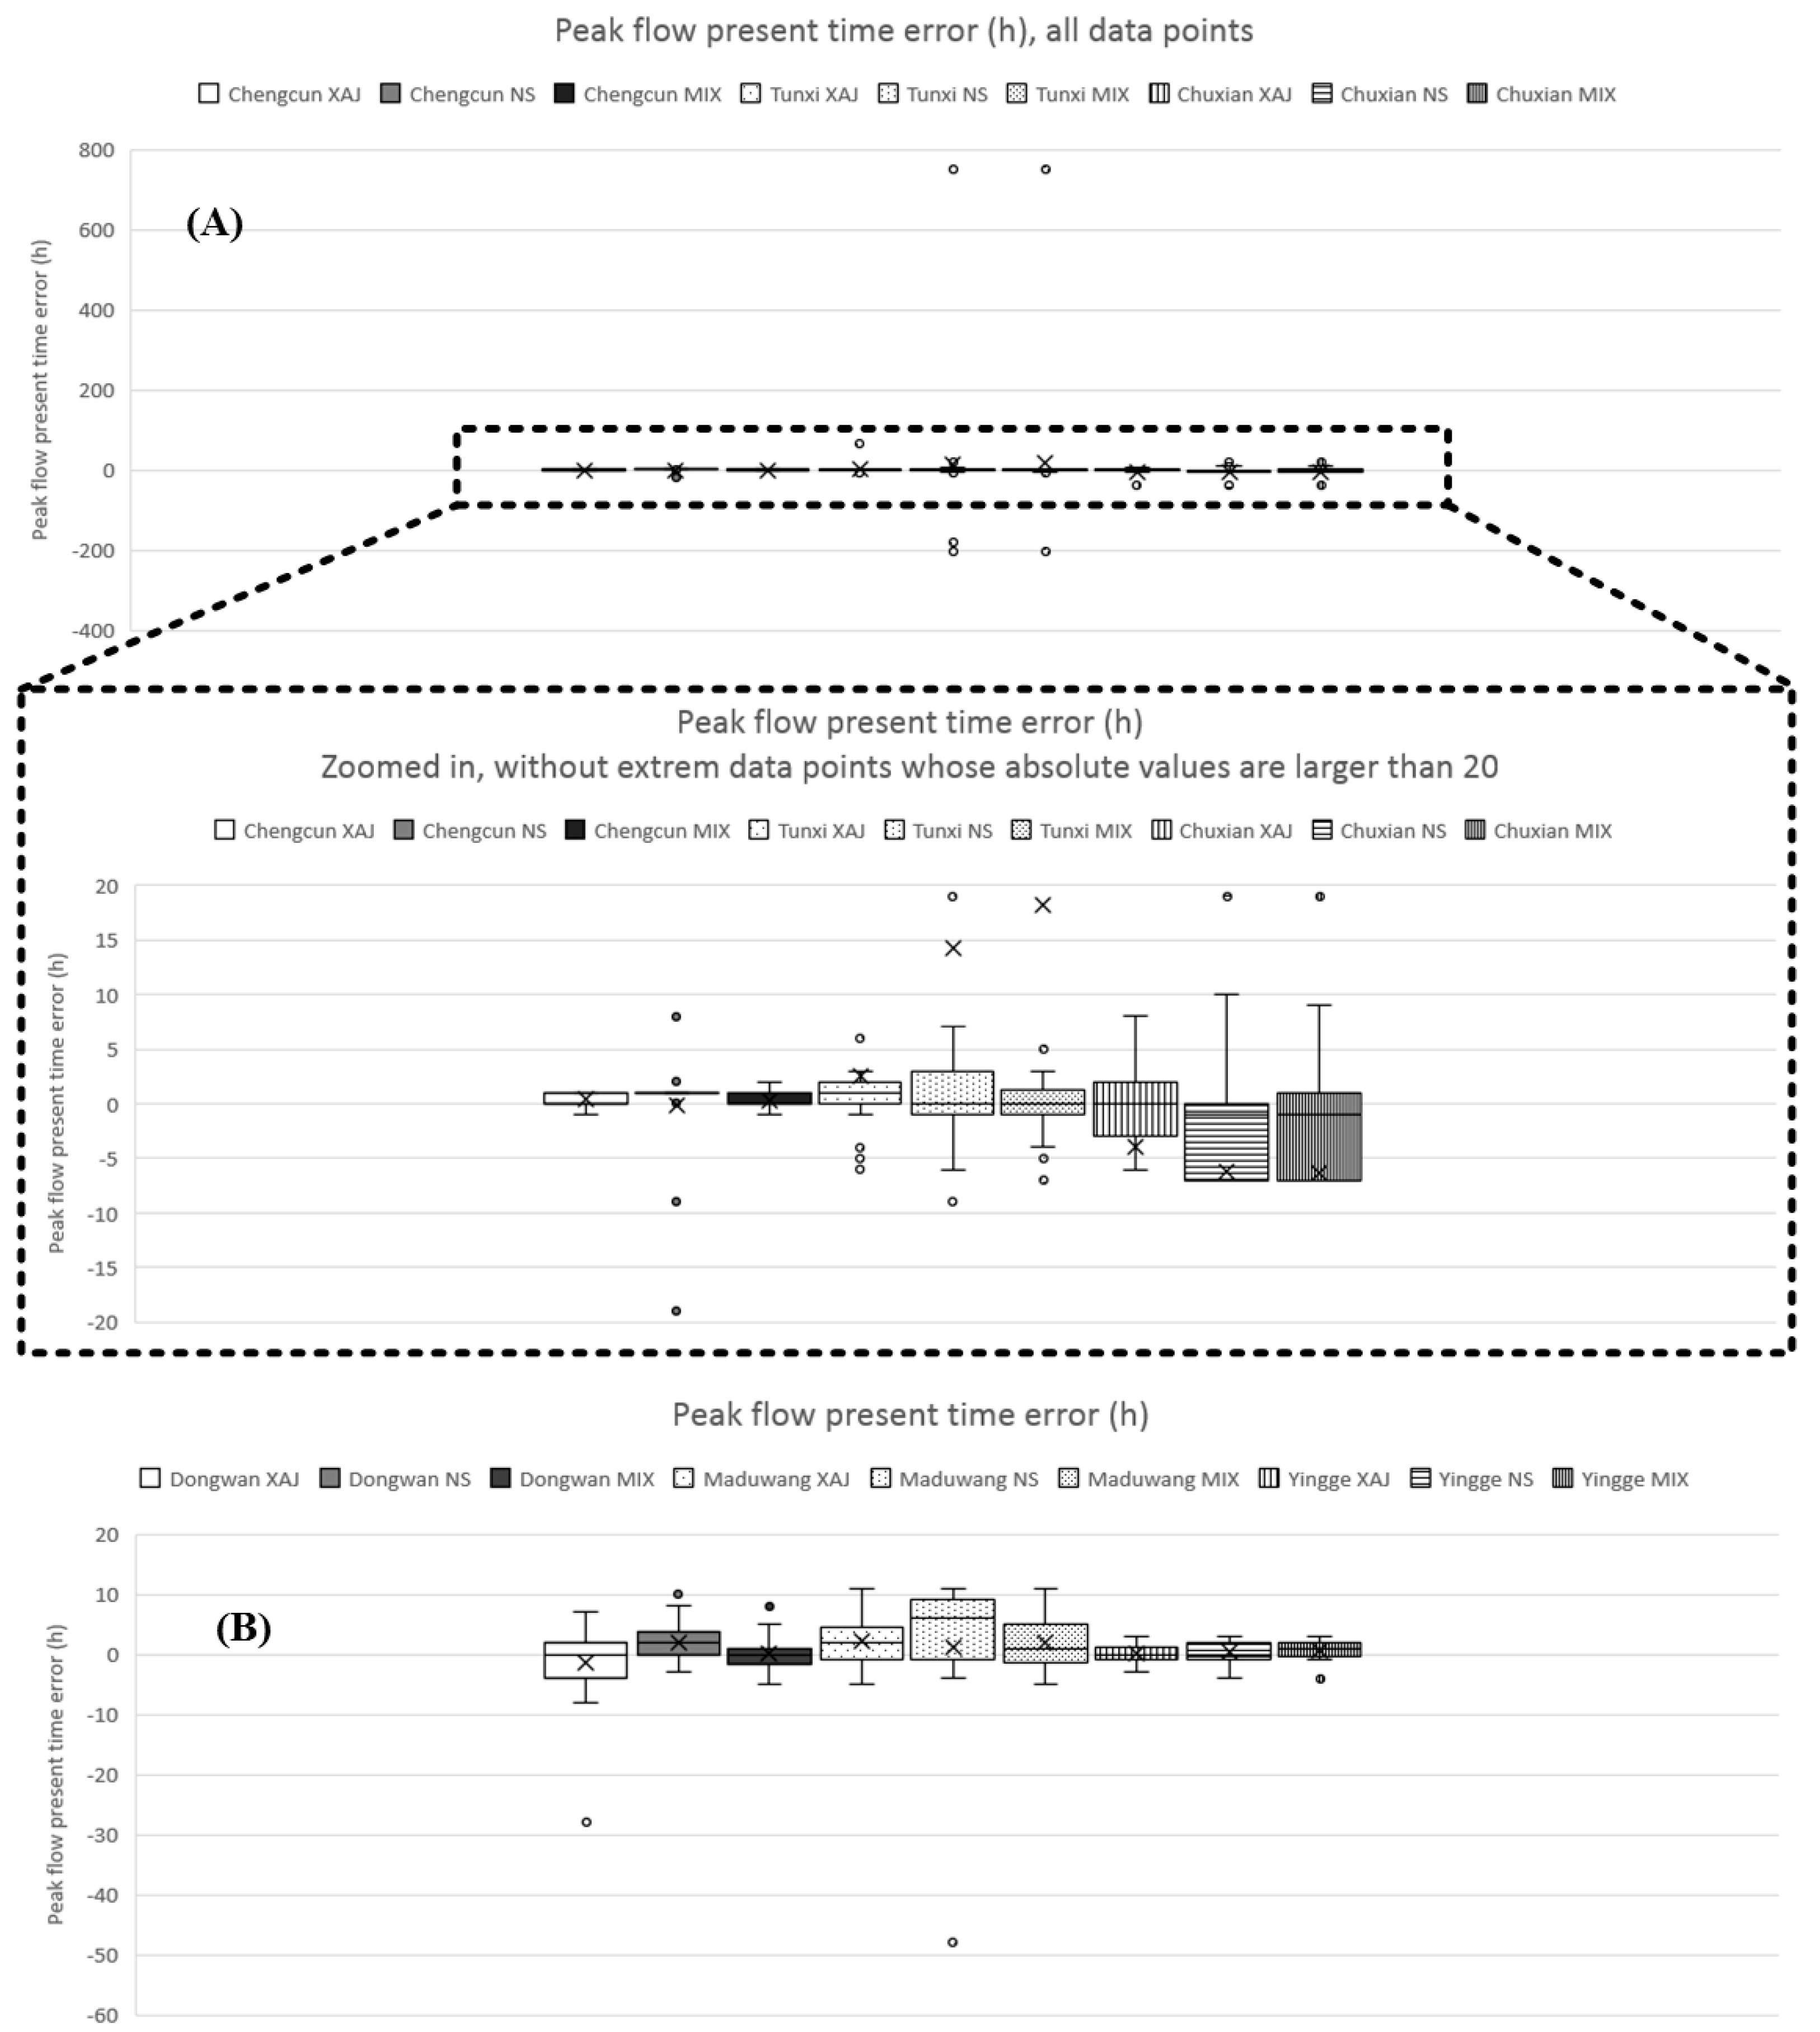
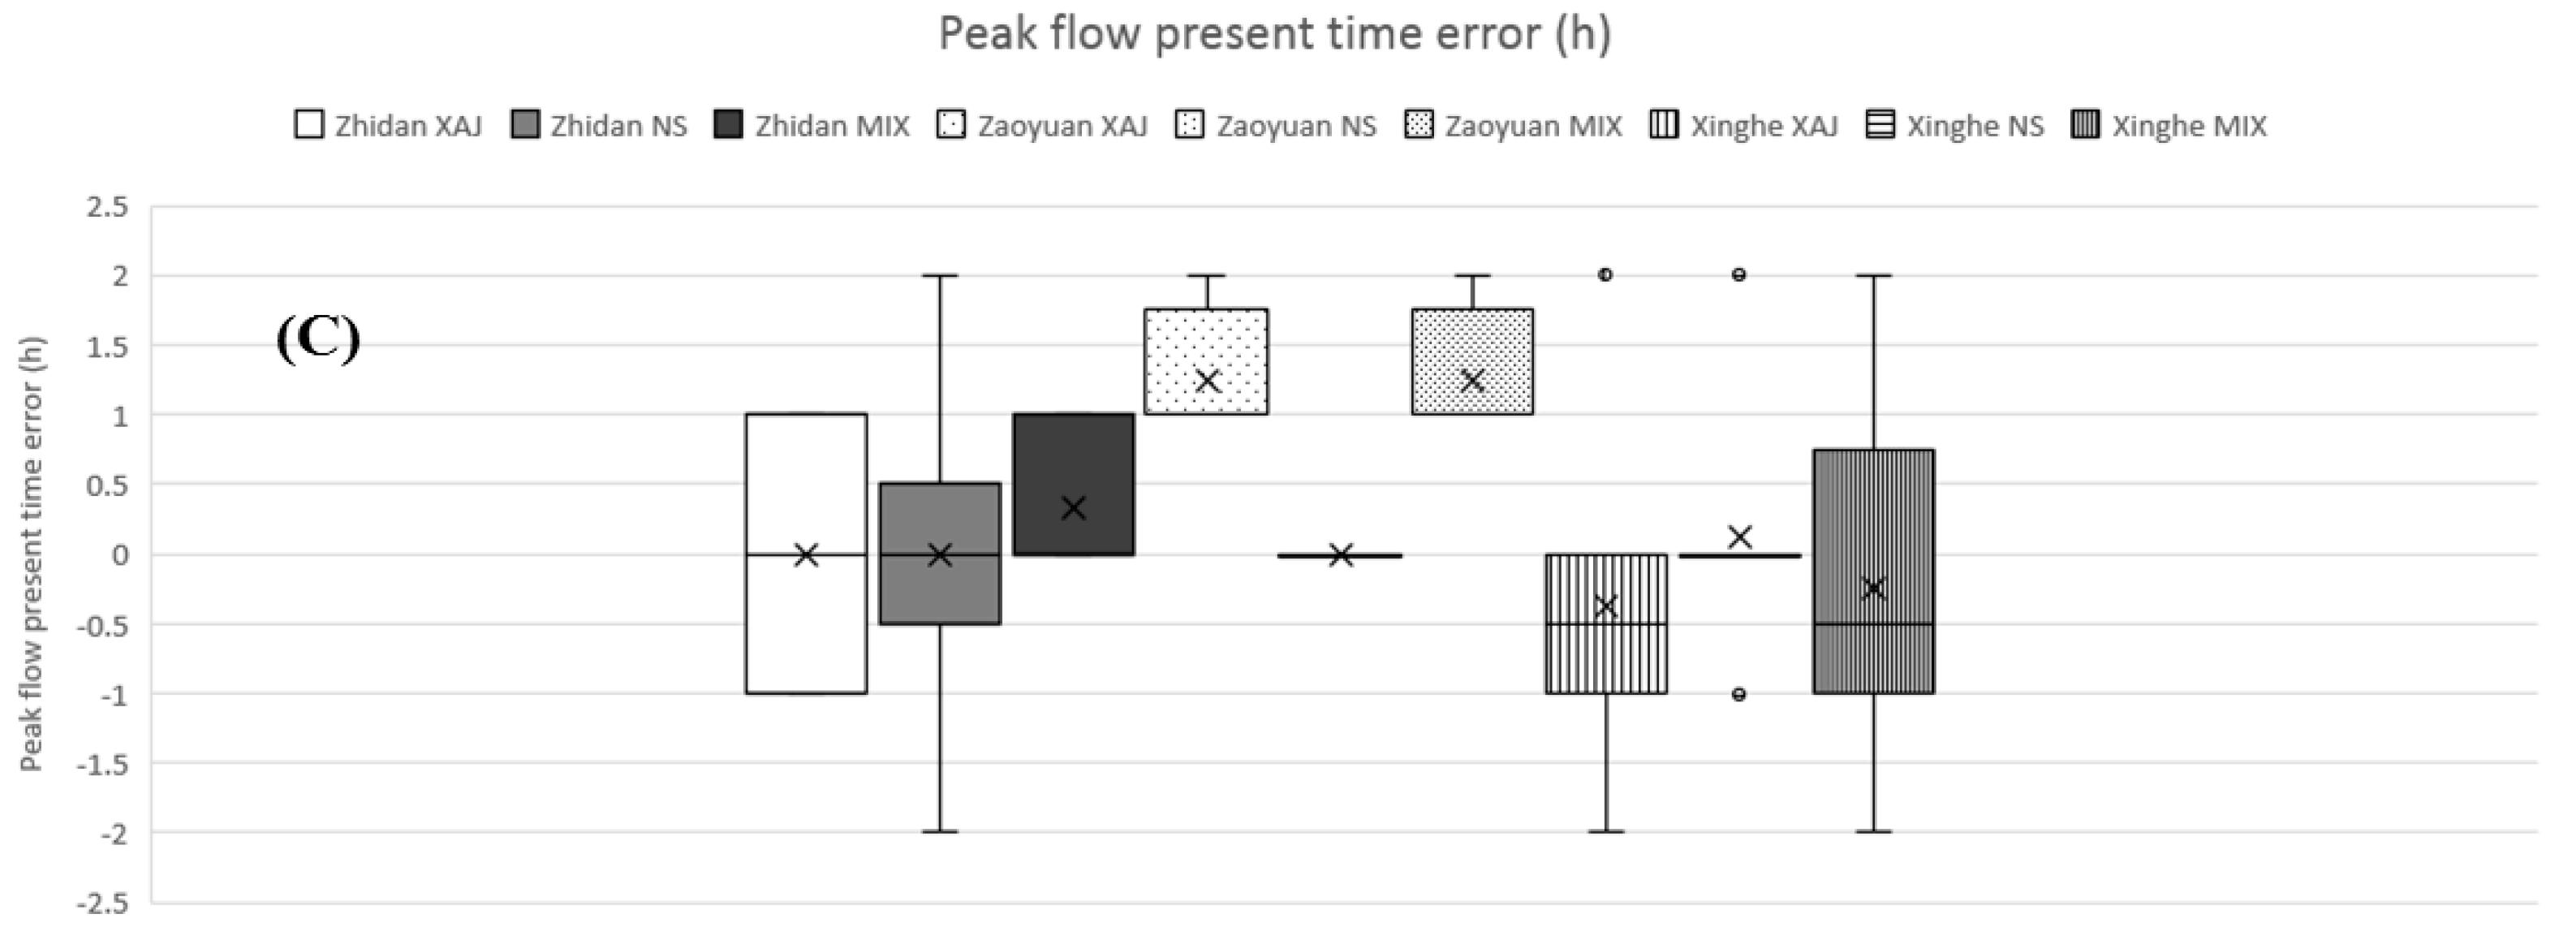
3.2.3. Peak Flooding Time Error
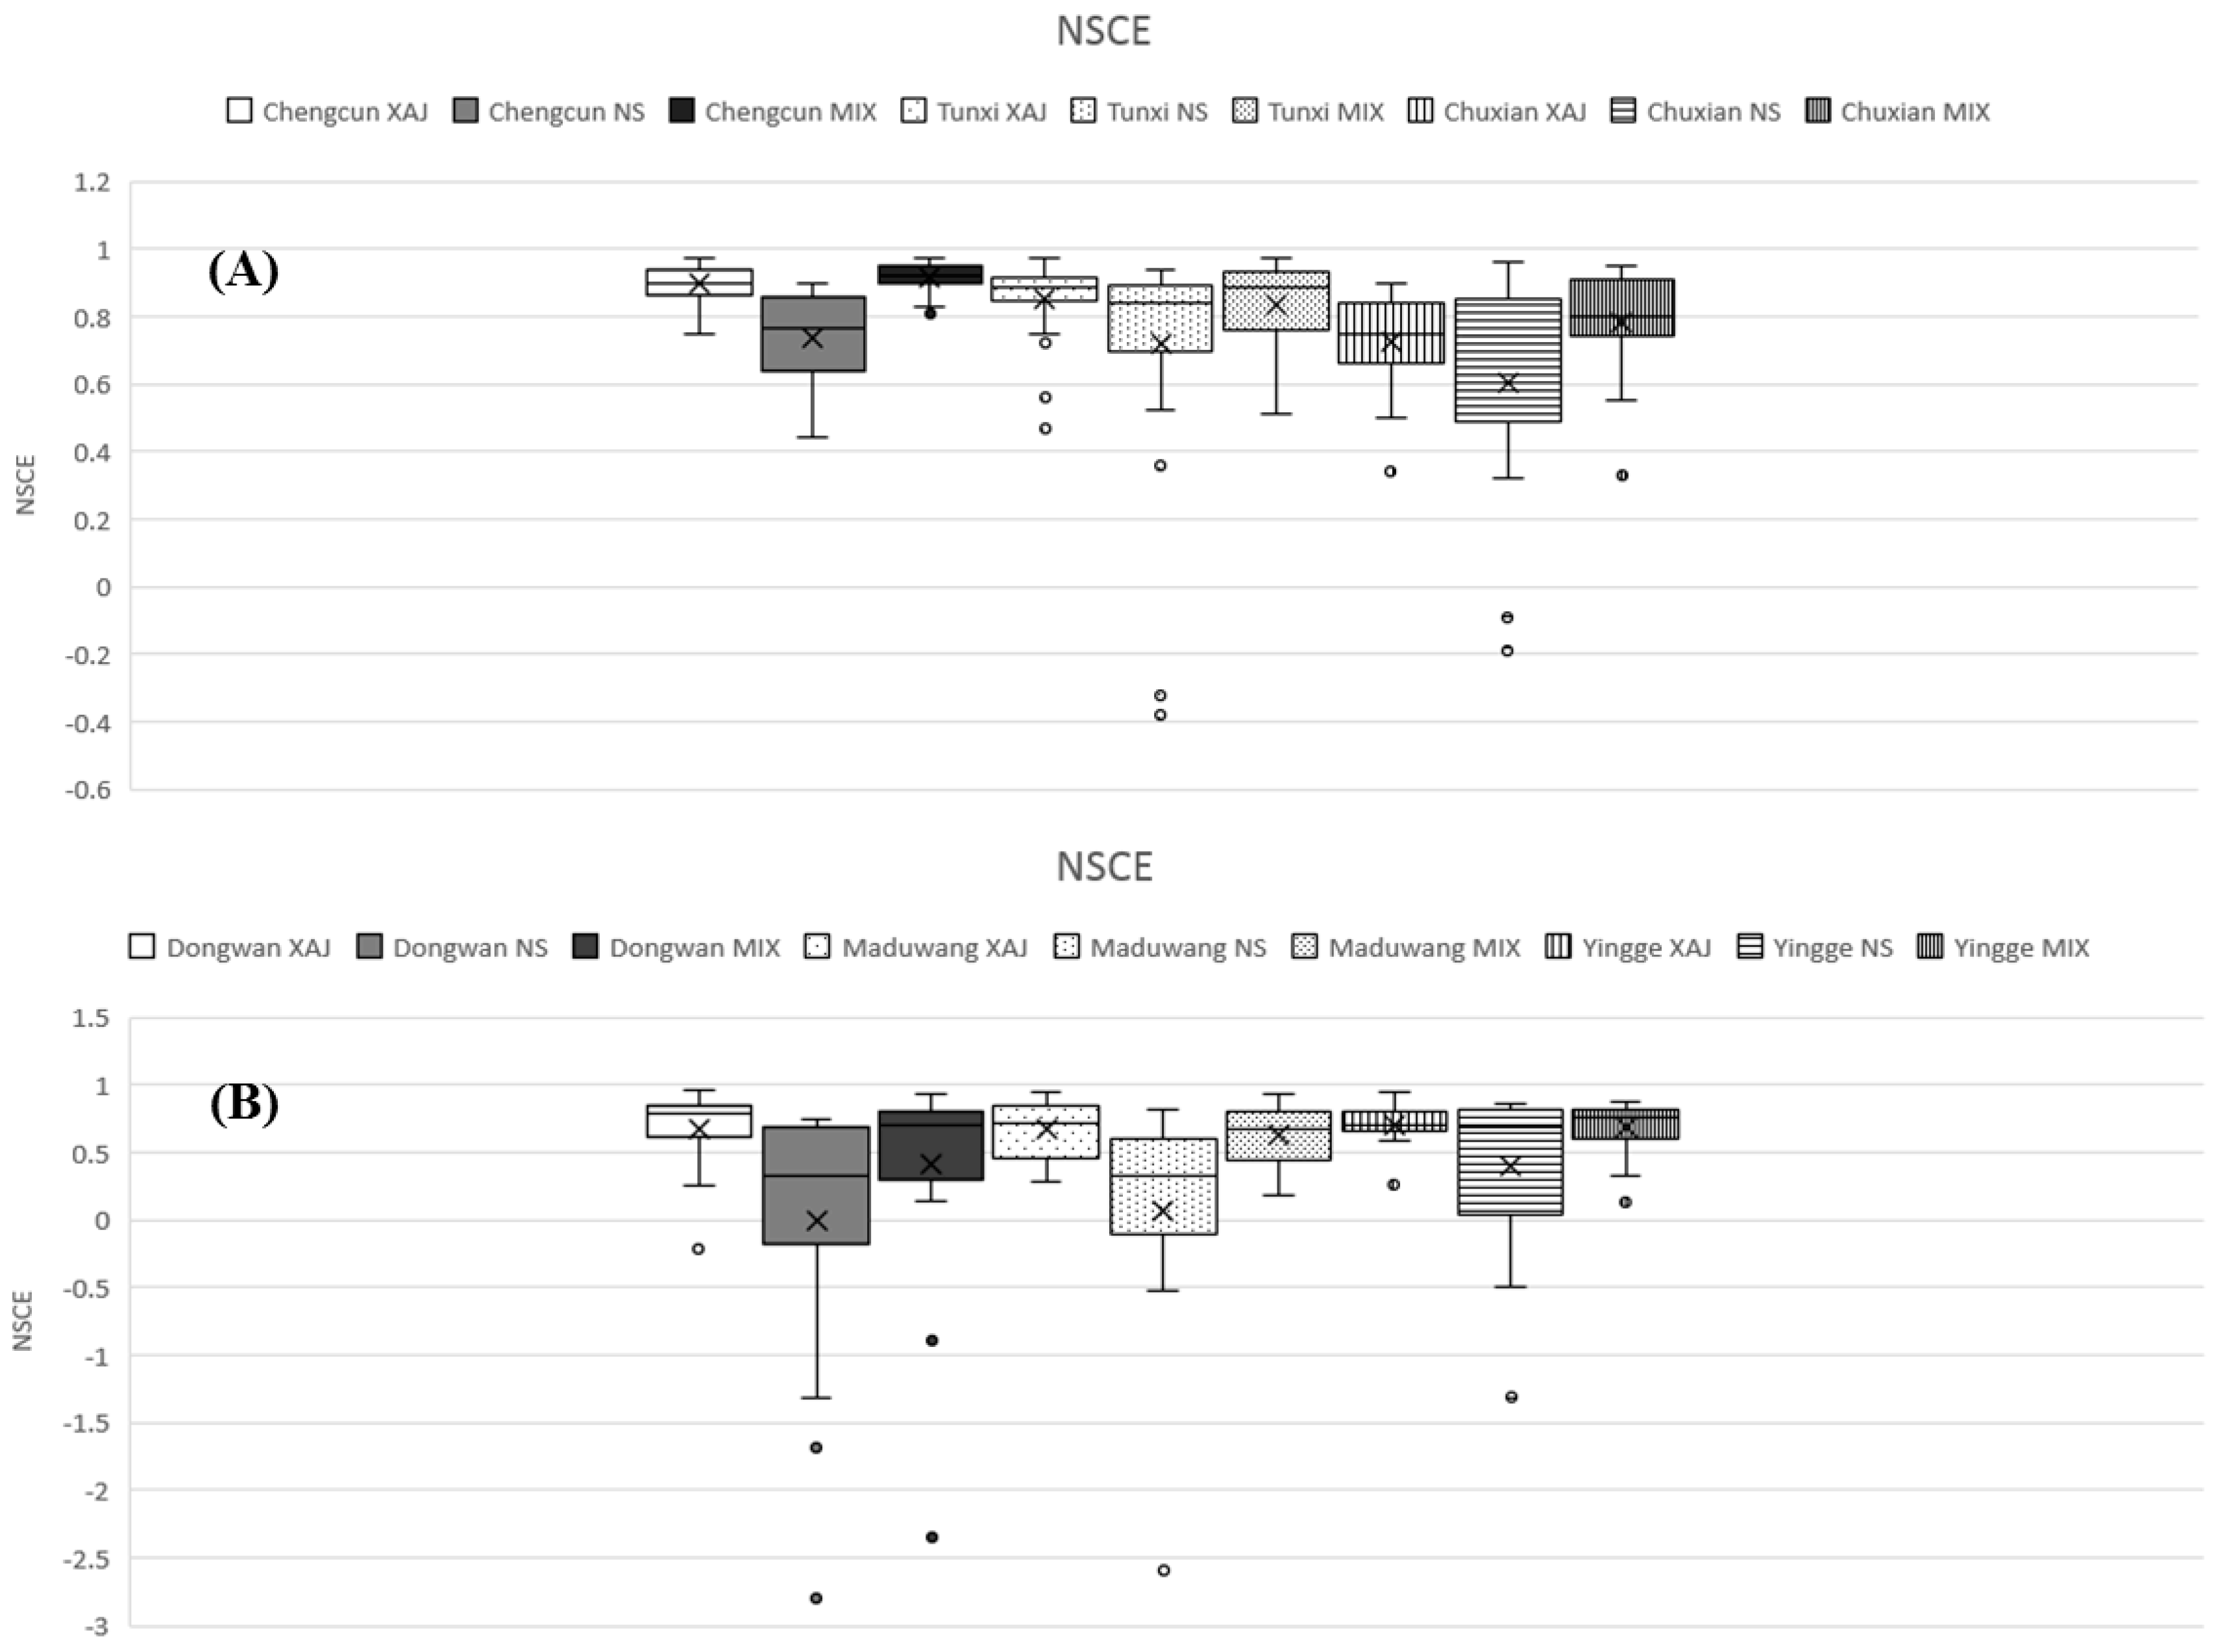
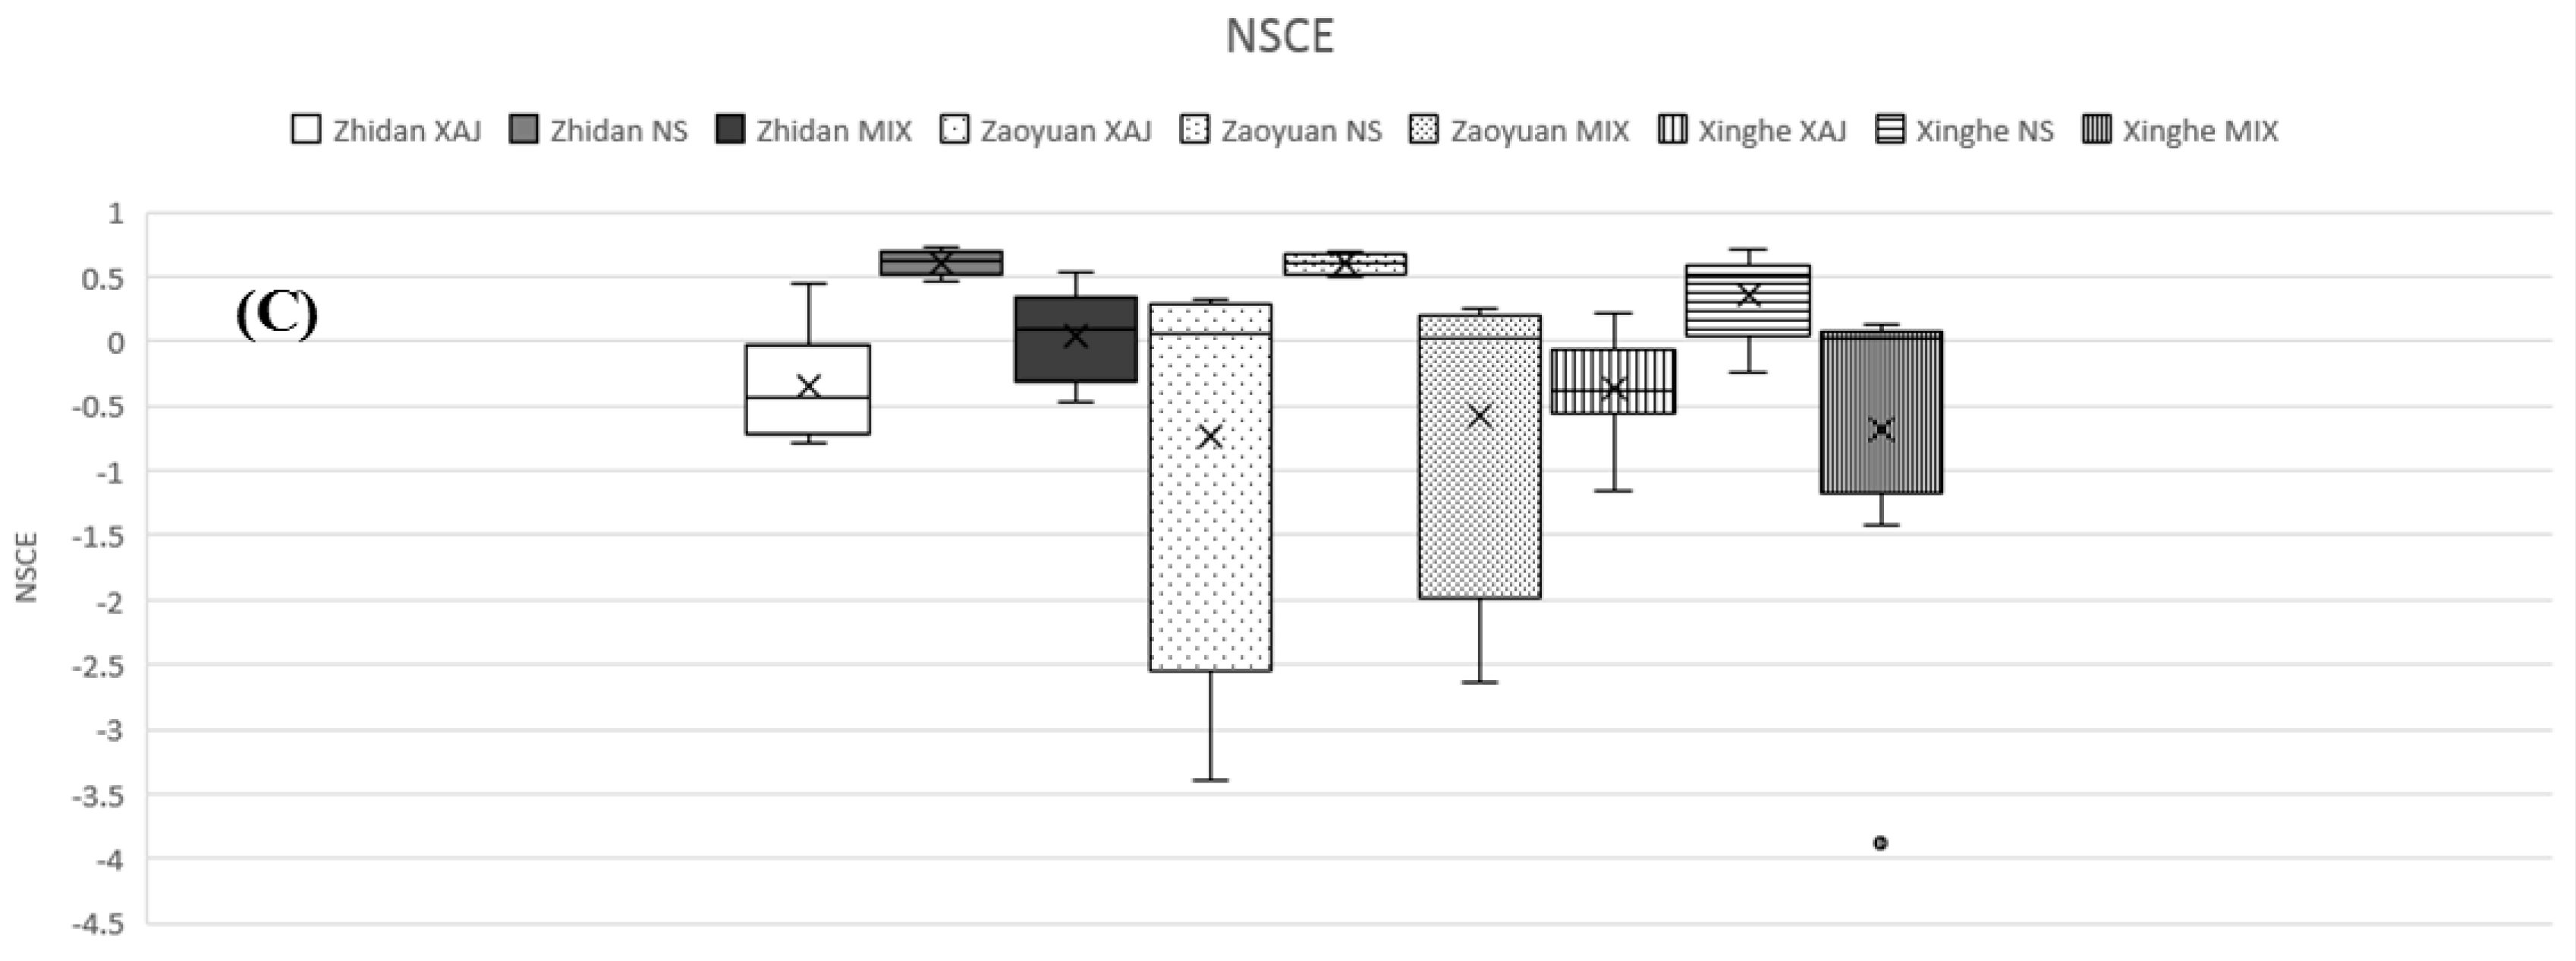
The boxplots of peak flooding time error (PFTE) for flood events of the humid (Figure 8A), semi-humid semi-arid (Figure 8B), and arid regions (Figure 8C) are demonstrated in Figure 8. It can be found the PFTE range of the humid regions is very wide. The upper and lower boundaries of the range of humid regions are about −200 and 800, respectively. Zoomed in figure indicates the distribution of PFTE is discrete and the peak flooding time simulations are not stable. Compared to the results of humid regions, the PFTE distributions of the semi-humid semi-arid and arid regions are more concentrated and stable. The better PFTE values of semi-humid semi-arid and arid regions may be owed to the characteristics and shapes of the hydrographs. After careful checking of historical flood events in semi-humid semi-arid and arid watersheds, we found that most hydrographs are single-peak shaped. On the other hand, lots of multiple-peak flood events are observed in the historical data set of humid regions. Even the total water quantity, peak flow, and process simulations of humid regions are better than semi-humid semi-arid and arid regions, the peak flooding time error may be very large. For example, supposing there is a double-peak flood event (assume the first peak is larger than the second peak) and the difference of the present times of these two flood peaks is 20 h. The hydrological model can simulate the hydrograph very well in water quantity, peak flow, and flow process, however the larger peak of the simulated hydrograph may not exactly be the first one. If the second simulated peak is larger than the first simulated peak, the PFTE will be very large (|PFTE| = 20 h in this example). As for the semi-humid semi-arid and arid regions, the flood events are usually single-peak shaped and therefore preventing the happening of the above mentioned problem. Furthermore, for drier watersheds such as the arid watersheds, the flood event duration is much shorter than the humid regions and therefore the maximum possible PFTE, which is constrained by the flood event duration, is relatively small (not larger than the flood event duration). Therefore, the extreme PFTE values of drier watersheds are much smaller than that of the wetter watersheds.
It can be observed the XAJ model demonstrates the best PFTE in humid watersheds, the MIX model demonstrates the best PFTE in semi-humid semi-arid watersheds, and the NS model demonstrates the best PFTE in arid watersheds. The MIX model performs slightly better than the XAJ model in arid regions, and the XAJ model is more suited to the wetter watersheds and cannot generate satisfactory results in arid regions.

3.2.4. NSCE

The boxplots of Nash-Sutcliffe coefficient of efficiency (NSCE) for flood events of the humid, semi-humid semi-arid, and arid regions are demonstrated in Figure 9. The model performances gradually decrease from humid regions through semi-humid semi-arid regions to arid regions. Most NSCEs in humid regions are good and larger than 0.6. Most NSCEs in semi-humid semi-arid regions are not too bad and larger than 0. However, in arid regions, lots of NSCEs are less than 0 which indicates the model simulations are worse than the mean value of observed discharges. It can be seen the performances of the XAJ and MIX models are equally good and applicable in humid and semi-humid semi-arid watersheds. Even though simulation results of NS model are worse than the XAJ and MIX models in humid and semi-humid semi-arid watersheds, the NS model is still applicable and can generate not too bad results in these regions. However, in arid regions, only the NS model is applicable. The performances of the XAJ and MIX models significantly deteriorate in arid regions. In arid regions such as Zhidan and Zaoyuan watersheds, the MIX model performs slightly better than the XAJ model.

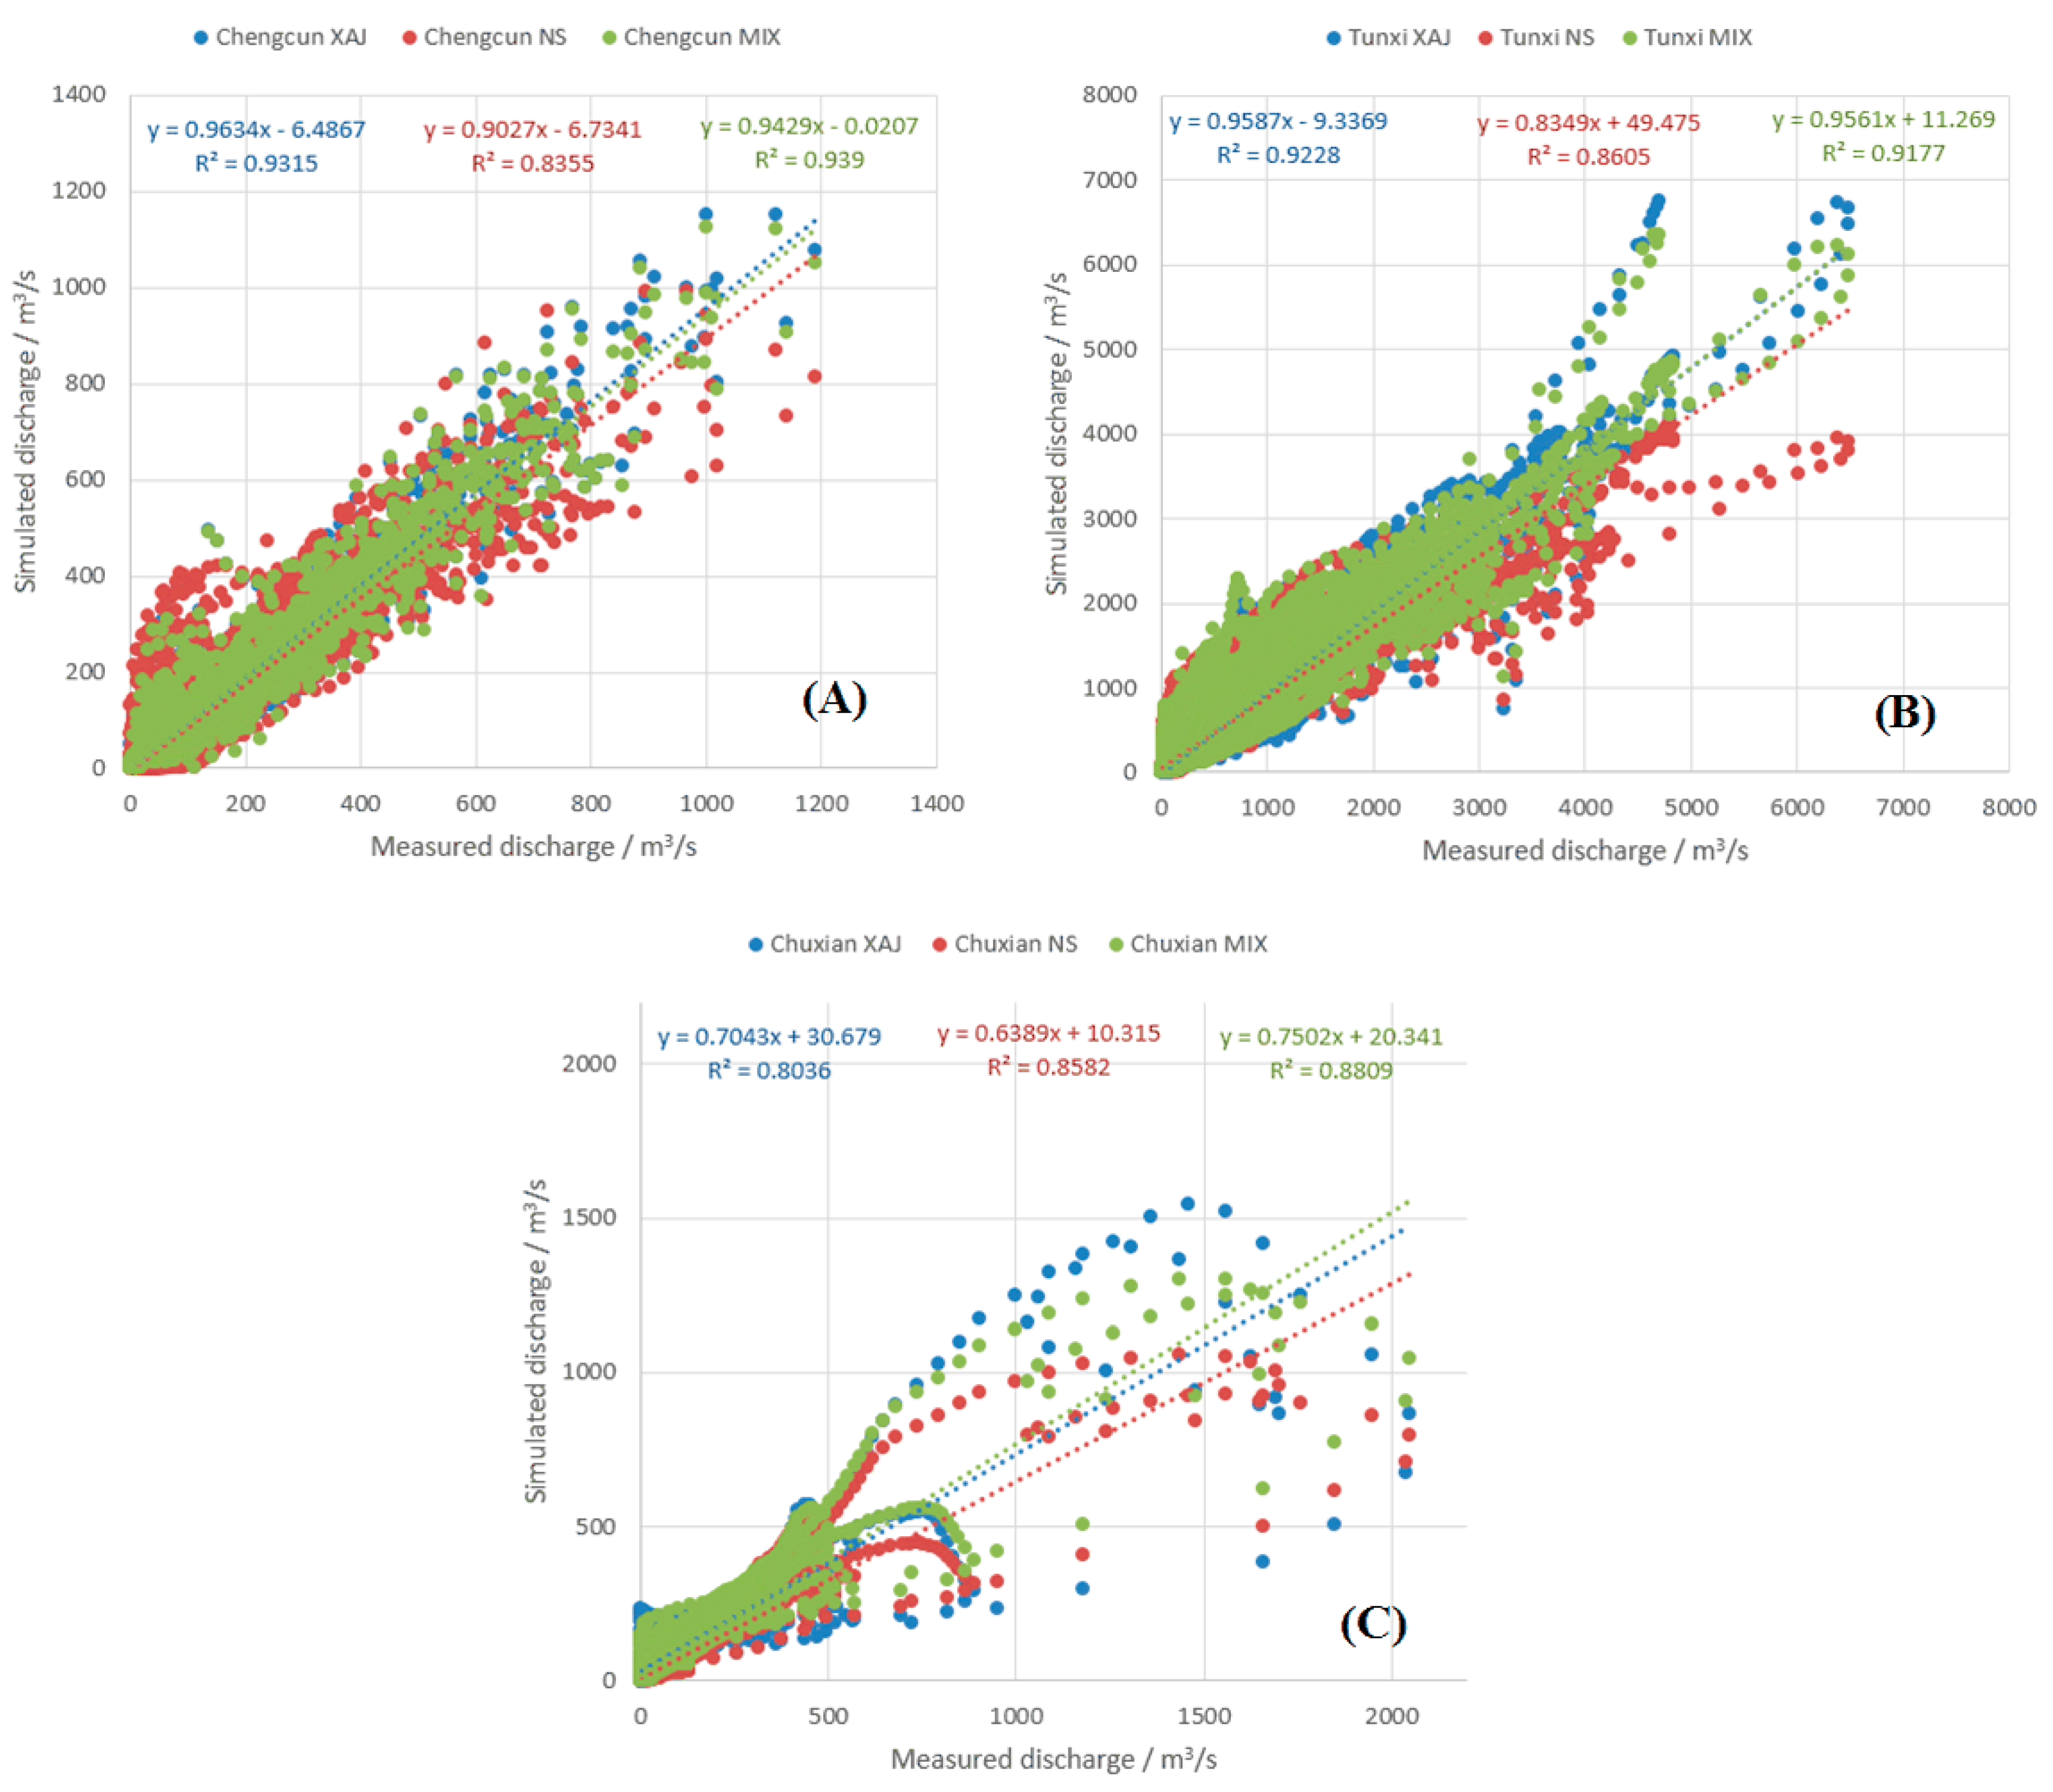
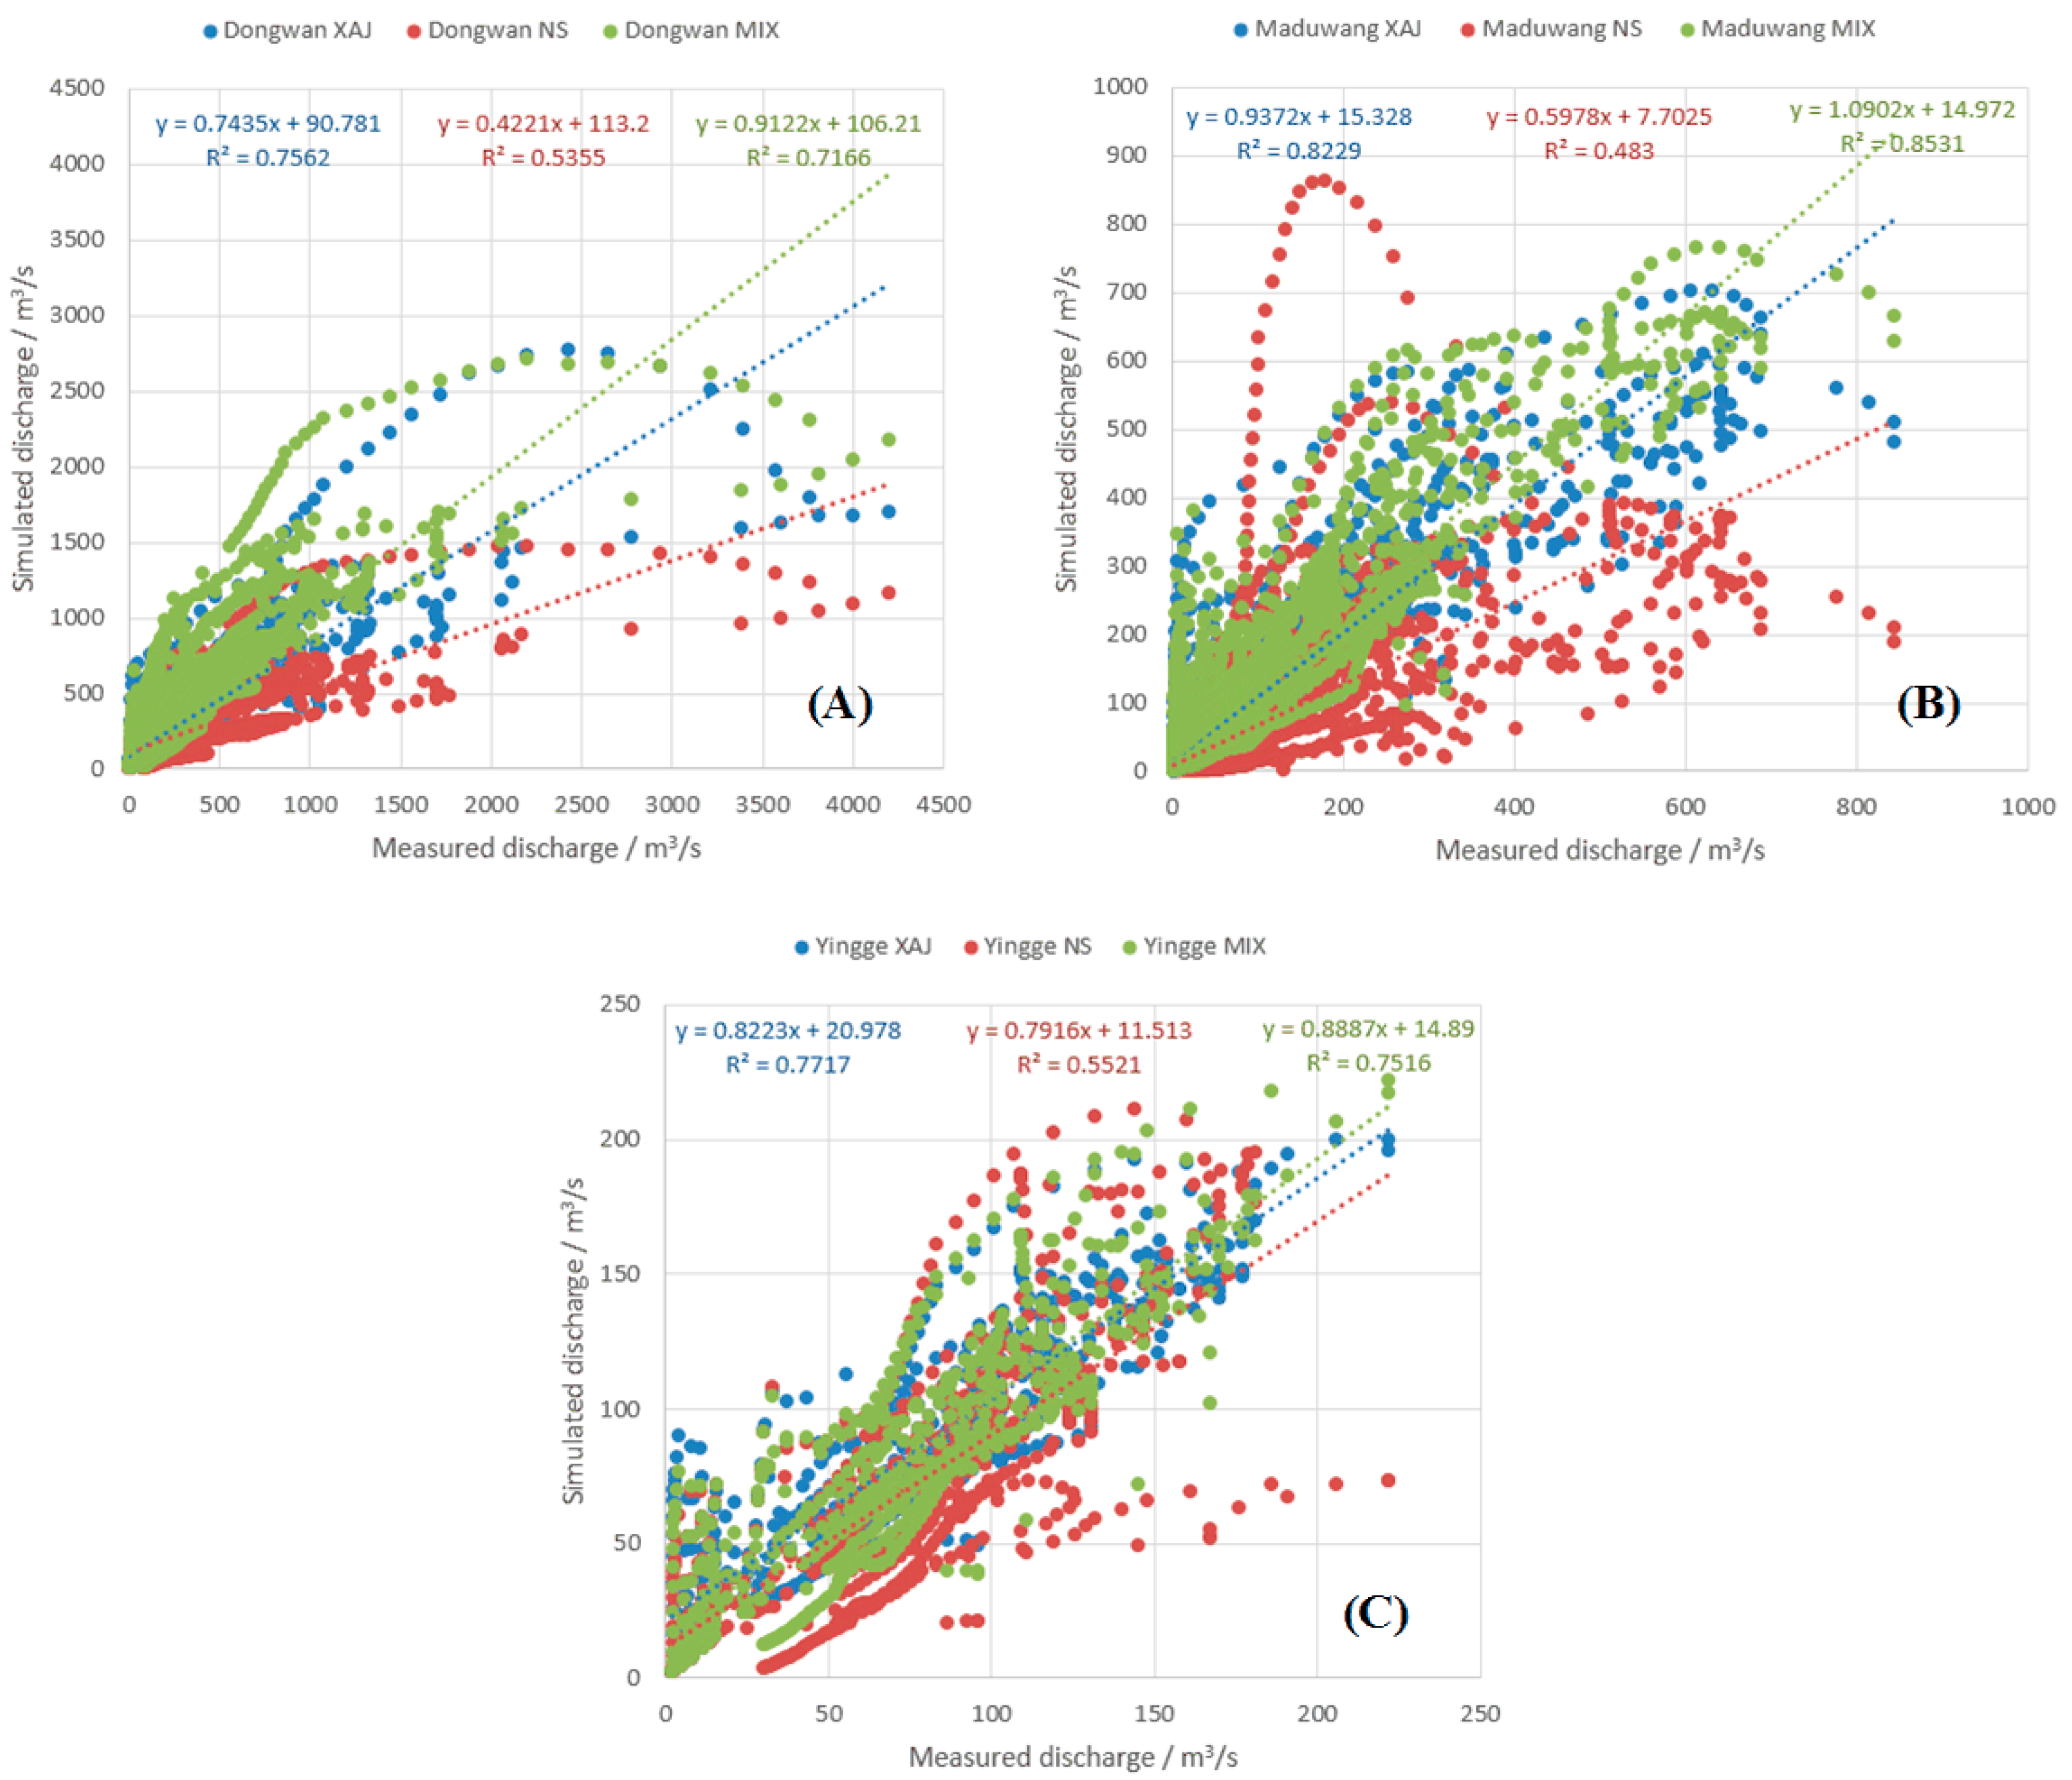
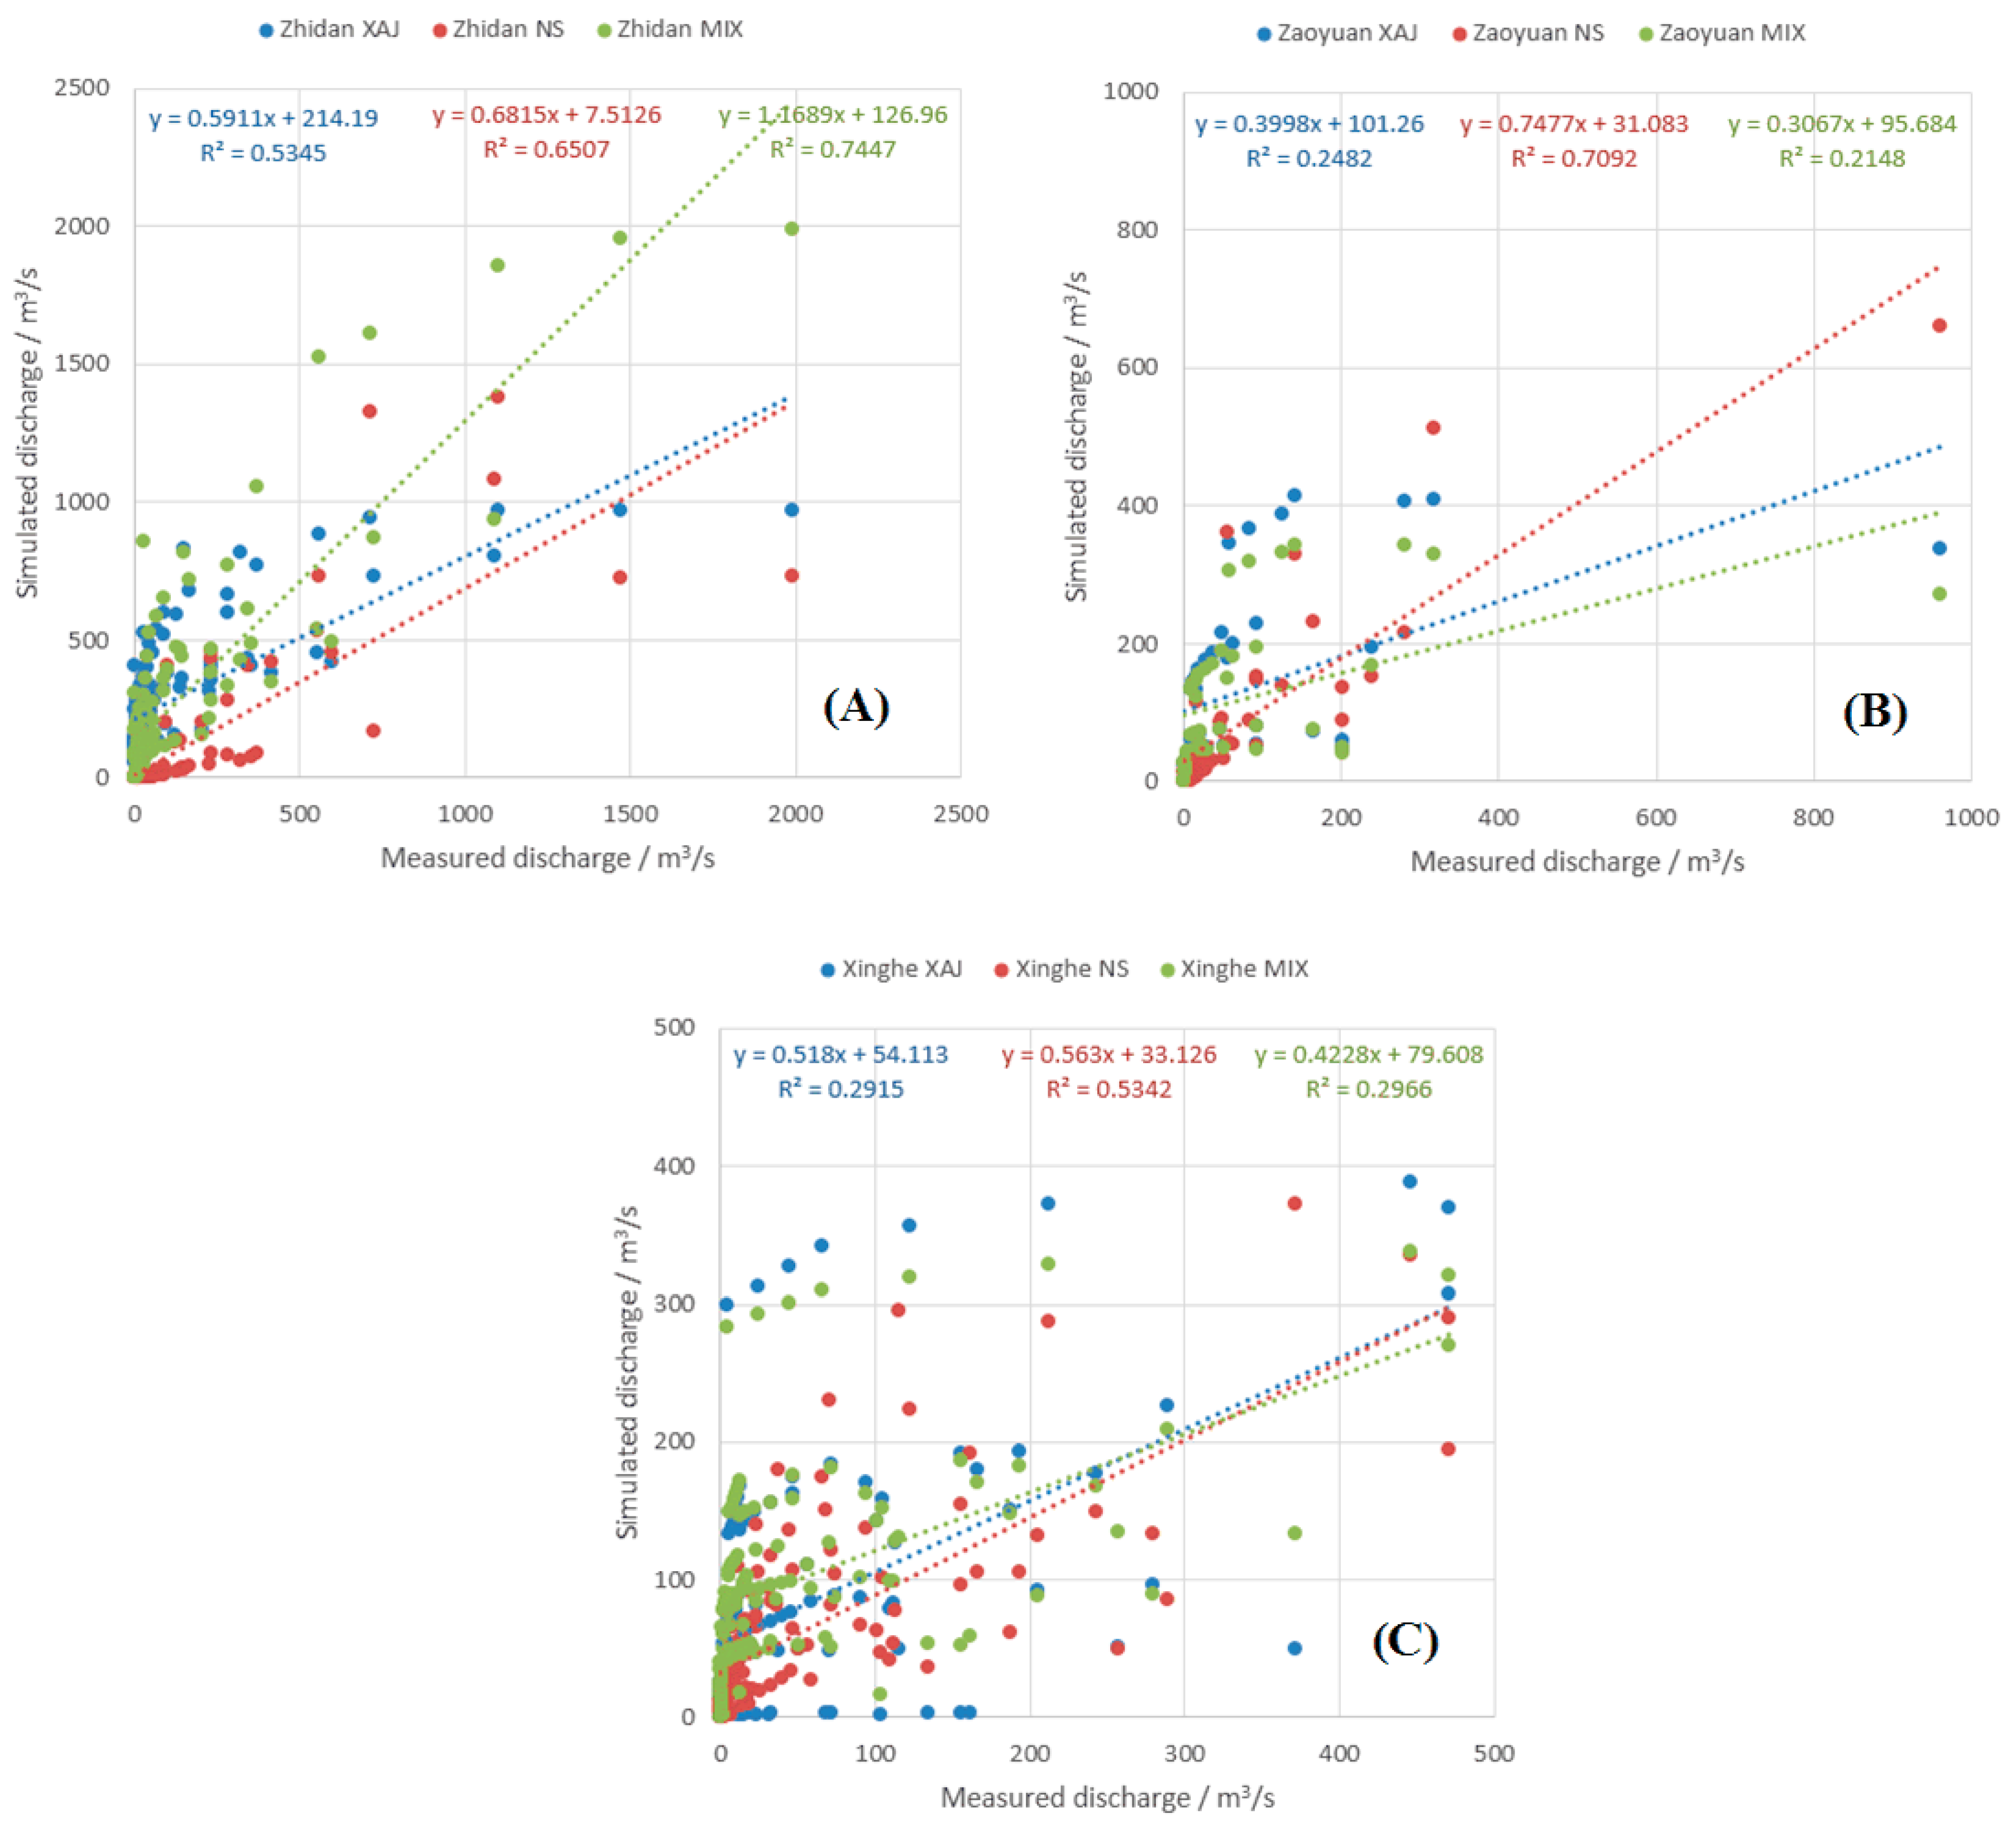
3.3. Model Performance Comparisons Based on Scatter Plots

Scatter plots of observed and simulated discharges for humid, semi-humid semi-arid, and arid regions are shown in Figure 10, Figure 11 and Figure 12. In this section, we analyze the model performances and carry out comparisons based on these scatter plots.
It can be seen in Figure 10 the XAJ and MIX models obtain comparably good simulations whose R2 values are larger than 0.9 in Chengcun and Tunxi watersheds. In Chuxian watershed, the R2 of MIX model is higher than that of XAJ model. The R2 of NS model is slightly worse than that of the XAJ and MIX models in Chengcun and Tunxi watersheds. For Chuxian watershed, the NS model outperforms the XAJ model and performs worse than the MIX model. The data points distribute concentrated around the regression lines for Chengcun and Tunxi watersheds. The distributions of data points are even and good in three humid watersheds, especially for small and medium discharge values. For large discharge values, the data points disperse and the simulation results become worse. The large discharge simulations of Chuxian watershed are especially poor. The poor simulation accuracy may be caused by reservoir operations. There are some reservoirs in the Chuxian watershed and we do not have sufficient reservoir operation information. Therefore, the simulation accuracy is worse than for Chengcun and Tunxi watersheds which are natural catchments and rarely affected by human activities. Overall speaking, the XAJ, NS, and MIX models perform satisfactorily in humid watersheds and no model overwhelmingly outperforms other models in these areas. All models are applicable in humid regions and can generate good simulation results.
As shown in Figure 11, the NS model performs worst in semi-humid semi-arid watersheds. The XAJ and MIX model generate comparably good simulation results in the three semi-humid semi-arid watersheds and outperform the NS model significantly. The R2 of XAJ and MIX models are all larger than 0.7. The R2 of NS model is lower than 0.6, especially low for Maduwang watershed. This indicates runoff components should include not only infiltration excess surface runoff but also interflow and ground water runoff in semi-humid semi-arid watersheds. The NS model only considers the infiltration excess surface runoff and therefore cannot generate satisfactory and reliable simulation results. It can be observed the MIX model does not significantly outperform the XAJ model. This indicates the vertical mix runoff generation mechanism implemented by the MIX model is not mature enough to mimic the highly complex rainfall-runoff relationship of the semi-humid semi-arid watersheds such as Dongwan, Maduwang, and Yingge, even though the MIX model tries to consider the infiltration and saturation excess runoff, interflow, and ground water runoff. More complex model structure and additional parameters do not significantly increase the simulation accuracy compared to a relatively simpler XAJ model which only considers saturation excess runoff, interflow, and ground water runoff. Therefore, hydrological model specially designed for the rainfall-runoff simulation of the semi-humid semi-arid watersheds needs further and deeper research, and new observation methods are also urgently needed.
It can be seen in Figure 12 the NS model outperforms other models significantly in arid regions such as Zaoyuan and Xinghe. The XAJ and MIX models perform poor in these areas. This indicates infiltration excess runoff is the crucial and determinate runoff component in arid watersheds. There is almost no interflow and ground water runoff generated in arid regions. This is consistent with the characteristics of rivers in arid watersheds. Many arid rivers are ephemeral streams and usually have very small or almost no discharge or baseflow in dry seasons, and some rivers even draught-up. It is observed the MIX model significantly outperforms the XAJ model in Zhidan watershed and performs almost equally compared to the XAJ model in Zaoyuan and Xinghe watersheds. This indicates the inclusion of infiltration excess runoff generation mechanism can improve the simulations to some extent in arid watersheds. The XAJ model only considers the saturation excess runoff. The initial soil moisture of arid watersheds is usually low and the water storage capacity is very large, therefore, the runoff computed according to the saturation excess mechanism is usually underestimated. This leads to the worst simulation results of the XAJ model. It should be noted even the R2 of NS model is the best, the model performance of the NS model is still not as good as it is observed in humid regions. The worse results may due to the too large observation and computation time interval (1 h in this study). Because the infiltration excess runoff generation mechanism usually requires high time resolution of observed rainfall data (such as at least 10 min). Therefore, the improvement of data quality is an important factor in arid region flood simulation and forecasting.

3.4. General Performance of the Models

The flood events characteristics, simulation accuracies, and reliabilities of hydrological models are quite different for three kinds of watersheds. Some typical measured hydrographs of the 9 study watersheds are shown in Figure 13. In Figure 13, the upper line (A) refers to humid watershed, the middle one (B) to semi-humid semi-arid watersheds and the bottom line (C) to arid watersheds.
The floods happen frequently in humid regions and sufficient flood events can be used for model calibration and validation. The peak flows are larger compared to arid watersheds. The nonlinearity of the rainfall-runoff relationships of the humid watersheds is not high. Linear regression analyses in previous paragraphs have revealed highly linear correlation between rainfall and runoff in humid regions. The flood simulation accuracies of humid watersheds are good and reliable. All kinds of models are applicable and generate acceptable simulations in humid watersheds. The models, with consideration of the saturation excess runoff generation mechanism, outperform other models. Even the NS model, which do not have saturation excess computation module and only generates infiltration excess surface runoff, simulates the outlet discharges acceptably. Therefore, the flood simulation and forecasting is not too hard in humid regions.
The flood simulations in arid regions are not easy compared to humid regions. The climate of arid regions is very dry and it seldom rains in these regions. The rainfall intensity is usually very high and the rainfall duration is short. The peak flows rise up and go down rapidly, and the shape of hydrographs is very slim and high. The flood simulation accuracies of XAJ and MIX models are very bad. Only the NS model is applicable in arid regions. The historical flood event data is insufficient and the data quality is also very poor. The model parameters cannot be stably calibrated using small number of historical flood events. The quality of rainfall data is poorer compared to humid watersheds. The observation time interval of the available rainfall data is 1 h which is too long for the infiltration excess-based runoff generation model. The density of rainfall stations is also very low. These factors lead to poor quality of rainfall data. After checking the rainfall data of arid watersheds, we find the spatial-temporal distributions of rainfall data of some flood events are not correctly captured. Some rainfall peaks appear later than the flood peak. For flood peaks with same quantity level, some flood events correspond to much smaller rainfall compared to other flood events and therefore cannot be correctly simulated. These unreasonable phenomena are attributed to the poor quality of the observation data in arid watersheds. Therefore, constrained by the data quality, the flood simulation and forecasting in arid regions are still hard, and the uncertainty issue is severe and challenging.
In semi-humid semi-arid watersheds, the XAJ and MIX models are applicable and generate satisfactory simulation results. The performance of NS model is poor. This indicates the runoff components of semi-humid semi-arid watersheds should include both infiltration and saturation excess-based surface runoff, interflow, and ground water runoff. The rainfall-runoff process is very complex considering the spatial-temporal heterogeneity in semi-humid semi-arid watersheds. Even though the MIX model performs well in both humid and semi-humid semi-arid watersheds, it does not significantly outperform the XAJ model. Especially, its performance is poor in arid watersheds. The MIX model is originally designed for flood simulation and forecasting in watersheds with highly complex runoff generation processes. It is constructed with infiltration and saturation excess modules which are designed for switching between different runoff generation mechanisms automatically. The applications of MIX model in humid and semi-humid semi-arid watersheds indicate the MIX model can switch between infiltration and saturation excess automatically and the simulation accuracies are good. However, application of the MIX model in arid watersheds implies the MIX model cannot switch into a pure infiltration excess-based rainfall-runoff model by using automatic parameter calibration method such as SCE-UA. The saturation excess module is still working and has not been disabled by automatically adjusting the model parameters. Therefore, further studies on how to design an infiltration and saturation excess coupled hydrological model which can more accurately describe the hydrological processes and auto-switch between different runoff generation mechanisms for different watersheds are absolutely required.

4. Conclusions

In this study, we carry out flood simulation in 9 typical humid, semi-humid semi-arid, and arid Chinese watersheds by using the widely accepted and applied XAJ, MIX, and NS models. The characteristics of flood events are analyzed based on statistical analysis and information theory. The model performances are compared and analyzed based on boxplots and scatter plots. Three conclusions can be drawn:
(1) The rainfall happens more frequently in wetter watersheds than in drier watersheds. The underlying surface of wetter watersheds is different from that of the drier watersheds. The vegetation of drier watersheds is usually not so abundant as that of the wetter watersheds. This generates three completely different runoff generation mechanisms, including saturation excess, mix, and infiltration excess mechanisms. For humid watersheds, the total rainfall and the rainfall duration are usually large but with a small intensity. For arid watersheds, the rainfall intensity is large but the total rainfall and the rainfall duration are small. Consequently, the hydrograph is “fat” (with long flood duration) and “slim” (with short flood duration) in humid and arid watersheds, respectively. The rainfall and runoff present a higher linear correlation relationship in wetter watersheds and the mutual information contained in the rainfall-runoff data is also higher in wetter watersheds. The runoff coefficient and peak flow present a significant correlation in arid watersheds however the correlation relationship is dramatically deteriorating in semi-humid semi-arid watersheds.
(2) Difficulty of flood simulation and forecasting increases when the watershed becomes drier. All models perform well in humid regions. The models, with consideration of the saturation excess runoff generation mechanism, perform well in semi-humid semi-arid watersheds. On the other hand, the model only considers infiltration excess runoff generation mechanism performs worst. Only NS model can generate acceptable results in arid watersheds. The MIX model which can generate infiltration excess surface runoff outperforms the saturation excess-based XAJ model in arid regions. The simulation results indicate flood forecasting in semi-humid semi-arid and arid regions is still challenging and yet to be solved.
(3) Flood simulation and forecasting in humid regions have been developed well and the saturation excess runoff generation mechanism-based hydrological models, such as the XAJ model, have been successfully applied in China for decades. The flood forecasting in semi-humid semi-arid watersheds is yet to be solved and still challenging. The mix runoff generation mechanism considering the spatial-temporal heterogeneity and variation in semi-humid semi-arid watersheds is far from mature. Without a convincible mix runoff generation theory, the accuracy of flood simulation and forecasting is unstable and the uncertainty issue cannot be solved. The study on infiltration excess runoff generation mechanism needs further research. The theoretical solution of the infiltration equation has not yet been obtained and numerical solution with stable convergence and high computational efficiency is also in great need. Apart from the above-mentioned issues, data quality is another important obstacle for flood forecasting in China. Data sharing and data spatial-temporal resolution should also be improved in the future.

Acknowledgments

This research was funded by China Postdoctoral Science Foundation on Grant (Grant No. 2016M600096), Research on Key Technologies of Real Time Dynamic Control of Water Level in Flood Season of Cascade Reservoirs (KY1734), the Third Sub-Project: Flood Forecasting, Controlling and Flood Prevention Aided Software Development—Flood Control Early Warning Communication System and Flood Forecasting, Controlling and Flood Prevention Aided Software Development for Poyang Lake Area of Jiangxi Province (0628-136006104242, JZ0205A432013, SLXMB200902), Construction project of Shaanxi province medium and small river hydrological monitoring and forecast system—construction of Guanzhong and north of Shaanxi flood forecast scheme (JZ0205A112015), Major International (Regional) Joint Research Project—China’s Water and Food Security under Extreme Climate Change Impact: Risk Assessment and Resilience (G0305, 7141101024), International Project (71461010701), Study of distributed flood risk forecast model and technology based on multi-source data integration and hydro meteorological coupling system (2013CB036406), and China National Flash Flood Disaster Prevention and Control Project (126301001000150068). We gratefully acknowledge the support of NVIDIA Corporation with the donation of the Tesla K40 GPU used for this research. Guangyuan Kan, Xiaoyan He, and Liuqian Ding are the corresponding authors. The author(s) declare(s) that there is no conflict of interest regarding the publication of this paper.

Author Contributions

Guangyuan Kan, Jiren Li, and Xiaoyan He conceived and designed the experiments; Guangyuan Kan, Jiren Li, and Ke Liang performed the experiments and analyzed the data; Xiaoyan He, Liuqian Ding, Jiren Li, and Yang Hong contributed materials and analysis tools; Guangyuan Kan and Ke Liang wrote the paper.

Conflicts of Interest

The authors declare there is no conflicts of interest.

References

  1. Lei, T.; Li, L.; Kan, G.; Zhang, Z.; Sun, T.; Zhang, X.; Ma, J.; Huang, S. Automatic registration of unmanned aerial vehicle remote sensing images based on an improved SIFT algorithm. In Proceedings of the Eighth International Conference on Digital Image Processing (ICDIP 2016), Chengdu, China, 20–22 May 2016. [Google Scholar]
  2. Lei, T.; Pang, Z.; Wang, X.; Li, L.; Fu, J.; Kan, G.; Zhang, X.; Ding, L.; Li, J.; Huang, S.; et al. Drought and carbon cycling of grassland ecosystems under global change: A review. Water 2016, 8, 460. [Google Scholar] [CrossRef]
  3. Hall, J.; Arheimer, B.; Aronica, G.T.; Bilibasi, A.; Bohac, M.; Bonacci, O.; Borga, M.; Burlando, P.; Castellarin, A.; Chirico, G.B.; et al. A European Flood Database: Facilitating comprehensive flood research beyond administrative boundaries. In Changes in Flood Risk and Perception in Catchments and Cities; Proceedings of the International Association of Hydrologic Sciences, (PIAHS, ISSN 0144-7815, Volume 370); Rogger, M., Ed.; Copernicus Publications—International Association of Hydrologic: Stanford, CA, USA, 2015; pp. 89–95. [Google Scholar]
  4. Farkas, C.; Kværnø, S.; Engebretsen, A.; Deelstra, J. Applying profile- and catchment-based mathematical models for evaluating the run-off from a Nordic catchment. J. Hydrol. Hydromech. 2016, 64, 218–225. [Google Scholar] [CrossRef]
  5. Nester, T.; Komma, J.; Blöschl, G. Real time flood forecasting in the Upper Danube basin. J. Hydrol. Hydromech. 2016, 64, 404–414. [Google Scholar] [CrossRef]
  6. Zuo, D.; Cai, S.; Xu, Z.; Li, F.; Sun, W.; Yang, X.; Kan, G.; Liu, P. Spatiotemporal patterns of drought at various time scales in Shandong Province of Eastern China. Theor. Appl. Climatol. 2016. [Google Scholar] [CrossRef]
  7. Blöschl, G.; Hall, J.; Parajka, J.; Perdigão, R.A.P.; Merz, B.; Arheimer, B.; Aronica, G.T.; Bilibashi, A.; Bonacci, O.; Borga, M.; et al. Changing climate shifts timing of European floods. Science 2017, 357, 588–590. [Google Scholar] [CrossRef] [PubMed]
  8. Chen, S.; Kan, G.; Liang, K.; Li, J.; Hong, Y.; Zuo, D.; Lei, T.; Xu, W.; Zhang, M.; Shi, W.; et al. Air quality analysis and forecast for environment and public health protection: A case study in Beijing, China. Transylv. Rev. 2016, XXIV, 3575–3593. [Google Scholar]
  9. Dong, J.; Zheng, C.; Li, Z.; Kan, G.; Zhao, M.; Yang, N. SCE-UA algorithm for economic load dispatch of generators with value-point effects. J. Hydroelectr. Eng. 2014, 33, 277–285. (In Chinese) [Google Scholar]
  10. Dong, J.; Zheng, C.; Kan, G.; Wen, J.; Zhao, M.; Yu, J. Applying the ensemble artificial neural network-based hybrid data-driven model to daily total load forecasting. Neural Comput. Appl. 2015, 26, 603–611. [Google Scholar] [CrossRef]
  11. Dong, J.; Zheng, C.; Kan, G.; Zhao, M. Optimal scheduling of hydrothermal system with network and ramping via SCE-UA method. Open Cybern. Syst. J. 2015, 7, 55–64. [Google Scholar] [CrossRef]
  12. Kan, G.; Liu, Z.; Li, Z.; Yao, C.; Zhou, S. Couping Xinanjiang runoff generation model with improved BP flow concentration model. Adv. Water Sci. 2012, 23, 21–28. (In Chinese) [Google Scholar]
  13. Kan, G.; Li, Z.; Liu, Z.; Li, Q.; Hu, Y. An improved neural network model and its application to hydrological simulation. J. Hohai Univ. 2013, 41, 294–299. (In Chinese) [Google Scholar]
  14. Kan, G.; Li, Z.; Liu, Z.; Yao, C.; Zhang, H. Application and study on coupling of conceptual hydrological model and neural network model. J. Hydroelectr. Eng. 2013, 32, 9–13. (In Chinese) [Google Scholar]
  15. Li, Z.; Huang, P.; Yao, C.; Li, Q.; Zhao, L.; Yu, Z. Application of flexible-structure hydrological models in different runoff generation regions. Adv. Water Sci. 2014, 25, 28–35. (In Chinese) [Google Scholar]
  16. Zhao, L.; Kan, G.; Li, Z. Building and application of XPBK neural network model. Yellow River 2014, 36, 30–32. (In Chinese) [Google Scholar]
  17. Kan, G.; Yao, C.; Li, Q.; Li, Z.; Yu, Z.; Liu, Z.; Ding, L.; He, X.; Liang, K. Improving event-based rainfall-runoff simulation using an ensemble artificial neural network based hybrid data-driven model. Stoch. Environ. Res. Risk Assess. 2015, 29, 1345–1370. [Google Scholar] [CrossRef]
  18. Kan, G.; Li, J.; Zhang, X.; Ding, L.; He, X.; Liang, K.; Jiang, X.; Ren, M.; Li, H.; Wang, F.; et al. A new hybrid data-driven model for event-based rainfall-runoff simulation. Neural Comput. Appl. 2015, 28, 2519–2534. [Google Scholar] [CrossRef]
  19. Kan, G.; He, X.; Ding, L.; Li, J.; Lei, T.; Liang, K.; Hong, Y. An improved hybrid data-driven model and its application in daily rainfall-runoff simulation. In Proceedings of the 6th Digital Earth Summit on IOP Conference Series: Earth and Environmental Science, Beijing, China, 7–8 July 2016; Volume 46. [Google Scholar]
  20. Kan, G.; He, X.; Li, J.; Ding, L.; Zhang, D.; Lei, T.; Hong, Y.; Liang, K.; Zuo, D.; Bao, Z.; et al. A novel hybrid data-driven model for multi-input single-output system simulation. Neural Comput. Appl. 2016. [Google Scholar] [CrossRef]
  21. Kan, G.; Liang, K.; Li, J.; Ding, L.; He, X.; Hu, Y.; Amo-Boateng, M. Accelerating the SCE-UA global optimization method based on multi-core CPU and many-core GPU. Adv. Meteorol. 2016, 2016, 8483728. [Google Scholar] [CrossRef]
  22. Kan, G.; Lei, T.; Liang, K.; Li, J.; Ding, L.; He, X.; Yu, H.; Zhang, D.; Zuo, D.; Bao, Z.; et al. A multi-core CPU and many-core GPU based fast parallel shuffled complex evolution global optimization approach. IEEE Trans. Parallel Distrib. Syst. 2016. [Google Scholar] [CrossRef]
  23. Kan, G.; Zhang, M.; Liang, K.; Wang, H.; Jiang, Y.; Li, J.; Ding, L.; He, X.; Hong, Y.; Zuo, D.; et al. Improving water quantity simulation & forecasting to solve the energy-water-food nexus issue by using heterogeneous computing accelerated global optimization method. Appl. Energy 2016. [Google Scholar] [CrossRef]
  24. Zhao, R.; Zhuang, Y.; Fang, L.; Liu, X.; Zhuang, Q. The Xinanjiang Model, Hydrological Forecasting—Prévisions hydrologi, Proceedings Oxford Symposium; IAHS-AISH Press: Wallingford, UK, 1980; No. 129; pp. 351–356. Available online: http://hydrologie.org/redbooks/a129/iahs_129_0351.pdf (accessed on 18 September 2017).
  25. Zhao, R. Watershed Hydrological Model-Xinanjiang Model and Northern Shaanxi Model; Water Resources and Electric Power Press: Beijing, China, 1983. [Google Scholar]
  26. Zhao, R. The Xinanjiang model applied in China. J. Hydrol. 1992, 135, 371–381. [Google Scholar]
  27. Zhao, R. A non-linear system model for basin concentration. J. Hydrol. 1993, 142, 477–482. [Google Scholar]
  28. Zhao, R. Anthology of Hydrological Forecasting; Water Resources and Electric Power Press: Beijing, China, 1994. [Google Scholar]
  29. Huang, P.; Li, Z.; Yao, C.; Hu, C.; Zhang, J. Application and comparison of hydrological models for semi-arid and semi-humid regions. J. Hydroelectr. Eng. 2013, 32, 4–9. (In Chinese) [Google Scholar]
  30. Li, Z.; Kan, G.; Yao, C.; Liu, Z.; Li, Q.; Yu, S. Improved neural network model and its application in hydrological simulation. J. Hydrol. Eng. 2014, 19, 04014019-1–04014019-17. [Google Scholar] [CrossRef]
  31. Li, Z.; Huang, P.; Zhang, Y.; Yao, C.; Yan, M.; Huo, W. Study on spatial combination model of infiltration-excess and saturation-excess runoff in semi-humid watersheds. Yellow River 2015, 37, 1–6. (In Chinese) [Google Scholar]
  32. Bao, W.; Wang, C. Vertically-mixed runoff generation model and its application. J. China Hydrol. 1997, 3, 18–21. (In Chinese) [Google Scholar]
  33. Bao, W.; Zhao, L.; Wang, J.; Wang, H.; Qian, K. Linearized calibration of vertically-mixed runoff model parameters. J. Hydroelectr. Eng. 2014, 33, 85–91. (In Chinese) [Google Scholar]
  34. Wang, Q.; Shen, G.; Wang, H. Application and improvement of vertical-mixed runoff model in different regions. Water Sav. Irrig. 2012, 5, 11–15. (In Chinese) [Google Scholar]
  35. Wen, S.; Cai, T. Application of improved vertical mixed runoff model in Dalinghe river basin. Water Resour. Hydropower Northeast China 2015, 4, 45–48. (In Chinese) [Google Scholar]
  36. Li, Z.; Kong, X.; Zhang, C. Improving Xin’anjiang model. J. China Hydrol. 1998, 4, 19–23. (In Chinese) [Google Scholar]
  37. Qu, S.; Bao, W.; Zhang, M.; Ji, H.; Hu, Q. Comparison of Xin’anjiang model with vertically-mixed runoff model. J. Hohai Univ. (Nat. Sci.) 2003, 32, 374–377. (In Chinese) [Google Scholar]
  38. Duan, Q. A Global Optimization Strategy for Efficient and Effective Calibration of Hydrologic Models. Ph.D. Thesis, Department of Hydrology and Water Resources, University of Arizona, Tucson, AZ, USA, 1991. [Google Scholar]
  39. Duan, Q.; Sorooshian, S.; Gupta, V. Effective and efficient global optimization for conceptual rainfall-runoff models. Water Resour. Res. 1992, 28, 1015–1031. [Google Scholar] [CrossRef]
  40. Duan, Q.; Gupta, V.K.; Sorooshian, S. Shuffled complex evolution approach for effective and efficient global minimization. J. Optim. Theory Appl. 1993, 76, 501–521. [Google Scholar] [CrossRef]
  41. Duan, Q.; Sorooshian, S.; Gupta, V. Optimal use of the SCE-UA global optimization method for calibrating watershed models. J. Hydrol. 1994, 158, 265–284. [Google Scholar] [CrossRef]
  42. Bowden, G.J.; Dandy, G.C.; Maier, H.R. Input determination for neural network models in water resources applications. Part 1-background and methodology. J. Hydrol. 2005, 301, 75–92. [Google Scholar] [CrossRef]
  43. Bowden, G.J.; Maier, H.R.; Dandy, G.C. Input determination for neural network models in water resources applications. Part 2. Case study: Forecasting salinity in a river. J. Hydrol. 2005, 301, 93–107. [Google Scholar] [CrossRef]
  44. May, R.J.; Dandy, G.C.; Maier, H.R.; Nixon, J.B. Application of partial mutual information variable selection to ANN forecasting of water quality in water distribution systems. Environ. Model. Softw. 2008, 23, 1289–1299. [Google Scholar] [CrossRef]
  45. May, R.J.; Maier, H.R.; Dandy, G.C.; Gayani Fernando, T.M.K. Non-linear variable selection for artificial neural networks using partial mutual information. Environ. Model. Softw. 2008, 23, 1312–1326. [Google Scholar] [CrossRef]
  46. Sharma, A. Seasonal to internannual rainfall probabilistic forecasts for improved water supply management: Part 1-A strategy for system predictor identification. J. Hydrol. 2000, 239, 232–239. [Google Scholar] [CrossRef]
  47. Sharma, A. Seasonal to interannual rainfall probabilistic forecasts for improved water supply management: Part 3-A nonparametric probabilistic forecast model. J. Hydrol. 2000, 239, 249–258. [Google Scholar] [CrossRef]
  48. Li, C.; Cheng, X.; Li, N.; Du, X.; Yu, Q.; Kan, G. A framework for flood risk analysis and benefit assessment of flood control measures in urban areas. Int. J. Environ. Res. Public Health 2016, 13, 787. [Google Scholar] [CrossRef] [PubMed]
  49. Li, H.; He, X.; Ren, M.; Zhang, Z.; Jiang, X.; Kan, G.; Wang, F. Study of Daqiao reservoir operation scheme during flood period based on short-term rainfall forecasting. In Proceedings of the 6th Symposium on Flood and Draught Defense Information Technology and Flash Flood Disaster Warning New Technology Application; (In Chinese). Available online: https://www.researchgate.net/publication/306357292_Study_of_Daqiao_reservior_operation_scheme_during_flood_period_based_on_short-term_rainfall_forecasting (accessed on 18 September 2017).
Figure 1. Map of the nine study watersheds. (A) Chengcun; (B) Chuxian; (C) Tunxi; (D) Yingge; (E) Maduwang; (F) Dongwan; (G) Xinghe; (H) Zaoyuan; (I) Zhidan.
Water 09 00719 g001
Figure 2. Scatter plot between rainfall and runoff.
Water 09 00719 g002
Figure 3. Scatter plot between rainfall and peak flow.
Water 09 00719 g003
Figure 4. Scatter plot between runoff coefficient and peak flow.
Water 09 00719 g004
Figure 5. Scatter plot between runoff coefficient and peak flow (exclude runoff coefficient larger than 1).
Water 09 00719 g005
Figure 6. Boxplots of total volume relative error; (A) humid regions; (B) semi-humid semi-arid regions; (C) arid regions.
Water 09 00719 g006
Figure 7. Boxplots of peak flow relative error; (A) humid regions; (B) semi-humid semi-arid regions; (C) arid regions.
Water 09 00719 g007
Figure 8. Boxplots of peak flooding time error; (A) humid regions; (B) semi-humid semi-arid regions; (C) arid regions.
Water 09 00719 g008aWater 09 00719 g008b
Figure 9. Boxplots of NSCE; (A) humid regions; (B) semi-humid semi-arid regions; (C) arid regions.
Water 09 00719 g009aWater 09 00719 g009b
Figure 10. Scatter plots of observed and simulated discharges for humid regions; (A) Chengcun; (B) Tunxi; (C) Chuxian.
Water 09 00719 g010
Figure 11. Scatter plots of observed and simulated discharges for semi-humid semi-arid regions; (A) Dongwan; (B) Maduwang; (C) Yingge.
Water 09 00719 g011
Figure 12. Scatter plots of observed and simulated discharges for arid regions; (A) Zhidan; (B) Zaoyuan; (C) Xinghe.
Water 09 00719 g012
Figure 13. Typical measured hydrographs of the 9 study watersheds. (A) Typical hydrographs of humid watersheds such as Chengcun, Chuxian, and Tunxi; (B) Typical hydrographs of semi-humid semi-arid watersheds such as Yingge, Maduwang, and Dongwan; (C) Typical hydrographs of arid watersheds such as Xinghe, Zaoyuan, and Zhidan.
Water 09 00719 g013
Table 1. Characteristics of the nine study watersheds.
Watershed TypeWatershed NameArea (km2)Number of Sub-Basins (Rainfall Stations)Annual Mean Rainfall (mm)Annual Mean Runoff (mm)Annual Mean Runoff Coefficient
HumidChengcun2901016005910.37
Chuxian579410473520.34
Tunxi2696.71118009000.5
Semi-humid semi-aridYingge53927142480.35
Maduwang1601106311910.3
Dongwan285687002120.3
AridXinghe4743500960.19
Zaoyuan7164635710.11
Zhidan7735510420.08
Table 2. Selected input variables and MI of the 9 studied watersheds.
Watershed TypeWatershedSelected Input VariablesMI
HumidChengcunP(t-4), P(t-7), P(t-9), P(t-10), P(t-12), P(t-15), P(t-18), P(t-21), P(t-23)0.7378
TunxiP(t-6), P(t-9), P(t-10), P(t-13), P(t-17), P(t-18), P(t-20), P(t-21), P(t-22), P(t-23)0.4794
ChuxianP(t-8), P(t-12), P(t-15), P(t-17), P(t-18), P(t-20), P(t-21), P(t-22), P(t-23)0.3186
Semi-humid semi-aridDongwanP(t-9), P(t-10), P(t-13), P(t-14), P(t-15), P(t-18), P(t-23)0.4536
MaduwangP(t-9), P(t-15), P(t-19), P(t-22), P(t-15)0.5287
YinggeP(t), P(t-3), P(t-6), P(t-9), P(t-12), P(t-15), P(t-23)0.8971
AridZhidanP(t), P(t-1), P(t-2), P(t-3), P(t-8)0.5573
ZaoyuanP(t-12)4.9642
XingheP(t), P(t-1), P(t-2), P(t-3), P(t-4), P(t-6)0.8057

