Land–Atmosphere Exchange of Water and Heat in the Arid Mountainous Grasslands of Central Asia during the Growing Season

1
State Key Laboratory of Desert and Oasis Ecology, Xinjiang Institute of Ecology and Geography, Chinese Academy of Sciences, Urumqi 830011, China
2
University of the Chinese Academy of Sciences, Beijing 100049, China
*
Author to whom correspondence should be addressed.
Water 2017, 9(10), 727; https://doi.org/10.3390/w9100727
Submission received: 1 August 2017
/
Revised: 5 September 2017
/
Accepted: 18 September 2017
/
Published: 28 September 2017
Abstract
:Arid grassland ecosystems are widely distributed across Central Asia. However, there is a lack of research and observations of the land–atmosphere exchange of water and heat in the arid grasslands in this region, particularly over complex surfaces. In this study, systematic observations were conducted from 2013 to 2015 using an HL20 Bowen ratio and TDR300 and WatchDog1400 systems to determine the characteristics of these processes during the growing season (April–October) of the arid mountainous grasslands of this region. (1) The latent heat flux (Le) was lower than the sensible heat flux (He) overall, and a small transient decrease in Le was observed before its daytime maximum; daily comparative variations in both fluxes were closely related to vegetation growth. (2) Evapotranspiration (ET) showed substantial variation across different years, seasons and months, and monthly variations in ET were closely related to vegetation growth. Water condensation (Q) was low and relatively stable. Relatively high levels of soil water were measured in spring followed by a decreasing trend. The land–atmosphere exchange of water and heat during the growing season in this region was closely associated with phenology, available precipitation and terrain. This study provides data support for the scientific management of arid mountainous grasslands.
1. Introduction
Water and heat are the major natural resources in terrestrial ecosystems [1,2,3], and their interactions are highly relevant to net primary productivity [4,5,6]. A clear understanding of the characteristics of the land–atmosphere exchange of water and heat in ecosystems forms the scientific basis for the rational development and utilization of natural resources [7,8,9]. Solar radiation is Earth’s main source of energy as well as the basic driving force of physical and biological processes on its surface, and when solar radiation reaches the land surface through the atmosphere, the energy is redistributed in multiple ways. The net radiation received by the land surface is mainly transferred via moisture and heat to the atmosphere in the form of latent and sensible heat, whereas another portion is transduced into the soil or stored in the plant canopy [10,11]. Radiant energy is influenced by different geographic features and other factors, and the amount of this energy received by different terrestrial ecosystems varies [12]. Different underlying surfaces (vegetation and soil conditions) influence the land–atmosphere exchange of water and heat in different ways, resulting in variations in net primary productivity [13,14].
Arid mountainous grassland ecosystems are widely distributed across Central Asia, and they play a major role in livestock production and regional ecological balances [15]. In addition, these ecosystems are ecologically fragile and highly sensitive to climate change [16]. In these ecosystems, the available precipitation is low, but the amount of solar radiation is high.
Additionally, the potential evaporation is much higher than the actual evaporation, which may result in different land–atmosphere water and heat exchange characteristics compared to those of humid regions. Furthermore, due to the influence of terrain, the characteristics of this exchange in arid mountainous grassland ecosystems may vary from those in arid plain grassland ecosystems [17]. Therefore, research is required to clarify the characteristics of the land–atmosphere exchange of water and heat in the arid mountainous grassland ecosystems in Central Asia. Moreover, the socio-economic development of the arid regions of Central Asia has been inhibited because of the limited ecological and environmental data. Water-heat observation sites are sporadically distributed across arid grasslands in Central Asia, and such data for the arid mountainous grassland ecosystems in this region are limited [18], which is detrimental to the improvement of the ecological environment as well as the rational use of natural resources.
Methods for studying the land–atmosphere exchange of water and heat include experimental observations, remote sensing estimations and model simulations [19,20,21]. Remote sensing and modeling methods allow for the characteristics of the land–atmosphere exchange of water and heat to be studied over large regions, but the results are often highly uncertain due to defects in computational methods and difficulty in determining initial parameter values [22,23]. In particular, there is a serious shortage of observational water and heat data for the arid mountainous grassland ecosystems in Central Asia, making it impossible to fully verify the findings obtained from remote sensing and modeling. However, experimental observations can provide reliable water and heat data and can represent the most accurate methodological approach [19,24].
Using the observational energy and water data from 2013 to 2015, the objectives of this study are to analyze and clarify the characteristics of the land–atmosphere exchange of (1) energy (heat) and (2) water of the arid mountainous grassland ecosystems in Central Asia during the growing season.
2. Study Materials and Methods
2.1. Study Area
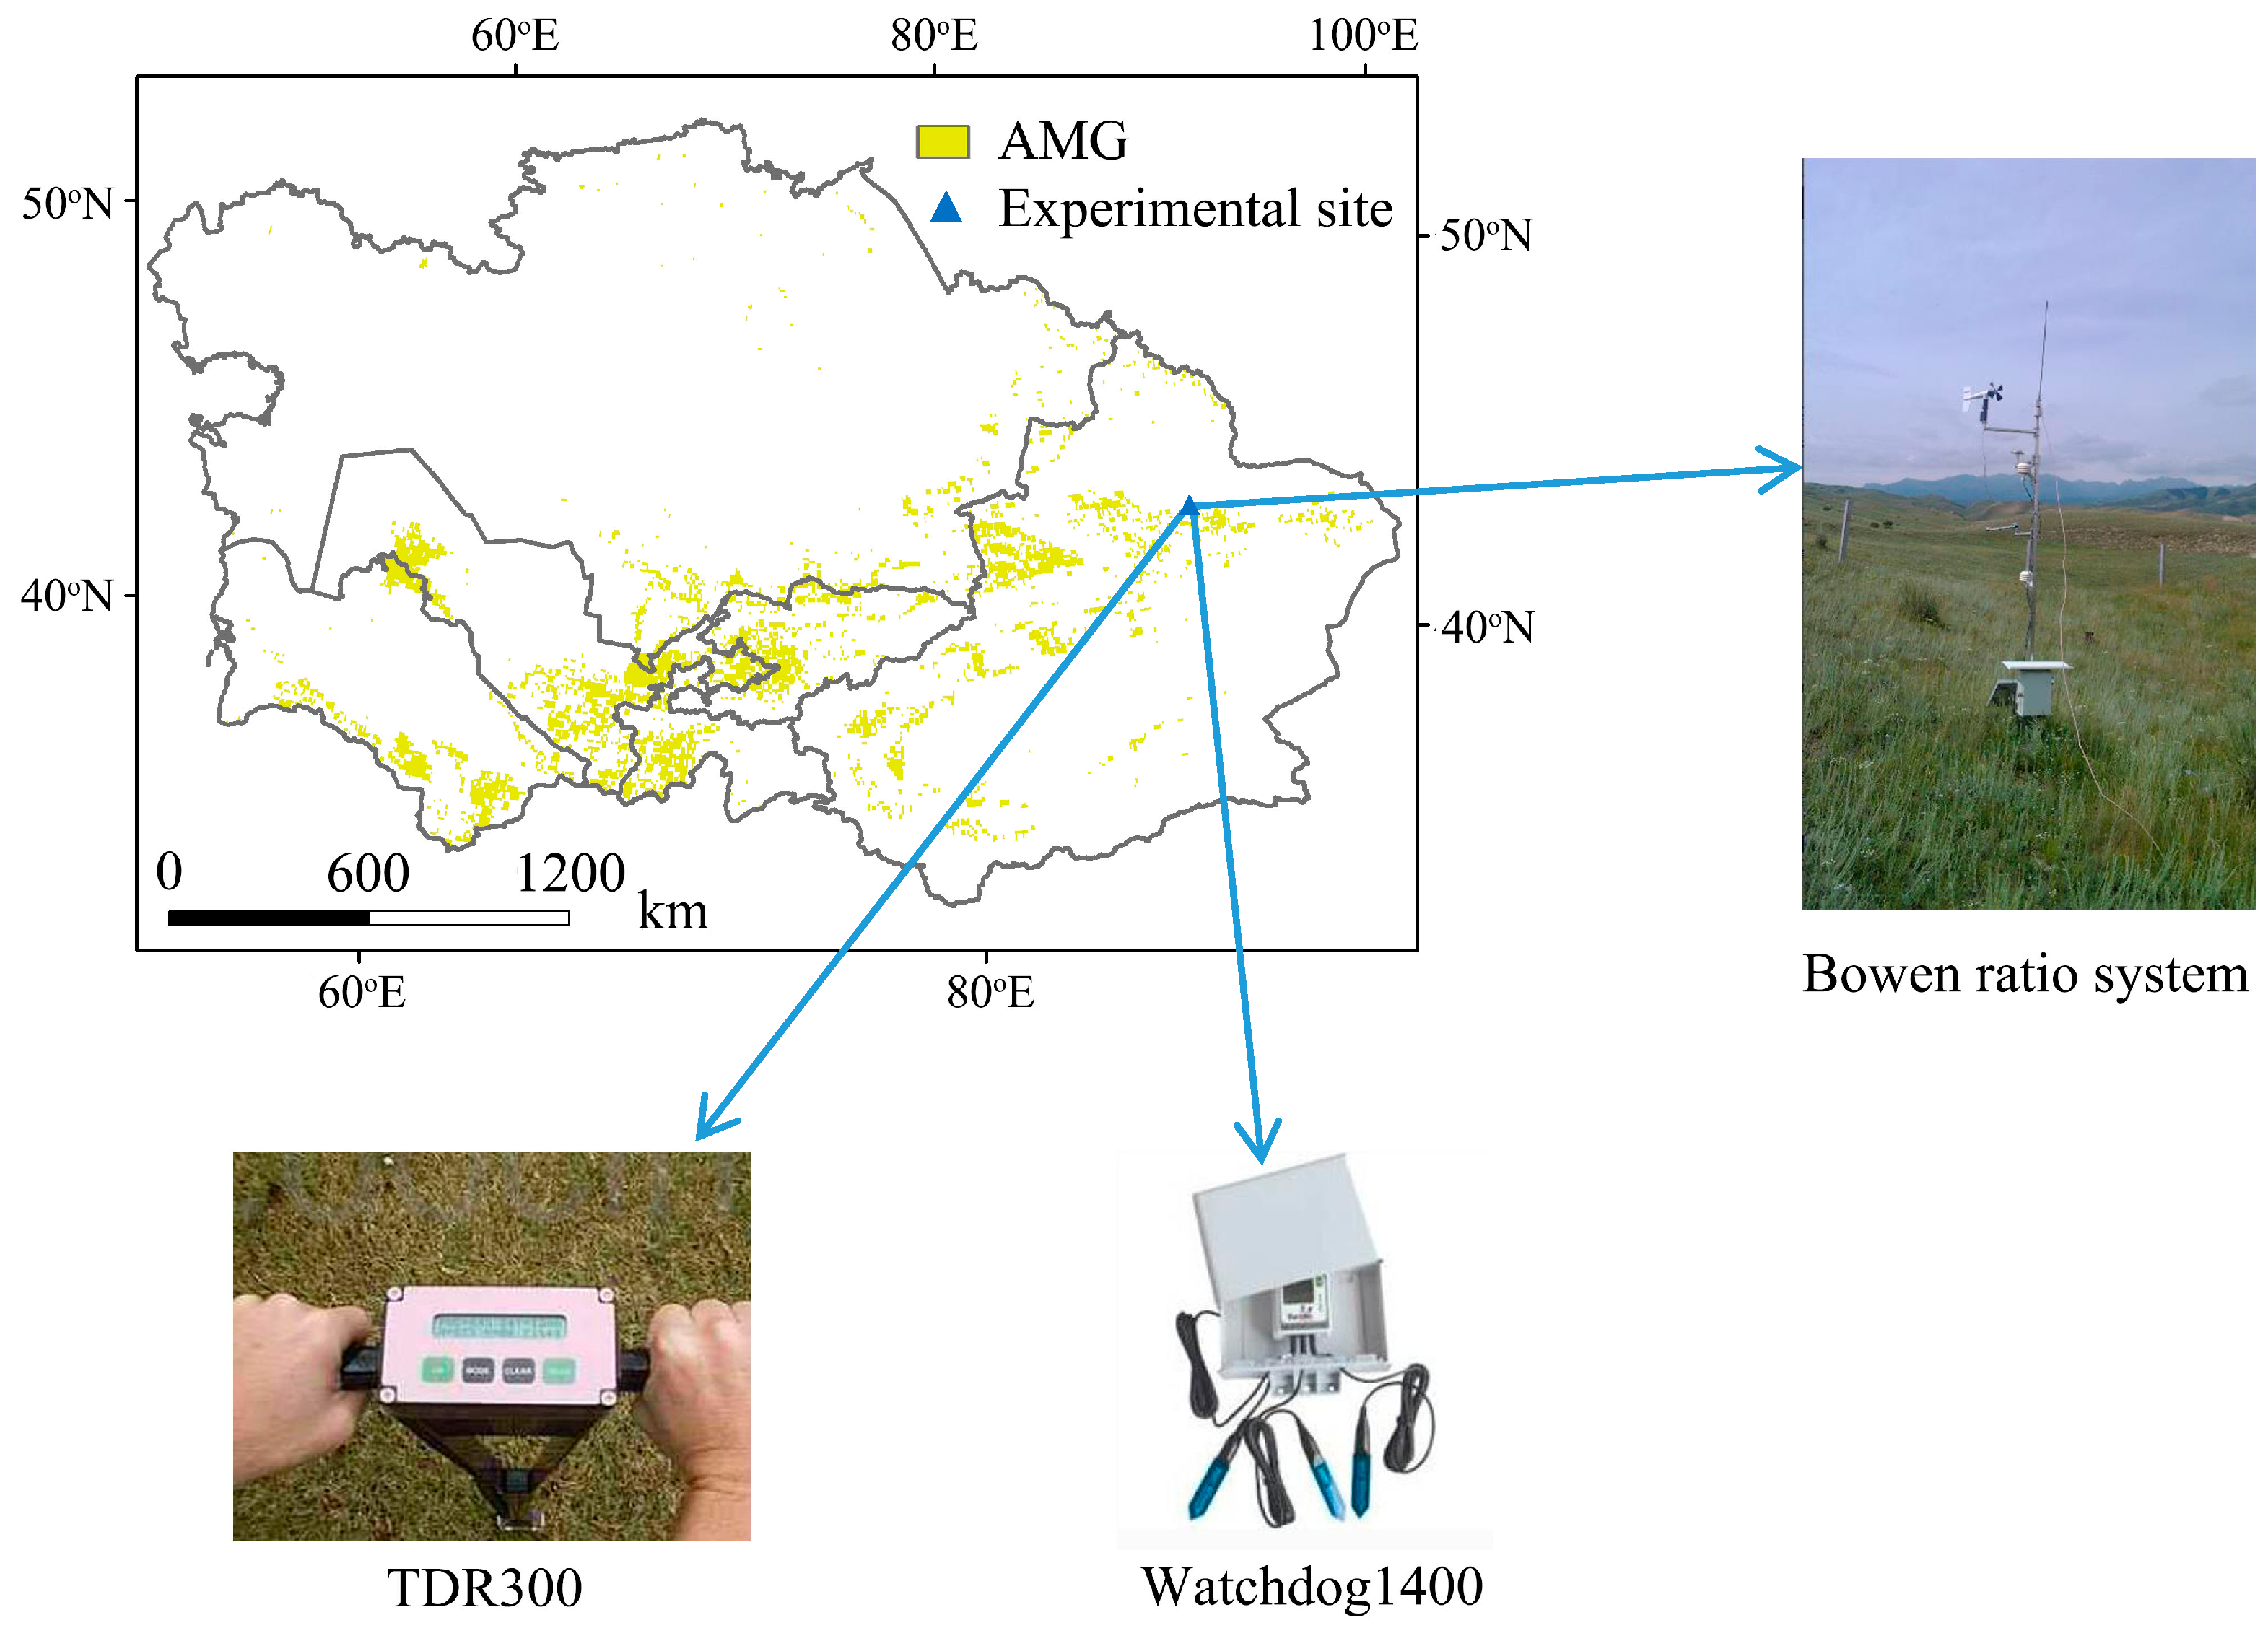
The experimental site (43°33′0.4″ N, 87°11′32.8″ E, elevation 1648 m), which is representative of a typical arid mountainous grassland ecosystem in Central Asia, is located in the northern Tianshan Mountains, Urumqi, Xinjiang, China. Mountain–valley winds occur in this region, and the mean wind speed measured during the vegetation growth period from 2013 to 2015 was approximately 2.1 m·s−1. Precipitation is mainly concentrated in the spring and summer with large interannual variations. The mean summer (June–August) temperature from 2013 to 2015 was approximately 18.2 °C, and drastic temperature variations occurred in spring and autumn. The topography is relatively consistent within a 1000-m radius of the observation site; the terrain is relatively flat; typical chestnut soil occurs with silt as the main component of the soil particles; grass roots are mainly distributed at depths of 0–40 cm, particularly at 0–15 cm; and vegetation growth is uniform within 200 m of the observation site. The time of maximum increase of biomass is between May and July. Most of the grass began to wilt or enter dormancy in August. Subsequently, some of the grass regrew between September and October [25] (Figure 1).
2.2. Data
The collected data included energy, meteorological parameters and soil moisture. In 2013, an HL20 Bowen ratio system was installed in the Urumqi section of the arid mountainous grasslands in the northern Tianshan Mountains; this is a typical arid mountainous grassland in Central Asia [26]. Synchronous energy and meteorological observation data with a 1-h time step were acquired over the vegetation growth period (April–October) of this region for the years 2013–2015. Bowen ratio measurements are widely used to acquire multiple reliable energy and meteorological parameters [19,27,28], and high accuracy is ensured upon assuming an open, uniform underlying surface and a relatively low wind speed [29]. In addition, soil volumetric water content (VWC) data were collected using TDR300 and WatchDog1400 systems, which are high-precision instruments for measuring soil water content [30,31]. The data collected in this study provide a reliable foundation for analyzing the characteristics of the land–atmosphere exchange of water and heat in the arid mountainous grassland ecosystems in Central Asia.
The energy and meteorological data with a 1-h time step were derived from the HL20 Bowen ratio system (Jauntering International Corporation, Xinbei, Taiwan) installed at the observation site, which was set to record at the following four measuring heights: 1.2 m and 2.2 m above the ground, ground level and 2.5 cm belowground. The measured parameters included the net radiation, wind speed, wind direction, soil heat flux (Gn) at a depth of 2.5 cm, temperature and humidity at two different heights (1.2 m and 2.2 m) and precipitation reaching the land surface. Based on these observations, the Bowen ratio, sensible heat flux (He) and latent heat flux (Le) were synchronously calculated for the period from April to October (a complete vegetation growth period) from 2013 to 2015.
The soil VWC was measured at depths of 0–10 cm, 10–20 cm, 20–30 cm and 30–40 cm using a TDR300 (Jauntering International Corporation, Xinbei, Taiwan). The measurements were performed on 15 May, 11 June, 1 July, 6 August and 3 October of the years 2013–2015, and the soil VWC on these days typically represented the soil VWC in different vegetation growth stages. Soil VWC was continuously measured at depths of 0–10 cm and 30–40 cm in 2014 using a WatchDog1400 (Jauntering International Corporation, Xinbei, Taiwan). The observation period covered the entire growing season.
2.3. Methods
According to the law of conservation of energy, the net radiation (Rn) that reaches plant populations can be expressed as follows [32]:
where He is the sensible heat flux (W·m−2); Le is the latent heat flux (W·m−2); Gn is the soil heat flux (W·m−2); J is the change in stored energy (W·m−2); μA is the energy conversion by photosynthesis (W·m−2); and D is energy removal (mainly in the horizontal direction) (W·m−2). In this equation, μA is extremely low and therefore negligible, and under normal circumstances, J is also negligible. Additionally, D is difficult to estimate and is low in the case of low wind speed, so it is often ignored [33,34].
The Bowen ratio method is based on the energy balance principle and the gradient diffusion equation, and it divides the energy received by the underlying surface into He and Le using the ratio of the temperature gradient to the moisture gradient. The ground-surface heat balance equation can be derived from Equation (1) [35,36], as follows:
The actual evapotranspiration (ET) per hour was calculated as follows [35]:
where ET is evapotranspiration (mm); λ is the latent heat of vaporization (J·kg−1); and B is the Bowen ratio.
ET refers to the conversion of water from a liquid to a gaseous state, and when the calculated ET is positive, it indicates the volume of water converted from a liquid to a gaseous state, which is known as the actual ET. When the calculated ET is negative, it represents the volume of water converted from a gaseous to a liquid state and thus no longer represents the actual ET but rather condensation (Q).
When the Bowen ratio is close to −1, even small errors can result in large deviations or meaningless outliers in the calculated Le, He and ET values, which are often observed at sunrise or sunset and must be properly corrected. In this study, an interpolation was used to process the calculated results obtained with B values close to −1, which further ensured the validity of the data [19,29].
To determine the overall diurnal variations in energy partitioning, we calculated the arithmetic means of Rn, Le and Gn at the same time with a 1-h time step for each day of each month during the growing season.
The main source of water for the arid mountainous grasslands is precipitation followed by Q; the water output includes ET and runoff. The water balance equation is expressed as follows [37,38]:
where P is the precipitation (mm); Q is the condensation (mm); F is the runoff (mm); and ΔS is the change in soil water content.
To better compare total VWC values, the soil VWC at depths of 0–10 cm, 10–20 cm, 20–30 cm and 30–40 cm was averaged to obtain the mean VWC at a depth of 0–40 cm.
3. Results
3.1. Energy Partitioning in the Growing Season
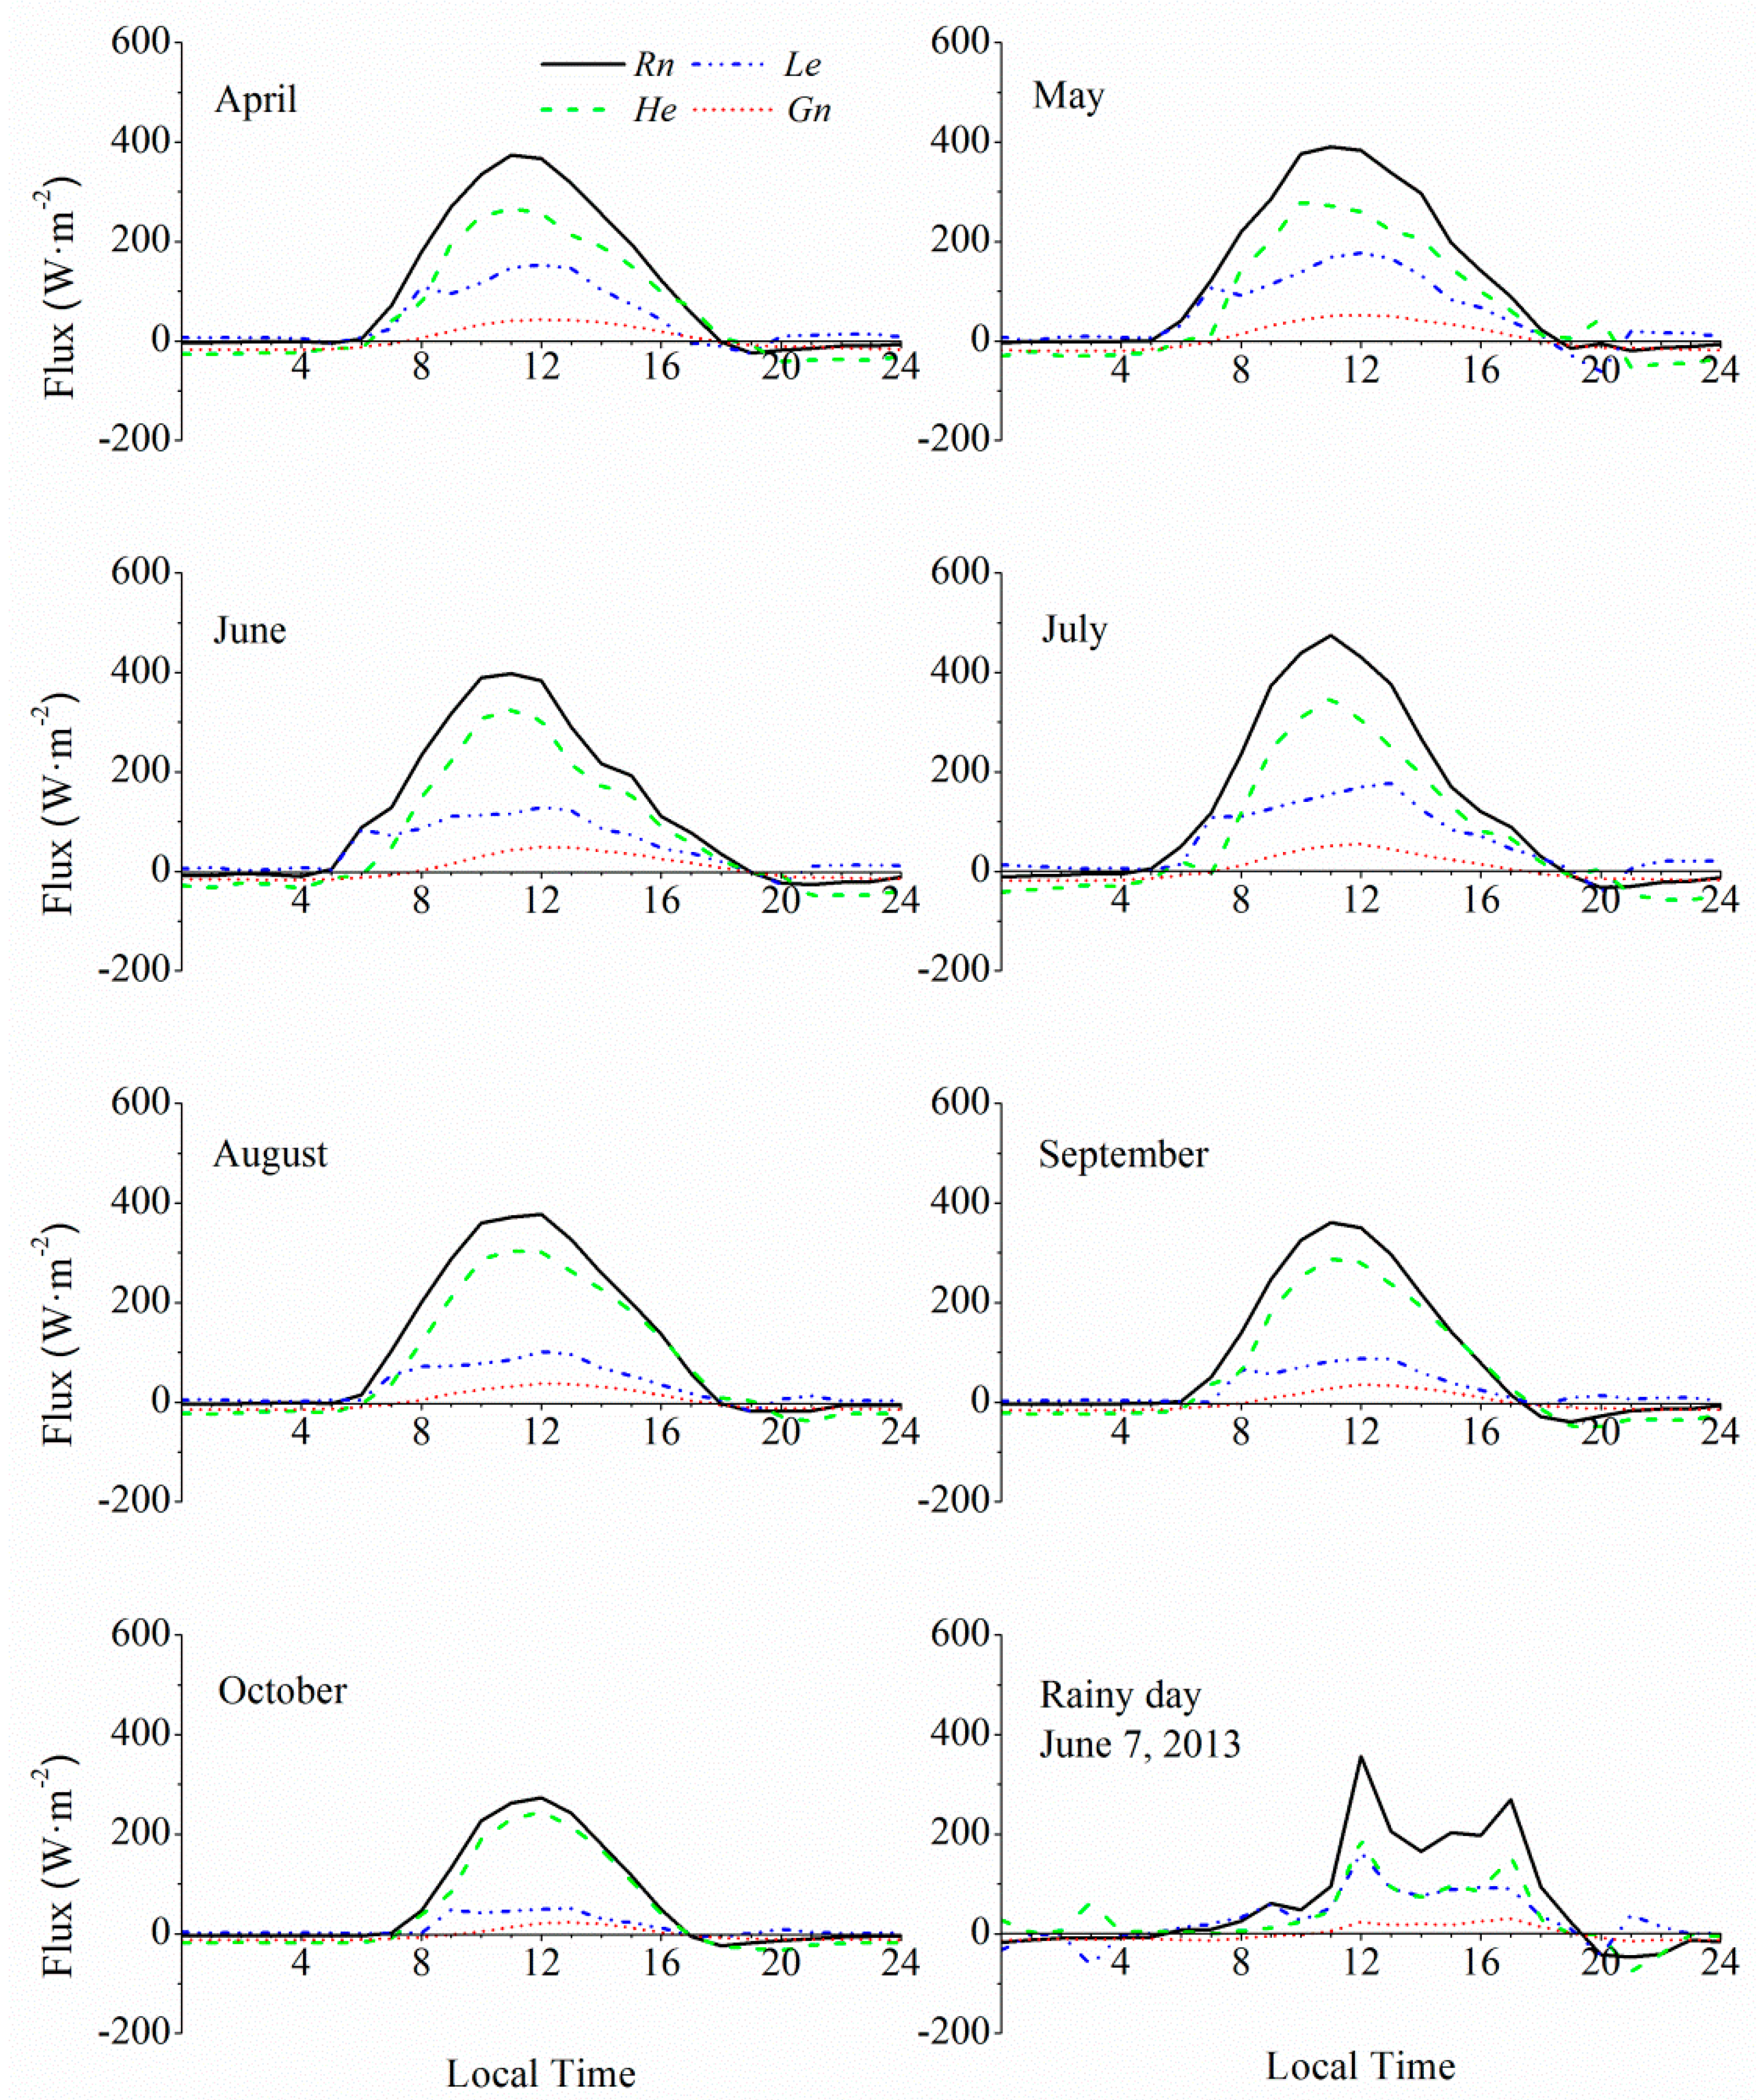
Figure 2 illustrates the mean diurnal variations in the Rn and its components in every month of the growing season in the arid mountainous grassland ecosystem; the night-time Rn was negative due to longwave ground radiation. Before sunrise, the Le, He and Gn were relatively low, showing stable variations, and both the He and Gn values were mainly negative before sunrise. The negative He indicated that there was heat transfer from the atmosphere to the ground, whereas the negative Gn indicated that there was heat transfer from belowground to the ground level. After sunrise, the Le, He and Gn increased with increasing Rn, which showed unimodal changes and reached its maximum at local noon. Overall, the He was higher than the Le in the growing season, which is consistent with a certain degree of water stress in an arid grassland, and the Le showed a small transient decrease before reaching its daytime maximum. From April to August, the Le was higher than the He for a certain time interval in the morning, whereas most of the energy was used to heat the atmosphere at noon.
Because sunny days predominated during the vegetation growth cycle in the study area, mean diurnal variations in the energy components during each month did not reflect the occurrence of rainy days. However, the partitioning of the Rn on 7 June 2013, which experienced 4.2 mm of rainfall, reflects the diurnal variation on rainy days. The Rn fluctuated more widely on rainy days than on sunny days, and the Le, He and Gn showed generally consistent trends compared with the Rn.
Overall, the Le and the He fluctuated more widely than the Gn and accounted for most of the Rn; the Gn accounted for a low proportion of the Rn.
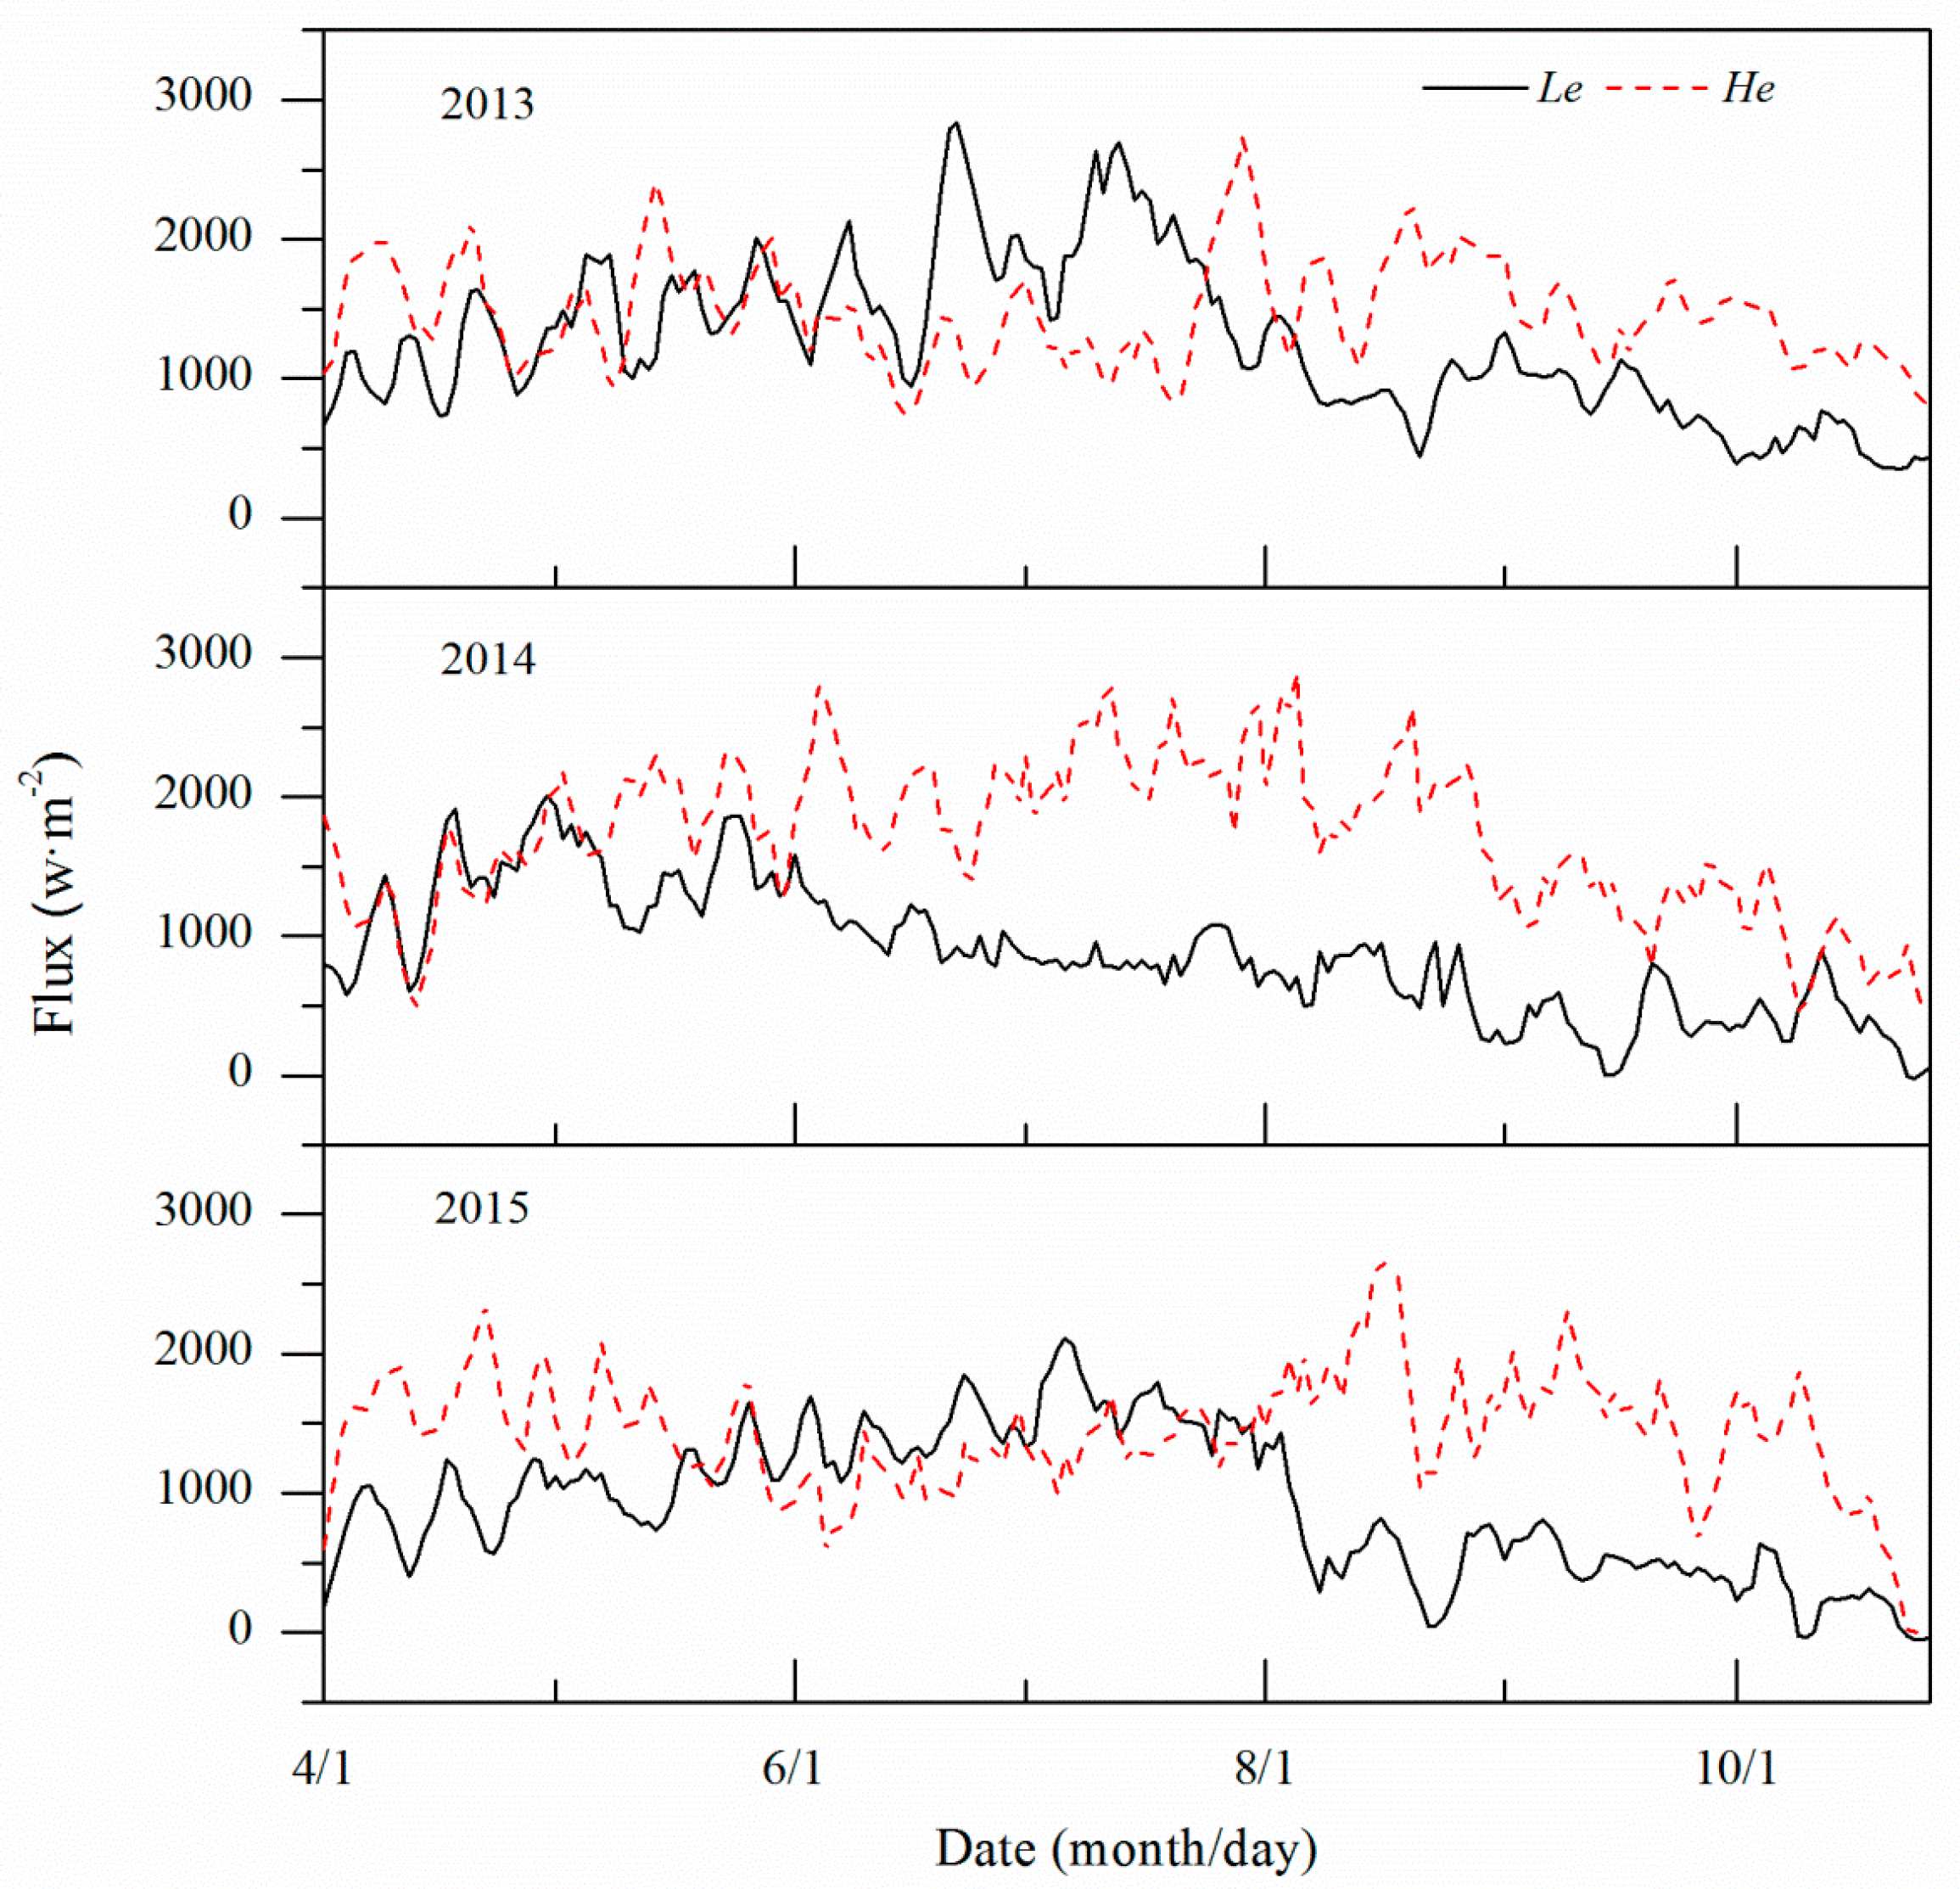
Figure 3 compares the time series of the Le and He from April to October for 2013–2015 and shows the 5-days moving average. In April 2013, although snowmelt water resulted in relatively high soil moisture [39], the Le remained lower than the He. The Le and He values were similar from the beginning of May to mid-June. The Le was higher than the He in late June to July but was lower than the He after August. Because of the decreasing solar radiation, both the Le and He showed an overall decreasing trend after August. Similar variations were observed in the comparison of the Le and He series from April to October 2015 with the values from 2013. Specifically, the Le was lower than the He from April to mid-May, whereas the Le and He values were roughly equivalent in mid–late May. The Le was higher than the He at the end of May and lower than the He with an overall decreasing trend after August. Overall, the Le was higher than the He from June to July, suggesting high ET in this period, and this result is consistent with the vigorous vegetative growth during this period, which was associated with relatively high transpiration [40,41]. Different results were obtained for the Le and He series from April to October in 2014 compared with the values from 2013 and 2015; the Le was lower than the He in June and July 2014, indicating relatively low ET in this period. This is consistent with the low precipitation, severe drought and poor vegetation growth in 2014 (Table 1), during which the ET in the normally vigorous growing season was relatively low [40,41].
3.2. Land–Atmosphere Water Exchange in the Growing Season
Despite its low values, Q is an important water resource in the arid mountainous grasslands because it can provide water to plants and help overcome drought stress [42,43]; Q formed almost every day in the growing season from 2013 to 2015. In 2013, the total Q from April to October was 37.8 mm, i.e., 9.7% of the P over the same period, and the mean daily Q was approximately 0.177 mm. In 2014, the total Q from April to October was 38.4 mm, i.e., 18.4% of the P over the same period, and the mean daily Q was approximately 0.179 mm. In 2015, the total Q from April to October was 67.7 mm, i.e., 16.8% of the P over the same period, and the mean daily Q was approximately 0.316 mm. Compared with P, the formation of Q water was relatively stable, although significant variations were observed in different years, seasons and months (Table 1).
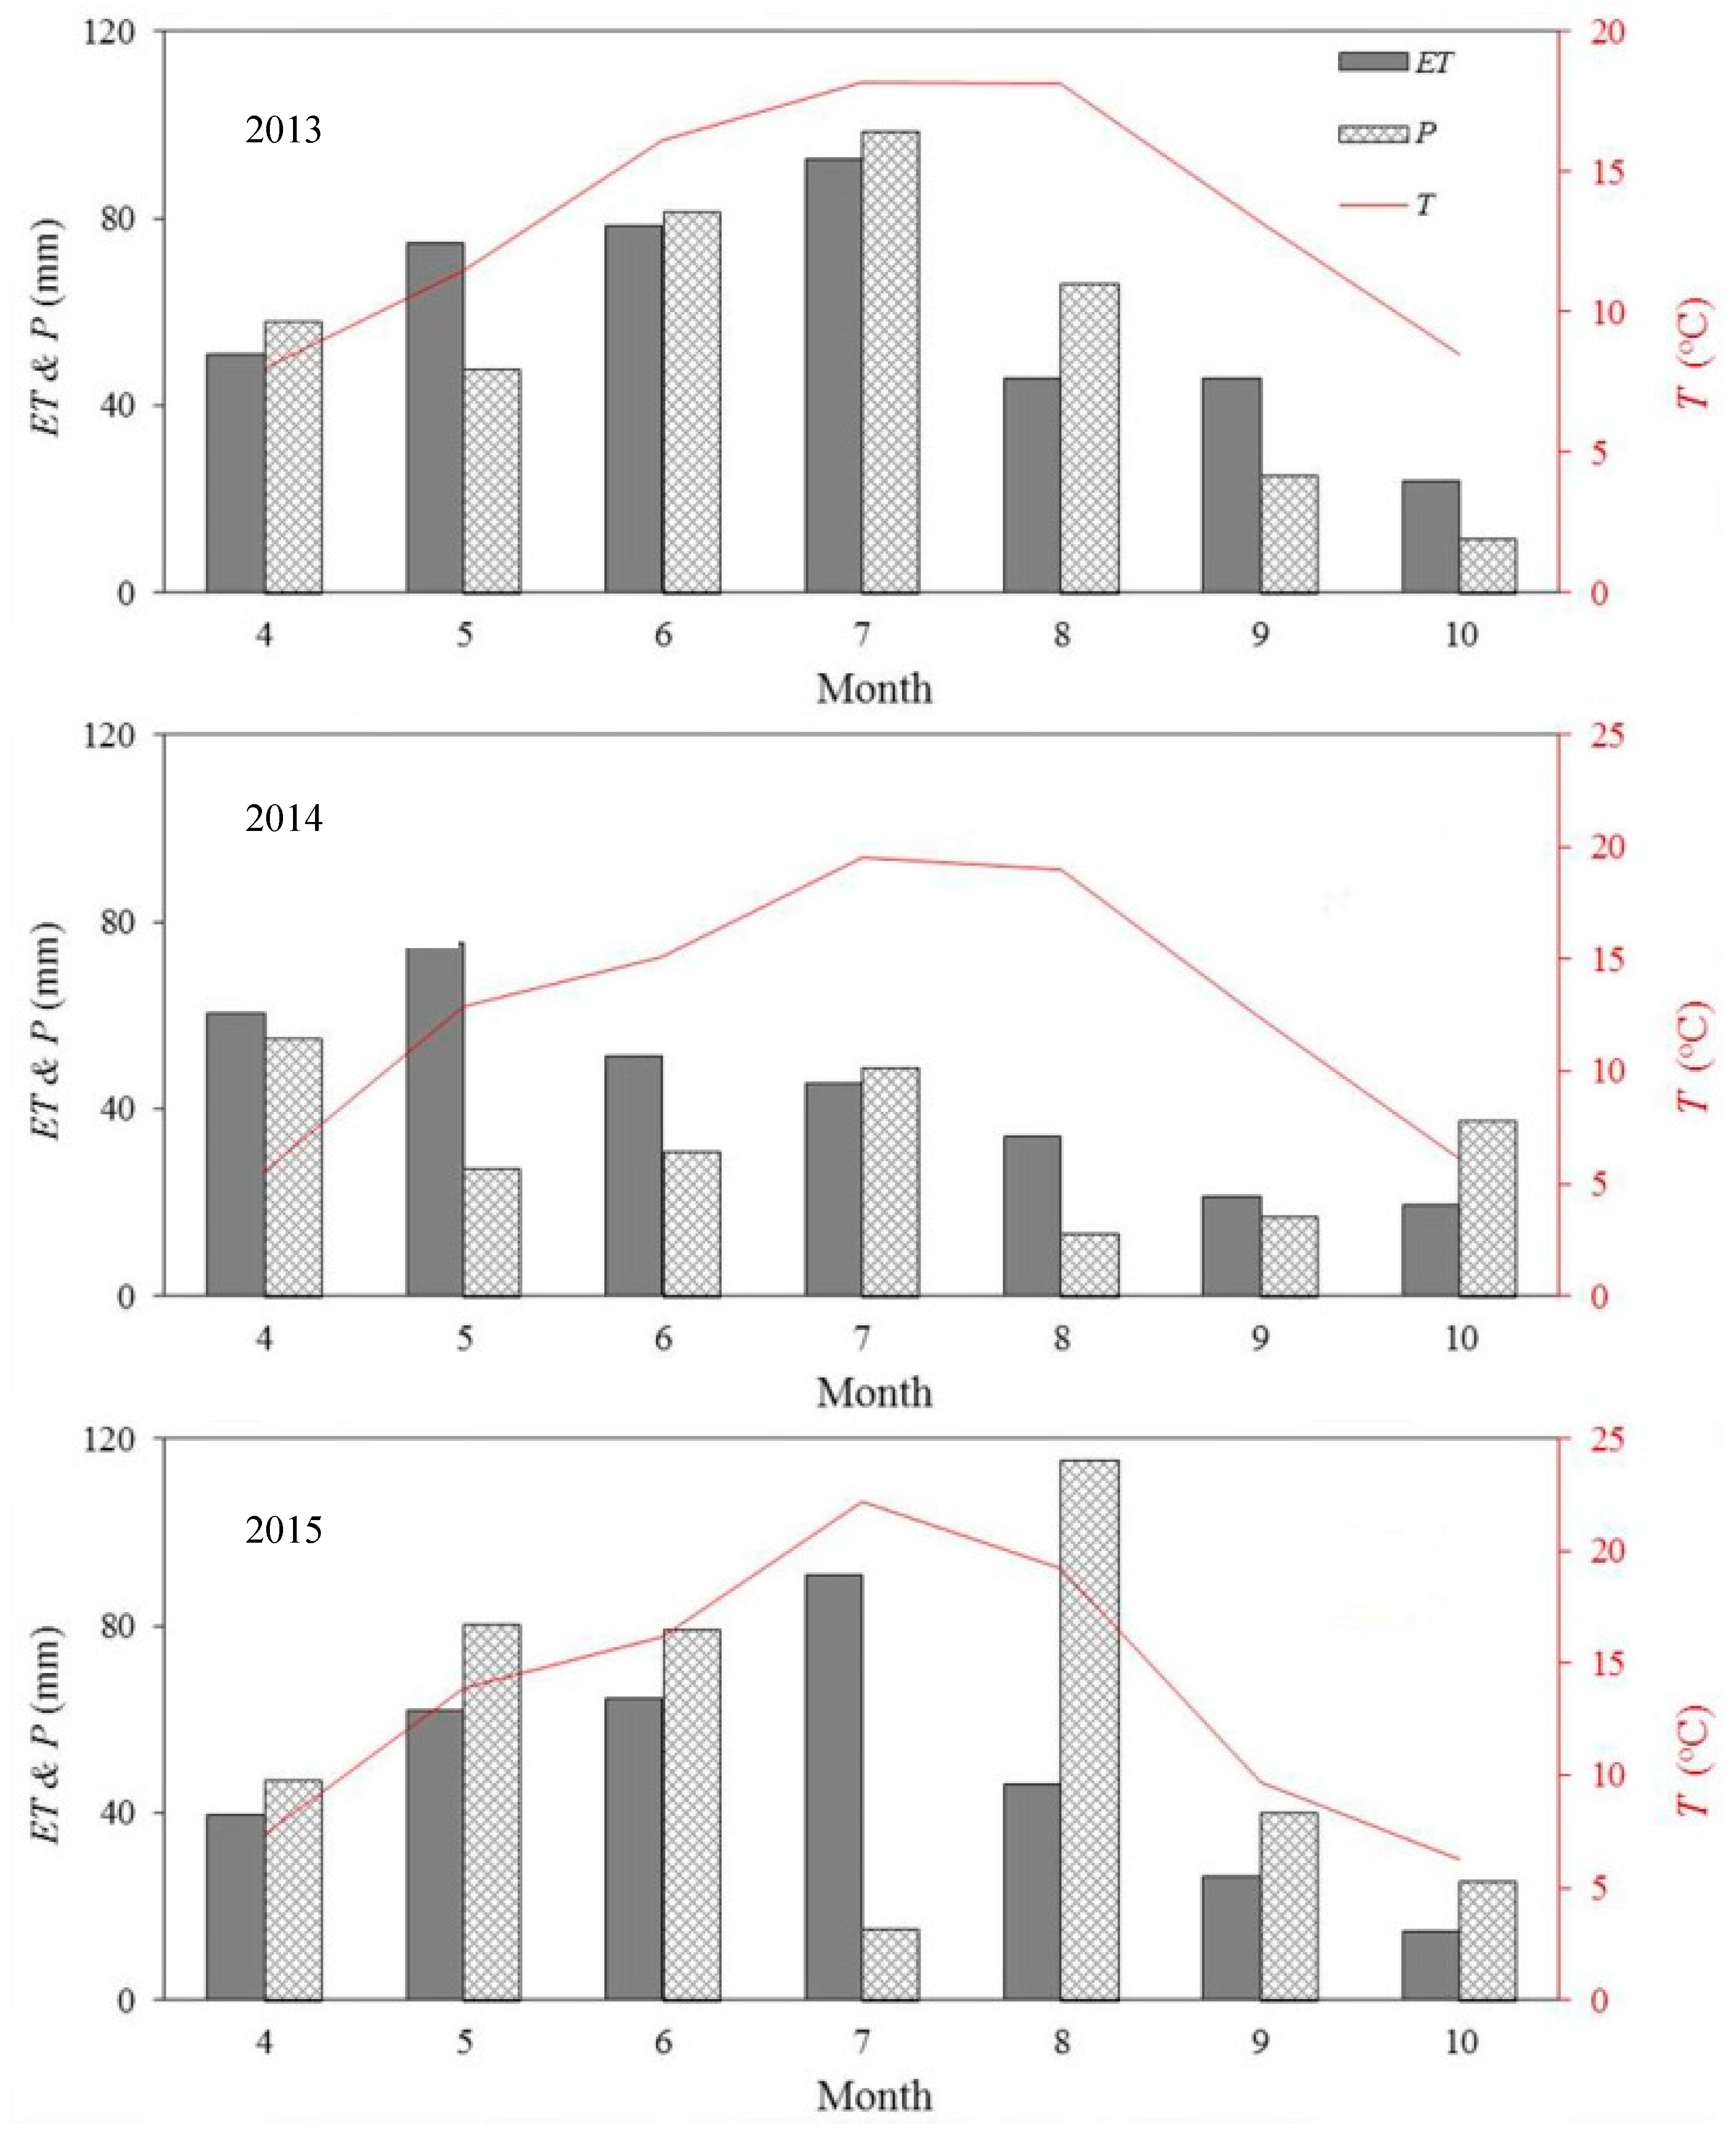
The mean ET was 353.2 mm in the growing season from 2013 to 2015, and it exhibited large interannual variations due to the influence of P and other factors. In 2013, the ET during the growing season was 412.2 mm, while the P over the same period was 388.4 mm. Thus, the ET was slightly higher than the P, mainly due to the Q water being 9.7% of the P (Table 1). Q is the reverse process of ET, so both Q and P influence ET. In 2014, the ET in the growing season was 302.9 mm, and the P over the same period was 212.8 mm. Therefore, the ET was higher than the P (Figure 4), which was primarily due to the soil water and Q, as there was a severe drought in 2014 that resulted in a soil water deficit (Figure 5a and Table 1). In 2015, the ET in the growing season was 344.4 mm, while the P over the same period was 402.8 mm; thus, the ET was lower than the P, which was mainly caused by runoff and the storage of water in the soil [39,44]. The grassland ET exhibited significant variations among the different seasons; overall, the ET was relatively low in the autumn months, whereas high values were observed in the spring and summer. However, the monthly variations in the ET were not entirely consistent with the variations in temperature. In August, the air temperature was relatively high compared with the ET. Moreover, monthly variations of ET were not completely consistent with the variations in P. In 2013–2014, there was a large amount of snowmelt water in April, and the P was relatively high in this month compared with that in May. By contrast, the ET was markedly low in April compared with that in May. In 2015, the P was markedly low in July, whereas the ET was substantially higher in this month. However, the P was markedly high in August compared to the ET. This phenomenon regarding the role of temperature and P on ET was similar to some findings in previous studies [45,46]. Monthly variations in the ET were closely related to vegetation growth during the growing period in this region; in 2013 and 2015, the ET rapidly increased with vegetation growth from April to July and reached its maximum value in July. Most of the vegetation began to wilt or enter dormancy in August [40,41]; therefore, transpiration was reduced, rapidly decreasing ET. In 2014, significantly low P, severe drought and poor vegetation growth resulted in relatively low grassland ET during the normally vigorous growing season (Figure 4).
The soil VWC was relatively low during the drought stages of the 2013–2015 period (Figure 5a), and further comparisons of the VWC between the 0–10 cm (shallow root layer) and 30–40 cm (deep root layer) soil layers in the 2014 growing season revealed generally lower values at the shallow depth compared with the deeper soil depth. Moreover, the VWC at the shallow depth fluctuated considerably because of the influence of P. The soil VWC was relatively high in spring and then showed an overall decreasing trend (Figure 5b).
4. Discussion
4.1. Land–Atmosphere Heat Exchange
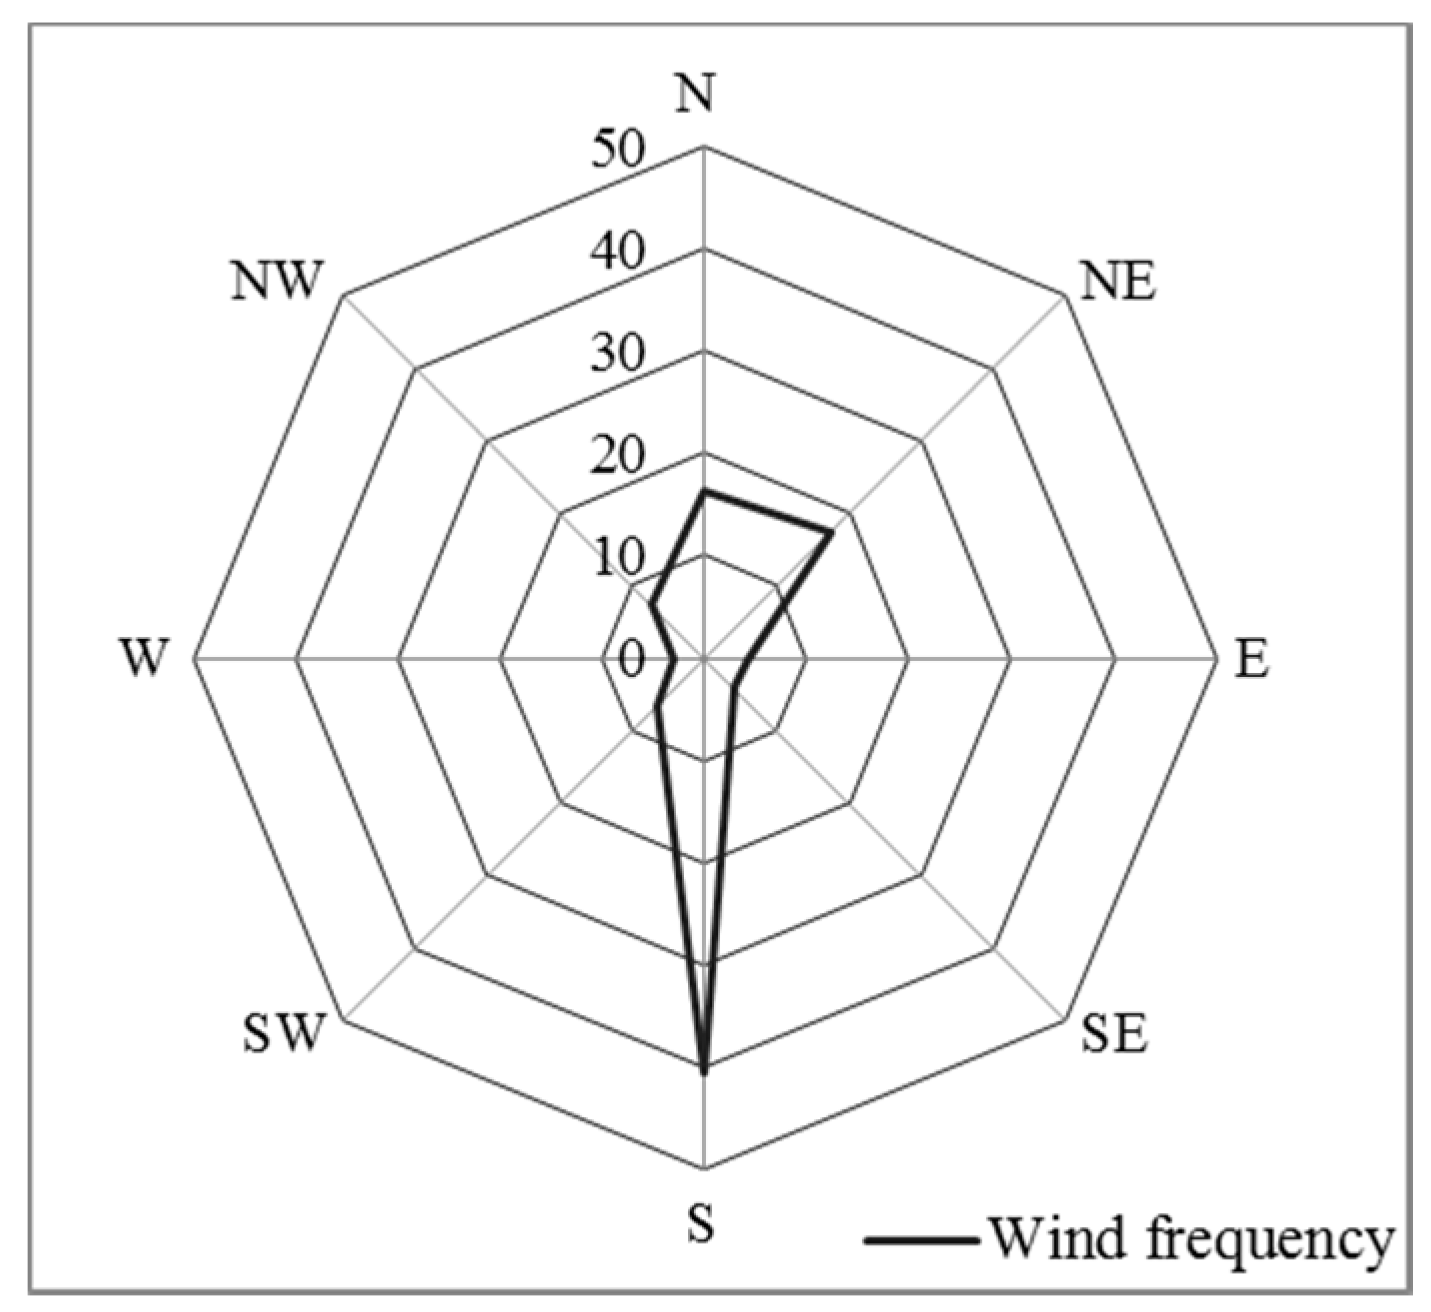
During the growing season, the Le was higher than the He within a certain morning time interval from April to August (Figure 2) because evaporation of condensation resulted in high Le [47,48,49], whereas the He increased significantly relative to the Le at noon due to strong turbulence. The Le showed a small transient decrease before the daytime maximum Le was reached, which may be attributable to the presence of local mountain–valley winds (Figure 6 and Table 2). Prior to the occurrence of the maximum Le, the wind direction changed from mountain to valley, and the valley winds moved up the mountain slope, facilitating water vapor Q and, to some extent, inhibiting the ET, which temporarily decreased the Le. According to the observations, the time when the mountain–valley winds changed each month was generally concentrated within the time interval when the Le showed a small transient decrease (Table 2), largely demonstrating that this decrease was caused by these winds. Daily variations in the Le and He during the growing season were associated with multiple factors and were closely related to vegetation growth, which was supported by a study in a Mediterranean coastal grassland [40]. In the year with good vegetation growth, high transpiration over the vigorous growing season often resulted in higher Le than He within a given time interval, but in the drought year with poor vegetation growth, transpiration was relatively low; therefore, the Le was unlikely to exceed the He.
4.2. Land–Atmosphere Water Exchange
The growing season ET was affected by various factors, and the monthly variations were closely related to vegetation growth. Vegetation growth of the arid mountainous grasslands in Central Asia is determined by phenology and available P; therefore, these factors are the major determinants of the monthly variations in the ET [25,50]. In drought years, soil water deficits often occur, whereas in wet years, more water is received from the growing season P and Q. The differences between the above-mentioned water inputs and the ET in wet years were primarily caused by the formation of runoff and the storage of water in the soil [39,44]. A comparison of the soil VWC for 2013–2015 (Figure 5a) also provided strong evidence that soil water played a regulatory role in ET. There were no significant differences in soil VWC between 2013 and 2015 (Figure 5a), and the P in the 2015 growing season was higher than that in 2013 (Table 1). However, the ET in the 2015 growing season was significantly lower than that in 2013, which was due to runoff. According to observations, the total P was high in 2015, and high-intensity P was relatively abundant, which increased the amount of runoff [39,44]. The soil VWC was relatively high in spring due to P infiltration, but the soil VWC showed an overall decreasing trend due to increased ET. Generally, soil VWC was lower at the shallow depth than the deeper depth because higher ET occurred at the shallow depth [51].
4.3. Comparison with Relevant Studies
Research has been conducted to clarify the dynamics of water and heat in the arid mountainous grasslands of Central Asia using remote sensing and modeling. However, the available research has mainly focused on one or two factors, such as ET and P, instead of a systematic analysis of multiple factors [52,53,54]. Furthermore, research based on remote sensing and modeling methods presents considerable uncertainties because of the lack of data validation in this region; consequently, experimental observations represent the most accurate methodological approach. Wang et al. [55] collected observational data using an Eddy-related system and studied the characteristics of water and carbon at a grassland station located at Lake Balkhash, Kazakhstan. However, the observation site, which is located between Lake Balkhash and the Kapchagay Reservoir, is strongly influenced by both the lake and the reservoir and does not represent a typical arid grassland ecosystem. Moreover, the observation point is not in a mountainous region. Yan et al. [56] acquired energy and meteorological data using a Bowen ratio system and then analyzed the summer ET, its relationships with environmental factors, and the energy distribution patterns in an Achnatherum splendens grassland in a plain desert region in Qitai, Xinjiang, China. However, only limited observational data were obtained for the period from 22 July to 2 September 2010, which severely constrains our understanding of the land–atmosphere exchange of water and heat in arid grasslands. In the current study, data were collected throughout the growing season from 2013 to 2015, and data on the energy, meteorological parameters and soil moisture were relatively abundant. Additionally, the study site lies in the arid mountainous grasslands in Urumqi, a typical arid grassland region in Central Asia. Based on these observed data, the characteristics of the land–atmosphere exchange of water and heat in the arid mountainous grasslands of Central Asia during the growing season was systemically analyzed and clarified. This study contributes to a better understanding of the characteristics of the land–atmosphere exchange of water and heat in arid mountainous grasslands in Central Asia and provides data support for the scientific management of arid grasslands.
It should be noted that arid mountainous grassland ecosystems and plain desert grassland ecosystems have different terrains; consequently, the land–atmosphere exchange of water and heat varies in these areas. In future studies, we intend to establish additional observation sites to measure the water and heat fluxes in both arid mountainous and plain desert grassland ecosystems and to acquire observational data over longer time series to provide sufficient data for further investigations of these important dynamics and also for validation of regional-scale modeling studies.
5. Conclusions
This study presents a systematic analysis of the characteristics of the land–atmosphere exchange of water and heat in the arid mountainous grassland ecosystems of Central Asia during the growing season (April–October) based on the principles of energy and water balance. The analysis was performed using energy and meteorological data from 2013 to 2015 with a 1-h time step, which were acquired using an HL20 Bowen ratio system, as well as soil VWC data, which were acquired using TDR300 and WatchDog1400 systems. During the vegetation growth period, the Le and He accounted for the majority of the Rn, but the He was generally higher than the Le in the growing season because there was a certain degree of water stress in the arid grassland. Daily comparative variations in the Le and He were tightly associated with vegetation growth, which was mainly determined by the phenology and available P of the region. Within a certain morning time interval, the Le was higher than the He because of the evaporation of Q water. Before the daytime maximum Le was reached, a transient decrease was observed, which might have been caused by the mountain–valley winds. The mean growing season ET was 353.2 mm for 2013–2015 and showed substantial variations in different years, seasons and months. Additionally, soil water and runoff both played a regulatory role in the ET, and monthly variations in the growing season ET were tightly associated with vegetation growth. The soil VWC was relatively high in spring followed by an overall decreasing trend. In the 2013, 2014 and 2015 growing seasons, the total Q accounted for 9.7%, 18.8% and 16.8% of the P, respectively, and the daily mean Q was 0.177 mm, 0.179 mm and 0.316 mm. The formation of Q water was relatively stable. This study provides data support for the scientific management of arid mountainous grasslands.
Acknowledgments
This work was financially supported by the international Partnership Program of the Chinese Academy of Science (Grant No. 131965KYSB20160004) and the National Natural Science Foundation of China (Grant No. 41271126, 41361140361). The authors declare no conflicts of interest.
Author Contributions
Geping Luo and Xiaotao Huang designed this study. Xiaotao Huang and Xinxin Wang collected the data. Xiaotao Huang processed the data. Xiaotao Huang wrote the manuscript. Xiaotao Huang and Geping Luo revised the manuscript.
Conflicts of Interest
The authors declare no conflicts of interest.
References
- Gusev, Y.M.; Nasonova, O.N. The simulation of heat and water exchange at the land-atmosphere interface for the boreal grassland by the land-surface model swap. Hydrol. Process. 2002, 16, 1893–1919. [Google Scholar] [CrossRef]
- Guo, D.L.; Yang, M.X.; Wang, H.J. Characteristics of land surface heat and water exchange under different soil freeze/thaw conditions over the central tibetan plateau. Hydrol. Process. 2011, 25, 2531–2541. [Google Scholar] [CrossRef]
- Ren, R.; Ma, J.; Cheng, Q.; Zheng, L.; Guo, X.; Sun, X. Modeling coupled water and heat transport in the root zone of winter wheat under non-isothermal conditions. Water 2017, 9. [Google Scholar] [CrossRef]
- Yan, H.M.; Zhan, J.Y.; Jiang, Q.O.; Yuan, Y.W.; Li, Z.H. Multilevel modeling of npp change and impacts of water resources in the lower heihe river basin. Phys. Chem. Earth 2015, 79–82, 29–39. [Google Scholar] [CrossRef]
- Vicente-Serrano, S.M.; Camarero, J.J.; Zabalza, J.; Sanguesa-Barreda, G.; Lopez-Moreno, J.I.; Tague, C.L. Evapotranspiration deficit controls net primary production and growth of silver fir: Implications for circum-mediterranean forests under forecasted warmer and drier conditions. Agric. For. Meteorol. 2015, 206, 45–54. [Google Scholar] [CrossRef]
- Fusi, M.; Cannicci, S.; Daffonchio, D.; Mostert, B.; Poertner, H.-O.; Giomi, F. The trade-off between heat tolerance and metabolic cost drives the bimodal life strategy at the air-water interface. Sci. Rep. 2016, 6, 19158. [Google Scholar] [CrossRef] [PubMed]
- Pielke, R.A.; Avissar, R.; Raupach, M.; Dolman, A.J.; Zeng, X.B.; Denning, A.S. Interactions between the atmosphere and terrestrial ecosystems: Influence on weather and climate. Glob. Chang. Biol. 1998, 4, 461–475. [Google Scholar] [CrossRef]
- Wang, G.Y.; Huang, J.P.; Guo, W.D.; Zuo, J.Q.; Wang, J.M.; Bi, J.R.; Huang, Z.W.; Shi, J.S. Observation analysis of land-atmosphere interactions over the loess plateau of northwest china. J. Geophys. Res. 2010, 115. [Google Scholar] [CrossRef]
- Zhao, Y.; Si, B.; He, H.; Xu, J.; Peth, S.; Horn, R. Modeling of coupled water and heat transfer in freezing and thawing soils, inner mongolia. Water 2016, 8. [Google Scholar] [CrossRef]
- Stiegler, C.; Lund, M.; Christensen, T.R.; Mastepanov, M.; Lindroth, A. Two years with extreme and little snowfall: Effects on energy partitioning and surface energy exchange in a high-arctic tundra ecosystem. Cryosphere 2016, 10, 1395–1413. [Google Scholar] [CrossRef]
- Bruemmer, C.; Black, T.A.; Jassal, R.S.; Grant, N.J.; Spittlehouse, D.L.; Chen, B.; Nesic, Z.; Amiro, B.D.; Arain, M.A.; Barr, A.G.; et al. How climate and vegetation type influence evapotranspiration and water use efficiency in Canadian forest, peatland and grassland ecosystems. Agric. For. Meteorol. 2012, 153, 14–30. [Google Scholar] [CrossRef]
- Hou, J.T.; Jia, G.S.; Zhao, T.B.; Wang, H.S.; Tang, B.H. Satellite-based estimation of daily average net radiation under clear-sky conditions. Adv. Atmos. Sci. 2014, 31, 705–720. [Google Scholar] [CrossRef]
- Mercado, L.M.; Bellouin, N.; Sitch, S.; Boucher, O.; Huntingford, C.; Wild, M.; Cox, P.M. Impact of changes in diffuse radiation on the global land carbon sink. Nature 2009, 458, 1014–1017. [Google Scholar] [CrossRef] [PubMed] [Green Version]
- Gu, L.H.; Baldocchi, D.; Verma, S.B.; Black, T.A.; Vesala, T.; Falge, E.M.; Dowty, P.R. Advantages of diffuse radiation for terrestrial ecosystem productivity. J. Geophys. Res. 2002, 107. [Google Scholar] [CrossRef]
- Liu, H.; Zang, R.G.; Chen, H.Y.H. Effects of grazing on photosynthetic features and soil respiration of rangelands in the tianshan mountains of northwest china. Sci. Rep. 2016, 6, 30087. [Google Scholar] [CrossRef] [PubMed]
- Mueller, K.E.; Blumenthal, D.M.; Pendall, E.; Carrillo, Y.; Dijkstra, F.A.; Williams, D.G.; Follett, R.F.; Morgan, J.A. Impacts of warming and elevated CO2 on a semi-arid grassland are non-additive, shift with precipitation, and reverse over time. Ecol. Lett. 2016, 19, 956–966. [Google Scholar] [CrossRef] [PubMed]
- Ma, N.; Zhang, Y.S.; Guo, Y.H.; Gao, H.F.; Zhang, H.B.; Wang, Y.F. Environmental and biophysical controls on the evapotranspiration over the highest alpine steppe. J. Hydrol. 2015, 529, 980–992. [Google Scholar] [CrossRef]
- Yan, R.; Xiong, H.; Zhang, F.; Feng, Z.; Qu, X. Relationship between evapotranspiration and multi-environmental factors of achnatherum splendens grassland’s spac system in oasis-desert ecotone. Arid Land Geogr. 2013, 36, 889–896. [Google Scholar]
- Wang, K.; Dickinson, R.E. A review of global terrestrial evapotranspiration: Observation, modeling, climatology, and climatic variability. Rev. Geophys. 2012, 50. [Google Scholar] [CrossRef]
- Dorigo, W.A.; Zurita-Milla, R.; de Wit, A.J.W.; Brazile, J.; Singh, R.; Schaepman, M.E. A review on reflective remote sensing and data assimilation techniques for enhanced agroecosystem modeling. Int. J. Appl. Earth Obs. 2007, 9, 165–193. [Google Scholar] [CrossRef]
- Sandor, R.; Barcza, Z.; Hidy, D.; Lellei-Kovacs, E.; Ma, S.; Bellocchi, G. Modelling of grassland fluxes in europe: Evaluation of two biogeochemical models. Agric. Ecosyst. Environ. 2016, 215, 1–19. [Google Scholar] [CrossRef]
- Sun, Y.; Piao, S.L.; Huang, M.T.; Ciais, P.; Zeng, Z.Z.; Cheng, L.; Li, X.R.; Zhang, X.P.; Mao, J.F.; Peng, S.S.; et al. Global patterns and climate drivers of water-use efficiency in terrestrial ecosystems deduced from satellite-based datasets and carbon cycle models. Glob. Ecol. Biogeogr. 2016, 25, 311–323. [Google Scholar] [CrossRef]
- Nouri, H.; Glenn, E.P.; Beecham, S.; Boroujeni, S.C.; Sutton, P.; Alaghmand, S.; Noori, B.; Nagler, P. Comparing three approaches of evapotranspiration estimation in mixed urban vegetation: Field-based, remote sensing-based and observational-based methods. Remote Sens. 2016, 8. [Google Scholar] [CrossRef]
- Eichelmann, E.; Wagner-Riddle, C.; Warland, J.; Deen, B.; Voroney, P. Evapotranspiration, water use efficiency, and energy partitioning of a mature switchgrass stand. Agric. For. Meteorol. 2016, 217, 108–119. [Google Scholar] [CrossRef]
- Liu, C.; Xu, P.; An, S. Study on the growing rhymes of plants of grassland in northern slope of Tianshan mountain. Chin. J. Grassl. 2006, 28, 18–21. [Google Scholar]
- Luo, G.; Han, Q.; Zhou, D.; Li, L.; Chen, X.; Li, Y.; Hu, Y.; Li, B.L. Moderate grazing can promote aboveground primary production of grassland under water stress. Ecol. Complex 2012, 11, 126–136. [Google Scholar] [CrossRef]
- Poznikova, G.; Trnka, M.; Fischer, M.; Orsag, M.; Zalud, Z. Applicability of bowen ratio energy balance method in fetch limited conditions. Mendelnet 2012, 2012, 493–503. [Google Scholar]
- Unlu, M.; Kanber, R.; Kapur, B. Comparison of soybean evapotranspirations measured by weighing lysimeter and bowen ratio-energy balance methods. Afr. J. Biotechnol. 2010, 9, 4700–4713. [Google Scholar]
- Hu, S.; Zhao, C.; Li, J.; Wang, F.; Chen, Y. Discussion and reassessment of the method used for accepting or rejecting data observed by a bowen ratio system. Hydrol. Process. 2014, 28, 4506–4510. [Google Scholar] [CrossRef]
- Benor, M.; Levy, G.J.; Mishael, Y.; Nadler, A. Salinity effects on the fieldscout tdr 300 soil moisture meter readings. Soil Sci. Soc. Am. J. 2013, 77, 412–416. [Google Scholar] [CrossRef]
- Zhang, X.F.; Zhao, J.P.; Sun, Q.A.; Wang, X.Y.; Guo, Y.L.; Li, J. Soil moisture retrieval from amsr-e data in Xinjiang (China): Models and validation. IEEE J. Stars 2011, 4, 117–127. [Google Scholar] [CrossRef]
- Meyers, T.P.; Hollinger, S.E. An assessment of storage terms in the surface energy balance of maize and soybean. Agric. For. Meteorol. 2004, 125, 105–115. [Google Scholar] [CrossRef]
- Gavilan, P.; Berengena, J. Accuracy of the bowen ratio-energy balance method for measuring latent heat flux in a semiarid advective environment. Irrig. Sci. 2007, 25, 127–140. [Google Scholar] [CrossRef]
- Todd, R.W.; Evett, S.R.; Howell, T.A. The bowen ratio-energy balance method for estimating latent heat flux of irrigated alfalfa evaluated in a semi-arid, advective environment. Agric. For. Meteorol. 2000, 103, 335–348. [Google Scholar] [CrossRef]
- Dicken, U.; Cohen, S.; Tanny, J. Examination of the bowen ratio energy balance technique for evapotranspiration estimates in screenhouses. Biosyst. Eng. 2013, 114, 397–405. [Google Scholar] [CrossRef]
- Zhang, S.Y.; Li, X.Y.; Zhao, G.Q.; Huang, Y.M. Surface energy fluxes and controls of evapotranspiration in three alpine ecosystems of Qinghai lake watershed, ne Qinghai-Tibet plateau. Ecohydrology 2016, 9, 267–279. [Google Scholar] [CrossRef]
- Gallagher, T.M.; Sheldon, N.D. Combining soil water balance and clumped isotopes to understand the nature and timing of pedogenic carbonate formation. Chem. Geol. 2016, 435, 79–91. [Google Scholar] [CrossRef]
- Wang, X.; Pedram, S.; Liu, T.; Gao, R.; Li, F.; Luo, Y. Estimated grass grazing removal rate in a semiarid eurasian steppe watershed as influenced by climate. Water 2016, 8, 339. [Google Scholar] [CrossRef]
- Huang, X.; Luo, G.; Lv, N. Spatio-temporal patterns of grassland evapotranspiration and water use efficiency in arid areas. Ecol. Res. 2017, 32, 523–535. [Google Scholar] [CrossRef]
- Trepekli, A.; Loupa, G.; Rapsomanikis, S. Seasonal evapotranspiration, energy fluxes and turbulence variance characteristics of a mediterranean coastal grassland. Agric. For. Meteorol. 2016, 226, 13–27. [Google Scholar] [CrossRef]
- Pei, T.; Wu, X.; Li, X.; Zhang, Y.; Shi, F.; Ma, Y.; Wang, P.; Zhang, C. Seasonal divergence in the sensitivity of evapotranspiration to climate and vegetation growth in the yellow river basin, china. J. Geophys. Res. 2017, 122, 103–118. [Google Scholar] [CrossRef]
- Stone, E.C. The ecological importance of dew. Q. Rev. Biol. 1963, 38, 328–341. [Google Scholar] [CrossRef]
- Li, X.Y. Effects of gravel and sand mulches on dew deposition in the semiarid region of china. J. Hydrol. 2002, 260, 151–160. [Google Scholar] [CrossRef]
- Arora, V.K.; Chiew, F.H.S.; Grayson, R.B. Effect of sub-grid-scale variability of soil moisture and precipitation intensity on surface runoff and streamflow. J. Geophys. Res. 2001, 106, 17073–17091. [Google Scholar] [CrossRef]
- Lu, X.; Liang, L.L.; Wang, L.; Jenerette, G.D.; McCabe, M.F.; Grantz, D.A. Partitioning of evapotranspiration using a stable isotope technique in an arid and high temperature agricultural production system. Agric. Water Manag. 2017, 179, 103–109. [Google Scholar] [CrossRef]
- Villarreal, S.; Vargas, R.; Yepez, E.A.; Acosta, J.S.; Castro, A.; Escoto-Rodriguez, M.; Lopez, E.; Martinez-Osuna, J.; Rodriguez, J.C.; Smith, S.V.; et al. Contrasting precipitation seasonality influences evapotranspiration dynamics in water-limited shrublands. J. Geophys. Res. 2016, 121, 494–508. [Google Scholar] [CrossRef]
- Yin, R.; Wu, Y.; Zhang, X.; Ha, S.; Tian, X.; Li, Z.; Wang, J.; Miao, H.; Ren, J. Effects of biological crusts on dew deposition and evaporation in the southern edge of the mu us sandy land, northern china. Acta Ecol. Sin. 2013, 33, 6173–6180. [Google Scholar]
- Zhang, Q.; Wang, S.; Yang, F.-L.; Yue, P.; Yao, T.; Wang, W.-Y. Characteristics of dew formation and distribution, and its contribution to the surface water budget in a semi-arid region in china. Bound. Layer Meteorol. 2015, 154, 317–331. [Google Scholar] [CrossRef]
- Heusinkveld, B.G.; Berkowicz, S.M.; Jacobs, A.F.G.; Holtslag, A.A.M.; Hillen, W.C.A.M. An automated microlysimeter to study dew formation and evaporation in arid and semiarid regions. J. Hydrometeorol. 2006, 7, 825–832. [Google Scholar] [CrossRef]
- Han, Q.; Luo, G.; Li, C.; Shakir, A.; Wu, M.; Saidov, A. Simulated grazing effects on carbon emission in central asia. Agric. For. Meteorol. 2016, 216, 203–214. [Google Scholar] [CrossRef]
- Jia, C.; Zhi-hua, S.H.I.; Lu, L.I.; Xuan, L.U.O. Effects of soil thickness on spatiotemporal pattern of soil moisture in catchment level. J. Appl. Ecol. 2009, 20, 1565–1570. [Google Scholar]
- Xu, G.B.; Liu, X.H.; Wu, G.J.; Chen, T.; Wang, W.Z.; Zhang, Q.; Zhang, Y.F.; Zeng, X.M.; Qin, D.H.; Sun, W.Z.; et al. Tree ring o-18’s indication of a shift to a wetter climate since the 1880s in the western Tianshan mountains of northwestern China. J. Geophys. Res. 2015, 120, 6409–6425. [Google Scholar]
- Klinge, M.; Bohner, J.; Erasmi, S. Modeling forest lines and forest distribution patterns with remote-sensing data in a mountainous region of semiarid central Asia. Biogeosciences 2015, 12, 2893–2905. [Google Scholar] [CrossRef]
- Cao, X.M.; Bao, A.M.; Chen, X.; Xia, Y. Land surface temperature in response to land use/cover change based on remote sensing data in Sangong river. In Remote Sensing and Modeling of Ecosystems for Sustainability V; Gao, W., Wang, H., Eds.; SPIE: Bellingham, WA, USA, 2008; Volume 7083. [Google Scholar]
- Wang, Y.; Jing, C.; Bai, J.; Li, L.; Chen, X.; Luo, G. Characteristics of water and carbon fluxes during growing season in three typical arid ecosystems in central Asia. Chin. J. Plant Ecol. 2014, 38, 795–808. [Google Scholar]
- Yan, R.; Xiong, H.; Zhang, F. The evapotranspiration and energy budget of an achnatherum splendens grassland in the oasis-desert ecotone in Xinjiang, China, during summer and autumn. J. Desert Res. 2013, 33, 133–140. [Google Scholar]
Figure 1.
Map of the study area showing the arid mountainous grasslands in Central Asia. (Abbreviation: AMG, arid mountainous grasslands).
Figure 1.
Map of the study area showing the arid mountainous grasslands in Central Asia. (Abbreviation: AMG, arid mountainous grasslands).

Figure 2.
Diurnal cycle of energy partitioning into net radiation (Rn), sensible heat flux (He), latent heat flux (Le), and ground heat flux (Gn) for each month of the growing season from 2013 to 2015.
Figure 2.
Diurnal cycle of energy partitioning into net radiation (Rn), sensible heat flux (He), latent heat flux (Le), and ground heat flux (Gn) for each month of the growing season from 2013 to 2015.

Figure 3.
Comparison of the daily (5-days moving average series) latent heat flux (Le) and sensible heat flux (He) in the 2013–2015 growing seasons.
Figure 3.
Comparison of the daily (5-days moving average series) latent heat flux (Le) and sensible heat flux (He) in the 2013–2015 growing seasons.

Figure 4.
Comparison of the monthly evapotranspiration (ET), precipitation (P) and temperature (T) during the growing season from 2013 to 2015.
Figure 4.
Comparison of the monthly evapotranspiration (ET), precipitation (P) and temperature (T) during the growing season from 2013 to 2015.

Figure 5.
Comparison of soil volumetric water content (VWC) averaged over 0–40 cm for the years 2013–2015 (a) and the VWC at different depths in the growing season of 2014 (b).
Figure 5.
Comparison of soil volumetric water content (VWC) averaged over 0–40 cm for the years 2013–2015 (a) and the VWC at different depths in the growing season of 2014 (b).

Figure 6.
Wind frequency at the experimental site over the period 2013–2015.


Table 1.
Comparison of condensation (Q) and precipitation (P) during the growing season from 2013 to 2015.
Table 1.
Comparison of condensation (Q) and precipitation (P) during the growing season from 2013 to 2015.
| Year | Season | Spring | Summer | Autumn | Total | |||||||
|---|---|---|---|---|---|---|---|---|---|---|---|---|
| Month | 4 | 5 | Total | 6 | 7 | 8 | Total | 9 | 10 | Total | ||
| 2013 | Q (mm) | 6.3 | 8.6 | 14.9 | 4.8 | 7.0 | 5.0 | 16.8 | 3.2 | 2.9 | 6.1 | 37.8 |
| P (mm) | 58.0 | 47.6 | 105.6 | 81.4 | 98.6 | 66.0 | 246 | 25.2 | 11.6 | 36.8 | 388.4 | |
| Q/P (%) | 10.9 | 18.1 | 14.1 | 5.9 | 7.1 | 7.6 | 6.8 | 12.7 | 25.0 | 16.6 | 9.7 | |
| 2014 | Q (mm) | 10.0 | 9.0 | 19.0 | 5.2 | 6.5 | 2.4 | 8.9 | 6.0 | 4.5 | 10.5 | 38.4 |
| P (mm) | 55.2 | 27.2 | 82.4 | 26.3 | 31.8 | 9.4 | 67.5 | 17.0 | 37.4 | 54.4 | 204.3 | |
| Q/P (%) | 18.1 | 33.1 | 23.1 | 19.8 | 20.4 | 25.5 | 13.2 | 35.3 | 12.0 | 19.3 | 18.8 | |
| 2015 | Q (mm) | 7.0 | 13.0 | 20.0 | 3.8 | 17.6 | 17.0 | 38.4 | 3.2 | 6.1 | 9.3 | 67.7 |
| P (mm) | 47.2 | 80.2 | 127.4 | 79.2 | 15.2 | 115.4 | 209.8 | 40.0 | 25.6 | 65.6 | 402.8 | |
| Q/P (%) | 14.8 | 16.2 | 15.7 | 4.8 | 115.8 | 14.7 | 18.3 | 8.0 | 23.8 | 14.2 | 16.8 | |
Table 2.
Times indicating the changes in the mountain–valley winds within the time intervals when the Le exhibited a small transient decrease in each month from 2013 to 2015.
Table 2.
Times indicating the changes in the mountain–valley winds within the time intervals when the Le exhibited a small transient decrease in each month from 2013 to 2015.
| Times | Month | ||||||
|---|---|---|---|---|---|---|---|
| 4 | 5 | 6 | 7 | 8 | 9 | 10 | |
| 2013 | 24 | 24 | 10 | 20 | 23 | 23 | 22 |
| 2014 | 21 | 23 | 23 | 16 | 19 | 15 | 21 |
| 2015 | 23 | 22 | 24 | 22 | 21 | 20 | 13 |
© 2017 by the authors. Licensee MDPI, Basel, Switzerland. This article is an open access article distributed under the terms and conditions of the Creative Commons Attribution (CC BY) license (http://creativecommons.org/licenses/by/4.0/).
Share and Cite
MDPI and ACS Style
Huang, X.; Luo, G.; Wang, X. Land–Atmosphere Exchange of Water and Heat in the Arid Mountainous Grasslands of Central Asia during the Growing Season. Water 2017, 9, 727. https://doi.org/10.3390/w9100727
AMA Style
Huang X, Luo G, Wang X. Land–Atmosphere Exchange of Water and Heat in the Arid Mountainous Grasslands of Central Asia during the Growing Season. Water. 2017; 9(10):727. https://doi.org/10.3390/w9100727
Chicago/Turabian StyleHuang, Xiaotao, Geping Luo, and Xinxin Wang. 2017. "Land–Atmosphere Exchange of Water and Heat in the Arid Mountainous Grasslands of Central Asia during the Growing Season" Water 9, no. 10: 727. https://doi.org/10.3390/w9100727
Note that from the first issue of 2016, this journal uses article numbers instead of page numbers. See further details here.