Dynamic of Dalinor Lakes in the Inner Mongolian Plateau and Its Driving Factors during 1976–2015


1
Nanjing Institute of Environmental Sciences, Ministry of Environmental Protection, Nanjing 210042, China
2
Department of Geography, University of Tennessee, Knoxville, TN 37996, USA
3
Jiangsu Provincial Key Laboratory of Geographic Information Science and Technology, Nanjing University, Nanjing 210046, China
*
Author to whom correspondence should be addressed.
Water 2017, 9(10), 749; https://doi.org/10.3390/w9100749
Submission received: 15 August 2017
/
Revised: 13 September 2017
/
Accepted: 27 September 2017
/
Published: 30 September 2017
Abstract
:Climate change and increasing human activities have induced lake expansion or shrinkage, posing a serious threat to the ecological security on the Inner Mongolian Plateau, China. However, the pattern of lake changes and how it responds to climate change and revegetation have rarely been reported. We investigated the pattern of lake-area changes in the Dalinor National Nature Reserve (DNR) using Landsat imagery during 1976–2015, and examined its relationship with changes in climate and vegetation factors. The total lake-area in the DNR has decreased by 11.6% from 1976 to 2015 with a rate of −0.55 km2 year−1. The largest Dalinor Lake reduced the most (by 32.7 km2) with a rate of −0.79 km2 year−1. The air temperature has increased significantly since 1976, with a rate of 0.03 °C year−1 (p < 0.05), while the precipitation slightly decreased during 1976–2015, with a rate of −0.86 mm year−1. The Normalized Difference Vegetation Index (NDVI) increased by 27.7% from 1976 to 2015, especially after 2001 when vegetation has been promoted greatly as a result of the successful ecological protection and restoration in the Dalinor basin. The decrease in lake-areas for the DNR exhibited a negative correlation with NDVI (r = −0.397, p < 0.05) during 1976–2015. It seems that decreasing precipitation drives the reduction in lake-area, while rising temperature and vegetation greenness accelerated this decreasing trend by increasing evapotranspiration. The continuous lake shrinkage increases the ecological risks to the habitat of birds, causing a challenge to the management in the DNR.
1. Introduction
Climate change, especially continuously rising temperature and changes in precipitation, has induced significant environmental changes around the world, including the changes in water resources that are of critical importance to human society and ecosystems [1,2,3]. Many areas of the world, including China, are currently facing water shortage issues, and will face higher risks of water shortages by the middle of this century due to global warming [4,5]. Water availability in China is already limited, especially in the northern and western part, and demand will continue to rise with population increase and economic growth.
Lakes are one of the most direct and sensitive water bodies affected by climate change [6,7]. In general, closed lakes (endorheic lakes), especially, small ones, are more sensitive to changing climate or human interventions than open lakes (exorheic lakes). Under some extremely climatic conditions, small lakes may disappear entirely [4,8]. Studies reported that rising temperature and variations in precipitation have caused dramatic changes in the lakes on the Qinghai-Tibetan and Mongolian plateaus and resulted in many ecological hazards since the 1970s [9,10,11]. For example, in recent years, the lake expansion on the Qinghai-Tibet Plateau flooded pastures and farmland, affecting the safety of roads and infrastructure [11]. The Mongolian Plateau is located in the hinterland of Eurasia, including Mongolia and the Inner Mongolia Autonomous Region of China. In contrast to the trend of lake expansion on the Qinghai-Tibetan Plateau, the number of lakes with areas of >1.0 km2 on the Mongolian Plateau dropped from 785 to 577 and the total lake area in Inner Mongolia reduced from 4160 km2 to 2901 km2 during 1987–2010. The remarkable lake shrinkage has resulted in water shortages to local residents, causing desertification and grassland degradation [9,10]. In Mongolia, precipitation was considered as the dominant driver for the lake changes, while in Inner Mongolia, coal mining was suggested as the most important factor in the grassland area, and irrigation was the leading factor in the cultivated area for lake shrinkage [10].
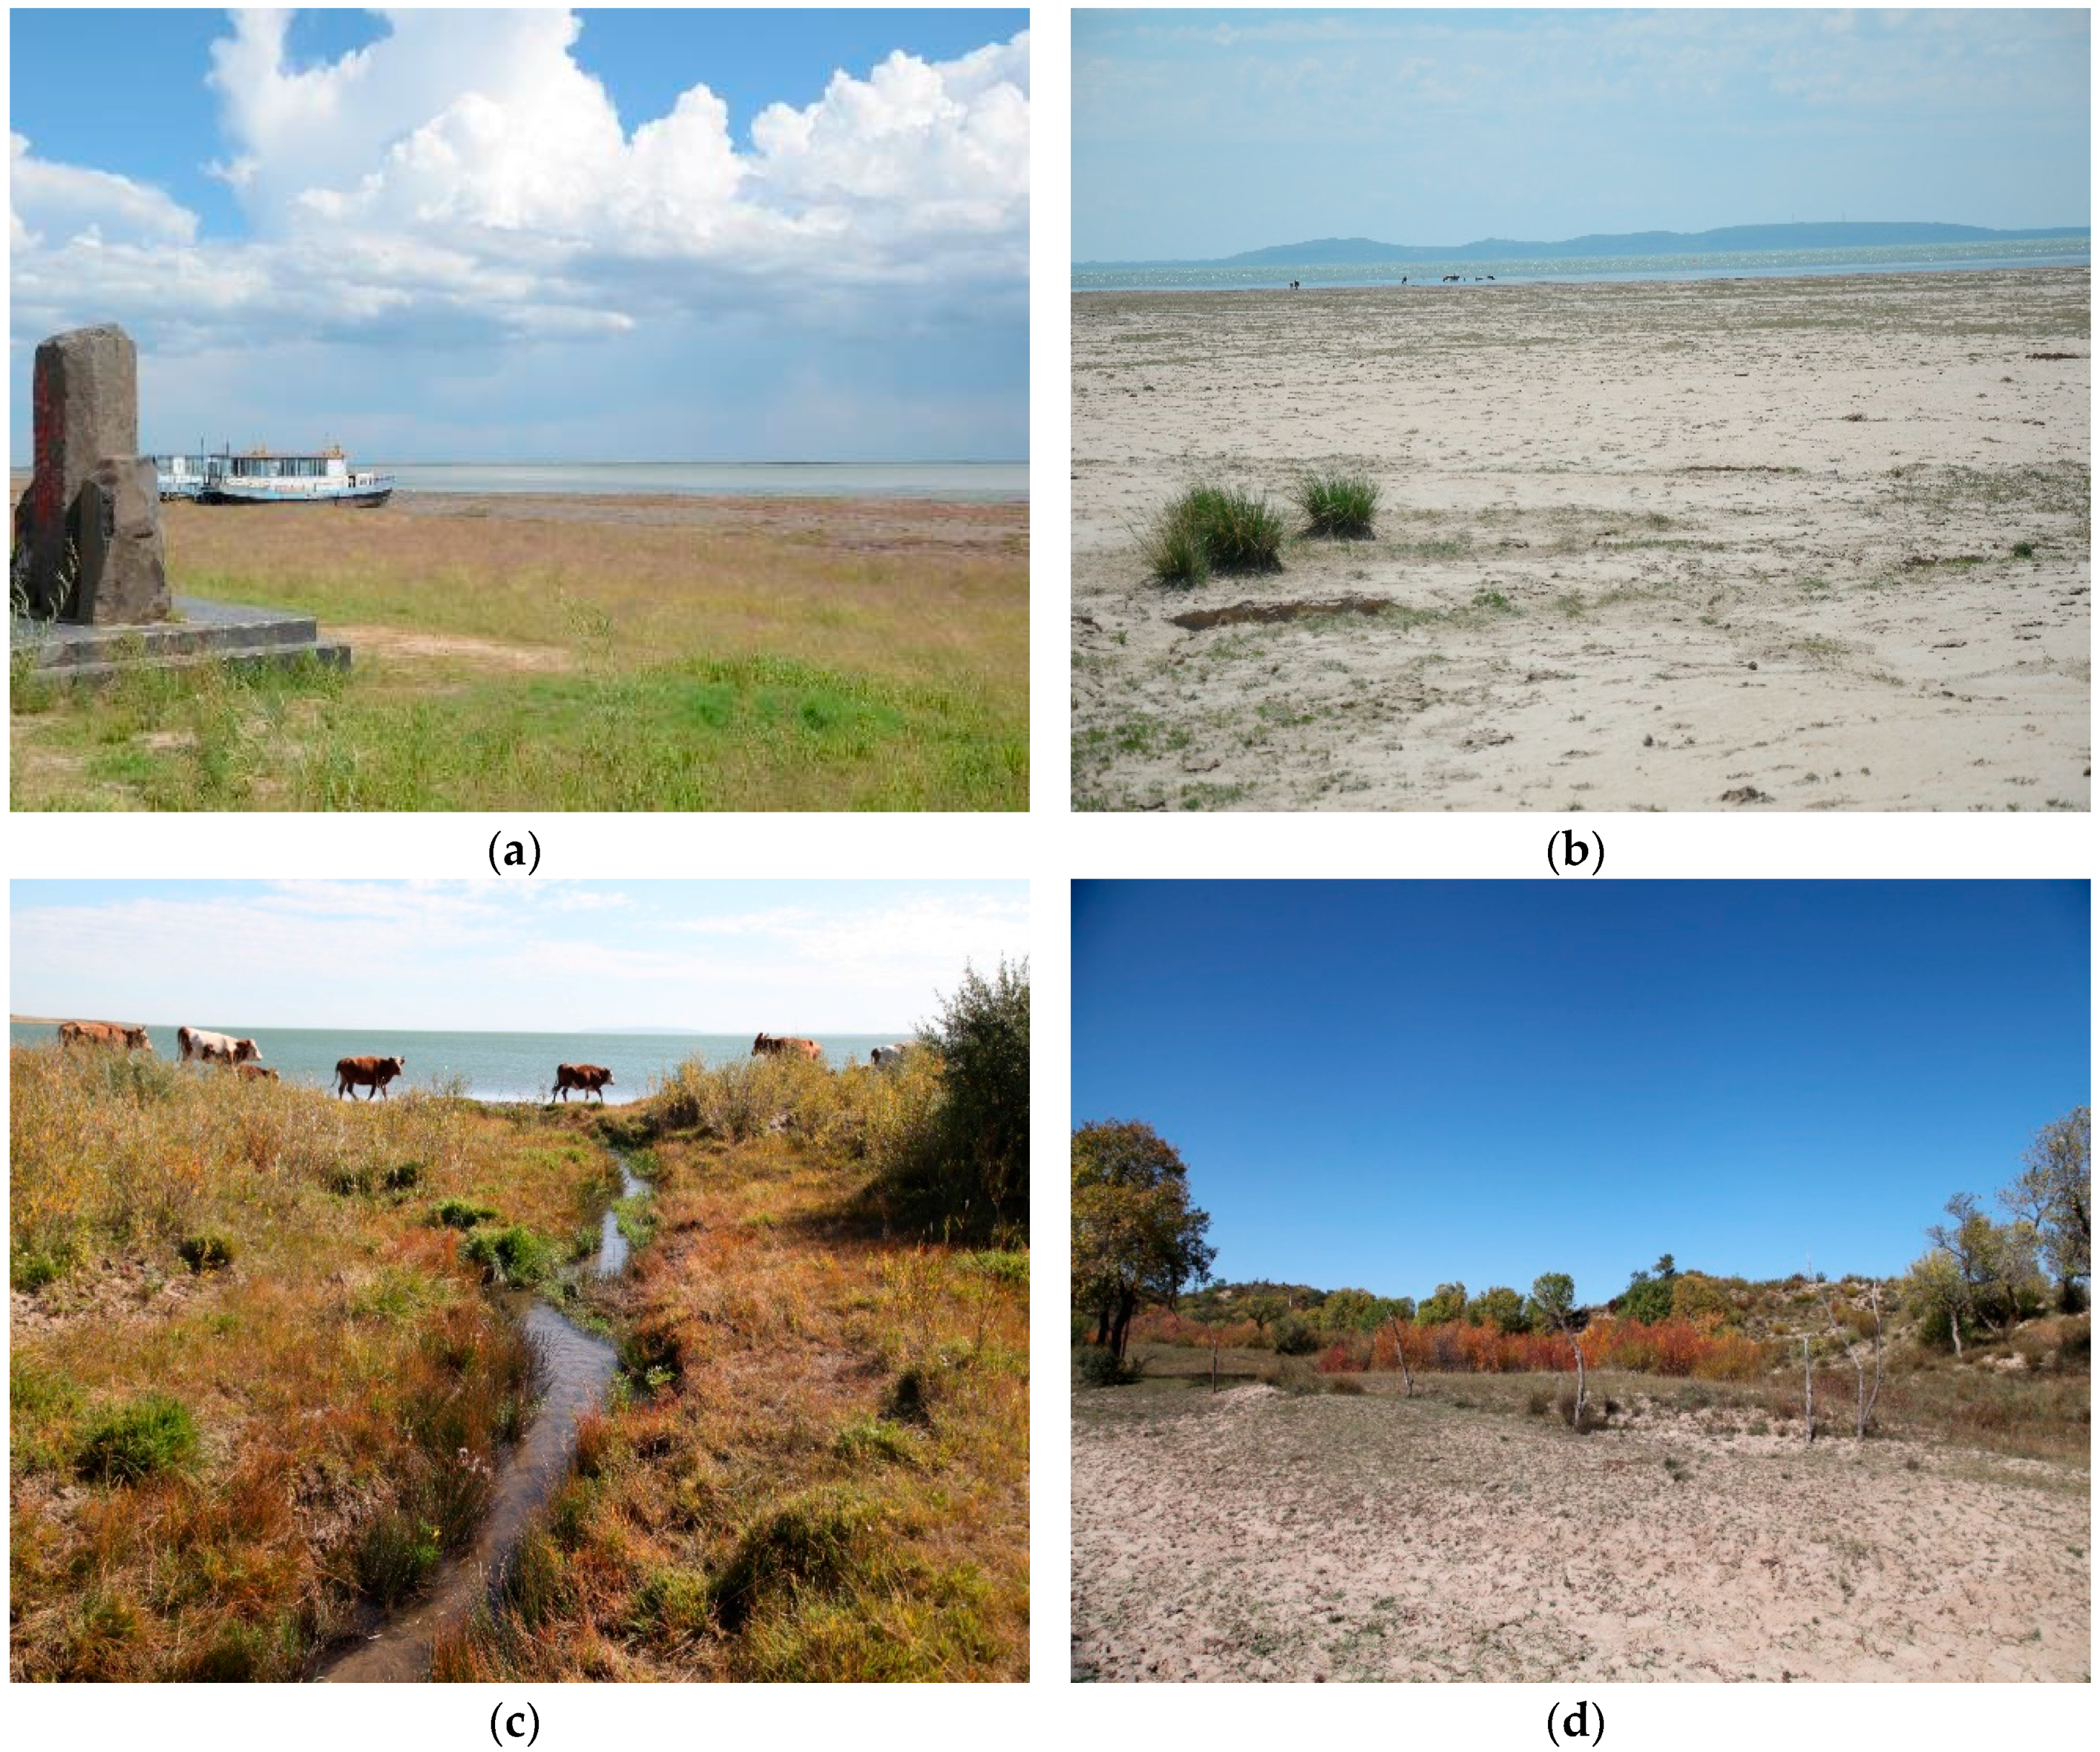
The Dalinor National Nature Reserve (DNR) is located within the Hunshandake sandy land in the Inner Mongolia Autonomous Region. The Hunshandake sandy land is one of the 25 National Key Ecological Function Areas in China and one of the main sources of sandstorm to Beijing and northern China. It is also one of the key implementation areas of the Beijing-Tianjin Wind and Sandstorm Source Control Project [12]. In recent years, water flowing into these lakes decreased significantly, and both lake-area and water quality have changed greatly. The lives of local herdsmen and fishermen have been affected (Figure 1). It is of critical importance to understand the ecological risks of the lake changes to the biodiversity and local community.
In this paper, we investigate the pattern of lake-area changes in the DNR, and examine how climatic factors affect this pattern. We also examine the potential impact of vegetation change on lake changing pattern using NDVI (normalized difference vegetation index) as an indicator of vegetation greenness. We aim to address three research questions: (1) Does the temporal lake changing trend depend on climate changes? (2) What is the potential role of revegetation of sandy land on the hydrological cycle in the Dalinor basin? (3) What is the best strategy to prevent and adapt climate change risks in this ecologically fragile environment? This study provides useful information for environmental protection and promotes a better understanding of climate change adaptation for this lake-based ecosystem and community.
2. Methods
2.1. Study Area
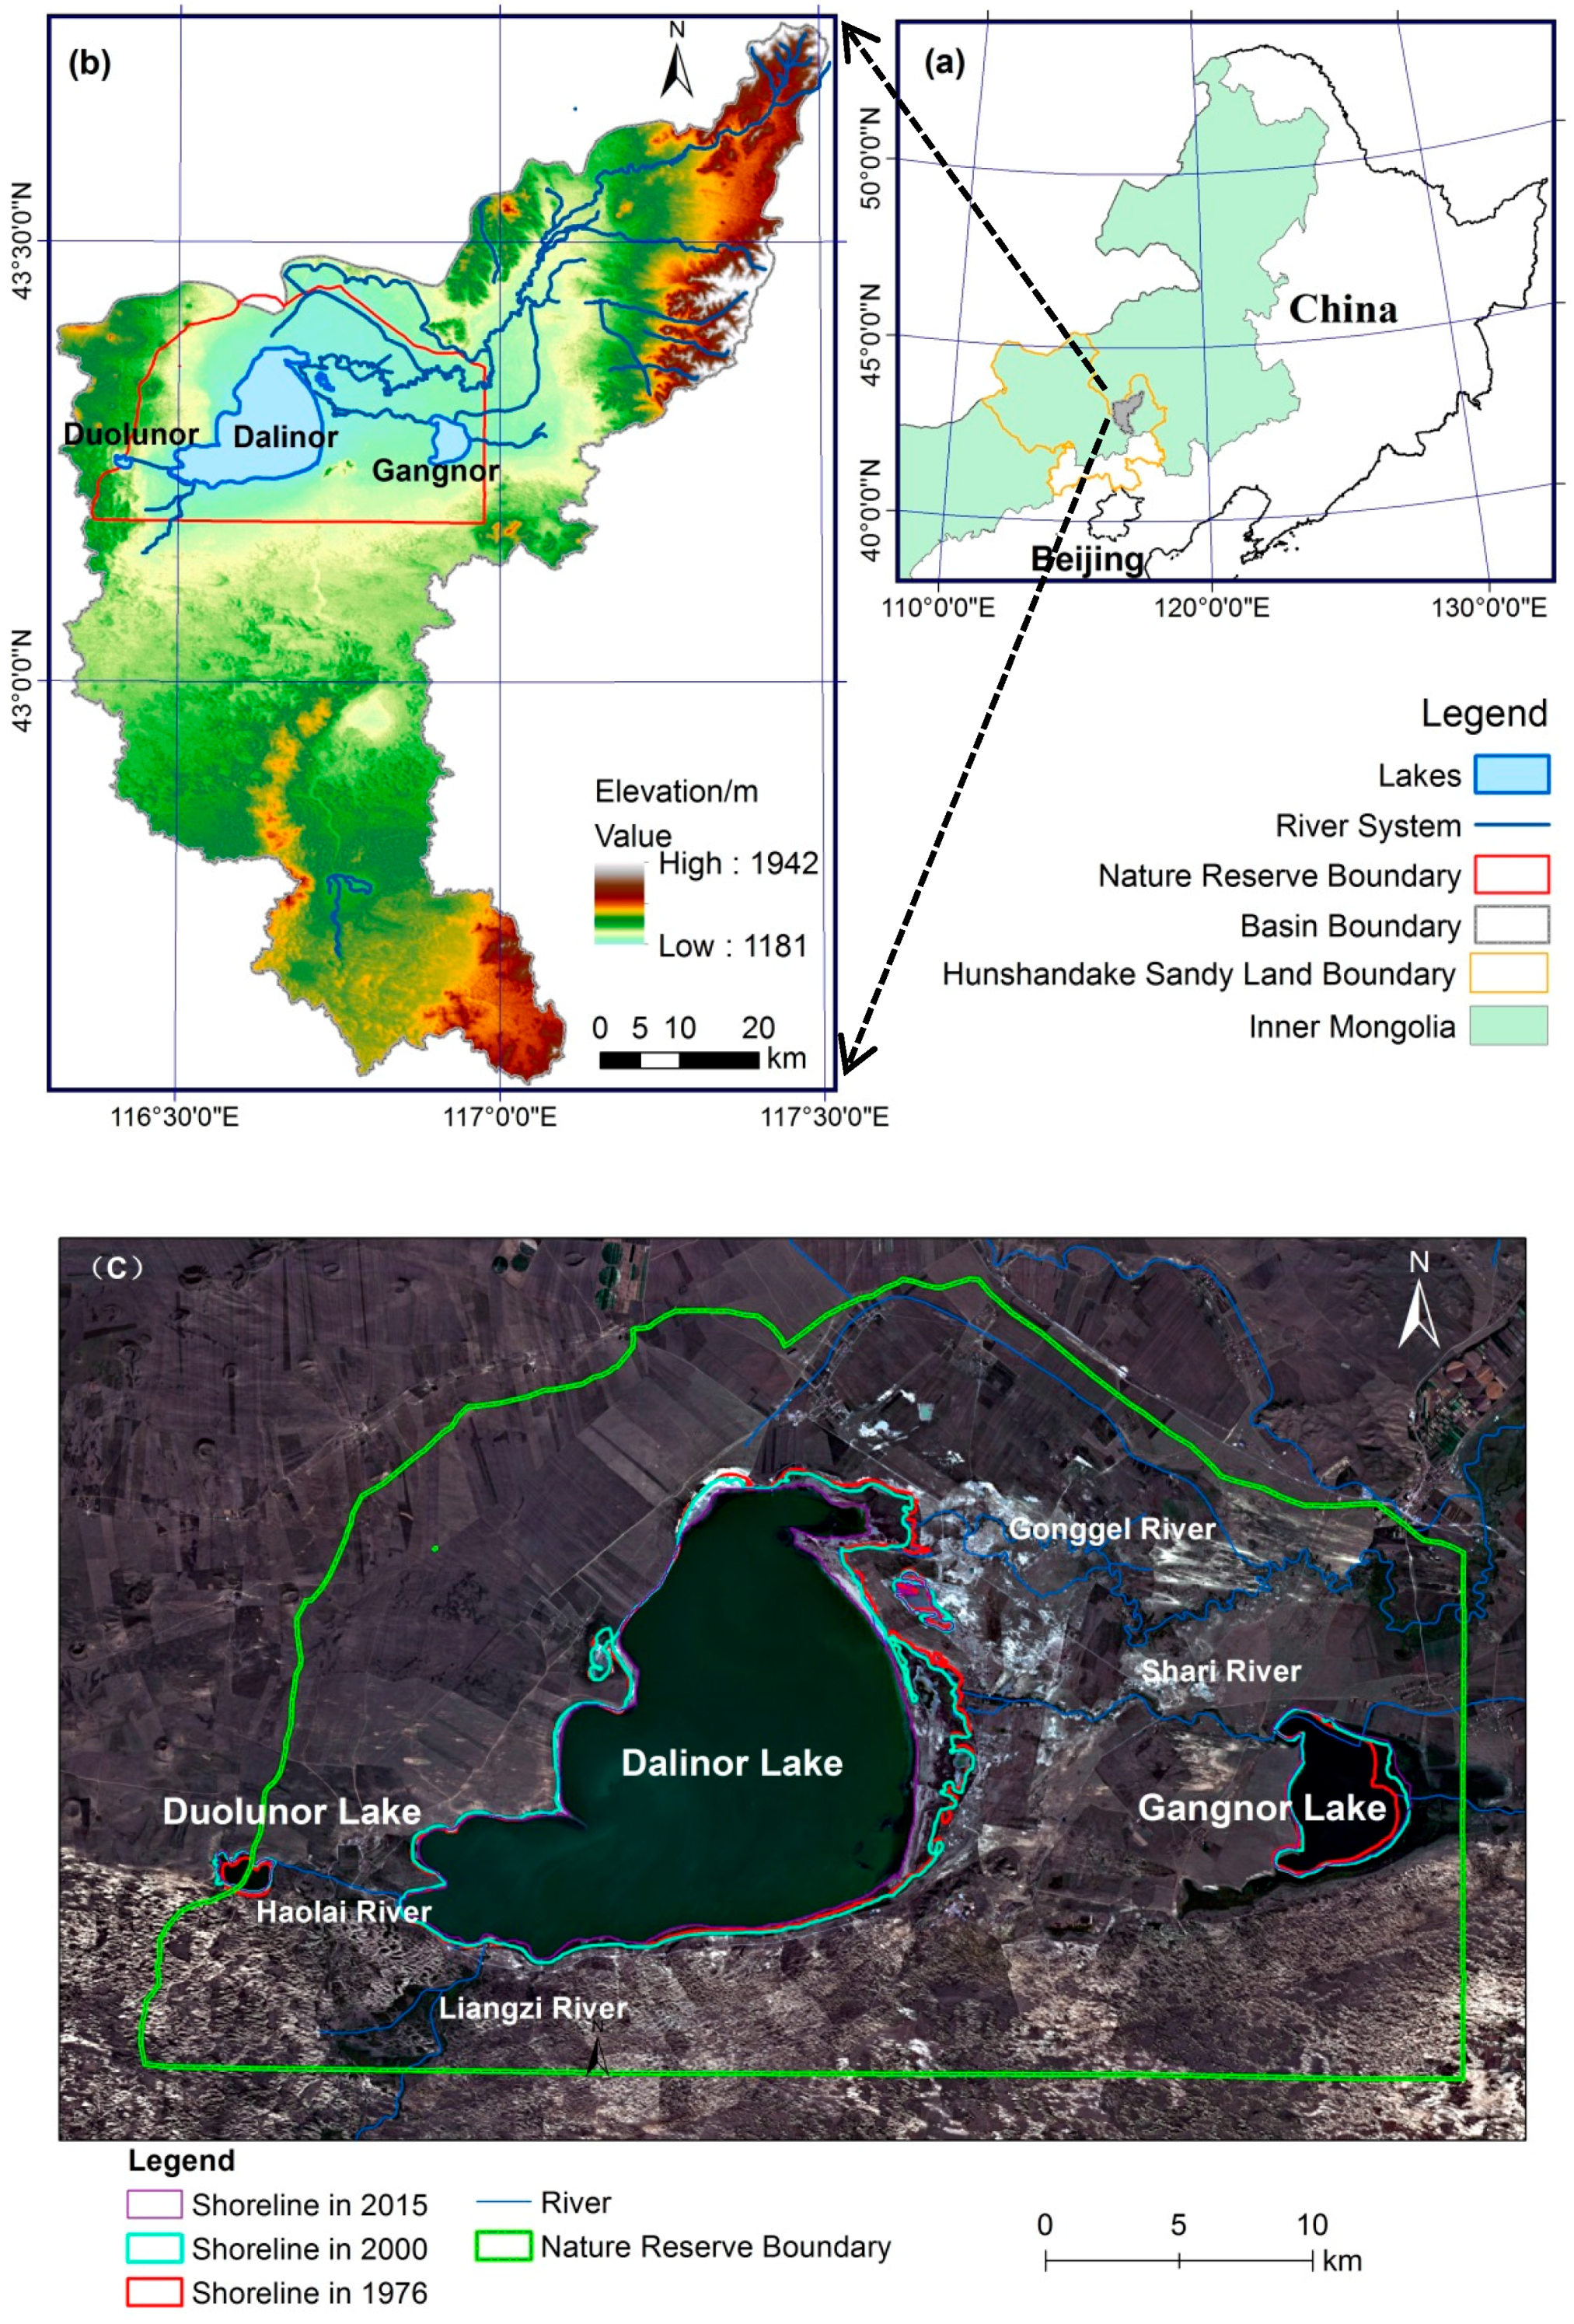
The Dalinor basin is located in the topographic junction of the eastern Mongolian Plateau, the southern end of Greater Khingan Mountains, and Hunshandake sandy land (Figure 2). It covers an area of 5550.54 km2, and is a typical inland lake basin, containing three major lakes (Dalinor Lake, Gangnor Lake, and Duolunor Lake with areas of 191 km2, 21.1 km2, and 2.2 km2 in 2015, respectively) and four rivers (Gonggel River, Liangzi River, Shari River, and Haolai River). The total discharge of the four rivers is about 0.61 million m3 year−1. Gonggel River is the largest river, accounting for about 75% of the total discharge. Among the lakes, Dalinor Lake (116°29′–116°45′ E, 43°13′–43°23′ N) is the largest. It belongs to Hexigten County and Chifeng City in Inner Mongolia. It is a brackish-water lake with elevation ranging from 1226 to 1228 m above sea level (a.s.l.). The average depth is 7.5 m, and the maximum depth is 13 m. The other two lakes flow into Dalinor Lake.
The DNR lies within the Dalinor Basin (Figure 2c), covering an area of 1194.14 km2. The main protected targets of the DNR are rare birds and their habitats, including lakes, wetlands, grasslands, and forests. The DNR is the largest bird-migration corridor in northern China. It is also one of the gathering places of migratory birds in northeast Asia. Many birds take a short stay when they fly between Siberia and south China, Korea, Japan in spring and autumn. Eight species belong to the national protected birds in the first class (such as Ciconia ciconia, Grus Japonensis, Ciconia nigra, Grus vipio, etc.) and 18 species belong to the second class (such as Cygnus cygnus, Anthropoides virgo, Grus grus, etc.) [13]. The Hunshandake sandy land on the south part and outside of the DNR in the Dalinor basin contains abundant groundwater resources. The depth of water table varies from 1.0 to 1.5 m in lowland between sand dunes to >3.0 m on sand dunes. The outflow springs of groundwater exist in some areas, including many springs from the lakebed, especially in Duolunor Lake [9,14,15].
The DNR belongs to the continental climate zone. The observation records from three meteorological stations (Xilinhot, Linxi, and Duolun) showed that the annual average temperature is 4.89 °C, the annual precipitation is 233 mm, and the annual evaporation is around 1300 mm during 1976–2015. The main plant species include Ulmus pumila var.sabulosa, Caragana microphylla, Prunus sibirica, Sabina vulgaris, Artemisia intramongolicas, Salixgorde jevii, Caragana microphylla, Cleistogenes squarrosas, Leymus chinensis (Trinius ex Bunge) Tzvelev, and Stipegrandis.
2.2. Data Collection and Analysis
2.2.1. Datasets
We used a total of 40 Landsat images downloaded from the United States Geological Survey website [16] to explore the pattern of lake-area changes in the DNR during 1976–2015. All of them are with <1% cloud cover and with lakes clearly visible (Table 1). As the time of the Landsat images can affect the estimation of the lake area, we selected the images with consistent survey dates (all from July to September) for each year. The Landsat images during 1976–1990 are MSS images with a spatial resolution of 79 m, and the images during 1991–2015 are TM/ETM+/OLI images with a spatial resolution of 30 m [11].
We collected daily temperature and precipitation records between 1976 and 2015 at three meteorological stations (Xilinhot, Linxi, and Duolun) around the Dalinor basin from the China Meteorological Data Sharing Service Network [17] and aggregated the observed daily records to monthly temperature and precipitation data.
The Shuttle Radar Topography Mission (SRTM) digital elevation model (DEM) [18] was used to analyze the topographic characteristics of the Dalinor basin. The spatial resolution of the DEM is 30 m. We used this DEM to delineate the basin boundary for inland lakes within the DNR using the hydrology tools in ArcGIS 10.2.
The other related data include the boundaries of the nature reserve, and the river stream network in the Dalinor basin.
2.2.2. Data Preparation
We first conducted geometric correction of each Landsat image based SRTM DEM. Then, we delineated the boundary of lakes manually through visual interpretation. The delineated lake boundary was visually validated and checked against Google Earth images [10,19]. Finally, we extracted the lake-area of Dalinor, Gangnor and Dunlunor, and assessed the accuracy of our delineated lake boundary, through quantifying the offset between our field Global Positioning System (GPS) measurements in 2014 and 2016 and delineations from Landsat images. The horizontal error of our delineated lake boundary is <15 m, about 0.5 pixel of the Landsat TM/ETM+ image.
We excluded the areas of lakes to reduce the noise in NDVI caused by the water bodies and derived the NDVI raster for each image by the following equation [11].
We derived a spatially averaged NDVI value for each image to analyze the relationship between lake-area change and vegetation growth. Based on the averaged records from three stations (Xilinhot, Linxi, and Duolun), we calculated the annual mean temperature by averaging the 12 monthly temperatures in each year, and summarized the annual precipitation using the 12 monthly precipitations for each year. We also calculated multi-year average temperature and precipitation by averaging the 40 annual mean temperatures or precipitations during 1976–2015, respectively.
2.2.3. Data Analysis
We applied a linear regression model to detect the changing rates in lake-area, NDVI, annual mean temperature, and annual precipitation during 1976–2015. The regression model is as follows:
where y is the lake-area, NDVI, annual mean temperature, or annual precipitation, respectively; t is the time (year) from 1976 to 2015; a is the slope, indicating the changing rate; and b is the intercept of the regression. The p-value is calculated using F-test to evaluate the statistical significance of the regression, with p-values of 0.05 and 0.01 representing the confidence level of 95% and 99%, respectively.
Pearson’s correlation analysis was conducted to investigate the relationship between lake-area, and NDVI, annual mean temperature, and annual precipitation of the Dalinor basin during 1976–2015. This analysis calculates the correlation coefficient (r) to measure the strength of the correlation and a p-value to represent the statistical significance of the correlation between lake-area and each factor.
To quantify the contributions of the NDVI, annual mean temperature, and annual precipitation to lake-area change in the DNR, we used the grey relational analysis [20] to determine the order of relational degree between lake-area change and different factors. The equation is as follows:
where is the relational coefficient between two sequences at time t; and represents the minimal and maximal difference of the sequences, respectively; represents absolute value of the difference between two sequences; and ρ is the coefficient to distinguish the degree of proximity. ρ ranges from 0 to 1; here, we assigned ρ of 0.5. We calculated the average relational coefficient for a period T (1976–2015), as following:
3. Results
3.1. Pattern of Lake-Area Change in the DNR
From 1976 to 2015, the total lake-area in the DNR exhibited a significantly decreasing trend, with a changing rate of −0.67 km2 year−1 (p < 0.01) (Figure 2c and Figure 3a). The total lake-area was 242.3 km2 in 1976 and 214.3 km2 in 2015, reduced by 11.6%. The largest lake-area of 243.7 km2 appeared in 2000. During 1976–1990 and 2001–2015, the total lake-area both showed the decreasing trends, with changing rate of −0.55 km2 year−1 and −2.07 km2 year−1, respectively (p < 0.01); During 1991–2000, the total lake-area presented an increasing trend with a rate of 0.15 km2 year−1 (p > 0.05). The most significant decrease in lake areas occurred in 2001–2015, with a reduction of 26.4 km2.
The area of Dalinor Lake accounts for 89.2% of the total lake-area in the DNR in 2015 (Figure 3b). The lake-area was 223.7 km2 and 191 km2 in 1976 and 2015, respectively. The area of Dalinor Lake has reduced by 31.6 km2 from 1976 to 2015, with a changing rate of was −0.77 km2 year−1 (p < 0.01). The Dalinor Lake showed a similar decreasing trend with the total lakes in the DNR, but with a greater decreasing rate. The most significant decrease also appeared during 2001–2015, with an area reduction of 26.9 km2 and a rate of −2.11 km2 year−1 (p < 0.01).
The areas of Gangnor Lake and Duolunor Lake only accounts for 9.8% and 1.0% of the total lake area in the DNR in 2015 (Figure 3c,d). From 1976 to 2015, the areas of these two lakes showed an increasing trend with a changing rate of 0.07 km2 year−1 and 0.01 km2 year−1, respectively (p < 0.01). The area of Gangnor Lake was 17.8 km2 in 1976 and increased to 21.1 km2 in 2015 with an increase of 3.3 km2. The area of Duolunor Lake was 1.93 km2 in 1976 and increased to 2.18 km2 in 2015 (with an increase of 0.25 km2).
3.2. Pattern of NDVI Changes in the Dalinor Basin
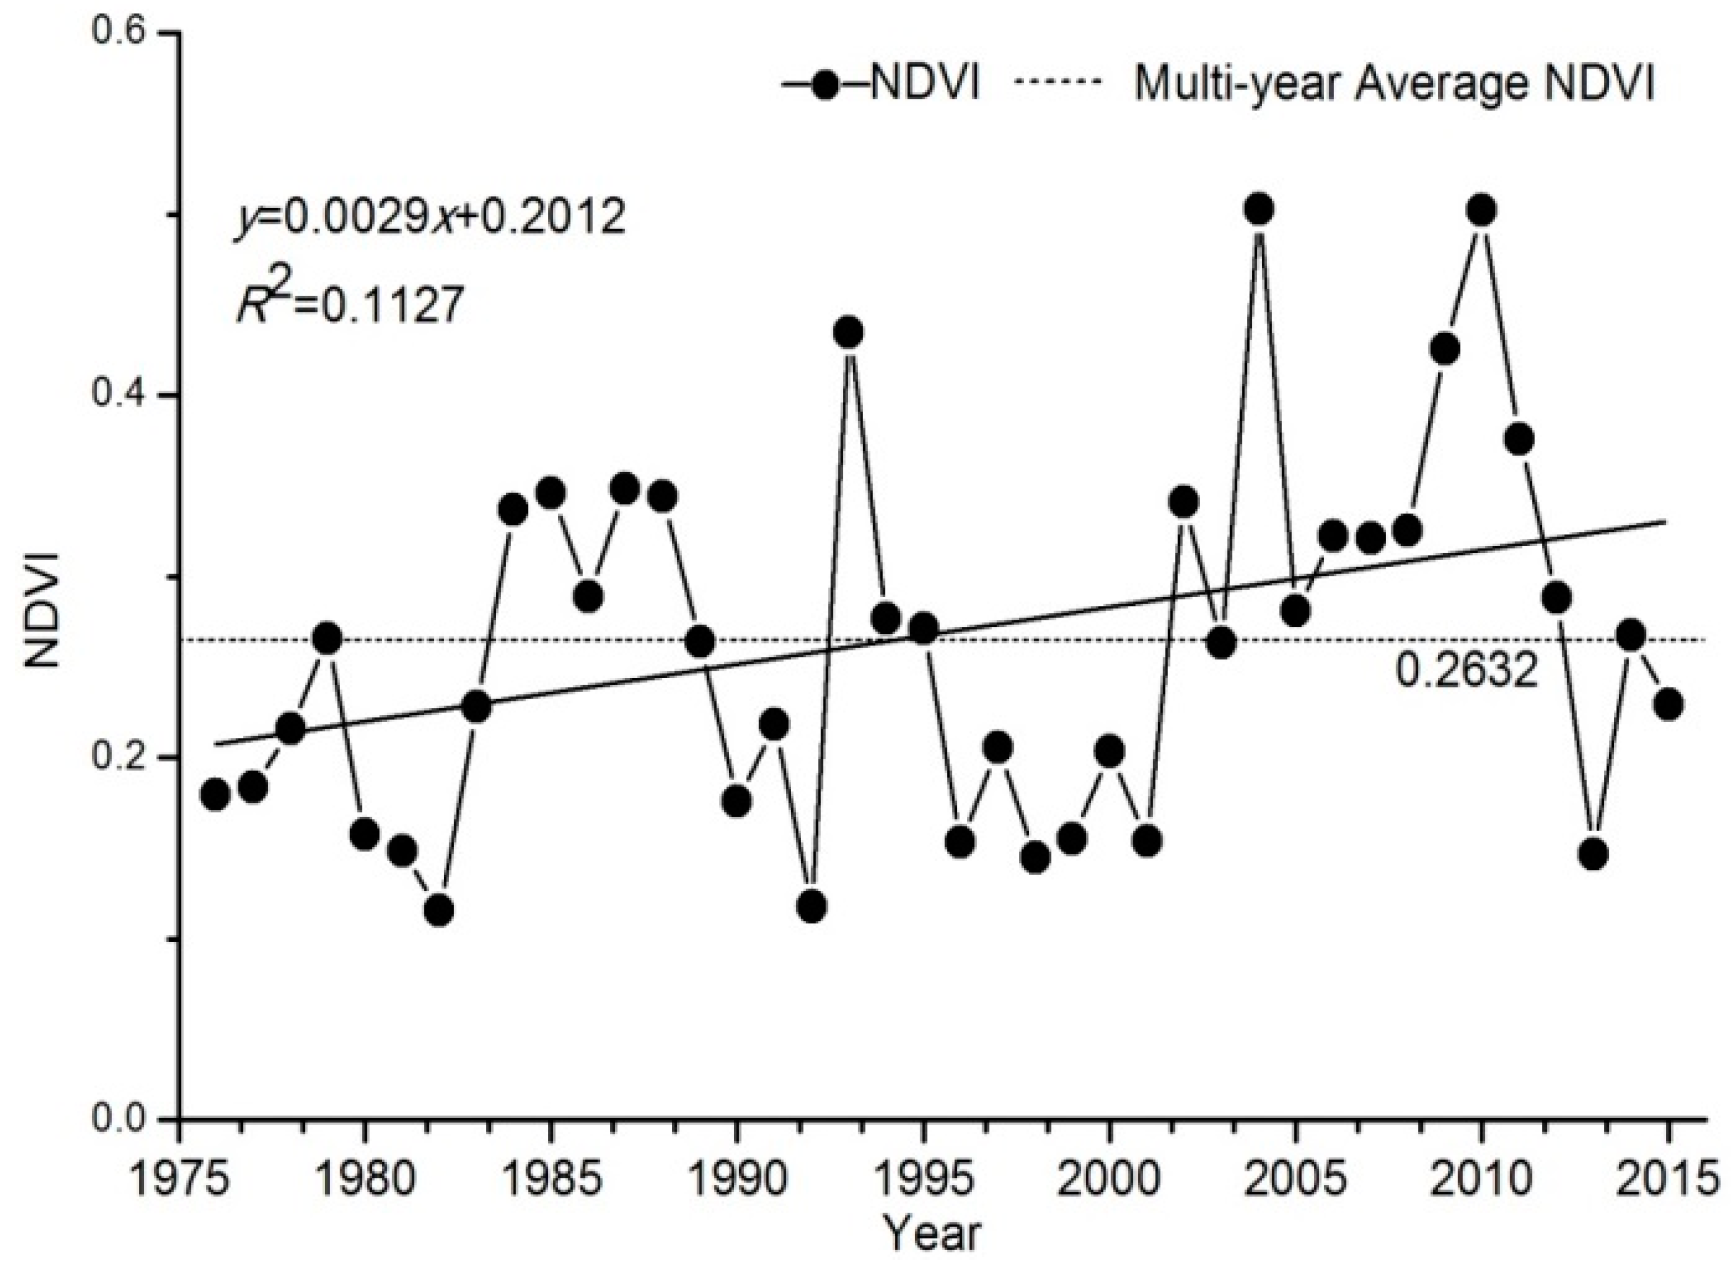
The NDVI value showed an increasing trend in the Dalinor basin during 1976–2015, with a rate of 0.0029 year−1 (Figure 4). Several NDVI peaks with the value greater than the multi-year average NDVI (0.263) occur from 1976 to 2015: the three largest are 0.435 in 1993, 0.503 in 2004 and 0.502 in 2010. This increasing trend was statistically significant at the 95% confidence level (p < 0.05). The vegetation greenness has been promoted greatly, with an increase of 27.7% from 1976 to 2015. The three lowest NDVI are 0.116 in 1982, 0.118 in 1992 and 0.145 in 1998. From 1976 to 2000, the mean NDVI value was 0.231, smaller than the multi-year average NDVI (0.263) during 1976–2015. From 2001 to 2015, the averaged NDVI value was 0.316, much higher than the multi-year average NDVI (0.263) from 1976 to 2015. However, the NDVI showed a slightly decreasing trend during 2001–2015 with a rate of −0.0022 year−1.
3.3. Changes in Temperature and Precipitation Around the DALINOR Basin
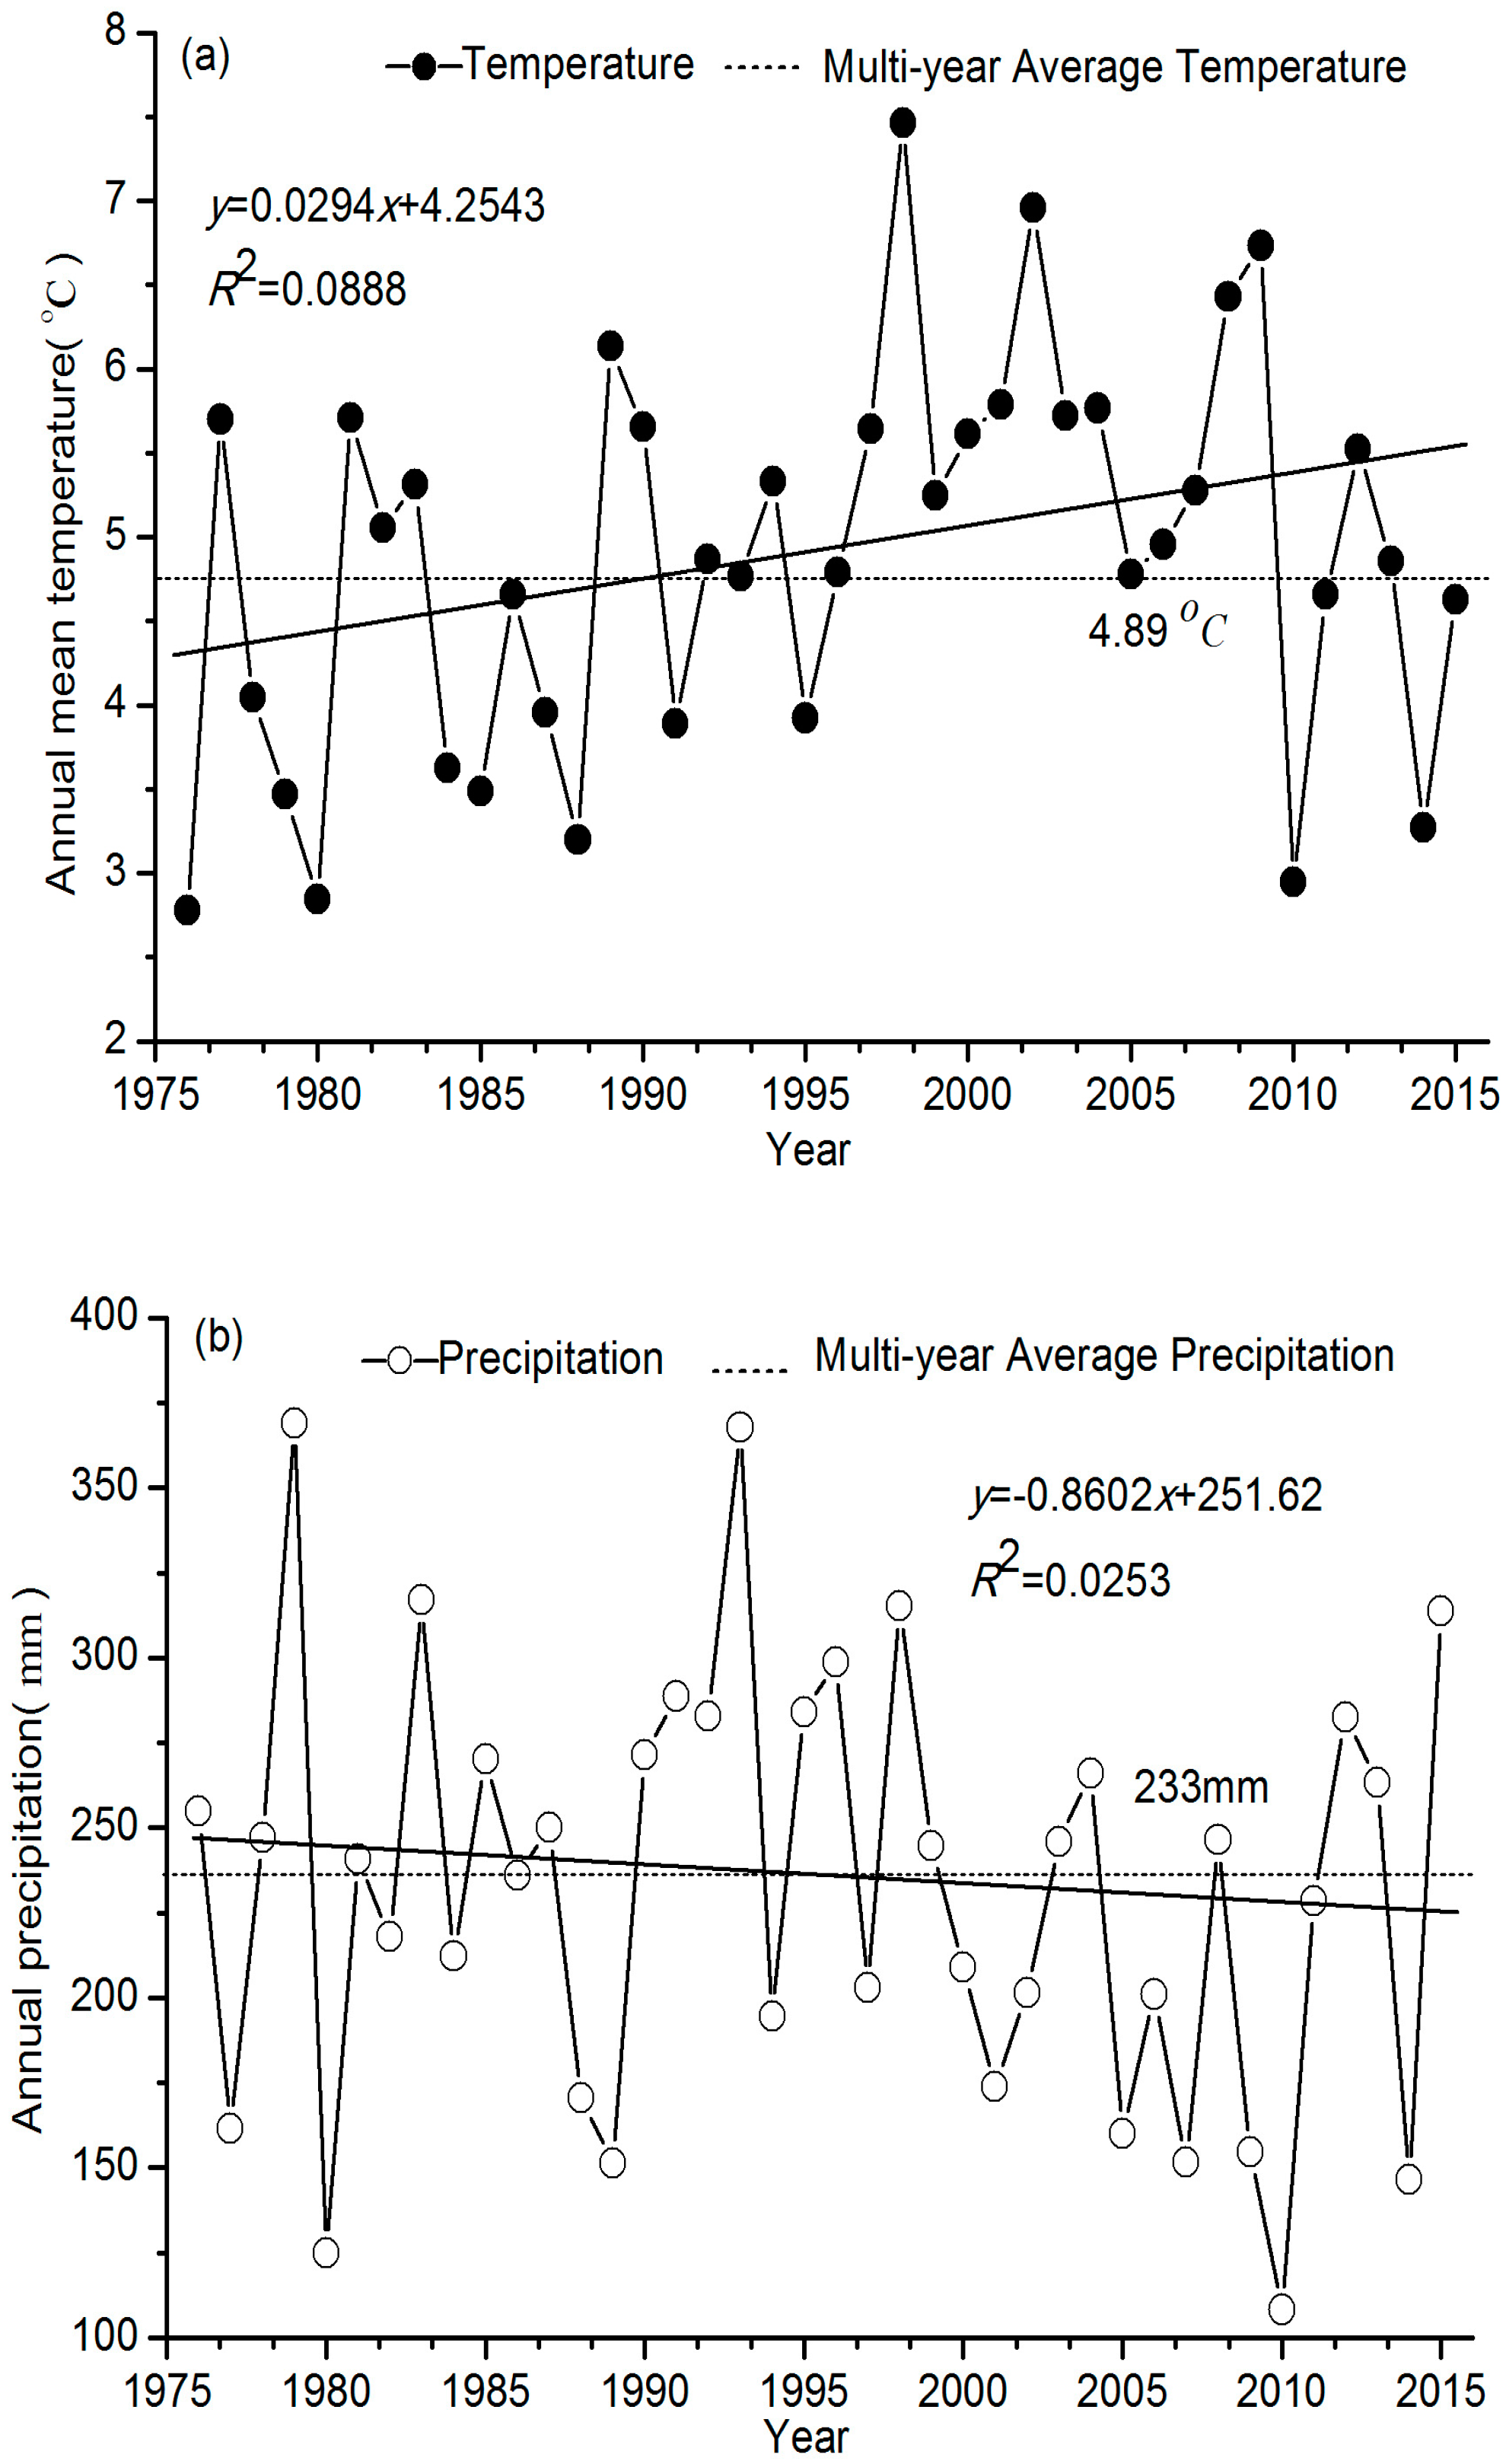
The annual mean temperature showed an increasing trend with a rate of 0.03 °C year−1 at the 95% confidence level (p < 0.05) (Figure 5a). The annual mean temperature was 2.78 °C in 1976 and rose to 4.63 °C in 2015 with a 66.5% increase from 1976 to 2015. The highest annual mean temperature occurred in 1998 (7.47 °C), followed by 1996 (6.96 °C) and 2009 (6.73 °C). During 1976–2000, the annual mean temperature was 4.69 °C, lower than the multi-year average temperature (4.89 °C) from 1976 to 2015. From 2001 to 2015, the annual mean temperature was 5.22 °C, greater than the multi-year average temperature (4.89 °C) during 2001–2015, however, the annual mean temperature exhibited a decreasing trend with a rate of −0.14 °C year−1 at the 95% confidence level (p < 0.05) from 2001 to 2015.
The annual precipitation exhibited a slightly decreasing trend during 1976–2015, with a changing rate of −0.86 mm year−1 (Figure 5b). The annual precipitation was 255 mm in 1976 and 314 mm in 2015. The highest annual precipitation occurred in 1979 (369 mm), followed by 1993 (368 mm) and 1983 (317 mm), the lowest annual precipitation was 108 mm in 2010, followed by 125 mm in 1980 and 147 mm in 2014. From 2001 to 2015, the mean annual precipitation was 210 mm, smaller than the multi-year average precipitation (233 mm) during 1976–2015; however, the annual precipitation exhibited an increasing trend with a rate of 2.95 mm year−1 from 2001 to 2015.
3.4. Relationship Between Lake-Area Change and NDVI, Annual Mean Temperature, and Annual Precipitation
The decrease in total lake-area in the DNR had a statistically significant negative correlation with increasing NDVI during 1976–2015 (r = −0.397, p < 0.05), but weak statistically significant correlations with rising temperature (r = −0.015) or decreasing precipitation (r = 0.227) (Table 2). The similar relationship between lake-area and driving factors appeared in the Dalinor Lake. in particular, the correlation between lake-area and NDVI reached the 99% confidence level (r = −0.415, p < 0.01). For the decrease in lake-area in the DNR and Dalinor Lake, the highest relational degree both appeared in the association of lake-area with annual precipitation, followed by annual mean temperature and NDVI. It seems that among the statistically driving factors, the decreasing precipitation drives the reduction in lake-area in the DNR, while rising temperature and vegetation greenness accelerated this decreasing trend.
4. Discussion
The Intergovernmental Panel on Climate Change (IPCC) Fifth Assessment Report (AR5) (2014) shows that lakes are susceptible to direct impacts of climate change, and changes in temperature and precipitation may cause changes in lake level, water quality, and the entire lake ecosystem [4,6]. For the inland lakes within the DNR, we found that the total lake-area had decreased significantly from 242.3 km2 to 214.3 km2 during 1976–2015. In particular, the largest Dalinor Lake has decreased from 223.7 km2 to 191 km2, with a significant decrease of 14.6%. Our results are consistent with the previous findings that most of the lakes in Inner Mongolia are shrinking [10,21,22]. From 1976 to 2015, the annual mean temperature exhibits an increasing trend (p < 0.05) and annual precipitation decreases slightly (p > 0.05). At the Dalinor basin scale, the NDVI shows a fluctuating but overall increasing trend (p < 0.05). These results are consistent with the findings that there is a significant increase in vegetation greenness of the Hunshandake sandy land [12,23]. The decreasing trend of lake-area in the DNR shows a similar trend to that of annual precipitation, while presents an opposite trend to that of annual mean temperature and vegetation greenness (Figure 3a, Figure 4 and Figure 5b).
Studies showed that, for the Dalinor lakes, besides precipitation, there are other supply sources, including spring water from the lakebed and groundwater from Hunshandake sandy land [9,24]. From 1959 to 1961, the average discharge of the largest river (Gonggel River) is 0.457 × 10⁸ m3; the flow reduced to 0.17 × 10⁸ m3 in 1972; in 2014, the total amount of the four rivers flowing into the lake was only 0.42 × 10⁸ m3, while the Gonggel River was 0.20 × 10⁸ m3 [25]. It seems that annual precipitation had the largest contribution to the decrease in lake-area in the DNR (Table 2, the largest relational degree are 0.734 and 0.742, respectively), from 2001 to 2015, the mean annual precipitation was 210 mm, with a 9.9% decrease of the multi-year average precipitation (233 mm) during 1976–2015 (Figure 5b). Zhai (2014) pointed out that groundwater flow was one of the main recharges of Dalinor Lake, through detecting the hydrogen and oxygen isotopes from the water samples of rivers, wells, and springs in and around Dalinor Lake in 2013 [25]. Simultaneously, it was reported that the groundwater flow is much larger than surface runoff in Dalinor Lake, and the sparse vegetation on Hunshandake sandy land favors groundwater recharge [26,27,28]. Since 2002, the lake-area in the DNR has decreased dramatically, whereas annual precipitation presents an increasing trend with a rate of 2.95 mm year−1 during 2001–2015. Note that the evaporation of this area is very high (around 1300 mm per year). In particular, the amount of evaporation has reached more than five times that of precipitation since 2000 [29]. Therefore, we argue that the precipitation in the Dalinor basin is not enough to compensate for the loss caused by evaporation. It seems that the change in precipitation cannot fully explain the pattern of lake-area changes in the DNR, and vegetation changes may be acted as an important role to the decrease in lake-area, through evapotranspiration depleting ground water on sandy land.
Since 2002, the Chinese government has implemented the Beijing-Tianjin Wind and Sandstorm Source Control Project (including the protection of natural vegetation, revegetation on sandy land, afforestation, returning farmland to forests and grassland management, etc.) to improve the ecological function and reduce the damage of sandstorm around Beijing and Tianjin. Benefiting from this policy and effective measurements of ecological protection and restoration, the vegetation greenness in the Dalinor basin has increased significantly from 2001 to 2015 (Figure 5). The Fifth Bulletin of Desertification and Sandification State of China released in December 2015 indicates that the area of sandy land has decreased by 5.85 × 10⁴ hectares in the Hunshandake sandy land during 2009–2014, and the area of >40% vegetation coverage has increased by 98.77 × 10⁴ hectares. Evapotranspiration is one of the key processes in connecting vegetation and groundwater: vegetation influences soil moisture by shading the land surface, while the intensity of transpiration increases as the increase in vegetation greenness [26,30,31,32]. It seems that revegetation on sandy land may be acted as a double-edged sword: it could increase vegetation greenness, but may also consume the groundwater. Although the Beijing-Tianjin Wind and Sandstorm Source Control Project has mitigated the frequency of sandstorms, it may also change the water balance around the lakes in the Dalinor basin. Climate change and human activities are regarded as the two driving forces to the lake changes on the Mongolian Plateau and the impact of human activities is more significant than that of climate change to cause the decreases in the lake area and the number of lakes in Inner Mongolia [10]. In addition to the potential groundwater consumption by vegetation [15,33], other human activities also consume water resources in the Dalinor basin, such as pasture irrigation, the number increase of wells, coal mining, etc. [9,34]. These human activities combining with the changes in climate variables have caused the decline in groundwater level, reduced the water discharge to the lake, and finally led to the shrinkage of these lakes.
The lake shrinkage during 1976–2015 has caused the deterioration of lake water quality, salinization of surrounding land, desertification of grassland [35,36], and the disturbance of the ecological balance among different function areas (core zone, buffer zone and experimental zone) in the DNR. According to the field surveys on lake shrinkage in 2014 and 2016, the shoreline of Dalinor lake has retreated more than 100 m in the northeast part, and the land has shown signs of salinization that may damage the bird habitats and become a source of alkali dust in the dry seasons [36] (Figure 1 and Figure 2). Studies showed that climate change may change the boundary of different functional zones and even lead to the protected species migrating outside the nature reserve [36,37]. The lake shrinkage in the Dalinor basin may result in seriously ecological hazards to the habitat of birds in the DNR, causing a great challenge to the reserve management. An integrated approach is needed to assess the threshold value of vegetation coverage at the basin scale, regulate unreasonable activities of mining and irrigation, and implement adaptation measures to mitigate the ecological risks induced by extremely climatic events.
5. Conclusions
In this paper, we investigated the pattern of lake-area changes in the DNR using Landsat images data from 1976 to 2015, and examined its relationship with climatic factors and vegetation changes. The total lake-area in the DNR has significantly decreased by 11.6% during 1976–2015. The largest Dalinor Lake accounts for 89.2% of the total lake-area in the DNR in 2015, and also exhibited a decreasing trend. The most significant decrease appeared in 2001–2015, with a rate of −2.11 km2 year−1. The annual mean temperature has been increasing since 1976, with a rate of 0.03 °C year−1, while the annual precipitation slightly decreases during 1976–2015, with a changing rate of −0.86 mm year−1. However, annual precipitation exhibited an increasing trend with a rate of 2.95 mm year−1 from 2001 to 2015. The NDVI value in the Dalinor basin showed an increasing trend with a rate of 0.0029 year−1 (p < 0.05), and has increased 27.7% from 1976 to 2015. The decrease in total lake-area in the DNR was negatively correlated with increasing NDVI (r = −0.397, p < 0.05), but no statistically significant relationship with decreasing precipitation (r = 0.227). The change in precipitation cannot fully explain the pattern of lake-area changes, while vegetation greening may play an important role to the decrease in lake-area, through increased evapotranspiration that depletes groundwater on sandy land. It seems that the revegetation on sandy land can act as a double-edged sword: it could increase vegetation greenness, but may also consume the groundwater through evapotranspiration. The lake shrinkage and vegetation growth in the Dalinor basin may cause seriously ecological damages to the habitat quality in the DNR. In addition, human activities, such as pasture irrigation, the number increase of wells, and coal mining, also consume groundwater, reducing the water discharge to the lake and leading to the shrinkage of these lakes. These findings provide important insight into the understanding of climate change risks and the development of a roadmap to climate adaptation program in lake-based communities.
Acknowledgments
We thank Weishou Shen from Nanjing Institute of Environmental Sciences, Ministry of Environmental Protection and Xianghua Xu from Nanjing University of Information Science & Technology for their suggestions and help. This work was funded by the National Geographic Air and Water Conservation Fund (Grant No. GEFC-12-16), a National Special Public Welfare Study on Environmental Protection in China (Grant No. 201509027), and the data support from National Earth System Science Data Sharing Infrastructure (http://www.geodata.cn/). The authors are indebted to the reviewers for their constructive comments and suggestions for improving the manuscript. The pictures in Figure 1 were photographed by Haidong Li.
Author Contributions
Haidong Li conceived and designed the research; Yuanyun Gao and Haidong Li conducted the analysis, and wrote the paper; and Yingkui Li, Shouguang Yan, and Yuyue Xu contributed to the analysis, discussion, and paper revision.
Conflicts of Interest
The authors declare no conflict of interest.
References
- Finnis, J.; Sarkar, A.; Stoddart, M.C. Bridging science and community knowledge? The complicating role of natural variability in perceptions of climate change. Glob. Environ. Chang. 2015, 32, 1–10. [Google Scholar] [CrossRef]
- Luo, P.; He, B.; Takara, K.; Xiong, Y.E.; Nover, D.; Duan, W.; Fukushi, K. Historical Assessment of Chinese and Japanese Flood Management Policies and Implications for Managing Future Floods. Environ. Sci. Policy 2015, 48, 265–277. [Google Scholar] [CrossRef]
- Li, Y.; Urban, M.A. Water resource variability and climate change. Water 2016, 8, 348. [Google Scholar] [CrossRef]
- Spencer, T.; Altman, P. Climate Change, Water, and Risk: Current Water Demands are not Sustainable; Natural Resources Defense Council: Washington, DC, USA, 2014; Available online: https://www.nrdc.org/sites/default/files/WaterRisk.pdf (accessed on July 2010).
- Chang, B.; He, K.; Li, R.; Sheng, Z.; Wang, H. Linkage of Climatic Factors and Human Activities with Water Level Fluctuations in Qinghai Lake in the Northeastern Tibetan Plateau, China. Water 2017, 9, 552. [Google Scholar] [CrossRef]
- Intergovernmental Panel on Climate Change (IPCC). Working Group II Report Climate Change 2014: Impacts, Adaptation, and Vulnerability; World Meteorological Organization: Geneva, Switzerland, 2014. [Google Scholar]
- Gao, H.; Cathryn, M.R.; Li, C.; Sun, B. Understanding the Role of Groundwater in a Remote Transboundary Lake (Hulun Lake, China). Water 2017, 9, 363. [Google Scholar] [CrossRef]
- Laird, K.R.; Fritz, S.C.; Grimm, E.C.; Mueller, P.C. Century-scale paleoclimatic reconstruction from Moon Lake, a closed basin lake in the Northern Great Plains. Limnol. Oceanogr. 1996, 41, 890–902. [Google Scholar] [CrossRef]
- Bao, Y.; Zhang, X. The study of lakes dynamic change based on RS and GIS-Take Dalinor Lake as an example. Procedia Environ. Sci. 2011, 10, 2376–2384. [Google Scholar] [CrossRef]
- Tao, S.; Fang, J.; Zhao, X.; Zhao, S.; Shen, H.; Hu, H.; Tang, Z.; Wang, Z.; Guo, Q. Rapid loss of lakes on the Mongolian Plateau. Proc. Natl. Acad. Sci. USA 2015, 112, 2281–2286. [Google Scholar] [CrossRef] [PubMed]
- Li, Y.; Liao, J.; Guo, H.; Liu, Z.; Shen, G. Patterns and Potential Drivers of Dramatic Changes in Tibetan Lakes, 1972–2010. PLoS ONE 2014, 9, e111890. [Google Scholar] [CrossRef] [PubMed]
- Yang, X.C.; Xu, B.; Jin, Y.X.; Qin, Z.; Ma, H.; Li, J.; Zhao, F.; Chen, S.; Zhu, X. Remote sensing monitoring of grassland vegetation growth in the Beijing-Tianjin sandstorm source project area from 2000 to 2010. Ecol. Indic. 2015, 51, 244–251. [Google Scholar] [CrossRef]
- Wang, S.; Xie, Y. China Speicies Red List; Higher Education Press: Beijing, China, 2009. [Google Scholar]
- Yang, J. The Investigation about Relationship between Ulmus pumila Distributing and Weather & Groundwater in Otingdag Sand Land; Inner Mongolia Agricultural University: Hohhot, China, 2010; (In Chinese with English Abstract). [Google Scholar]
- Su, H.; Li, Y.; Su, B.; Sun, J. Effects of groundwater decline on photosynthetic characteristics and stress tolerance of Ulmus pumila in Hunshandake Sandy Land, China. Chin. J. Plant Ecol. 2012, 36, 177–186, (In Chinese with English Abstract). [Google Scholar]
- The United States Geological Survey. Available online: http://glovis.usgs.gov/ (accessed on 5 December 2016).
- The China Meteorological Data Sharing Service Network. Available online: http://data.cma.cn/site/index.html (accessed on 1 September 2016).
- The CGIAR Consortium for Spatial Information. Available online: http://srtm.csi.cgiar.org/ (accessed on 3 June 2017).
- Li, Y.; Li, Y.; Lu, X.; Harbor, J. Geomorphometric Controls on Mountain Glacier Changes Since the Little Ice Age in the Eastern Tien Shan, Central Asia. Ann. Am. Assoc. Geogr. 2017, 107, 284–298. [Google Scholar] [CrossRef]
- Liu, S.F.; Yang, Y.; Forrest, J. Grey Data Analysis; Springer: Berlin, Germany, 2017. [Google Scholar]
- Chang, X.; Zou, X.; Wang, W.; Liu, L. Responses of lake fluctuation to climate change in Horqin Sandy Land. Acta Ecol. Sin. 2013, 33, 7002–7012, (In Chinese with English Abstract). [Google Scholar] [CrossRef]
- Bai, X.; Chun, X.; Si, Q.; Song, J. Changes of lakes in Hunshandake Sandy Land in the past 45 years, Inner Mongolia. J. Lake Sci. 2016, 28, 1086–1094, (In Chinese with English Abstract). [Google Scholar]
- Yuan, Z.; Bao, G.; Ying, S.; Lei, J.; Bao, Y.H.; Sa, C.L. Vegetation changes in Otindag sand country during 2000–2014. Acta Pratacult. Sin. 2016, 25, 33–46, (In Chinese with English Abstract). [Google Scholar]
- Chen, J.; Ji, B.; Liu, Z.; Zhang, Z.; Zhang, S. Isotopic and hydro-chemical evidence on the origin of groundwater through deep-circulation ways in Lake Daihai region, Inner Mongolia plateau. J. Lake Sci. 2013, 25, 521–530, (In Chinese with English Abstract). [Google Scholar]
- Zhai, Z. Environment and Climate Changes since 2100cal. a BP during the Holocene Recorded in Dali-Nor Lake; Inner Mongolia Agricultural University: Hohhot, China, 2016; (In Chinese with English Abstract). [Google Scholar]
- Wang, X.; Wan, L.; Qi, R.; Jiang, X.; Huang, J.; Jing, X.; Liang, S. Interaction between groundwater and vegetation coverage in Ordos Plateau. Quat. Res. 2014, 34, 13–24. [Google Scholar]
- Xing, L.; Song, L. National Geography of China: Wild Birds of Dalinor; Encyclopedia of China Publishing House: Beijing, China, 2014. (In Chinese) [Google Scholar]
- Feng, H.; Zou, B.; Luo, J. Coverage-dependent amplifiers of vegetation change on global water cycle dynamics. J. Hydrol. 2017, 550, 220–229. [Google Scholar] [CrossRef]
- Liu, X. The Research of the Relationship between Water Isotopes and Water Quality in the Dalinuoer Lake; Inner Mongalia Agriculture University: Hohhot, China, 2015; pp. 47–48, (In Chinese with English Abstract). [Google Scholar]
- Banks, E.W.; Brunner, P.; Simmons, C.T. Vegetation controls on variably saturated processes between surface water and groundwater and their impact on the state of connection. Water Resour. Res. 2011, 47, 178–186. [Google Scholar] [CrossRef]
- Li, H.; Shen, W.; Zou, C.; Jiang, J.; Fu, L.; She, G. Spatio-temporal variability of soil moisture and its effect on vegetation in a desertified aeolian riparian ecotone on the Tibetan Plateau, China. J. Hydrol. 2013, 479, 215–225. [Google Scholar] [CrossRef]
- Balugania, E.; Lubczynskia, M.W.; Reyes-Acostaab, L.; van der Tola, C.; Francésa, A.P.; Metselaar, K. Groundwater and unsaturated zone evaporation and transpiration in a semi-arid open woodland. J. Hydrol. 2017, 547, 54–66. [Google Scholar] [CrossRef]
- Wang, X.; Hu, C.; Li, G.; Zuo, H. Analysis on the factors affecting seed dispersal and seedling survival rate of Ulmus pumila var. sabulosa in the Otindag Sandy Land. Arid Zone Res. 2011, 28, 542–547, (In Chinese with English Abstract). [Google Scholar]
- Li, H.; Shen, W.; Bian, F. Damages to Eco-Environment Caused by Mineral Resources Exploitation in West China and Supervisary Countermeasures. J. Ecol. Rural Environ. 2016, 32, 345–350, (In Chinese with English Abstract). [Google Scholar]
- Wu, Y.; Shi, X.; Zhao, S.; Lin, T.; Ma, J. Major Ion Chemistry and Influencing Factors of Three Typical Lakes in Inner Mongolia Plateau. Ecol. Environ. Sci. 2015, 24, 1202–1208. [Google Scholar]
- Li, H.; Shen, W.; Liu, H.; Zhao, T. State, Problems and Countermeasures of Climate Change Risk Management at Nature Reserve in China. World For. Res. 2015, 28, 68–72, (In Chinese with English Abstract). [Google Scholar]
- Li, H.; Jiang, J.; Chen, B.; Li, Y.; Xu, Y.; Shen, W. Pattern of NDVI-based vegetation greening along an altitudinal gradient in the eastern Himalayas and its response to global warming. Environ. Monit. Assess. 2016, 188, 186. [Google Scholar] [CrossRef] [PubMed]
Figure 1.
Signs of: lake shrinkage (a); and land salinization (b) in the DNR in 2014; and lake-based ecosystem on lake coastal zone (c); and vegetation coverage on sandy land (d) in the Dalinor basin in 2016.
Figure 1.
Signs of: lake shrinkage (a); and land salinization (b) in the DNR in 2014; and lake-based ecosystem on lake coastal zone (c); and vegetation coverage on sandy land (d) in the Dalinor basin in 2016.

Figure 2.
The location of the Dalinor Basin in Inner Mongolia, China: (a) topographic characteristics of the Dalinor Basin; and (b) spatio-temporal changes of inland lakes in the Dalinor National Nature Reserve during 1976–2015. The remote sensing image is Landsat 8 OLI (30-m resolution) obtained on 13 September 2015 (c).

Figure 3.
Changes of: total lake-area (a); Dalinor Lake (b); Gangnor Lake (c) and Duolunor Lake (d), in the DNR during 1976–2015.
Figure 3.
Changes of: total lake-area (a); Dalinor Lake (b); Gangnor Lake (c) and Duolunor Lake (d), in the DNR during 1976–2015.

Figure 4.
Changes in NDVI in the Dalinor basin during 1976–2015.

Figure 5.
Changes of: annual mean temperature (a); and annual precipitation (b) around the Dalinor basin during 1976–2015.
Figure 5.
Changes of: annual mean temperature (a); and annual precipitation (b) around the Dalinor basin during 1976–2015.


Table 1.
The basic information of Landsat images during 1976–2015.
| Year | Sensor | Date | Cloud Cover (%) | Year | Sensor | Date | Cloud Cover (%) |
|---|---|---|---|---|---|---|---|
| 1976 | MSS | 3 September 1976 | 0.00 | 1996 | TM | 9 September 1996 | 0.00 |
| 1977 | MSS | 9 August 1977 | 0.34 | 1997 | TM | 11 September 1997 | 0.00 |
| 1978 | MSS | 19 July 1978 | 0.00 | 1998 | TM | 14 September 1998 | 0.00 |
| 1979 | MSS | 11 August 1979 | 0.00 | 1999 | TM | 11 September 1999 | 0.00 |
| 1980 | MSS | 26 September 1980 | 0.00 | 2000 | TM | 15 September 2000 | 0.00 |
| 1981 | MSS | 17 August 1981 | 0.00 | 2001 | ETM+ | 5 July 2001 | 0.00 |
| 1982 | MSS | 5 September 1982 | 0.00 | 2002 | TM | 7 July 2002 | 1.00 |
| 1983 | MSS | 11 July 1983 | 1.00 | 2003 | TM | 23 May 2003 | 0.00 |
| 1984 | MSS | 15 August 1984 | 0.00 | 2004 | TM | 14 August 2004 | 0.00 |
| 1985 | MSS | 2 September 1985 | 0.00 | 2005 | TM | 1 September 2005 | 0.00 |
| 1986 | MSS | 20 August 1986 | 0.00 | 2006 | TM | 20 September 2006 | 0.00 |
| 1987 | MSS | 16 September 1987 | 0.00 | 2007 | TM | 7 September 2007 | 0.00 |
| 1988 | MSS | 19 September 1988 | 0.00 | 2008 | TM | 26 September 2008 | 0.00 |
| 1989 | MSS | 21 September 1989 | 0.00 | 2009 | TM | 26 September 2009 | 0.43 |
| 1990 | MSS | 8 August 1990 | 0.00 | 2010 | TM | 31 August 2010 | 0.12 |
| 1991 | TM | 27 September 1991 | 0.00 | 2011 | TM | 9 July 2011 | 0.22 |
| 1992 | TM | 14 September 1992 | 0.00 | 2012 | ETM+ | 27 July 2012 | 1.00 |
| 1993 | TM | 16 September 1993 | 0.00 | 2013 | OLI | 23 September 2013 | 0.42 |
| 1994 | TM | 2 August 1994 | 0.00 | 2014 | OLI | 25 August 2014 | 0.32 |
| 1995 | TM | 20 July 1995 | 0.00 | 2015 | OLI | 13 September 2015 | 0.04 |
Table 2.
The correlation coefficient and relational degree between lake-area, NDVI, and climatic factors, respectively in the DNR.
Table 2.
The correlation coefficient and relational degree between lake-area, NDVI, and climatic factors, respectively in the DNR.
| Period | Lake-Area | NDVI | Climatic Factors | |
|---|---|---|---|---|
| Annual Mean Temperature | Annual Precipitation | |||
| 1976–2015 | The DNR | −0.397 */0.648 | −0.015/0.695 | 0.227/0.734 |
| Dalinor Lake | −0.415 **/0.647 | −0.034/0.698 | 0.236/0.742 | |
Notes: ** p < 0.01, * p < 0.05. The number before the symbol “/” indicates the correlation coefficient, the number following by indicates the relational degree.
© 2017 by the authors. Licensee MDPI, Basel, Switzerland. This article is an open access article distributed under the terms and conditions of the Creative Commons Attribution (CC BY) license (http://creativecommons.org/licenses/by/4.0/).
Share and Cite
MDPI and ACS Style
Li, H.; Gao, Y.; Li, Y.; Yan, S.; Xu, Y. Dynamic of Dalinor Lakes in the Inner Mongolian Plateau and Its Driving Factors during 1976–2015. Water 2017, 9, 749. https://doi.org/10.3390/w9100749
AMA Style
Li H, Gao Y, Li Y, Yan S, Xu Y. Dynamic of Dalinor Lakes in the Inner Mongolian Plateau and Its Driving Factors during 1976–2015. Water. 2017; 9(10):749. https://doi.org/10.3390/w9100749
Chicago/Turabian StyleLi, Haidong, Yuanyun Gao, Yingkui Li, Shouguang Yan, and Yuyue Xu. 2017. "Dynamic of Dalinor Lakes in the Inner Mongolian Plateau and Its Driving Factors during 1976–2015" Water 9, no. 10: 749. https://doi.org/10.3390/w9100749
Note that from the first issue of 2016, this journal uses article numbers instead of page numbers. See further details here.