A Keystone Methylobacterium Strain in Biofilm Formation in Drinking Water


School of Engineering, College of Science and Engineering, University of Glasgow, Glasgow G12 8LT, UK
*
Author to whom correspondence should be addressed.
Water 2017, 9(10), 778; https://doi.org/10.3390/w9100778
Submission received: 31 August 2017
/
Revised: 17 September 2017
/
Accepted: 9 October 2017
/
Published: 12 October 2017
(This article belongs to the Special Issue Biofilm Formation on Membranes in Water and Wastewater Treatment)
Abstract
:The structure of biofilms in drinking water systems is influenced by the interplay between biological and physical processes. Bacterial aggregates in bulk fluid are important in seeding biofilm formation on surfaces. In simple pure and co-cultures, certain bacteria, including Methylobacterium, are implicated in the formation of aggregates. However, it is unclear whether they help to form aggregates in complex mixed bacterial communities. Furthermore, different flow regimes could affect the formation and destination of aggregates. In this study, real drinking water mixed microbial communities were inoculated with the Methylobacterium strain DSM 18358. The propensity of Methylobacterium to promote aggregation was monitored under both stagnant and flow conditions. Under stagnant conditions, Methylobacterium enhanced bacterial aggregation even when it was inoculated in drinking water at 1% relative abundance. Laminar and turbulent flows were developed in a rotating annular reactor. Methylobacterium was found to promote a higher degree of aggregation in turbulent than laminar flow. Finally, fluorescence in situ hybridisation images revealed that Methylobacterium aggregates had distinct spatial structures under the different flow conditions. Overall, Methylobacterium was found to be a key strain in the formation of aggregates in bulk water and subsequently in the formation of biofilms on surfaces.
Keywords:
Methylobacterium; drinking water; aggregates; biofilms; microcolonies; stagnant; laminar; turbulent1. Introduction
The formation of biofilms on pipe walls is controlled by physical, biological, and chemical processes [1]. One important biological process is bacterial aggregation, where microorganisms interact with each other, forming a cluster that is free-floating and can be attached to a substratum as part-of or a precursor-to a biofilm [2]. This adhesion mechanism has been suggested to influence the formation of complex multi-species biofilms in several diverse habitats [3]. Aggregation conveys many advantages to microorganisms in drinking water systems, such as enhanced transfer of chemical signals, exchange of genetic information, protection against harsh conditions, and metabolic cooperation [4].
Among culturable bacteria, the most commonly found genera in drinking water are Pseudomonas [5,6,7,8,9,10,11], Sphingomonas [4,6,7,8,10,12], Methylobacterium [4,6,7,8,12], Aeromonas [8,13], and Acinetobacter [5,6,8]. A small number of species, such as the Methylobacterium species [12], Acinetobacter calcoaceticus [4], and Mycobacterium species [12,14] have been implicated in promoting aggregation in pure or simple mixed cultures. Species of Methylobacterium are found in a wide variety of environments, such as soil, dust, freshwater, lake sediments, leaf surfaces, air, root nodules, rice grains, and hospital environments [15]. They exhibit resistance to chlorination in drinking water, which might explain their prevalence in domestic water-associated environments, such as drinking water distribution systems, shower curtains, and showerhead biofilms [16,17]. They are classified as opportunistic pathogens in clinical settings, such as dental water lines, blood bank purification units and urinary units, causing serious threat to ill patients [18]. It has been shown that Methylobacterium species belong to the group of amoeba-resisting bacteria in drinking water [19] and that their presence in taps and showerheads inhibits the presence of Mycobacterium species, which are opportunistic pathogens in household, hospital plumbing, and in instruments with water reservoirs [17]. Here, it is hypothesised that the Methylobacterium strain DSMZ (Deutsche Sammlung von Mikroorganismen und Zellkulturen) 18358 is capable of promoting aggregation not only in dual cultures but also in complex mixed drinking water microbial communities. To test this hypothesis, this Methylobacterium strain was inoculated at a relative abundance of 1% into drinking water under stagnant conditions.
Evidence from the freshwater environment has shown that at higher shear rates, a higher number of autoaggregating bacteria (same species) was found. Also, at intermediate shear rates it was shown that a higher number of coaggregating bacteria (different species) occurred. This showed that autoaggregation interactions were stronger than coaggregation interactions at high shear rates. Within these autoaggregating and coaggregating bacteria, there were species of Methylobacterium with a high visual score [14]. It has been suggested that there is an “on and off” switching of the coaggregation ability of bacteria in the freshwater environment and that could indicate some form of environmental control of this coaggregation process through starvation and stress [20]. If flow dependence with aggregation does exist in oligotrophic stressful conditions, like that of complex mixed drinking water microbial communities, then perhaps the interaction between the aggregation ability of the Methylobacterium and the flow regime is critical for biofilm formation. To investigate the influence of flow regime, the Methylobacterium strain DSM 18358 was inoculated at a relative abundance of 1% into drinking water under laminar and turbulent flow conditions.
The development of methods in order to study multi-species biofilms has allowed the identification of the various architectures and compositions of a biofilm [21]. Fluorescence in situ hybridisation (FISH) is an effective and simple technique based on specific probes, which anneal to specific target sequences of samples. Also, fluorescent reporter molecules are attached to the probes. This technique has been used for the detection of the presence of chromosomal abnormalities due to its high sensitivity and specificity and has provided significant advances in the research of leukaemia [22,23]. This method extends fluorescence microscopy and allows for the fast detection and enumeration of specific microorganisms. It has been successfully used to characterise microorganisms within biofilms and to detect pathogens in drinking water [24]. A limitation of the method is that, when it is used to detect cells with low ribosomal content, an increased sensitivity must be obtained. Low ribosomal content is often seen in organisms of oligotrophic environments such as drinking water [25].
The use of FISH in order to characterise structures of bacteria in drinking water is rare [26]. Most often, DAPI staining [4] and catalysed reporter deposition-FISH (CARD-FISH) are used [24,25,27,28,29]. However, FISH has been used to detect Methylobacterium in various environments, such as plants [30] and bathrooms [31]. Here, the spatial structure of Methylobacterium in relation to the rest of the bacterial population under stagnant, laminar, and turbulent flow conditions was assessed using FISH. This technique allowed us to visualise the Methylobacterium strain DSM 18358 and the total bacterial cells in the bulk water and on the exposed surfaces. Thus, the aggregation ability of the Methylobacterium and its effect on the structures of the total bacterial population could be characterised.
2. Materials and Methods
2.1. Methylobacterium Culture
The Methylobacterium strain DSM 18358 was chosen for experimental analysis in this study. This strain was previously isolated from a drinking water network in Seville, Spain [15]. The culture received from DSMZ (Leibniz-Institute, Braunschweig, Germany) was first reactivated [32] and Methylobacterium was then cultured in R2A agar plates at 28 °C in the incubator for 72 h [16]. A colony, which was created by streaking on the agar plates [33], was inoculated into 10 mL R2A medium [12], and incubated at 28 °C at 150 rpm speed for 72 h [16]. The R2A is a low-nutrient medium, which has been used for viable bacterial count and isolation of bacteria from drinking water [34,35,36] like Methylobacterium [37,38]. The specific growth rate was calculated at 0.17 ± 0.02 h−1 and the doubling time was calculated at 4.24 ± 0.42 h. In this way, the Methylobacterium inoculum was prepared for our experiments.
To inoculate the Methylobacterium strain DSM 18358 in drinking water it was necessary to conduct cell count measurements of the pure culture at the exponential phase of growth. For these measurements, samples of 5 mL of the pure culture were filtered through 47 mm Whatman® 0.2 μm membrane filters (Sigma-Aldrich, Gillingham, UK) after they were fixed with 0.5 mL of 2% formaldehyde [39]. The filter paper pieces were then covered with 1 mL of 0.1% Triton X-100 solution (ThermoFisher Scientific, Loughborough, UK) in order to evenly disperse the cells. The cells were then stained with 1 mL of 10 μg/mL DAPI (ThermoFisher Scientific, Loughborough, UK) for 20 min in the dark and then visualised using fluorescence microscopy. All colony and cell count measurements were performed in triplicate. The Methylobacterium cells were then visualised under a 100× objective lens (UPlanFLN, Tokyo, Japan) using the Image Pro Plus 7.0 software. The cell concentrations after 6, 10.5, and 15 h of growth were found to be (1 ± 0.3) × 108, (3.2 ± 0.8) × 108 and (10 ± 3) × 108 cells/mL, respectively.
2.2. Drinking Water Culture
Drinking water was sampled from a domestic tap in Glasgow early in the morning after flushing the tap for 10 min. The drinking water treatment plant, which supplies water to the location from which the water was sampled, uses surface water as its source. The treatment steps that are followed in this treatment plant are: coagulation, rapid gravity filtration, chlorine disinfection, and orthophosphate dosing. The tap was flushed prior to sampling to avoid the effects of water stagnation in the premise plumbing at the sampling point [40]. The concentration of total chlorine of the drinking water sampled from the tap was measured immediately after its sampling using the USEPA DPD Method 8167 and a colorimeter (DR 900 Hach, Loveland, CO, USA) and was found to be 0.36 mg/L [41]. This high chlorine concentration was expected since the treatment plant is very close to the sampling point: approximately 6 km away. Chlorine concentration is expected to be lower if the sampling point is far from the treatment plant due to the reactions of chlorine with the network materials. This would result in higher number of bacteria in the sampled tap water, higher water temperature, and the formation of trihalomethanes from chlorine and precursor materials [42]. The density of bacteria in the drinking water was low. It was determined at (4.9 ± 1.5) × 105 cells/mL as described previously. To increase the density and, hopefully, the likelihood of seeing aggregation events, the samples were enriched with cells; this was achieved by adding glucose to the drinking water. Bacterial growth was achieved through the inoculation of 5% glucose in 10 mL drinking water [43]. Liquid cultures were incubated at 28 °C at 150 rpm for 72 h, as with the Methylobacterium pure culture. In order to ensure that the drinking water cultures were successfully enriched with cells by the addition of glucose, the optical density (OD) was monitored every 3 h for 72 h in total and the specific growth rate and doubling time were then calculated [12] in the same way as with the Methylobacterium pure culture. Then, in order to conduct the inoculation experiments it was necessary to measure the cell concentration of the drinking water culture at the exponential phase of growth. This was measured using fluorescence microscopy as described previously. The specific growth rate was calculated at 0.18 ± 0.02 h−1 and the doubling time was calculated at 3.96 ± 0.40 h [12]. The cell concentrations of the culture at the exponential phase of growth were found after 15, 19.5, and 24 h of growth to be (1.2 ± 0.8) × 108, (3.8 ± 1.2) × 108 and (9.2 ± 0.6) × 108 cells/mL, respectively [44].
2.3. Inoculation of Methylobacterium into Drinking Water
The drinking water culture without the addition of Methylobacterium is described as “control” culture, and the drinking water culture with the addition of Methylobacterium is described as “inoculated” culture. For both control and inoculated cultures, drinking water cells were harvested from the enriched cell drinking water culture that was at the exponential phase of growth (so that the cells are active) by centrifugation for 20 min at 13,000× g speed, washed 3 times in 0.1 M of phosphate-buffered saline [12], and re-suspended in 10 mL of drinking water that was sampled again from the domestic tap in Glasgow. For the inoculated culture, Methylobacterium cells were harvested from the pure Methylobacterium culture that was at the exponential phase of growth and re-suspended in the 10 mL of drinking water.
The relative abundances at which the Methylobacterium strain DSM 18358 was inoculated into the drinking water were 1%, 10%, and 20%. This was decided because, for species that are rare, their relative abundances are within the range of 0.1% to 1% [45]. Thus, a relative abundance of a strain at 1% is considered to be a low abundance in a mixed population. Also, Methylobacterium species have been found to be present in drinking water in the United Kingdom [46,47] but they have not been found to be abundant in Glasgow tap water [40]. Here, only the case in which Methylobacterium was inoculated at the lowest relative abundance of 1% is reported. This is because it is a more realistic concentration for a strain in drinking water and it was found that there were modest differences in aggregation for the successive relative abundances of 1–10% and 10–20%, so the behaviour of Methylobacterium was qualitatively the same. Thus, the discernible effects that are described below are adequately demonstrated with the lowest inoculated level, 1%, of Methylobacterium.
2.4. Stagnant Conditions
Both control and inoculated cultures were placed in BRAND® culture tubes (Sigma Aldrich, Gillingham, UK) and incubated at 28 °C, as this was the optimal growth temperature for Methylobacterium [16]. After 24, 48, and 72 h aggregation analysis was carried out [48]. Firstly, aggregation scores were recorded by visual observation of the different liquid cultures [14]. The cultures were homogenised in vortex for 10 s and then rolled gently for 30 s before determining the scores. For the visual aggregation assay the scoring criteria were as follows: 0 for no aggregates in suspension; 1 for small uniform aggregates in a turbid suspension; 2 for easily visible aggregates in a turbid suspension; 3 for clearly visible aggregates which settle, leaving a clear supernatant; and, finally, 4 for large flocs of aggregates that settle almost instantaneously, leaving a clear supernatant.
The liquid cultures were then filtered on gridded membrane filters (cellulose nitrate filters of 0.2 μm pore size with 3 mm2 squares, Sartorius, Surrey, UK). The number of aggregates was determined visually on the membrane filters. The size of aggregates was measured as the product of the length and width of the aggregates on the membrane filters. From the number and size of aggregates, the surface area that the aggregates occupied on the membrane filters was calculated. For each of those measurements, triplicates of samples were used.
2.5. Flow Conditions
Bacterial aggregation in the bulk water of the reactor was studied at 0, 24, 48, and 72 h, and the subsequent initial biofilm formation on the slides of the reactor at 24, 48, and 72 h in turbulent and laminar flows. A jacketed rotating annular reactor (RAR; model 1320 LJ, BioSurface Technologies, Bozeman, MT, USA) was used in order to develop the flow conditions. The reactor held 20 removable polycarbonate slides, which were attached to its inner drum. The polycarbonate material was chosen as one of the plastic materials used in drinking water systems, which does not have a rough surface of corroded material [49]. The jacket allowed the temperature to be maintained at 16 °C, via cooled water from a bath circulator (Isotemp Bath Circulator, Fisher Scientific, Loughborough, UK); this is the representative temperature of drinking water systems in the United Kingdom for spring and summer [50]. The reactor was covered with aluminium foil in order to achieve dark conditions for biofilm growth.
This reactor was used to simulate flow conditions similar to those in a pipe with a radius equal to the gap between the two cylinders of the reactor, and mean velocity equal to the mean velocity of the reactor. The inner drum of the reactor was rotated at two different speeds to induce Taylor–Couette flows [51]: at 30 rpm (the Reynolds number, Re = 960 and the Taylor number, Ta = 233), which corresponds to laminar flow; and at 217 rpm (Re = 6800 and Ta = 1682), which corresponds to turbulent flow. These two conditions in the reactor correspond to flow conditions of a pipe with a diameter of 30.3 mm: of average velocity at 0.03 m/s and shear stress at the wall at 0.007 N/m2, and average velocity at 0.25 m/s and shear stress at the wall at 0.07 N/m2, respectively [52,53]. The choice of the diameter of the pipe at 30.3 mm is acceptable for drinking water pipes at the extremities where the service lines start [14,54]. In those parts of drinking water distribution systems (DWDS) the control of flow conditions is very important as the disinfectant residual has been depleted and microbial activities are higher than in the mains of DWDS [55]. Also, the conditions in service lines are characterised by longer residence times, higher stagnation periods, reduced flow rates and higher temperatures compared to the mains [56]. The reactor was filled with only one litre of drinking water that was sampled from the domestic tap in Glasgow. In order to create the control and the inoculated drinking water cultures in the reactor, the same process described earlier was followed. The concentration of cells in the bulk water and on the reactor slides was determined using fluorescence microscopy (Olympus IX71, Tokyo, Japan) and was found to be (5.1 ± 2.3) × 108 cells/mL and (5.3 ± 2.2) × 105 cells/cm2, respectively.
The concentration of microcolonies of 5 mL liquid samples was determined by fluorescence microscopy using the 100× magnification, as described earlier for the concentration of cells. The microcolonies had a diameter of approximately 10 μm, indicating that they were formed of approximately 10 cells. Also, the number of aggregates from 10 mL liquid samples was determined directly by visual observation after the samples were filtered on cellulose nitrate filters of 0.2 μm pore size with 3 mm2 squares (Sartorius, Surrey, UK). Finally, 5 mL samples were filtered on 47 mm Whatman® 0.2 μm membrane filters (Sigma-Aldrich, Gillingham, UK) and subsequently the surface area that biofilms from the bulk water covered on the membrane filters was determined by fluorescence microscopy using the 1000× magnification. In order to stain the cells of the biofilms, 1 mL of 10 μg/mL of DAPI was used; in order to stain the extracellular polymeric substances (EPS) of the biofilms, 1 mL of 10 μg/mL of fluorescein Aleuria aurantia lectin (Vector laboratories, Peterborough, UK) was used [57]. The composite image of biofilms was created using the Matlab command called “imfuse”. The percentages of surface area of biofilms were calculated in Matlab by processing 30 microscopy images. The original images were firstly converted to grey-scale images and then to binary images in order to separate the biomaterial from the background. For each measurement, triplicates of samples were used.
The number of microcolonies that were attached on the reactor slides was calculated directly on the slides of the reactor by fluorescence microscopy using the 100× magnification after the samples were fixed with 0.5 mL of 4% paraformaldehyde [58]. Also, the number of aggregates was determined directly by visual observation on the reactor slides. Finally, the percentage of surface area that biofilms covered on the reactor slides was calculated by fluorescence microscopy using the 1000× magnification, as described previously. Again, for each measurement triplicates of samples were used.
2.6. Statistical Analysis
All measures were analysed in IBM SPSS Statistics. Statistical calculations were based on the confidence level of 95%, which means that a p value lower than 0.05 was considered statistically significant. For stagnant conditions, all aggregation measures were tested using the Pearson’s chi-squared and Phi and Cramer’s tests. For flow conditions, different tests were used. To compare the measures between the control and inoculated culture the following tests were used: In turbulent flow, for the number of microcolonies in the bulk water and the number of aggregates on the slides, the Kruskal–Wallis test, and the one-way ANOVA test in conjunction with the Tukey’s and Duncan–Waller’s tests were used, respectively. In laminar flow, for both these measures, the Pearson’s Chi-squared and Phi and Cramer’s tests were used. In turbulent flow, for the surface area of biofilms from the bulk water the one-way ANOVA test in conjunction with the Tukey’s and Duncan–Waller’s tests were used. To compare the measures between the turbulent and laminar flow, the following tests were used: To compare the microcolonies in the bulk water the Pearson’s Chi-squared and Phi and Cramer’s tests were used. Also, to compare the aggregates on the reactor slides and the surface area of biofilms from the bulk water, the one-way ANOVA test in conjunction with the Tukey’s and Duncan–Waller’s tests were followed. Finally, to compare the measures between the different time periods the following tests were used: In laminar flow, the Pearson’s Chi-squared and Phi and Cramer’s tests were used. In turbulent flow, for the microcolonies in the bulk water and the aggregates on the slides, the Pearson’s Chi-squared and Phi and Cramer’s tests were used, and for the surface area of biofilms from the bulk water, the Kruskal–Wallis test was used.
2.7. Polymerase Chain Reaction
To conduct FISH it was necessary firstly to perform polymerase chain reaction (PCR) in order to use a PCR primer specific to Methylobacterium DSM 18358 for the hybridisation step. For PCR, genomic DNA was extracted from the pure Methylobacterium culture that was at the exponential phase of growth at a series of different OD values using the Maxwell® 16 LEV Blood DNA kit and quantified based on the Qubit® DNA assay using the Qubit® Fluorometer (ThermoFisher Scientific, Loughborough, UK). In order to determine and amplify the DSM 18358 specific DNA, PCR primers were designed and tested to target the 16S rRNA gene for the Methylobacterium strain DSM 18358. The forward primer, MethF (5′-CTT GAG TGT GGT AGA GGT T-3′), targeted the V4 region and the reverse primer, MethR (5′-TGT ATC TCT CCA GGT AAC A-3′), targeted the V5 region. The PCRs were carried out using the Techne TC-5000 gradient thermal cycler (Boulevard, Suffern, NY, US).
To test the primers, the Standard MyTaq Mix Protocol (Bioline) [59] was used with 0.5 μL of 10 μM of each primer, 0.2 μL of 1 U Bioline MyTaqTM DNA polymerase (BIO-21106), 5 μL of 5X MyTaqTM Buffer (containing 5 mM deoxynucleoside triphosphates (dNTPs) and 15 mM magnesium chloride (MgCl2)), and 1 μL of 4.6 ng/μL template DNA in a final volume of 20 μL. This template DNA was derived from a sample from the pure culture with OD quantified at 0.32 and DNA quantified at 46 ng/μL. Triplicates of samples were used in the reactions, including 3 negative controls in which there was no template DNA. The thermal cycler conditions were as follows: 95 °C for 5 min followed by 35 cycles of 95 °C for 15 s, 55 °C for 15 s, and 72 °C for 15 s. The PCR products were finally visualised using agarose gel electrophoresis.
2.8. Characterisation of Aggregates Using FISH
Samples that were analysed using FISH were obtained from the 24 h time point of stagnant conditions, laminar flow, and turbulent flow. The samples under stagnant conditions were liquid samples, whereas those in laminar and turbulent flow included samples from both the bulk water and the slides of the reactor. For the samples that were obtained from the slides of the reactor, all the material was gently scraped from them and then diluted in 10 mL of distilled water. Fluorescent in situ hybridisation was carried out by following the steps described below [60].
All samples were firstly filtered on 47 mm Whatman® 0.2 μm membrane filters (Sigma-Aldrich, Gillingham, UK). Then, they were fixed using 2% paraformaldehyde for 8 h and stored at −20 °C [61]. The samples were dehydrated in an aqueous ethanol dilution series (50, 80, 90–96%) for 3 min each and then the filters were cut into pieces of 2 mm2 squares.
The 16S rRNA V4 region of Methylobacterium strain DSM 18358 was targeted using the forward PCR primer MethF (5′-CTT GAG TGT GGT AGA GGT T-3′). The probe was labelled with digoxigenin (DIG) [62,63]. For the detection of the total bacterial drinking water population the universal 16S rRNA bacterial probe EUB338 (5′-GCT GCC TCC CGT AGG AGT-3′) was used, targeting the 16S rRNA V3 region of all cells [64]. The EUB338 probe was labelled with cyanine dye (CY3) [65]. Both the 5′-DIG labelled probe MethF and the 5′-CY3 labelled probe EUB338 were purchased from Eurofins (Eurofins Scientific, Ebersberg, Germany).
The hybridisation buffer included 5 M sodium chloride (NaCl), 1 M tris-hydrochloride (Tris-HCL) at pH = 8, 30% formamide (CH3NO), and 10% sodium dodecyl sulphate (SDS) at pH = 7.2. Hybridisation was carried out through the addition of 8 μL of hybridisation buffer and 1 μL of 50 ng/μL of each probe to each sample. Samples were hybridised at 46 °C for 2 h in a water circulator (Isotemp Bath Circulator, Fisher Scientific, Loughborough, UK).
Unbound oligonucleotides were removed by rinsing the samples with 2 mL of washing buffer. This buffer included 1 M Tris-HCL at pH = 8, 5 M NaCl, 0.5 M EDTA at pH = 8 and 10% SDS at pH = 7.2. The samples were washed at 48 °C for 15 min in the same water circulator as in the previous step and then deposited on gelatin-coated slides (Marienfeld, Lauda-Königshofen, Germany), which contained 10 reaction wells. The slides were then dried at room temperature, in the dark, overnight. All the DNA of the samples was then stained with 10 μg/mL DAPI for 20 min in the dark. Remaining DAPI solution was removed afterwards by rinsing the slides gently with distilled water. After air drying, cover glasses were mounted with 2 μL of Ever Brite™ mounting medium (Biotium, Cambridge Bioscience, Cambridge, UK). Samples were finally analysed using fluorescence microscopy. The composite images included all 3 staining channels: DAPI for all DNA, Cy3 for all drinking water bacteria, and digoxigenin for the Methylobacterium strain DSM 18358 only. The images were analysed using Matlab whereby the command called “cat” was used that concatenates arrays along a specified dimension.
3. Results
3.1. Influence of Methylobacterium on Aggregation under Stagnant Conditions
The characteristics of the aggregates that were formed under stagnant conditions for the two different drinking water cultures, the control and the inoculated one, are presented in Table 1. Our first critical question was: did the addition of Methylobacterium influence the aggregation in drinking water? Even without adding Methylobacterium, aggregates were formed in drinking water. However, when Methylobacterium was inoculated into the drinking water at 1% relative abundance, all our measures except from the number of aggregates were found to be significantly higher (p < 0.05) in the inoculated than in the control culture. The second question was: did the time period of growth influence the aggregation in drinking water? There were no significant differences in the aggregation between the different time periods of growth at 24, 48, and 72 h for the control and inoculated cultures. These results were found based on all our tested inoculated cultures and not only on the data presented in Table 1 for the lowest inoculated culture.
3.2. Influence of Methylobacterium on Aggregation under Flow Conditions
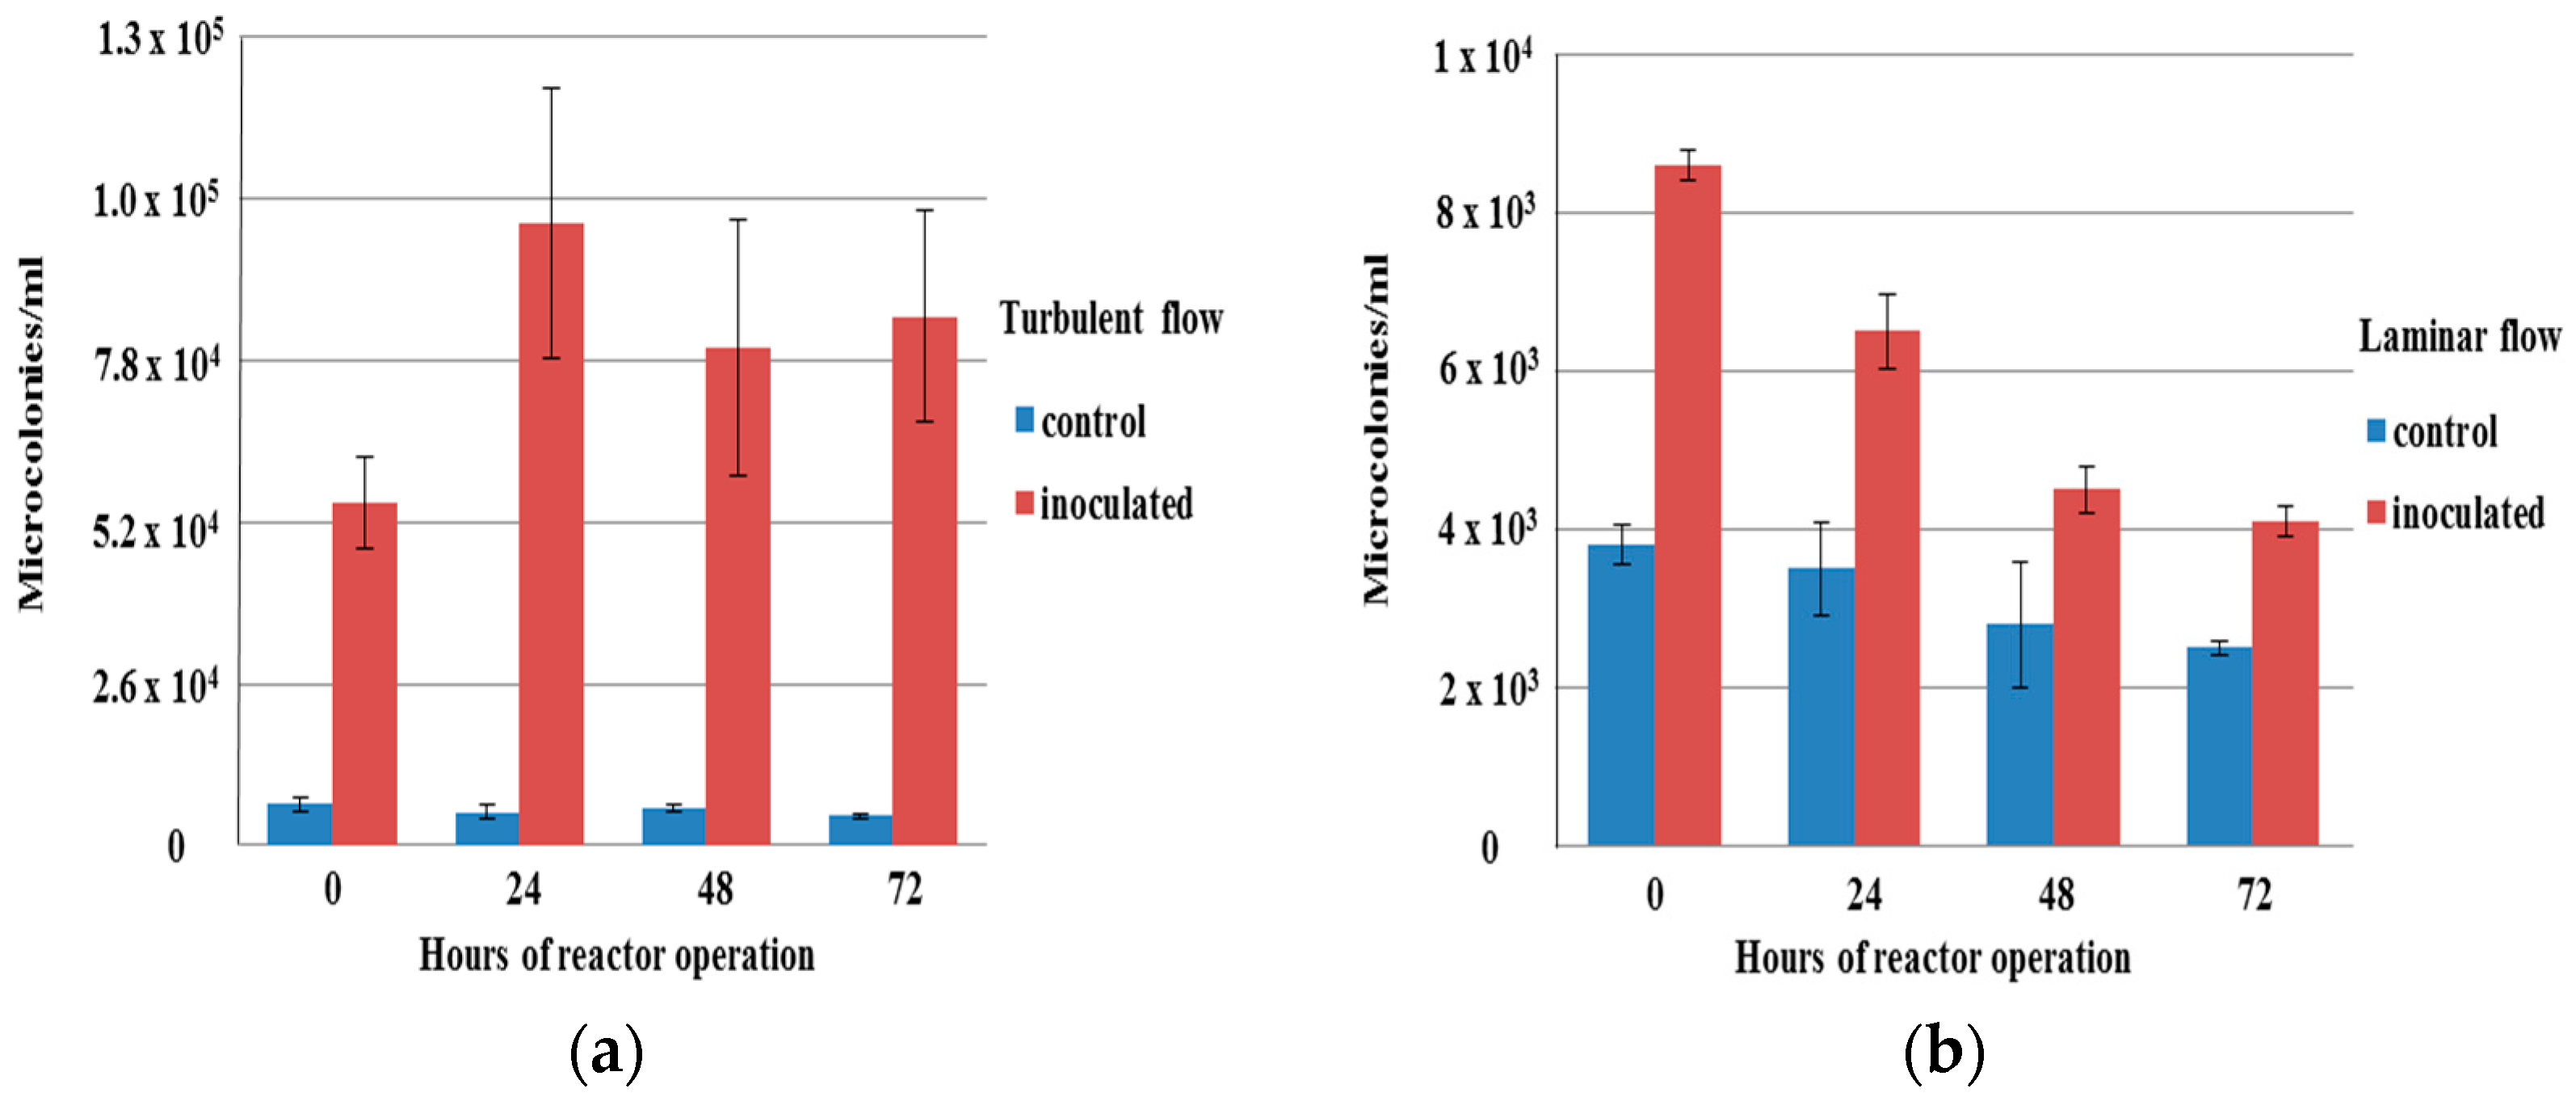
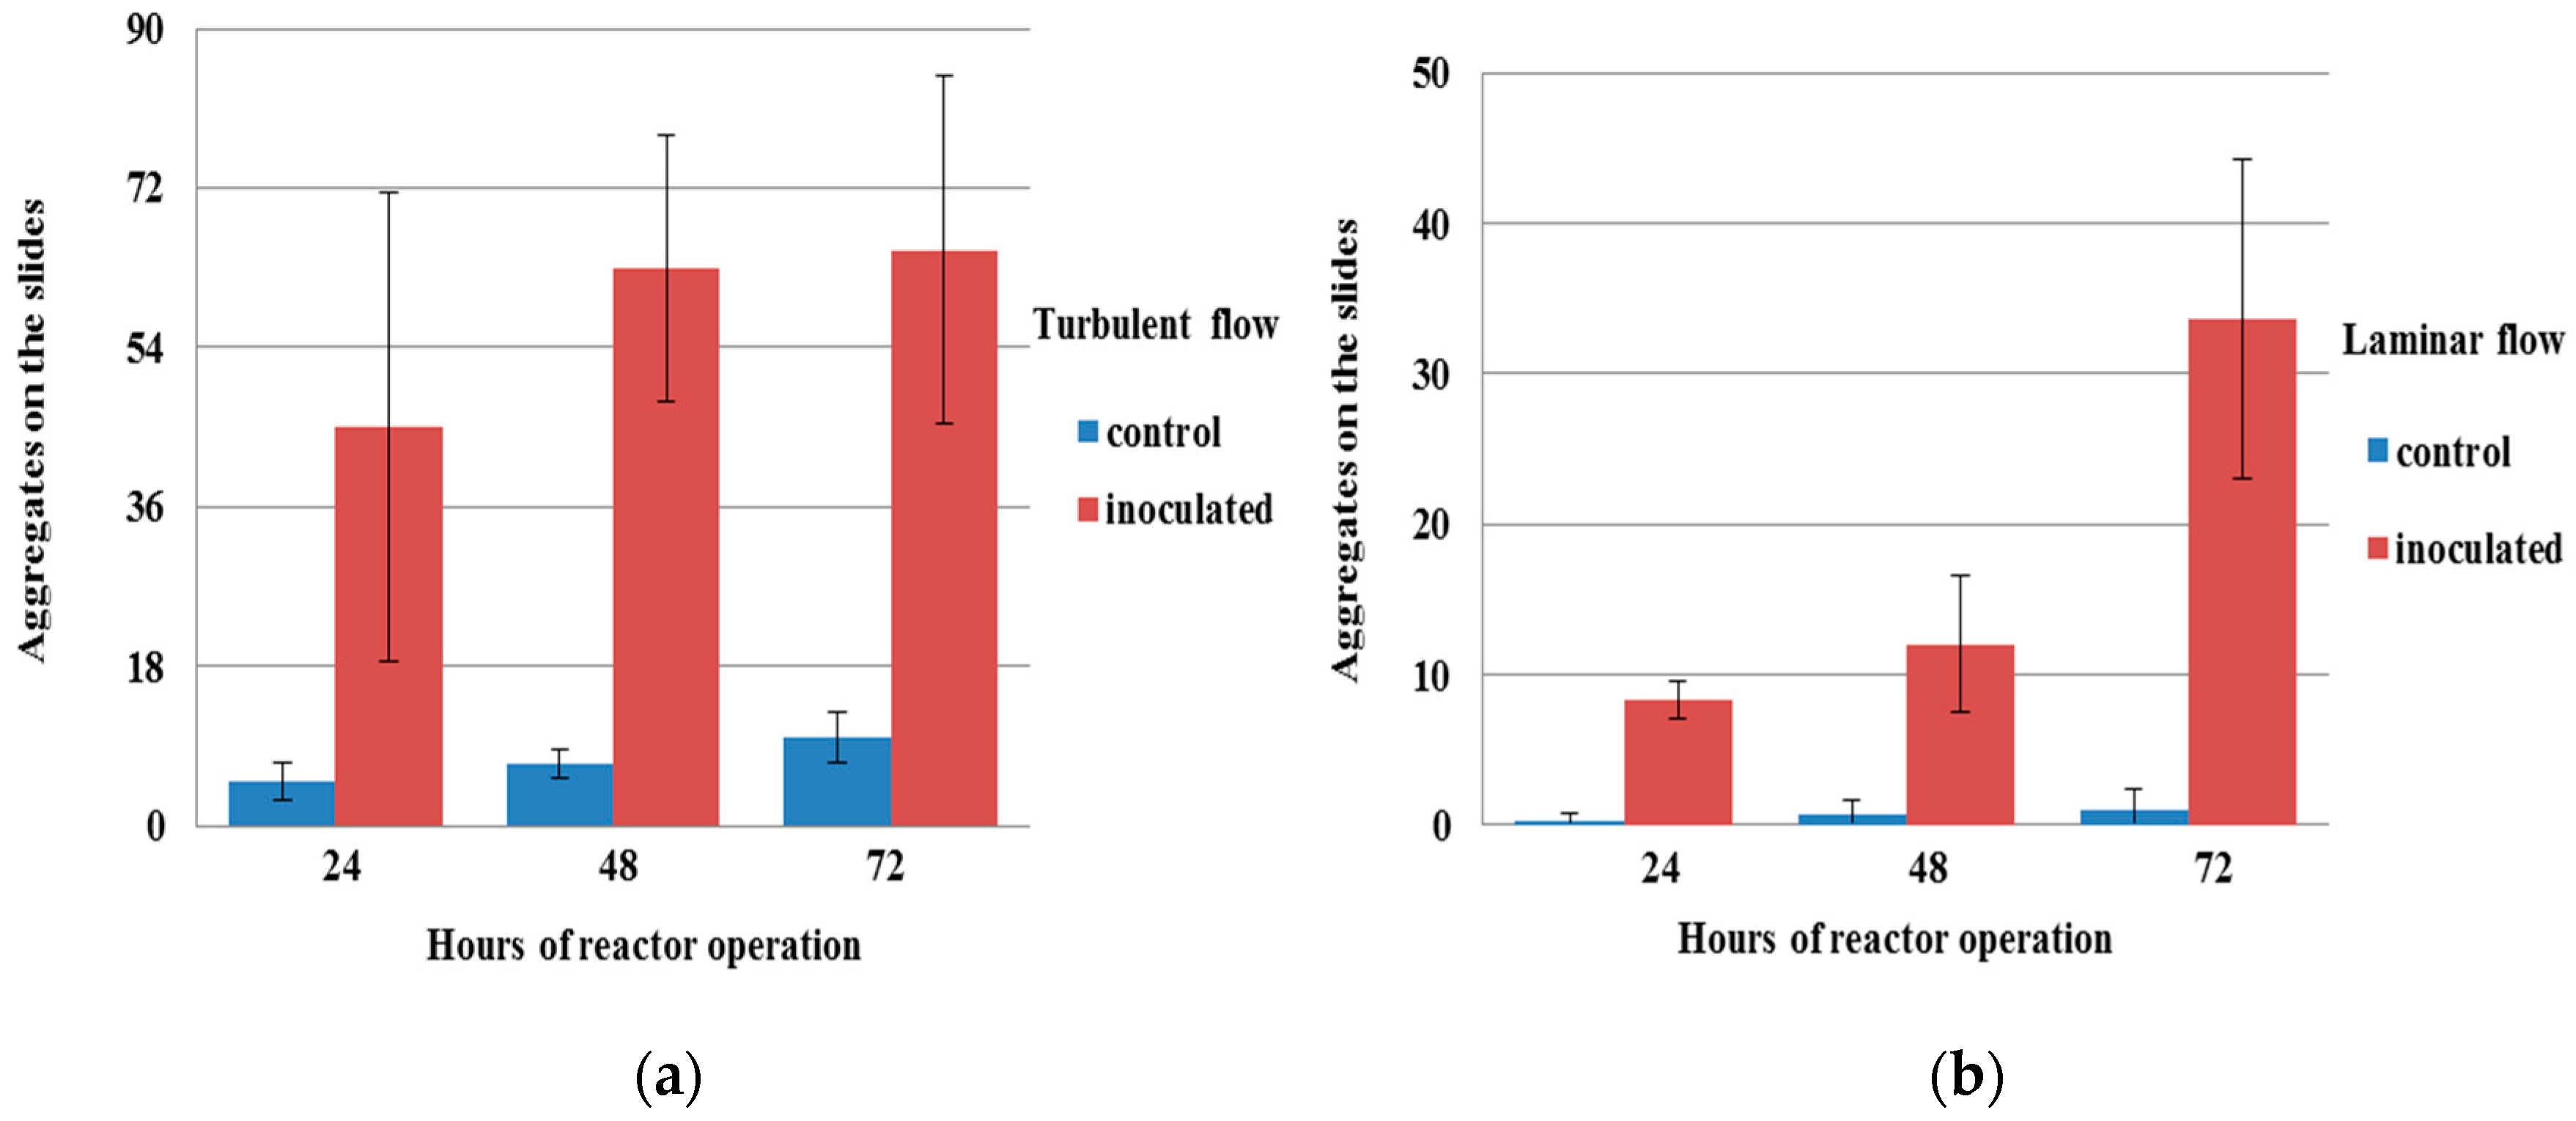
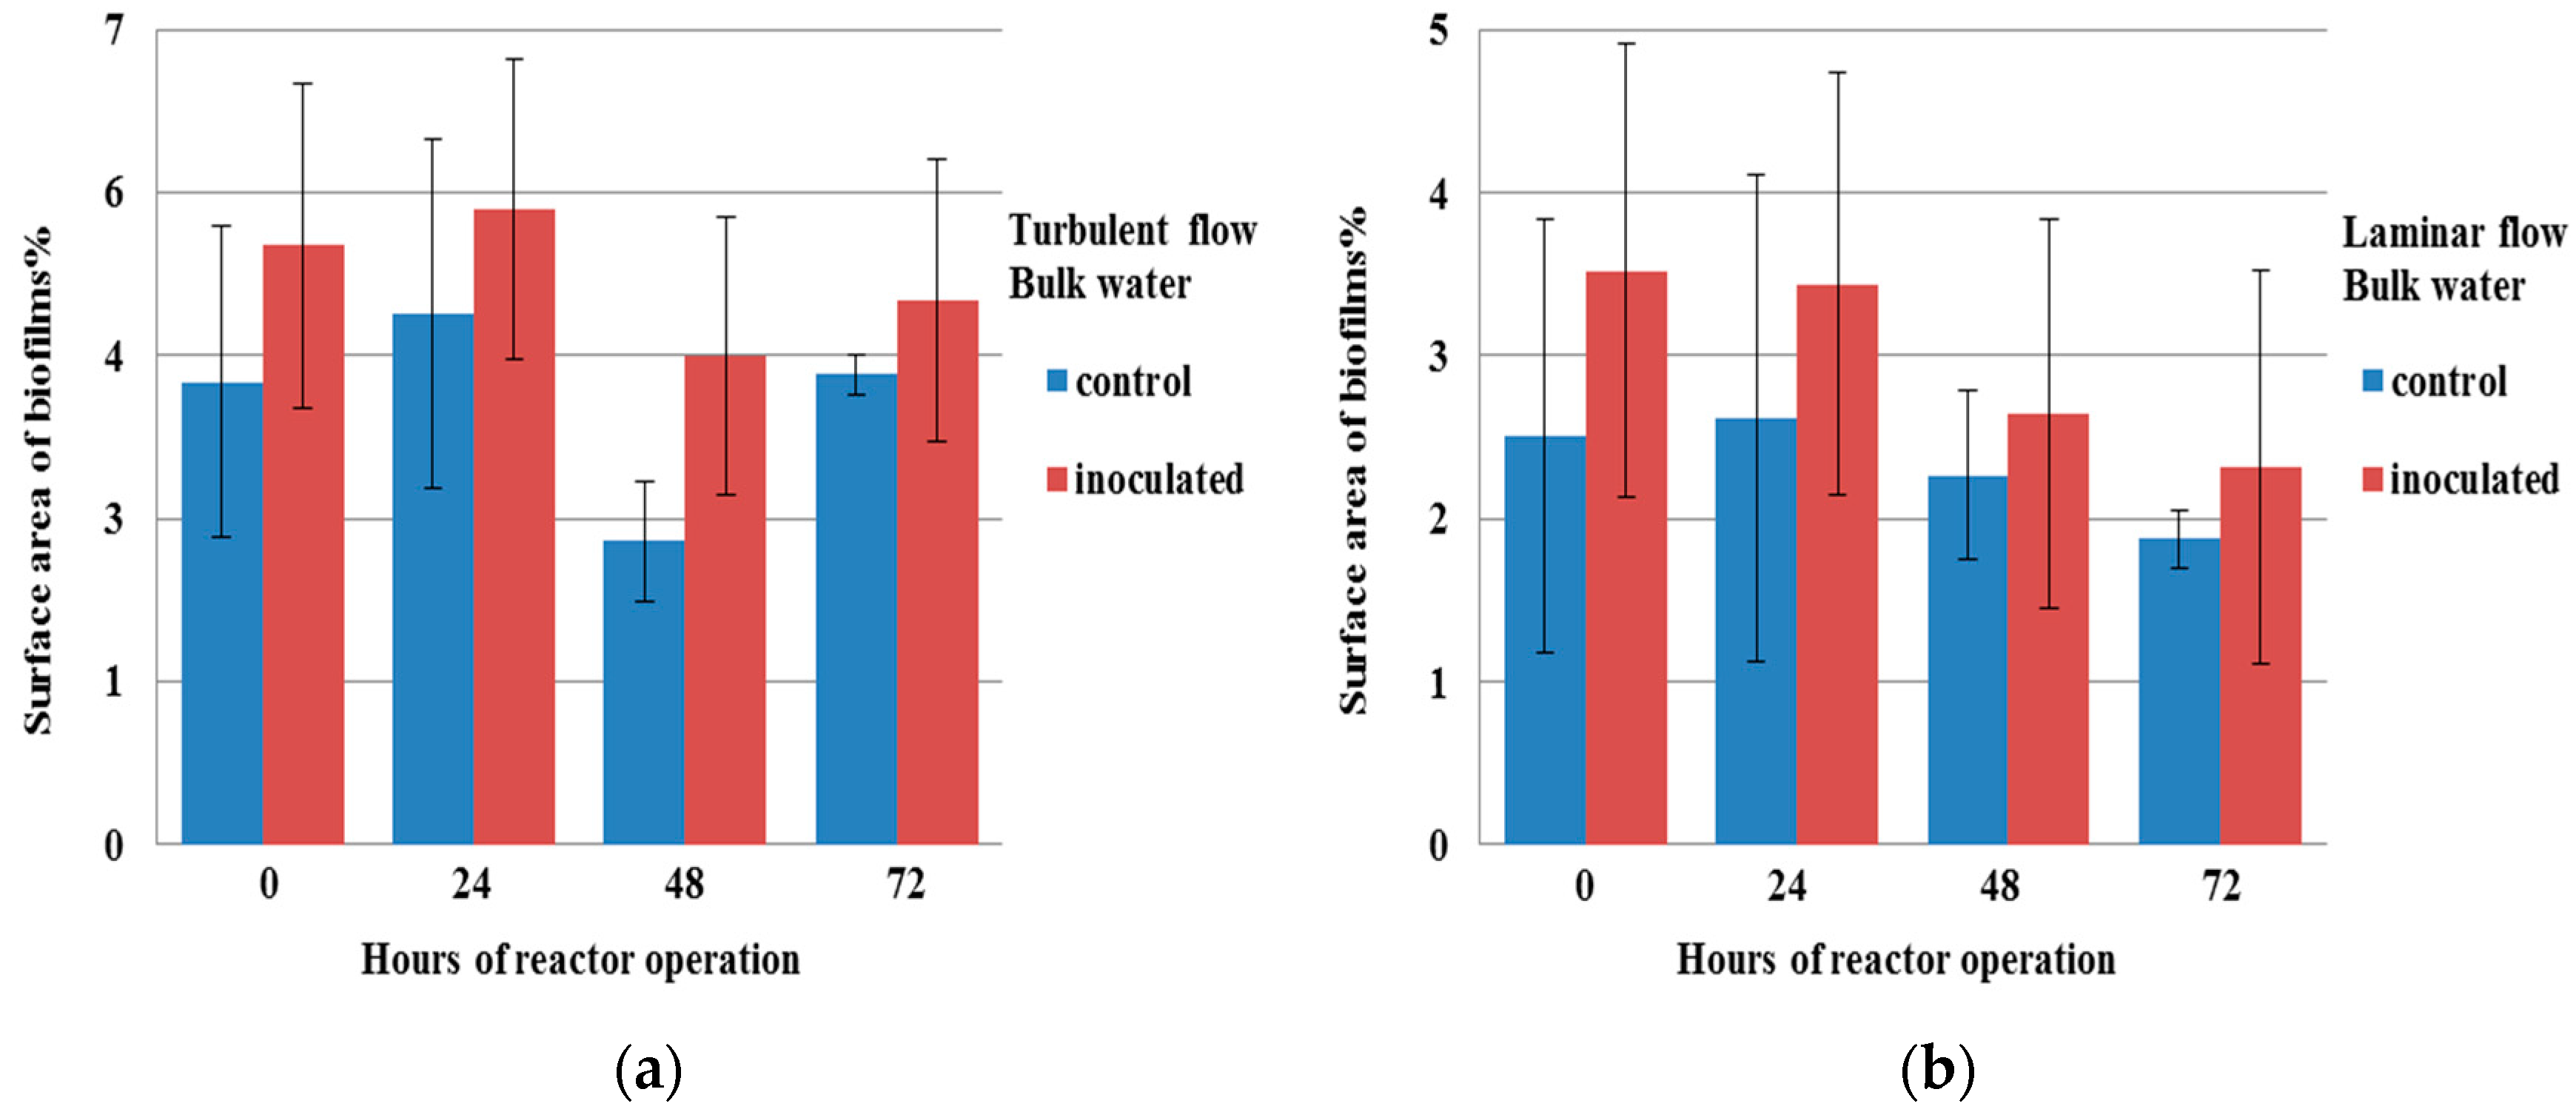
Here, only the results for the measures for which significant differences were found between the different tested conditions are presented. The concentration of microcolonies in the bulk water (Figure 1) and the number of aggregates on the slides of the reactor (Figure 2) were found to be significantly higher (p < 0.05) in the inoculated culture than in the control one for turbulent flow. The same result for the microcolonies in the bulk water and aggregates on the reactor slides was found for laminar flow. There were no aggregates found in the bulk water in both laminar and turbulent flow. The percentage of surface area of biofilms from the bulk water (Figure 3) was found to be significantly higher (p < 0.05) in the inoculated culture than in the control one only in turbulent flow. The summary for those differences is presented in Table 2.
The number of microcolonies in the bulk water (Figure 1), the number of aggregates on the slides of the reactor (Figure 2), and the percentage of surface area of biofilms from the bulk water (Figure 3) were found to be significantly higher (p < 0.05) in turbulent flow than in laminar flow for the control culture. The same result for the microcolonies in the bulk water, the aggregates on the reactor slides, and the surface area of biofilms was found for the inoculated culture. The summary for those differences is presented in Table 2.
Significant differences were found in the various measures between the different time periods of growth. The most significant differences (p < 0.05) were found between 24 and 48 h, which shows that this was the most important time period for bacterial aggregation in the reactor. The summary for those differences is presented in Table 3.
3.3. Structures of Aggregates
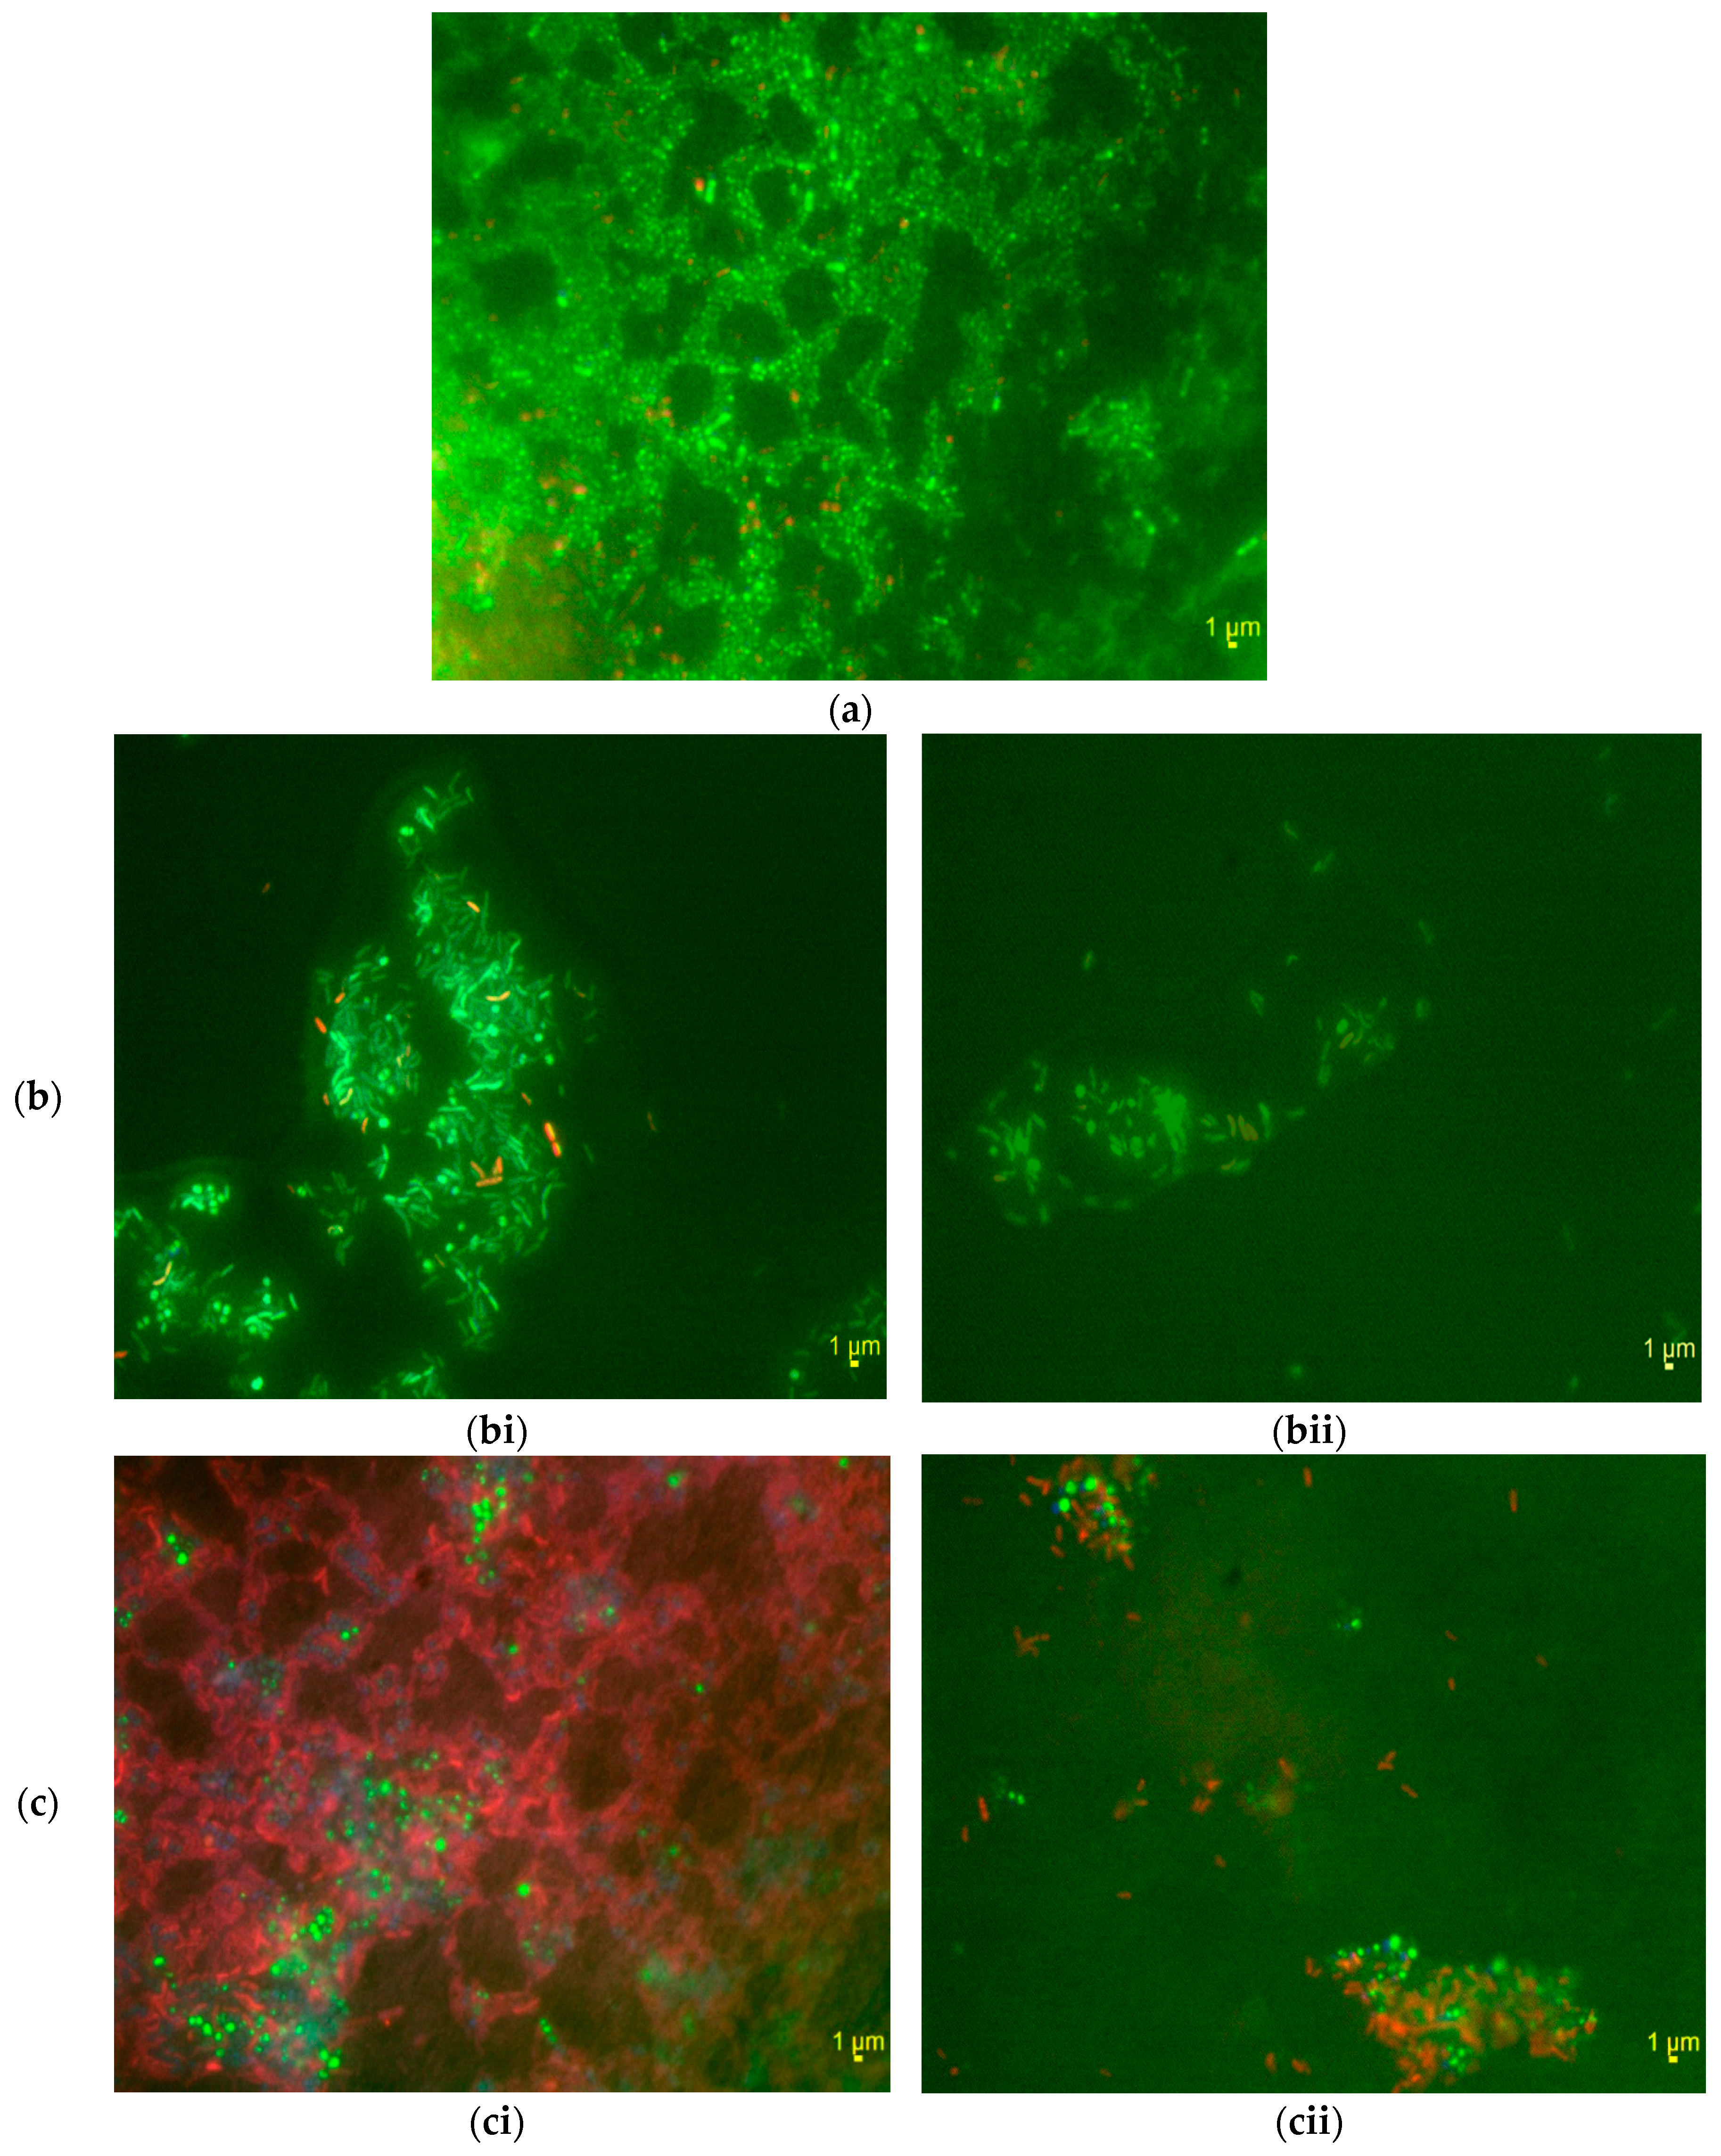
The images obtained from microscopy only in the areas in which the Methylobacterium was present are here presented. Under stagnant conditions, the Methylobacterium was dominant within large aggregates that appeared to exclude the other drinking water bacteria (Figure 4a). Similarly, by visual observation of all the images it was found that, in laminar flow, the Methylobacterium was dominant within the aggregates from the reactor slides (Figure 4bi). However, as the shear stress increased from stagnant to laminar flow conditions there was a co-location of other drinking water bacteria within the aggregates in which the Methylobacterium was present. In turbulent flow, the Methylobacterium acted as a coagulant forming firstly its own aggregates and then picking up the rest of the drinking water bacteria around it (Figure 4ci). Specifically, it was shown that the Methylobacterium created a tightly knit core and the rest of the drinking water bacteria created a large mantle that surrounded this core. Here, the aggregates that were formed were more than those detected in laminar flow.
The samples analysed with FISH in turbulent and laminar flow conditions included not only samples from the reactor slides, but also samples from the bulk water of the reactor. In brief, the FISH images revealed that there were more aggregates detected in the samples from the slides of the reactor compared to those from the bulk water in both turbulent and laminar flow conditions. Also, the aggregates detected in the bulk water of the reactor in both laminar (Figure 4bii) and turbulent flows (Figure 4cii) were less than those in the bulk water under stagnant conditions (Figure 4a). Finally, the aggregates detected in the bulk water of the reactor in turbulent flow (Figure 4cii) were more than those in the bulk water in laminar flow (Figure 4bii).
Finally, there were images in which there was no Methylobacterium detected in both stagnant and flow conditions. For those images, it was found that this area was covered by the rest of the drinking water bacterial population. Again, more aggregates were detected in turbulent than in laminar flow for both bulk water samples and samples from the reactor slides. Again, more aggregates were found in the samples from the reactor slides than in those from the bulk water of the reactor for both laminar and turbulent flow conditions.
4. Discussion
The interaction between hydrodynamics and biofilm growth and morphology has received significant attention. Both modelling [66,67] and experimental studies [57,68] have revealed the important roles that, for example, shear-stress-induced detachment of cells or increased oxygen transport to a biofilm in turbulent flow conditions play on the structure and growth of an established biofilm. From an engineering perspective, this does give some inkling of ways of managing the flow of the water distribution system to control the sloughing of biofilm material into the bulk water that ultimately emerges at the tap. However, more attractive, but currently more elusive, solutions to the problems of biofilms in drinking water systems would involve intervention that prevents the biofilms ever forming on the pipe surfaces. The solutions could take many forms—novel pipe materials, chemical interventions, disruption of the cell biology—but all would share a common goal of disrupting the initial colonisation of surfaces: a process that may start with bacterial aggregation and about which there is little knowledge concerning complex mixes of bacteria in environments with different physicochemical conditions.
Studies on drinking water biofilms tend to be for flow conditions; far less is known about biofilm formation under stagnant conditions. This is despite the fact that stagnant waters occur regularly in parts of a drinking water distribution system when the water consumption is low [69]. Thus, part of our study here was focused on bacterial aggregation in drinking water under stagnant conditions. Motility, stress, and quorum sensing are all known to play an important role in triggering the switch from planktonic to biofilm mode of life in bacteria [70,71]. In the oligotrophic conditions in DWDS, where chemical stresses like chlorination are imposed, biofilms unsurprisingly seem to be the favoured mode of life for microorganisms. Yet, there is evidence that colonisation of biofilms on surfaces does not progress as a random uniformly distributed deposition of bacteria from the bulk liquid onto the surface [72].
Recently, in one of the few studies to explore the colonisation of complex biofilms under high-shear flows, for a complex mix of bacteria harvested from an activated sludge plant in a rotating annular reactor, the formation of heterogeneous clusters of bacteria, and the size and number of clusters were demonstrated [72]. Surprisingly, the number and size of clusters was positively correlated with shear stress on the surface of the slides; one might have expected that higher shear would make it more difficult for bacteria to adhere. Flocs that are important in successful wastewater treatment were removed and then a mixed supernatant, comprising planktonic bacteria, was cultured for 24 h before it was inoculated into the high-shear bioreactor. The clustering patterns observed were also observed in previous studies [73,74,75], but the positive and strong correlation between clustering and shear is novel and the level of turbulence in the flow developed to induce such high shear flows is unique in biofilm colonisation studies. The mechanisms suggested to be important for the clustering patterns are co-adhesion [76], which occurs on the substratum and describes the propensity for bacteria to attach in proximity to those that have already attached, and coaggregation [77], which is the coming-together of bacteria in clumps in the bulk water prior to adhesion onto the surface.
Part of the motivation for our research was that bacterial aggregation has been studied only for simple mono- and dual-species cultures [4]. These studies, which were performed in batch cultures, were motivated by biofilm formation but did not extend as far as the formation of complex multi-species biofilms on surfaces in realistic flow conditions. Nonetheless, the critical finding was that not all bacteria contribute equally to aggregation: some bacterial species such as Methylobacterium seem to promote aggregation. They go onto suggest that quorum sensing (QS) may play a role in aggregation [12,28,78,79]. Quorum sensing can be influenced by the hydrodynamic environment. It has been shown that signals do not remain the same under different shear stress conditions due to mass transfer properties in the local environment. Biofilm thickness and density may be altered due to the hydrodynamic environment and, subsequently, QS signals can be also affected [79].
Here, it was found that aggregation did occur in a complex drinking water microbial community even under stagnant conditions. This suggests that some form of chemotaxis occurs, perhaps QS, which causes the bacteria to move towards and then adhere to one another. What is clear is that the process is enhanced by inoculating the Methylobacterium and it has been shown that the production of QS molecules is widespread amongst Methylobacterium species [28,80,81]. Also, the fact that there were no significant differences in aggregation beyond 24 h suggests that the aggregation occurred relatively quickly and plateaued once it had occurred. This might indicate that Methylobacterium initiated the aggregation process and then played a less important role as time proceeded.
Our experiments indicated that, in laminar flow, aggregation was enhanced in the inoculated drinking water culture compared to the control one. In the inoculated laminar flow experiment, as time progressed the number of microcolonies in the bulk water and the surface area of biofilms from the bulk water were diminished and, subsequently, the number of aggregates on the slides was increased. Interestingly, when the rotational speed of the reactor was increased to take the flow into a fully turbulent regime there was no such gradual increase in aggregates on the reactor slides. Instead, there was a rapid accumulation within the first 24 h, and then a much slower accumulation. Aggregation was found to be enhanced in turbulent flow compared to laminar flow; inoculating with the Methylobacterium further enhanced the aggregation. Contrary to stagnant conditions, visible aggregates were not observed in the bulk water for both flow regimes. This suggests that the hydrodynamics ensure that aggregates are moved onto the reactor surfaces before they become large enough to be visible.
From FISH analysis it was found that aggregation did occur for general drinking water bacteria other than the Methylobacterium strain DSM 18358. It might be that these aggregates were created by other keystone species that were not targeted with FISH. The findings from this study agreed with the previous findings, which showed that aggregation was enhanced in the turbulent flow compared with the laminar flow. Under both flow conditions, aggregates were more apparent for the slide samples than for the liquid samples. This suggests that once aggregates formed in the bulk water they moved onto the surfaces. Previously, it was found that there were no visible aggregates in the liquid samples for both flow conditions. However, from the FISH images it was shown that aggregates did occur in the bulk water, but those aggregates were detectable by microscopy and not by visual observation. It was finally shown that there were more aggregates under stagnant conditions than under flow conditions in the bulk water, which again suggests that the flow conditions enable the move of aggregates onto the surfaces.
Our experiments lend weight to the speculation in Saur et al. [72] that coaggregation in the bulk liquid is an important precursor to biofilm colonisation and that the formation of aggregates at various scales is enhanced by turbulence. The increase in mass transport with increasing turbulence is a very well documented phenomenon [82,83,84,85] and, thus, it is unsurprising that movement of biomass from the bulk liquid onto the surfaces increases with shear stress. What is surprising is that the propensity for aggregation in the bulk liquid is maintained as the flow speeds increase and turbulence is induced. If there are groups of bacteria that produce a chemical signal to induce aggregation, then one might expect that the dispersal caused by turbulent flow would homogenise the concentration of the signalling molecule and, thus, make chemotaxis difficult. It has been suggested that individual bacterial cells can feel turbulence and modify their phenotype in response to it [86]. So, it could be that the drinking water bacteria modify their cell surfaces to promote adhesion in turbulent flow conditions, and that the mechanical mixing and the consequent increased likelihood of collisions form aggregates. Yet, this does not explain why the core of the aggregates was made up of the Methylobacterium in turbulent flow; the Methylobacterium must firstly form a single-species core and, then, the other bacterial species adhere to this core. Thus, it looks like even in turbulent flow conditions some sort of signalling occurs between the Methylobacterium cells that causes them to rapidly adhere to one another. If this is chemical signalling, then it is a mystery how the chemical gradients are maintained in highly mixed turbulent flows.
These results revealed that the Methylobacterium studied is a keystone strain in aggregation in drinking water. Thus, disrupting the formation of biofilms by targeting the keystone species that initiate the aggregation process, rather than acting on all species equally, may be a beneficial strategy to the drinking water industry.
Acknowledgments
This work was supported by the University of Glasgow James Watt Scholarship and the Engineering and Physical Sciences Research Council (EP/K038885/1).
Author Contributions
Erifyli Tsagkari and William T. Sloan conceived the experiments; Erifyli Tsagkari designed and performed the experiments; Jillian M. Couto helped in the design of PCR probes; Ciara Keating trained Erifyli Tsagkari in FISH experimentation; Erifyli Tsagkari analysed the data; Erifyli Tsagkari and William T. Sloan wrote the paper; Ciara Keating and Jillian M. Couto reviewed the paper.
Conflicts of Interest
The authors declare no conflict of interest.
References
- Jefferson, K.K. What drives bacteria to produce a biofilm? FEMS Microbiol. Lett. 2004, 236, 163–173. [Google Scholar] [CrossRef] [PubMed]
- Karunakaran, E.; Mukherjee, J.; Ramalingam, B.; Biggs, C.A. “Biofilmology”: A multidisciplinary review of the study of microbial biofilms. Appl. Microbiol. Biotechnol. 2011, 90, 1869–1881. [Google Scholar] [CrossRef] [PubMed]
- Rickard, A.H.; McBain, A.J.; Ledder, R.G.; Handley, P.S.; Gilbert, P. Coaggregation between freshwater bacteria within biofilm and planktonic communities. FEMS Microbiol. Lett. 2003, 220, 133–140. [Google Scholar] [CrossRef]
- Simões, L.C.; Simões, M.; Vieira, M.J. Intergeneric coaggregation among drinking water bacteria: Evidence of a role for Acinetobacter calcoaceticus as a bridging bacterium. Appl. Environ. Microbiol. 2008, 74, 1259–1263. [Google Scholar] [CrossRef] [PubMed] [Green Version]
- Sekar, R.; Deines, P.; Machell, J.; Osborn, A.M.; Biggs, C.A.; Boxall, J.B. Bacterial water quality and network hydraulic characteristics: A field study of a small, looped water distribution system using culture-independent molecular methods. J. Appl. Microbiol. 2012, 112, 1220–1234. [Google Scholar] [CrossRef] [PubMed]
- Simoes, L.C.; Simoes, M.; Oliveira, R.; Vieira, M.J. Potential of the adhesion of bacteria isolated from drinking water to materials. J. Basic Microbiol. 2007, 47, 174–183. [Google Scholar] [CrossRef] [PubMed] [Green Version]
- Williams, M.M.; Domingo, J.W.S.; Meckes, M.C.; Kelty, C.A.; Rochon, H.S. Phylogenetic diversity of drinking water bacteria in a distribution system simulator. J. Appl. Microbiol. 2004, 96, 954–964. [Google Scholar] [CrossRef] [PubMed]
- Kormas, K.A.; Neofitou, C.; Pachiadaki, M.; Koufostathi, E. Changes of the bacterial assemblages throughout an urban drinking water distribution system. Environ. Monit. Assess. 2010, 165, 27–38. [Google Scholar] [CrossRef]
- Emtiazi, F.; Schwartz, T.; Marten, S.M.; Krolla-Sidenstein, P.; Obst, U. Investigation of natural biofilms formed during the production of drinking water from surface water embankment filtration. Water Res. 2004, 38, 1197–1206. [Google Scholar] [CrossRef]
- Martiny, A.C.; Jorgensen, T.M.; Albrechtsen, H.J.; Arvin, E.; Molin, S. Long-term succession of structure and diversity of a biofilm formed in a model drinking water distribution system. Appl. Environ. Microbiol. 2003, 69, 6899–6907. [Google Scholar] [CrossRef] [PubMed]
- Soge, O.O.; Giardino, M.A.; Ivanova, I.C.; Pearson, A.L.; Meschke, J.S.; Roberts, M.C. Low prevalence of antibiotic-resistant gram-negative bacteria isolated from rural south-western Ugandan groundwater. Water SA 2009, 35, 343–347. [Google Scholar] [CrossRef]
- Simões, L.C.; Simões, M.; Vieira, M.J. Biofilm interactions between distinct bacterial genera isolated from drinking water. Appl. Environ. Microbiol. 2007, 73, 6192–6200. [Google Scholar] [CrossRef] [PubMed] [Green Version]
- Scoaris, D.D.; Colacite, J.; Nakamura, C.V.; Ueda-Nakamura, T.; de Abreu, B.A.; Dias, B.P. Virulence and antibiotic susceptibility of Aeromonas spp. isolated from drinking water. Antonie Leeuwenhoek Int. J. Gen. Mol. Microbiol. 2008, 93, 111–122. [Google Scholar] [CrossRef] [PubMed]
- Rickard, A.H.; McBain, A.J.; Stead, A.T.; Gilbert, P. Shear rate moderates community diversity in freshwater biofilms. Appl. Environ. Microbiol. 2004, 70, 7426–7435. [Google Scholar] [CrossRef] [PubMed]
- Gallego, V.; Garcia, M.T.; Ventosa, A. Methylobacterium isbiliense sp. nov., isolated from the drinking water system of Sevilla, Spain. Int. J. Syst. Evol. Microbiol. 2005, 55, 2333–2337. [Google Scholar] [CrossRef] [PubMed]
- Gallego, V.; Garcia, M.T.; Ventosa, A. Methylobacterium variabile sp. nov., a methylotrophic bacterium isolated from an aquatic environment. Int. J. Syst. Evol. Microbiol. 2005, 55, 1429–1433. [Google Scholar] [CrossRef] [PubMed]
- Falkinham, J.O.; Williams, M.D.; Kwait, R.; Lande, L. Methylobacterium spp. as an indicator for the presence or absence of Mycobacterium spp. Int. J. Mycobacteriol. 2016, 5, 240–243. [Google Scholar] [CrossRef] [PubMed]
- Sanders, J.W.; Martin, J.W.; Hooke, M.; Hooke, J. Methylobacterium mesophilicum infection: Case report and literature review of an unusual opportunistic pathogen. Clin. Infect. Dis. 2000, 30, 936–938. [Google Scholar] [CrossRef] [PubMed]
- Thomas, V.; Herrera-Rimann, K.; Blanc, D.S.; Greub, G. Biodiversity of amoebae and amoeba-resisting bacteria in a hospital water network. Appl. Environ. Microbiol. 2006, 72, 2428–2438. [Google Scholar] [CrossRef] [PubMed]
- Rickard, A.H.; Leach, S.A.; Buswell, C.M.; High, N.J.; Handley, P.S. Coaggregation between aquatic bacteria is mediated by specific-growth-phase-dependent lectin-saccharide interactions. Appl. Environ. Microbiol. 2000, 66, 431–434. [Google Scholar] [CrossRef] [PubMed]
- Hall-Stoodley, L.; Costerton, J.W.; Stoodley, P. Bacterial biofilms: From the natural environment to infectious diseases. Nat. Rev. Microbiol. 2004, 2, 95–108. [Google Scholar] [CrossRef] [PubMed]
- Dohner, H.; Stilgenbauer, S.; Benner, A.; Leupolt, E.; Krober, A.; Bullinger, L.; Dohner, K.; Bentz, M.; Lichter, P. Genomic aberrations and survival in chronic lymphocytic leukemia. N. Engl. J. Med. 2000, 343, 1910–1916. [Google Scholar] [CrossRef] [PubMed]
- Cui, C.; Shu, W.; Li, P. Fluorescence In situ Hybridization: Cell-Based Genetic Diagnostic and Research Applications. Front. Cell Dev. Biol. 2016, 4, 89. [Google Scholar] [CrossRef] [PubMed]
- Douterelo, I.; Boxall, J.B.; Deines, P.; Sekar, R.; Fish, K.E.; Biggs, C.A. Methodological approaches for studying the microbial ecology of drinking water distribution systems. Water Res. 2014, 65, 134–156. [Google Scholar] [CrossRef] [PubMed]
- Nielsen, J.L.; Klausen, C.; Nielsen, P.H.; Burford, M.; Jorgensen, N.O.G. Detection of activity among uncultured Actinobacteria in a drinking water reservoir. FEMS Microbiol. Ecol. 2006, 55, 432–438. [Google Scholar] [CrossRef] [PubMed]
- Wilhartitz, I.; Mach, R.L.; Teira, E.; Reinthaler, T.; Herndl, G.J.; Farnleitner, A.H. Prokaryotic community analysis with CARD-FISH in comparison with FISH in ultra-oligotrophic ground- and drinking water. J. Appl. Microbiol. 2007, 103, 871–881. [Google Scholar] [CrossRef] [PubMed]
- Deines, P.; Sekar, R.; Husband, P.S.; Boxall, J.B.; Osborn, A.M.; Biggs, C.A. A new coupon design for simultaneous analysis of in situ microbial biofilm formation and community structure in drinking water distribution systems. Appl. Microbiol. Biotechnol. 2010, 87, 749–756. [Google Scholar] [CrossRef] [PubMed]
- Ramalingam, B. The Role of Cell to Cell Interactions and Quorum Sensing in Formation of Biofilms by Drinking Water Bacteria, in Chemical and Biological Engineering. Ph.D. Thesis, Univeristy of Sheffield, United Kingdom, Sheffield, UK, 2012. [Google Scholar]
- Kubota, K. CARD-FISH for Environmental Microorganisms: Technical Advancement and Future Applications. Microbes Environ. 2013, 28, 3–12. [Google Scholar] [CrossRef] [PubMed]
- Hardoim, P.R.; van Overbeek, L.S.; Berg, G.; Pirttila, A.M.; Compant, S.; Campisano, A.; Doring, M.; Sessitsch, A. The Hidden World within Plants: Ecological and Evolutionary Considerations for Defining Functioning of Microbial Endophytes. Microbiol. Mol. Biol. Rev. 2015, 79, 293–320. [Google Scholar] [CrossRef] [PubMed]
- Yano, T.; Kubota, H.; Hanai, J.; Hitomi, J.; Tokuda, H. Stress Tolerance of Methylobacterium Biofilms in Bathrooms. Microbes Environ. 2013, 28, 87–95. [Google Scholar] [CrossRef] [PubMed]
- World Health Organization (WHO). Biosafety Manual, 3rd ed.; World Health Organization (WHO) Laboratory: Geneva, Switzerland, 2004. [Google Scholar]
- Thiel, T. Streaking Microbial Cultures on Agar Plates, in Science in the Real World: Microbes in Action; Department of Biology, University of Missuri-St. Louis: St. Louis, MO, USA, 1999. [Google Scholar]
- Reasoner, D.J.; Geldreich, E.E. A New Medium for the Enumeration and Subculture of Bacteria from Potable Water. Appl. Environ. Microbiol. 1985, 49, 1–7. [Google Scholar] [PubMed]
- Sandle, T. An approach for the reporting of microbiological results from water systems. PDA J. Pharm. Sci. Technol. 2004, 58, 231–237. [Google Scholar] [PubMed]
- Kalmbach, S.; Manz, W.; Szewzyk, U. Isolation of new bacterial species from drinking water biofilms and proof of their in situ dominance with highly specific 16S rRNA probes. Appl. Environ. Microbiol. 1997, 63, 4164–4170. [Google Scholar] [PubMed]
- Gallego, V.; Garcia, M.T.; Ventosa, A. Methylobacterium hispanicum sp. nov and Methylobacterium aquaticum sp. nov., isolated from drinking water. Int. J. Syst. Evolut. Microbiol. 2005, 55, 281–287. [Google Scholar] [CrossRef] [PubMed]
- Hiraishi, A.; Furuhata, K.; Matsumoto, A.; Koike, K.A.; Fukuyama, M.; Tabuchi, K. Phenotypic and Genetic Diversity of Chlorine-Resistant Methylobacterium Strains Isolated from Various Environments. Appl. Environ. Microbiol. 1995, 61, 2099–2107. [Google Scholar] [PubMed]
- Kepner, R.L.; Pratt, J.R. Use of Fluorochromes for Direct Enumeration of Total Bacteria in Environmental-Samples—Past and Present. Microbiol. Rev. 1994, 58, 603–615. [Google Scholar] [PubMed]
- Bautista-de Los Santos, Q.M.; Schroeder, J.L.; Blakemore, O.; Moses, J.; Haffey, M.; Sloan, W.; Pinto, A.J. The impact of sampling, PCR, and sequencing replication on discerning changes in drinking water bacterial community over diurnal time-scales. Water Res. 2016, 90, 216–224. [Google Scholar] [CrossRef] [PubMed]
- Chamberlain, E.; Adams, C. Oxidation of sulfonamides, macrolides, and carbadox with free chlorine and monochloramine. Water Res. 2006, 40, 2517–2526. [Google Scholar] [CrossRef] [PubMed]
- Machell, J.; Boxall, J.; Saul, A.; Bramley, D. Improved Representation of Water Age in Distribution Networks to Inform Water Quality. J. Water Resour. Plan. Manag. ASCE 2009, 135, 382–391. [Google Scholar] [CrossRef]
- Stepanovic, S.; Vukovic, D.; Dakic, I.; Savic, B.; Svabic-Vlahovic, M. A modified microtiter-plate test for quantification of staphylococcal biofilm formation. J. Microbiol. Methods 2000, 40, 175–179. [Google Scholar] [CrossRef]
- Miettinen, I.; Schaule, G. Surveillance and control of microbiological stability in drinking water distribution networks. Handbook for Analytical Methods and Operational Criteria for Biofilm Reactors. EU Project SAFER, Contract Number: EVK1-CT-2002-00108. 2003. Available online: http://www.oieau.org/eaudoc/system/files/documents/40/204680/204680_doc.pdf (accessed on 10 October 2017).
- Fuhrman, J.A. Microbial community structure and its functional implications. Nature 2009, 459, 193–199. [Google Scholar] [CrossRef] [PubMed]
- Douterelo, I. Bacterial community dynamics during the early stages of biofilm formation in a chlorinated experimental drinking water distribution system: Implications for drinking water discolouration. J. Appl. Microbiol. 2014, 117, 286–301. [Google Scholar] [CrossRef] [PubMed]
- Douterelo, I.; Husband, S.; Boxall, J.B. The bacteriological composition of biomass recovered by flushing an operational drinking water distribution system. Water Res. 2014, 54, 100–114. [Google Scholar] [CrossRef] [PubMed]
- Ramalingam, B.; Sekar, R.; Boxall, J.B.; Biggs, C.A. Aggregation and biofilm formation of bacteria isolated from domestic drinking water. Water Sci. Technol. Water Supply 2013, 13, 1016–1023. [Google Scholar] [CrossRef]
- Szabo, J.G.; Rice, E.W.; Bishop, P.L. Persistence and decontamination of Bacillus atrophaeus subsp. globigii spores on corroded iron in a model drinking water system. Appl. Environ. Microbiol. 2007, 73, 2451–2457. [Google Scholar] [CrossRef] [PubMed]
- Douterelo, I.; Sharpe, R.L.; Boxall, J.B. Influence of hydraulic regimes on bacterial community structure and composition in an experimental drinking water distribution system. Water Res. 2013, 47, 503–516. [Google Scholar] [CrossRef] [PubMed]
- Childs, P.R.N. Rotating Cylinders, Annuli, and Spheres. In Rotating Flow; Elsevier Science & Technology Books: China, 2011; Chapter 6; Available online: http://www.homepages.ed.ac.uk/shs/Climatechange/Flettner%20ship/Childs%20Annuli.pdf (accessed on 10 October 2017).
- Bird, R.B.; Steward, E.W.; Lightfoot, E.N. Transport Phenomena; Wiley: New York, NY, USA, 1960; 780p. [Google Scholar]
- Kaye, J.; Elgar, E.C. Modes of Adiabatic and Diabatic Fluid Flow in an Annulus with an Inner Rotating Cylinder; M.I.T. Research Laboratory of Heat Transfer in Electronics: Cambridge, MA, USA, 1957; pp. 753–765. [Google Scholar]
- SAWater. Allowable Pipe Size, Class and Materials for Water Mains; South Australian (SA) Water Corporation: Adelaide, Australia, 2011. [Google Scholar]
- Chowdhury, S. Heterotrophic bacteria in drinking water distribution system: A review. Environ. Monit. Assess. 2012, 184, 6087–6137. [Google Scholar] [CrossRef] [PubMed]
- Zheng, M.Z.; He, C.G.; He, Q. Fate of free chlorine in drinking water during distribution in premise plumbing. Ecotoxicology 2015, 24, 2151–2155. [Google Scholar] [CrossRef] [PubMed]
- Garny, K.; Horn, H.; Neu, T.R. Interaction between biofilm development, structure and detachment in rotating annular reactors. Bioprocess. Biosyst. Eng. 2008, 31, 619–629. [Google Scholar] [CrossRef] [PubMed]
- Chao, Y.Q.; Zhang, T. Optimization of fixation methods for observation of bacterial cell morphology and surface ultrastructures by atomic force microscopy. Appl. Microbiol. Biotechnol. 2011, 92, 381–392. [Google Scholar] [CrossRef] [PubMed] [Green Version]
- Ragot, S.A.; Kertesz, M.A.; Bunemann, E.K. phoD Alkaline Phosphatase Gene Diversity in Soil. Appl. Environ. Microbiol. 2015, 81, 7281–7289. [Google Scholar] [CrossRef] [PubMed]
- Hugenholtz, P.; Tyson, G.W.; Blackall, L.L. Design and evaluation of 16S rRNA-targeted oligonucleotide probes for fluorescence in situ hybridization. Methods Mol. Biol. 2002, 179, 29–42. [Google Scholar] [PubMed]
- Herndl, G. CARD-FISH and Microautoradiography Protocol for Bacteria and Archaea. 2007. Available online: http://www.microbial-oceanography.eu/pdf/MicroCardFish_Protocol.pdf (accessed on 10 October 2017).
- Pirttila, A.M.; Laukkanen, H.; Pospiech, H.; Myllyla, R.; Hohtola, A. Detection of intracellular bacteria in the buds of Scotch fine (Pinus sylvestris L.) by in situ hybridization. Appl. Environ. Microbiol. 2000, 66, 3073–3077. [Google Scholar] [CrossRef] [PubMed]
- Podolich, O.; Laschevskyy, V.; Ovcharenko, L.; Kozyrovska, N.; Pirttila, A.M. Methylobacterium sp. resides in unculturable state in potato tissues in vitro and becomes culturable after induction by Pseudomonas fluorescens IMGB163. J. Appl. Microbiol. 2009, 106, 728–737. [Google Scholar] [CrossRef] [PubMed]
- Amann, R.I.; Krumholz, L.; Stahl, D.A. Fluorescent-Oligonucleotide Probing of Whole Cells for Determinative, Phylogenetic, and Environmental-Studies in Microbiology. J. Bacteriol. 1990, 172, 762–770. [Google Scholar] [CrossRef] [PubMed]
- Stoecker, K.; Dorninger, C.; Daims, H.; Wagner, M. Double labeling of oligonucleotide probes for fluorescence in situ hybridization (DOPE-FISH) improves signal intensity and increases rRNA accessibility. Appl. Environ. Microbiol. 2010, 76, 922–926. [Google Scholar] [CrossRef] [PubMed]
- Barai, P.; Kumar, A.; Mukherjee, P.P. Modeling of Mesoscale Variability in Biofilm Shear Behavior. PLoS ONE 2016, 11, e0165593. [Google Scholar] [CrossRef] [PubMed]
- Duddu, R.; Chopp, D.L.; Moran, B. A Two-Dimensional Continuum Model of Biofilm Growth Incorporating Fluid Flow and Shear Stress Based Detachment. Biotechnol. Bioeng. 2009, 103, 92–104. [Google Scholar] [CrossRef] [PubMed]
- Percival, S.L.; Knapp, J.S.; Wales, D.S.; Edyvean, R.G.J. The effect of turbulent flow and surface roughness on biofilm formation in drinking water. J. Ind. Microbiol. Biotechnol. 1999, 22, 152–159. [Google Scholar] [CrossRef]
- Manuel, C.M.; Nunes, O.C.; Melo, L.F. Dynamics of drinking water biofilm in flow/non-flow conditions. Water Res. 2007, 41, 551–562. [Google Scholar] [CrossRef] [PubMed]
- Harshey, R.M. Bacterial motility on a surface: Many ways to a common goal. Ann. Rev. Microbiol. 2003, 57, 249–273. [Google Scholar] [CrossRef] [PubMed]
- Liu, S.; Gunawan, C.; Barraud, N.; Rice, S.A.; Harry, E.J.; Amal, R. Understanding, Monitoring, and Controlling Biofilm Growth in Drinking Water Distribution Systems. Environ. Sci. Technol. 2016, 50, 8954–8976. [Google Scholar] [CrossRef] [PubMed]
- Saur, T.; Morin, E.; Habouzit, F.; Bernet, N.; Escudie, R. Impact of wall shear stress on initial bacterial adhesion in rotating annular reactor. PLoS ONE 2017, 12, e0172113. [Google Scholar] [CrossRef] [PubMed]
- Bos, R.; Vandermei, H.C.; Busscher, H.J. A Quantitative Method to Study Co-Adhesion of Microorganisms in a Parallel-Plate Flow Chamber. 2. Analysis of the Kinetics of Co-Adhesion. J. Microbiol. Methods 1995, 23, 169–182. [Google Scholar] [CrossRef]
- Perni, S.; Jordan, S.J.; Andrew, P.W.; Shama, G. Biofilm development by Listeria innocua in turbulent flow regimes. Food Control 2006, 17, 875–883. [Google Scholar] [CrossRef] [Green Version]
- Brugnoni, L.I.; Cubitto, M.A.; Lozano, J.E. Role of shear stress on biofilm formation of Candida krusei in a rotating disk system. J. Food Eng. 2011, 102, 266–271. [Google Scholar] [CrossRef]
- Bos, R.; Vandermei, H.C.; Meinders, J.M.; Busscher, H.J. A Quantitative Method to Study Co-Adhesion of Microorganisms in a Parallel-Plate Flow Chamber—Basic Principles of the Analysis. J. Microbiol. Methods 1994, 20, 289–305. [Google Scholar] [CrossRef]
- Kolenbrander, P.E.; Palmer, R.J.; Periasamy, S.; Jakubovics, N.S. Oral multispecies biofilm development and the key role of cell-cell distance. Nat. Rev. Microbiol. 2010, 8, 471–480. [Google Scholar] [CrossRef] [PubMed]
- Purevdorj, B.; Costerton, J.W.; Stoodley, P. Influence of Hydrodynamics and Cell Signaling on the Structure and Behavior of Pseudomonas aeruginosa Biofilms. Appl. Environ. Microbiol. 2002, 68, 4457–4464. [Google Scholar] [CrossRef] [PubMed]
- Kirisits, M.J.; Margolis, J.J.; Purevdorj-Gage, B.L.; Vaughan, B.; Chopp, D.L.; Stoodley, P.; Parsek, M.R. Influence of the hydrodynamic environment on quorum sensing in Pseudomonas aeruginosa biofilms. J. Bacteriol. 2007, 189, 8357–8360. [Google Scholar] [CrossRef] [PubMed]
- Poonguzhali, S.; Madhaiyan, M.; Sa, T. Production of acyl-homoserine lactone quorum-sensing signals is widespread in gram-negative Methylobacterium. J. Microbiol. Biotechnol. 2007, 17, 226–233. [Google Scholar] [PubMed]
- Penalver, C.G.N.; Cantet, F.; Morin, D.; Haras, D.; Vorholt, J.A. A plasmid-borne truncated luxI homolog controls quorum-sensing systems and extracellular carbohydrate production in Methylobacterium extorquens AM1. J. Bacteriol. 2006, 188, 7321–7324. [Google Scholar] [CrossRef] [PubMed]
- Jischa, M. Transfer of Momentum, Heat and Mass in Turbulent Flows of Binary-Mixtures 1. Reynolds Equations and Transport-Equations. Warme Stoffubertrag.-Thermo Fluid Dyn. 1976, 9, 173–178. [Google Scholar] [CrossRef]
- Jaberi, F.A.; Colucci, P.J. Large eddy simulation of heat and mass transport in turbulent flows. Part 2: Scalar field. Int. J. Heat Mass Transf. 2003, 46, 1827–1840. [Google Scholar] [CrossRef]
- Jaberi, F.A.; Colucci, P.J. Large eddy simulation of heat and mass transport in turbulent flows. Part 1: Velocity field. Int. J. Heat Mass Transf. 2003, 46, 1811–1825. [Google Scholar] [CrossRef]
- Hughmark, G.A. Heat, Mass, and Momentum Transport with Turbulent-Flow in Smooth and Rough Pipe. Aiche J. 1975, 21, 1033–1035. [Google Scholar] [CrossRef]
- Hondzo, M.; Wuest, A. Do Microscopic Organisms Feel Turbulent Flows? Environ. Sci. Technol. 2009, 43, 764–768. [Google Scholar] [CrossRef] [PubMed]
Figure 1.
Concentration of microcolonies in the bulk water of reactor for both the control and inoculated cultures after 0, 24, 48, and 72 h (a) in turbulent flow and (b) in laminar flow.
Figure 1.
Concentration of microcolonies in the bulk water of reactor for both the control and inoculated cultures after 0, 24, 48, and 72 h (a) in turbulent flow and (b) in laminar flow.

Figure 2.
Number of aggregates on the reactor slides for both the control and inoculated cultures after 24, 48, and 72 h (a) in turbulent flow and (b) in laminar flow.
Figure 2.
Number of aggregates on the reactor slides for both the control and inoculated cultures after 24, 48, and 72 h (a) in turbulent flow and (b) in laminar flow.

Figure 3.
Percentage of surface area of biofilms from the bulk water of reactor for both the control and inoculated cultures after 0, 24, 48, and 72 h (a) in turbulent flow and (b) in laminar flow.
Figure 3.
Percentage of surface area of biofilms from the bulk water of reactor for both the control and inoculated cultures after 0, 24, 48, and 72 h (a) in turbulent flow and (b) in laminar flow.

Figure 4.
Fluorescence In Situ Hybridisation images: 1000× magnification of Methylobacterium and drinking water aggregates after 24 h. Methylobacterium DSM 18358: green; all drinking water bacteria: red; all DNA: blue. (a) Under stagnant conditions from the bulk water; (b) In laminar flow, (bi) from samples from the reactor slides and (bii) from samples from the bulk water; (c) In turbulent flow, (ci) from samples from the reactor slides and (cii) from samples from the bulk water.


Table 1.
Aggregation measures for control (C) and inoculated (I) drinking water cultures at 24, 48, and 72 h under stagnant conditions.
Table 1.
Aggregation measures for control (C) and inoculated (I) drinking water cultures at 24, 48, and 72 h under stagnant conditions.
| Measures | 24 h | 48 h | 72 h |
|---|---|---|---|
| Size of aggregates (mm2) | |||
| C/I | 0.2/0.3 | 0.3/0.6 | 0.1/0.2 |
| Number of aggregates | |||
| C/I | 1/4 | 5/6 | 1/2 |
| Total Area of aggregates (mm2) | |||
| C/I | 0.2/1.2 | 1.5/3.6 | 0.1/0.4 |
| Aggregation scores | |||
| C/I | 1/2 | 2/3 | 2/3 |
Table 2.
Significant differences that were found in the various aggregation measures between the control and inoculated drinking water culture in turbulent and laminar flow, and between the turbulent and laminar flow in the control and inoculated drinking water cultures.
Table 2.
Significant differences that were found in the various aggregation measures between the control and inoculated drinking water culture in turbulent and laminar flow, and between the turbulent and laminar flow in the control and inoculated drinking water cultures.
| p < 0.05 = X | Control vs. Inoculated | ||
|---|---|---|---|
| p < 0.05 = Y | Turbulent vs. Laminar | ||
| Aggregation measure | microcolonies per mL | aggregates on slides | biofilms% from the bulk |
| Turbulent/Laminar | X/X | X/X | X/- |
| Control/Inoculated | Y/Y | Y/Y | Y/Y |
Table 3.
Significant differences in the various aggregation measures in turbulent and laminar flow between the different time periods. “C” refers to control and “I” refers to inoculated drinking water cultures.
Table 3.
Significant differences in the various aggregation measures in turbulent and laminar flow between the different time periods. “C” refers to control and “I” refers to inoculated drinking water cultures.
| p < 0.05 = X | Microcolonies per mL | Aggregates on Slides | Biofilms% from the Bulk | |
|---|---|---|---|---|
| 0–24 h | Turbulent C/I | /X | /X | |
| Laminar C/I | /X | |||
| 24–48 h | Turbulent C/I | /X | /X | X/X |
| Laminar C/I | /X | /X | X/X | |
| 48–72 h | Turbulent C/I | X/X | ||
| Laminar C/I | /X | |||
© 2017 by the authors. Licensee MDPI, Basel, Switzerland. This article is an open access article distributed under the terms and conditions of the Creative Commons Attribution (CC BY) license (http://creativecommons.org/licenses/by/4.0/).
Share and Cite
MDPI and ACS Style
Tsagkari, E.; Keating, C.; Couto, J.M.; Sloan, W.T. A Keystone Methylobacterium Strain in Biofilm Formation in Drinking Water. Water 2017, 9, 778. https://doi.org/10.3390/w9100778
AMA Style
Tsagkari E, Keating C, Couto JM, Sloan WT. A Keystone Methylobacterium Strain in Biofilm Formation in Drinking Water. Water. 2017; 9(10):778. https://doi.org/10.3390/w9100778
Chicago/Turabian StyleTsagkari, Erifyli, Ciara Keating, Jillian M. Couto, and William T. Sloan. 2017. "A Keystone Methylobacterium Strain in Biofilm Formation in Drinking Water" Water 9, no. 10: 778. https://doi.org/10.3390/w9100778
Note that from the first issue of 2016, this journal uses article numbers instead of page numbers. See further details here.