Removal of Nitrogen and COD from Reclaimed Water during Long-Term Simulated Soil Aquifer Treatment System under Different Hydraulic Conditions


1
Chinese-Israeli International Center for Research and Training in Agriculture, China Agricultural University, Beijing 100083, China
2
School of Resources and Environment, University of Jinan, Shandong 250022, China
3
Center for Agricultural Water Research, China Agricultural University, Beijing 100083, China
*
Author to whom correspondence should be addressed.
Water 2017, 9(10), 786; https://doi.org/10.3390/w9100786
Submission received: 3 September 2017
/
Revised: 30 September 2017
/
Accepted: 10 October 2017
/
Published: 16 October 2017
Abstract
:Reclaimed water is an important supplementary source for fresh water. Purification is necessary prior to utilization in order to minimize the pollution and human-health risk. A three-year experiment was carried out to study the removal of nitrogen and organics through a simulated soil aquifer treatment (SAT) system under continuous wetting and wetting/drying conditions. The removal performance of nitrogen and chemical oxygen demand (COD) was improved in the wetting/drying column. The average removal efficiencies of the three years were 51% and 78% for the NO3–N, 41% and 51% for the NH4–N, and 40% and 50% for the COD in the continuous wetting and wetting/drying columns. Nitrogen and COD removal mainly took place within the top 20 cm of the columns, which was highly correlated with the distribution of microorganisms. The amount of microorganisms was also positively correlated with the content of organic matter and dissolved oxygen (DO) in both soil columns. NO3–N can be removed effectively via aerobic denitrifying bacteria as the DO concentration was 3–6 mg/L. DO and NO3–N were simultaneously reduced as the electron acceptors for COD degradation, and DO only accounted for 40% of total electron acceptor in COD degradation for the continuous wetting column. Nitrogen and COD can be effectively and steadily removed from reclaimed water during the long-term operation of a SAT system.
1. Introduction
Marginal-quality water (e.g., reclaimed water) has served as an important resource due to the shortage of fresh water. Reclaimed water, with most contaminants being removed compared to wastewater, is still characterized by a higher load of nutrients, dissolved organic matters, suspended solids and a more considerable salinity than fresh water. For instance, the salinity level in reclaimed water is about 1.5–2 times higher than that of fresh water. The average total dissolved solids of the reclaimed water in Beijing was in a range of 300–800 mg/L, while the concentration in reclaimed water in a range of 300–400 mg/L [1], respectively. As compared with fresh water, reclaimed water always contains a relatively high nitrogen content [2,3]. Direct use of reclaimed water (e.g., agriculture irrigation, river and lake recharge) has a risk of surface- and ground-water contamination [4,5], especially where groundwater is pumped for potable purposes. Reclaimed water is usually purified prior to its utilization to minimize the risk of pollution. Various purification techniques and facilities are applied for different reclaimed water reuses [6]. Soil aquifer treatment (SAT) is one of the widely used approaches to removing contaminants in reclaimed water.
SAT is a geo-purification system that utilizes biogeochemical processes during infiltration of the reclaimed water through soil strata to improve water quality [7,8]. Treatment benefits are initially achieved during vertical infiltration of reclaimed water through the unsaturated zone, and eventually during its horizontal movement in the saturated zone, before it is abstracted again from a recovery well. During percolation through a soil-aquifer system, various complicated physical, chemical and biological reactions take place, including filtration, sorption, ion exchange, precipitation, redox reactions, and biodegradation [9,10,11]. The performance of the treatment system is highly influenced by various factors including soil texture, initial water quality, soil microorganism community, hydraulic condition, water retention time and wetting and drying cycles [12,13,14]. Due to the complicated biogeochemical processes and corresponding impact factors as well as the complexity of soil and environment variability, soil columns are usually used to simulate the SAT system to understand the removal mechanism [13,15,16].
Soil, the basic media for contaminant removal, determines the fate, transformation and interactions of different contaminates. The ideal medium for a SAT is one that allows the rapid infiltration and complete removal of all constituents of concern. However, the attributes required to achieve one goal hampers the achievement of the other. In the SAT system, coarse-textured materials are desirable for infiltration because they transmit water readily; however, the large pores in these soils are inefficient at filtering out contaminants, and the solid surfaces adjacent to the main flow paths are relatively nonreactive. In contrast, fine-textured soils are efficient at contaminant adsorption and filtration, but they have low permeability, and their small pores may become clogged easily. The fine soils are also unfavorable for microorganism growth [15]. In reality, fine sand, loamy sand or sandy loam with relatively little structure is widely used for SAT systems.
In addition to the texture, the microorganism community in the soil also impacts the performance of the SAT system. Various biochemical processes in the SAT system—for example, mineralization, denitrification and nitrification—are dominated by the quantity and type of microorganisms, organic matter, temperature, and pH. In addition, variation in the concentrations of the electron acceptors and donors in a SAT system may change the dynamics of microbial community in the biofilms environment [17]. On the other hand, these processes affect the growth of microorganisms and their community structure. Thus, soil biomass is used as an indicator for the biological removal of organic carbon in the reclaimed water of the SAT system [18]. Abel [19] has investigated the effects of biological activity on the removal of bulk organic matter and nitrogen from primary treated wastewater, and has detected that the removal of dissolved organic carbon (DOC) is largely influenced (positive correlation) by the extent of microbial activity in the simulated SAT system. Organic matter in the reclaimed water is adsorbed and decomposed by the heterotrophic bacteria (under both aerobic and anaerobic conditions) in the SAT system. Simultaneously, biomass and microbial community in the SAT system are affected by the bioavailable organic carbon and attempt to maintain a relatively steady microorganism state [18,20]. Nitrogen removal results from the combination of nitrification and denitrification, which is highly related to the amount and structure of nitrifying and denitrifying bacteria [21,22]. However, the relationship between the number of microorganism and the contents of organics and nutrients, and the specific effect of the microorganism on the removal of chemical oxygen demand (COD) and nitrogen under different redox conditions are not fully known during SAT.
Microbial denitrification is an important mechanism for nitrate removal via converting NO3 to nitrogen gases (N2 and N2O), which can occur under anaerobic or anoxic conditions [23,24]. The existence and growth of denitrifiers have also been reported to occur under various aerobic environments [25,26]. Large numbers of denitrifying bacteria have been isolated from activated sludge and soil that were capable of respiring oxygen and nitrate simultaneously under aerobic conditions. The rate of aerobic denitrification is affected by dissolved oxygen concentration, C/N ratio, temperature and pH. Among these parameters, dissolved oxygen concentration and organic carbon concentration are the major factors affecting the dentrification reaction [26,27]. Patureau et al. [27] have found that denitrification was observed to occur in aerobic environments even at air saturation conditions. The higher carbon concentration as an energy source for cell growth and nitrate reduction processes promotes the denitrification reaction of aerobic denitrifer [27]. However, an extremely high concentration of the carbon source inhibited the aerobic denitrification processes [28,29]. Different enzymes and species in the denitrification pathway in the aerobic denitrifier responded to different oxygen concentrations and C/N ratios [23,26,27]. Even though the relevance of bacterial communities that live in SAT systems is widely recognized, the quantification and distribution of bacteria in the systems has not been well understood and some microbiological aspects are still challenging.
The hydraulic condition (hydraulic loading rate, wetting pattern) is another important operating parameter in determining the removal efficiency of the SAT system [30,31]. The infiltration rate, retention time, aerobic/anoxic and biochemical processes are affected by the hydraulic conditions [32,33]. The length of wetting period was an important parameter affecting nitrogen removal efficiency of SAT columns [34]. The cyclic operation of wetting and drying helps in restoration of infiltration rates and allows oxygen to diffuse to the underlying soil. Abel et al. [34] found that reduction of NH4–N increased significantly with an increase in drying period, suggesting a positive effect on NH4–N as compared to continuous application of primary effluent. Longer drying periods accelerated the reduction of NH4–N by nitrifying bacteria. A corresponding high NO3–N concentration was observed during the longest dying periods [35]. Güngör and Ünlü [34] found that the denitrification performance of the SAT columns decreased significantly when the infiltration operation schedule was switched from 7 days wetting/7 days drying cycles to 3 days wetting/4 days drying cycles. Ak and Gunduz [36] have detected that removal of complex organic matter in treated wastewater is related to the wetting period. Thus, hydraulic conditions have different impacts on the removal of various contaminants and biogeochemical processes. In this study, two laboratory-scale columns were operated at two different hydraulic loading rates to investigate the effect of hydraulic loading rates on the reduction of nitrogen and organics.
The purpose of this paper is (i) to investigate the removal efficiency of nitrogen and COD in the reclaimed water through a long term simulated SAT system during a relatively long running period; (ii) to study the impact of hydraulic conditions on the performance of the SAT system; (iii) to understand the active function of the microorganism community in the soil column on contaminate removal; (iv) to quantitatively analyze the relationship of microorganism species and their consumption of nitrate, dissolved oxygen (DO) and COD.
2. Materials and Methods
2.1. Experiment Setup
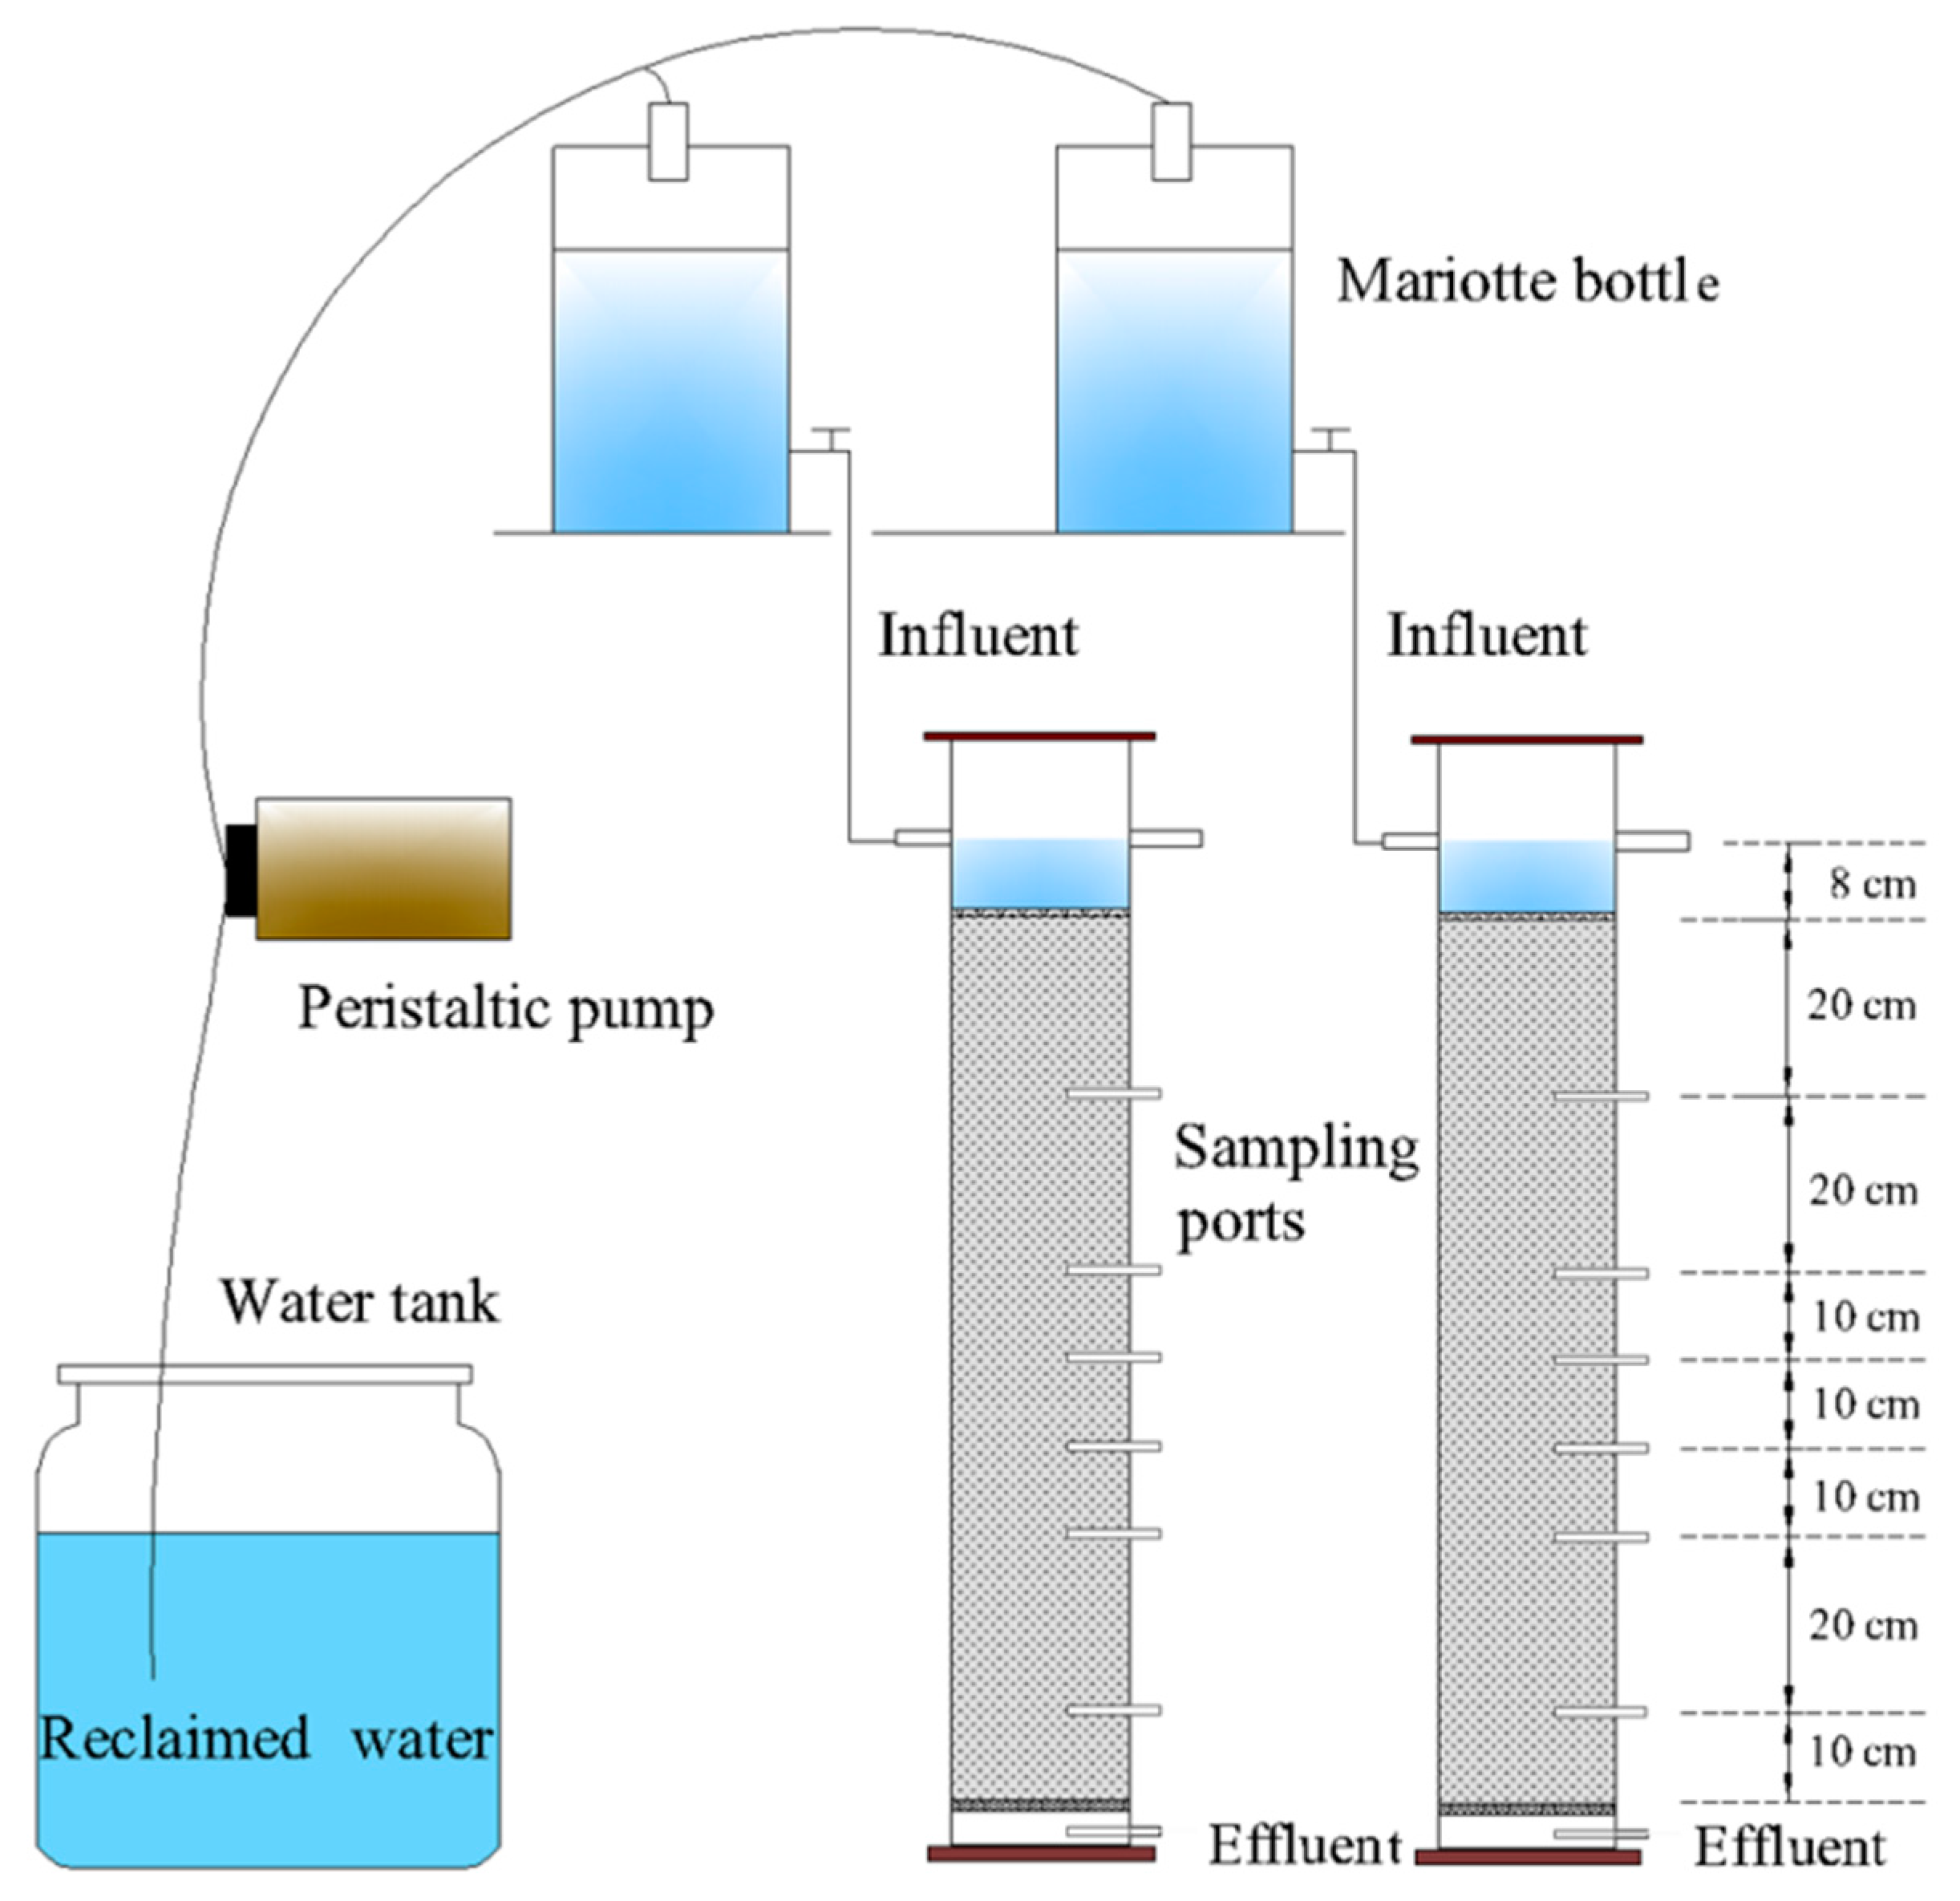
The nitrogen and COD removal experimental setup consisted of two 125 cm plexiglass columns (inner diameter of 19 cm), two Mariotte bottles, a water tank and a peristaltic pump. The Mariotte bottles were placed on a steel frame to supply reclaimed water for the soil columns. Along the soil column, a series of sampling ports were installed at the depths of 20, 40, 50, 60, 70 and 90 cm from the soil surface. The distance between the sampling ports is settled at every 20 cm, while extra sampling ports were added when there was a notable change in soil texture. In each sample port, a porous ceramic cup was set in the center of the column with a slightly downward angle (approximately 15°–20°) to ensure the emission of the gas upward smoothly. The other side of the ceramic cup was connected to the sampling bottle through a polyethylene tube. The porous ceramic cup (manufactured by Institute of Geographic Science and Natural Resources Research, CAS, Beijing, China), with the length of 28 mm and the diameter of 8 mm, was made of clay materials with the particle size of 0.2 μm. In the bottom of the soil column, a porous baffle was installed to prohibit the leaching of fine soil particles. The detailed experimental setup is illustrated in Figure 1.
The test soil in the columns was sampled from the Tongzhou experimental station in Beijing (latitude: 398,360 N; longitude: 1,168,480 E; 20 m above sea level). Texture analysis showed that the soil was silt loam according to the USDA soil texture triangle. The physical and chemical properties of the test soil are tabulated in Table 1. The sampled soil was air-dried and passed through the 2 mm sieve prior to packing. The soil column was packed corresponding to the field profile with increments of 2 cm. The interface of layers was stirred during the packing to minimize heterogeneity. The height of the packed soil was 100 cm. The mean bulk density of the packed soil was 1.50 g/cm3 and the porosity was around 0.42. The soil columns and reclaimed water were kept at room temperature and enveloped with opaque cloth to avoid light in order to minimize algal growth. Although the experiment was carried out in a room, the water temperature ranged from 15 to 31 °C with the seasonal variation of room temperature.
Soil columns were saturated from the bottom using deionized water, which took 5 days to reach the saturated equilibrium. Then the soil columns were flushed from the top prior to the experimental treatment. The flushing was terminated when no NO3–N and NH4–N was detected in the effluents. Subsequent to the flushing process, reclaimed water was supplied from the column top. The reclaimed water was taken from the Qinghe Wastewater Treatment Plant periodically and stored in an opaque water tank. The water quality parameters are presented in Table 2. The NO3–N concentration exceeded the drinking water standard of China (<10 mg/L).
Two hydraulic conditions, continuous wetting and wetting/drying cycles, were applied for the nitrogen and COD removal treatments. In the continuous wetting column, reclaimed water was continuously applied under the 8 cm hydraulic head. In the wetting/drying column, reclaimed water was ponded with a depth of 8 cm for 2 days and then removed immediately. Subsequent to removal of ponding water, the soil column was left drying (free drainage) for 5 days. Thus, one period of wetting and drying cycle was 7 days. Water samples in the columns were taken after the second wetting day of each wetting/drying cycle, and simultaneously, samples were collected from the continuous wetting column. The influents and effluents at the column bottom were also collected periodically. The experiment was carried out for more than three years.
Water samples were collected with a prescheduled arrangement to analyze the concentration of NO3–N, NH4–N, COD and DO. The collected samples were filtered by a 0.45 μm membrane filter (Heng Odd H9059, Beijing, China) before analysis. The concentrations of NO3–N and NH4–N were measured using the UV-absorbance spectrophotometer method (JH756 UV/Vis spectrophotometer, Shanghai, China) [37]. COD was analyzed with the spectrophotometer method (DR/2400 spectrophotometer, Loveland, CO, USA). The water sample was measured immediately after sampling. DO was measured by a dissolved oxygen meter (Hach Sension 6, Loveland, CO, USA) with measuring errors within ±1% in a lab room based on the instrument instruction manual.
At the end of the third experimental year, soils in both columns were sampled at various depths from the soil surface (5, 20, 40, 50, 60, 70 and 90 cm) to analyze the microorganism community. After sampling, 1 g soil was added in 99 mL of sterile water and the mixture was shaken for 30 min (at the rate of 170 r/min) at room temperature of 25 ± 0.5 °C. One milliliter of the soil suspension was then diluted serially (ten-fold) and used in the estimation of the amount of bacteria (denitrifying bacteria, nitrifying and nitrite bacteria) and fungi by standard spread-plate dilution method, in triplicate. Various culturing medium were chosen for bacteria and fungi. Colonies were counted after incubation, 5 days for bacteria and 7 days for fungi [38].
2.2. Adsorption Experiment
The NH4–N is less mobile compared to NO3–N because it is easily adsorbed on soil particles due to its positive charge. Adsorption batch tests were conducted to investigate the NH4–N adsorption capacity. Soil samples were placed into 250 mL conical flasks, and solutions with different NH4–N concentrations (ammonium sulfate) were added to each flask. The ratio of soil weight to solution volume was 1:20. The conical flasks were shaken for 24 h (at the rate of 160 r/min) at room temperature of 25 ± 0.5 °C. Subsequent to the vibration, the mix solutions from conical flasks were filtered through a 0.45 μm membrane filter and the NH4–N concentration was measured. The soil adsorption capacity for NH4–N, q (mg/g), is expressed as:
where C0 is the initial concentration of the NH4–N in the ammonium sulfate solution (mg/L), C is the equilibrium concentration of the NH4–N in the equilibrium soil solution (mg/L), V is the volume of soil solution (L), and M is the mass of soil (g).
3. Results
3.1. Nitrogen Concentration and Its Removal Efficiency
Nitrogen in the water sample was mainly in the forms of NO3–N, NH4–N and organic nitrogen. The NO3–N accounted for around 90% of the total nitrogen in the influent, so the removal efficiency of nitrogen depended mainly on that of NO3–N reduction.
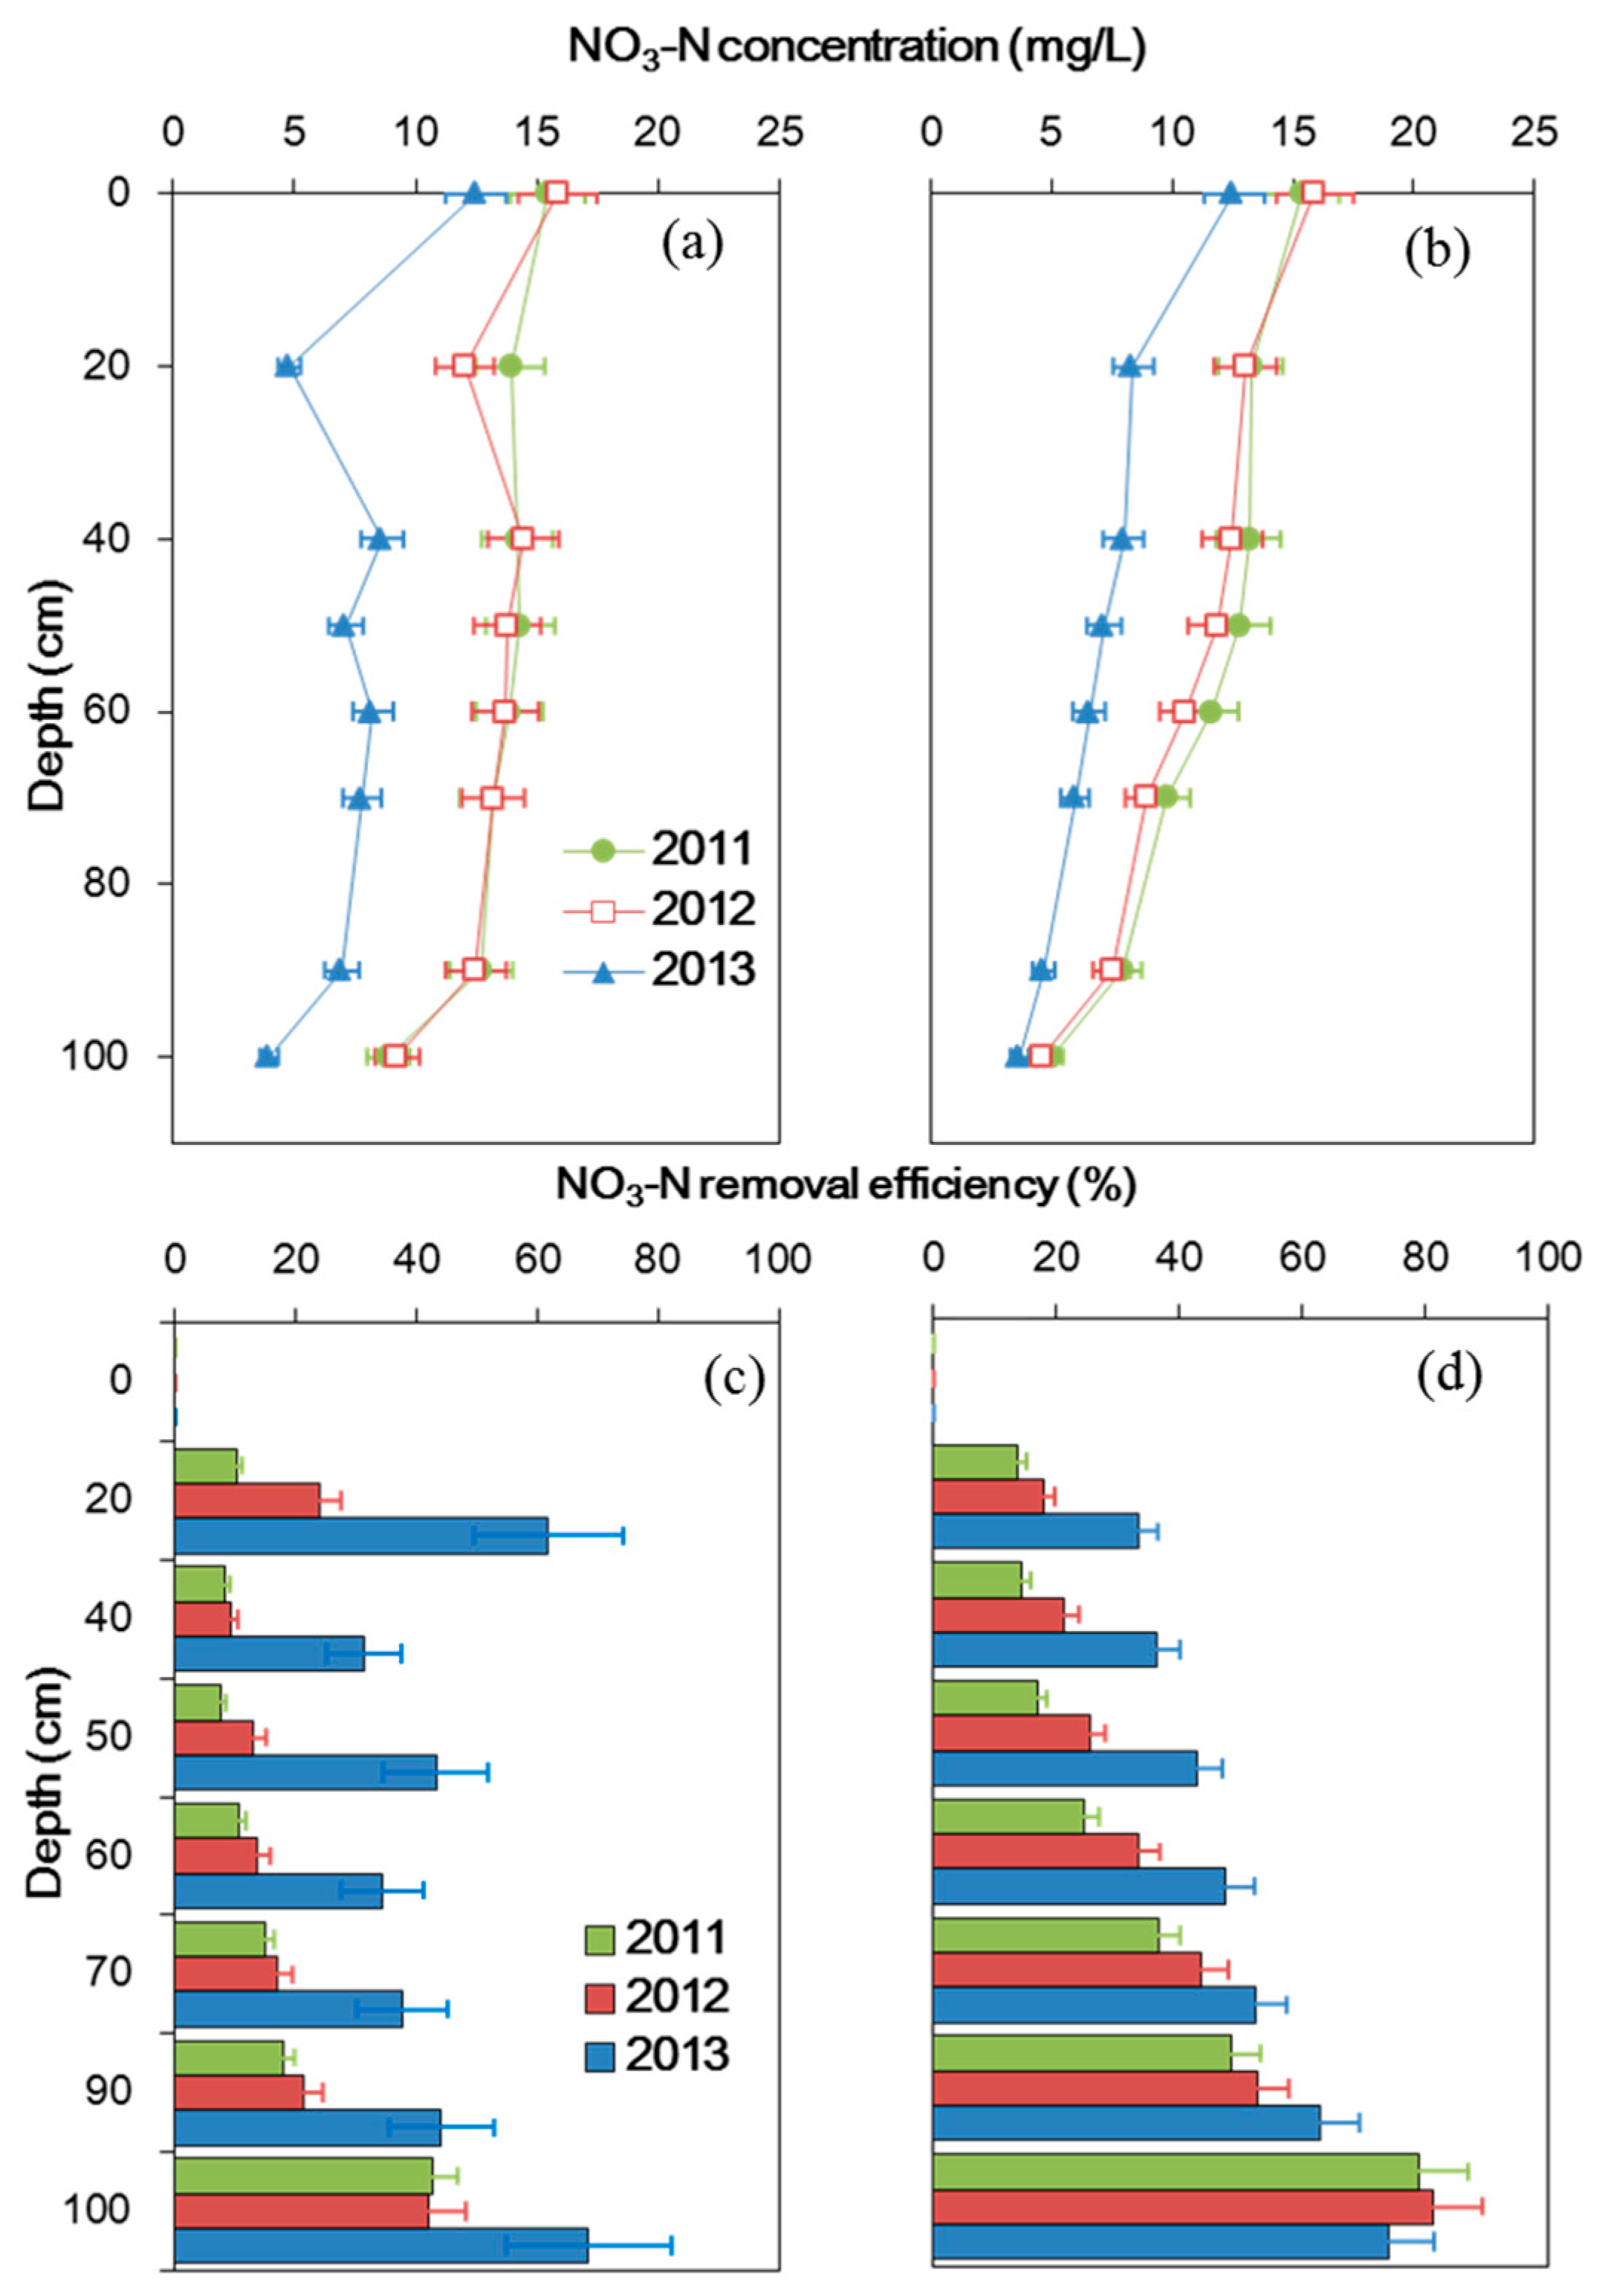
Figure 2 illustrates the annual average NO3–N concentration distribution in the soil columns and the corresponding removal efficiencies during the three-year period under different hydraulic conditions. For each soil column, the NO3–N concentration profiles were not evidently different in the first two experimental years (2011 and 2012). The average NO3–N concentration in the influent was 15.6 mg/L, and the concentrations in the effluents were 9.0 and 4.8 mg/L for the first two years in the continuous wetting and wetting/drying columns, respectively. Both concentrations in the effluents are lower than the drinkable water standard (<10 mg/L). The corresponding NO3–N removal efficiencies were 42% and 69% in the continuous wetting and wetting/drying soil columns, respectively. In the third year, the mean NO3–N concentration was 12.5 mg/L in the influent, and those for the effluents were 4.0 and 3.7 mg/L for the continuous wetting and wetting/drying columns, respectively. NO3–N removal efficiencies were 68% and 71% under the saturated and unsaturated conditions (Figure 2c,d), respectively.
The annual mean NO3–N concentration profile along the soil columns varied under different hydraulic conditions. For the continuous wetting column, the concentration changed slightly (almost constant around 13.2 mg/L) along the column in the first two experimental years (Figure 2a). In contrast to the saturated condition, the NO3–N concentration decreased gradually from the top to the bottom for the wetting/drying column (decreased from 15.6 to 4.8 mg/L) in the first two experimental years. In the third experimental year, the variation trend in the NO3–N concentration profile was consistent with those in the first two years, but the value of the concentrations at different depths were lower than those in the first two experimental years under both hydraulic conditions. The values of the concentrations were lower in the third experimental year resulting from the relatively low concentration in the influents. It is worth noting that a relatively low NO3–N concentration was observed at the 20 cm sampling depth of the continuous wetting column in the third experimental year. The NO3–N removal efficiency was higher in the third experimental year (around 42%) than the previous two years (Figure 2c) in the continuous wetting column. Contrary to the saturated condition, the removal efficiency of NO3–N monotonically increased from 22% to 78% with depth for the wetting/drying column, and the removal efficiencies were not obviously different in the three experimental years.
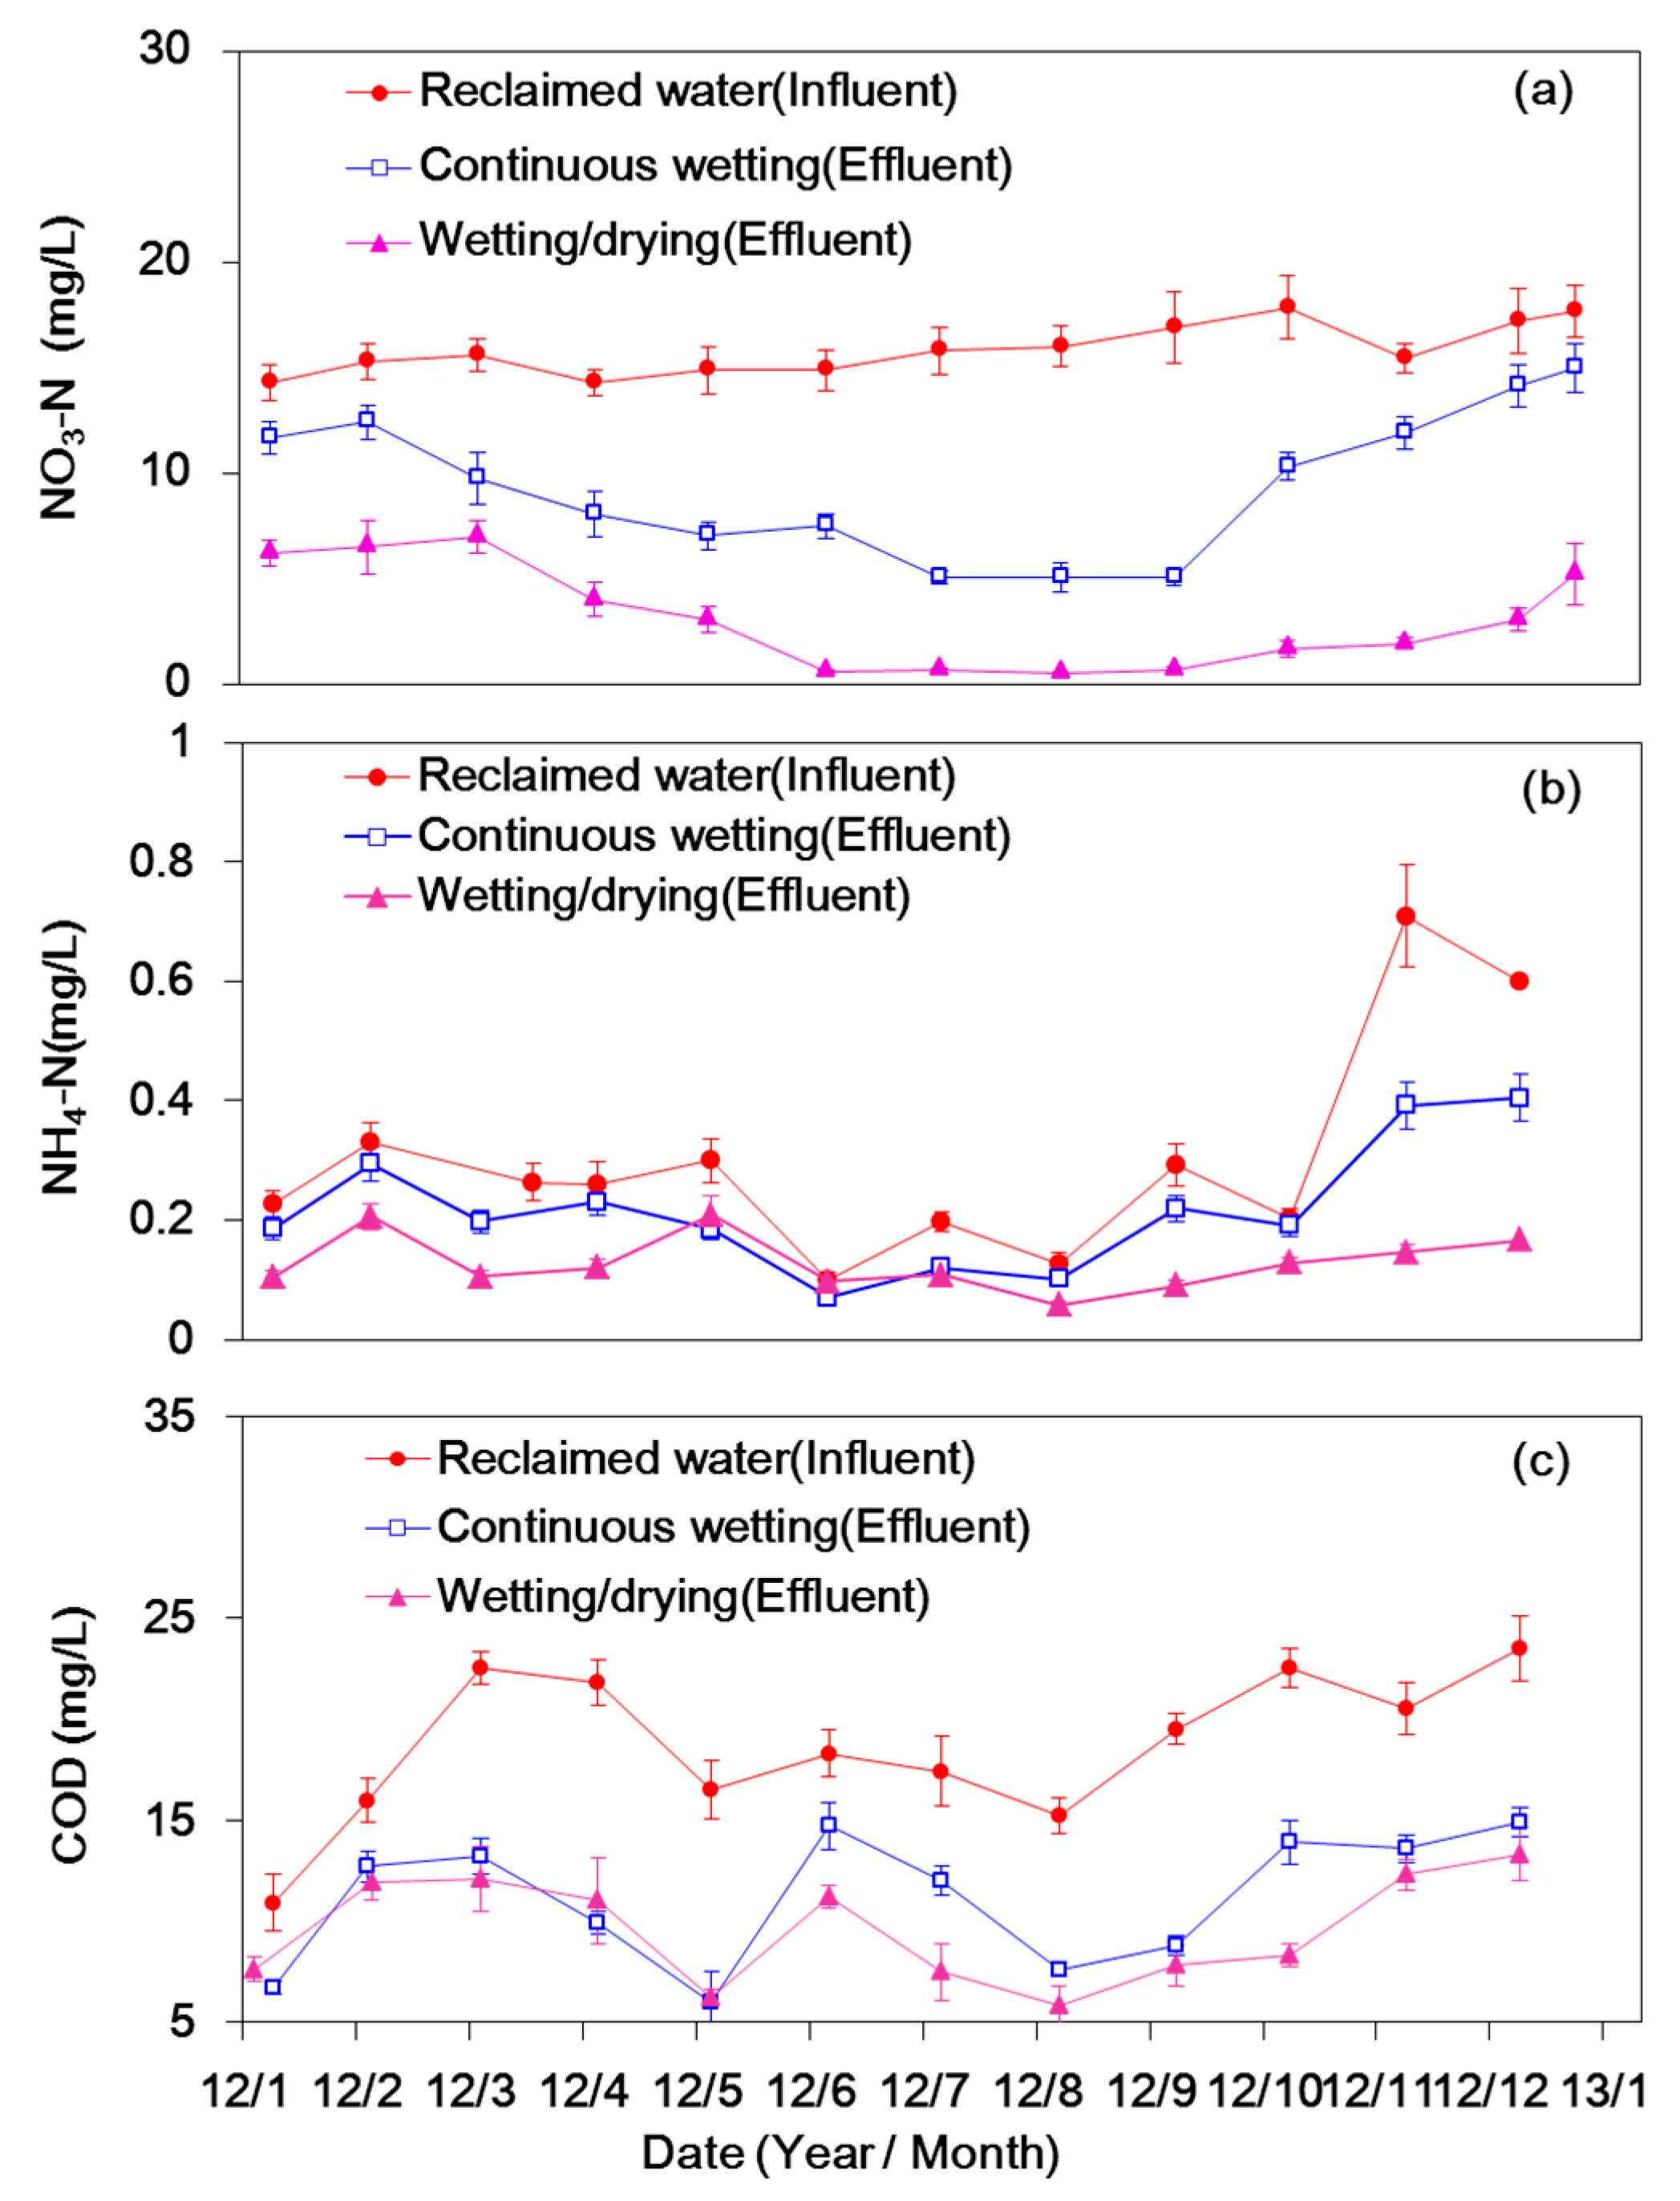
The temporal variations of NO3–N concentration in 2012 are presented in Figure 3a. The average concentration in the influent was 15.6 ± 1.6 mg/L, whereas that in the effluent was different for the continuous wetting and wetting/drying columns. For different hydraulic conditions, a large amount of NO3–N removal took place in summer, and the highest NO3–N concentration in the effluent occurred in January, which is the coldest month of the winter season in Beijing. This result suggested that favorable temperatures can promote the activity of microorganisms; thus, a higher NO3–N removal efficiency was expected. The detected NO3–N in the effluent for the wetting/drying column was significantly lower than that for the continuous wetting one. Similar variation was obtained in the other experimental years (2011 and 2013).
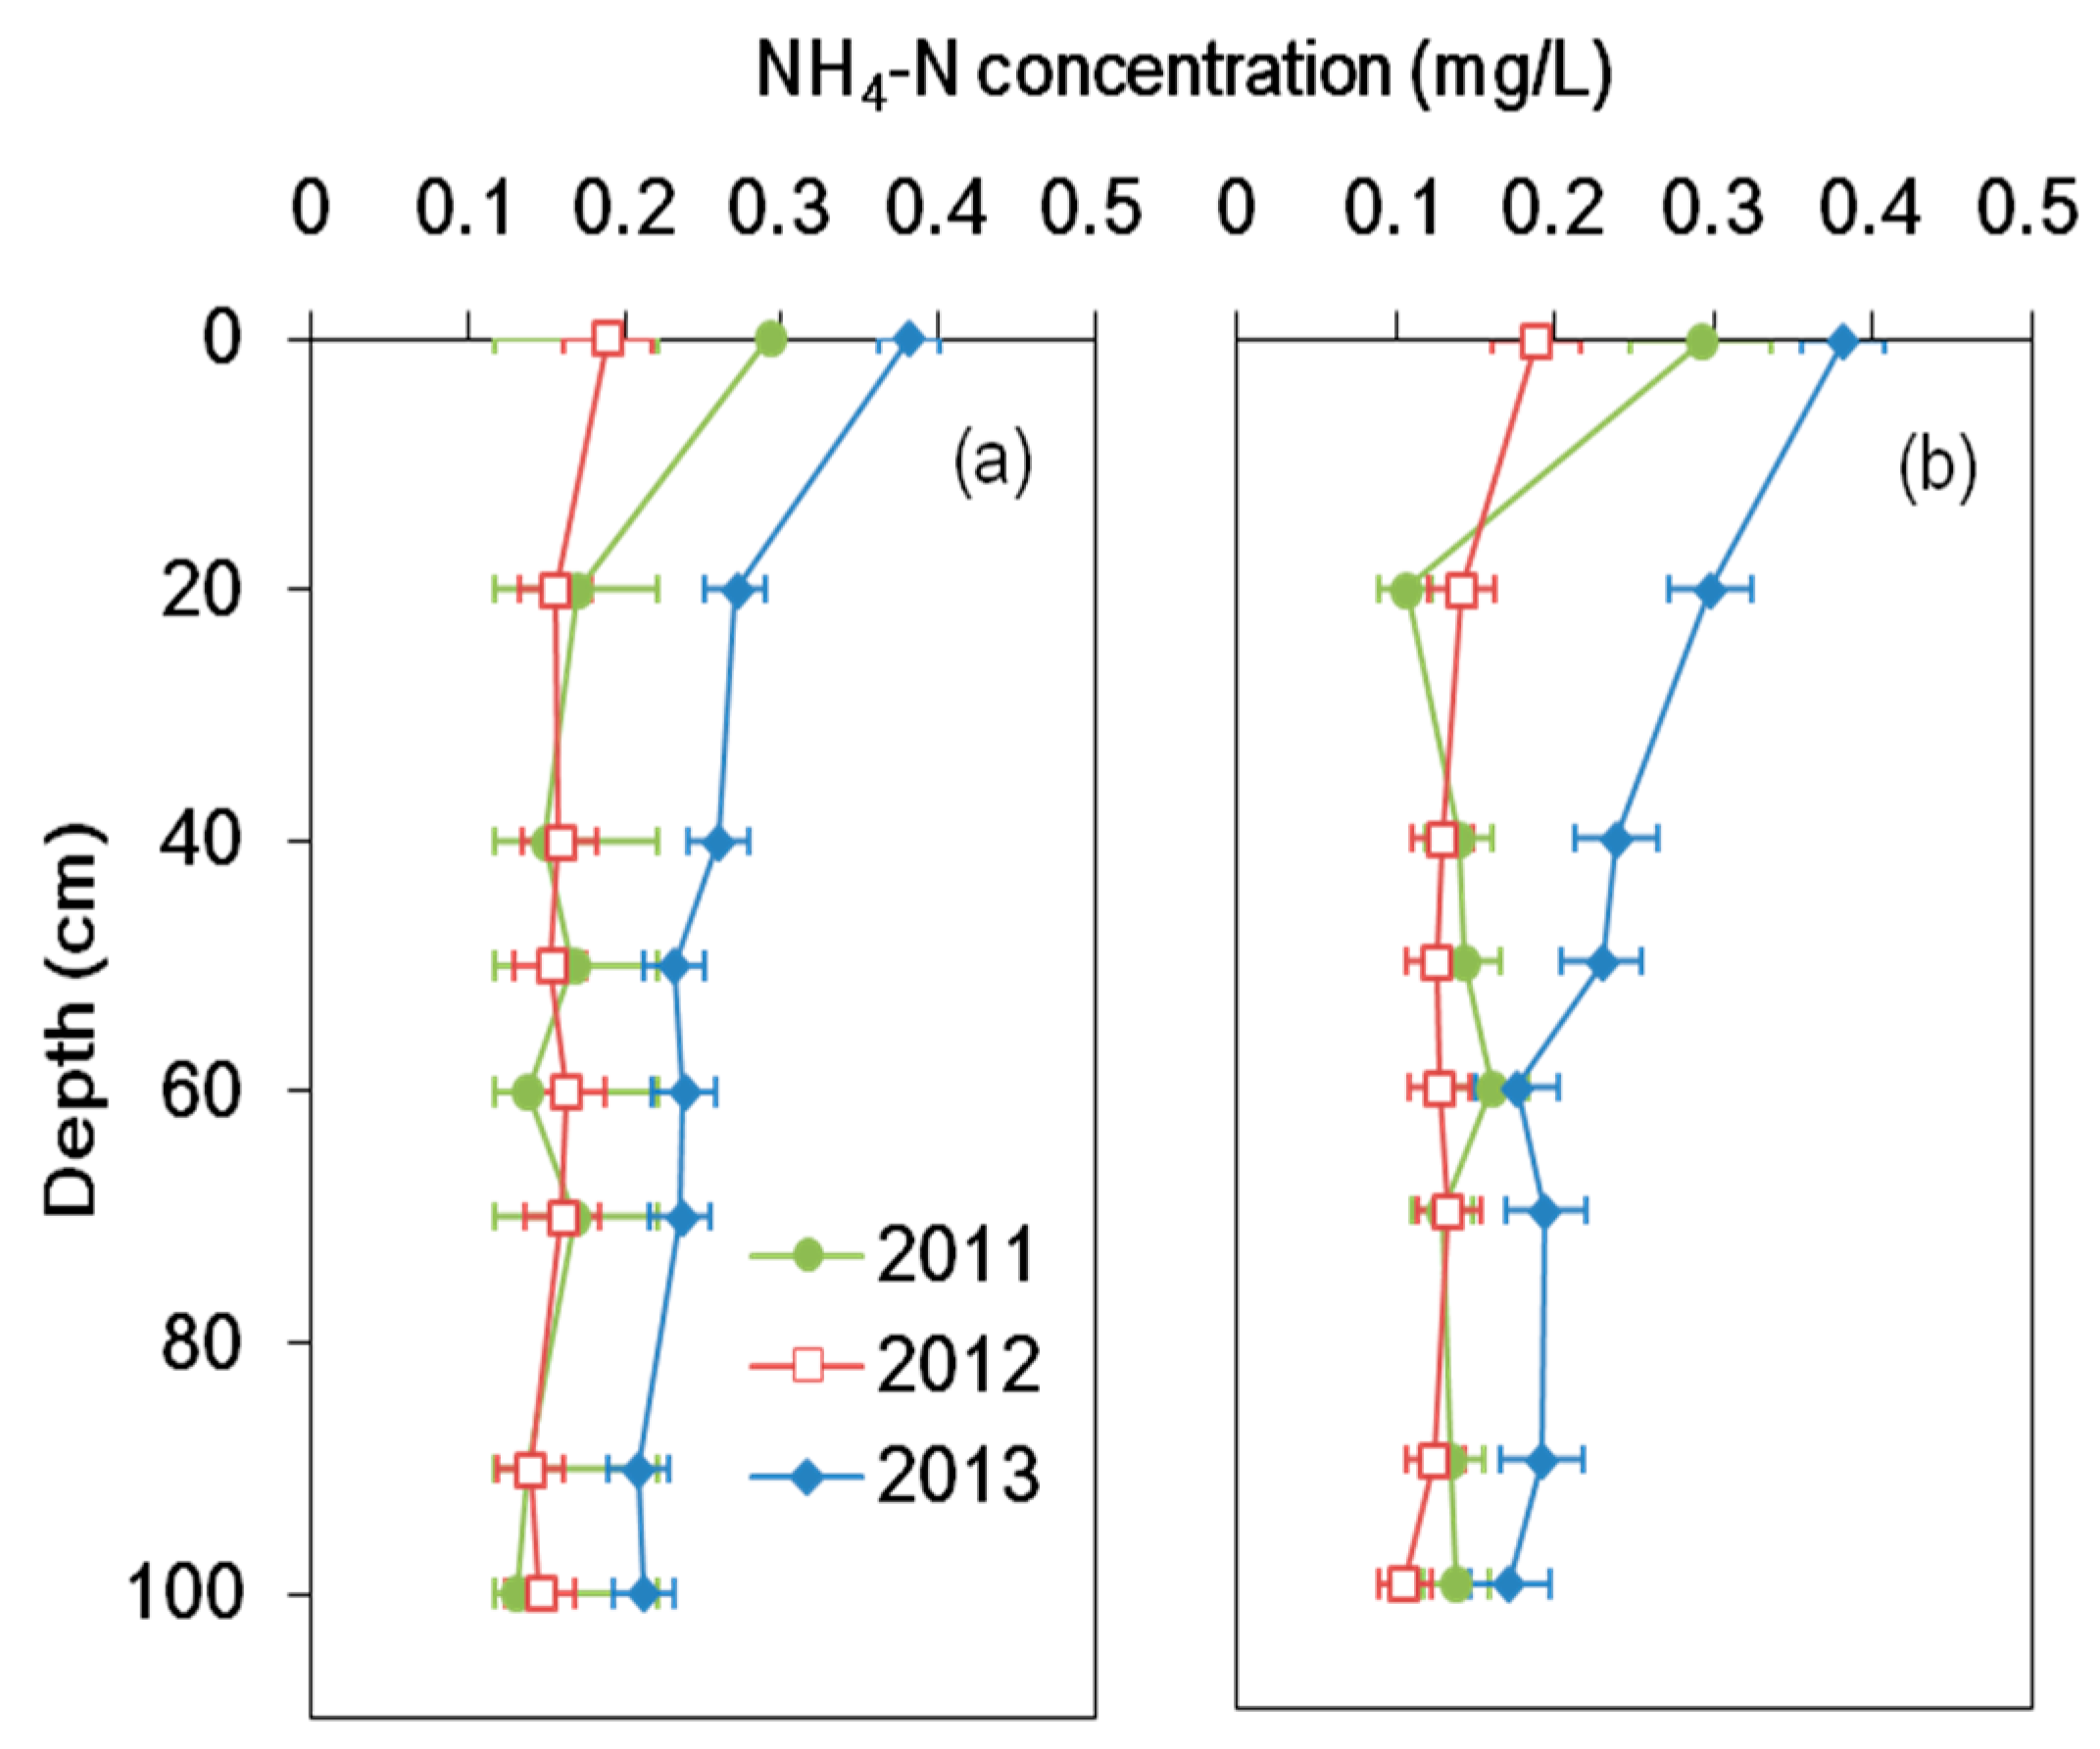
The annual average NH4–N concentration profiles in the soil columns are presented in Figure 4. The NH4–N concentration in the influent was relatively low, accounting for only 1.6% of the total nitrogen. The average concentrations in the influents were different and varied between 0.18 and 0.71 mg/L during the three experimental years. The NH4–N concentration profiles did not evidently vary in the first two years for both columns. Due to the relatively high NH4–N concentrations in the influents, the concentration profiles were higher in the third year. For both hydraulic conditions, the variation trends of mean NH4–N concentrations along the soil columns were consistent for the three experimental years. The NH4–N concentration decreased in the first 20 cm depth of soil columns, and the corresponding average removal efficiency was 29% and 37% in the continuous wetting and wetting/drying columns, respectively. Except for the top 20 cm, the NH4–N concentrations changed slightly along the soil profile. The NH4–N removal efficiency (53%) was higher in the wetting/drying column than that in the continuous wetting one (41%). Figure 3b depicts the temporal variations of NH4–N concentrations in 2012. The detected NH4–N in the effluent of the wetting/drying column was slightly lower than that of the continuous wetting one. The NH4–N in the effluents in both columns was lower than that in the reclaimed water. In contrast to the NO3–N concentration, the NH4–N concentration in the effluents did not show a significant seasonal variation.
3.2. DO Consumption and COD Removal
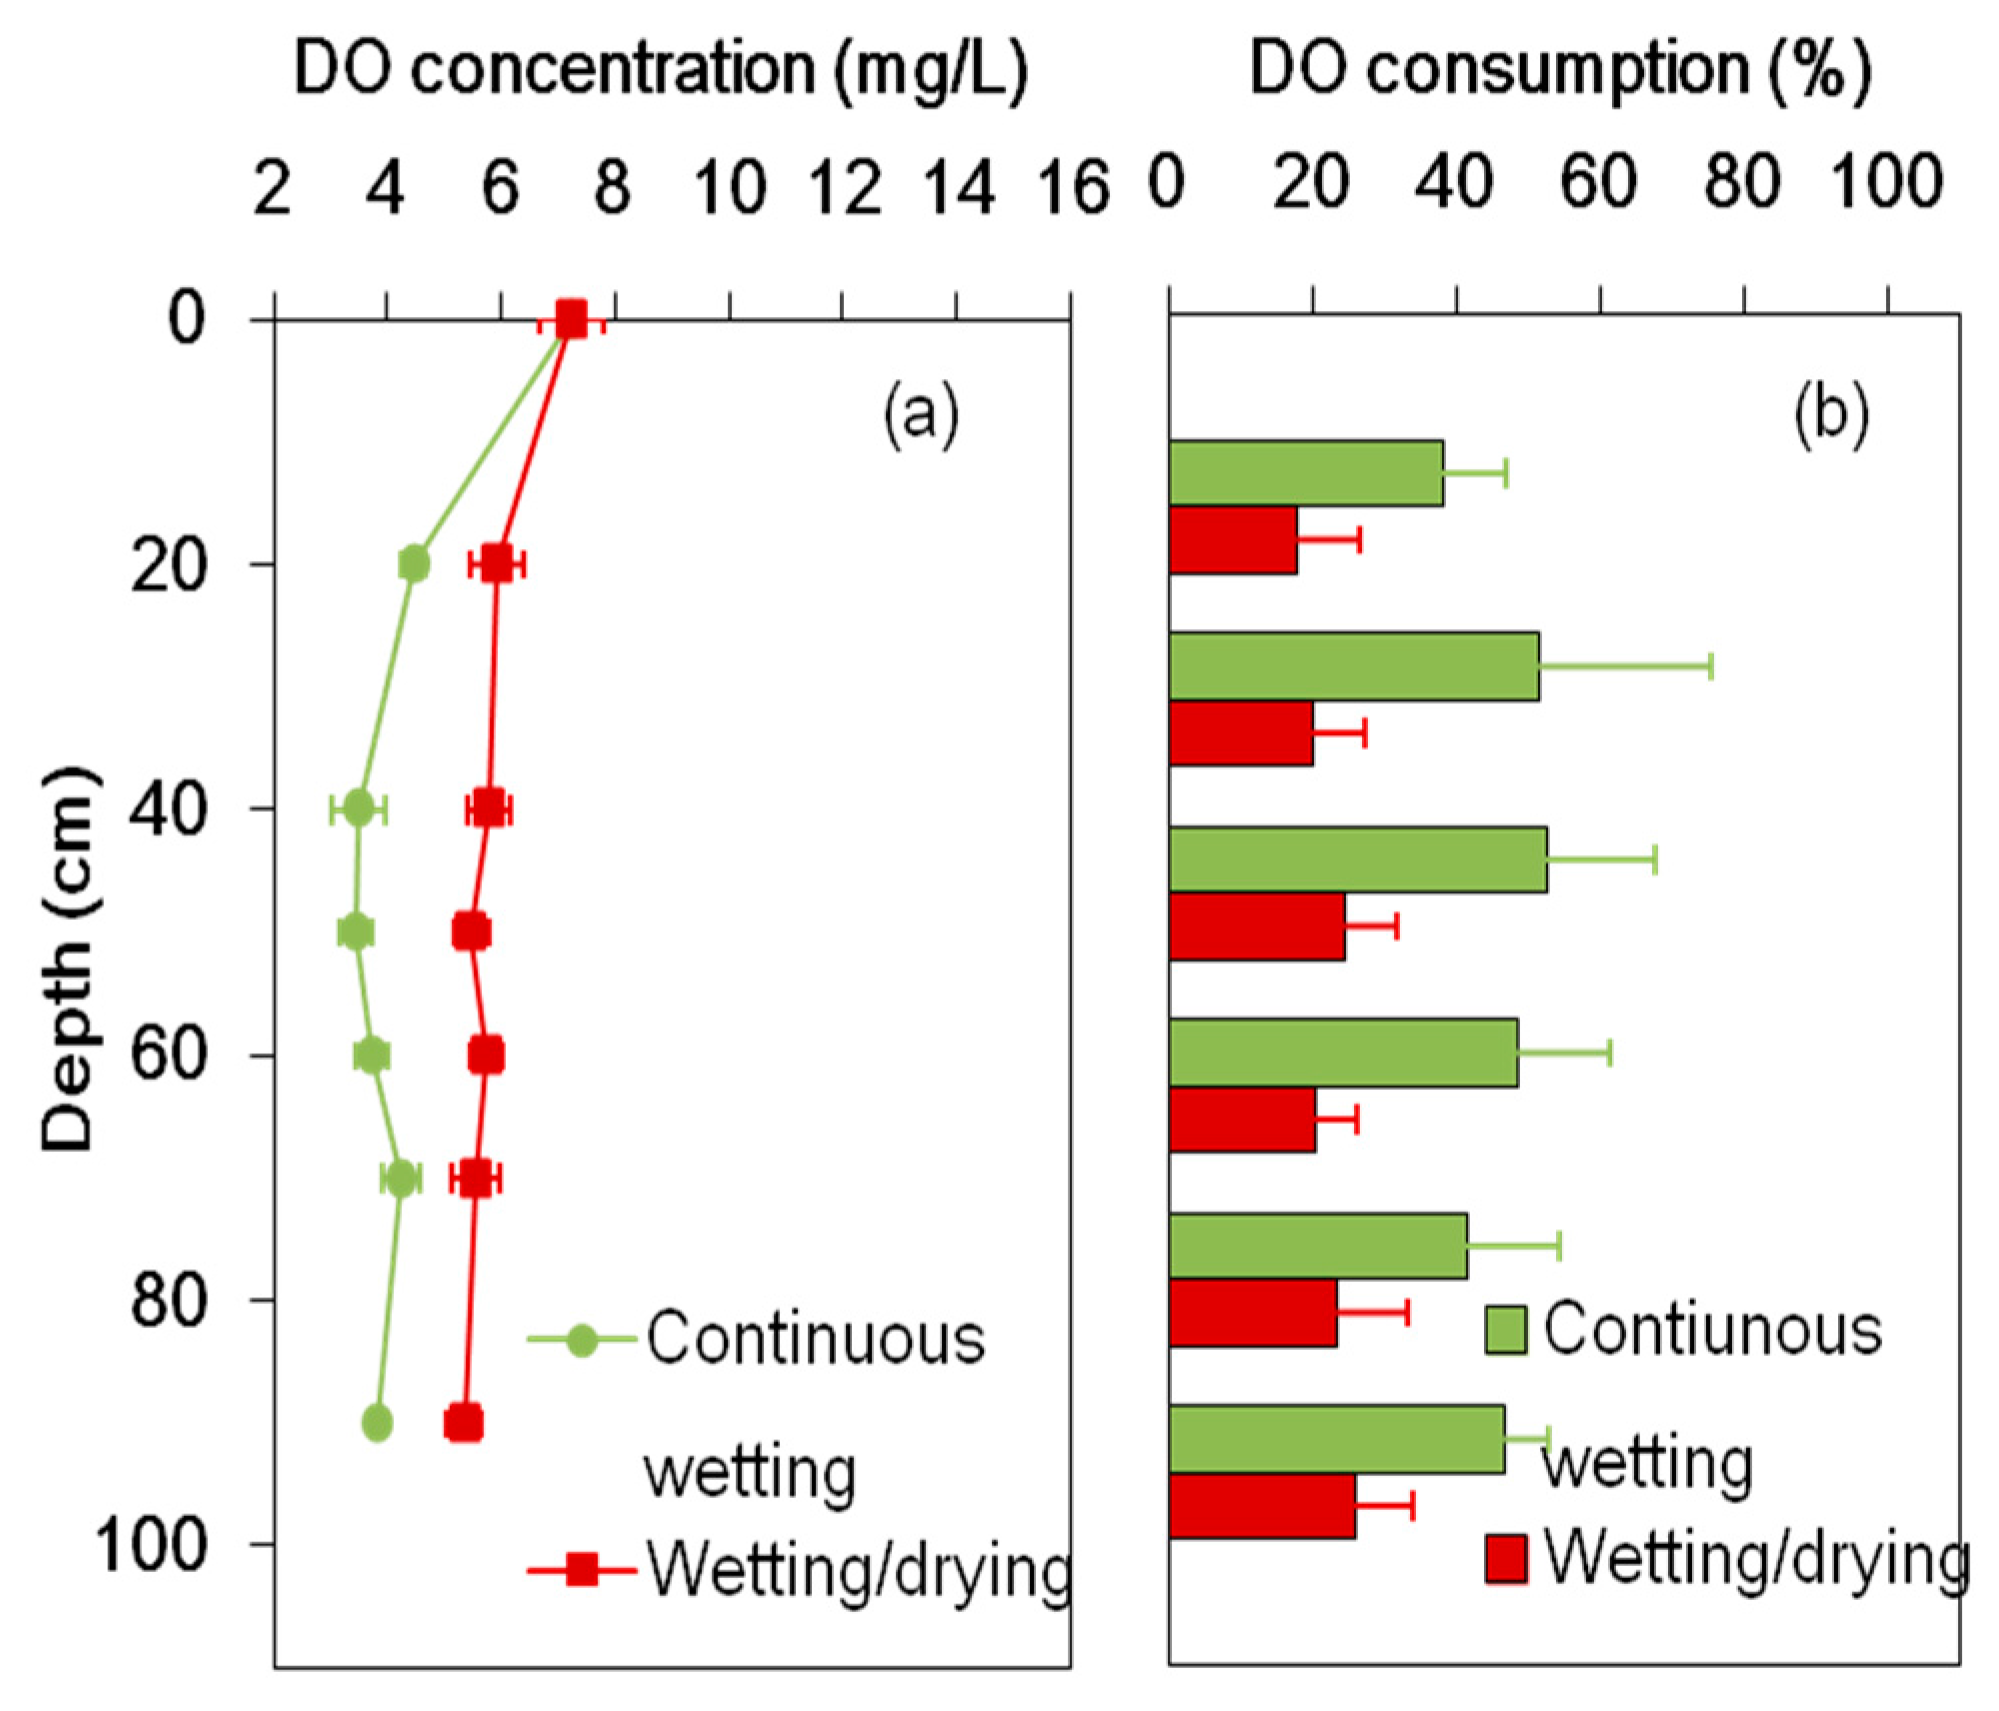
The monthly mean DO concentration was 7.25 mg/L in the influents (Figure 5). The DO concentration decreased generally with soil depth. The DO concentrations in the effluents were 3.8 and 5.3 mg/L for the continuous wetting and wetting/drying columns, respectively. Correspondingly, 47% and 26% of the DO in the reclaimed water was consumed. For both soil columns, a large portion of the DO was consumed in the top 20 cm soil layer. For those layers lower than 20 cm, the DO concentrations were maintained between 3.5 and 5.5 mg/L, and no evident variation was identified. Relatively high DO concentrations in the wetting/drying column might be caused by oxygen replenishment during the drying periods.
The annual mean COD concentration and the corresponding removal efficiencies in the first two experimental years are shown in Figure 6. In the third year, the samples collected from the sampling ports were not enough for COD analysis due to soil clogging. The COD concentration profiles were not significantly different for soil columns with different hydraulic conditions. The average COD concentration was 19.3 mg/L in the influents. The concentrations for the effluents were 11.4 and 9.6 mg/L, and the corresponding average COD removal efficiencies were 40.9% and 50.2%, respectively (Figure 6). The COD concentrations decreased rapidly within the first 20 cm of soil columns, with 33.7% and 53.3% COD removed at top 20 cm soil layers for continuous wetting and wetting/drying treatments, respectively.
The temporal variations of the COD concentrations in 2012 are shown in Figure 3c. Temporal variation of the COD concentrations in the effluent was consistent with that in the influent. The COD concentrations in the effluents changed between 5.8 and 14.9 mg/L, and the COD concentrations in the influents ranged from 15.2 to 23.5 mg/L within a year. The concentrations in the effluents and their variation trends were similar for different hydraulic conditions. The COD concentration in the effluents did not show a significant seasonal variation for the continuous wetting and wetting/drying columns.
3.3. Microorganisms
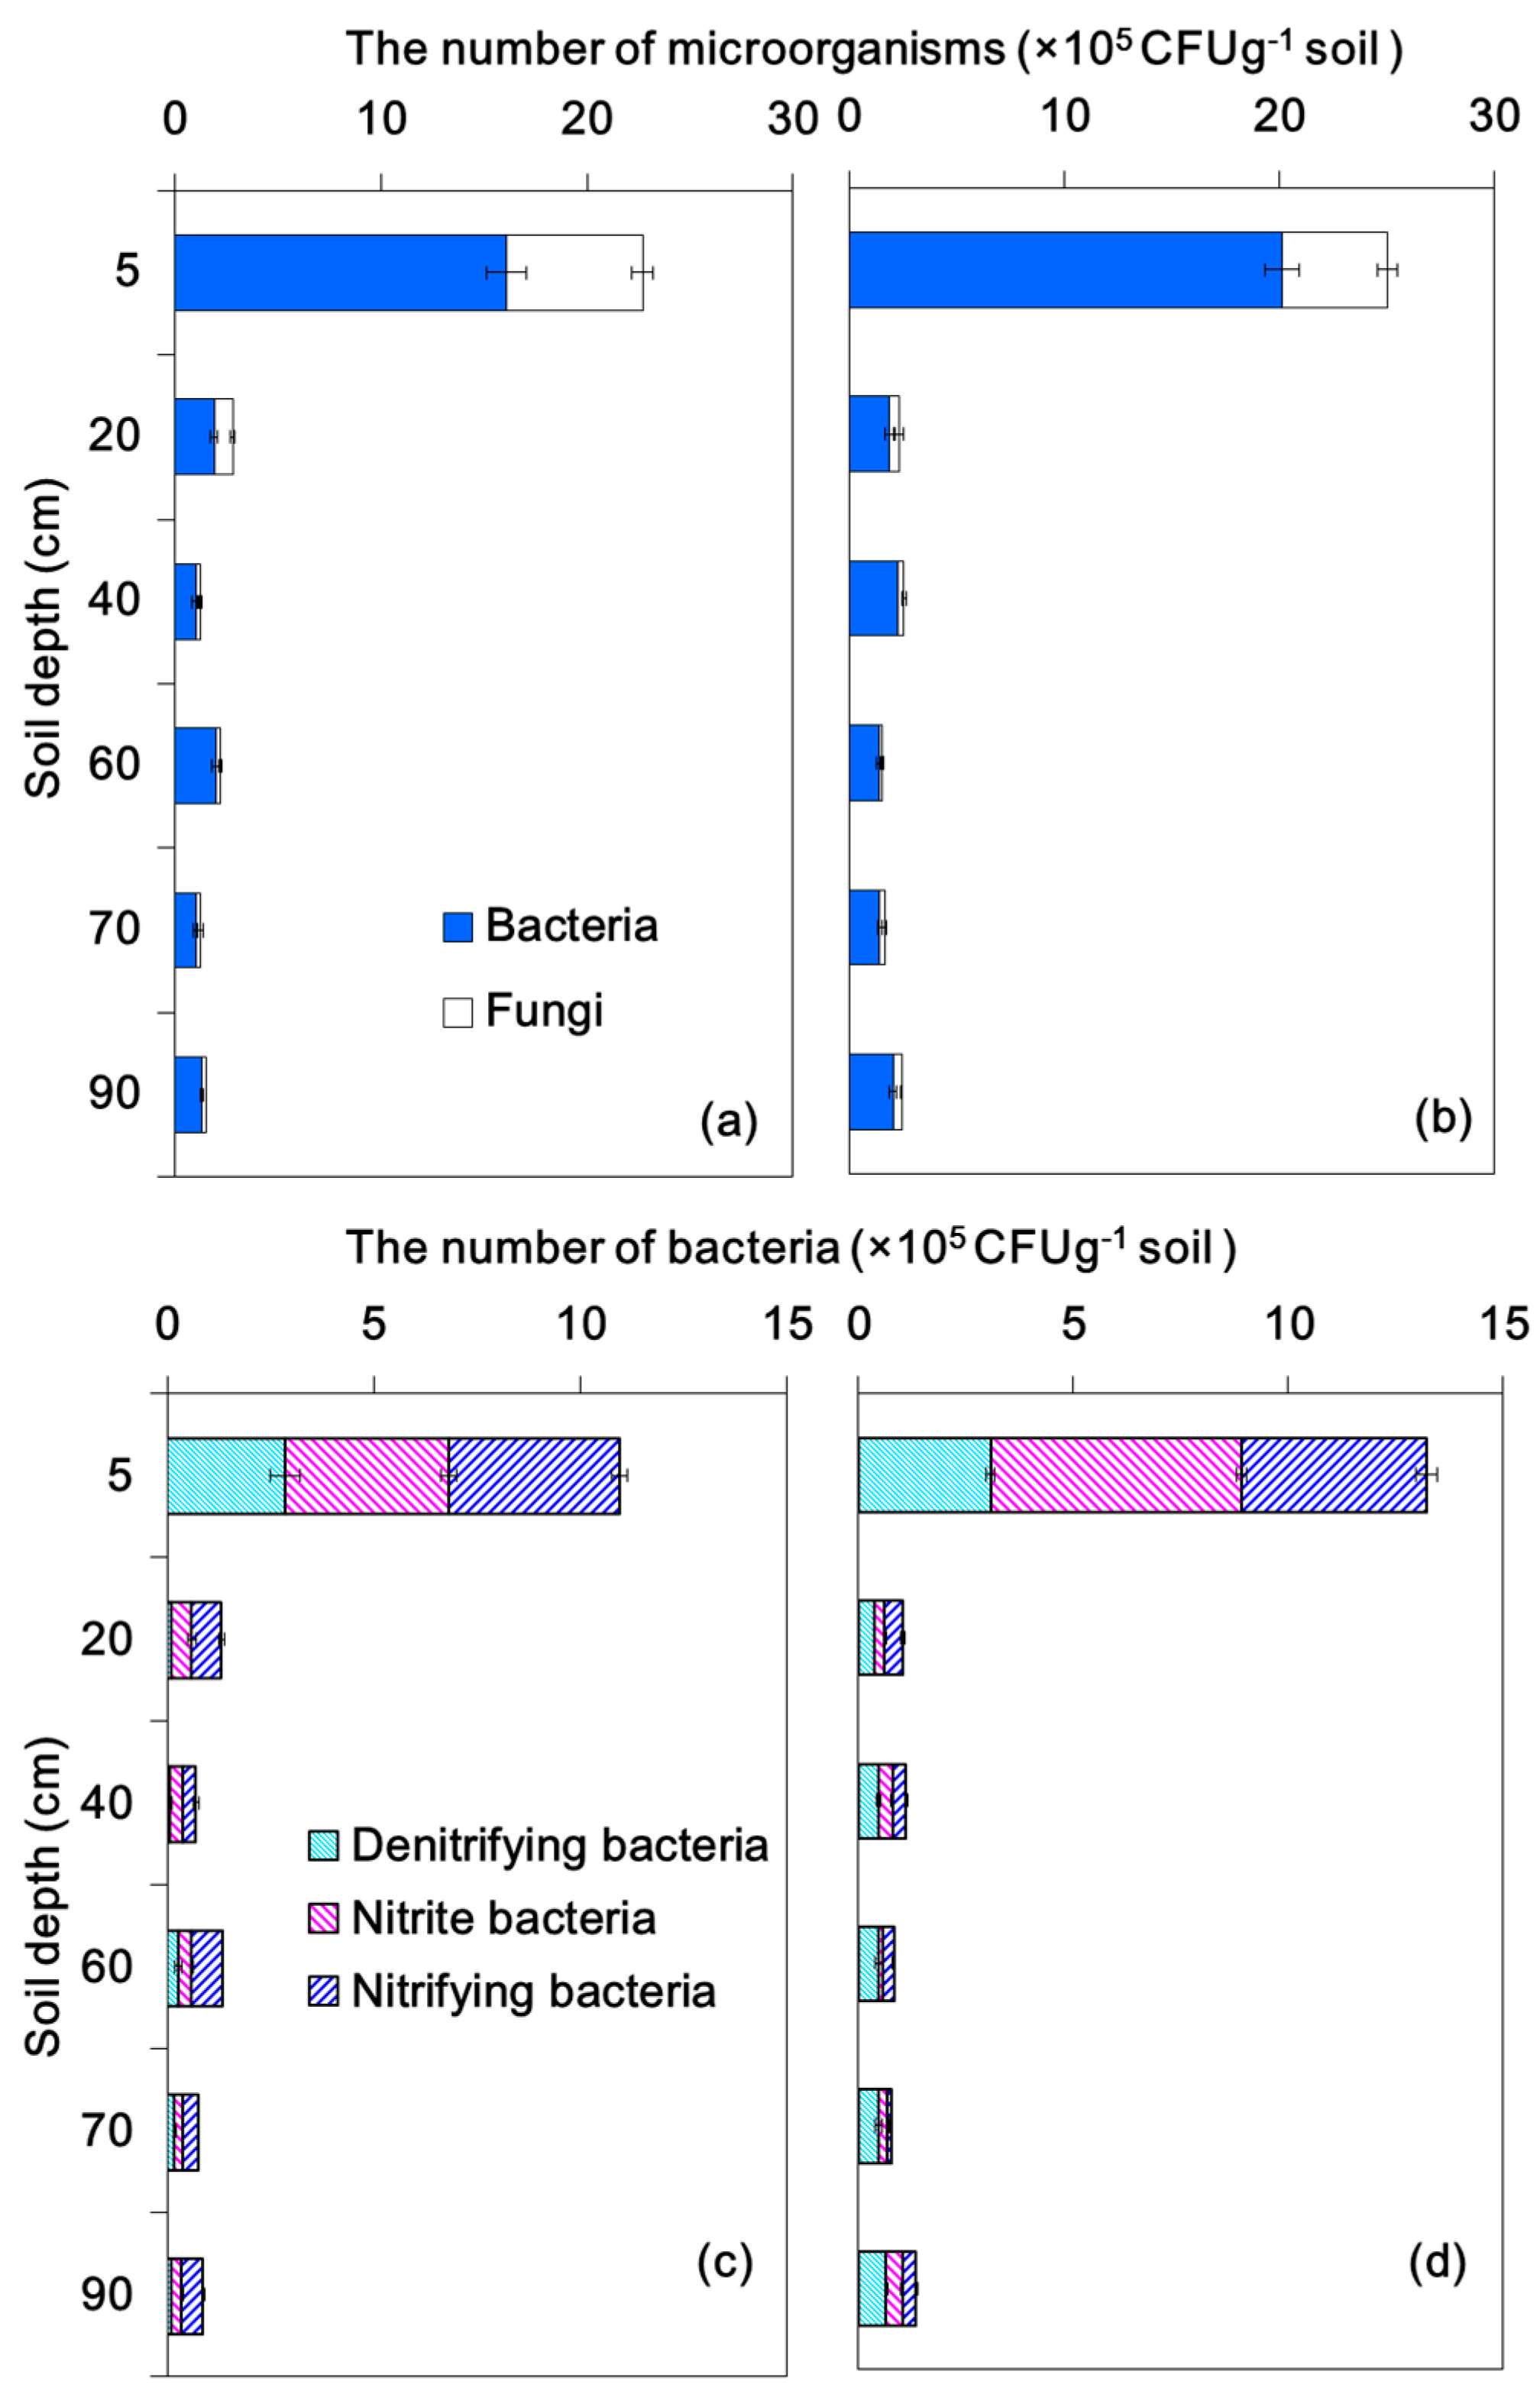
Microorganisms (bacteria and fungi) play essential roles in the removal of contaminants in reclaimed water. After the three year experimental period, soil samples (n = 3 for each depth) were taken at different depths from the columns to measure active bacteria and fungi. The quantities of bacteria and fungi were 3.2 × 10⁶ and 3.5 × 10⁶ colony-forming units per gram of soil in the continuous wetting and the wetting/drying columns, respectively. The top 5 cm soil layer was the major site for microbial activity (Figure 7a,b). The bacteria and fungi in the top 5 cm of soil columns accounted for 71.6% and 70.8% of those in the continuous wetting and wetting/drying columns, respectively. The bacteria and fungi in soil layers below the top 5 cm were significantly less than those in the top 5 cm soil layer. The vertical variation in this zone was slight for both soil columns. The number of bacteria and fungi in the wetting/drying column was about 10% more than those in the continuous wetting one.
The total number of nitrite-, nitrifying- and aerobic denitrifying bacteria occupied 68% and 63% of the total bacteria in the continuous wetting and wetting/drying columns, respectively. For the different types of bacteria, the ratio of nitrite, nitrifying and aerobic denitrifying bacteria within the top 5 cm of the soil columns was 1.4:1.5:1 for the continuous wetting column, and 2:1.5:1 for the wetting/drying one, respectively. The variation of the three types of bacteria along the columns was consistent with the total amount of bacteria.
4. Discussion
4.1. Nitrogen Removal
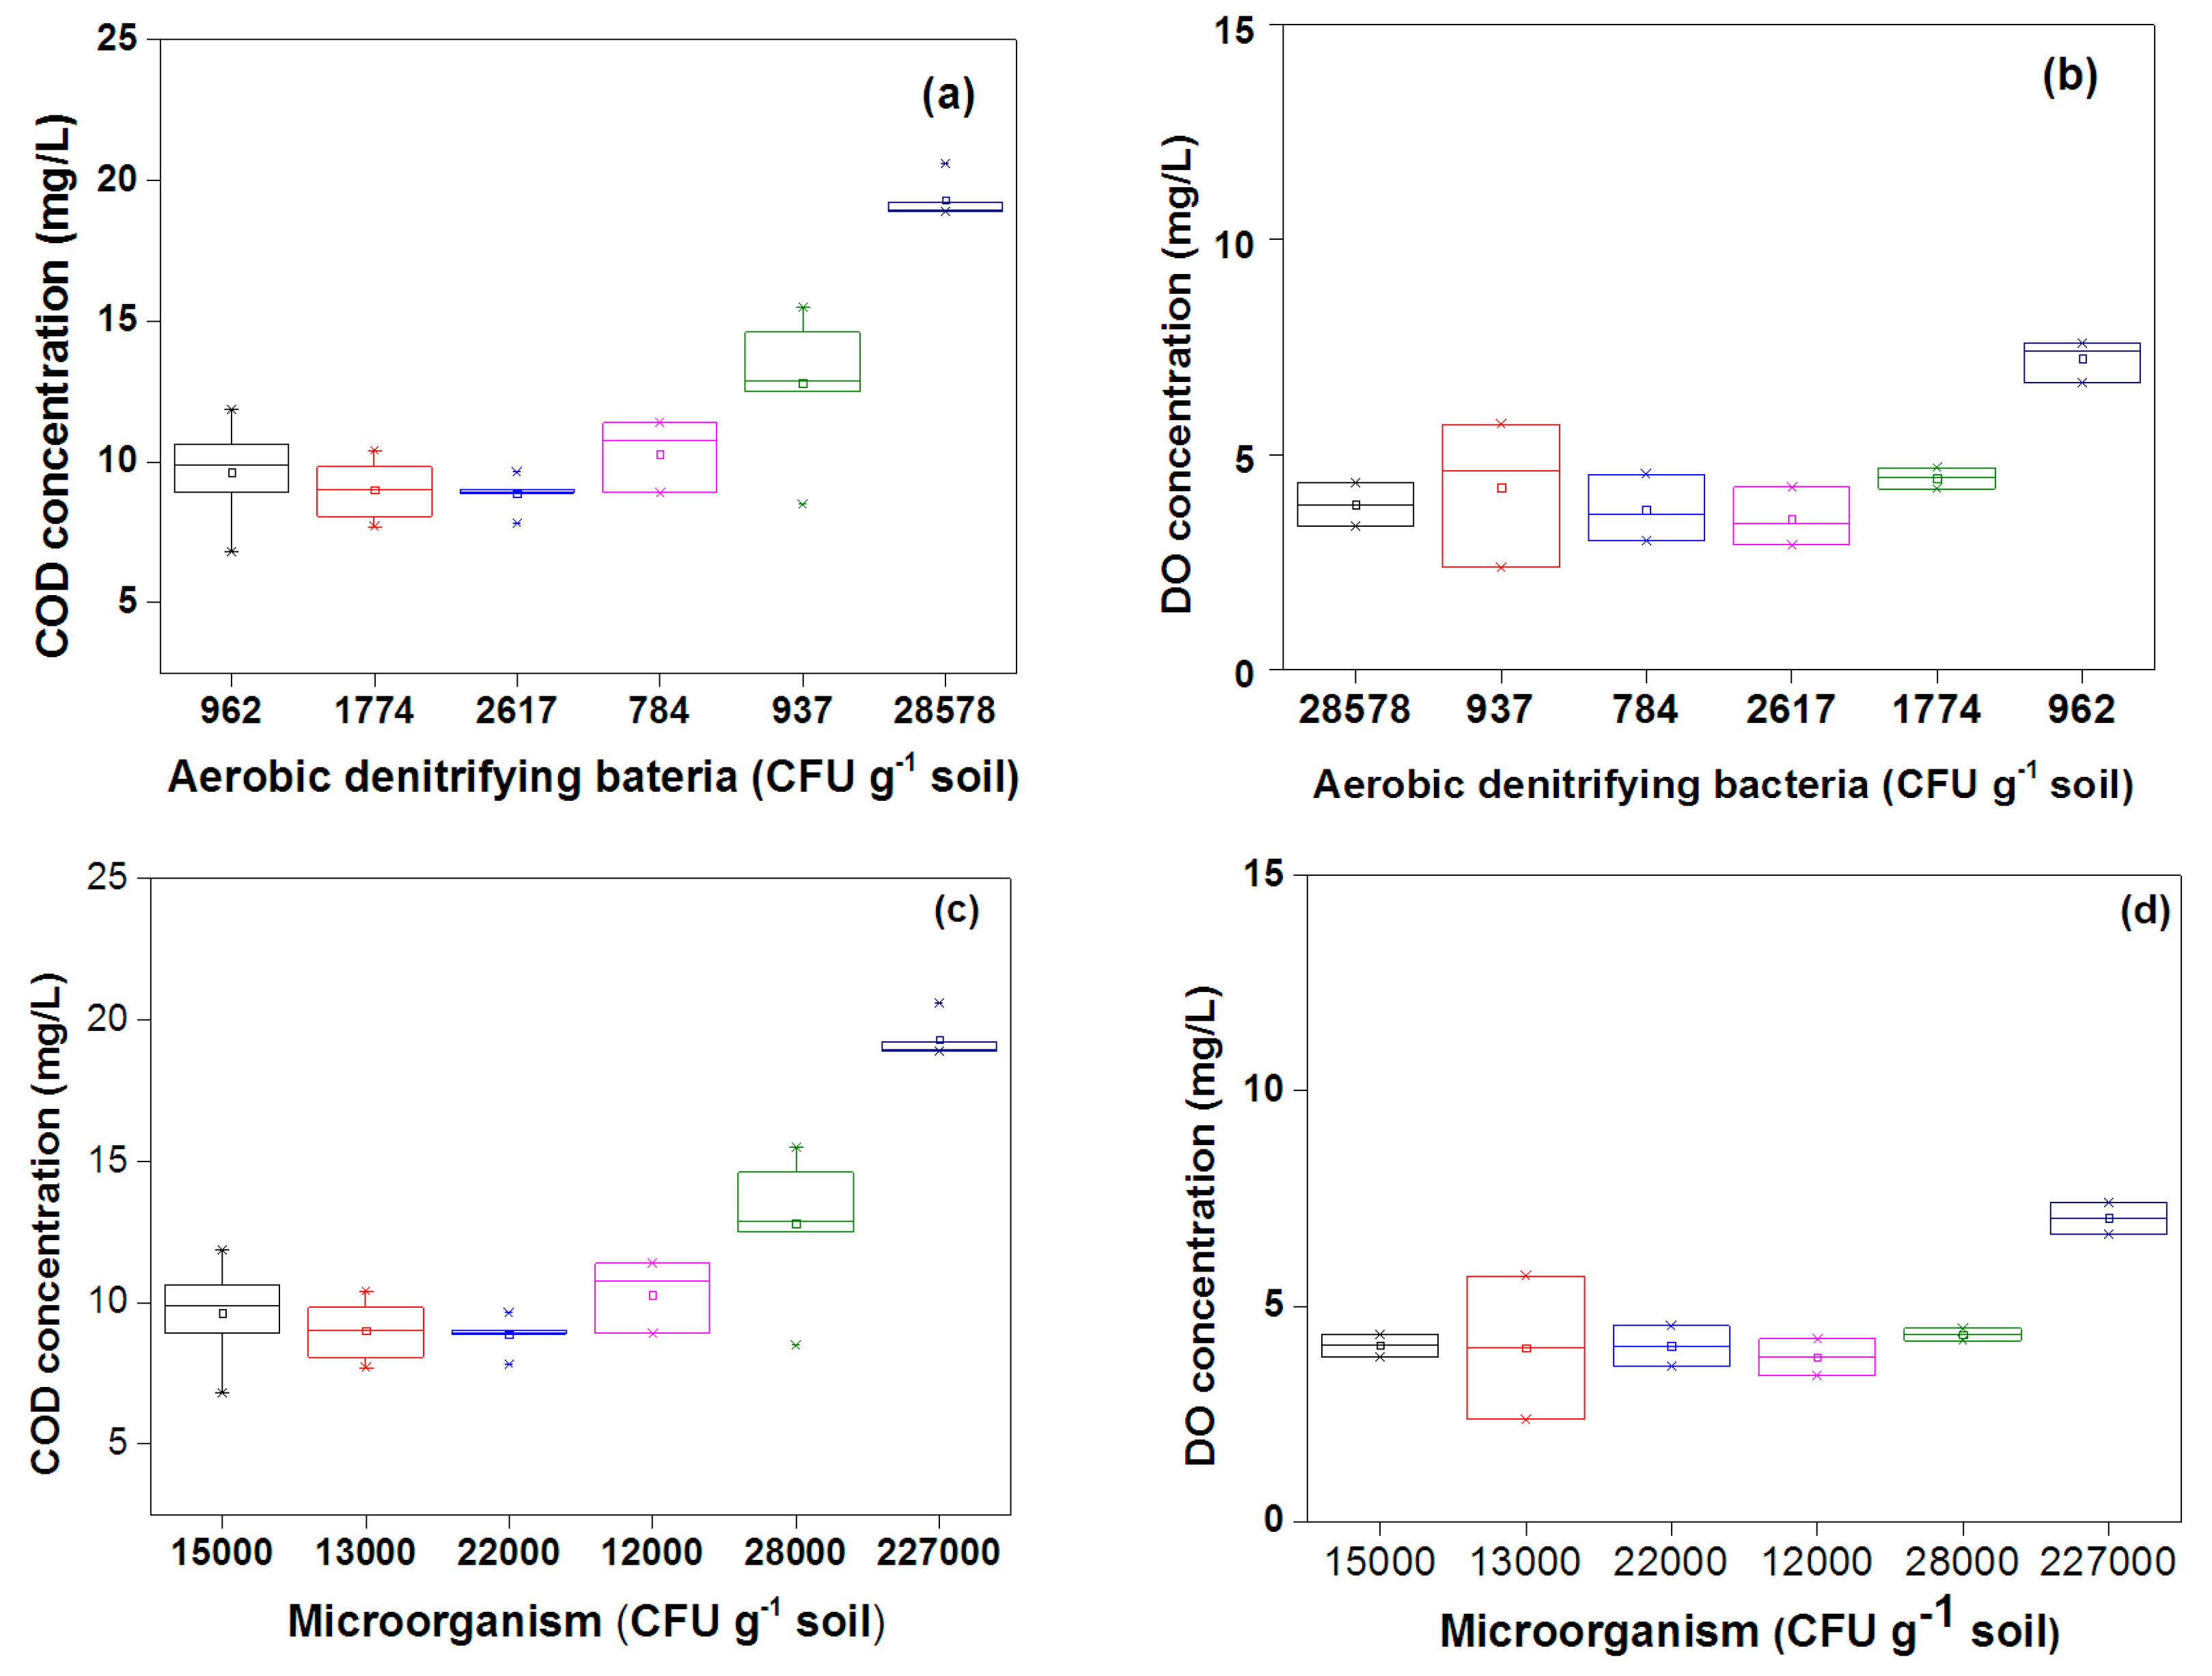
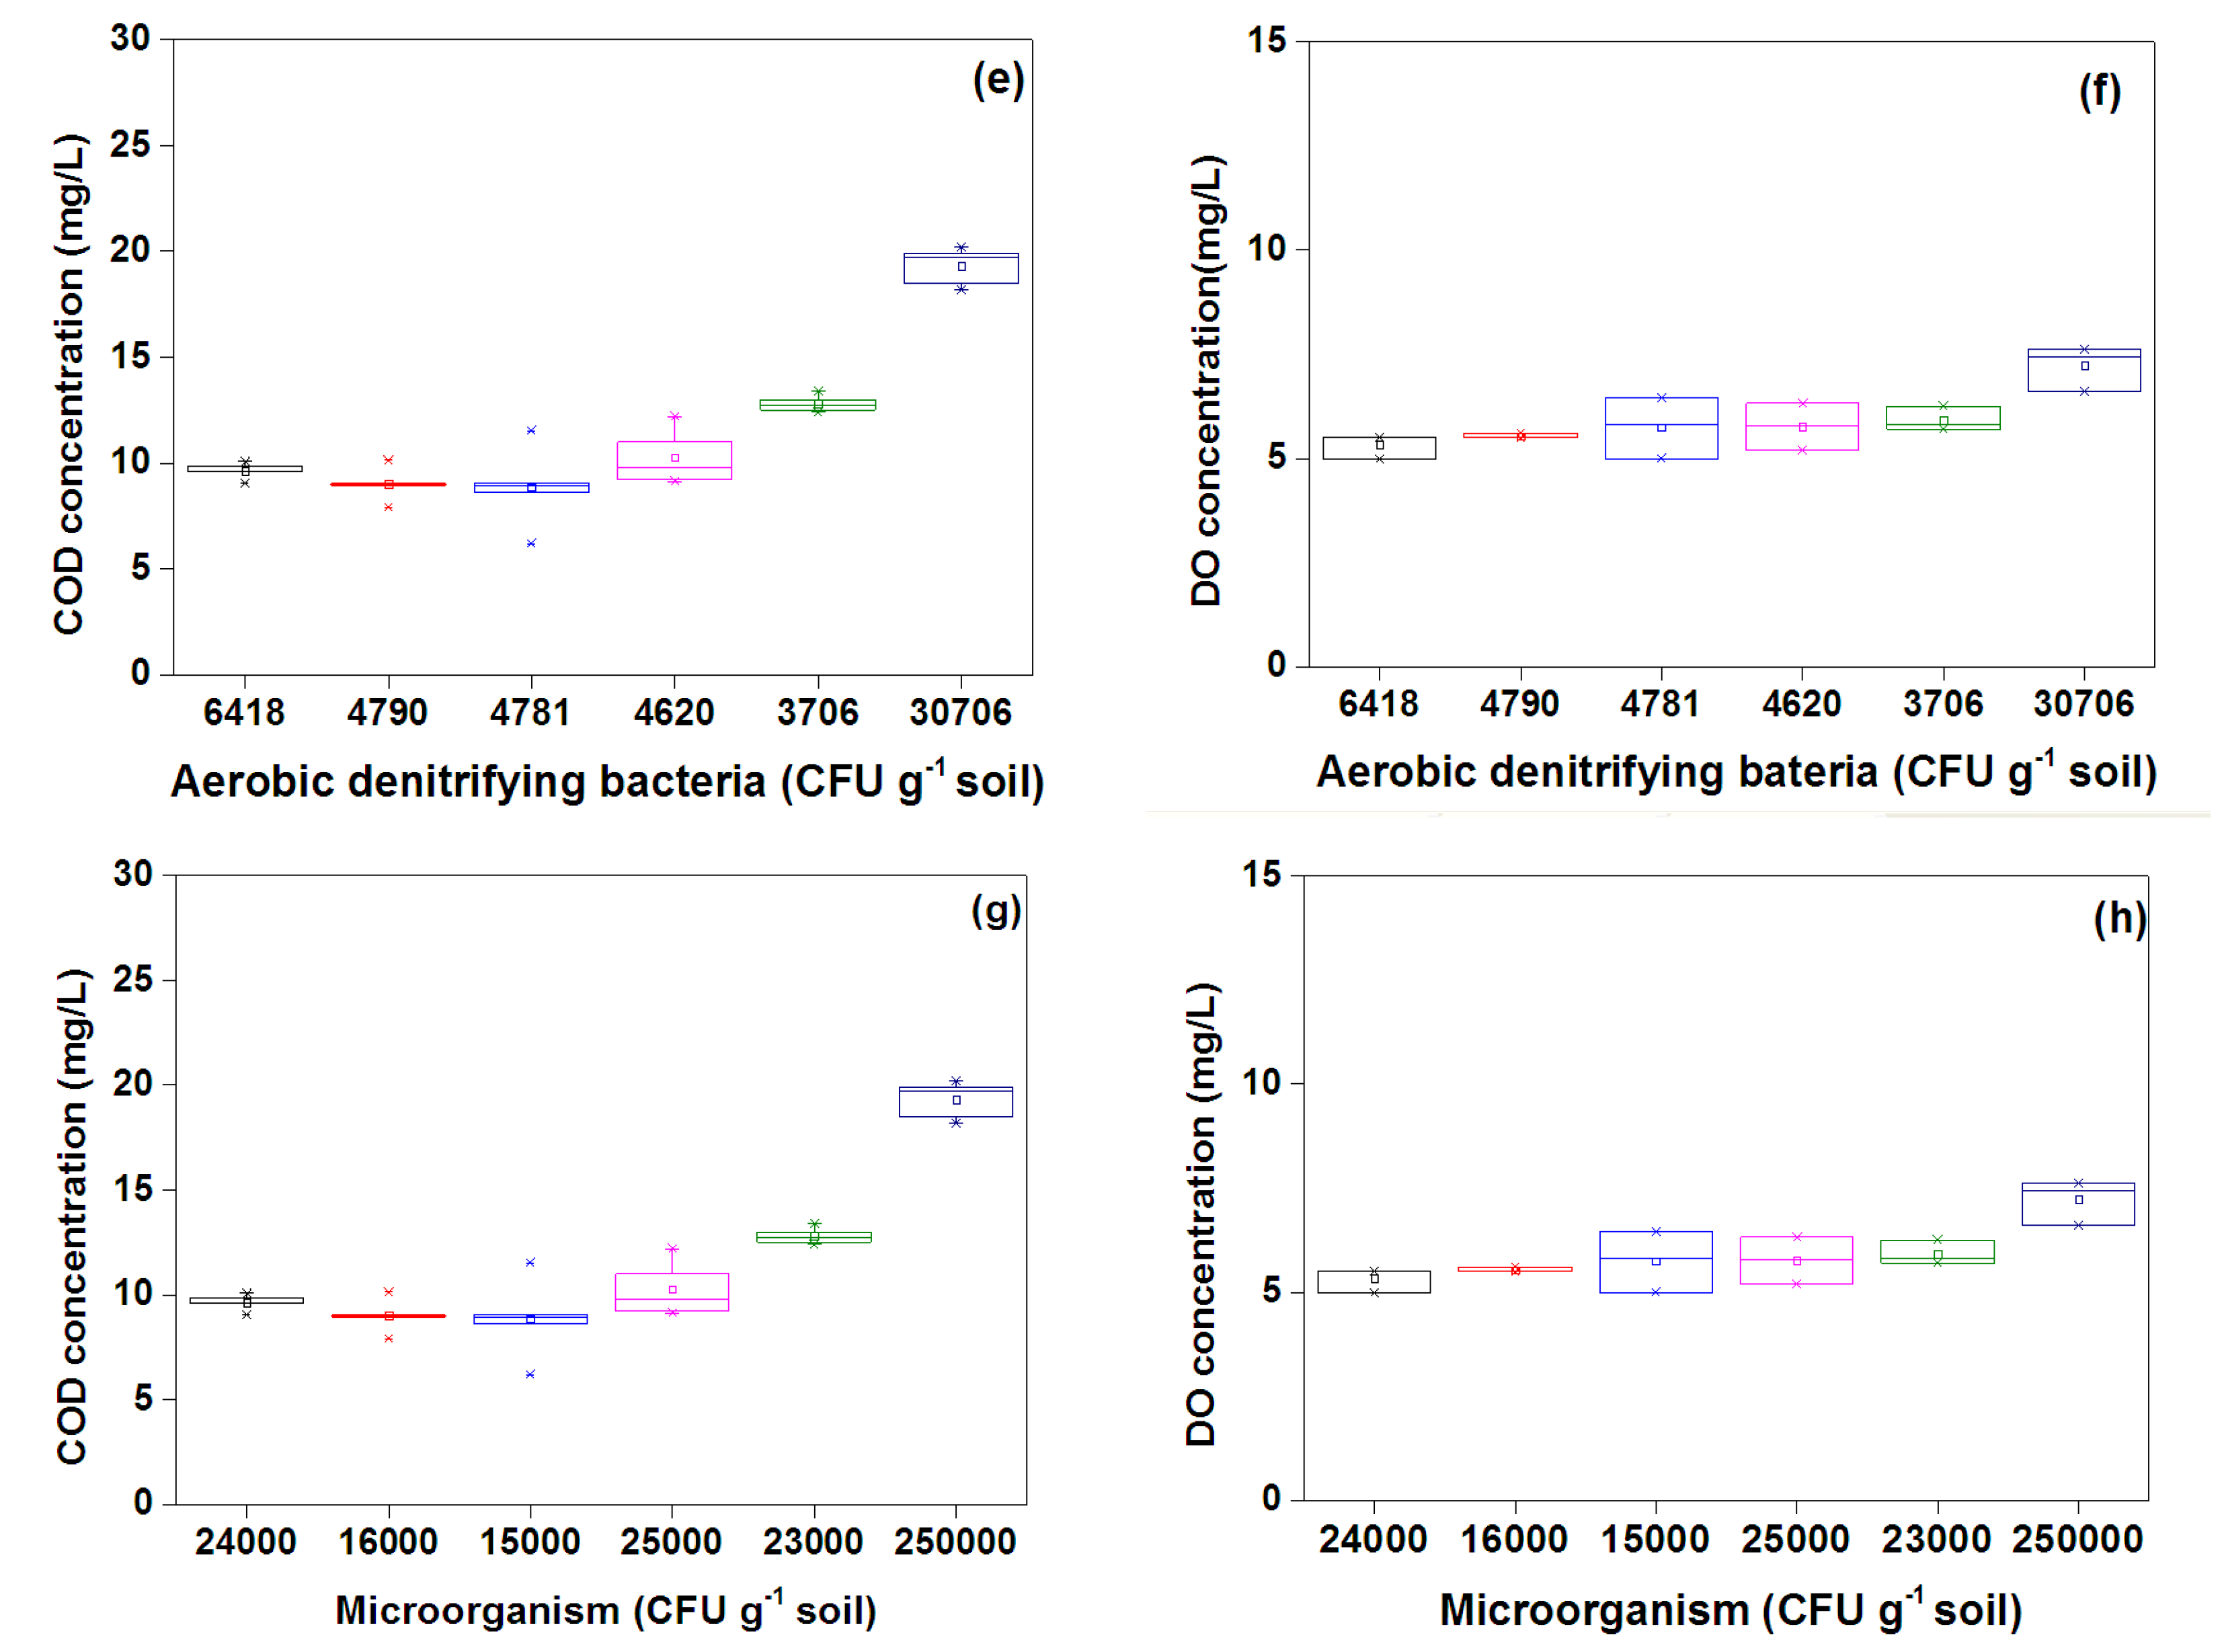
Denitrification is widely accepted as the major process for nitrate removal. Factors such as available carbon, DO concentration, NO3–N concentration, and temperature affect nitrate removal through the soil column system [23,39]. In this experiment, NO3–N was removed in the top 20 cm of the columns with annual average efficiencies of 31.9% and 24.0% in the continuous wetting and wetting/drying column, respectively. The removal performance for the top 20 cm soil layer accounted for 63% and 31% of each column which was proportional to the accumulation of aerobic denitrifying bacteria (between 83% and 63% in the top 20 cm soil layer). The growth of aerobic denitrifying bacteria was impacted by the content of organic matter in the reclaimed water and soils. In this study, the aerobic denitrifying bacteria were well correlated with COD concentrations, as shown in Figure 8a,e, the amount of aerobic denitrifying bacteria increased with the increase of COD. The organic matter in the reclaimed water was higher than that in the middle and bottom of the column, thus, most aerobic denitrifying bacteria existed at the top layer. Additionally, an exponential correlation was found between the amount of aerobic denitrifying bacteria and corresponding NO3–N removal efficiency in the soil columns. Relatively low NO3–N removal efficiencies in layers beneath 40 cm resulted from much less aerobic denitrifying bacteria.
For the identified reclaimed water, NO3–N distribution patterns as well as removal efficiencies are influenced by the hydraulic condition. In the wetting/drying column, the NO3–N concentration monotonically decreased along the depth, and correspondingly the removal efficiency monotonically increased. In contrast, the NO3–N distribution and its removal efficiency were relatively stable except at the top soil layers in the continuous wetting column. The different removal performances were attributed to the specific micro-environment under different hydraulic conditions. Oxygen was allowed to enter into the soil during the drying periods and entrapped during the wetting stage, resulting in relatively high DO concentration for the wetting/drying column. The DO in the continuous wetting column could only be replenished when accompanied by the injection of reclaimed water. As shown in Figure 8b,f, the aerobic denitrifying bacteria increased with the DO concentration increase for the continuous wetting and wetting/drying columns. The DO concentration influenced the growth of aerobic denitrifying bacteria besides organics in the columns. More aerobic denitrifying bacteria were found in the wetting/drying column compared to the continuous column (Figure 7). As a result, more NO3–N was consumed, because a larger amount of aerobic denitrifying bacteria existed in the wetting/drying column, which resulted in a higher average NO3–N removal efficiency. However, the continuous wetting column provided a higher total amount of NO3–N removal due to its higher hydraulic loading rate (2.65 cm/d in the continuous wetting column, 0.74 cm/d in the wetting/drying column). The total amount of NO3–N input was 11,670 mg, while the output was 5870 mg and approximately 5800 mg of NO3–N was removed during three years in the continuous wetting column. Only one-third of the total amount of NO3–N was applied in the wetting/drying column compared to the continuous one, and only 1200 mg was leached out of the column.
In this experiment, the DO was not completely depleted, suggesting that the aerobic condition existed before NO3–N was digested. This, however, did not preclude the occurrence of NO3–N reduction (denitrification) in cases where there was relatively high DO concentration. Thus, DO would compete with NO3–N as the final electron acceptor for organic degradation in the SAT systems. The results found that the aerobic denitrifying bacteria could remove NO3–N effectively when DO concentration was approximately 3–6 mg/L, as well as the aerobic denitrification was also isolated by using a selective medium. Denitrification is usually considered as an anaerobic process. However, investigations have demonstrated that denitrification also take place in an aerobic environment, i.e., canals, ponds, soils, and activated sludge [40,41]. Specific bacteria [23,29] as well as some fungi have also been isolated those are able to carry out denitrification under aerobic conditions [42].
In our experiment, the C/N ratio was around 1–2 in the reclaimed water; the C/N ratio was lower than the theoretical value of 2.86 of aerobic denitrification [27]. However, the result found that 51% and 78% NO3–N was removed under the continuous wetting and wetting/drying condition, which was not fully consistent with the previous studies [23,28,43], indicating that denitrification occurred in this SAT system. The results suggested that the aerobic denitrification occurred in the SAT system with a relatively low C/N ratio in the influent. The difference may be attributed to the relatively high organic matter content in the test soil (Table 1), which was sampled from farmland. The organic matter contained in the soil can also act as carbon source except for the organic carbon in the reclaimed water for the growth of microorganisms and aerobic denitrification process.
Temperature is an important factor when considering the biochemical reaction for NO3–N. The removal efficiencies of NO3–N exhibited a dramatically annual variation despite the concentrations of NO3–N in influent that showed relatively limited fluctuation. As the water temperature increased to 31 °C in summer, the NO3–N removal efficiency approached 67.1% for the continuous wetting column and 96.6% for the wetting/drying column. In contrast, the NO3–N removal efficiencies dropped to 18% for the continuous wetting column and 56% for the other column as the temperature decreased to 15 °C in winter, respectively. A logarithm linear relation was found between the water temperature and removal efficiency of NO3–N under the continuous wetting (determination coefficient, R2 = 0.90) and wetting/drying (determination coefficient, R2 = 0.56) conditions. The seasonal variations of NO3–N removal efficiencies were attributed to the influence of water temperature on the activity of denitrifying bacteria. Higher temperatures enhance biological and chemical reactions including denitrification. Willems et al. [44] also reported that the denitrification rates generally decreased at lower temperature.
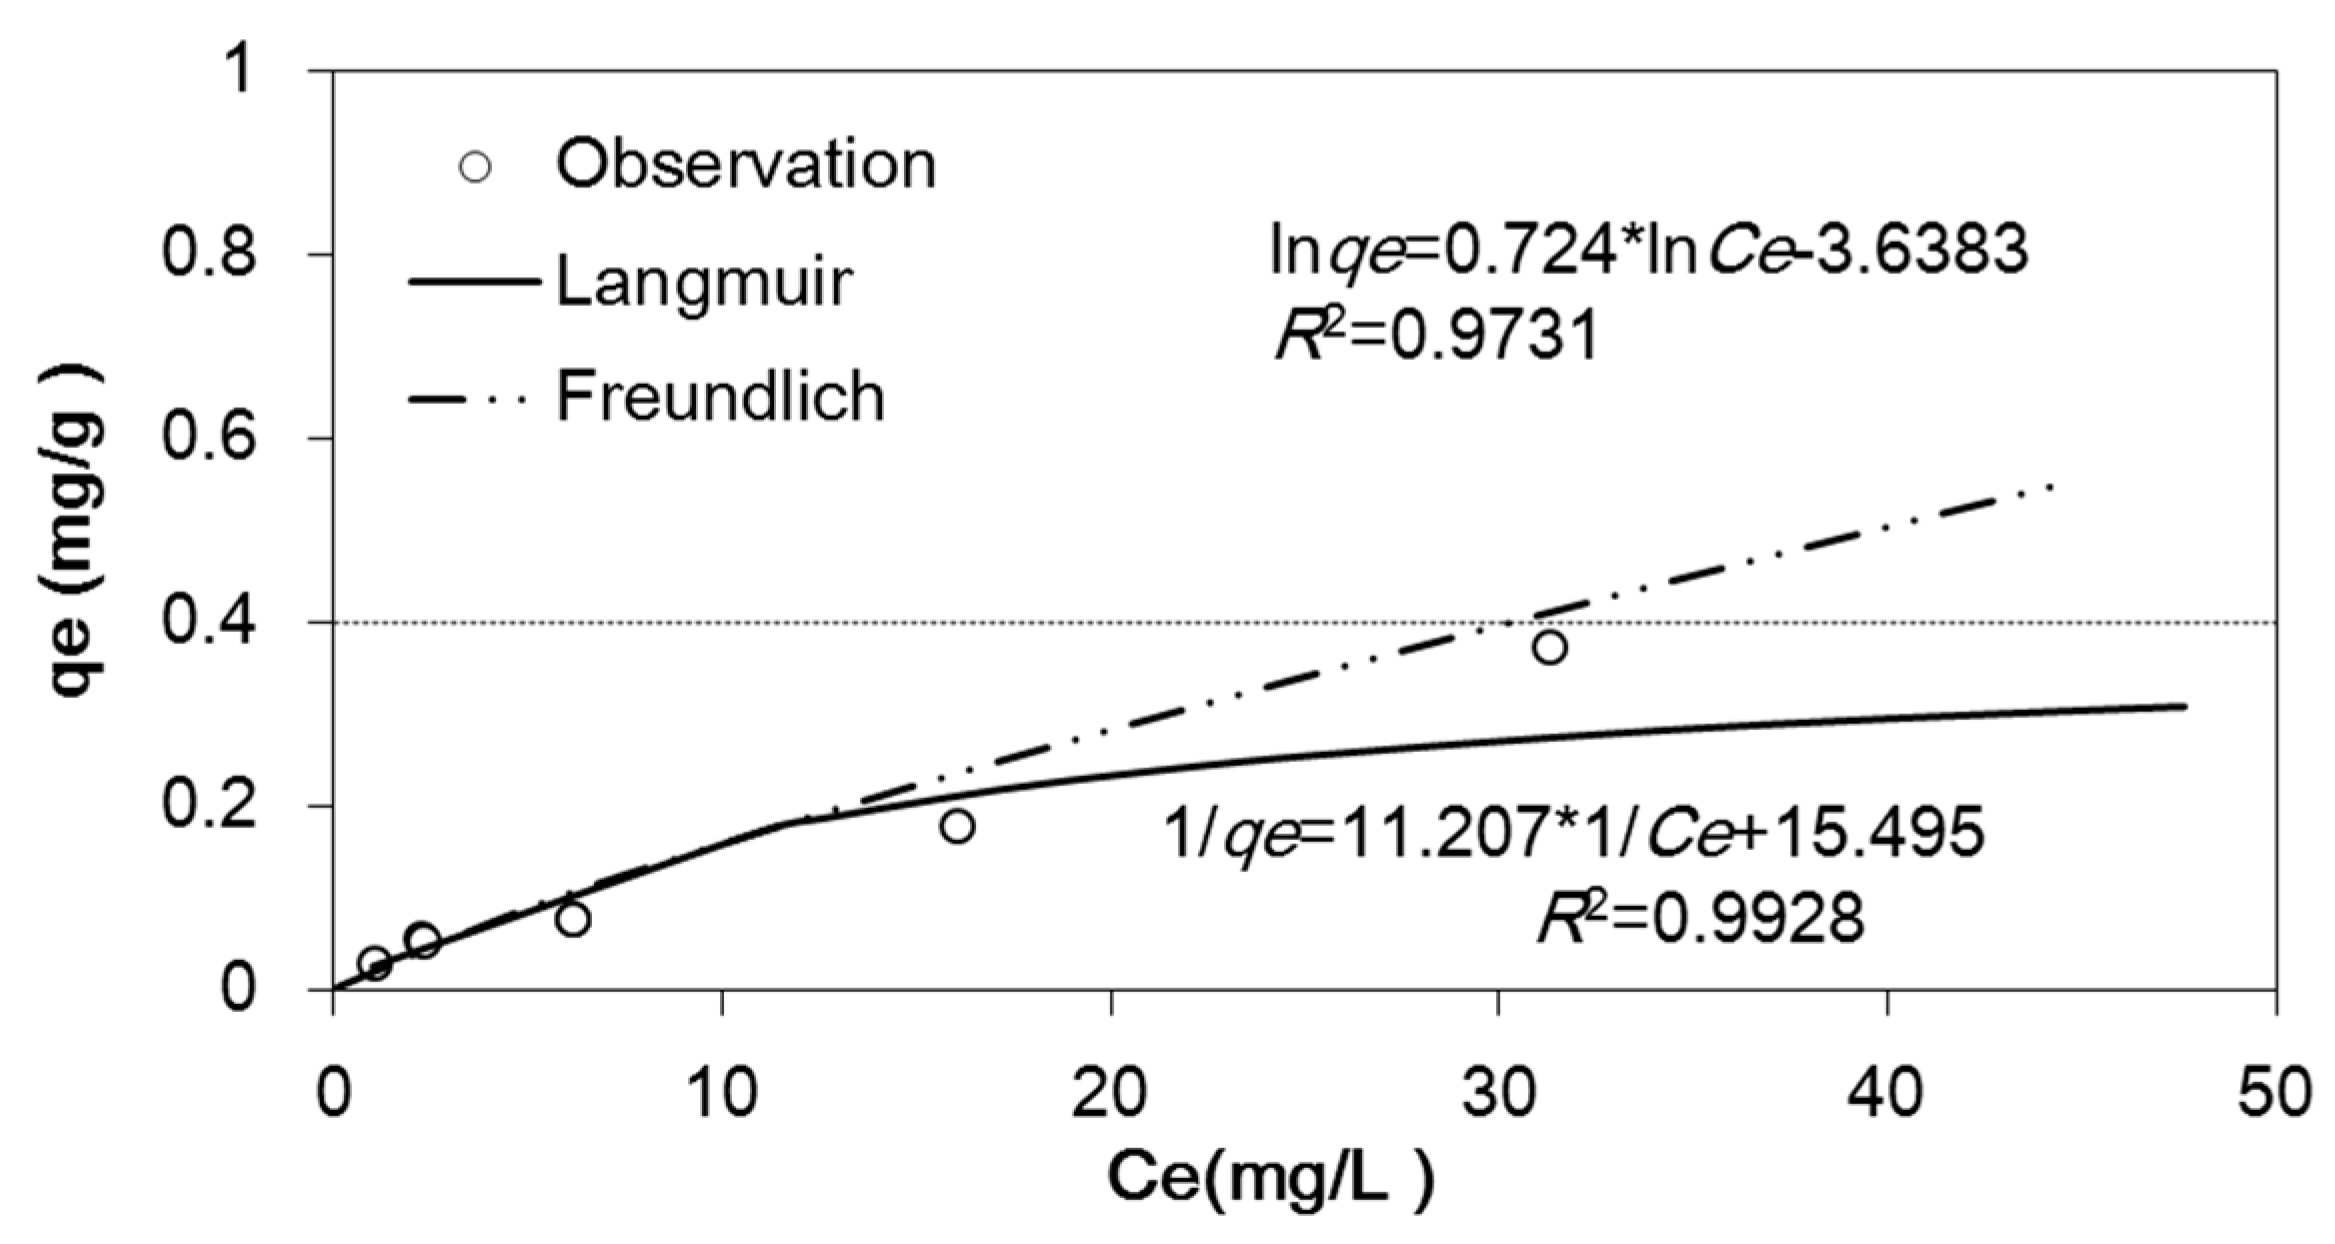
The NH4–N and organic nitrogen together accounted for approximately 10% of the total nitrogen in the influents. The source of NH4–N includes the ammonium in the reclaimed water and those partially transformed from organic nitrogen. In contrast to the process for NO3–N removal, NH4–N is generally removed through soil adsorption, volatilization and subsequent nitrification. The volatilization of NH4–N was negligible due to the relatively low pH for water samples of the influent and effluent at different soil depths. The measured pH of water samples was around 8 while the NH4–N volatilization generally took place at a pH value above 9.4 [45]. The adsorbed NH4–N ultimately converted to NO3–N via the nitrification for a long-term reactor. Considering the mass balance analysis, adsorption was an important factor for NH4–N removal, especially for short term soil-column experiments. The estimated NH4–N adsorption capacity was 0.018 mg/g at the top of soil columns (with an average concentration of 0.29 mg/L) and 0.013 mg/g at the bottom of soil columns (with an average concentration of 0.16 mg/L) according to the Langmuir adsorption isotherm fitting (Figure 9). The actual quantities of NH4–N adsorbed by soil thus were calculated by the sum of the adsorbed amount of each layer. 670 and 620 mg of NH4–N were adsorbed in soil for two columns, respectively. The amount of NH4–N adsorbed by soil was much higher than the amount brought by reclaimed water. There was about 230 mg of NH4–N infiltrated through the top of the continuous wetting column, whereas up to 100 mg of NH4–N was leached away from the column over the three years. A simple mass balance calculation indicated that at least 540 mg of NH4–N was produced during the biochemical reaction process, which was as much as twice amount of the total NH4–N input into soil columns. Similarly, a slightly higher value (580 mg) was obtained for the wetting/drying column. Mineralization was the major biochemical process to produce NH4–N in the soil columns. Dissolved organic nitrogen was digested during this process. Especially for direct potable purposes, potential risk was still a matter of concern when reclaimed water with a higher dissolved organic nitrogen was applied in the SAT system, even with an NH4–N concentration below the quality standard for drinkable water (<0.5 mg/L).
The decreased NH4–N concentrations in the columns indicated that a high NH4–N removal efficiency occurred in the simulated SAT system even though a large amount of NH4–N is reproduced through mineralization of the organic nitrogen. The NH4–N was removed mainly within the top 20 cm of the soil column, which was consistent with the accumulation of nitrifying and nitrite bacteria (Figure 4 and Figure 7). NH4–N removal efficiency was not affected by the increase of soil depth. The removal efficiency was higher in the wetting/drying column than that in the continuous wetting one, which was attributed to the larger amount of nitrifying and nitrite bacteria. However, the cumulative mass removal of NH4–N was higher in the continuous wetting column because of the continuous wetting operation and the larger total amount of NH4–N input. NO3–N was the major form of nitrogen in the reclaimed water which accounted for nearly 90% of the total nitrogen. Denitrification was the main removal mechanism for nitrogen under different hydraulic conditions.
4.2. COD Removal
The COD, a parameter of organic matter, is removed mainly through biodegradation by the microorganisms. The biodegradation process is impacted by the amount and type of microorganisms and redox conditions. A large number of microorganisms accumulated in the top 20 cm of the columns: 80% in the continuous wetting column and 77% in the wetting/drying one. Thus, a large proportion of COD (34% and 53%, respectively) was removed in these regions. The accumulation and activity of microorganisms in the top soil resulted from a high proportion of organic matter and DO [46]. The microorganisms were significantly reduced below 20 cm since most of the organic matter was biodegraded in the top of the columns and there was not sufficient nutrient left for the microorganisms. As presented in Figure 8, the amount of microorganisms was highly relevant to the concentration of COD and DO. Compared with the impact of DO on the microorganism distribution, the COD concentration played a more significant role in their distributions for both soil columns. The distribution of microorganisms along soil depths was consistent with the findings of Ak and Gunduz [36]. Relatively small quantities of microorganisms in current experiments may be attributed to the water quality of the influent [47].
The removal efficiency of COD was higher in the wetting/drying column than that in the continuous wetting column for the years of 2011 and 2012, which was mainly due to the relatively higher amount of microorganism. Additionally, COD removal efficiency had an exponential relationship with the amount of microorganisms. The top 20 cm also played an important role in COD removal for different hydraulic conditions. This finding was consistent with previous researches [36]. In this experiment, the removal efficiency of COD by the top 20 cm soil columns was between 34% and 53% for the saturated and unsaturated condition, respectively. Correspondingly, more than 90% of COD removal occurred in the top 20 cm of the soil columns. A similar tendency at the field scale investigation site had also occurred [48]. In this experiment, the COD removal rate increased gradually every year. This result was highly consistent with a short term experiment (91 days) carried out by Bunsri et al. [49] where 80% of COD was reduced in the top 30 cm of the 120 cm soil column. The removal efficiency for the whole 120 cm column was 83%, which was higher than this study. Rauch-Williams and Drewes [18] also found that removal of biodegradable organic carbon mainly occurred within the first 30 cm of the soil column. Other similar experiments resulted in slightly different optimized depth for COD removal. All these factors, the property of soil, the composition of contaminants within the water, and environmental conditions could be the reasons for the differences in their conclusions. The COD removal efficiencies were relatively stable below 20 cm, which was due to the relatively low concentration of DO and few microorganisms (Figure 5 and Figure 7).
Aerobic degradation usually proceeds more rapidly and has much higher biochemical efficiency than anoxic and anaerobic degradation [50]. In the two columns, the aerobic degradation was considered to dominate the removal of COD since a relatively high DO concentration was detected. According to Metcalf [30,51], 1 g of DO is consumed as it is the electron acceptor for removing one gram of COD. In fact, the consumed DO along the soil columns was not enough for mass removal of COD. The total amount of COD removed from the simulated SAT system was 6300 mg for continuous wetting column, whereas only 2700 mg of DO was consumed during the three years. DO only provided around 40% of total amount needed by COD removal at the saturated condition. Thus, another electron acceptor was required in addition to oxygen. As previously discussed, most of the removed NO3–N was consumed within the first 20 cm and continuously decreased downward to the bottom of column. During this process, the NO3–N could act as the electron acceptor. Therefore, the simultaneous reduction of DO and NO3–N in the soil columns suggests that aerobic degradation for COD and aerobic denitrification occurs at the same time.
5. Summary and Conclusions
A three-year laboratory soil column experiment was conducted to simulate a SAT system for the removal of the major contaminants in reclaimed water. Two different hydraulic conditions were considered, including continuous wetting and wetting/drying cycles. The following conclusions can be drawn: (1) Aerobic denitrifying bacteria exists in the simulated SAT system, and denitrification can take place when the DO concentration is around 3–6 mg/L. Denitrification and COD degradation take place simultaneously under the continuous wetting and wetting/drying conditions. NO3–N together with DO acted as the electron acceptor for COD degradation, and DO only accounts for 40% of the total electron acceptors needed by COD under saturated conditions; (2) The top 20 cm of the 100 cm silt loam soil columns was the main zone for nitrogen and COD removal under the continuous wetting and wetting/drying conditions. Microorganisms and aerobic denitrifying bacteria are both linearly related to the DO and COD concentration in the soil columns. Additionally, the amount of microorganisms and aerobic denitrifying bacteria shows an exponential relationship with the COD removal efficiency and NO3–N removal efficiency in the soil columns, respectively; (3) The wetting/drying column performed with higher efficiency for nitrogen and COD removal. The removal efficiency was 78% for the NO3–N, 51% for the NH4–N, and 50% for the COD under the wetting/drying condition. The removal efficiency of NO3–N was logarithmically related to temperature during the experiment.
The results obtained in this study demonstrated that the efficiency of the SAT system to remove nitrogen and COD improved significantly under wetting/drying conditions at a high temperature. However, several factors need to be considered to minimize potential risk when using a SAT system for potable water purposes. The application of reclaimed water with a high organic nitrogen content in the SAT system may result in a high NH4–N content, even when the concentration in the influent is below the quality standard for drinkable water (<0.5 mg/L).
Acknowledgments
This research was supported by the National Natural Science Foundation of China (Nos. 51079149, 51379209, 51639009) and Grand Project of Inner Mongolia, China (2014117-06).
Author Contributions
Quanzhong Huang and Weiyan Pan conceived and designed the experiments; Weiyan Pan performed the experiment, analyzed the data, and wrote the paper; Quanzhong Huang, Guanhua Huang and Yunwu Xiong corrected and improved it.
Conflicts of Interest
The authors declare no conflicts of interest.
References
- Chen, W.P.; Lu, S.D.; Jiao, W.T.; Wang, M.E.; Chang, A.C. Reclaimed water: A safe irrigation water source? Environ. Dev. 2013, 8, 74–83. [Google Scholar] [CrossRef]
- Chen, Y.; Chen, C. The optimal reuse of reclaimed water: A mathematical model analysis. Water Resour. Manag. 2014, 28, 2035–2048. [Google Scholar] [CrossRef]
- Wang, X.P.; Huang, G.H. Evaluation on the irrigation and fertilization management practices under the application of treated sewage water in Beijing, China. Agric. Water Manag. 2008, 95, 1011–1027. [Google Scholar] [CrossRef]
- Zheng, F.D.; Liu, L.C.; Li, B.H.; Yang, Y.; Guo, M.L. Effects of reclaimed water use for scenic water on groundwater environment in a multilayered aquifer system beneath the Chaobai River, Beijing, China: Case Study. J. Environ. Eng. 2015, 20. [Google Scholar] [CrossRef]
- Yu, Y.L.; Ma, M.Y.; Zheng, F.D.; Liu, L.C.; Zhao, N.N.; Li, X.X.; Yang, Y.M.; Guo, J. Spatio-temporal variation and controlling factors of water quality in Yongding River replenished by reclaimed water in Beijing, North China. Water 2017, 9, 453. [Google Scholar] [CrossRef]
- Dash, R.R.; Bhanu Prakash, E.V.P.; Kumar, P.; Mehrotra, I.; Sandhu, C.; Grischek, T. River bank filtration in Haridwar, India: Removal of turbidity, organics and bacteria. Hydrogeol. J. 2010, 18, 973–983. [Google Scholar] [CrossRef]
- Goren, O.; Burg, A.; Gavrieli, I.; Negev, I.; Guttman, J.; Kraitzer, T.; Kloppmann, W.; Lazar, B. Biogeochemical processes in infiltration basins and their impact on the recharging effluent, the soil aquifer treatment (SAT) system of the Shafdan plant, Israel. Appl. Geochem. 2014, 48, 58–69. [Google Scholar] [CrossRef]
- Nadav, I.; Arye, G.; Tarchitzky, J.; Chen, Y. Enhanced infiltration regime for treated-wastewater purification in soil aquifer treatment (SAT). J. Hydrol. 2012, 420–421, 275–283. [Google Scholar] [CrossRef]
- Filter, J.; Jekel, M.; Ruhl, A.S. Impacts of Accumulated Particulate Organic Matter on Oxygen Consumption and Organic Micro-Pollutant Elimination in Bank Filtration and Soil Aquifer Treatment. Water 2017, 9, 349. [Google Scholar] [CrossRef]
- Regnery, J.; Wing, A.D.; Kautz, J.; Drewes, J.E. Introducing sequential managed aquifer recharge technology (SMART)—From laboratory to full-scale application. Chemosphere 2016, 154, 8–16. [Google Scholar] [CrossRef] [PubMed]
- Wei, L.L.; Li, S.L.; Noguera, D.R.; Qin, K.; Jiang, J.Q.; Zhao, Q.L.; Kong, X.J.; Cui, F.Y. Dissolved organic matter removal during coal slag additive soil aquifer treatment for secondary effluent recharging: Contribution of aerobic biodegradation. J. Environ. Manag. 2015, 156, 158–166. [Google Scholar] [CrossRef] [PubMed]
- Abel, C.D.T.; Sharma, S.K.; Buçpapaj, E.; Kennedy, M.D. Impact of hydraulic loading rate and media type on removal of bulk organic matter and nitrogen from primary effluent in a laboratory-scale soil aquifer treatment system. Water Sci. Technol. 2013, 68, 217–226. [Google Scholar] [CrossRef] [PubMed]
- Bertelkamp, C.; Reungoat, J.; Cornelissen, E.R.; Singhal, N.; Reynisson, J.; Cabo, A.J.; van der Hoek, J.P.; Verliefde, A.R.D. Sorption and biodegradation of organic micropollutants during river bank filtration: A laboratory column study. Water Res. 2014, 52, 231–241. [Google Scholar] [CrossRef] [PubMed]
- Maeng, S.K.; Sharma, S.K.; Abel, C.D.T.; Knezev, A.M.; Song, K.G.; Amy, G.L. Effects of effluent organic matter characteristics on the removal of bulk organic matter and selected pharmaceutically active compounds during managed aquifer recharge: Column study. J. Contam. Hydrol. 2012, 140–141, 139–149. [Google Scholar] [CrossRef] [PubMed]
- Essandoh, H.M.K.; Tizaoui, C.; Mohamed, M.H.A. Removal of dissolved organic carbon and nitrogen during simulated soil aquifer treatment. Water Res. 2013, 47, 3559–3572. [Google Scholar] [CrossRef] [PubMed]
- Von Rohr, M.R.; Hering, J.G.; Kohler, H.P.E.; von Gunten, U. Column studies to assess the effects of climate variables on redox processes during riverbank filtration. Water Res. 2014, 61, 263–275. [Google Scholar] [CrossRef] [PubMed]
- Dillon, P.K.; Kumar, A.; Kookana, R.; Leijs, R.; Reed, D.; Parsons, S.; Ingleton, G. Managed Aquifer Recharge-Risks to Groundwater Dependent Ecosystems: A Review. In Water for a Healthy Country Flagship Report to Land & Water Australia; CSIRO: Canberra, Australia, 2009. [Google Scholar]
- Rauch-Williams, T.; Drewes, J.E. Using soil biomass as an indicator for the biological removal of effluent-derived organic carbon during soil infiltration. Water Res. 2006, 40, 961–968. [Google Scholar] [CrossRef] [PubMed]
- Abel, C.D.T. Soil Aquifer Treatment: Assessment and Applicability of Primary Effluent Reuse in Developing Countries. Ph.D. Thesis, Delft University of Technology, Delft, The Netherlands, 2014. [Google Scholar]
- Meng, J.; Li, J.L.; Li, J.Z.; Sun, K.; Antwi, P.; Deng, K.W.; Wang, C.; Buelna, G. Efficiency and bacterial populations related to pollutant removal in an upflow microaerobic sludge reactor treating manure-free piggery wastewater with low COD/TN ratio. Bioresour. Technol. 2016, 201, 166–173. [Google Scholar] [CrossRef] [PubMed]
- Calderer, M.; Martí, V.; de Pablo, J.; Guivernau, M.; Prenafeta-Boldú, F.X.; Viñas, M. Effects of enhanced denitrification on hydrodynamics and microbial community structure in a soil column system. Chemosphere 2014, 111, 112–119. [Google Scholar] [CrossRef] [PubMed]
- Gao, H.; Schreiber, F.; Collins, G.; Jensen, M.M.; Kostka, J.E.; Lavik, G.; de Beer, D.; Zhou, H.Y.; Kuypers, M.M.M. Aerobic denitrification in permeable Wadden Sea sediments. ISME J. 2010, 4, 417–426. [Google Scholar] [CrossRef] [PubMed]
- Chen, D.; Yang, K.; Wang, H.Y.; Lv, B.; Ma, F. Characteristics of nitrate removal in a bio-ceramsite reactor by aerobic denitrification. Environ. Technol. 2015, 36, 1457–1463. [Google Scholar] [CrossRef] [PubMed]
- Wan, C.L.; Yang, X.; Lee, D.J.; Du, M.A.; Wan, F.; Chen, C. Aerobic denitrification by novel isolated strain using NO2-N as nitrogen source. Bioresour. Technol. 2011, 102, 7244–7248. [Google Scholar] [CrossRef] [PubMed]
- Patureau, D.; Davison, J.; Bernet, N.; Moletta, R. Denitrification under various aeration conditions in Comamonas sp., strain SGLYS2. FEMS Microbiol. Ecol. 1994, 14, 71–78. [Google Scholar] [CrossRef]
- Huang, H.K.; Tseng, S.K. Nitrate reduction by Citrobacter diversus under aerobic environment. Appl. Microbiol. Biotechnol. 2001, 55, 90–94. [Google Scholar] [CrossRef] [PubMed]
- Patureau, D.; Bernet, N.; Delgenès, J.P.; Moletta, R. Effect of dissolved oxygen and carbon-nitrogen loads on denitrification by an aerobic consortium. Appl. Microbiol. Biotechnol. 2000, 54, 535–542. [Google Scholar] [CrossRef] [PubMed]
- Chiu, Y.C.; Chung, M.S. Determination of optimal COD/nitrate ratio for biological denitrification. Int. Biodeterior. Biodegrad. 2003, 51, 43–49. [Google Scholar] [CrossRef]
- Kim, M.; Jeong, S.Y.; Yoon, S.J.; Cho, S.J.; Kim, Y.H.; Kim, M.J.; Ryu, E.Y.; Lee, S.J. Aerobic denitrification of Pseudomonas putida AD-21 at different C/N ration. J. Biosci. Bioeng. 2008, 106, 498–502. [Google Scholar] [CrossRef] [PubMed]
- Essandoh, H.M.K.; Tizaoui, C.; Mohamed, M.H.A.; Amy, G.; Brdjanovic, D. Soil aquifer treatment of artificial wastewater under saturated conditions. Water Res. 2011, 45, 4211–4226. [Google Scholar] [CrossRef] [PubMed]
- Zhang, S.S.; Jin, M.G.; Sun, Q. Experiment and numerical simulation on transportation of ammonia nitrogen in saturated soil column with steady flow. Procedia Environ. Sci. 2011, 10, 1327–1332. [Google Scholar] [CrossRef]
- Paus, K.H.; Morgan, J.; Gulliver, J.S.; Asce, F.; Hozalski, R.M. Effects of bioretention media compost volume fraction on toxic metals removal, hydraulic conductivity, and phosphorous release. J. Environ. Eng. 2014, 140. [Google Scholar] [CrossRef]
- Brown, P.; Ong, S.K.; Lee, Y. Influence of anoxic and anaerobic hydraulic retention time on biological nitrogen and phosphorus removal in a membrane bioreactor. Desalination 2011, 270, 227–232. [Google Scholar] [CrossRef]
- Güngör, K.; Ünlü, K. Nitrite and nitrate removal efficiencies of soil aquifer treatment columns. Turkish J. Eng. Environ. Sci. 2005, 29, 159–170. [Google Scholar]
- Abel, C.D.T.; Sharma, S.K.; Mersha, S.A.; Kennedy, M.D. Influence of intermittent infiltration of primary effluent on removal of suspended solids, bulk organic matter, nitrogen and pathogens indicators in a simulated managed aquifer recharge system. Ecol. Eng. 2014, 64, 100–107. [Google Scholar] [CrossRef]
- Ak, M.; Gunduz, O. Comparison of organic matter removal from synthetic and real wastewater in a laboratory-scale soil aquifer treatment system. Water Air Soil Pollut. 2013, 224, 1–16. [Google Scholar] [CrossRef]
- Wei, F.S.; Qi, W.Q.; Sun, Z.G.; Huang, Y.R.; Shen, Y.W. Water and Wastewater Monitoring and Analysis Method; China Environmental Science Press: Beijing, China, 2002; ISBN 978-7-8016-3400-9. [Google Scholar]
- Dong, X.Z.; Cai, M. Manual of System Determinative Common Bacteriology; Science Press: Beijing, China, 2001; ISBN 978-7-0300-8460-6. [Google Scholar]
- Schmidt, C.A.; Clark, M.W. Efficacy of a denitrification wall to treat continuously high nitrate loads. Ecol. Eng. 2012, 42, 203–211. [Google Scholar] [CrossRef]
- Münch, E.V.; Lant, P.; Keller, J. Simultaneous nitrification and denitrification in bench-scale sequencing batch reactors. Water Res. 1996, 30, 277–284. [Google Scholar] [CrossRef]
- Yao, S.; Ni, J.R.; Ma, T.; Li, C. Heterotrophic nitrification and aerobic denitrification at low temperature by a newly isolated bacterium, Acinetobacter sp. HA2. Bioresour. Technol. 2013, 139, 80–86. [Google Scholar] [CrossRef] [PubMed]
- Hayatsu, M.; Tago, K.; Saito, M. Various players in the nitrogen cycle: Diversity and functions of the microorganisms involved in nitrification and denitrification. Soil Sci. Plant Nutr. 2008, 54, 33–45. [Google Scholar] [CrossRef]
- Ryu, H.D.; Kim, D.; Lim, H.E.; Lee, S.I. Nitrogen removal from low carbon-to-nitrogen wastewater in four-stage biological aerated filter system. Process Biochem. 2008, 43, 729–735. [Google Scholar] [CrossRef]
- Zhang, L.Y.; Ye, Y.B.; Wang, L.J.; Xi, B.D.; Wang, H.Q.; Li, Y. Nitrogen removal processes in deep subsurface wastewater infiltration systems. Ecol. Eng. 2015, 77, 275–283. [Google Scholar] [CrossRef]
- Willems, H.P.; Rotelli, M.D.; Berry, D.F.; Smith, E.P.; Reneau, R.B., Jr.; Mostaghimi, S. Nitrate removal in riparian wetland soils: Effects of flow rate, temperature, nitrate concentration and soil depth. Water Res. 1997, 31, 841–849. [Google Scholar] [CrossRef]
- Fox, P.; Makam, R. Surface area and travel time relationships in aquifer treatment systems. Water Environ. Res. 2009, 81, 2337–2343. [Google Scholar] [CrossRef] [PubMed]
- Pavelic, P.; Dillon, P.J.; Mucha, M.; Nakai, T.; Barry, K.E.; Bestland, E. Laboratory assessment of factors affecting soil clogging of soil aquifer treatment systems. Water Res. 2011, 45, 3153–3163. [Google Scholar] [CrossRef] [PubMed]
- Quanrud, D.M.; Hafer, J.; Karpiscak, M.M.; Zhang, J.M.; Lansey, K.E.; Arnold, R.G. Fate of organics during soil-aquifer treatment: Sustainability of removals in the field. Water Res. 2003, 37, 3401–3411. [Google Scholar] [CrossRef]
- Bunsri, T.; Sivakumar, M.; Hagare, D. Transport and biotransformation of organic carbon and nitrate compounds in unsaturated soil conditions. Water Sci. Technol. 2008, 58, 2143–2153. [Google Scholar] [CrossRef] [PubMed]
- Gray, N.F. Biology of Wastewater Treatment; World Scientific: London, UK, 2004; ISBN 1-86094-332-2. [Google Scholar]
- Metcalf and Eddy, Inc. Wastewater Engineering: Treatment and Reuse; McGraw-Hill: New York, NY, USA, 2003; ISBN 978-0-0734-0118-8. [Google Scholar]
Figure 1.
A schematic diagram of experimental setup.

Figure 2.
The NO3–N concentration and the corresponding removal efficiency in the continuous wetting column (a,c) and the wetting/drying column (b,d).
Figure 2.
The NO3–N concentration and the corresponding removal efficiency in the continuous wetting column (a,c) and the wetting/drying column (b,d).

Figure 3.
Temporal variation of NO3–N (a), NH4–N (b) and COD (chemical oxygen demand) (c) concentration in the reclaimed water and the effluents.
Figure 3.
Temporal variation of NO3–N (a), NH4–N (b) and COD (chemical oxygen demand) (c) concentration in the reclaimed water and the effluents.

Figure 4.
The NH4–N concentration in the continuous wetting column (a) and the wetting/drying column (b).
Figure 4.
The NH4–N concentration in the continuous wetting column (a) and the wetting/drying column (b).

Figure 5.
The DO (dissolved oxygen) concentration (a) and the corresponding consumption (b) in the continuous wetting and the wetting/drying columns.
Figure 5.
The DO (dissolved oxygen) concentration (a) and the corresponding consumption (b) in the continuous wetting and the wetting/drying columns.

Figure 6.
The COD (chemical oxygen demand) concentration and the corresponding removal efficiency in the continuous wetting column (a,c) and the wetting/drying column (b,d).
Figure 6.
The COD (chemical oxygen demand) concentration and the corresponding removal efficiency in the continuous wetting column (a,c) and the wetting/drying column (b,d).

Figure 7.
The number of total bacteria, fungi, aerobic denitrifying-, nitrite- and nitrifying bacteria in the continuous wetting column (a,c) and the wetting/drying column (b,d) (CFU g−1 soil is the colony—forming units per gram of soil).
Figure 7.
The number of total bacteria, fungi, aerobic denitrifying-, nitrite- and nitrifying bacteria in the continuous wetting column (a,c) and the wetting/drying column (b,d) (CFU g−1 soil is the colony—forming units per gram of soil).

Figure 8.
Correlations between the aerobic denitrifying bacteria and COD (chemical oxygen demand) concentration, DO (dissolved oxygen) concentration in the continuous wetting column (a,b) and the wetting/drying column (e,f), correlations between microorganisms and COD concentration, DO concentration in the continuous wetting column (c,d) and the wetting/drying column (g,h) (CFU g−1 soil, colony—forming units per gram of soil) (Note: COD and DO data received 3 months before soil sampling).


Figure 9.
Adsorption isotherm of NH4–N in the test soil. Note: qe is the adsorption capacity of NH4–N (mg/g); Ce is the equilibrium concentration of the NH4–N in the soil solution (mg/L).
Figure 9.
Adsorption isotherm of NH4–N in the test soil. Note: qe is the adsorption capacity of NH4–N (mg/g); Ce is the equilibrium concentration of the NH4–N in the soil solution (mg/L).


Table 1.
Physical and chemical properties of the test soil in experiments.
| Soil Depth | Bulk Density | Sand | Silt | Clay | Organic | NO3–N | NH4–N |
|---|---|---|---|---|---|---|---|
| (cm) | (g/cm3) | (%) | (%) | (%) | Matter (%) | (mg/kg) | (mg/kg) |
| 5 | 1.47 | 35 | 57 | 8 | 1.24 | 100 | 0.7 |
| 15 | 1.47 | 35 | 57 | 8 | 0.83 | 25 | 0.7 |
| 35 | 1.49 | 28 | 61 | 11 | 0.48 | 48 | 1 |
| 55 | 1.49 | 12 | 72 | 16 | 0.64 | 66 | 0.5 |
| 75 | 1.52 | 19 | 67 | 14 | 0.54 | 68 | 1.1 |
| 95 | 1.54 | 20 | 66 | 14 | 0.27 | 78 | 0.4 |
Table 2.
Reclaimed-water quality for experiments.
| Parameters | Average Concentration (mg/L) | The Number of Samplings (n) |
|---|---|---|
| Chemical oxygen demand (COD) | 19.3 ± 2.6 | 71 |
| Ammonia nitrogen (NH4–N) | 0.29 ± 0.1 | 228 |
| Nitrate nitrogen (NO3–N) | 15.6 ± 1.6 | 228 |
| Total nitrogen (TN) | 17.3 ± 2.0 | 93 |
| Dissolved oxygen (DO) | 7.25 ± 0.6 | 10 |
© 2017 by the authors. Licensee MDPI, Basel, Switzerland. This article is an open access article distributed under the terms and conditions of the Creative Commons Attribution (CC BY) license (http://creativecommons.org/licenses/by/4.0/).
Share and Cite
MDPI and ACS Style
Pan, W.; Xiong, Y.; Huang, Q.; Huang, G. Removal of Nitrogen and COD from Reclaimed Water during Long-Term Simulated Soil Aquifer Treatment System under Different Hydraulic Conditions. Water 2017, 9, 786. https://doi.org/10.3390/w9100786
AMA Style
Pan W, Xiong Y, Huang Q, Huang G. Removal of Nitrogen and COD from Reclaimed Water during Long-Term Simulated Soil Aquifer Treatment System under Different Hydraulic Conditions. Water. 2017; 9(10):786. https://doi.org/10.3390/w9100786
Chicago/Turabian StylePan, Weiyan, Yunwu Xiong, Quanzhong Huang, and Guanhua Huang. 2017. "Removal of Nitrogen and COD from Reclaimed Water during Long-Term Simulated Soil Aquifer Treatment System under Different Hydraulic Conditions" Water 9, no. 10: 786. https://doi.org/10.3390/w9100786
Note that from the first issue of 2016, this journal uses article numbers instead of page numbers. See further details here.