Promoting Water Conservation: Where to from here?


CSIRO Land and Water, Ian Wark Building (B203), Clayton South, VIC 3169, Australia
*
Author to whom correspondence should be addressed.
Water 2018, 10(11), 1510; https://doi.org/10.3390/w10111510
Submission received: 14 August 2018
/
Revised: 24 September 2018
/
Accepted: 23 October 2018
/
Published: 25 October 2018
(This article belongs to the Special Issue Technologies and Interventions to Support Sustainable Urban Water Management)
Abstract
:This paper reports on a review of international water conservation efforts, but with a particular focus on the Australian context. The aim is to take stock of the current understanding of water conservation, in particular: what influences people’s decision to conserve water, what influences whether people persist with water conservation behavior and what contributes to awareness and familiarity of water conservation behaviors. We also explore how all these factors jointly can achieve water savings over time, and the efficacy of past efforts to save water. Subsequently, this is used to identify where leading practice for managing water conservation is heading, which we argue is the application of recent developments in behavioral science and advances in smart metering to personalize water conservation programs. To support individualized water conservation efforts, we need more longitudinal studies of water conservation behavior, a greater focus on behavioral science, as well as the development of modelling tools that embed insights and lessons of this research into decision support capability. This can help to develop the capacity to better implement water conservation programs that respond to short-term water scarcity crises, such as droughts, while also providing persistent reductions in per-capita water demand that can help meet strategic water planning needs, such as deferring or downsizing capital investment in supply infrastructure to accommodate demands associated with population growth.
1. Introduction
Over the last decade, several global regions have experienced severe droughts that have impacted on regional water supply security. Furthermore, it is expected that anthropogenic climate change will increase drought risk in many areas around the world [1]. Water-stressed regions have included California in the United States where a severe drought limited the water available to support a large population [2]. In Cape Town, South Africa an extended drought caused dwindling reservoirs and the possibility of a “day zero” when potable water supplies run-out for a modern city of 3.7 million people [3] clearly caused by a combination of drought and mismanagement. The water security of cities is often negatively influenced by population growth, competition with other demands (e.g., agriculture and environment), droughts, over-extraction, and pollution of fresh water sources [4,5,6]. Typically, however, it is when a drought strikes that underlying vulnerabilities become apparent, sometimes not allowing planners the time to respond. For example, Muller [7] argued that the potable water supply crisis in Cape Town was mostly a product of poor management and planning where decisions were made based on political popularity rather than a scientific assessment of drought risks. Ziervogel et al. [8] argued that potable water demand-side interventions, i.e., water conservation, is an essential climate adaptation priority for Cape Town. In particular, potable water conservation measures can be rapidly implemented in response to a drought event, while interventions to augment supply have a much longer lead time to reduce potable water security stress. With the benefit of hindsight, few would now argue it was not prudent to implement potable water conservation measures. In Australia, the location of the authors, the Millennium Drought was an extended period (1996–2010) of below average rainfall that meant water storages for Australia’s most populous cities reached critically low levels [9]. The response to the drought transformed how cities in Australia both source their water and how they use it [10]. In fact, due to the length of the drought, many would argue that it changed the culture of water management in the country [11,12].
Generally, the responses to potable water supply deficits are of three types:
- Conserve water;
- Substitute potable water with alternatives sources;
- Augment existing supplies.
Strategy B (substitute supply) and C (augment supply) usually come at considerable costs and require time to implement. Conversely, water conservation efforts support more responsive governance and can be implemented quickly and are not associated with large infrastructure investment costs. Therefore, pressures on potable water supply security highlight the importance of demand-side measures, where the focus of water services is not only on meeting growing demand through augmentation of supply infrastructure but also on shaping future demand to ensure that water services are reliable, cost-effective and environmentally sustainable [13]. Reduced potable water use is also associated with reduced energy use and greenhouse gas emissions [14,15,16,17]. Another important advantage of water conservation, similar to supply augmentation, is that it has the potential to protect environmental water flows, especially at times of drought [18,19] and can, if using stormwater as a supply source, even reduce environmental damage caused by urban runoff [20]. As such, potable water conservation is often considered to be an important tool in the toolbox to support Sustainable Urban Water Management (SUWM) [21,22,23,24].
This paper provides a review of water conservation experiences over the last couple of decades, with a specific focus on Australia, to identify any key lessons, and subsequently provides a discussion about where the key opportunities are for water conservation going forward. As such, the paper is primarily a review paper, but it is framed around a theoretical understanding of how water conservation is implemented through promoting awareness and understanding, and with the addition of decision trigger, such as a drought, initiate behavioral changes that conserve water. We do this in recognition that the primary driver for water conservation is the adoption of water-efficient practices by households. In particular, we structure the discussion around how to promote water conservation based on the notion of the “consumer decision journey” [25] translated into the context of water conservation behavior:
- Awareness and familiarity: how can you make people be aware of and familiar with water conservation practices? To what extent does this translate into consideration of water conservation behaviors? The consideration here is the active choice whether to undertake a particular behavior.
- Adoption: once water conservation practices are “on the radar”, what makes people consider and adopt them?
- Persisting: once people have adopted water conservation practices, to what extent will they persist with this behavior?
Finally, with this in mind, we ask: what approaches are available for planners to initiate water conservation behavior in response to future water security challenges?
2. Scope and Method of Paper
As already noted, this paper focuses on reviewing experiences to conserve potable water in urban areas, with most of the references from the US, the UK, Australia, and Spain. The paper’s scope does not cover water governance, but findings from this paper can help inform better decisions (i.e., who can use this information). We also note that the paper does not cover non-residential urban water conservation, or water demand from ex-urban uses such as agriculture.
The literature review was undertaken using Scopus abstract and citation database which covers more than 36,000 titles and 69 million records. We searched particular keywords, including but not limited to those listed here:
- “Water conservation” and Urban
- “Rainwater harvesting” and “water saving”
- “Irrigation”, “water saving” and urban
- “Smart meter”, feedback and “water saving”
- Tariff, metering, urban and water
- Media, water, conservation, urban and awareness
- Water, conservation, urban and “public awareness”
- “Water conservation” and psychology
- Awareness, “water conservation” and urban
- Awareness, “water demand management” and urban
Based on the search results, we focused primarily on those which fulfilled the criteria of (1) being one of the top-20 most highly cited OR which are published in the last two years, and (2) which had abstracts and/or titles that indicated relevance to our topic. Once key articles were identified and reviewed, we also followed the reference lists for what we perceived to be particularly pertinent information. Generally, we avoided conference papers except in cases when papers seemed particularly relevant. This approach was complemented with further “snowballing” where citations in papers found through the original search were used to develop a more comprehensive review of relevant papers.
3. Awareness and Familiarity with Water Conservation Behaviors
There is a reason many of the conservation programs aiming to reduce potable water demand focus on raising awareness, rather than focusing on providing financial incentives or restrictions. In China, where water shortages are becoming increasingly common, water pricing and raising awareness have been proposed as key strategies to reducing demand, while pricing reforms are perceived as more difficult to get right [26]. In fact, there is huge potential in voluntary water conservation [27]. This is because the first step towards a household deciding to conserve water is that they understand the importance of water conservation and that they know what to do to reduce water demand. In India, it was found that uptake of particular water conservation efforts, such as rainwater harvesting, was hampered due to lack of familiarity [28]. Stavenhagen et al. [29] have reviewed water conservation methods, and found that while information campaigns are considered important for creating a more informed and rational water user [30] but Inman and Jeffrey [31] found that media broadcasts tend to reduce water demand by 2–5% but the effectiveness of awareness campaigns is unclear and in the range of 0 to 8%. In a more recent study in California, regular media attention around drought and the need for water conservation has been associated with 11–18% reduction in water use [32]. In the context of Namibia, with near permanent water stress, it has also been argued that information and awareness campaigns need to have a long-term focus [33]. In one of the most encouraging results, a study in Australia found that providing householders with procedural information about how to reduce their water demand achieved a 16% reduction, indicating the power of individualized recommendations [34]. Based on experiences of water conservation awareness media campaigns in Barcelona, March et al. [35] report survey results which indicate that campaigns over several years can achieve a near complete awareness (92% in the case of Barcelona) of the impacts of severe drought and the associated need for water conservation. Furthermore, nearly two thirds of the population reported to have adopted measures to reduce their water consumption, although the majority of actions were behavioral, such as having shorter showers (74%), turning off the tap while brushing the teeth (67%) and only using the washing machine when full (49%). They do however note that there are concerns about how the media campaigns were implemented, in the sense that there needs to be a greater focus on how to reduce water demand and providing targeted information suitable to particular household segments. For example, it was noted there was a need for a greater focus on those households with outdoor water use, and what they could do to reduce water demand. This echoes research from the 1980s that found that while the awareness of the need for water conservation could be generated, given underlying circumstances, the increased understanding of specific of water conservation actions is harder to achieve [27]. The authors also noted that there needs to be a rigorous and quantitative approach to evaluating the effectiveness of awareness campaigns over the long term, and a better understanding of how the design of awareness campaigns influence water conservation outcomes in different contexts. Particular focus needs to be given to the influence of the credibility of the information source, the narrative style of the message, the information channel, and how the message is targeted to the individual [27]. Sauri [36], in a more recent review, has argued that awareness campaigns tend to benefit from having a particular behavior change in focus and it is important to target behavior changes that have a greater impact across a population. Willis et al. [37] described the innovative use of householder’s smart meter data to provide direct and individualized information feedback on water use patterns, which influenced changed behavior.
4. Influences on the Choice to Conserve Water
The choice to conserve water depends on contextual factors, such as the price of water, household characteristics, the level of inconvenience and practicality of practices, as well as the attitudes and social norms of the household [28,31,38]. A seminal paper by Gregory and Di Leo [39] found evidence in an Australian study that water conservation adoption was driven by a process of environmental awareness, personal involvement, habit formation and contextual factors such as income.
4.1. Contextual Factors
There are contextual factors that influence both water demand as well as the potential to conserve water [40]. For example, in the context of Sydney, it has been shown that changes in temperature, rainfall patterns, and evaporation, has a moderate impact on water demand [41,42]. We also know that the urban design, soil type and urban greenery has an impact on urban heat as well as on water demand [43,44,45]. It has also been observed in the Californian context, not surprisingly, that the potential for water savings are greatest during summer months [46].
4.2. Price and Restrictions
The elasticity of water demand to the price of water has been the topic of many studies [41,47,48]. This is a typical approach by economists and an example of such a study is that by Arbués et al. [49] explored an econometric model derived of the form Qd = f(P,Z), which relates water consumption to some measure of price (P) and other factors (Z) such as income, household type, or household composition. However, there is no consensus on the methodology to analyse water demand. Variables affecting demand include price, household income, weather, housing characteristics (number of bedrooms and bathrooms, garden size, metering), the frequency of billing and tariff design, indoor versus outdoor use (seasonal demand and peak-load pricing.). It was found in Namibia that pricing was important for reducing urban water demand but that the effectiveness of block tariffs was over-estimated [33]. Furthermore, water companies and/or governments often put in place water restrictions at times of drought, and this clearly helps to reduce demand [47,50]. We note, however, that restriction of urban water use, especially for outdoor irrigation, tends to come at a cost in terms of externalities put onto the community and ecosystem services and it will therefore in many instances be more efficient and desirable for planners and to implement alternative approaches [51,52,53].
4.3. Household Characteristics
Household characteristics influence water demand and the potential for water conservation, such as:
In a study in India, social norms, income, age, and self-efficacy (the perception of one’s actions capacity to make a difference) had an influence on water conservation behaviors [28]. Along these lines, Pullinger et al. [55] explored the influence of demographic factors on water conservation behavior, with the findings used to test the validity of existing standard approaches to modelling household water use within the water industry. Current approaches to household segmentation, for example, categorize “households of water users” based on socio-demographic or other household characteristics. These approaches assume that these household level variables can “predict” the water using behavior of particular types of households, as well as other environmental behaviors [56,57,58,59]. Another important goal of market segmentation is finding out which groups that could best be targeted to achieve water savings. Turner et al. [60] have suggested water conservation be promoted within low-income groups because of the high relative savings as well as social benefits to these groups. However, it has also been argued that there is no “average water user” because there are so many context-specific factors associated with different sites and different homes (kitchen sink, shower, toilet, outdoor tap, etc.) that vary so greatly that prediction becomes almost impossible [61]. In fact, it has been shown that even with segmentation based on attitudes, values, and socio-geo-demographic variables, current approaches provide relatively poor predictions of individual water use [59]. A study by Jorgensen et al. [62] in South Australia and Victoria, Australia, explored the way that the temporal dynamics of metered household water consumption could be explained by individual household characteristics. It was found that household size and personal motivations were important factors, and the level of social comparison predicts temporal changes over time. Sofoulis [63] argues, based on interviews with water professionals in Australia, that there is a need to focus more on the application of social, political, and cultural theory in designing water conservation programs. Theoretical insights from these fields can provide for better consideration of gender, intrinsic motivations, cultural considerations, and ethics.
4.4. Inconvenience and Impracticality
Dolnicar and Hurlimann [64] collected empirical data, through an Australian survey of 1495 people about attitudes towards water conservation and their stated water conservation behaviors. The results from this survey indicate that Australians generally had, at the time of the study, very positive attitudes towards water conservation and water-saving appliances; however, these positive attitudes did not consistently translate into reported water conservation behavior. In India, a large survey of urban households found that water conservation that requires some level of effort, but no financial cost was significantly less popular than water conservation that did not require behavioral change [28]. It is, therefore, believed that important barriers to adoption of water conservation behaviors are the perception of inconvenience and impracticality, as well as costs associated with water-saving appliances. Please note that costs in this instance are not just the financial cost of the appliance, but it includes the perceived time and effort it takes to acquire the appliance i.e., the opportunity cost of time and the perceived amount of space the appliance will require as well [65].
4.5. Attitudes and Social Norms
Fielding et al. [38] aimed to identify the key determinants of household water use, with a view to identifying those factors that could be targeted in water demand management campaigns. Objective water use data and surveys were collected from 1008 households in four local government areas of southeast Queensland, Australia. Results showed that demographic, psychosocial, behavioral, and infrastructure variables all have a role to play in determining household water use. Consistent with past research, household occupancy was the most important predictor of water use. Households in regions recently exposed to drought conditions and higher-level restrictions also used less water than those who had less experience with drought. The effect of water-efficient technology was mixed: some water-efficient appliances were associated with less water use, while others were associated with more water use. Results also demonstrated the importance of considering water use as a collective behavior that is influenced by household dynamics. Households who reported a stronger culture of water conservation used less water. These findings, along with evidence that good water-saving habits are linked to water conservation, highlight the value of policies that support long-term cultural shifts in the way people think about and use water. Along similar lines, among Indian households, water conservation behavior was most likely in households that considered it a community expectation, and that also had the view that government is not necessarily responsible for providing water security during a drought [28].
5. Persisting with Water Conservation Behaviors
Ideally, households persist with water conservation behaviors at the end of water conservation campaigns. Indeed, in many countries around the world, the per-capita water use is in decline:
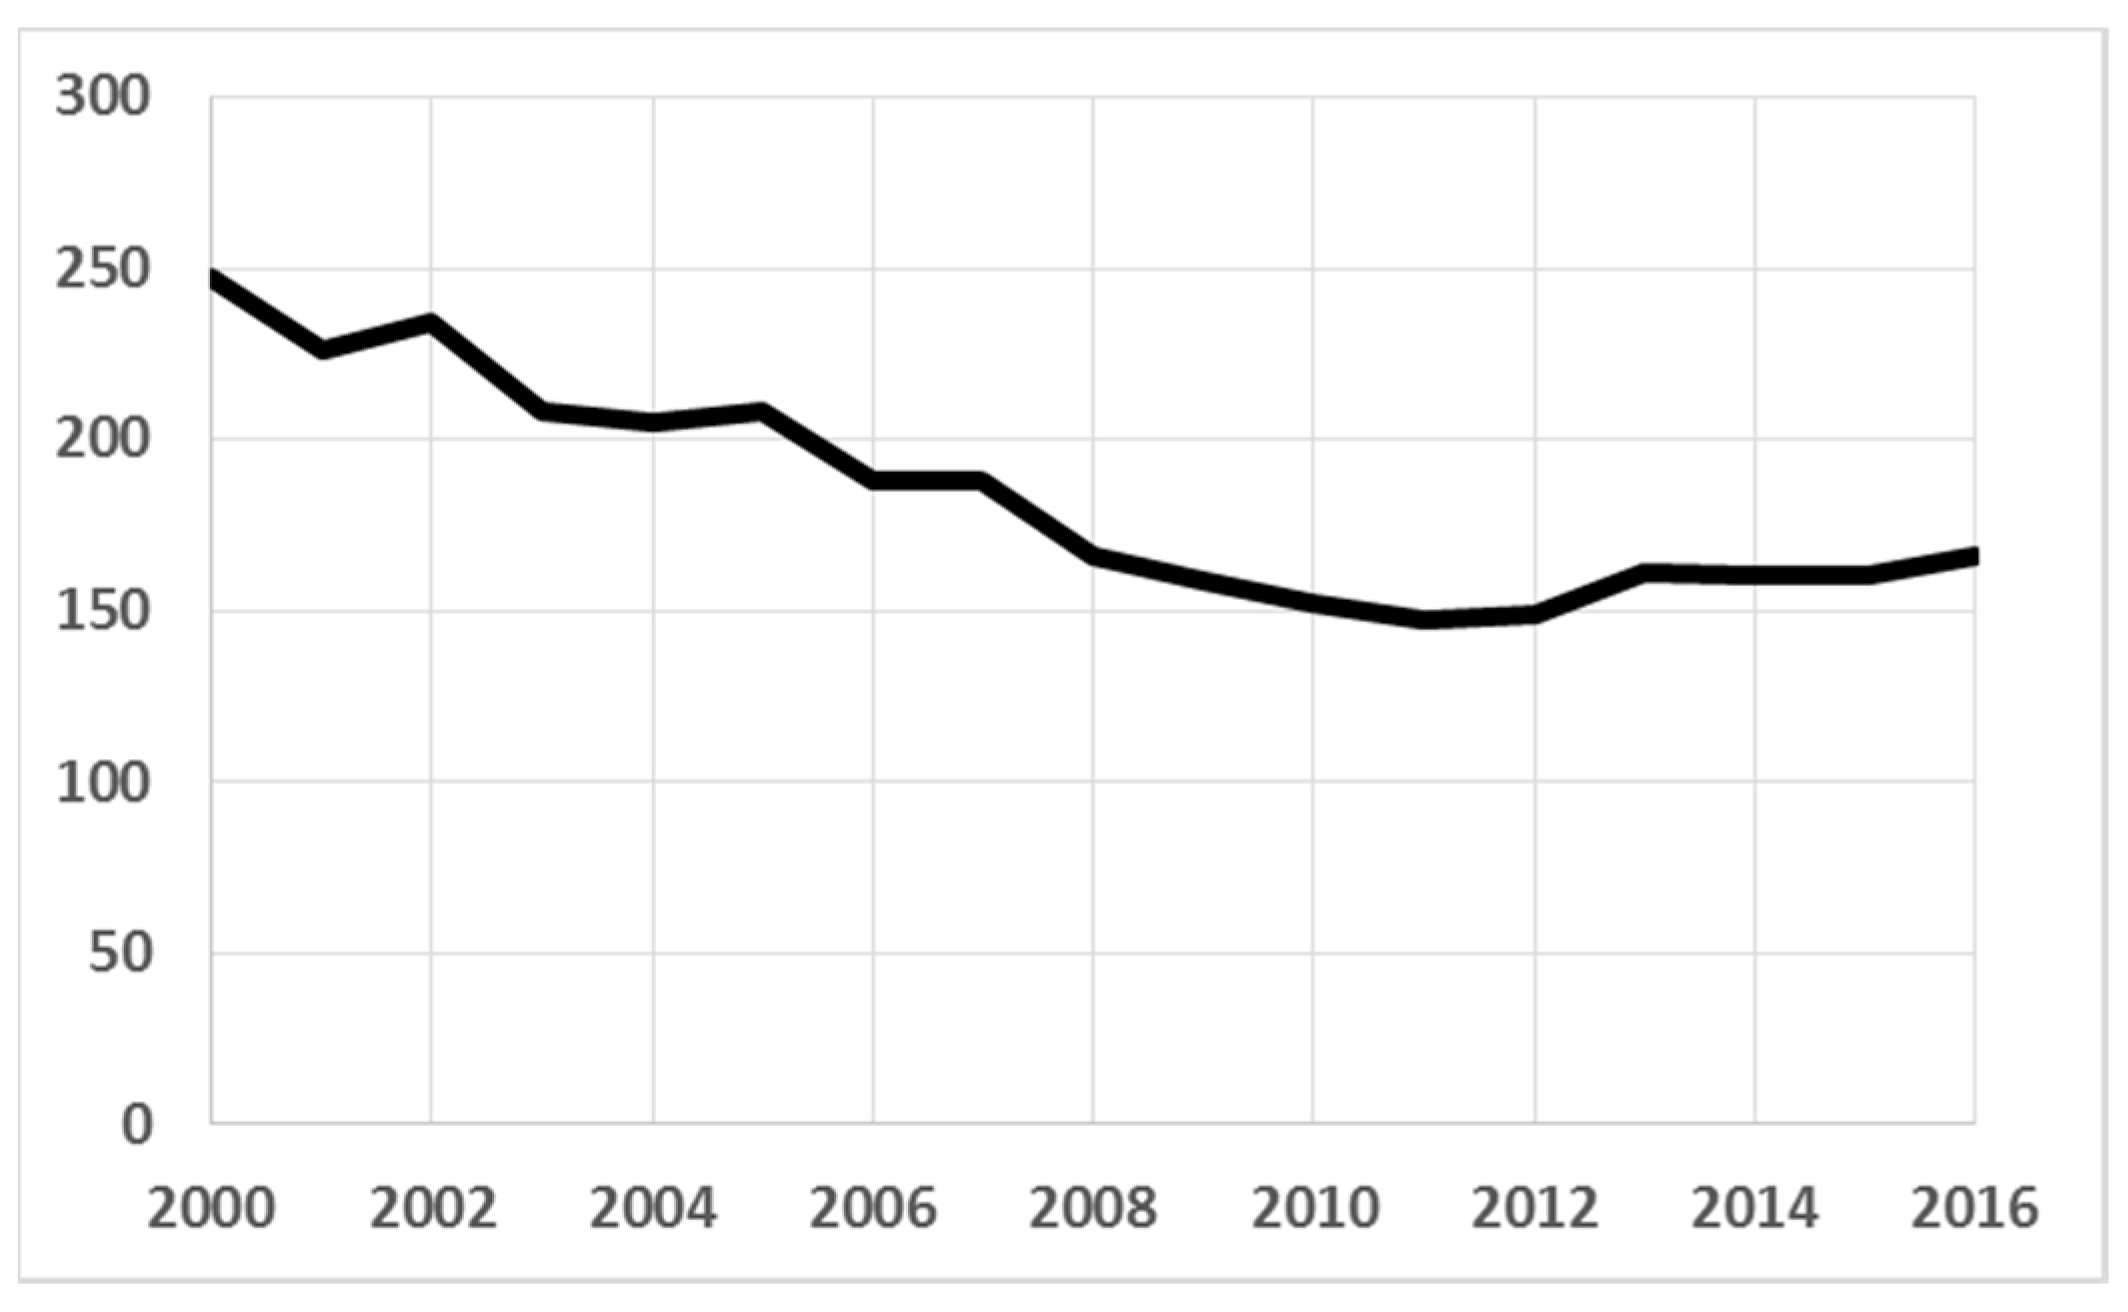
The reasons for declining per-capita potable water use may vary, which in Australian cities is likely to include a combination of adoption of more water-efficient appliances, shifts to denser urban form reducing outdoor water use, and greater awareness of the need to conserve scarce water resources, particularly during droughts. In many instances, targeted water conservation efforts have helped to reduce per-capita water use. One such example is the Millennium Drought in Australia, during which per-capita water use declined. Figure 1 shows that when the drought broke in Melbourne (circa 2012) there was a rebound in water demand, but most of the reduction in water demand achieved during the drought persisted. Similar results were observed in California which revealed that in the first year of a campaign to reduce water demand, there was a 19% reduction in residential water demand, but only a 9% reduction after two years [73]. This indicates that water demand bounced back after the initial efforts. The challenge for water planners is better to understand how programs to increase water conservation behavior during droughts can result in persistent change.
So what types of water conservation behaviors are more “sticky”, and which are likely to bounce back over time? Studies on this are limited, which in part is due to the difficulty in untangling the influence of behavioral change on water demand from more efficient appliance stock and increased substitution with alternative water sources (e.g., household rainwater tanks). However, the analysis of water conservation behavior surveys from both during and post-drought can, in combination with demand data, provide some useful insights. For this purpose, we explore the case of Sydney, as shown in Table 1. While there is not enough data to draw too many conclusions, we note a few implications of the data:
- There is a close correlation between stated intention in 2005 and the self-reported behavior in 2017, beyond what we would have expected. We interpret this to mean that stated intentions take time to be realised due to limits on resources—time, effort, knowledge, and capacity etc. However, over time, if motivational drivers remain, the stated intentions will largely be translated into behavior through a process of diffusion.
- We do however also note that two types of behavior where there appears to have been a bounce-back effect, i.e., only using washing machines when they are full, and turning the tap off while brushing teeth. We interpret this to mean that when opting out is easy, and when there is an effort and/or cost involved with persisting with the behavior, some of the households will opt out over time.
- We also note that the appliance stock has changed significantly over the period, with front-loading washing machines (previously considered a proxy for water-efficient appliances in Australia) increasing their proportion of the stock from 16% to 37%. This uptake of more water-efficient appliance stock will definitely lead to reduced water demand.
All considered the data in Table 1 is quite consistent with the per-capita water demand over time. Most households will persist with most of the water conservation behaviors even after motivational drivers are removed, except in cases when the effort and/or cost triggers householders to regress to prior water conservation behavior. This shows that further longitudinal research is required to explore the persistence of water conserving behaviors, as well as understand the contribution of behavior change relative to changes in appliance stocks in reducing water demand.
6. What Has Worked in the Past?
Inman and Jeffrey [31] provided a review of types of water conservation programs. They note a range of residential urban water demand in the range of 123–503 l/c/d; and then focus on an array of policy instruments by which reduced residential water demand can be achieved noting five categories of interventions: technological, financial, legislative, operation and maintenance, and educational. What we are interested in is, to what extent do the respective programs achieve water savings? This question is explored in Table 2.
Public awareness and media campaigns have been shown to be quite effective, although the exact mechanisms of triggering water use behavior, particularly outside of a drought, are largely unexplored. Public awareness campaigns promoting water conservation practices are a response to a drought episode, and once that drought threat recedes often the public awareness efforts are also wound back.
While public awareness campaigns have been effective in reducing water demand [40,91], there can be considerable variability. Therefore, it would be worthwhile to explore how the effectiveness can be maximized both during drought crises and outside of drought.
Moving from fixed pricing to volumetric pricing has a very considerable potential for impact in terms of water savings. However, this opportunity has already been realised for most cities who have implemented water metering and volumetric pricing schedules. Another option may be to introduce more complex cost reflective tariff structures, based on reducing demand at peak times that determines many of supply side costs [92]; or to use increasing block tariffs whereby consumers that use larger volumes pay a higher price per kL [93]. Although this has been noted as problematic from a fairness perspective given that the cost of meeting basic individual needs will depend substantially on the size of the household [94,95], and larger household size is generally correlated with lower socioeconomic status [96].
Promoting water-saving devices is another high impact option but does typically require some rebates or investments in infrastructure [97]. For example, rainwater tanks may help reduce water demand by up to 80%, based on studies in the Australian context, and which in the Indonesian context can provide 100% volumetric reliability in the right circumstances [98], and studies in Bangladesh indicate that 30–40% reliability can be achieved in their context [99]. However, rainwater harvesting comes at a significant investment cost, and requires ongoing maintenance and operation by households [100,101,102]. A key benefit of these investments in alternative water supply infrastructure is that, to a greater extent, the water demand does not bounce back after a drought.
System-wide adoption of smart metering technology seems to be easily obtained gain for managing water demand, where the cost of the metering equipment is to a large extent offset if successfully achieving the average reductions in water use of approximately 6%. The key advantages of smart meters, however, may not be the immediate savings, but the increased understanding of water use [90], the potential for leakage management [103]; as well as the possibility to provide targeted messaging to households (yet to be fully explored).
7. What May Work in the Future?
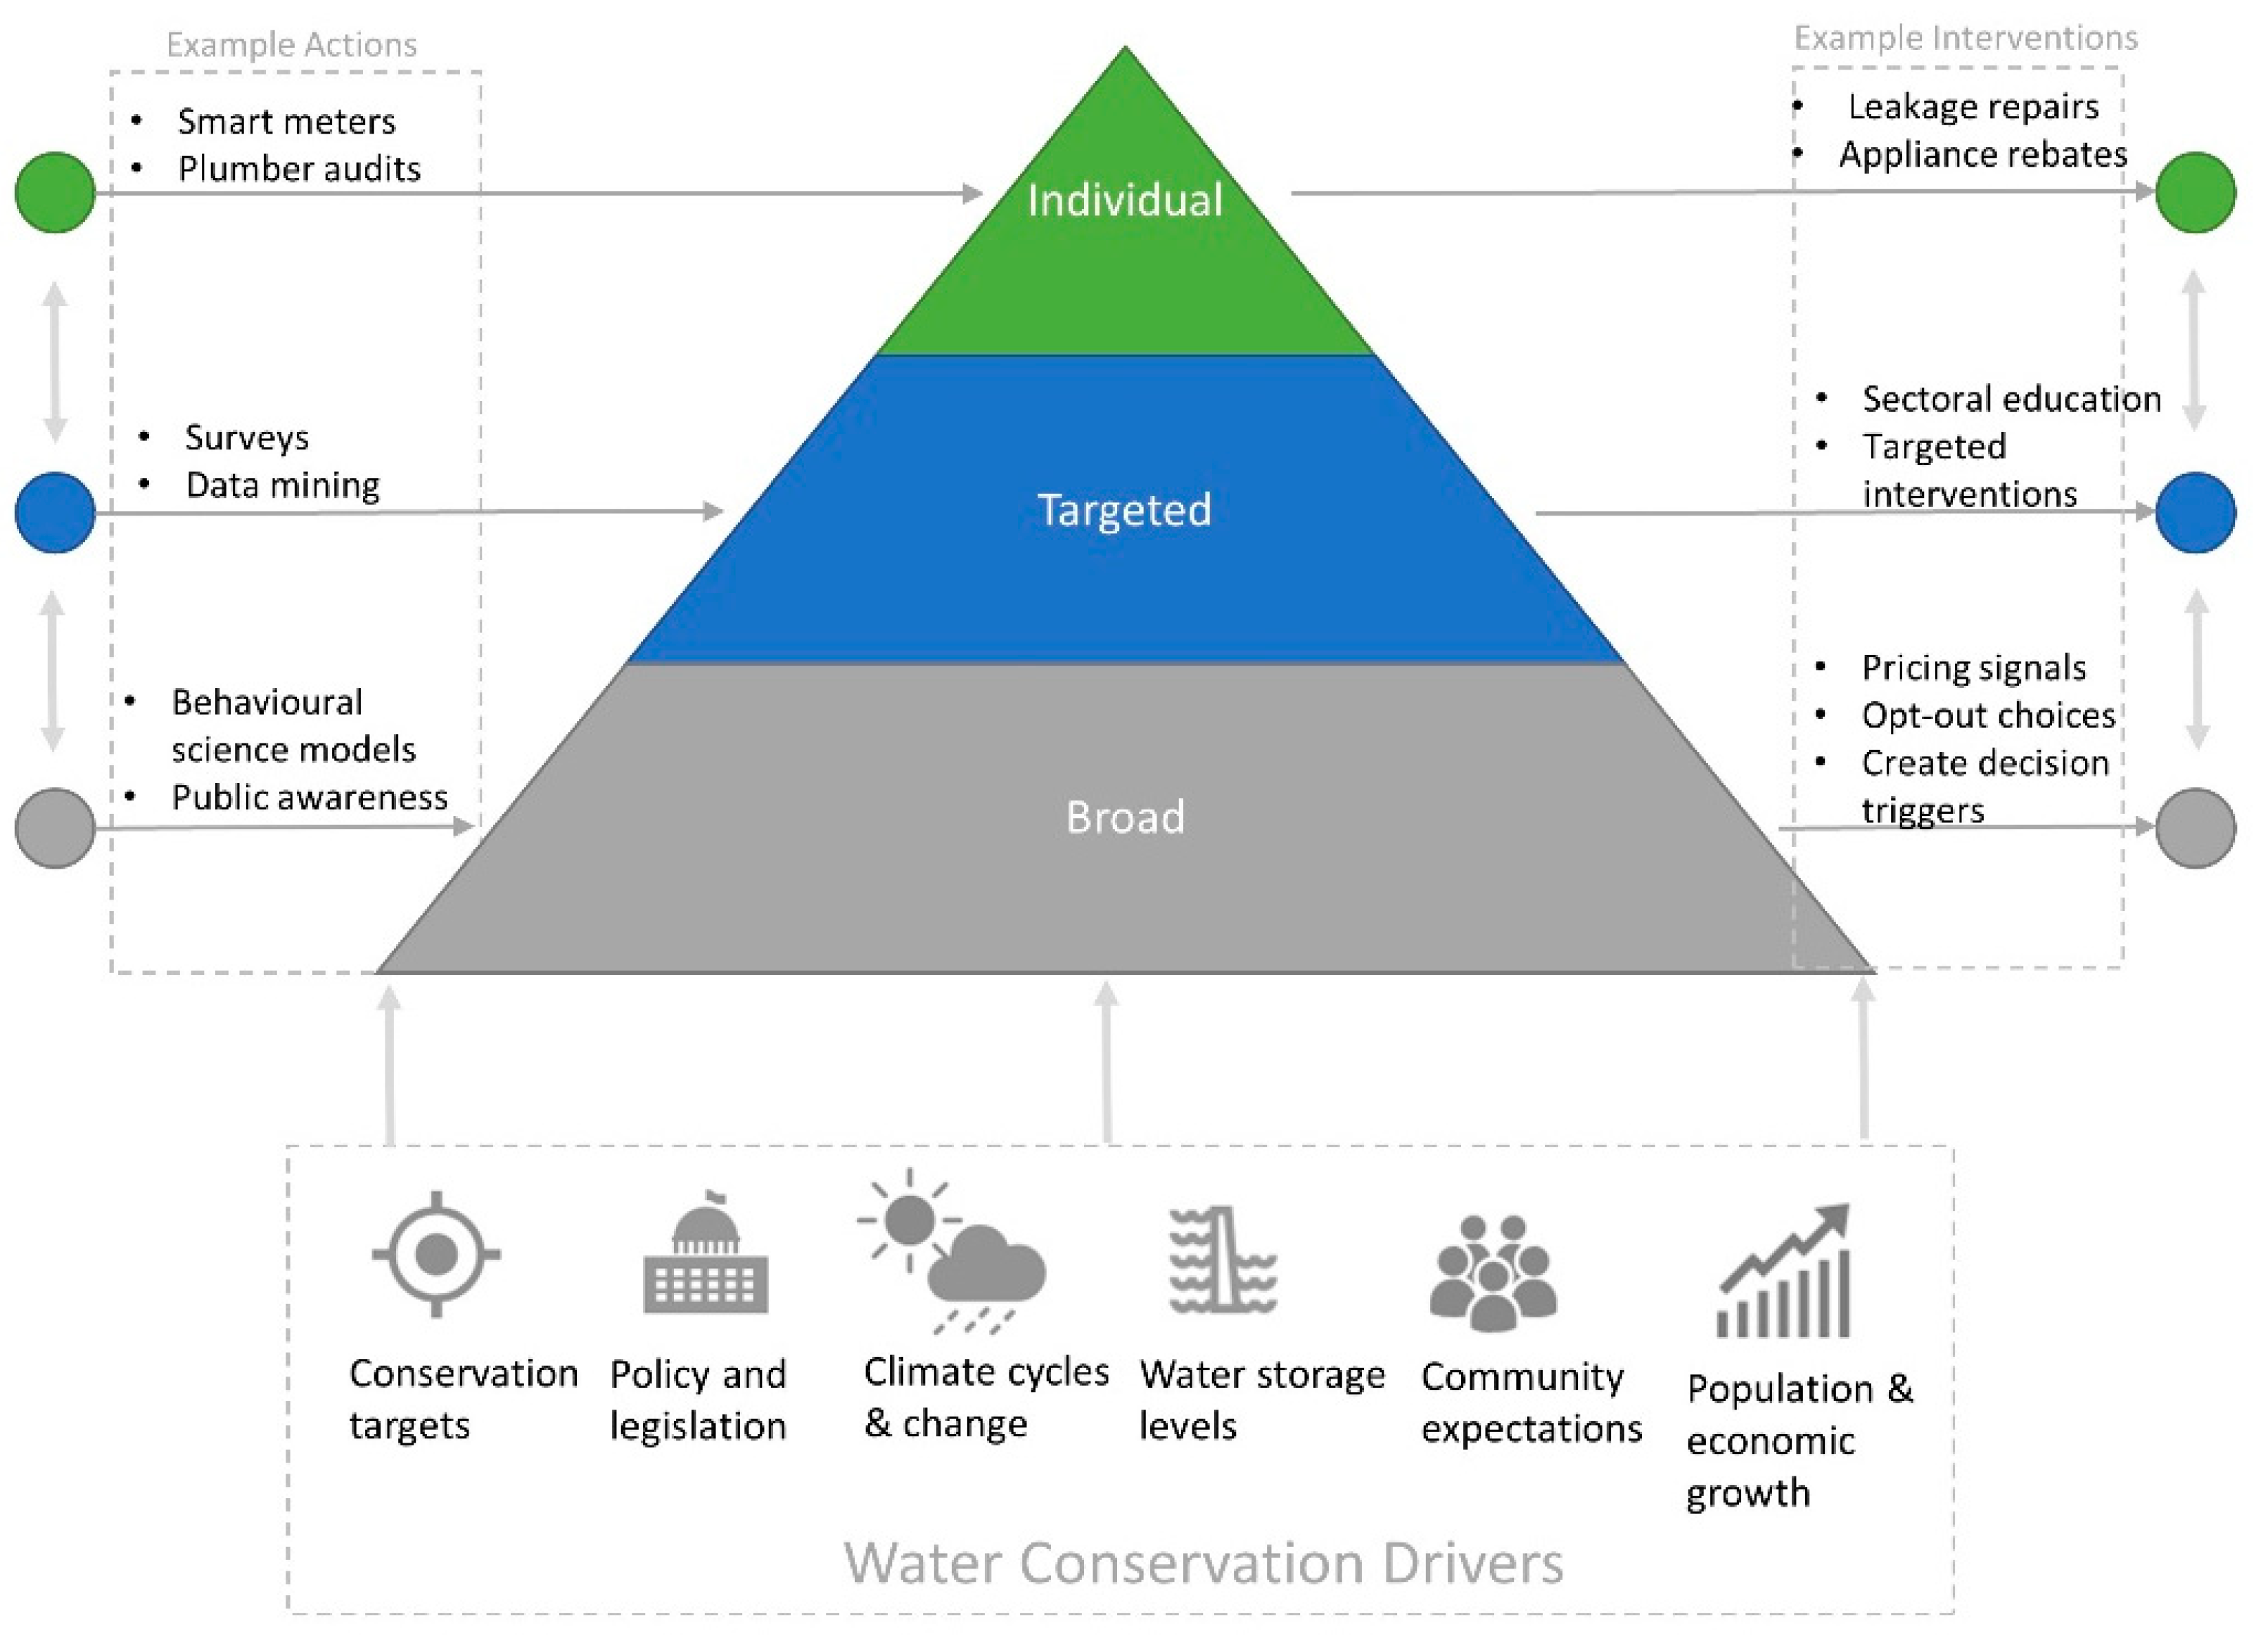
Here we draw on previous experiences to discuss the potential to improve water conservation practices into the future, with a focus on personalized messages to specific sectors and customer cohorts, smart metering, and nudging; plus, what this means in terms of research needs. Figure 2 depicts the types of actions that might be applied for interventions on a spectrum from broad-based approaches that seek to shape water demand for all customers, to more targeted approaches at specific sectors or cohorts that have been identified as receptive to water conservation, and finally, actions at the level of an individual customer. In reality, there will be cross-over and interdependencies between these levels of water conversation interventions. For example, smart meters across a sample of customers can be used to inform interventions targeted at specific cohorts, and also then inform likely responses to broad-level interventions, such as behavioral nudges where customers’ water consumption relative to a benchmark is displayed prominently on a bill to create a decision trigger for changed behavior or adoption of more water-efficient appliance. Water utilities designing conservation programs face a tension between individualizing programs to specific customer types versus broad-level programs that build awareness and create triggers for the adoption of water conservation across all customers. While individualized water conservation programs may provide the most appropriate interventions for specific customers they also come at increased cost and effort if programs are to be scaled up for broader adoption. For this reason, a hybrid approach may be most suitable based on the Pareto principle that develops individualized water conservation interventions for the 20% of customers who can potentially provide 80% of the water savings, while remaining customers are targeted through broad approaches.
7.1. Smart Metering as a Tool for Individualized Behavior Change Prompts
There needs to be further research on testing how to use smart meters as a catalyst for greater water conservation, including through the types of creative uses identified by researchers already:
- Understanding individual end-use profiles, including the potential for water savings in changed behavior, changed appliances and fixing leaks [90]. This has the potential to be the basis for individual messages to households, providing advice which is specific to circumstances.
- Using smart meters to enable more nuanced pricing structures, although this has already been explored by various agencies and researchers [50,73,78]; there is a need for further exploring how price structures, individual commitments to water conservation and information feedback can increase the effectiveness of policies in a fair manner.
7.2. Targeted Messaging for Specific Customer Cohorts
Already in 2004, Campbell et al. [41] suggest that “personalized communication can enhance the water-saving potential of implementation and decrease the effect of offsetting behavior”. This points to the importance of targeted communication to specific customer cohorts, which is quite feasible with current information technology and recent potential changes in how customers interact with their water suppliers, such as for example through social media. Personalized messages can either be based on contextual factors (demographics, age, type of dwelling, location, climate zone, etc.) or based on surveys that indicate individual preferences and practical limitations; or indeed based on real-time monitoring of water use through smart meters. There is also the opportunity now to provide individualized practical information to households on what types of water conservation actions that they can carry out.
7.3. Nudging for Encouraging Broad Customer Change
The behavioral science perspective is still developing in the research papers on water and resource conservation, with a limited number of papers [34,104,105,106,107,108]. There is a potential to use behavioral science in the way that Thaler describes [109,110]. For example, by understanding the choice architecture of water conservation we may move our attention to:
- How the decision to conserve water is being presented to community members.
- The cognitive effort of making choices, i.e., make choices easier to understand.
- The consumer funnel, which dictates that you may only make a decision if you are aware of a choice and if you are triggered into action by some event.
- Focusing on defaults, i.e., people are more likely to choose a pre-selected option.
- Understanding the broader set of attributes that people may consider when deciding to conserve water, especially in relation to factors such as effort and social norms.
- Rebound effects, i.e., what makes people choose to opt out of water conservation behaviors. In consumer and marketing theory, this loyalty aspect of purchases is critically important, and it should also be important for water conservation theory.
Modelling tools may also provide a better understanding of how all these effects interact to provide desirable outcomes. These tools can help visualize and communicate complex feedback from water conservation interventions in a consistent manner to a broad audience that might have different levels of experience and training backgrounds.
8. Research Needs
We note three key areas of research which are not yet well understood:
- There is a need for longitudinal studies of water conservation behaviors to better understand the impacts of enablers (such as awareness and motivational drivers) and barriers (effort and costs). Well-designed longitudinal studies will finally allow researchers to distinguish causality from correlation. This also needs to be done with a control sample to understand relative savings [86] because absolute savings in any one year will not prove useful as they do not account for other contextual factors such as climate or imposed restrictions which can vary significantly.
- The research around how to best promote water conservation is still not well developed including on which communication tools to use, how to frame and target messages, and how the success is influenced by trust in the information source, etc. These issues and questions were raised already by Syme in 2000 but some aspects in how information is best communicated appear to still require further research [27].
- To enable the capacity for nudging significant change in water conservation behavior through identifying strategic interventions and triggers, there is a need to further understanding of how state of the art behavioral science in the planning and evaluation of water conservation programs, along the lines of that by Moglia et al. [111].
9. Conclusions
Decades of research on water conservation behavior provide significant insights into the decision triggers and antecedent environmental factors that can influence households’ water demand. This has helped us to improve the prediction of behavioral responses to intervention programs, such as water restrictions and price increases. However, we still have a long way to go to accurately predict water use response to water conservation education and awareness programs, which takes into consideration individual customer values and motivations. Water conservation awareness and education are often implemented as part of a drought response. Given the high likelihood that Australian cities will in future experience drought events at least as severe as historical droughts, coupled with increasing water demand driven by population increase, water planners and policy-makers are faced with the dilemma of ensuring future water security while ensuring a least-cost approach to providing water services. Further supply augmentation in Australian cities is likely to have a significant cost, as in most cases suitable natural water supply sources are already fully allocated, which means there would need to be further investment in desalination plants that are capital and energy intensive. For this reason, the use of water conservation programs to reduce demand should be fully used as a first line response to droughts.
There is a need for an accurate and reliable water use model that could help water planners in developing both responsive and strategic water conservation programs to meet both short and long-term water security outcomes. However, there are still many gaps in our understanding of water conservation behavior, particularly around how we can make water conservation behavior stick when the threat of water scarcity is no longer preeminent in people’s minds. We argue the importance of longitudinal studies, as the key research method to develop further. Only by using longitudinal observations, can we have a clear understanding of key causalities of water conservation behavior, and test the key influencing factors that will cause water conservation behavior to persist in the long term. In addition to better modelling, we also advocate the use of new techniques employed in the behavioral sciences to “nudge” people towards better water use behavior through strategic, targeted interventions.
Author Contributions
All authors were involved in designing and discussing the study as well as writing the paper. M.M. was the project leader and engaged with stakeholders. All authors discussed the results and implications and commented on the manuscripts at all the stages.
Funding
This research is funded by the CRC for Low Carbon Living Ltd. supported by the Cooperative Research Centres program, an Australian Government initiative. It is also co-funded by CSIRO and Sydney Water.
Acknowledgments
We acknowledge those in CSIRO, and Sydney Water who have contributed to this research. This includes Stephen White and Luke Reedman of CSIRO, and from Sydney Water: Marcia Dawson, Bronwyn Cameron, Jonathan Dixon, and Andre Boerema
Conflicts of Interest
The authors declare no conflict of interest.
References
- Diffenbaugh, N.S.; Swain, D.L.; Touma, D. Anthropogenic warming has increased drought risk in California. Proc. Natl. Acad. Sci. USA 2015, 112, 3931–3936. [Google Scholar] [CrossRef] [PubMed] [Green Version]
- Mann, M.E.; Gleick, P.H. Climate change and California drought in the 21st century. Proc. Natl. Acad. Sci. USA 2015, 112, 3858–3859. [Google Scholar] [CrossRef] [PubMed] [Green Version]
- Wolski, P. How severe is Cape Town’s “Day Zero” drought? Significance 2018, 15, 24–27. [Google Scholar] [CrossRef]
- Postel, S.L. Entering an era of water scarcity: The challenges ahead. Ecol. Appl. 2000, 10, 941–948. [Google Scholar] [CrossRef]
- Pahl-Wostl, C. Transitions towards adaptive management of water facing climate and global change. Water Resour. Manag. 2007, 21, 49–62. [Google Scholar] [CrossRef]
- Maggioni, E. Water demand management in times of drought: What matters for water conservation. Water Resour. Res. 2015, 51, 125–139. [Google Scholar] [CrossRef] [Green Version]
- Muller, M. Cape Town’s drought: Don’t blame climate change. Nature 2018, 559, 174–176. [Google Scholar] [CrossRef] [PubMed]
- Ziervogel, G.; Johnston, P.; Matthew, M.; Mukheibir, P. Using climate information for supporting climate change adaptation in water resource management in South Africa. Clim. Chang. 2010, 103, 537–554. [Google Scholar] [CrossRef]
- Low, K.G.; Grant, S.B.; Hamilton, A.J.; Gan, K.; Saphores, J.D.; Arora, M.; Feldman, D.L. Fighting drought with innovation: Melbourne’s response to the Millennium Drought in Southeast Australia. Wiley Interdiscip. Rev. Water 2015, 2, 315–328. [Google Scholar] [CrossRef]
- Grant, S.B.; Fletcher, T.D.; Feldman, D.; Saphores, J.-D.; Cook, P.L.M.; Stewardson, M.; Low, K.; Burry, K.; Hamilton, A.J. Adapting Urban Water Systems to a Changing Climate: Lessons from the Millennium Drought in Southeast Australia. Environ. Sci. Tech. 2013, 47, 10727–10734. [Google Scholar] [CrossRef] [PubMed] [Green Version]
- Neal, B.; Mackellar, P.; Davies, R.G.; Ampt, E. Drought response measures in dampening urban demand. Inst. Civ. Eng. 2014, 167, 435–441. [Google Scholar] [CrossRef]
- Lindsay, J.; Dean, A.J.; Supski, S. Responding to the Millennium drought: Comparing domestic water cultures in three Australian cities. Reg. Environ. Chang. 2017, 17, 565–577. [Google Scholar] [CrossRef]
- Sharma, S.K.; Vairavamoorthy, K. Urban water demand management: Prospects and challenges for the developing countries. Water Environ. J. 2009, 23, 210–218. [Google Scholar] [CrossRef]
- Novotny, V. Water and energy link in the cities of the future—Achieving net zero carbon and pollution emissions footprint. Water Sci. Technol. 2011, 63, 184–190. [Google Scholar] [CrossRef] [PubMed]
- Siddiqi, A.; De Weck, O.L. Quantifying end-use energy intensity of the urban water cycle. J. Infrastruct. Syst. 2013, 19, 474–485. [Google Scholar] [CrossRef]
- Da Costa Silva, G. Climate change and the water-energy nexus: An urban challenge. J. Water Clim. Chang. 2014, 5, 259–275. [Google Scholar] [CrossRef]
- Nair, S.; George, B.; Malano, H.M.; Arora, M.; Nawarathna, B. Water-energy-greenhouse gas nexus of urban water systems: Review of concepts, state-of-art and methods. Resour. Conserv. Recycl. 2014, 89, 1–10. [Google Scholar] [CrossRef]
- Anderson, J.M. Blueprint for a greener city: Growth need not cost the earth. Water Sci. Technol. 2005, 52, 61–67. [Google Scholar] [CrossRef] [PubMed]
- Meng, W.; Fan, J.; Zhang, Y. Freshwater ecosystem health and ecological civilization construction at the watershed scale. Res. Environ. Sci. 2015, 28, 1495–1500. [Google Scholar]
- Walsh, C.J.; Fletcher, T.D.; Burns, M.J. Urban Stormwater Runoff: A New Class of Environmental Flow Problem. PLoS ONE 2012, 7, e45814. [Google Scholar] [CrossRef] [PubMed]
- Larsen, T.A.; Gujer, W. The concept of sustainable urban water management. Water Sci. Technol. 1997, 35, 3–10. [Google Scholar] [CrossRef]
- Hellström, D.; Jeppsson, U.; Kärrman, E. A framework for systems analysis of sustainable urban water management. Environ. Impact Assess. Rev. 2000, 20, 311–321. [Google Scholar] [CrossRef]
- Wong, T.H.F.; Brown, R.R. The water sensitive city: Principles for practice. Water Sci. Technol. 2009, 60, 673–682. [Google Scholar] [CrossRef] [PubMed]
- Marlow, D.R.; Moglia, M.; Cook, S.; Beale, D.J. Towards sustainable urban water management: A critical reassessment. Water Res. 2013, 47, 7150–7161. [Google Scholar] [CrossRef] [PubMed]
- Court, D.; Elzinga, D.; Mulder, S.; Vetvik, O.J. The Consumer Decision Journey; McKinsey Quarterly: Boston, MA, USA, 2014. [Google Scholar]
- Zhao, B.; Guo, X.; Marinova, D. To pay more or use less: China’s urban water pricing regime and water awareness. In Proceedings of the 19th International Congress on Modelling and Simulation—Sustaining Our Future: Understanding and Living with Uncertainty, Perth, Australia, 12–16 December 2011. [Google Scholar]
- Syme, G.J.; Nancarrow, B.E.; Seligman, C. The evaluation of information campaigns to promote voluntary household water conservation. Eval. Rev. 2000, 24, 539–578. [Google Scholar] [CrossRef]
- Ramsey, E.; Berglund, E.Z.; Goyal, R. The impact of demographic factors, beliefs, and social influences on residentialwater consumption and implications for non-price policies in urban India. Water 2017, 9, 844. [Google Scholar] [CrossRef]
- Stavenhagen, M.; Buurman, J.; Tortajada, C. Saving water in cities: Assessing policies for residential water demand management in four cities in Europe. Cities 2018, 79, 187–195. [Google Scholar] [CrossRef]
- Sustainable Water Use in Europe—Part 2: Demand Management; Technical Report No. 19; European Environment Agency: Copenhagen, Denmark, 2001.
- Inman, D.; Jeffrey, P. A review of residential water conservation tool performance and influences on implementation effectiveness. Urban Water J. 2006, 3, 127–143. [Google Scholar] [CrossRef] [Green Version]
- Quesnel, K.J.; Ajami, N.K. Changes in water consumption linked to heavy news media coverage of extreme climatic events. Sci. Adv. 2017, 3. [Google Scholar] [CrossRef] [PubMed]
- Magnusson, T.S. Household responsiveness to water demand management incentives in Windhoek, Namibia. Water Policy 2004, 6, 453–471. [Google Scholar] [CrossRef]
- Fielding, K.S.; Spinks, A.; Russell, S.; McCrea, R.; Stewart, R.; Gardner, J. An experimental test of voluntary strategies to promote urban water demand management. J. Environ. Manag. 2013, 114, 343–351. [Google Scholar] [CrossRef] [PubMed]
- March, H.; Domènech, L.; Saurí, D. Water conservation campaigns and citizen perceptions: The drought of 2007–2008 in the Metropolitan Area of Barcelona. Nat. Hazard. 2013, 65, 1951–1966. [Google Scholar] [CrossRef]
- Saurí, D. Water conservation: Theory and evidence in urban areas of the developed world. Annu. Rev. Environ. Resour. 2013, 38, 227–248. [Google Scholar] [CrossRef]
- Willis, R.M.; Stewarta, R.A.; Panuwatwanich, K.; Jones, S.; Kyriakides, A. Alarming visual display monitors affecting shower end use water and energy conservation in Australian residential households. Resour. Conserv. Recycl. 2010, 54, 1117–1127. [Google Scholar] [CrossRef]
- Fielding, K.S.; Russell, S.; Spinks, A.; Mankad, A. Determinants of household water conservation: The role of demographic, infrastructure, behavior, and psychosocial variables. Water Resour. Res. 2012, 48. [Google Scholar] [CrossRef] [Green Version]
- Gregory, G.D.; Di Leo, M. Repeated Behavior and Environmental Psychology: The Role of Personal Involvement and Habit Formation in Explaining Water Consumption. J. Appl. Soc. Psychol. 2003, 33, 1261–1296. [Google Scholar] [CrossRef]
- Gilbertson, M.; Hurlimann, A.; Dolnicar, S. Does water context influence behaviour and attitudes to water conservation? Australas. J. Environ. Manag. 2011, 18, 47–60. [Google Scholar] [CrossRef]
- Campbell, H.E.; Johnson, R.M.; Larson, E.H. Prices, devices, people, or rules: The relative effectiveness of policy instruments in water conservation. Rev. Policy Res. 2004, 21, 637–662. [Google Scholar] [CrossRef]
- Moglia, M.; Grant, A.L.; Inman, M.P. Estimating the effect of climate on water demand: Towards strategic policy analysis. Aust. J. Water Resour. 2009, 13, 81–94. [Google Scholar] [CrossRef]
- Cleugh, H.A.; Bu, E.; Simon, D.; Xu, J.; Mitchell, V.G. The impact of suburban design on water use and microclimate. In Proceedings of the MODSIM05—International Congress on Modelling and Simulation: Advances and Applications for Management and Decision Making, Melbourne, Australia, 12–15 December 2005. [Google Scholar]
- Symes, P.; Connellan, G. Water management strategies for urban trees in dry environments: Lessons for the future. Arboricult. Urban For. 2013, 39, 116–124. [Google Scholar]
- Connellan, G.; Symes, P. Soil moisture management to deliver productive and sustainable urban landscapes. In Proceedings of the 2015 ASABE/IA Irrigation Symposium: Emerging Technologies for Sustainable Irrigation-A Tribute to the Career of Terry Howell: American Society of Agricultural and Biological Engineers, Long Beach, CA, USA, 9–11 November 2015. [Google Scholar]
- Mayer, P.W.; Deoreo, W.B.; Towler, E.; Caldwell, E.; Miller, T.; Osann, E.R.; Brown, E.; Bickel, P.; Fisher, S.B. National Multiple Family Submetering and Allocation Billing Program Study; Aquacraft. Inc. and East Bay Municipal Utility District: Boulder, CO, USA, 2003. [Google Scholar]
- Kenney, D.S.; Goemans, C.; Klein, R.; Lowrey, J.; Reidy, K. Residential water demand management: Lessons from Aurora, Colorado. J. Am. Water Resour. Assoc. 2008, 44, 192–207. [Google Scholar] [CrossRef]
- Iglesias, E.; Blanco, M. New directions in water resources management: The role of water pricing policies. Water Resour. Res. 2008, 44. [Google Scholar] [CrossRef] [Green Version]
- Arbués, F.; García-Valiñas, M.a.Á.; Martínez-Espiñeira, R. Estimation of residential water demand: A state-of-the-art review. J. Soc. Econ. 2003, 32, 81–102. [Google Scholar] [CrossRef]
- Worthington, A.C.; Hoffman, M. An empirical survey of residential water demand modelling. J. Econ. Surv. 2008, 22, 842–871. [Google Scholar] [CrossRef]
- Brennan, D.; Tapsuwan, S.; Ingram, G. The welfare costs of urban outdoor water restrictions. Aust. J. Agric. Resour. Econ. 2007, 51, 243–261. [Google Scholar] [CrossRef] [Green Version]
- Mansur, E.T.; Olmstead, S.M. The value of scarce water: Measuring the inefficiency of municipal regulations. J. Urban Econ. 2012, 71, 332–346. [Google Scholar] [CrossRef]
- Kandulu, J.M.; MacDonald, D.H.; Dandy, G.; Marchi, A. Ecosystem Service Impacts of Urban Water Supply and Demand Management. Water Resour. Manag. 2017, 31, 4785–4799. [Google Scholar] [CrossRef]
- Yu, J.; Lipkin, F.; Moglia, M. Novel spatial analysis of residential resource consumption via the Melbourne train network. In Proceedings of the 21st International Congress on Modelling and Simulation, Gold Coast, Queensland, Australia, 29 November–4 Decmber 2015. [Google Scholar]
- Pullinger, M.; Browne, A.; Anderson, B.; Medd, W. Patterns of Water: The Water Related Practices of Households in Southern England, and Their Influence on Water Consumption and Demand Management; Final report of the ARCC-Water/SPRG Patterns of Water projects; Lancaster University: Lancaster, UK, 2013. [Google Scholar]
- Collier, A.; Cotterill, A.; Everett, T.; Muckle, R.; Pike, T.; Vanstone, A. Understanding and Influencing Behaviours: A Review of Social Research, Economics and Policy Making in DEFRA; DEFRA: London, UK, 2010.
- DEFRA. A Framework for Pro-Environmental Behaviours; Defra: London, UK, 2008.
- Ipsos, M. Public Acceptability of Water Efficiency Scenarios; Environment Agency: London, UK, 2007.
- Waterwise. Exploring the Potential for Smarter Demand Management: Forecasting and Targeted Interventions; WWF’s Itchen Initiative: London, UK, 2011. [Google Scholar]
- Turner, A.; White, S.; Beatty, K.; Gregory, A. Results of the Largest Residential Demand Management Program in Australia; Sydney Institute for Sustainable Futures & Sydney Water Corporation: Sydney, Australia, 2004. [Google Scholar]
- Medd, W.; Shove, E. The Sociology of Water Use; UK Water Industry Research: London, UK, 2006. [Google Scholar]
- Jorgensen, B.S.; Martin, J.F.; Pearce, M.W.; Willis, E.M. Predicting Household Water Consumption with Individual-Level Variables. Environ. Behav. 2014, 46, 872–897. [Google Scholar] [CrossRef]
- Sofoulis, Z. Below the double bottom line: The challenge of socially sustainable urban water strategies. Aust. J. Water Resour. 2013, 17, 211–221. [Google Scholar] [CrossRef]
- Dolnicar, S.; Hurlimann, A. Australians’ Water Conservation Behaviours and Attitudes. Aust. J. Water Resour. 2010, 14, 43–53. [Google Scholar] [CrossRef] [Green Version]
- Tapsuwan, S.; Mankad, A.; Greenhill, M.; Tucker, D. The influence of coping appraisals on the adoption of decentralised water systems in Australia. Urban Water J. 2017, 14, 45–52. [Google Scholar] [CrossRef]
- Renwick, M.A.; Green, R.D. Do residential demand side management policies measure up? An analysis of eight California water agencies. J. Environ. Econ. Manag. 2000, 40, 37–55. [Google Scholar] [CrossRef]
- Lee, M.; Tansel, B.; Balbin, M. Goal based water conservation projections based on historical water use data and trends in Miami-Dade County. Sustain. Cities Soc. 2011, 1, 97–103. [Google Scholar] [CrossRef]
- Brand, C.C.; Frost, D. Understanding declining water demand: New approaches to research and projections. In Proceedings of the AWWA/WEF Utility Management Conference 2013, Glendale, CA, USA, 10–13 March 2013. [Google Scholar]
- Brelsford, C.; Abbott, J.K. Growing into Water Conservation? Decomposing the Drivers of Reduced Water Consumption in Las Vegas, NV. Ecol. Econ. 2017, 133, 99–110. [Google Scholar] [CrossRef]
- Rutherfurd, I.; Finlayson, B. Whither Australia: Will availability of water constrain the growth of Australia’s population? Geogr. Res. 2011, 49, 301–316. [Google Scholar] [CrossRef]
- De Clercq, D.; Smith, K.; Chou, B.; Gonzalez, A.; Kothapalle, R.; Li, C.; Dong, X.; Liu, S.; Wen, Z. Identification of urban drinking water supply patterns across 627 cities in China based on supervised and unsupervised statistical learning. J. Environ. Manag. 2018, 223, 658–667. [Google Scholar] [CrossRef] [PubMed]
- Setlhogile, T.; Arntzen, J.; Pule, O.B. Economic accounting of water: The Botswana experience. Phys. Chem. Earth 2017, 100, 287–295. [Google Scholar] [CrossRef]
- Maddaus, L.A. Effects of Metering on Residential Water Demand for Davis, California; Brown and Caldwell: Sacramento, CA, USA, 2001. [Google Scholar]
- Melbourne Water. Water Outlook for Melbourne. Melbourne, Australia, 2016. Available online: https://www.melbournewater.com.au/sites/default/files/Water-outlook-Melbourne2016.pdf (accessed on 24 October 2018).
- Randolph, B.; Troy, P. Attitudes to conservation and water consumption. Environ. Sci. Policy 2008, 11, 441–455. [Google Scholar] [CrossRef]
- Baumann, D.D.; Boland, J.J.; Haneman, W.M. Urban Water Demand Management and Planning; Mcgraw-Hill: New York, NY, USA, 1998. [Google Scholar]
- Tortajada, C.; Joshi, Y.K. Water Demand Management in Singapore: Involving the Public. Water Resour. Manag. 2013, 27, 2729–2746. [Google Scholar] [CrossRef]
- Ofwat. Water and Regulation: Facts and Figures; Office of Water Services: Birmingham, UK, 2002.
- Lopez-Nicolas, A.; Pulido-Velazquez, M.; Rougé, C.; Harou, J.J.; Escriva-Bou, A. Design and assessment of an efficient and equitable dynamic urban water tariff. Application to the city of Valencia, Spain. Environ. Model. Softw. 2018, 101, 137–145. [Google Scholar] [CrossRef]
- Tanverakul, S.A.; Lee, J. Impacts of metering on residential water use in California. J. Am. Water Works Assoc. 2015, 107, E69–E75. [Google Scholar] [CrossRef]
- Petersen, J.E.; Shunturov, V.; Janda, K.; Platt, G.; Weinberger, K. Dormitory residents reduce electricity consumption when exposed to real-time visual feedback and incentives. Int. J. Sustain. High. Educ. 2007, 8, 16–33. [Google Scholar] [CrossRef]
- Liu, A.; Giurco, D.; Mukheibir, P. Urban water conservation through customised water and end-use information. J. Clean. Prod. 2016, 112, 3164–3175. [Google Scholar] [CrossRef]
- Erickson, T.; Podlaseck, M.E.; Sahu, S.; Dai, J.D.; Chao, T.; Naphade, M. The Dubuque Water Portal: Evaluation of the uptake, use and impact of residential water consumption feedback. In Proceedings of the SIGCHI Conference on Human Factors in Computing Systems, Austin, TX, USA, 5–10 May 2012; pp. 675–684. [Google Scholar]
- Liu, A.; Mukheibir, P. Digital metering feedback and changes in water consumption—A review. Resour. Conserv. Recycl. 2018, 134, 136–148. [Google Scholar] [CrossRef]
- Sønderlund, A.L.; Smith, J.R.; Hutton, C.; Kapelan, Z. Using smart meters for household water consumption feedback: Knowns and unknowns. Procedia Eng. 2014, 89, 990–997. [Google Scholar] [CrossRef] [Green Version]
- Turner, A.; White, S.; Beatty, K.; Gregory, A. Results of the largest residential demand management program in Australia. Water Sci. Technol. Water Supply 2005, 5, 249–256. [Google Scholar] [CrossRef]
- Khastagir, A.; Jayasuriya, N. Optimal sizing of rain water tanks for domestic water conservation. J. Hydrol. 2010, 381, 181–188. [Google Scholar] [CrossRef]
- Muthukumaran, S.; Baskaran, K.; Sexton, N. Quantification of potable water savings by residential water conservation and reuse—A case study. Resour. Conserv. Recycl. 2011, 55, 945–952. [Google Scholar] [CrossRef]
- Mayer, P.W.; Deoreo, W.B.; Towler, E.; Caldwell, E.; Miller, T.; Osann, E.R.; Brown, E.; Bickel, P.; Fisher, S.B. National Multiple Family Submetering and Allocation Billing Program Study; Aquacraft Inc.: Boulder, CO, USA, 2004. [Google Scholar]
- Willis, R.M.; Stewart, R.A.; Giurco, D.P.; Talebpour, M.R.; Mousavinejad, A. End use water consumption in households: Impact of socio-demographic factors and efficient devices. J. Clean. Prod. 2013, 60, 107–115. [Google Scholar] [CrossRef]
- Nieswiadomy, M.L. Estimating urban residential water demand: Effects of price structure, conservation, and education. Water Resour. Res. 1992, 28, 609–615. [Google Scholar] [CrossRef]
- Cole, G.; Stewart, R.A. Smart meter enabled disaggregation of urban peak water demand: Precursor to effective urban water planning. Urban Water J. 2013, 10, 174–194. [Google Scholar] [CrossRef]
- Sibly, H.; Tooth, R. The consequences of using increasing block tariffs to price urban water. Aust. J. Agric. Resour. Econ. 2014, 58, 223–243. [Google Scholar] [CrossRef]
- Whittington, D. Possible Adverse Effects of Increasing Block Water Tariffs in Developing Countries. Dev. Cult. Chang. 1992, 41, 87. [Google Scholar] [CrossRef]
- Pashardes, P.; Hajispyrou, S. Consumer Demand and Welfare under Increasing Block Pricing; University of Cyprus Working Papers in Economics 0207; University of Cyprus Department of Economics: Nicosia, Cyprus, May 2002. [Google Scholar]
- Australian Bureau of Statistics. Measures of Socioeconomic Status. ABS Catalogue no. 1244.0.55.001; 2011. Available online: http://www.abs.gov.au/ausstats/[email protected]/mf/1244.0.55.001 (accessed on 24 October 2018).
- Tapsuwan, S.; Burton, M.; Mankad, A.; Tucker, D.; Greenhill, M. Adapting to Less Water: Household Willingness to Pay for Decentralised Water Systems in Urban Australia. Water Resour. Manag. 2014, 28, 1111–1125. [Google Scholar] [CrossRef]
- Juliana, I.C.; Syahril Badri Kusuma, M.; Cahyono, M.; Kardhana, H.; Martokusumo, W. Performance of rainwater harvesting system based on roof catchment area and storage tank capacity. MATEC Web Conf. 2017, 101. [Google Scholar] [CrossRef]
- Bashar, M.Z.I.; Karim, M.R.; Imteaz, M.A. Reliability and economic analysis of urban rainwater harvesting: A comparative study within six major cities of Bangladesh. Resour. Conserv. Recycl. 2018, 133, 146–154. [Google Scholar] [CrossRef]
- Moglia, M.; Gan, K.; Delbridge, N.; Tjandraatmadja, G.; Gulizia, E.; Pollard, C.; Sharma, A.; Cook, S. Condition inspection of rainwater tanks in Melbourne. Eng. Aust. 2015, 1413–1417. [Google Scholar]
- Moglia, M.; Gan, K.; Delbridge, N. Exploring methods to minimize the risk of mosquitoes in rainwater harvesting systems. J. Hydrol. 2016, 543, 324–329. [Google Scholar] [CrossRef]
- Moglia, M.; Gan, K.; Delbridge, N.; Sharma, A.K.; Tjandraatmadja, G. Investigation of pump and pump switch failures in rainwater harvesting systems. J. Hydrol. 2016, 538, 208–215. [Google Scholar] [CrossRef]
- Britton, T.C.; Stewart, R.A.; O’Halloran, K.R. Smart metering: Enabler for rapid and effective post meter leakage identification and water loss management. J. Clean. Prod. 2013, 54, 166–176. [Google Scholar] [CrossRef]
- Athanasiadis, I.N.; Mentes, A.K.; Mitkas, P.A.; Mylopoulos, Y.A. A Hybrid Agent-Based Model for Estimating Residential Water Demand. Simulation 2005, 81, 175–187. [Google Scholar] [CrossRef] [Green Version]
- Rixon, A.; Moglia, M.; Burn, S. Exploring water conservation behaviour through participatory agent-based modelling. In Topics on System Analysis and Integrated Water Resources Management; Elsevier: Oxford, UK, 2007; pp. 73–96. [Google Scholar]
- Fraternali, P.; Baroffio, G.; Pasini, C.; Galli, L.; Micheel, I.; Novak, J.; Rizzoli, A. Integrating Real and Digital Games with Data Analytics for Water Consumption Behavioral Change: A Demo. In 2015 IEEE/ACM 8th International Conference on Utility and Cloud Computing(UCC); IEEE: Limassol, Cyprus, 2015. [Google Scholar]
- Koutiva, I.; Makropoulos, C. Modelling domestic water demand: An agent based approach. Environ. Model. Softw. 2016, 79, 35–54. [Google Scholar] [CrossRef]
- Moglia, M.; Cook, S.; McGregor, J. A review of Agent-Based Modelling of Technology Diffusion with special reference to residential energy efficiency. Sustain. Cities Soc. 2017, 31, 173–182. [Google Scholar] [CrossRef]
- Thaler, R.H.; Sunstein, C.R. Nudge: Improving Decisions about Health, Wealth, and Happiness; Yale University Press: New Haven, CT, USA, 2008; ISBN 978-0-300-12223-7. [Google Scholar]
- Thaler, R.H.; Sunstein, C.R.; Balz, J.P. Choice architecture. In The Behavioral Foundations of Public Policy; Princeton University Press: Princeton, NJ, USA, 2013; pp. 428–439. [Google Scholar]
- Moglia, M.; Podkalicka, A.; McGregor, J. An agent-based model of residential energy efficiency adoption. J. Artif. Soc. Soc. Simul. 2018, 21, 1–26. [Google Scholar] [CrossRef]
Figure 1.
Residential water use in Melbourne, 2000–2016. X-axis: years. Y-axis: Per-capita residential water use in liters per person per day. Sourced from Melbourne Water [74].
Figure 1.
Residential water use in Melbourne, 2000–2016. X-axis: years. Y-axis: Per-capita residential water use in liters per person per day. Sourced from Melbourne Water [74].

Figure 2.
Water conservation drivers and levels of intervention


Table 1.
Rates of self-reported water conservation behaviors in Sydney 2005 and 2017. First two data columns are from Randolph and Troy [75]. The last data column is based on a survey of 406 households in Sydney by the authors in 2017.
Table 1.
Rates of self-reported water conservation behaviors in Sydney 2005 and 2017. First two data columns are from Randolph and Troy [75]. The last data column is based on a survey of 406 households in Sydney by the authors in 2017.
| Self-Reported Behavior 2005 | Stated Intention 2005 | Self-Reported Behavior 2017 | |
|---|---|---|---|
| Use half flush button on the toilet | 13% | 62% | 62% |
| Use the washing machine only when full | 21% | 86% | 56% |
| Take shorter showers | 29% | 58% | 57% |
| Reduce garden watering | 13% | 44% | 50% |
| Turn the tap off while brushing teeth | 18% | 92% | 72% |
| Front-loading washing machine (a proxy for water-efficient appliance) | 16% | N/A | 37% |
Table 2.
Estimates of water savings from different types of water conservation programs. Ranges reported using the range of estimates in the different studies mentioned.
Table 2.
Estimates of water savings from different types of water conservation programs. Ranges reported using the range of estimates in the different studies mentioned.
| Type of Program | The Estimated Range of Savings |
|---|---|
| Public awareness/media campaigns (2–20%) | |
| Public awareness campaigns, e.g., media broadcasts [76] | 2–5% |
| Public awareness and media campaign during a drought in Barcelona [35] | 21% |
| Providing simple procedural information to households on how to achieve water conservation in a small study in Queensland, Australia [34] | 16% |
| Media attention during drought, i.e., ~100 articles bimonthly [32] | 11–18% |
| Information and media campaign during drought [77] | 11% |
| Implementation of water use restrictions, and reductions in the household and network leakage in the UK [78] | 14% |
| A review of the evidence for the effectiveness of awareness campaigns reports results of 5–20% reduction but notes that the contextual factors and design of the awareness campaign are of critical importance [36] | 5–20% |
| Metering linked with pricing mechanism (−16–56%) | |
| In an 8-year study in Aurora, Colorado, metering linked with a block-based tariff found that people, in fact, used 16% more water than before, presumably because of the being better able to control not going into a higher block [47] | −16% |
| Implementing a dynamic tariff system and using smart meters in Valencia, Spain has provided considerable water savings [79] | Up to 18% |
| Metering residential water use and charging on a per unit basis in several cases in the US, excl. limited metering [31] | 10–56% |
| Metering residential water use and moving from a flat rate to volumetric pricing [80] | 15–31% |
| Smart Metering feedback of information to householders (3–20%) | |
| Real-time feedback on water use, via meters [81] | 3% |
| Public awareness promoted using smart water meters in Copenhagen [29] | 20% |
| In Dubuque, the US, a study of the water conservation effects of an online water portal providing near real-time feedback to households based on smart metering information there were measurable water savings | 7% |
| Public goal setting combined with installation of smart meters to provide feedback to households, in Zaragoza, Spain [29] | 5% |
| Smart metering intervention providing detailed feedback on household water use, in the context of Australia [82] | 8% |
| Smart metering feedback of information to households [83] | 7% |
| Synthesis of a range of smart metering feedback studies [84] | 6% |
| A review by Sønderlund et al. [85] found that the amount of water savings based on providing feedback on water consumption to households varies considerably (3–54%), with average water savings of 20% | 20% |
| Water-saving/efficient devices (12–80% depending on type) | |
| Residential retrofit program in Sydney provided considerable population level savings [86] | 12% |
| Adoption of rainwater harvesting, in the context of Australia [87] | Up to 80% |
| Use of rainwater found to be able to meet a large proportion of household demand in the context of Melbourne, Australia [88] | 40% |
| Retrofitting water-efficient devices [89] | 50% |
| Water-efficient washing machines were found in a metering study to provide significant water savings to individual households in the Gold Coast, Australia [90] | 15% |
| Water-efficient shower heads were found in a metering study to provide high levels of water savings to individual households in the Gold Coast, Australia [90] | 19% |
© 2018 by the authors. Licensee MDPI, Basel, Switzerland. This article is an open access article distributed under the terms and conditions of the Creative Commons Attribution (CC BY) license (http://creativecommons.org/licenses/by/4.0/).
Share and Cite
MDPI and ACS Style
Moglia, M.; Cook, S.; Tapsuwan, S. Promoting Water Conservation: Where to from here? Water 2018, 10, 1510. https://doi.org/10.3390/w10111510
AMA Style
Moglia M, Cook S, Tapsuwan S. Promoting Water Conservation: Where to from here? Water. 2018; 10(11):1510. https://doi.org/10.3390/w10111510
Chicago/Turabian StyleMoglia, Magnus, Stephen Cook, and Sorada Tapsuwan. 2018. "Promoting Water Conservation: Where to from here?" Water 10, no. 11: 1510. https://doi.org/10.3390/w10111510
Note that from the first issue of 2016, this journal uses article numbers instead of page numbers. See further details here.