Assessing the Hydrologic Impacts of Land Use Change in the Taihu Lake Basin of China from 1985 to 2010

1
State Key Laboratory of Lake Science and Environment, Nanjing Institute of Geography and Limnology, Chinese Academy of Sciences, Nanjing 210008, China
2
University of Chinese Academy of Sciences, Beijing 100049, China
*
Author to whom correspondence should be addressed.
Water 2018, 10(11), 1512; https://doi.org/10.3390/w10111512
Submission received: 13 August 2018
/
Revised: 17 October 2018
/
Accepted: 23 October 2018
/
Published: 25 October 2018
(This article belongs to the Special Issue Catchment Modelling)
Abstract
:In recent decades, the land use patterns in the Taihu Lake Basin (TLB) have undergone tremendous change. Assessing the response of land surface hydrological processes caused by land use change is conducive to basin water resource management and the prevention of urban flooding. The water yield under different land use scenarios in 1985, 1995, 2000, 2005, and 2010 were calculated by the STREAM model. During the study period of 1985–2010, the contribution of farmland to the total water yield decreased from 47.20% to 35.2%. The contribution of construction land to the total water yield increased from 10.50% to 25.82%. There was a significant spatial difference in the growth of the water yield in 1985–2010. The Pudong sub-region, Puxi sub-region, Yangchengdianmao sub-region, and the Wuchengxiyu sub-region, with relatively faster urban development, also had higher water yield growth rates. During the study period, the growth rate of water yields in towns showed a spatial clustering feature. MI increased from 0.22 to 0.38, indicating that this spatial clustering feature had an increasing trend. The results of an LISA analysis showed that there was a significant spatial difference in the growth rate of water yield in the TLB. The high growth centers are mainly located in the north of the basin, while the low growth centers are mainly located in the southwest of the basin. At the same time, the center of the high growth rate of water yield showed a certain trend of expansion and transfer. Regression analysis showed that urban development had a significant impact on water yield; for every increase of 1 km2 of construction land in the TLB, there was an increase of water yield of more than 300,000 m3. Further study indicated that the growth of local water production in TLB was much higher than the average value of the basin, and it was significantly related to the gross domestic product (GDP) per capita.
1. Introduction
Land use and land cover (LULC) changes are major factors of global environmental change, with potentially severe impacts on human livelihoods [1]. LULC changes are usually caused by the expansion of agriculture, urbanization, deforestation, and the day-to-day activities of mankind. At different spatial and temporal scales, LULC affects hydrology [2,3,4]. Assessing the impacts of LULC changes on hydrological characteristics is vital for both understanding the effects of LULC changes on hydrological processes over the earth surface [5], and managing and developing watersheds [6]. In addition, it is important for flood potential prediction and mitigation of hazard and sustainable developments, to link the effects of land use change on the hydrological cycle [7,8].
LULC changes are one of the main factors influencing regional hydrological characteristics, which lead to changes in water distribution in hydrological processes such as evaporation, runoff, lateral flow, infiltration, and groundwater. Because of the transpiration of vegetation, the conversion of woodland to other types of land is often accompanied by a decrease in evapotranspiration (ET) [9,10]. Some studies suggest that grassland and lateral flow are positively correlated [11]. Urbanization and agricultural land expansion will lead to an increase in impervious surface area, which may lead to an increase in surface runoff, and a decrease in infiltration and groundwater recharge [12,13]. Differences in watershed development and landscape patterns make hydrological processes respond differently to LULC change. For example, detection thresholds for urbanized impervious surfaces that begin to have a significant influence on hydrological characteristics are widely distributed between 5% and 20% [14,15,16]. At the same time, studies in urbanization areas show that the increase of streamflow is closely related to urbanization [10,17,18], and regions with high urbanization have a greater impact on streamflow and peak values [19].
At present, the methods for studying the hydrological response of LULC changes include statistical analysis and model simulation. The statistical analysis methods include trend analysis of long time series [20], and the paired catchment approach [21]. The trend analysis method is usually performed by comparing the catchment in which LULC changes in the region, with a catchment without significant changes, and is generally applicable to areas with long-term monitoring data. The advantage of the paired catchments approach is that it can remove the influence of meteorological factors, but is generally only applicable to small watersheds, and it is difficult to find control watersheds in urbanized areas. Model simulation methods can be divided into conceptual model simulation [22] and distributed (semi-distributed) physical model simulation [23,24,25] from the perspective of model selection. Conceptual models are generally used in large watersheds where it is difficult to find control catchments, but often there is no clear relationship between their parameters and land use characteristics. Therefore, the variation of the model parameters caused by LULC change have great uncertainty [26]. The distributed (semi-distributed) physical model is capable of describing the various components of the hydrological process, and it is considered to be the most rational way to investigate the hydrological response to LULC change [27]. The distributed (semi-distributed) physical model is generally simulated by a grid unit [19] or the watershed division method [11]. Compared with the sub-watershed division method, grid unit simulation can output more detailed spatial information.
Scenario simulation is a common method of using a model to study the hydrological responses of LULC changes. According to the difference of hypothesis, it can be divided into the artificial hypothesis scenario [28], the historical scenario [12,24], and the future scenario [19,29]. Although the artificial hypothesis can reflect the influence of LULC changes on hydrological characteristics, its assumptions are often inconsistent with the actual development of the basin, and the future scenarios are more biased towards prediction. The historical scenarios can better reflect the real impacts of the basin, but they need a large amount of historical data support. Hydrologic responses to LULC changes were studied at the various spatial scales from plot [30], small watershed [14,24], medium watershed [19], and large watershed [12]. As the scale of the study area increases, the landscape distribution pattern of the basin and the meteorological factors will cause more spatial differences. Therefore, for large basins, the spatial analysis results will be more conducive to water resource management and decision-making process [10,18].
The Taihu Lake Basin (TLB) is one of the most well-developed regions in China. The population of the basin accounts for about 3% of the country’s total, and the gross domestic product (GDP) accounts for about 12%of the total GDP. With the development of the economy, the natural ecological environment of the TLB has been greatly damaged, resulting in frequent flood events in the basin. In the past 30 years, large-scale flood events (in 1991, 1999 and 2016) have occurred in the TLB. Local flood events are more frequent, and some studies have indicated that the frequency and risk of future floods in the TLB will increase further [31,32]. Therefore, clarifying the impact of LULC change on hydrological processes in the TLB will help with water resource management in the basin, thereby reducing the risk of flooding. Existing research in the TLB shows that the conversion of other types of land to construction land will cause the largest change in the runoff coefficient, and afforestation will help to reduce flood disasters [28]. Runoff and peak flow change are most significant in sub-basin areas near the urban center [7,33]. The urbanization process has led to an overall increase in the water level of the river network in the basin, and the increase rate is consistent with the urbanization rate, and the water level rise is more obvious in areas with high degrees of urbanization [34]. Since about 80% of the TLB is plain area with dense river networks, and it is subject to complex artificial regulation and control, it is difficult to validate the streamflow in the whole basin. At present, there are a few studies focusing on the hydrological responses to LULC changes in the entire TLB. In existing research works, some of them calibrate and validate the model parameters through the monitoring results of flood years [32,35], while others directly apply the calibrated and validated parameters of the Xitiaoxi small watershed to other parts of the TLB [31]. Therefore, in order to improve the reliability of the model as much as possible, we combine the above two methods when calibrating and validating the model parameters. On the other hand, in the study of the hydrological response of LULC change in the TLB, only a few studies have analyzed the spatial differences of runoff or water yield [35,36], and the scale is limited to large-scale hydrological zoning. It is also not directly related to administrative zoning, which limits further construction of the link between LULC change, hydrological response, and regional development (e.g., GDP, population, urban area, etc.).
Our research objective was to assess the change of water yield and its spatial distribution in rapidly urbanized areas at different scales, analyze the internal causes of frequent local floods and urban waterlogging in the TLB, and to establish a link between land use change, hydrological response, and regional development. In order to achieve this goal, we used the Spatial Tools for River basin Environmental Analysis and Management (STREAM) model (version 2.0, Institute for Environmental Studies Vrije Universiteit De Boelelaan, Amsterdam, the Netherlands) to simulate the water yield under different land use conditions in the TLB in 1985, 1995, 2000, 2005, and 2010. In order to eliminate the influence of meteorological factors as far as possible, the average water yields of different weather scenarios in all land use conditions were calculated to evaluate the LULC change effect on water yield. The average water yields were counted at the hydrological sub-region scale and the township scale in ArcGIS (version 10.1, Esri China Information Technology Co. Ltd., Beijing, China) and used to study the relationship between water yield distribution and regional development. Finally, we explored the relationship between urban development and urban waterlogging through the spatial distribution difference of water production, and analyzed the causes of frequent local floods in the TLB.
2. Materials and Methods
2.1. The Study Area
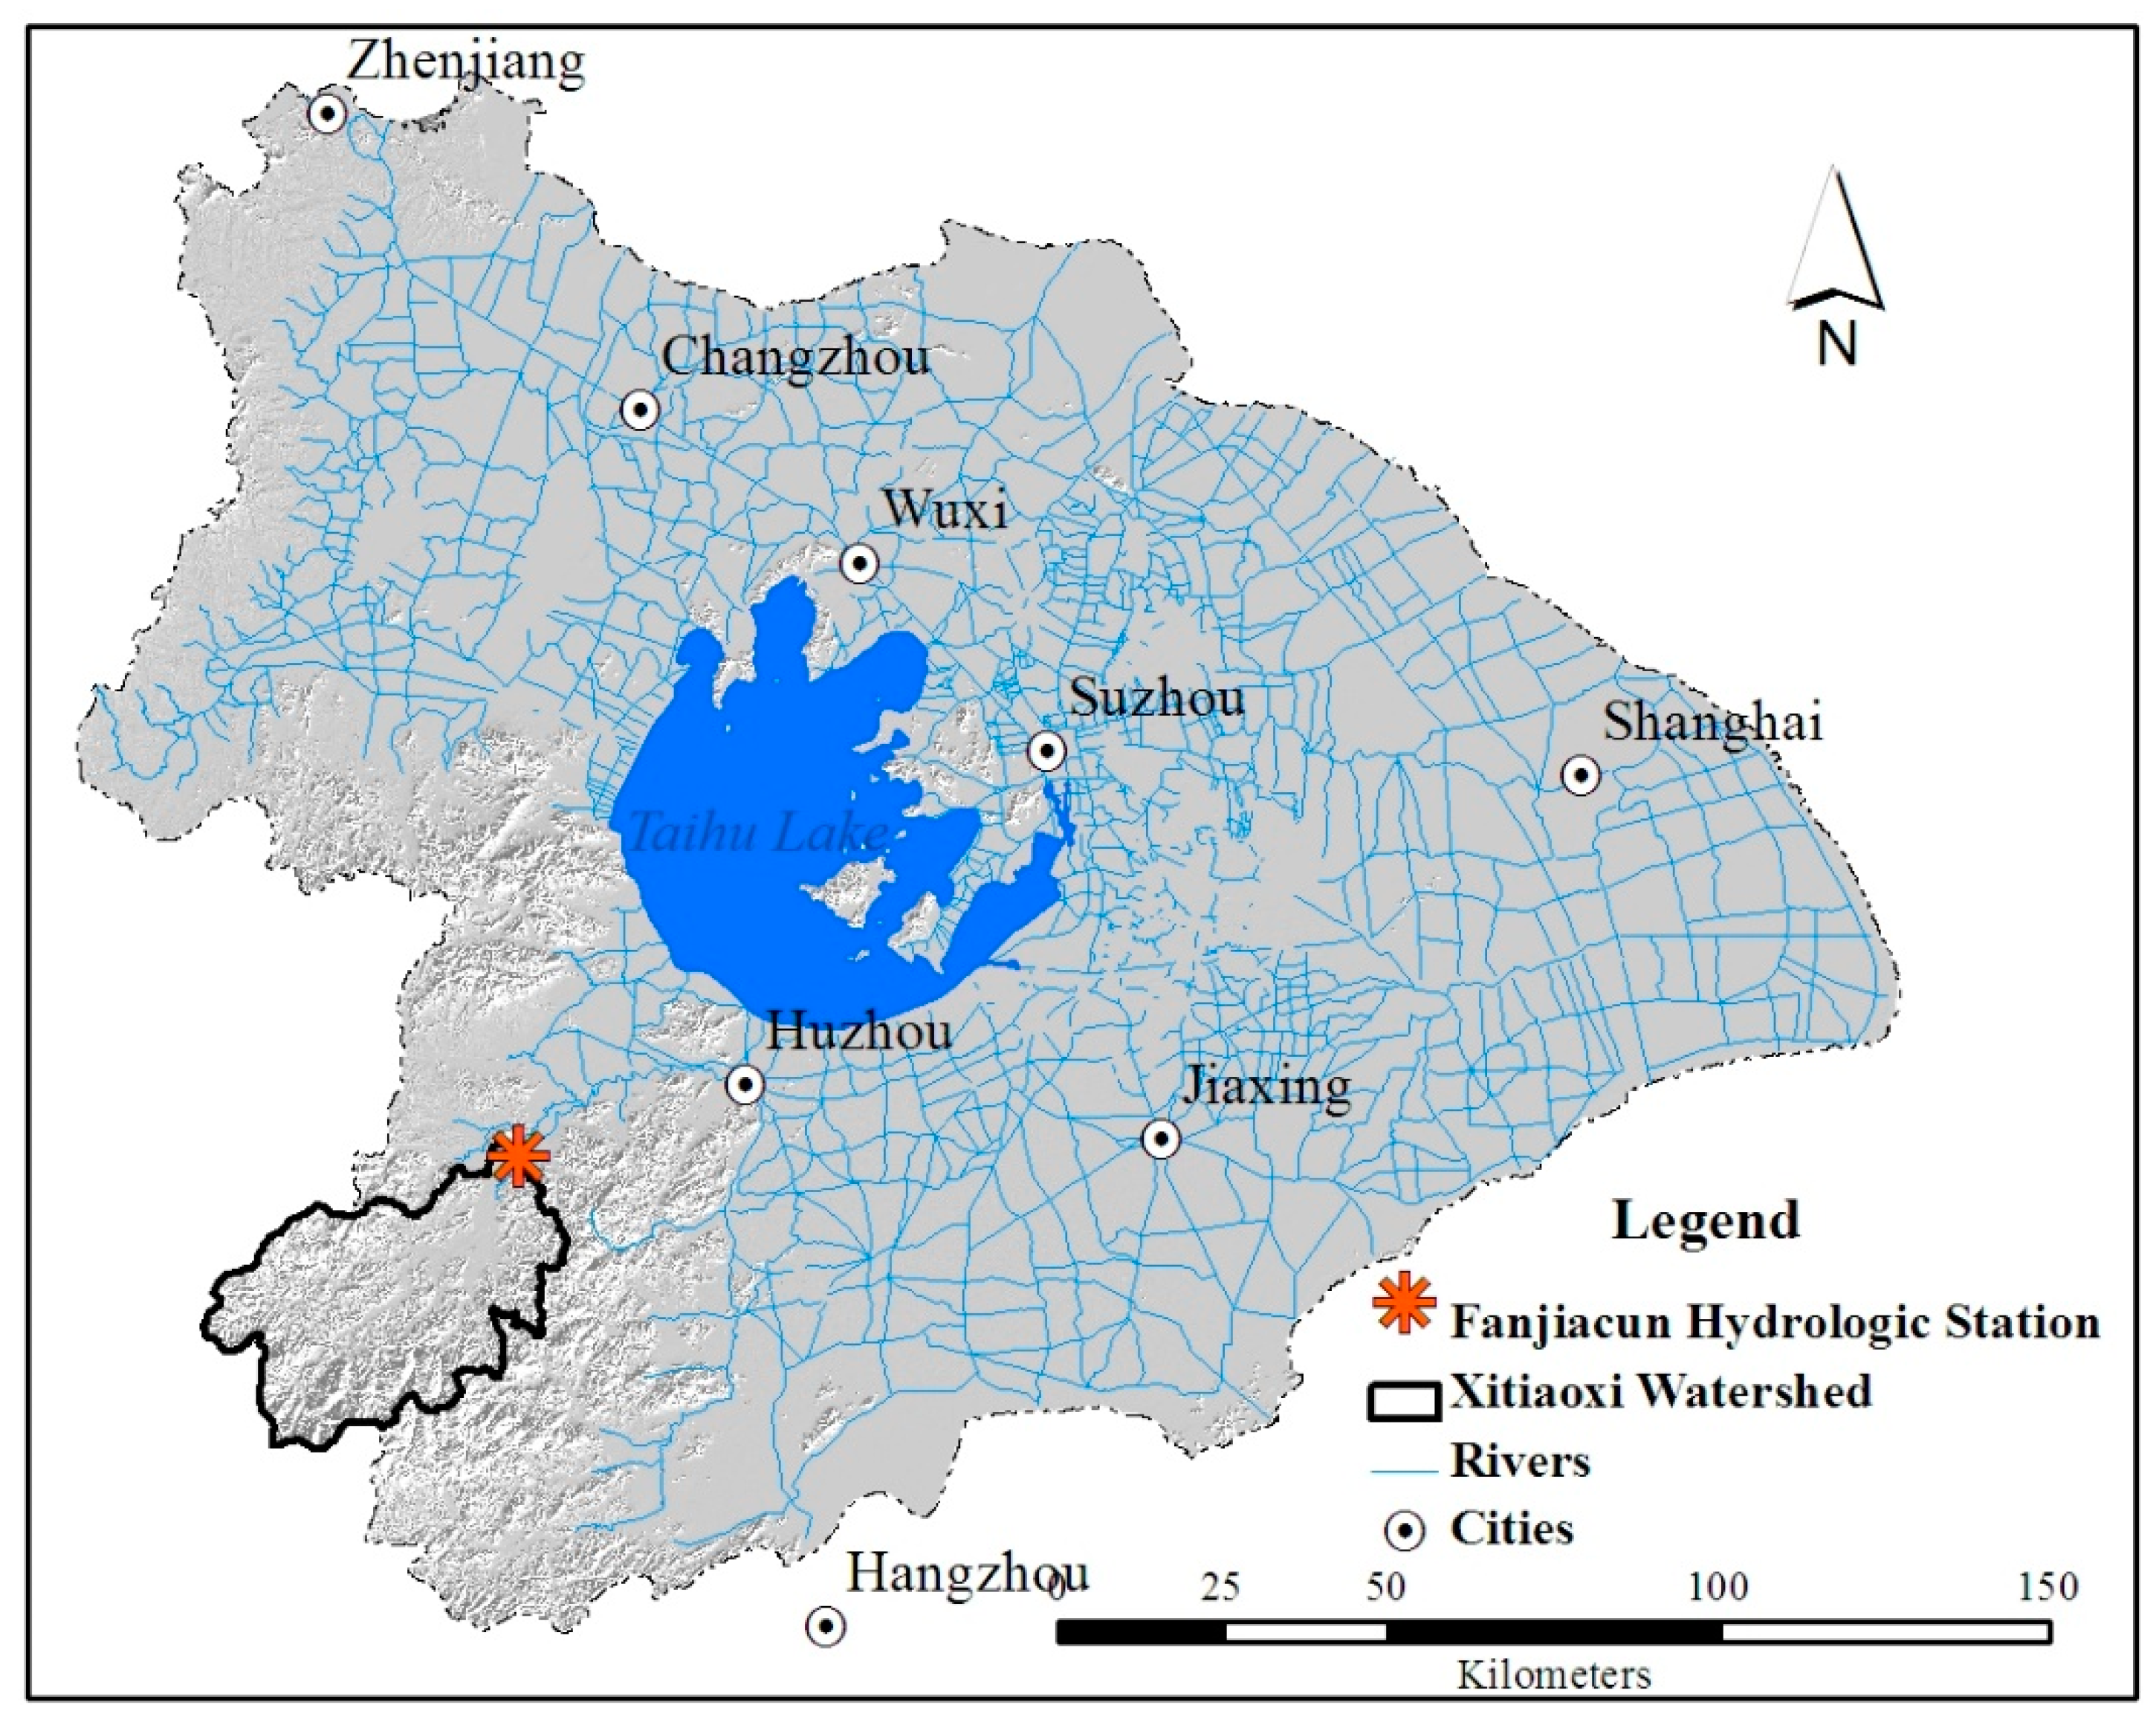
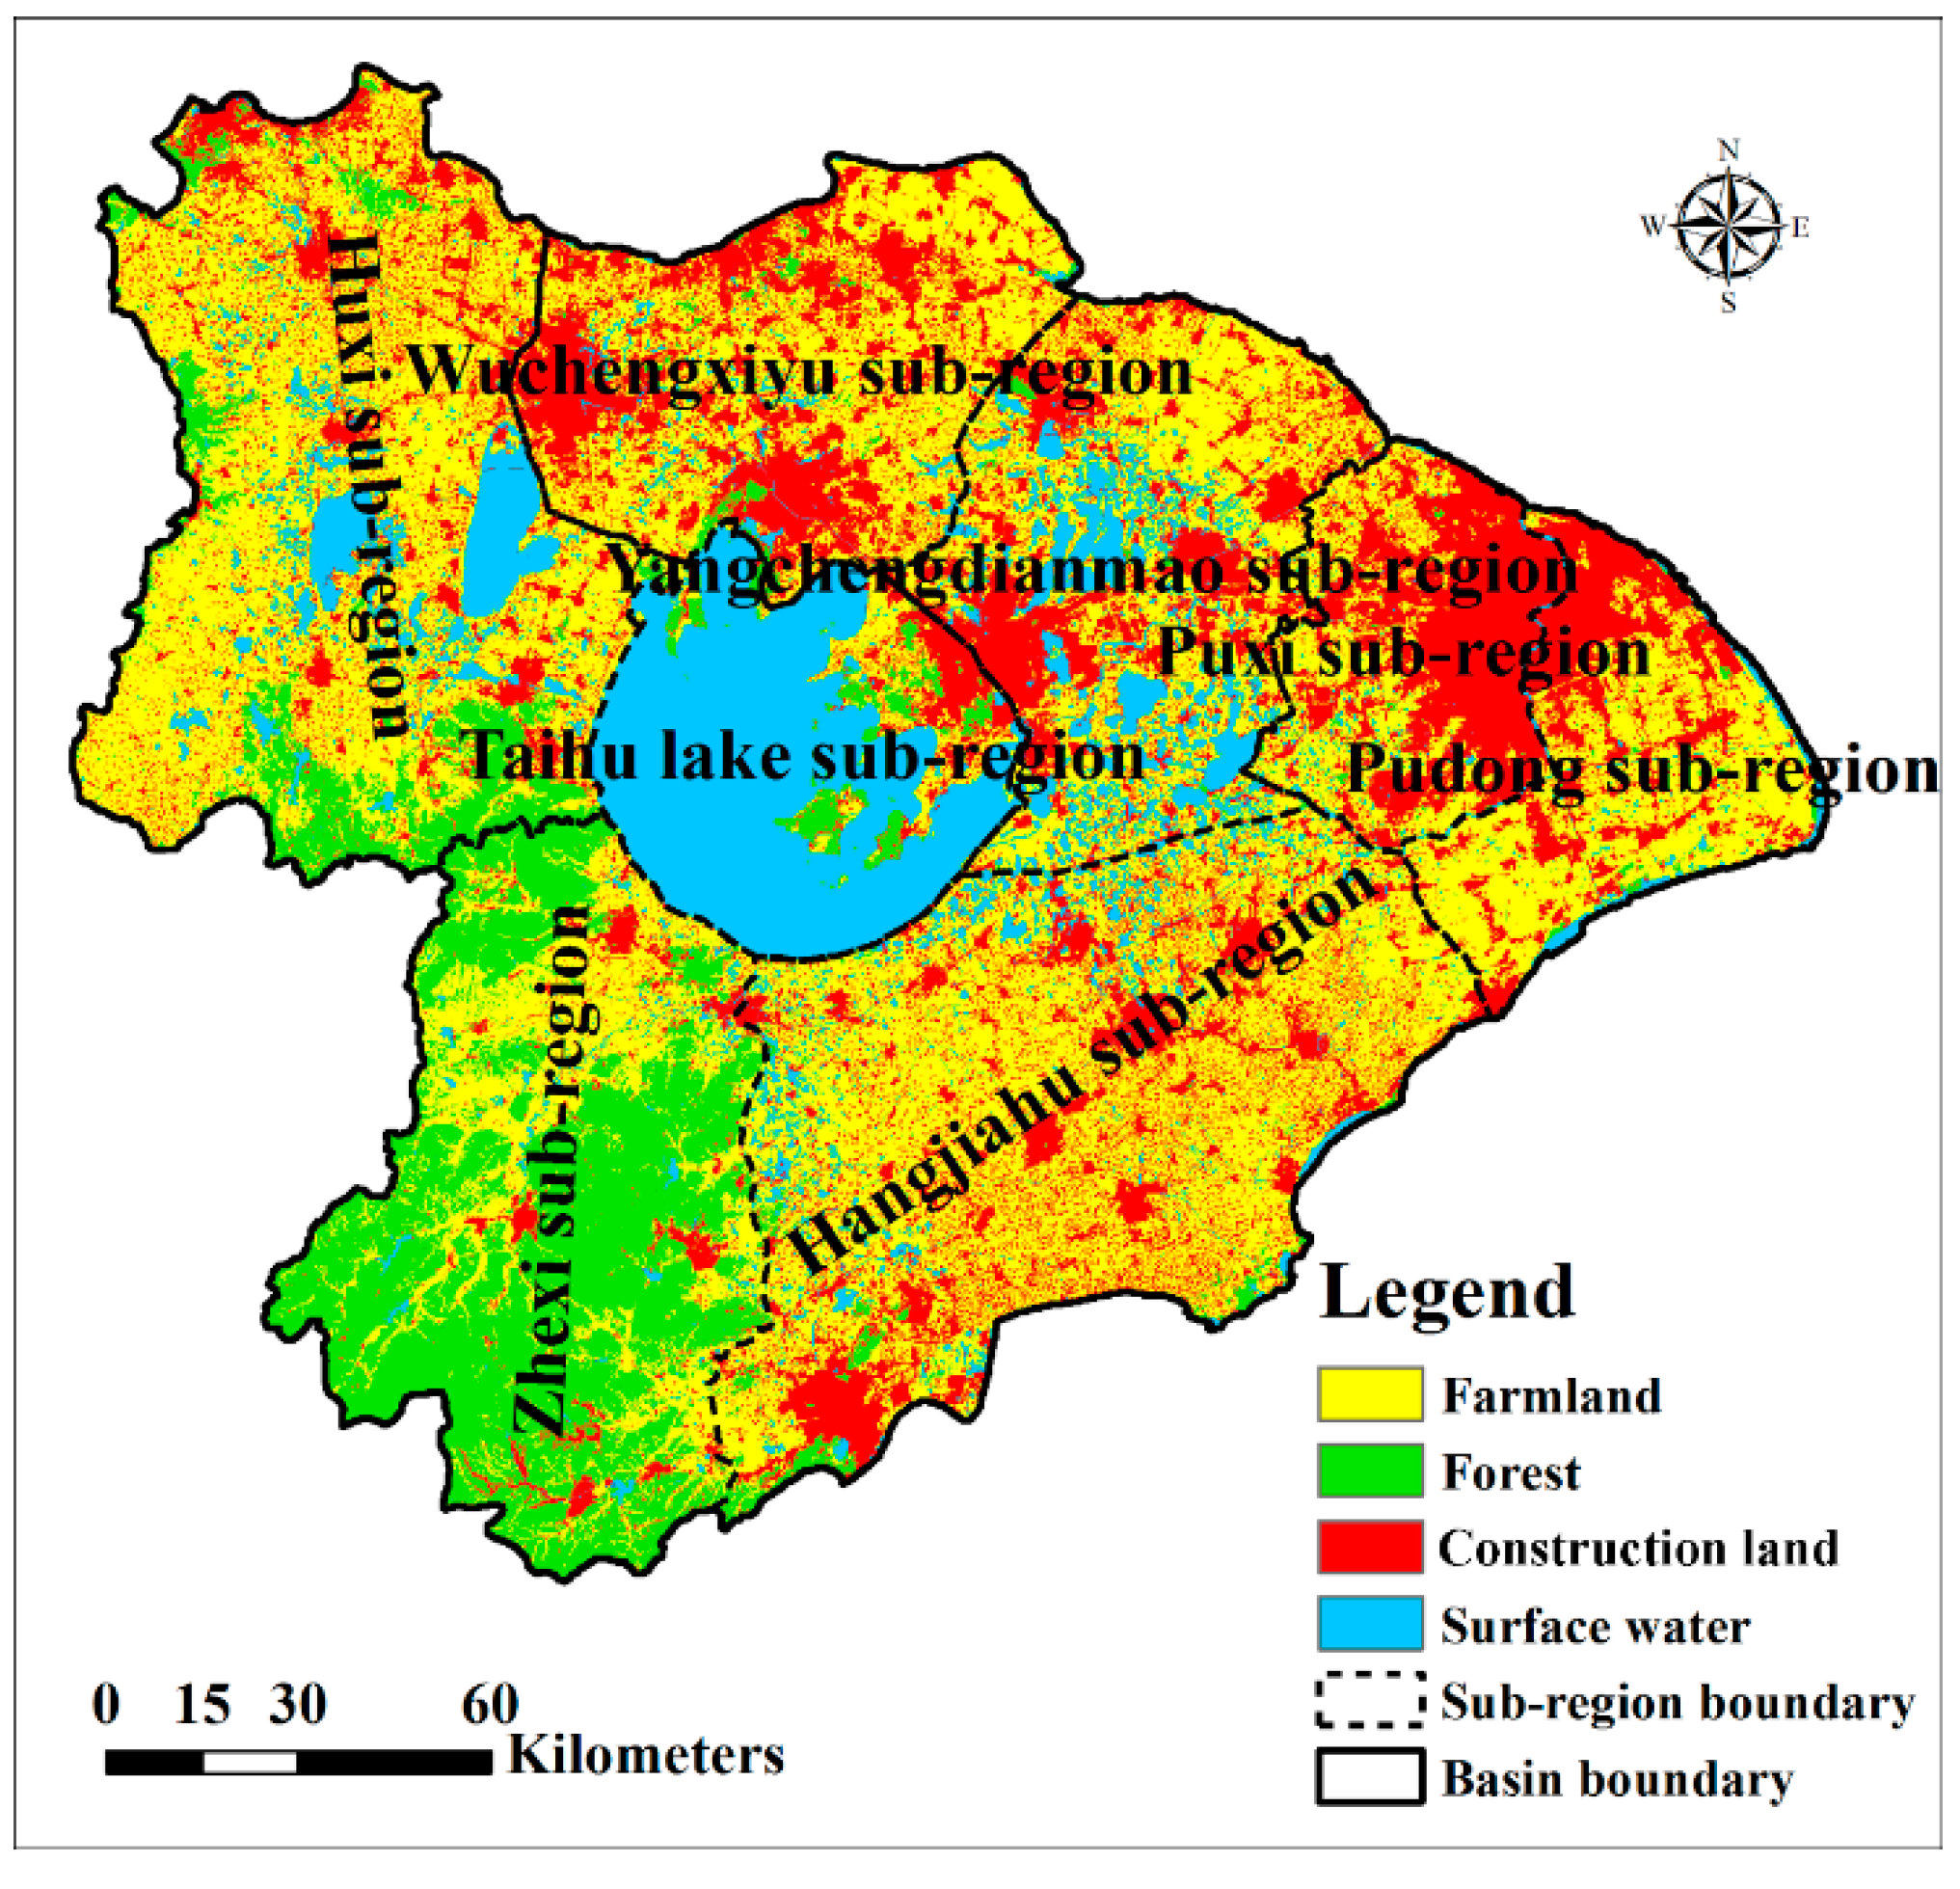
Taihu Lake Basin lies in the southern part of the Yangtze Delta, which is located at 30°28′–32°15′ N, 119°11′–121°53′ E. It faces Yangtze River on the north, reaches Hangzhou Bay on the south, neighbors the East China Sea on the east, and is bounded on the west by the Tianmu Mountain Range and the Maoshan Mountain Range. The basin (Figure 1) covers 36 895 km2, accounting for 0.4% of China’s territory. Seven large and medium cities, including Shanghai, Hangzhou, Suzhou, Wuxi, Changzhou, Jiaxing, and Huzhou, and 31 counties, are distributed in the basin, with a population of 36 million, accounting for 3% of China’s entire population. It is one of the most developed areas in China, and its GDP occupies about 12% of the total GDP of China.
The study area is composed of the mountain region in the west, and plain land in the central and east. The elevations in the basin range from 2 m to 1587 m above sea level. The mountain land and plain land is about 25% and 75%, respectively, of the total basin area. Taihu Lake is located in the middle of the basin, with a water surface area of 2238 km2, and an average depth of 2 m. The plains surrounding Taihu Lake, which extend to the Yangtze River, as well as to the sea, are covered by a dense network of natural and man-made waterways, with a total length of more than 12,000 km. The inflow to the Taihu Lake is mainly from the Tiaoxi river system and the Nanxi river system. The Grand Canal also has a small volume of water interflow with the Taihu Lake. A total of 70% of the lake flow discharge is through the Taipu River to the Huangpu River, and then into the Yangtze River, and 20% is through the Wangyu Rivers to the Yangtze River. The remaining 10% of lake flow discharge is to the south into Hangzhou Bay.
The basin belongs to the subtropical monsoon region, with warm humid summers and cold dry winters. The rainy season is from April to September. The annual average rainfall is about 1010–1400 mm, and high rainfall occurs in the southwest of the basin. The dominant soil types are clay loam (51.00%) and loam (27.27%). The clay loam soil is distributed in the plain land with paddy fields and loam soil in the higher terrains with forest land. The basin has undergone rapid urbanization and extensive cultivation, due to its long history of development. Urban areas cover about 24.24% (in 2010). Cultivated lands occupy about 47.90% of the total basin area. Forest land and grassland are mainly distributed in river valleys and high terrain areas.
2.2. The STREAM Model
STREAM is a raster-based hydrological rainfall–runoff model. Originally, the water balance model was developed for the Rhine Basin, and is called RHINEFLOW. This model runs in MS-DOS mode, and uses a GIS-based programming language called PC-Raster [37]. The STREAM has been developed for a Windows environment, and has been extended to a river basin management instrument. The idea of developing the STREAM was to simulate the hydrology of large river basins in a simplified way with minimum data requirements, which at the same time is sufficient to gain insight into the major processes of the hydrological cycle. The model requires monthly precipitation, monthly temperature, digital elevation model (DEM, 90 m, Lakes Basin Data Integration and Simulation Center, Institute of Geography and Lakes, Chinese Academy of Sciences, Nanjing, China), soil (water holding capacity), and land cover as inputs (Figure 2). The water flow direction is determined by the DEM. The model enables the analysis of the impacts of climate and land use changes on the hydrological characteristics of a river basin, and many studies have used the STREAM model to simulate hydrological components successfully [38,39,40,41]. STREAM enables rapid assessment of water balance, and can be used to estimate the long-term hydrological impacts of land use change, climate change, river basin management, population pressure, economic development, and so on. Another advantage of this model is that the Blaise script language used is very clear, and therefore is easy to be changed by the user to meet special objectives.
The hydrological approach that is used in STREAM is based on the water balance. The potential and actual evapotranspiration is calculated using the Thornthwaite & Mather equation [37], which uses temperature and precipitation as the major input parameters. The land use map is used as a base map to prepare the crop factor, which plays an important role in determining the actual evapotranspiration. When precipitation is higher than the potential evapotranspiration, the soil will remain full of water, and actual evapotranspiration will be equal to potential evapotranspiration. However, in conditions where the precipitation drops to below potential evapotranspiration, the soil begins to dry out, and actual evapotranspiration is now less than the potential. Actual evapotranspiration is calculated using the moisture-related method with antecedent soil water content and water holding capacity. The water that enters the grid cell can be stored in deep groundwater (deep storage) or shallow storage. The output of water occurs through flow discharge and evapotranspiration (from shallow storage). The model runs on a monthly basis, generating direct runoff, delayed runoff, groundwater storage (shallow and deep), snow water equivalents, and snow melt. STREAM describes the water balance at location (x, y) in month (t) by:
where R = runoff (mm/month); P = precipitation (mm/month); S = water volume stored in the soil, snow and groundwater (mm/month); AE = water loss due to actual evapotranspiration (mm/month); dS = change in water volume stored (mm/month); SS = water stored in the soil and as shallow groundwater (mm/month); GWS = the water stored in aquifers and as deeper groundwater (mm/month); SNS = the amount of water stored in the snow cover.
R(x, y, t) = P(x, y, t) + AE(x, y, t) + dS(x, y, t)
S(x, y, t) = SS(x, y, t) + GWS(x, y, t) + SNS(x, y,t)
2.3. Data Collection and Preparation
The spatial input data necessary for running STREAM includes a land use map, a soil type map, monthly precipitation maps, monthly temperature maps, and DEM. As STREAM is a cell-based model, all of the input data should be raster maps, in the same format, and having the same geo-reference and spatial resolution. In this study, the Albers Conical Equal Area Projection was applied, and spatial resolution was established at 250 m. A DEM with a 25 × 25m grid size for the basin was acquired from the National Geomatics Center of China. A DEM for the model was then constructed by resampling to a lower resolution map at a pixel resolution of 250 × 250 m. The flow direction map and slope map were calculated by IDRISI software (version 16.1, Clark University, Wooster, MA, USA), which is an integrated GIS and image processing software solution developed by Clark Labs, providing over 250 modules for the analysis and display of digital spatial information. Information on the soil types was obtained from a digital 1:500,000 soil map of the local Bureaus of Agriculture, and converted to 12 USDA (United States Department of Agriculture) soil texture classes based on textural properties. According to the STREAM model manual, water holding capacity can be determined by soil textural properties. The land use information at a 1:10,000 scale was obtained from the Data Center for Resources & Environmental Sciences, Chinese Academy of Sciences (RESDC, CAS) derived from Landsat TM/ETM+ remote sensing image (30m, National Aeronautics and Space Administration, https://www.nasa.gov/) in 1985, 1995, 2000, 2005, and 2010. The land cover was classified as four classes, including farmland, forest, build-up, and surface water. The crop factor could be determined by land use type according to the STREAM model manual.
Monthly mean temperature and precipitation data of 13 meteorological stations from 1979 to 2011, which were distributed in and around the total basin, were acquired in this study. The station data had to be interpolated into grids with a 250 × 250 m grid size by the inverse distance-weighted interpolation (IDW) method, and 120 precipitation and temperature raster maps from 2002 to 2011 were acquired. Due to the flat terrains and complex river network, most of the river system is not independent, and it exchanges water with Taihu Lake and other river systems in the TLB by man-made water courses. Most of the gauge stations are affected by the return flow of Taihu Lake and hydrologic engineering facilities. In this study, the Xitiaoxi Watershed, with its independent natural river system, which lies in the southwest of Taihu Lake Basin and is the largest watershed in the up-river area of Taihu Lake, was selected for model calibration and verification. The monthly flow discharge data of the Fanjiachun gauge station, located downstream of the Xitiaoxi river system, were obtained from Huzhou Bureaus of Water Resource.
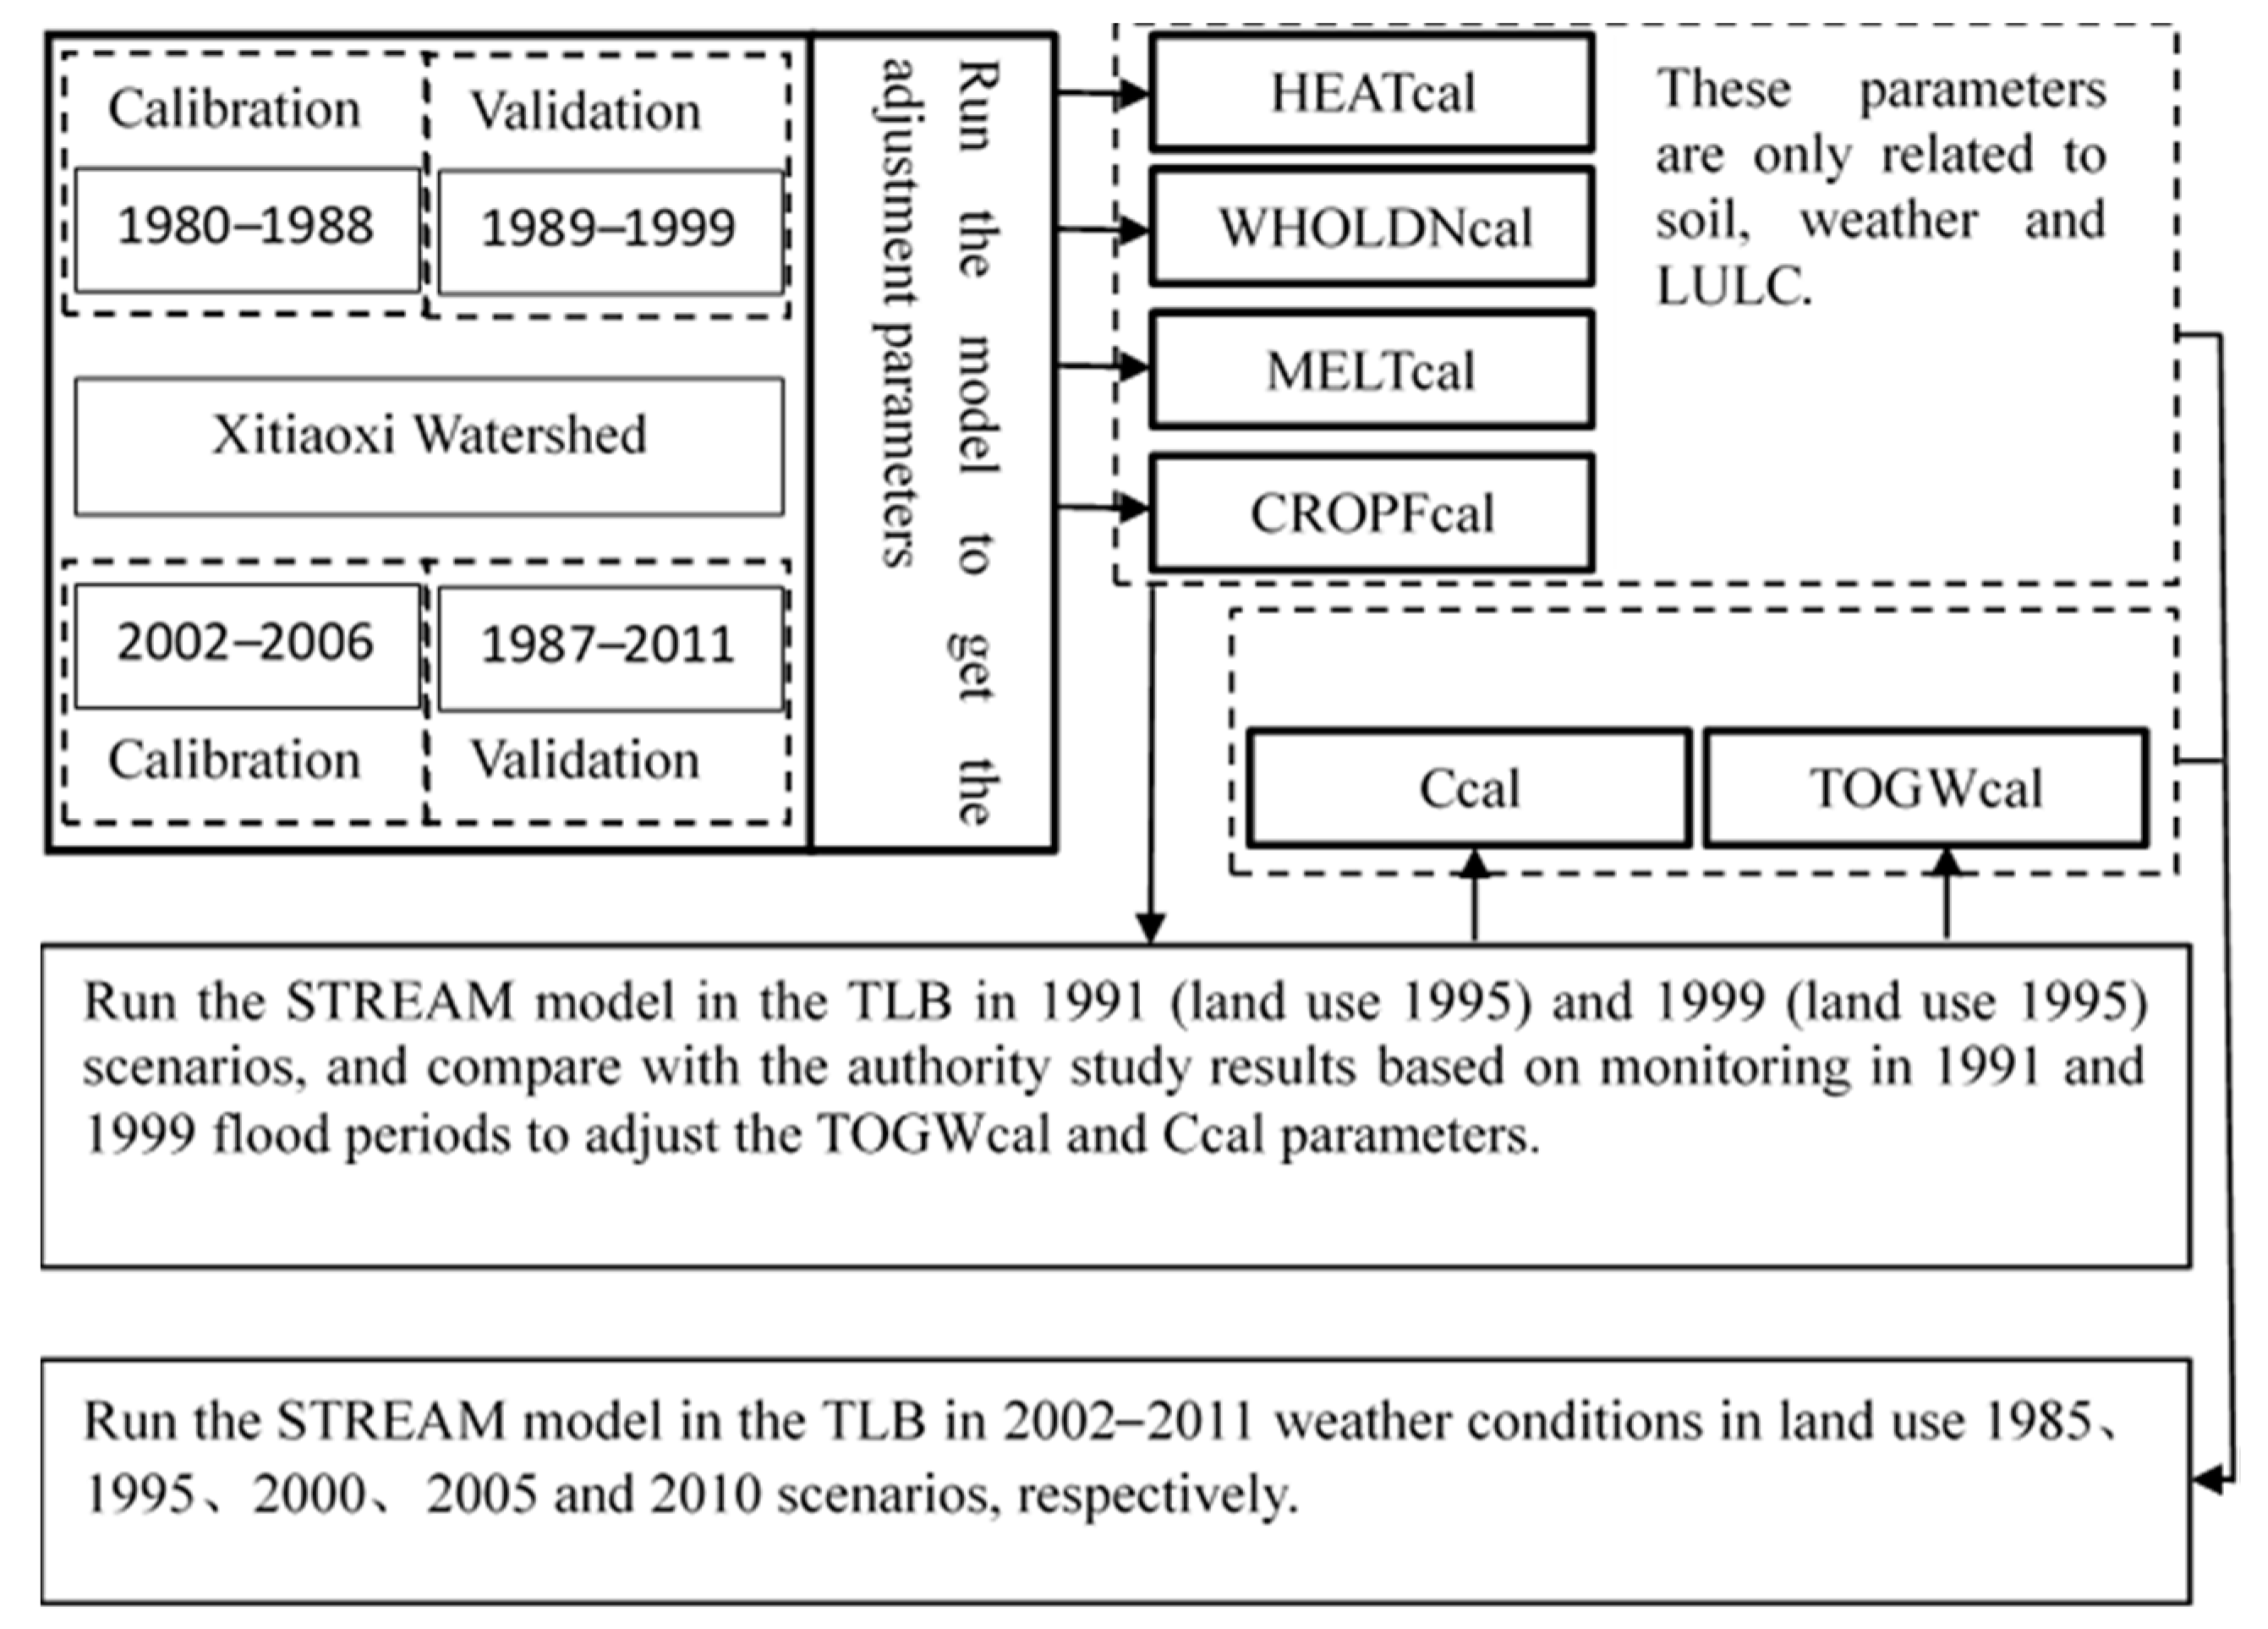
The STREAM model was calibrated and validated on the basis of observation data over the stages 1980–1999 and 2002–2011 in Xitiaoxi watershed (Figure 3). The calibrated parameters included CROPFcal, HEATcal, WHOLDNcal, Ccal and TOGWcal (Table 1). The initial parameters were adjusted automatically to reflect more realistic values using the monthly input data. The flow discharge dataset was split into two time slices in each phase. The first phase was divided into two periods: 1980–1988 and 1989–1999, and the second phase was divided into two periods, 2002–2006 and 2007–2010. The first period was used to calibrate the model, and the second period was used to validate the model. These parameters were then used to simulate the flow discharge of the entire TLB in 1991 (land use 1995) and 1999 (land use 2000), and the parameters of Ccal and TOGWcal were further adjusted by comparing the flow discharge of the TLB with the measured value in the flood periods of 1991 and 1999.
The model performance was evaluated using two objective functions, namely: the coefficient of determination (R2) and the percent bias (PBIAS). The two parameters were calculated as follows:
where is the observed variable, is the mean of the observed variable, is the simulated variable, is the mean of the simulated variable, n is the number of observations.
2.4. Moran’s I
Moran’s I is widely used in the study of spatial distribution patterns, where the global Moran’s I is used to evaluate the spatial correlation and the degree of difference, which is generally between −1 and 1. The Moran’s I is greater than zero, indicating that variables are clustered in space; on the contrary, the Moran’s I is smaller than zero, indicating that variables are discrete in space; the Moran’s I equals zero, indicating that variables are randomly distributed in space. The formula is as follows:
In the formula, sat and are the values of the statistic and the mean of the statistic, respectively, Wij is the spatial weight of factor i and factor j, and n are the sum of factors.
The local indicators of spatial association (LISA) was used to make up for the local instability of the global spatial autocorrelation, and to analyze the contribution of regional units to the global space self-correlation. The formula is as follows:
In the formula, sat and are the values of the statistic and the mean of n locations, respectively, and Wij is the weighted value of the weight matrix at position (i, j).
In our study, based on the calculated results of the average water yields under the 2002–2011 meteorological scenarios, we calculated the Moran’s I (MI) and LISA of the growth rate of water yields in towns by using the GeoDa software (http://www.csiss.org/); empirical Bayesian adjustment was used to consider the variance instability of the ratio. The weighting factors were calculated by the Euclidean distances of towns.
3. Results
3.1. Model Calibration and Validation
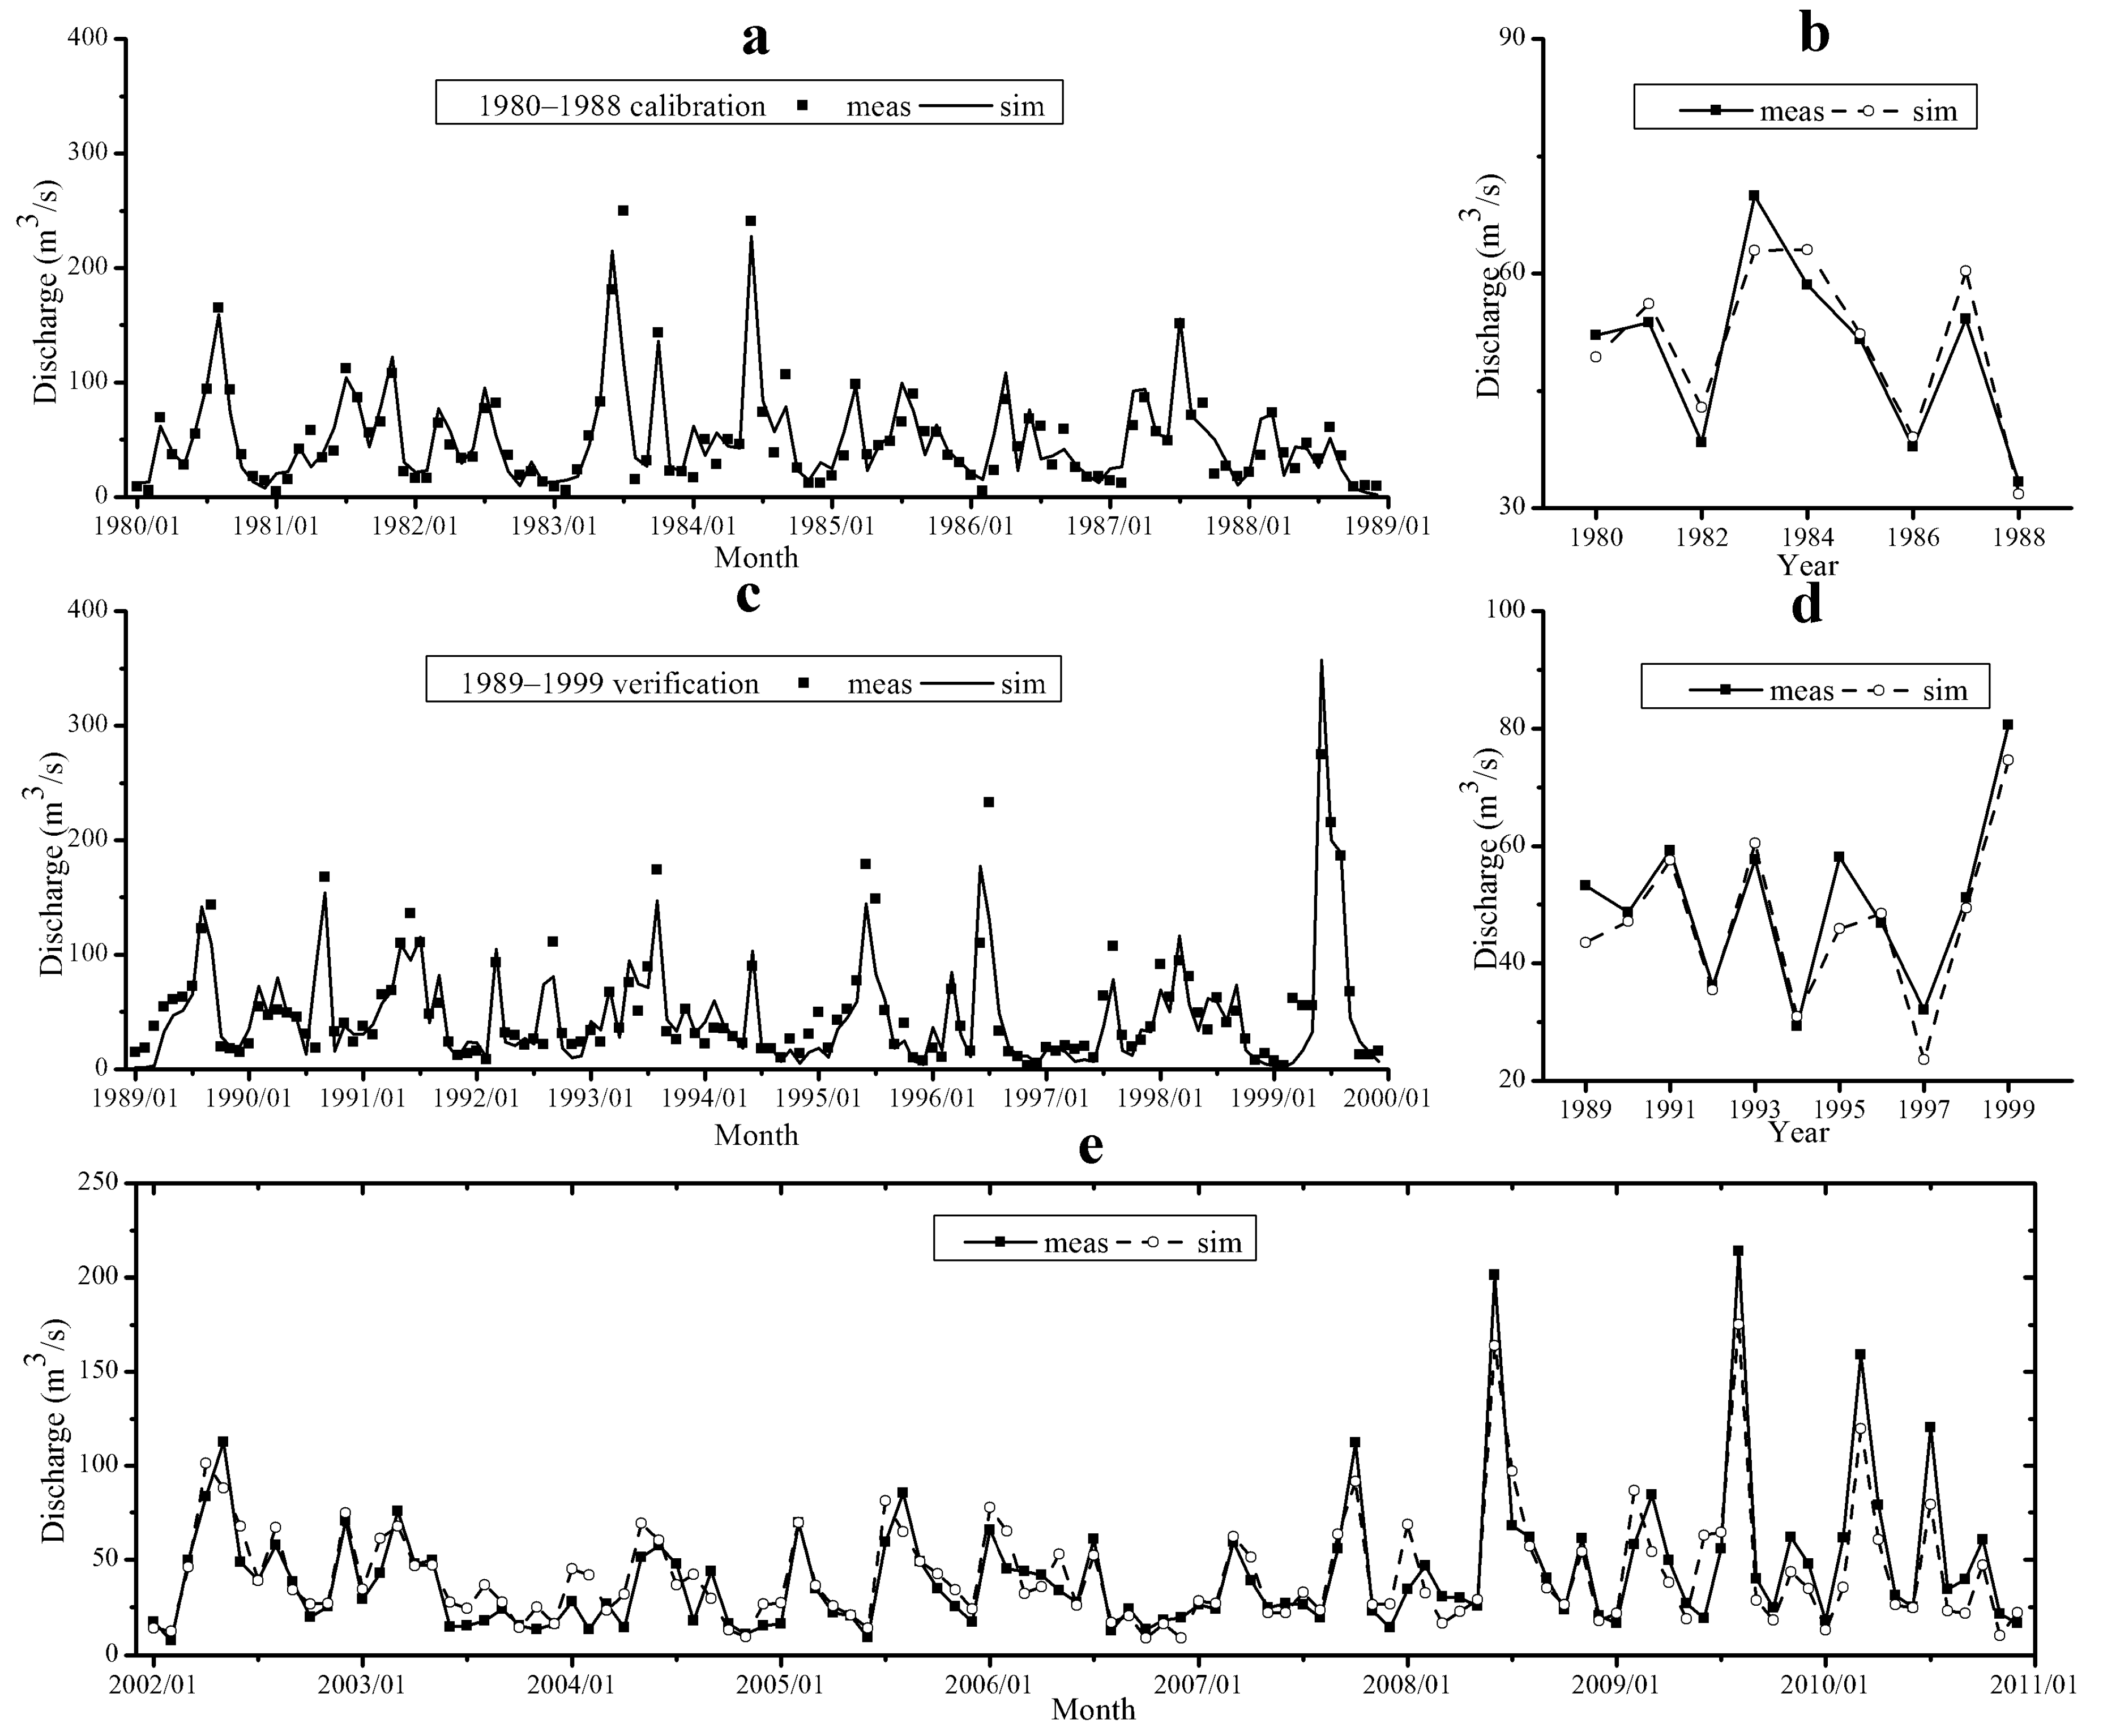
As shown in Figure 4, the two-stage simulation (sim) results were highly consistent with the measured (meas) monthly flow discharge of the Fanjiacun hydrological station. In the first stage, the determination coefficients of the calibration period and the verification period were 0.78 and 0.75 respectively, and the average annual errors during the calibration period and the verification period were about 6% and 9.5%. In the second stage, the determination coefficients of the calibration period and the verification period were 0.77 and 0.75 respectively, and annual error of the entire stage was about 5%. Finally, the modeled results were compared with the study results of the TLB Authority, based on runoff monitoring of the whole basin in the rainy season in 1991 and 1999 [36,42]. The relative mean error was about 0.19 for 1991, and 0.16 for 1999. These results proved that the model can consider the runoff-generating process in a distributed manner based on topography, precipitation, land use, and soil type, and it gave quite an accurate simulation for assessing the hydrologic impacts of land use changes.
3.2. LULC Change
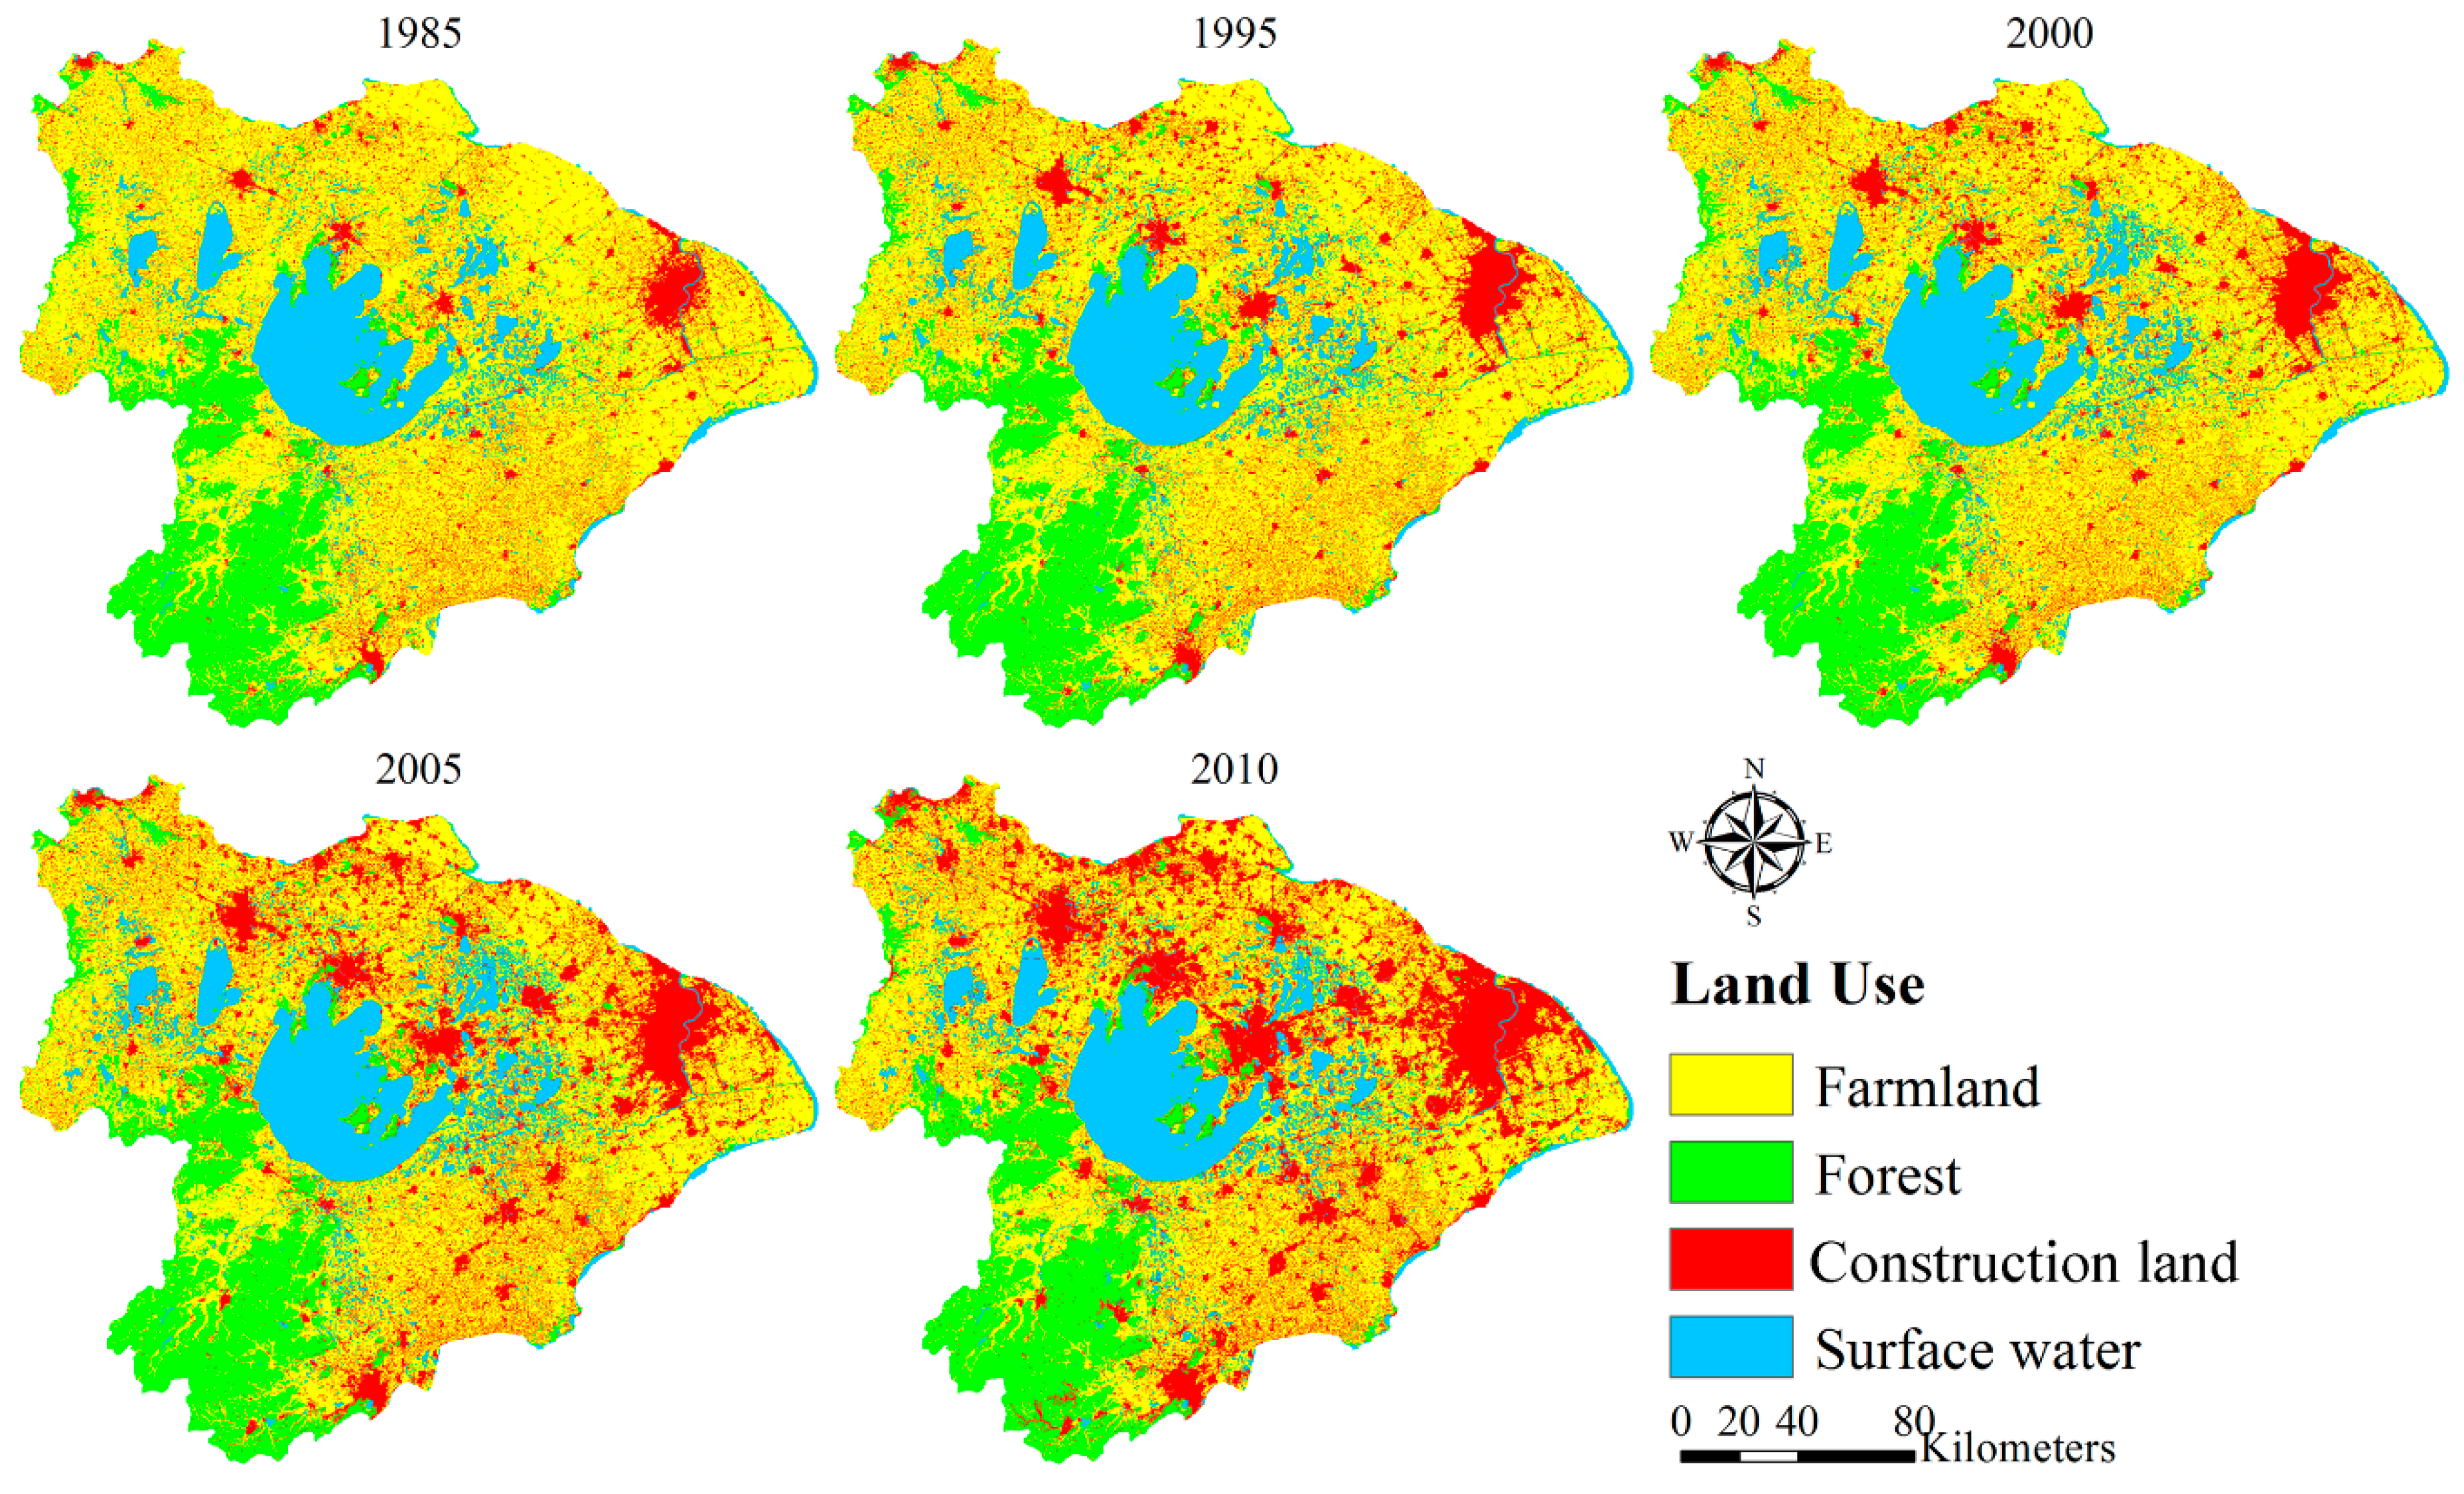
During the study period, LULC changes in TLB are shown in Table 2, which were mainly manifested as the continuous decrease of farmland area, and the continuous increase of construction land area. In 1985, construction land area only accounted for 9.68% in the TLB, and by 2010, the proportion has increased to 24.24%; meanwhile, the proportion of farmland area dropped from 63.65% to 47.90%. The increase in construction land area was mainly due to the rapid expansion of cities and towns, which occupied the surrounding farmland (Figure 5). Among them, the expansion of construction land area was divided into two stages: during 1985–2000, the expansion of construction land was relatively smoothly, only increasing by 3.73% in 15 years. During 2000–2010, the river basin entered a rapid development period, and the construction land area increased by 10.83%. From the perspective of spatial distribution, the areas with the most dramatic increase in construction land area were mainly located in the northern part of the basin. This was mainly due to the rapid development of Shanghai, Suzhou, Wuxi, and Changzhou in the northern part of the river basin.
3.3. Water Yield Response to Land Use Change
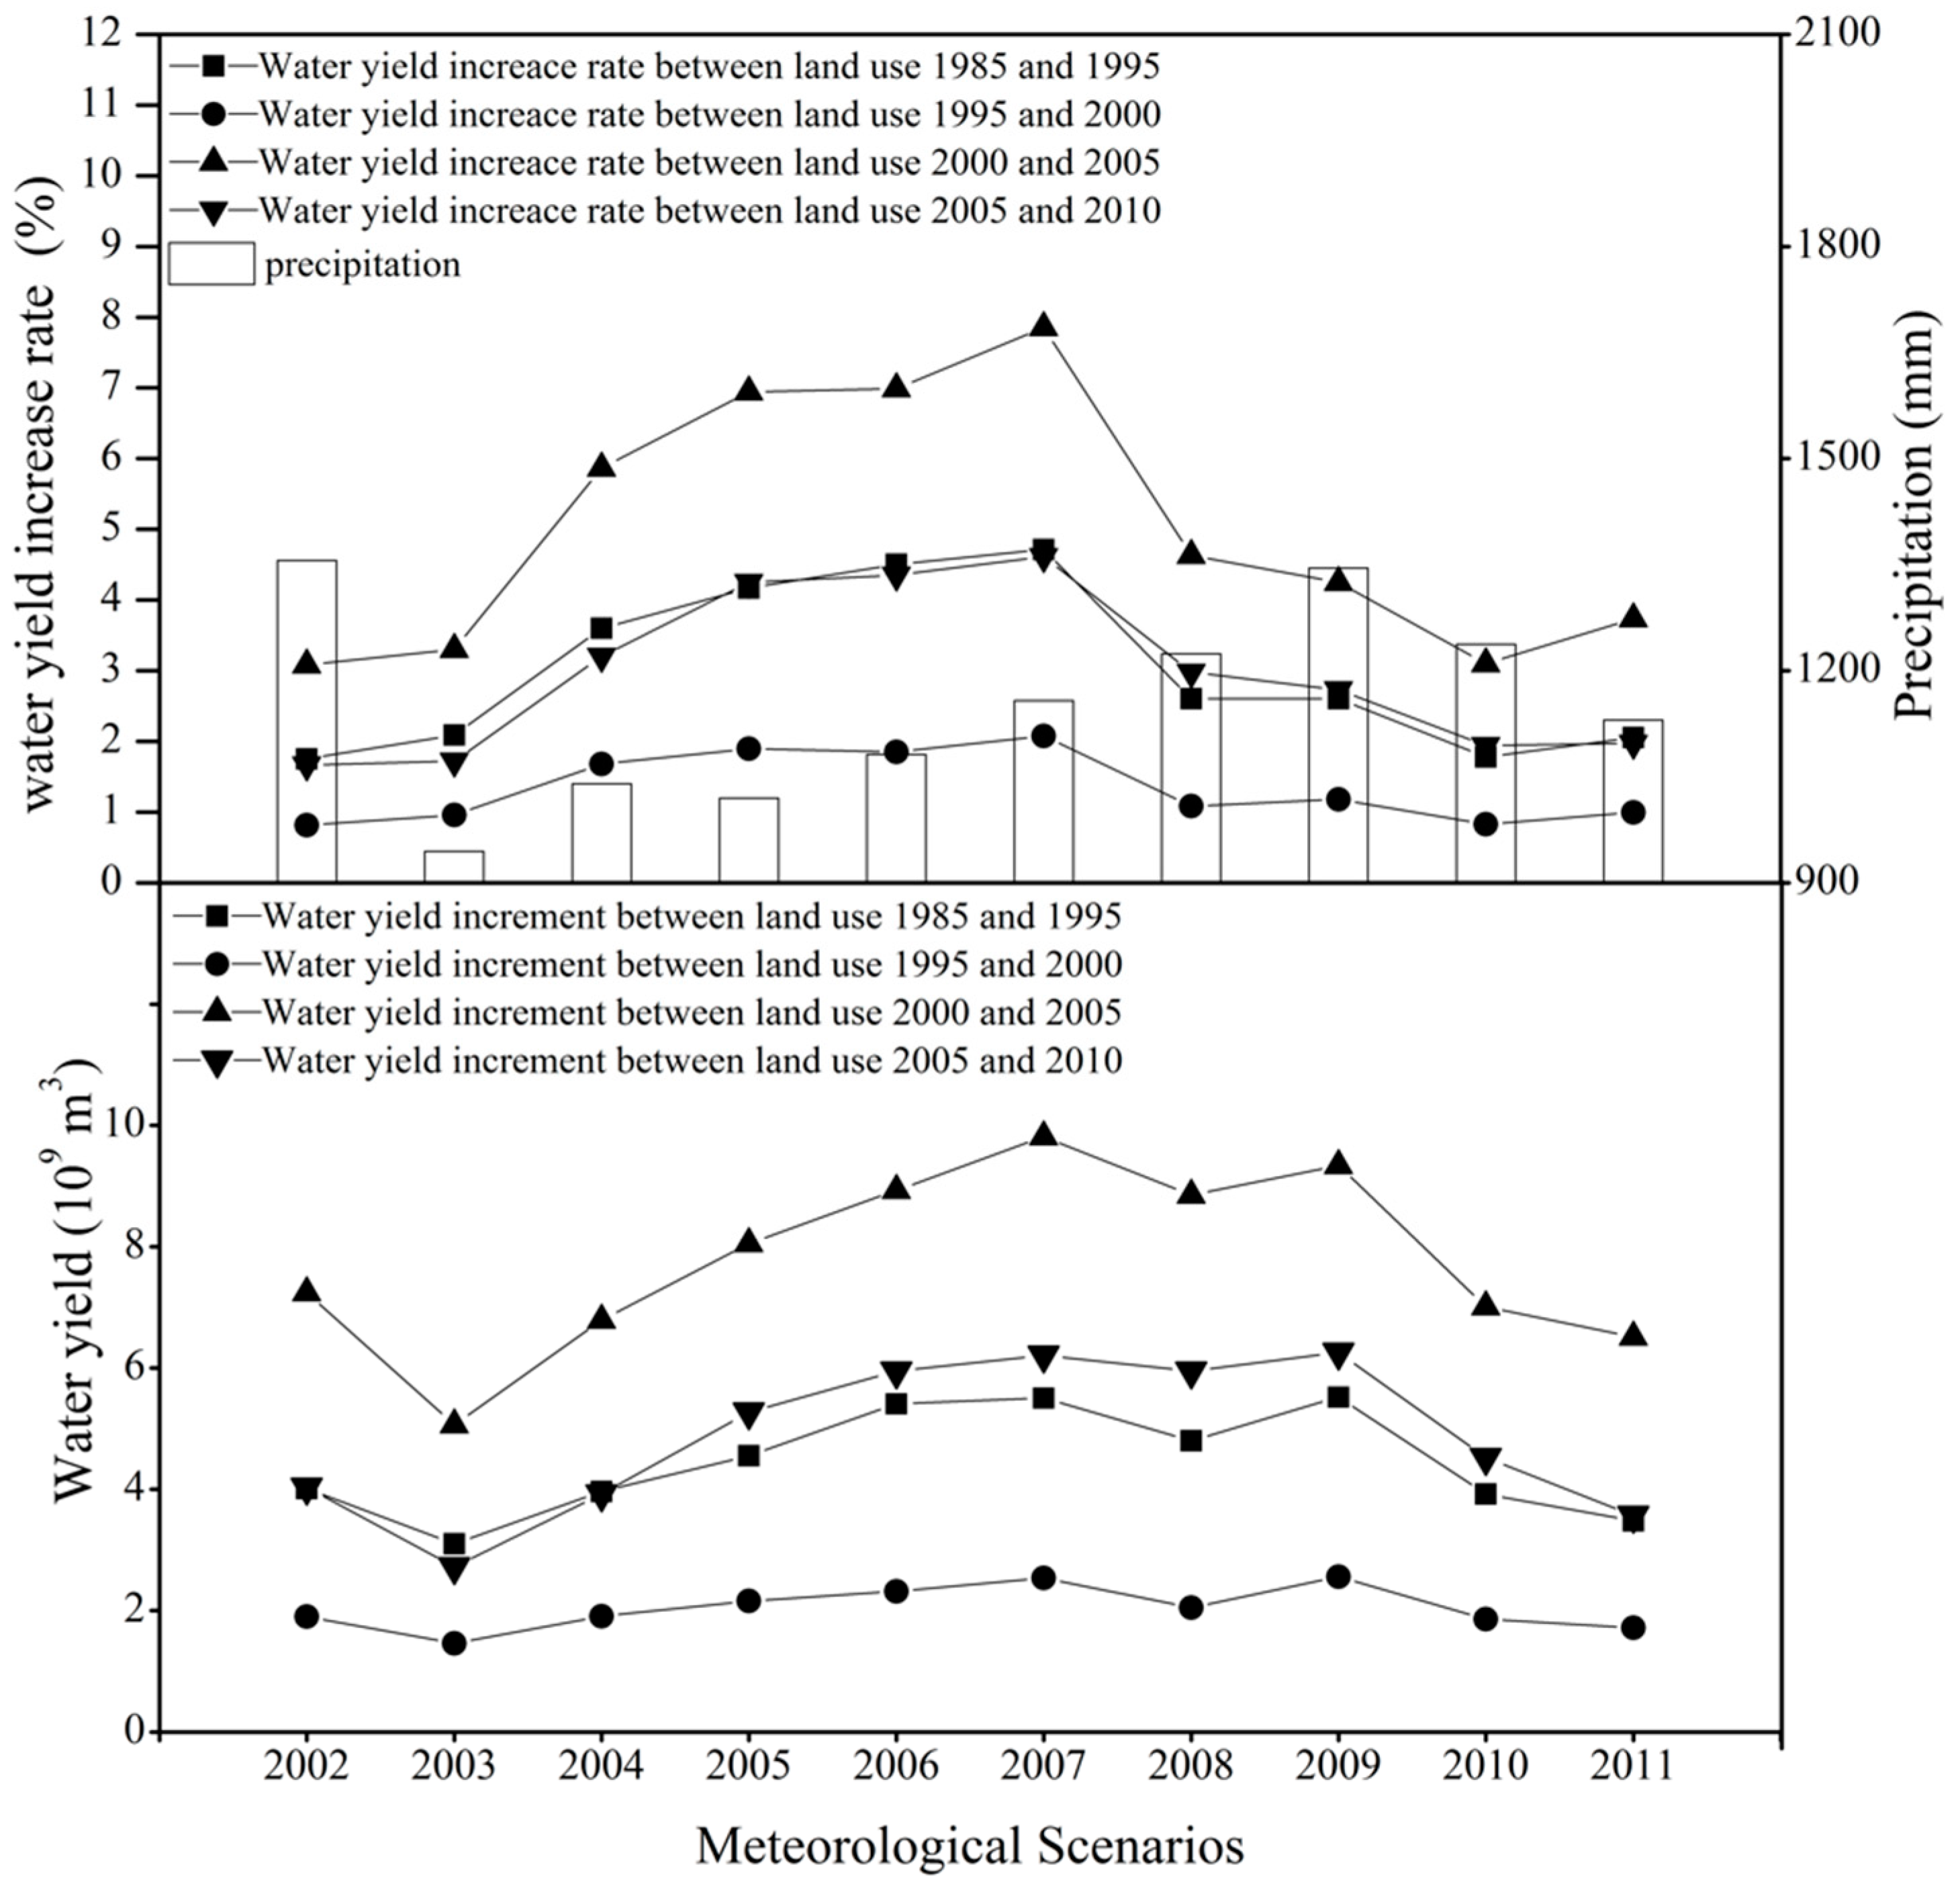
Climate input was an important factor that affected the water yield in the TLB. In order to eliminate the possible impact of precipitation and air temperature difference, water yields were simulated by 2002–2011 climate scenarios and LULC changes, and their mean value was used to evaluate the effects of LULC changes on the water yields. As shown in Figure 6, from 1985 to 1995, the annual water yield increased by an average of 2.99%, about 442 million cubic meters, with a maximum growth rate of 4.71% and about 550 million cubic meters; the correlation coefficient between precipitation and water yield increment was 0.35. In 1995–2000, the annual water yield increased by an average of 1.34%, about 205 million cubic meters, with a maximum growth rate of 2.07 percent, about 254 million cubic meters; and the correlation coefficient was 0.38 between the precipitation and the water yield increment. In 2000–2005, the annual water yield increased by 4.97% on average, about 776 million cubic meters, with a maximum growth rate of 7.86%, about 981 million cubic meters, and the correlation coefficient between precipitation and water yield increment was 0.43. From 2005 to 2010, the annual water yield increased by an average of 2.94%, about 484 million cubic meters, with a maximum growth rate of 4.61%, about 621 million cubic meters, and the correlation coefficient was 0.39 between the precipitation and the water yield growth. According to the change characteristics of the annual water yield from 1985 to 2010, the annual increase of water yield was much higher in 2000–2010 than in 1985–2000, when land use change was more severe. Obviously, the LULC change was an important reason for the increase of runoff. On the other hand, there was no strong linear correlation between runoff increment and precipitation, which may be related to the spatial distribution difference of climate input.
The change of LULC not only changed the total water volume of the river basin, but also affected the water yield’s composition. Among them, the most significant changes were the contribution rate of cultivated land and construction land to the total water yield. As shown in the simulation results displayed in Table 3, in the 1985 land use scenario, the contribution rate of the cultivated land water yield was 47.20%, while in the 2010 land use scenario, the contribution rate of the cultivated land water yield was reduced to 35.20%. At the same time, the contribution rate of the construction land water yield increased from 10.50% to 25.82%.
3.4. Spatial Variation Difference of Water Yield
3.4.1. Water Yield Changes in Hydrological Subregions
The change of land use was not uniform in space. In order to detect the difference of the water yield change caused by this spatial inhomogeneity, the water yield increase rate and increment in the water conservancy subareas (Figure 7) of the TLB, along with the land use changes, were statistically evaluated, respectively. These subareas were divided by the TLB Authority according to hydrologic engineering and water resource management. The results showed that there was a significant gap in the growth of water yield in different sub-regions (Table 4). The increase rates of water yield in the Puxi and Wuchengxiyu sub-regions were higher than the average in the whole basin at all research stages. In the Yangchengdianmao sub-region, the growth rates were only lower than the basin average in the 2005–2010 stage. Since 2000, the water yield growth rates of the Hangjiahu sub-region became higher than that of the basin average level. The water yield increase in the Pudong sub-region mainly occurred in the 2005–2010 stage. The increase rates of water yield were relatively lower in the Huxi and Zhexi sub-regions upstream of the TLB. In particular, the water yield growth rate of the Zhexi sub-region in every stage was far lower than the average value of the TLB.
The difference of development speed led to the difference of water production in different sub-regions. In further analysis, regression analysis was used to analyze the growth of water yield and the increment of construction land from 1985 to 2010. As shown in Figure 8, there was a significant linear relationship between the growth of water yield and the increment of construction land, which indicated that for every increase of 1 km2 construction land in the TLB, the water yield increased by 362,073 m3.
3.4.2. Water Yield Changes in the Town Scale
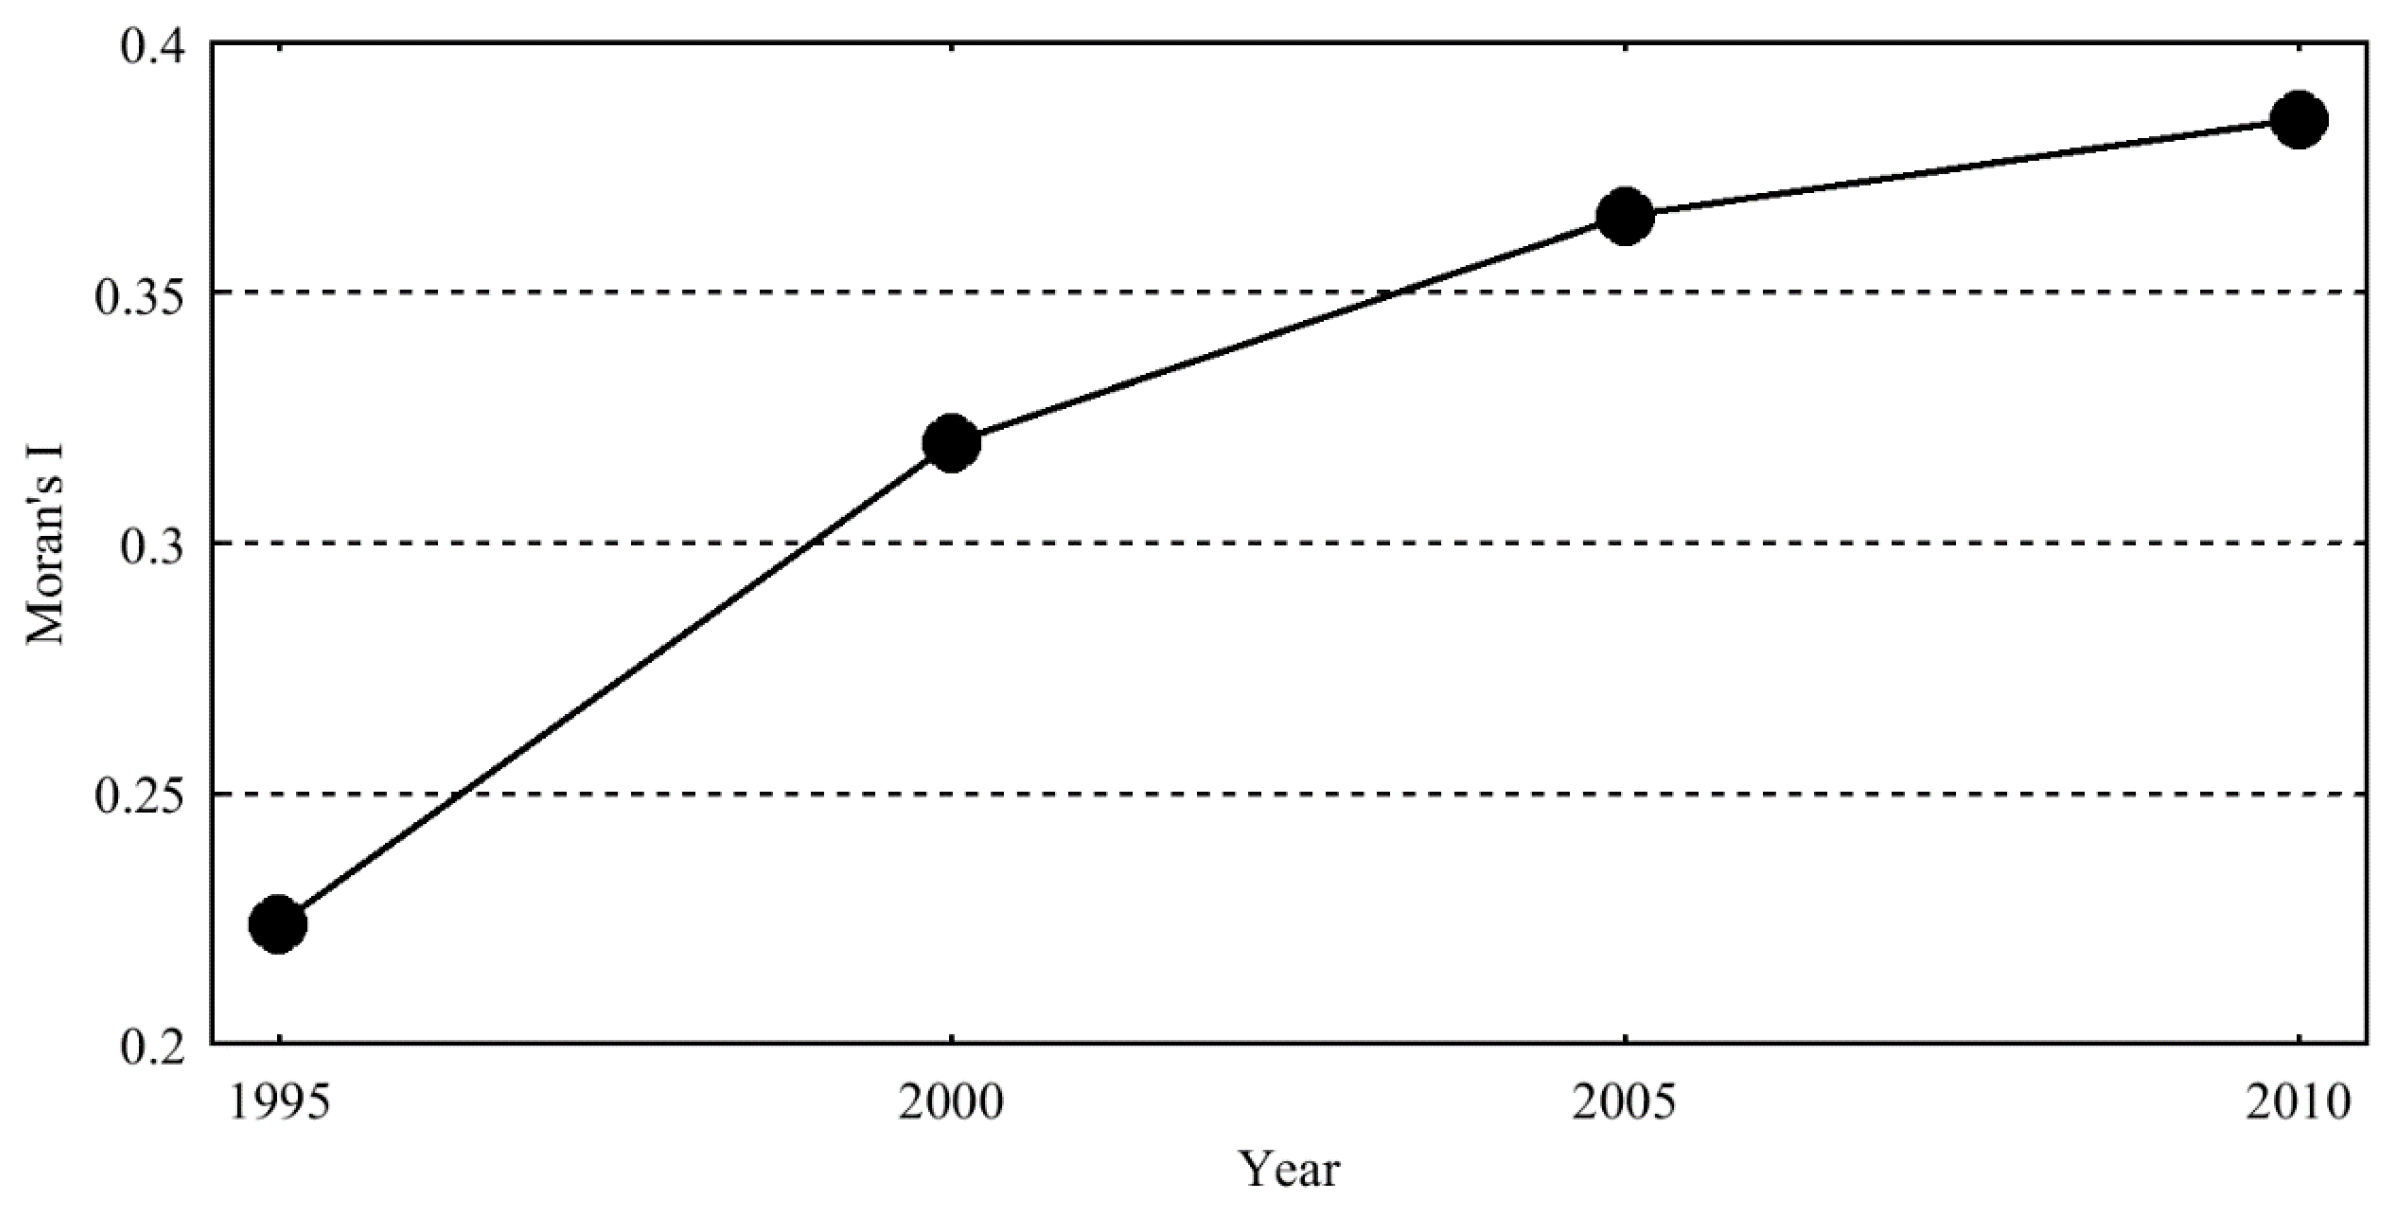
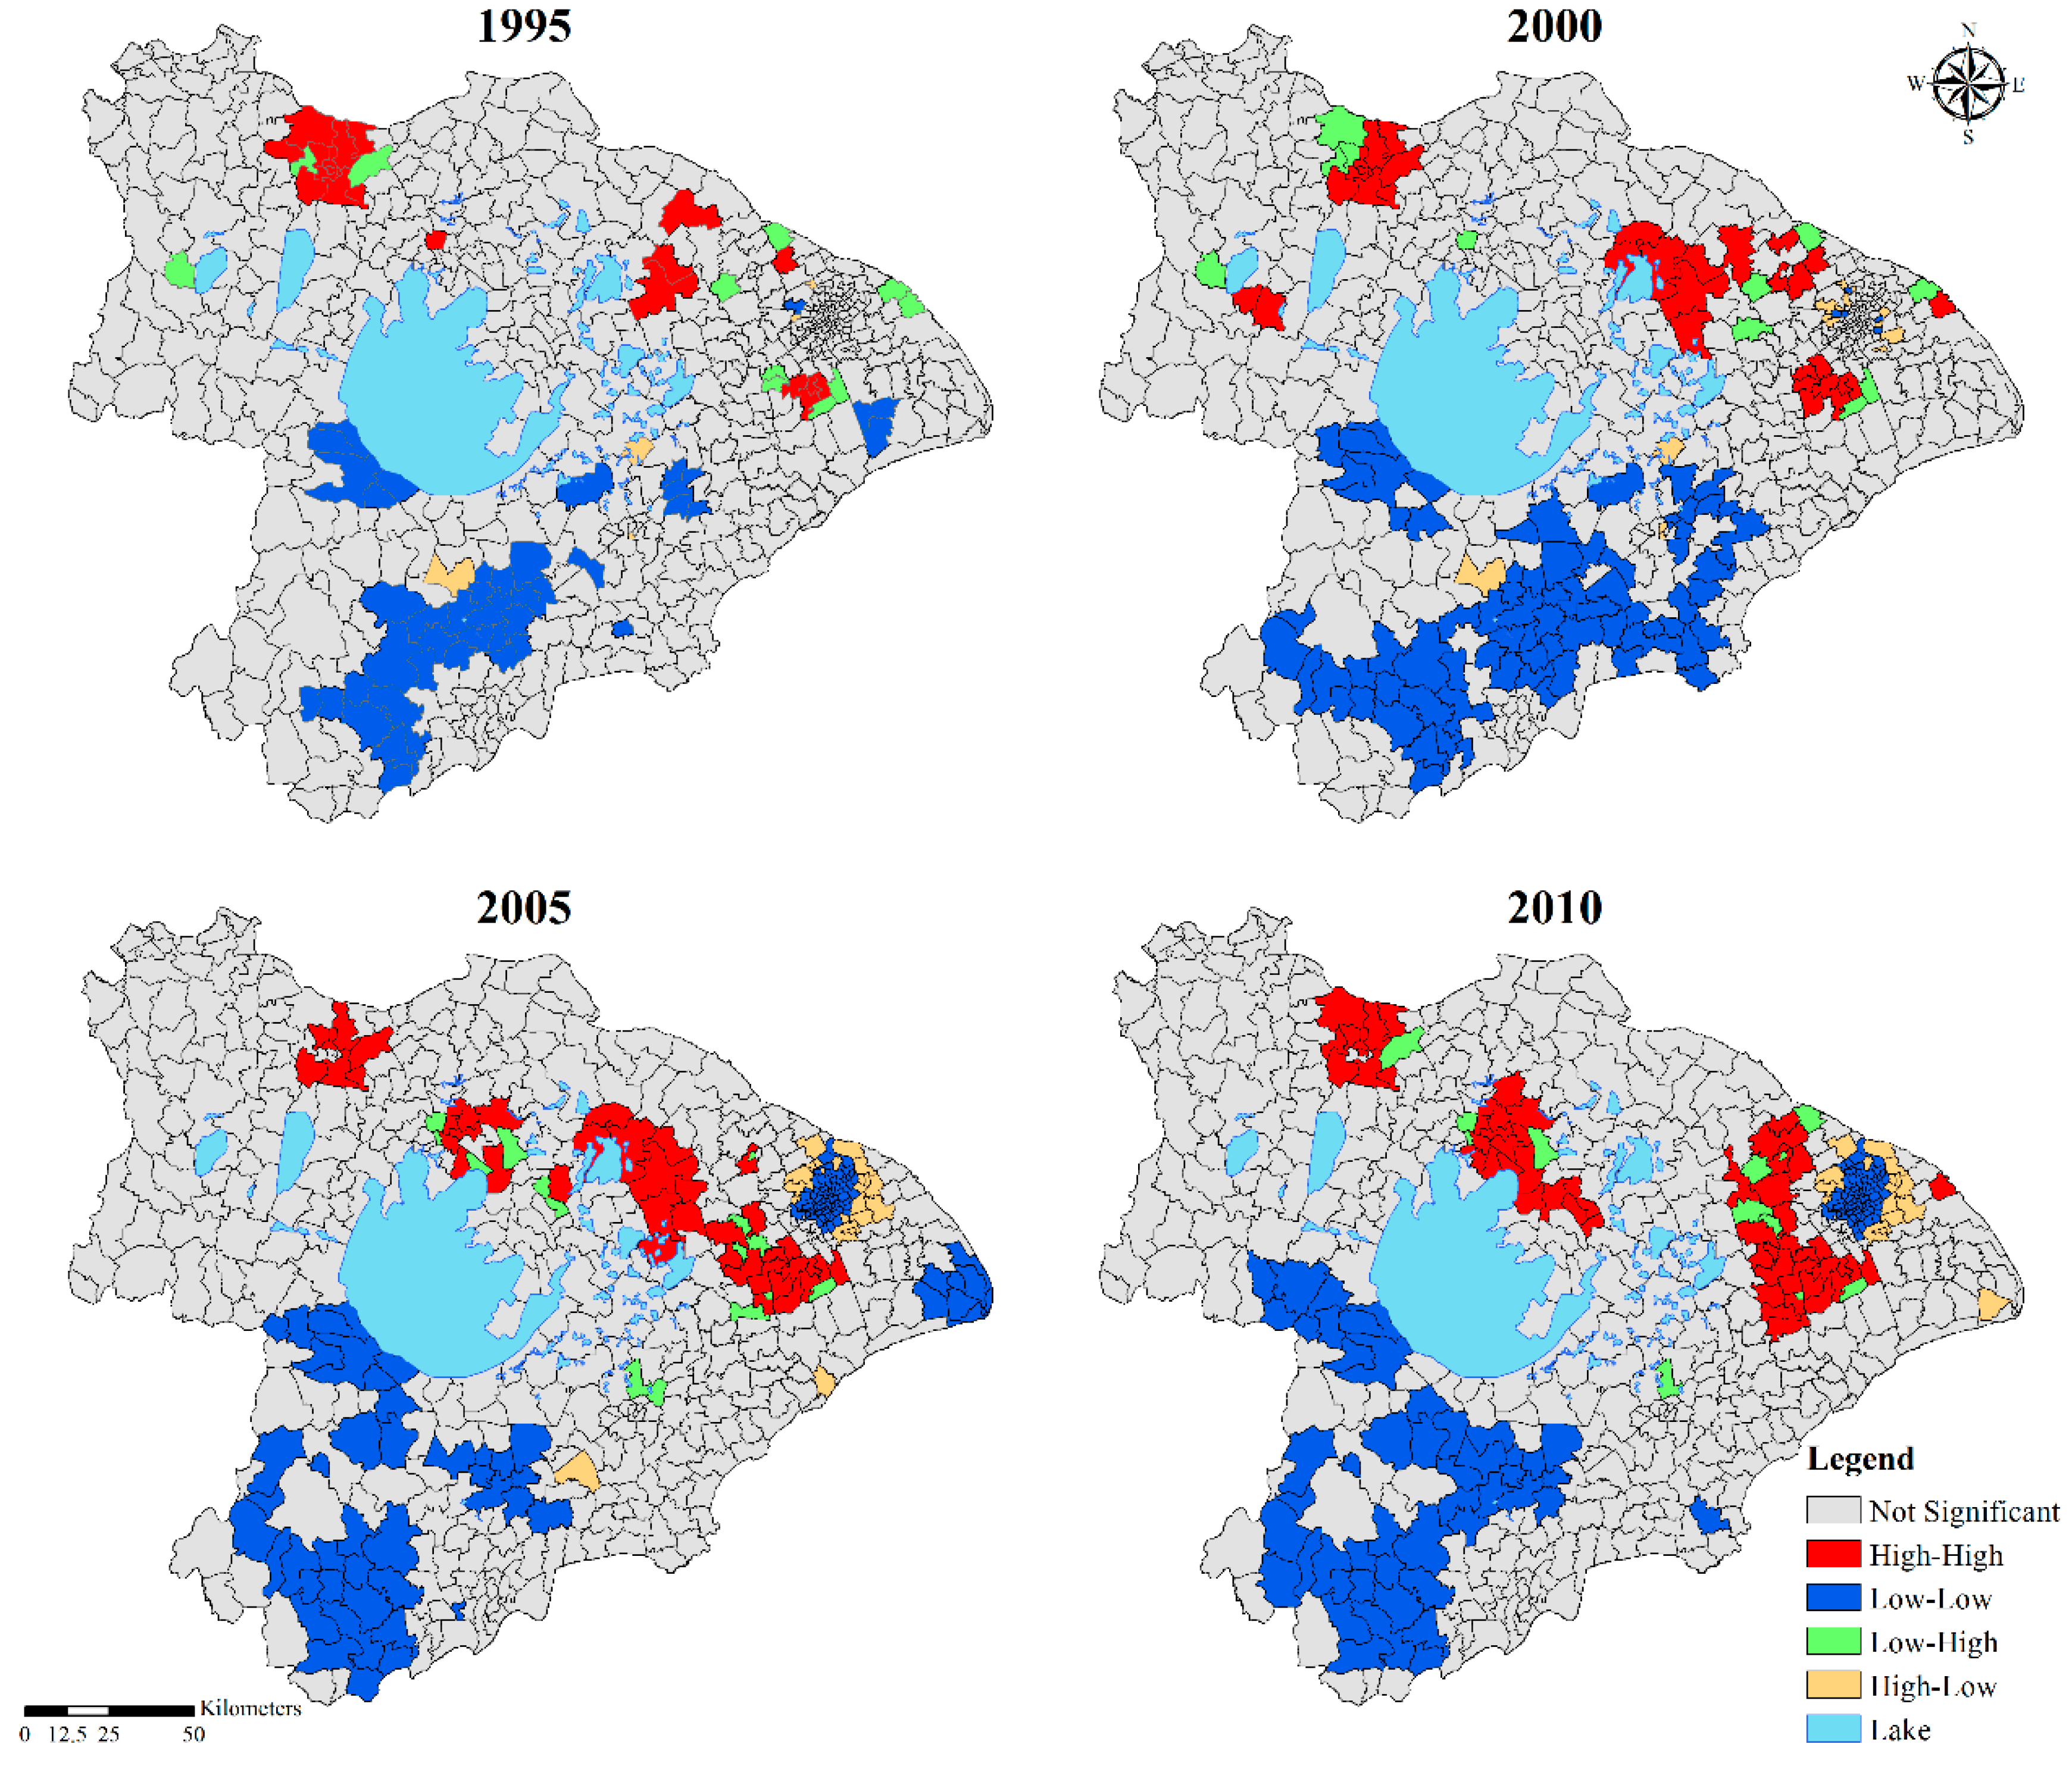
Water yields (mm) of towns in the TLB after 1995 were carried out by empirical Bayesian standardization based on water yields in 1985, and MIs were calculated. The results showed that the global MIs were above 0 in all stages, and they rose from 0.22 to 0.38 (Figure 9), which indicated that the spatial aggregation of the water yield increase rate in TLB was gradually strengthened. The results of the LISA analysis (Figure 10) showed that there was a significant spatial difference in the growth rate of the water yield in the TLB. High growth centers were mainly located in the north of the basin, while the low growth centers were mainly located in the southwest of the basin. In the northern part of the basin where cities were developing more rapidly, the high-high centers had significant expansion trends. The water yields growth rate of the towns in the southwest was generally at a low level.
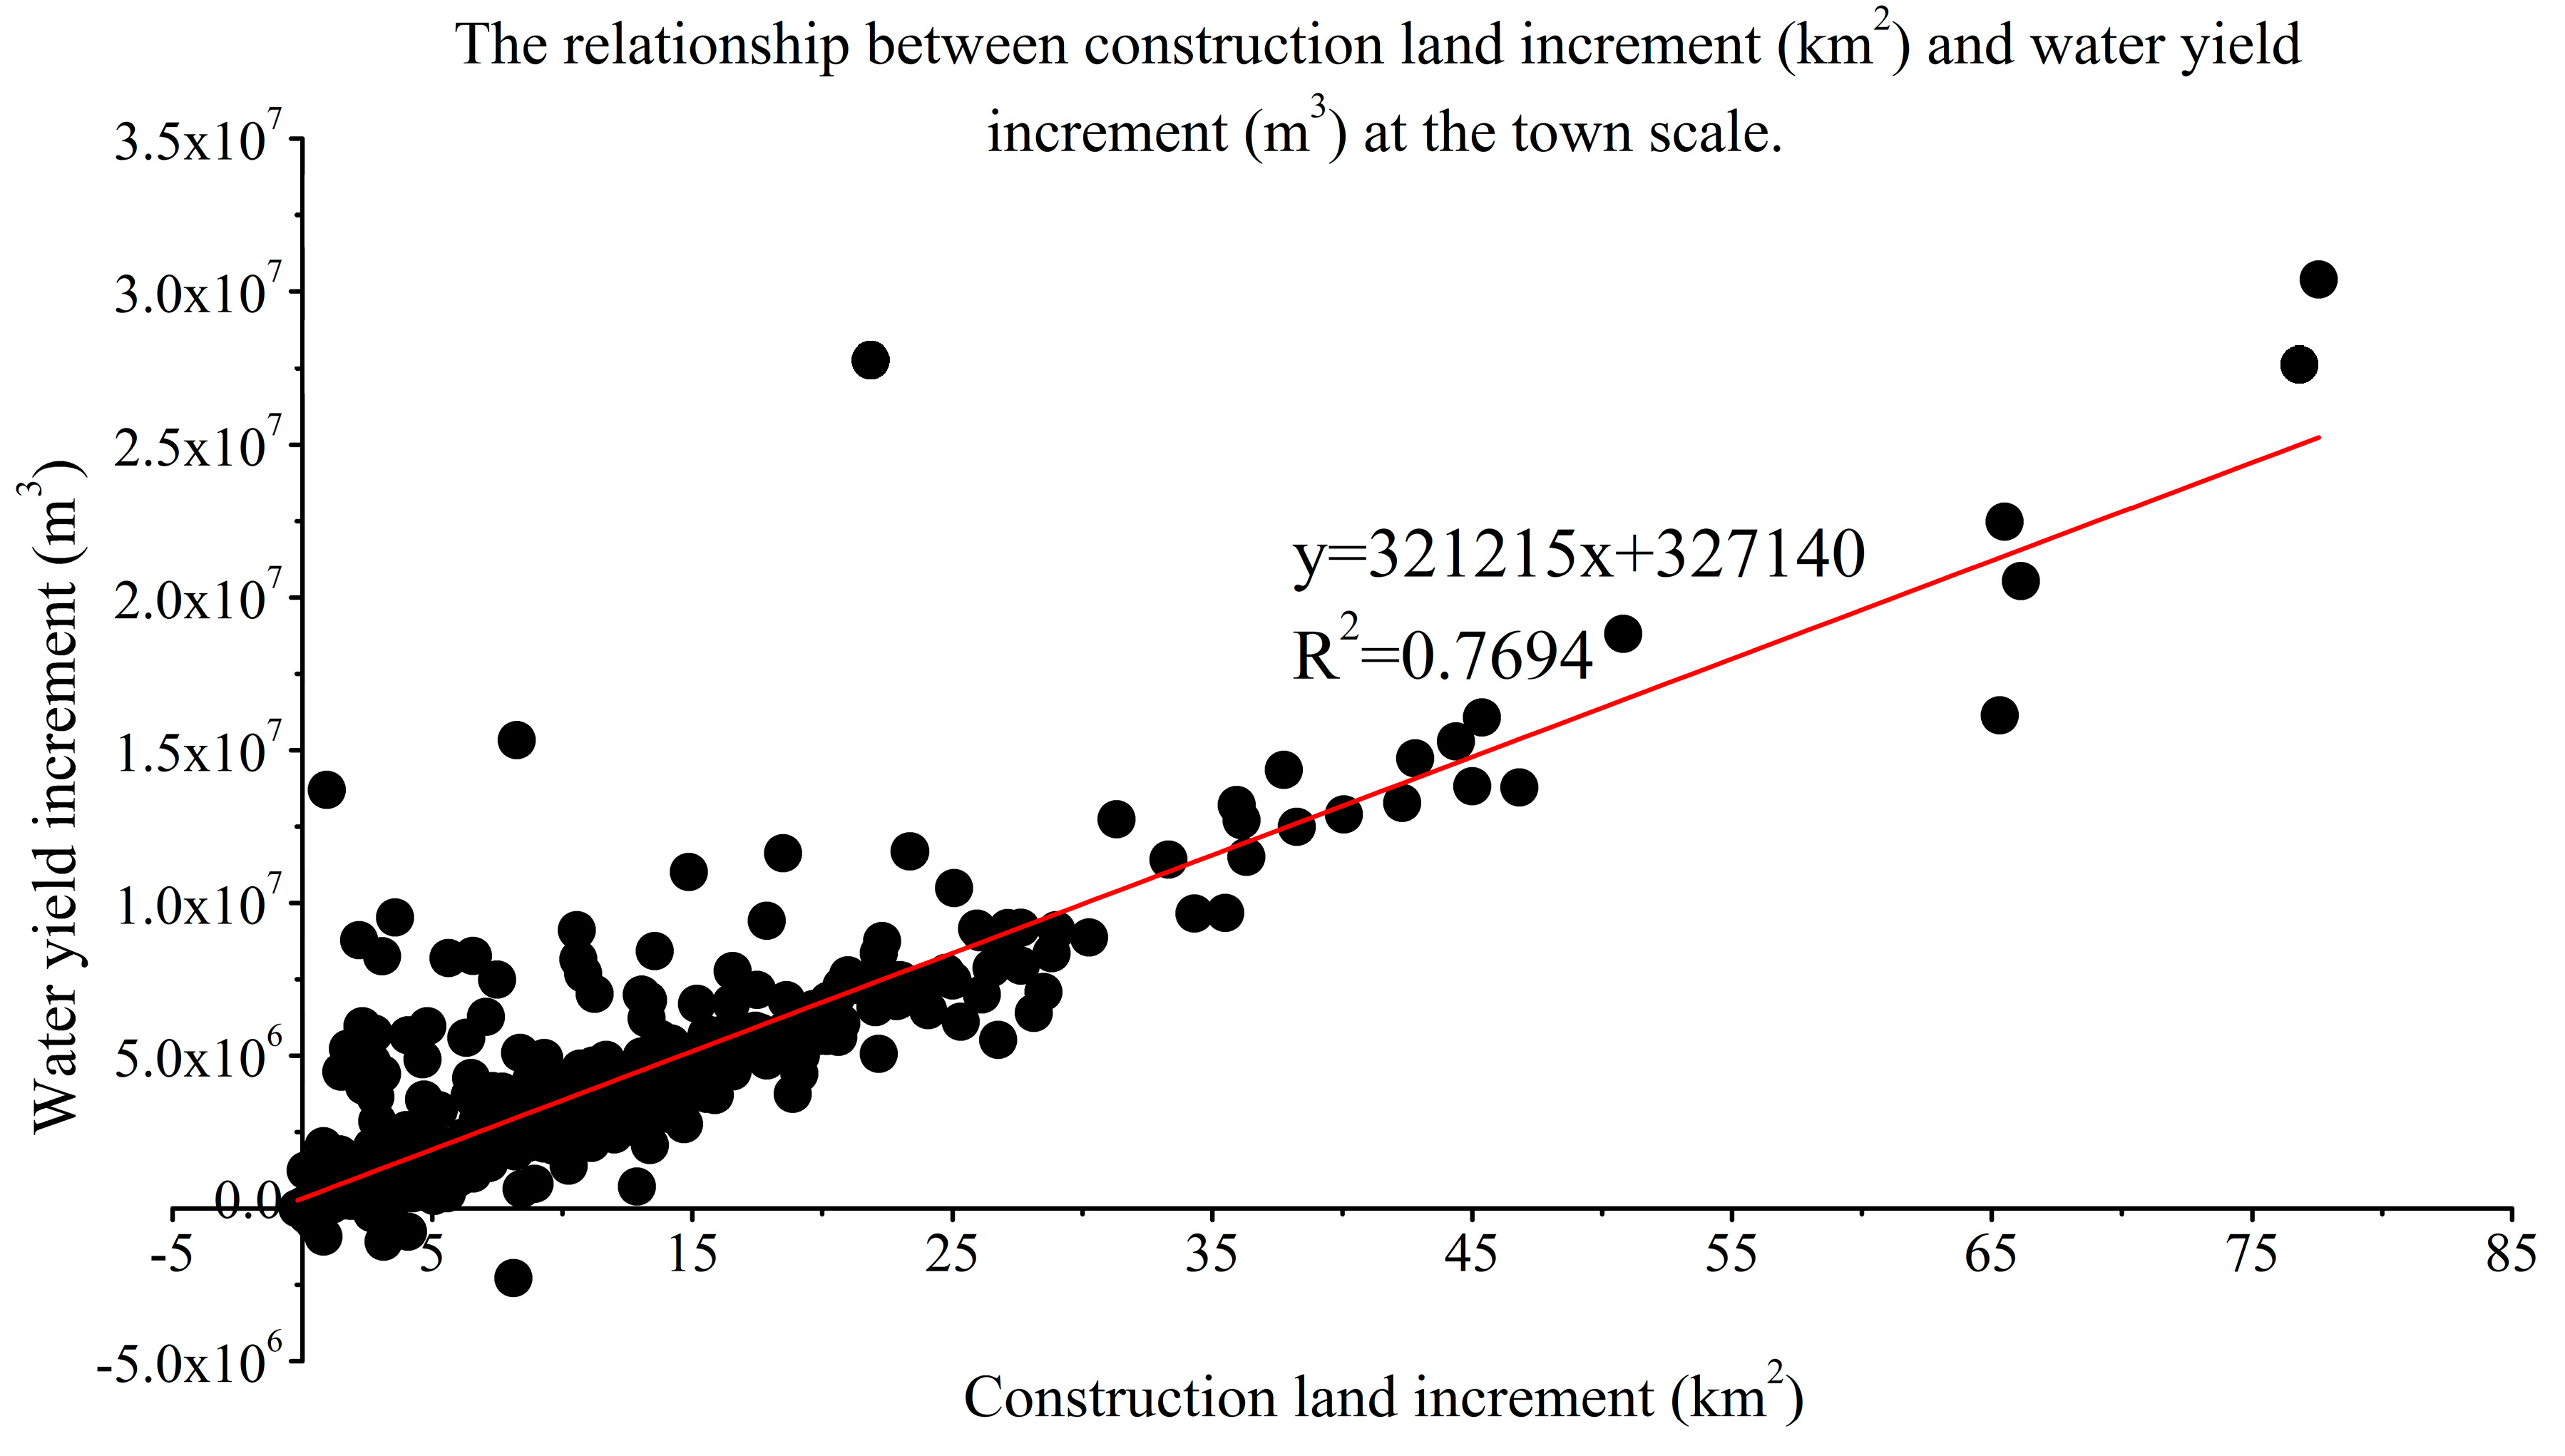
The regression analysis was also used to analyze the growth of water yield and the increment of construction land from 1985 to 2010 at the town scale. As shown in Figure 11, there was a good linear relationship between the growth of water yield and the increment of construction land. The gradient was 321,215, which was about 11.28% lower than the sub-region scale. This not only showed that the increase of construction land area has a significant impact on the regional runoff in the rapid urbanization area, which is consistent with some existing research results [12,13], but also that every increase of 1 km2 of construction land in the TLB will lead to an increase of water yield by more than 300,000 m3.
4. Discussion
4.1. Influences of Urbanization on Local Hydrological Characteristics
Urbanization development levels had an important influence on precipitation water yield. The regional MI analysis showed that large developed cities in the north of TLB, such as Shanghai, Wuxi, and Suzhou, with a growth area of construction land exceeding 15% of the total cities’ areas, had always been the concentration area of High-High (HH) discharge growth centers. However, Low-Low (LL) water yield growth centers have always been concentrated in the cities, such as Huzhou and Jiaxing in the south of the TLB, with relatively lower urbanization levels. Construction land and per capita GDP were two important indicators to measure the level of urban development (Table 5). There was strong consistency between water yield increment with per capita GDP and construction land growth rate, and the correlation coefficients were 0.89 (p < 0.05) and 0.93 (p < 0.05), respectively.
It has been indicated that the urbanization process is an important factor for the change of local hydrological conditions in the TLB. In this study, water yield growth rate was calculated by the average of simulated results under the precipitation conditions of 2002–2011, in order to eliminate the impact of precipitation. However, existing studies have shown that the urbanization process will also lead to a significant increase in precipitation in urban areas [37,38,39]. High-density cities create a significant heat island effect and urban rain island effect. This also means that the effect of urbanization on the local water yield might actually be higher than the simulation results. The influences of urbanization on the local hydrological conditions were not only reflected in large water yield increases, but also in the local flow velocity, resulting in a significant increase in river runoff peaks in urbanized areas [5]. Some of the original rivers were insufficient for meeting the needs of drainage, and manual intervention was necessary to reduce the risk of flooding in cities.
4.2. Urban Waterlogging and Urbanization
The analysis of MI showed that the discharge increase in TLB was always highly concentrated, which necessitated higher requirements for the regional storage capacity of floodwater. However, the extensive expansion of construction land constantly weakens the natural storage capacity of local areas, and urban waterlogging occurs. A study from 2008 to 2010 found that 62% of China’s cities experienced waterlogging [41], flood disasters increased with fluctuation, and the vulnerability of metropolis was heightened [43]. Shanghai is highly vulnerable to flood disaster [44]. During the study period, the water yield growth rates of Shanghai, Suzhou, Wuxi, and Changzhou, which were relatively developed in the basin, exceeded 40% (Table 6), which was far higher than the average level of the basin (12.85%). Floods have occurred frequently in Suzhou, Wuxi, and Shanghai since 2000, but these cities seldom experience once-in-a-century heaviest rainfalls. The water yield growth rates in relatively underdeveloped cities, Jiaxing and Huzhou, were only about 20%.
The LULC changes in the TLB had resulted in an increase in water yields, especially in areas of rapid urbanization. Considering the characteristics of flat terrain and dense river network in the plain area of the TLB, the increase of local water yields could lead to an increase of drainage load in the region; however, the flow speed of the whole river network is still slow because of very low stream gradient. Therefore, the water level of the river in the local area could rise rapidly, making it difficult to discharge the accumulated water on the land surface. In severe cases, it could cause local flooding or urban waterlogging. One of the main measures to alleviate this problem in the TLB was to build a large number of sluice gates and pumping stations, using artificial regulation and control to increase drainage speed. With the development of urbanization, the installed capacity of pumping stations in the TLB increased from 6000 m3/s in 1999 to 17,100 m3/s in 2015 [45,46]. However, flood events in the TLB have not decreased significantly. Some studies believe that in order to deal with flood disasters in Wujiang District of Suzhou City, by 2020, 99 new drainage pumping stations should be built, and 58 existing drainage pumping stations should be reconstructed [47]. This clearly shows that with the expansion of cities and towns, the TLB will have higher requirements for pumping capacity of the pumping stations. If the pumping stations do not have sufficient drainage capacity, urban waterlogging and local flood events are most likely occur.
5. Conclusions
Urbanization was the main driving force in LUCC change in the TLB. From 1985 to 2010, the area of construction land increased by 150.41%, and the area of construction land expansion mainly occurred from farmland around the city. The changes in LUCC patterns significantly affected the hydrological characteristics of the basin. Compared with 1985, the water yield of the basin increased by about 12.85% until 2010; the increase of water yield in the basin was not uniform. In the Pudong sub-region, the Puxi sub-region, the Yangchengdianmao sub-region, and the Wuchengxiyu sub-region, where urban development was more rapid, the water yield increased by a larger proportion. The local water yield increase caused by urbanization was even more significant. In Shanghai, Suzhou, Wuxi, and Changzhou, cities which were relatively developed in the basin, the water yield increase rates caused by construction land expansion exceeded 40%, far exceeding the average level of the basin.
During the study period, the growth rate of water yields in towns showed a spatial clustering feature. MI increased from 0.22 to 0.38, indicating an increasing trend. The results of LISA analysis show that there is a significant spatial difference in the growth rate of water yield in the TLB. The high growth centers are mainly located in the north of the basin, while the low growth centers are mainly located in the southwest of the basin. At the same time, the center of high growth rate of water yield showed a certain trend of expansion and transfer.
Regression analysis was used to analyze the growth of water yield, and the increment of construction land from 1985 to 2010 in both sub-region scales and town scales. The results showed that urban development has a significant impact on water yield; every increase of 1 km2 of construction land in the TLB will lead to an increase of water yield by more than 300,000 m3.
Taking the construction land area in 2010 as the research scope, the analysis showed that the growth of local water production in TLB is much higher than the average value of the basin, and the results show that the growth of local water yield is significantly related to the GDP per capita.
Author Contributions
Conceptualization, G.Y., H.L., Q.Z. and P.L.; Methodology, H.L. and P.L.; Validation, H.L.; Formal Analysis, H.L. and P.L.; Investigation, G.Y., H.L. and Q.Z.; Resources, G.Y., H.L. and Q.Z.; Data Curation, P.L. and Y.D.; Writing—Original Draft Preparation, H.L. and P.L.; Writing—Review & Editing, P.L. and Y.D.; Visualization, P.L. and Y.D.; Supervision, G.Y., H.L. and Q.Z.; Project Administration, G.Y. and H.L.; Funding Acquisition, H.L.
Funding
This research was funded by the National Natural Science Foundation of China (Grant No. 41877513), the “135” Key Program in Nanjing Institute of Geography and Limnology, Chinese Academy of Sciences (Grant No. NIGLAS2018GH06) and the Key Research Programme of the Chinese Academy of Sciences, grant number KZZD-EW-10-04.
Acknowledgments
We thank the Lakes Basin Data Integration and Simulation Center, Institute of Geography and Lakes, Chinese Academy of Sciences (http://lwdc.niglas.cas.cn/), for providing basic data.
Conflicts of Interest
The authors declare no conflict of interest.
References
- Olson, J.M.; Alagarswamy, G.; Andresen, J.A.; Campbell, D.J.; Davis, A.Y.; Ge, J.; Huebner, M.; Lofgren, B.M.; Lusch, D.P.; Moore, N.J.; et al. Integrating diverse methods to understand climate and interactions in East Africa. Geoforum 2008, 39, 898–911. [Google Scholar] [CrossRef]
- Zhang, X.; Cao, W.; Guo, Q.; Wu, S. Effects of landuse change on surface run-off and sediment yield at different watershed scales on the Loess Plateau. Int. J. Sediment Res. 2010, 25, 283–293. [Google Scholar] [CrossRef]
- Rientjes, T.; Haile, A.; Kebede, E.; Mannaerts, C.; Habib, E.; Steenhuis, T. Changes in land cover, rainfall and stream flow in Upper Gilgel Abbay catchment, Blue Nile Basin Ethiopia. Hydrol. Earth Syst. Sci. 2011, 15, 1979–1989. [Google Scholar] [CrossRef] [Green Version]
- Khoi, D.; Suetsugi, T. Impact of climate and land-use changes on hydrological processes and sediment yield: A case study of the Be River catchment, Vietnam. Hydrol. Sci. J. 2014, 59, 1095–1108. [Google Scholar] [CrossRef]
- Shi, P.J.; Yuan, Y.; Zheng, J.; Wang, J.A.; Ge, Y.; Qiu, G.Y. The effect of land use/cover change on surface runoff in Shenzhen region, China. Catena 2007, 69, 31–35. [Google Scholar] [CrossRef]
- Woldesenbet, T.A.; Elagib, N.A.; Ribbe, L.; Heinrich, J. Hydrological responses to land use/cover changes in the source region of the Upper Blue Nile Basin, Ethiopia. Sci. Total. Environ. 2017, 575, 724–741. [Google Scholar] [CrossRef] [PubMed]
- Chen, Y.; Xu, Y.; Yin, Y. Impact of land use change scenarios on storm-runoff generation in Xitiaoxi Basin, China. Quatern. Int. 2009, 1, 1–8. [Google Scholar] [CrossRef]
- Ahiablame, L.; Shakya, R. Modeling flood reduction effects of low impact development at a watershed scale. J. Environ. Manag. 2016, 171, 81–91. [Google Scholar] [CrossRef] [PubMed]
- Fohrer, N.; Haverkamp, S.; Eckhardt, K.; Frede, H.G. Hydrologic response to land use changes on the catchment scale. Phys. Chem. Earth B 2001, 26, 577–582. [Google Scholar] [CrossRef]
- Nie, W.; Yuan, Y.; Kepner, W.; Nash, M.S.; Jackson, M.; Erickson, C. Assessing impacts of land use and land cover changes on hydrology for the upper San Pedro watershed. J. Hydrol. 2011, 407, 105–114. [Google Scholar] [CrossRef]
- Gyamfi, C.; Ndambuki, J.M.; Salim, R.W. Hydrological Responses to Land Use/Cover Changes in the Olifants Basin, South Africa. Water 2016, 8, 588. [Google Scholar] [CrossRef]
- Baker, T.J.; Miller, S.N. Using the Soil and Water Assessmnent Tool (SWAT) to assess land use impact on water resources in an East African watershed. J. Hydrol. 2013, 486, 100–111. [Google Scholar] [CrossRef]
- Koneti, S.; Sunkara, S.L.; Roy, P.S. Hydrological Modeling with Respect to Impact of Land-Use and Land-Cover Change on the Runoff Dynamics in Godavari River Basin Using the HEC-HMS Model. ISPRS Int. J. Geo-Inf. 2018, 7, 206. [Google Scholar] [CrossRef]
- Yang, G.; Bowling, L.C.L.; Cherkauer, K.A.L.; Pijanowski, B.C.; Niyogi, D. Hydroclimatic response of watersheds to urban intensity: An observational and modeling-based analysis for the White River Basin, Indiana. J. Hydrometeorol. 2010, 11, 122–138. [Google Scholar] [CrossRef]
- Brun, S.E.; Band, L.E. Simulating runoff behavior in an urbanizing watershed. Comput. Environ. Urban Syst. 2000, 24, 5–22. [Google Scholar] [CrossRef]
- Oudin, L.; Salavati, B.; Percot, C.F.; Ribstein, P.; Saadi, M. Hydrological impacts of urbanization at the catchment scale. J. Hydrol. 2018, 559, 774–786. [Google Scholar] [CrossRef]
- Zhu, C.H.; Li, Y.K. Long-term hydrological impacts of land use/land cover change from 1984 to 2010 in the Little River Watershed, Tennessee. Int. Soil Water Conserv. Res. 2014, 2, 11–22. [Google Scholar] [CrossRef]
- Yan, B.; Fang, N.F.; Zhang, P.C.; Shi, Z.H. Impacts of land use change on watershed streamflow and sediment yield: An assessment using hydrologic modelling and partial least squares regression. J. Hydrol. 2013, 484, 26–37. [Google Scholar] [CrossRef]
- Farjad, B.; Gupta, A.; Razavi, S.; Faramarzi, M.; Marceau, D.J. An Integrated Modelling System to Predict Hydrological Processes under Climate and Land-Use/Cover Change Scenarios. Water 2017, 9, 767. [Google Scholar] [CrossRef]
- Jovanovic, T.; Mejía, A.; Gall, H.; Gironás, J. Effect of urbanization on the long-term persistence of streamflow records. Phys. A 2016, 447, 208–221. [Google Scholar] [CrossRef]
- Yang, L.; Smith, J.A.; Wright, D.B.; Baeck, M.L.; Villarini, G.; Tian, F.Q.; Hu, H.P. Urbanization and climate change: An examination of nonstationarities in urban flooding. J. Hydro Meteorol. 2013, 14, 1791–1809. [Google Scholar] [CrossRef]
- Seibert, J.; McDonnell, J.J. Land-cover impacts on streamflow: A changedetection modelling approach that incorporates parameter uncertainty. Hydrol. Sci. J. 2010, 55, 316–332. [Google Scholar] [CrossRef] [Green Version]
- Li, Z.; Liu, W.-Z.; Zhang, X.-C.; Zheng, F.-L. Impacts of land use change and climate variability on hydrology in an agricultural catchment on the Loess Plateau of China. J. Hydrol. 2009, 377, 35–42. [Google Scholar] [CrossRef]
- Miller, J.D.; Kim, H.; Kjeldsen, T.R.; Packman, J.; Grebby, S.; Dearden, R. Assessing the impact of urbanization on storm runoff in a peri-urban catchment using historical change in impervious cover. J. Hydrol. 2014, 515, 59–70. [Google Scholar] [CrossRef] [Green Version]
- Zope, P.E.; Eldho, T.I.; Jothiprakash, V. Impacts of land use–land cover change and urbanization on flooding: A case study of Oshiwara River Basin in Mumbai, India. Catena 2016, 145, 142–154. [Google Scholar] [CrossRef]
- Hundecha, Y.; Bárdossy, A. Modeling of the effect of land use changes on the runoff generation of a river basin through parameter regionalization of a watershed model. J. Hydrol. 2004, 292, 281–295. [Google Scholar] [CrossRef]
- Salvadore, E.; Bronders, J.; Batelaan, O. Hydrological modelling of urbanized catchments: A review and future directions. J. Hydrol. 2015, 529, 62–81. [Google Scholar] [CrossRef]
- Wan, R.R.; Yang, G.S. Influence of Land Use/Cover Change on Storm Runoff—A Case Study of Xitiaoxi River Basin in Upstream of Taihu Lake Watershed. Chin. Geogr. Sci. 2007, 17, 349–356. [Google Scholar] [CrossRef]
- Solecki, W.D.; Oliveri, C. Downscaling climate change scenarios in an urban land use change model. J. Environ. Manag. 2004, 72, 105–115. [Google Scholar] [CrossRef] [PubMed]
- Nunes, A.N.; Almeida, A.C.D.; Coelho, C.O.A. Impacts of land use and cover type on runoff and soil erosion in a marginal area of Portugal. Appl. Geogr. 2011, 31, 687–699. [Google Scholar] [CrossRef]
- Liu, L.; Xu, Z.X.; Reynard, N.S.; Hu, C.W.; Jones, R.G. Hydrological analysis for water level projections in Taihu Lake, China. J. Flood Risk Manag. 2013, 6, 14–22. [Google Scholar] [CrossRef]
- Yu, C.; Hall, J.W.; Cheng, X.; Evans, E.P. Broad scale quantified flood risk analysis in the Taihu Basin, China. J. Flood Risk Manag. 2013, 6, 57–68. [Google Scholar] [CrossRef]
- Chen, Y.; Xu, Y.P.; Yin, Y.X. Assessment of effects of land use changes on storm runoff generation—A Case Study of Xitiaoxi Basin. Sci. Geogra. Sinica. 2009, 29, 117–123. (In Chinese) [Google Scholar]
- Rong, J.; Zeng, C.F.; Wang, L.C. The impact of land use/cover change on hydrological processes of Lake Taihu Basin. J. Lake Sci. 2014, 26, 305–312. (In Chinese) [Google Scholar]
- Gao, J.F. Flood response to land use change in Taihu Lake Basin. J. Nat. Resour. 2002, 17, 150–156. (In Chinese) [Google Scholar]
- Wu, H.Y.; Guan, W.Q. The Flood in Taihu Lake Basin in 1991; China Water Power Press: Beijing, China, 2000; pp. 20–33. ISBN 7-5084-0186-7. (In Chinese) [Google Scholar]
- Aerts, J.C.J.H.; Kriek, M.; Schepel, M. STREAM (Spatial Tools for River Basins and Environment and Analysis of Management Options): ‘Set Up and Requirements’. Phys. Chem. Earch (B) 1999, 24, 591–595. [Google Scholar] [CrossRef]
- Shepherd, J.M. Detection of urban-induced rainfall anomalies in a major coastal city. Earth Interact. 2003, 7, 1–17. [Google Scholar] [CrossRef]
- Shepherd, J.M. Evidence of urban-induced precipitation variability in arid climate regimes. J. Arid Environ. 2006, 67, 607–628. [Google Scholar] [CrossRef] [Green Version]
- Xu, Y.P.; Ding, J.J.; Chen, Y. Impacts of urbanization on hydrology in the Yangtze River delta. Hydro-Sci. Eng. 2009, 12, 67–73. (In Chinese) [Google Scholar]
- Ye, G.B.; Su, W.Z.; Chen, W.X. The Elevation Characteristics Variation of Urban and Rural Construction Land Expansion in Taihu Lake Basin. J. Nat. Resour. 2015, 30, 938–950. [Google Scholar]
- Ou, H.Y.; Wu, H.Y. The Flood in Taihu Lake Basin in 1999; China Water Power Press: Beijing, China, 2001; pp. 22–31. ISBN 7-5084-0851-9. (In Chinese) [Google Scholar]
- Shi, P.J.; Wang, J.A.; Zhou, J.H.; Ding, Y.; Ge, Y.; Wang, Y.; Yang, M.C. Integrated risk management of flood disaster in China: To balance flood disaster magnitude and vulnerability in metropolitan regions. J. Nat. Disaster 2004, 4, 1–7. (In Chinese) [Google Scholar]
- Balica, S.F.; Wright, N.G.; van der Meulen, F. A flood vulnerability index for coastal cities and its use in assessing climate change impacts. Nat. Hazards 2012, 64, 73–105. [Google Scholar] [CrossRef] [Green Version]
- Yu, X.G.; Wu, T.L.; Jiang, J.H.; Mao, R. 1999 heavy flooding in the Taihu Basin: Investigation, analysis and further suggestions on the integrated harnessing in the basin. J. Lake Sci. 2000, 12, 1–5. (In Chinese) [Google Scholar]
- Zhu, F.W.; Wu, Y.N.; Yao, S.J. Key issues of water conservancy in the Taihu Lake Basin and sci-tech demands under fast urbanization. China Water Resour. 2015, 8, 18–21. (In Chinese) [Google Scholar]
- Geng, X.M.; Jin, H.Z.; Chen, Y.H. Countermeasures for new problems of urban flood and waterlogging prevention in east Taihu Lake Basin. Yangtze River 2013, 44, 7–9. (In Chinese) [Google Scholar]
Figure 1.
The Taihu Lake Basin (TLB).

Figure 2.
The inputs and outputs of the STREAM model.

Figure 3.
Calculated water yield by the STREAM model.

Figure 4.
Calibration and verification: (a) calibration period of 1980–1988; (b) flow discharge and measured values of 1980–1989; (c) verification period of 1980–1988; (d) flow discharge and measured values of 1989–1999; (e) calibration and verification period of 2002–2011).
Figure 4.
Calibration and verification: (a) calibration period of 1980–1988; (b) flow discharge and measured values of 1980–1989; (c) verification period of 1980–1988; (d) flow discharge and measured values of 1989–1999; (e) calibration and verification period of 2002–2011).

Figure 5.
LUCC change of the TLB from 1985 to 2010.

Figure 6.
Water yield changes in different meteorological scenarios.

Figure 7.
Sub-regions of the TLB.

Figure 8.
The regress result in sub-region scale.

Figure 9.
Standardized regional Moran Index.

Figure 10.
Standardized local Moran Index. High-High indicates a high value surrounded by high values, Low-Low indicates a low value surrounded by low values, Low-High indicates a low value surrounded by high values, and High-Low indicates a high value surrounded by low values.
Figure 10.
Standardized local Moran Index. High-High indicates a high value surrounded by high values, Low-Low indicates a low value surrounded by low values, Low-High indicates a low value surrounded by high values, and High-Low indicates a high value surrounded by low values.

Figure 11.
The regress result in sub-region scale.


Table 1.
Calibrated parameters.
| Parameter | Description | Range | Fitted Value |
|---|---|---|---|
| WHOLDNcal | Water holding capacity of the soil | >0 | 1.5 |
| MELTcal | How fast snow melts | >0 | 10 |
| CROPFcal | Parameter steering the evapotranspiration | >0 | 1 |
| TOGWcal | Parameter separating the fraction going to groundwater and to direct runoff | >0 | 0.4 |
| Ccal | Parameter steering how fast groundwater flows | >1 | 2 |
| Heatcal | parameter (constant) used to calculate PE | >0 | 1 |
Table 2.
LUCC change of the TLB.
| Landuse | 1985 | 1995 | 2000 | 2005 | 2010 | Change of 1985–1995 | Change of 1995–2000 | Change of 2000–2005 | Change of 2005–2010 |
|---|---|---|---|---|---|---|---|---|---|
| Farmland | 63.65% | 60.23% | 58.98% | 53.20% | 47.90% | −3.41% | −1.25% | −5.79% | −5.29% |
| Vegetation | 13.92% | 14.00% | 13.98% | 13.89% | 14.30% | 0.08% | −0.03% | −0.09% | 0.41% |
| construction land | 9.68% | 12.53% | 13.41% | 18.57% | 24.24% | 2.85% | 0.88% | 5.16% | 5.67% |
| Water | 12.75% | 13.24% | 13.63% | 14.34% | 13.55% | 0.49% | 0.39% | 0.71% | −0.79% |
Table 3.
Proportion of water yield in different types of LUCC from 1985 to 2010 (unit: %).
| Landuse | Farmland | Vegetation | Construction Land | Water | ||||||||
|---|---|---|---|---|---|---|---|---|---|---|---|---|
| Average | Max | Min | Average | Max | Min | Average | Max | Min | Average | Max | Min | |
| 1985 | 47.20 | 54.26 | 38.15 | 17.36 | 19.88 | 14.71 | 10.50 | 11.53 | 9.53 | 24.94 | 31.24 | 18.70 |
| 1995 | 44.05 | 51.06 | 35.41 | 16.99 | 19.27 | 14.57 | 13.99 | 15.53 | 12.96 | 24.97 | 30.79 | 19.02 |
| 2000 | 44.75 | 51.05 | 37.29 | 16.97 | 19.23 | 14.59 | 13.77 | 14.88 | 13.13 | 24.50 | 30.03 | 18.88 |
| 2005 | 40.21 | 45.72 | 33.43 | 16.05 | 17.84 | 14.07 | 19.28 | 20.82 | 18.05 | 24.46 | 29.76 | 19.28 |
| 2010 | 35.20 | 40.43 | 28.82 | 16.11 | 17.84 | 14.25 | 25.82 | 27.98 | 24.30 | 22.88 | 27.77 | 18.21 |
Table 4.
Water yield changes in sub-regions.
| 1985–1995 | 1995–2000 | 2000–2005 | 2005–2010 | |||||
|---|---|---|---|---|---|---|---|---|
| Increase Rate | Increment (mm) | Increase Rate | Increment (mm) | Increase Rate | Increment (mm) | Increase Rate | Increment (mm) | |
| Zhexi sub-region | 0.19% | 1.16 | 0.20% | 1.21 | 0.48% | 2.88 | 1.02% | 6.16 |
| Hangjiahu sub-region | 0.90% | 3.64 | 0.53% | 2.16 | 6.10% | 24.95 | 3.23% | 14.02 |
| Taihu Lake sub-region | 0.28% | 2.11 | 0.25% | 1.90 | 1.55% | 11.73 | 0.48% | 3.67 |
| Pudong sub-region | 2.61% | 7.99 | 2.46% | 7.74 | 4.34% | 13.97 | 9.57% | 32.15 |
| Puxi sub-region | 4.64% | 14.64 | 4.50% | 14.84 | 10.62% | 36.60 | 9.39% | 35.82 |
| Yangchengdianmao sub-region | 7.53% | 27.79 | 3.83% | 15.22 | 10.69% | 44.04 | 0.47% | 2.13 |
| Wuchengxiyu sub-region | 7.66% | 23.16 | 2.93% | 9.53 | 8.57% | 28.72 | 8.35% | 30.38 |
| Huxi sub-region | 4.69% | 18.22 | 0.65% | 2.64 | 3.68% | 15.06 | 1.32% | 5.60 |
| Total Taihu Lake Basin | 2.74% | 11.91 | 1.23% | 5.49 | 4.61% | 20.85 | 2.75% | 13.01 |
Table 5.
Water yield growth rate and per capita GDP.
| City | Per Capita GDP in 2010 (Yuan) | Construction Land Growth Rate | Water Yield Growth Rate |
|---|---|---|---|
| Shanghai | 73,297 | 57.73% | 40.79% |
| Suzhou | 87,607 | 72.23% | 54.84% |
| Wuxi | 90,355 | 64.25% | 43.43% |
| Changzhou | 64,824 | 63.06% | 43.89% |
| Huzhou | 44,982 | 50.78% | 18.45% |
| Jiaxing | 51,003 | 45.64% | 24.85% |
Table 6.
Water yield changes in different cities.
| City/Basin | 1985–1995 | 1995–2000 | 2000–2005 | 2005–2010 | 1985–2010 |
|---|---|---|---|---|---|
| Shanghai | 6.77% | 3.64% | 12.41% | 13.19% | 40.79% |
| Suzhou | 11.64% | 2.99% | 19.29% | 12.90% | 54.84% |
| Wuxi | 11.41% | 2.41% | 12.58% | 11.66% | 43.43% |
| Changzhou | 15.42% | 1.97% | 9.18% | 11.97% | 43.89% |
| Huzhou | 1.50% | 0.10% | 7.37% | 8.57% | 18.45% |
| Jiaxing | 1.18% | 0.11% | 16.21% | 6.06% | 24.85% |
| Taihu Lake Basin | 2.99% | 1.34% | 4.97% | 2.94% | 12.85% |
© 2018 by the authors. Licensee MDPI, Basel, Switzerland. This article is an open access article distributed under the terms and conditions of the Creative Commons Attribution (CC BY) license (http://creativecommons.org/licenses/by/4.0/).
Share and Cite
MDPI and ACS Style
Li, P.; Li, H.; Yang, G.; Zhang, Q.; Diao, Y. Assessing the Hydrologic Impacts of Land Use Change in the Taihu Lake Basin of China from 1985 to 2010. Water 2018, 10, 1512. https://doi.org/10.3390/w10111512
AMA Style
Li P, Li H, Yang G, Zhang Q, Diao Y. Assessing the Hydrologic Impacts of Land Use Change in the Taihu Lake Basin of China from 1985 to 2010. Water. 2018; 10(11):1512. https://doi.org/10.3390/w10111512
Chicago/Turabian StyleLi, Pengcheng, Hengpeng Li, Guishan Yang, Qi Zhang, and Yaqin Diao. 2018. "Assessing the Hydrologic Impacts of Land Use Change in the Taihu Lake Basin of China from 1985 to 2010" Water 10, no. 11: 1512. https://doi.org/10.3390/w10111512
Note that from the first issue of 2016, this journal uses article numbers instead of page numbers. See further details here.