Response of the Meltwater Erosion to Runoff Energy Consumption on Loessal Slopes
by
Tian Wang
1,2, 
Peng Li
1,2,*,
Jingming Hou
1,2,
Zhanbin Li
1,2,3,
Zongping Ren
1,2,
Shengdong Cheng
1,2,
Guoce Xu
1,2,
Yuanyi Su
1,2 and
Feichao Wang
1,2 1
State Key Laboratory of Eco-hydraulics in Northwest Arid Region of China, Xi’an University of Technology, Xi’an 710048, China
2
Key Laboratory of National Forestry Administration on Ecological Hydrology and Disaster Prevention in Arid Regions, Xi’an University of Technology, Xi’an 710048, China
3
State Key Laboratory of Soil Erosion and Dry-land Farming on the Loess Plateau, Institute of Soil and Water Conservation, Chinese Academy of Sciences and Ministry of Water Resources, Yangling 712100, China
*
Author to whom correspondence should be addressed.
Water 2018, 10(11), 1522; https://doi.org/10.3390/w10111522
Submission received: 8 September 2018
/
Revised: 17 October 2018
/
Accepted: 19 October 2018
/
Published: 26 October 2018
(This article belongs to the Section Hydrology)
Abstract
:Soil properties are influenced by freeze-thaw, which in turn influences soil erosion. Despite this, only a few studies have investigated the impacts on soil hydrodynamic processes. The objective of this study was to evaluate the impact of soil freezing conditions on runoff, its energy consumption, and soil erosion. A total of 27 laboratory-concentrated meltwater flow experiments were performed to investigate the soil erosion rate, the runoff energy consumption, and the relationship between the soil erosion rate and runoff energy consumption by concentrated flow under combinations of three flow rates (1, 2, and 4 L/min) and three soil conditions (unfrozen, shallow-thawed, and frozen). The individual and combined effects of soil condition, flow rate, and runoff energy consumption on the soil erosion rate were analyzed. For the same flow rate, the shallow-thawed and frozen slope produced mean values of 3.08 and 4.53 times the average soil erosion rates compared to the unfrozen slope, respectively. The number of rills in the unfrozen soil slope were 4, 3, and 2 under the flow rate of 1, 2, and 4 L/min, respectively. The number of rills in the thawed-shallow and frozen soil slope were all 1 under the flow rate of 1, 2, and 4 L/min. The rill displayed disconnected distribution patterns on the unfrozen slope, but a connected rill occurred on the shallow-thawed and frozen slopes. The average rill width on unfrozen, thawed-shallow, and frozen soil slopes increased by 1.87 cm, 4.38 cm, and 1.68 cm as the flow rate increased from 1 L/min to 4 L/min. There was no significant difference in the rill length on the frozen slope under different flow rates (p > 0.05). The runoff energy consumption ranged from unfrozen > shallow-thawed > frozen slopes at the same flow rate. The soil erosion rate had a linear relationship with runoff energy consumption. The spatial distribution of the runoff energy implied that soil erosion was mainly sourced from the unfrozen down slope, shallow-thawed upper slope, and frozen full slope.
1. Introduction
The Loess Plateau in northwestern China is suffering from a serious soil erosion problem [1,2,3]. Freeze-thaw (FT) erosion, resulting from melted water, is one of the most important erosion types on the Loess Plateau [4,5,6]. Compound erosion of freeze-thaw and meltwater strips the soil particles from the soil surface on hillslopes, and then moves them into the river [7].
Field observed experiments on gully erosion resulted from FT [8]. The results showed 11% of variability in channel erosion, 14% of variability in interfluve erosion, and 26% of variability in side wall erosion using a weekly timescale, which implied that FT processes were a significant contributor to erosion in gully channels, interfluves, and especially the side walls. Gully erosion is one type of linear erosion, where the soil material is detached and transported by overland flow. Several researchers have reported on linear mechanisms, e.g., erosion resulting in headcut and bank retreat due to concentrated surface flow [9,10,11,12], and landslides that form as a result of the subsurface flow [13,14]. Linear erosion, once connected, results from the depression formed, which becomes the main sediment source of the river basin. Rills correspond to the shallowest forms of linear erosion, which are both sediment source areas and sediment transport vehicles on the hillslope. The resulting rills may be persistent and develop into gullies [15,16], which will lead to irreversible losses of agricultural land due to not being filled by tillage operations. Therefore, it is important to understand the rill erosion process and spatial distribution for controlling the development of erosion.
Rill erosion accounts for approximately 70% of upland erosion, which is the primary sediment generation on the hillslopes of the Loess Plateau [17]. Flows in natural rills on hillslopes transport significantly more sediment down slope than overland flows, which in turn affects rill geomorphology that is closely related to the hydraulic conditions [18,19,20]. Therefore, the geomorphic importance of rill erosion has been well-developed [18,19,21]. Surface runoff and soil loss are subjected to rill morphology on the hillslope [22]. Processes that change the cross-sectional geometry of a rill channel indirectly change the velocity and turbulence [19]. The importance of the collapse of rill sidewalls resulting in rill widening has received little attention [23]. Rill length, width, depth, and cross-sections are considered as rill morphology parameters for analyzing the soil erosion rate and hydraulic processes [21,24,25]. Some researchers have focused on the effect of rill morphology on the relationship between the hydraulic and soil erosion rate, such as down-cutting of the rill bed [26,27] and widening subprocesses of rill development [3,24]. More importantly, rills easily form on soils that have previously experienced FT cycles [28,29]. Wischmeier and Smith [30] reported that frozen strata covered with thawed soil strata were highly susceptible to meltwater erosion. The capability of soil FT processes can affect rill erosion, sediment production, and geomorphic evolution [20]. At present, research on alternate FT soil erosion, particularly studies on rill erosion and sediment transport process, is limited. However, the processes associated with soil FT that affect rill geometry have received very little attention. Changes in the area-to-perimeter ratios of a V-shaped rill in a frozen fine sandy loam were compared with similar rills that had been never frozen [31], which showed that after similar flows through each rill, the frozen rill was deeper and narrower throughout its length than the rill that had never been frozen. Gatto et al. [20] demonstrated that the final x-section of the entire rill was changed from rectangular trapezoidal to triangular as the soil-flows, slides, and slumps filled the rill and increased the width of its top, resulting from the effect of FT cycling. Ban et al. [32] implemented a laboratory for comparing the rill velocity over frozen and thawed hillslopes and found that the rill morphology without headcuts along the rill on the frozen hillslope promoted an increase in the flow velocity when compared with the erosion of a thawed hillslope with headcuts. Variations in the morphology of rills resulting from freeze-thaw-induced soil erosion under concentrated flow, however, have not been previously investigated, which in turn influence rill erosion and sediment production.
Different relationships between soil detachment and hydraulic parameters have been established to predict the soil erosion rates through concentrated flow experiments [33,34,35,36]. Therefore, soil erosion rates have been described by several hydraulics parameters, such as shear stress [37], flow velocity [38], stream power [39], unit stream power [40], and runoff energy consumption [41]. Flow energy is a better hydraulic parameter than shear stress for describing soil detachment [42,43,44,45]. Li et al. [41] demonstrated that the processes of soil erosion accompanied flow energy consumption and consumed energy was used to detach and transport soil particles on the loessal hillslope. Li et al. [46] calculated the soil erosion and sediment yield through runoff shear stress, runoff energy consumption, and unit stream power, respectively, and indicated that runoff energy consumption in describing the soil erosion process was simpler and more accurate on the loessal hillslope. Experimental results indicated that the soil erosion rate was affected by factors such as soil texture, land use type, bulk density, clay content, organic matter content, and soil moisture [35,47,48]. As the hydraulic parameter does not represent an actual measurable soil property [43], the values in models are often acquired through calibration in different regions. Therefore, the quantification of soil erosion based on flow hydraulic parameters varies with different soil conditions [49,50]. The effect of FT influences soil properties such as soil bulk, water-stable aggregate content, soil cohesion, and soil disintegration [5,51,52,53], and in turn affects the soil erosion. However, the relative research on the relationship between hydraulic parameters and soil erosion resulting from meltwater is limited. Therefore, the response of meltwater erosion to runoff energy consumption was investigated in this study.
The concentrated flow experiments were conducted under different flow rates and soil conditions (a) to compare the erosion resistance characteristics of soil erosion, rill morphology, and runoff energy consumption; (b) to quantify the relationship between the soil erosion rate and energy consumption; and (c) to analyze the spatial distribution of sediment based on the runoff energy consumption.
2. Materials and Methods
2.1. Experimental Material
A laboratory-concentrated flow experiment was implemented at the State Key Laboratory of Eco-hydraulics in the Northwest Arid Region of China in Xi’an, China. The deposited soil was loessal soil sourced from the Wangmaogou catchment (37°34′13′′–37°36′03′′ N and 110°20′26′′–110°22′46′′ E) in Shaanxi Province, China, and contained 0.02% clay, 65.28% silt, and 34.7% sand particles. Stones, plants, and other debris were removed from the air-dried soil material via sieving through a 5 mm mesh to maintain uniform soil materials.
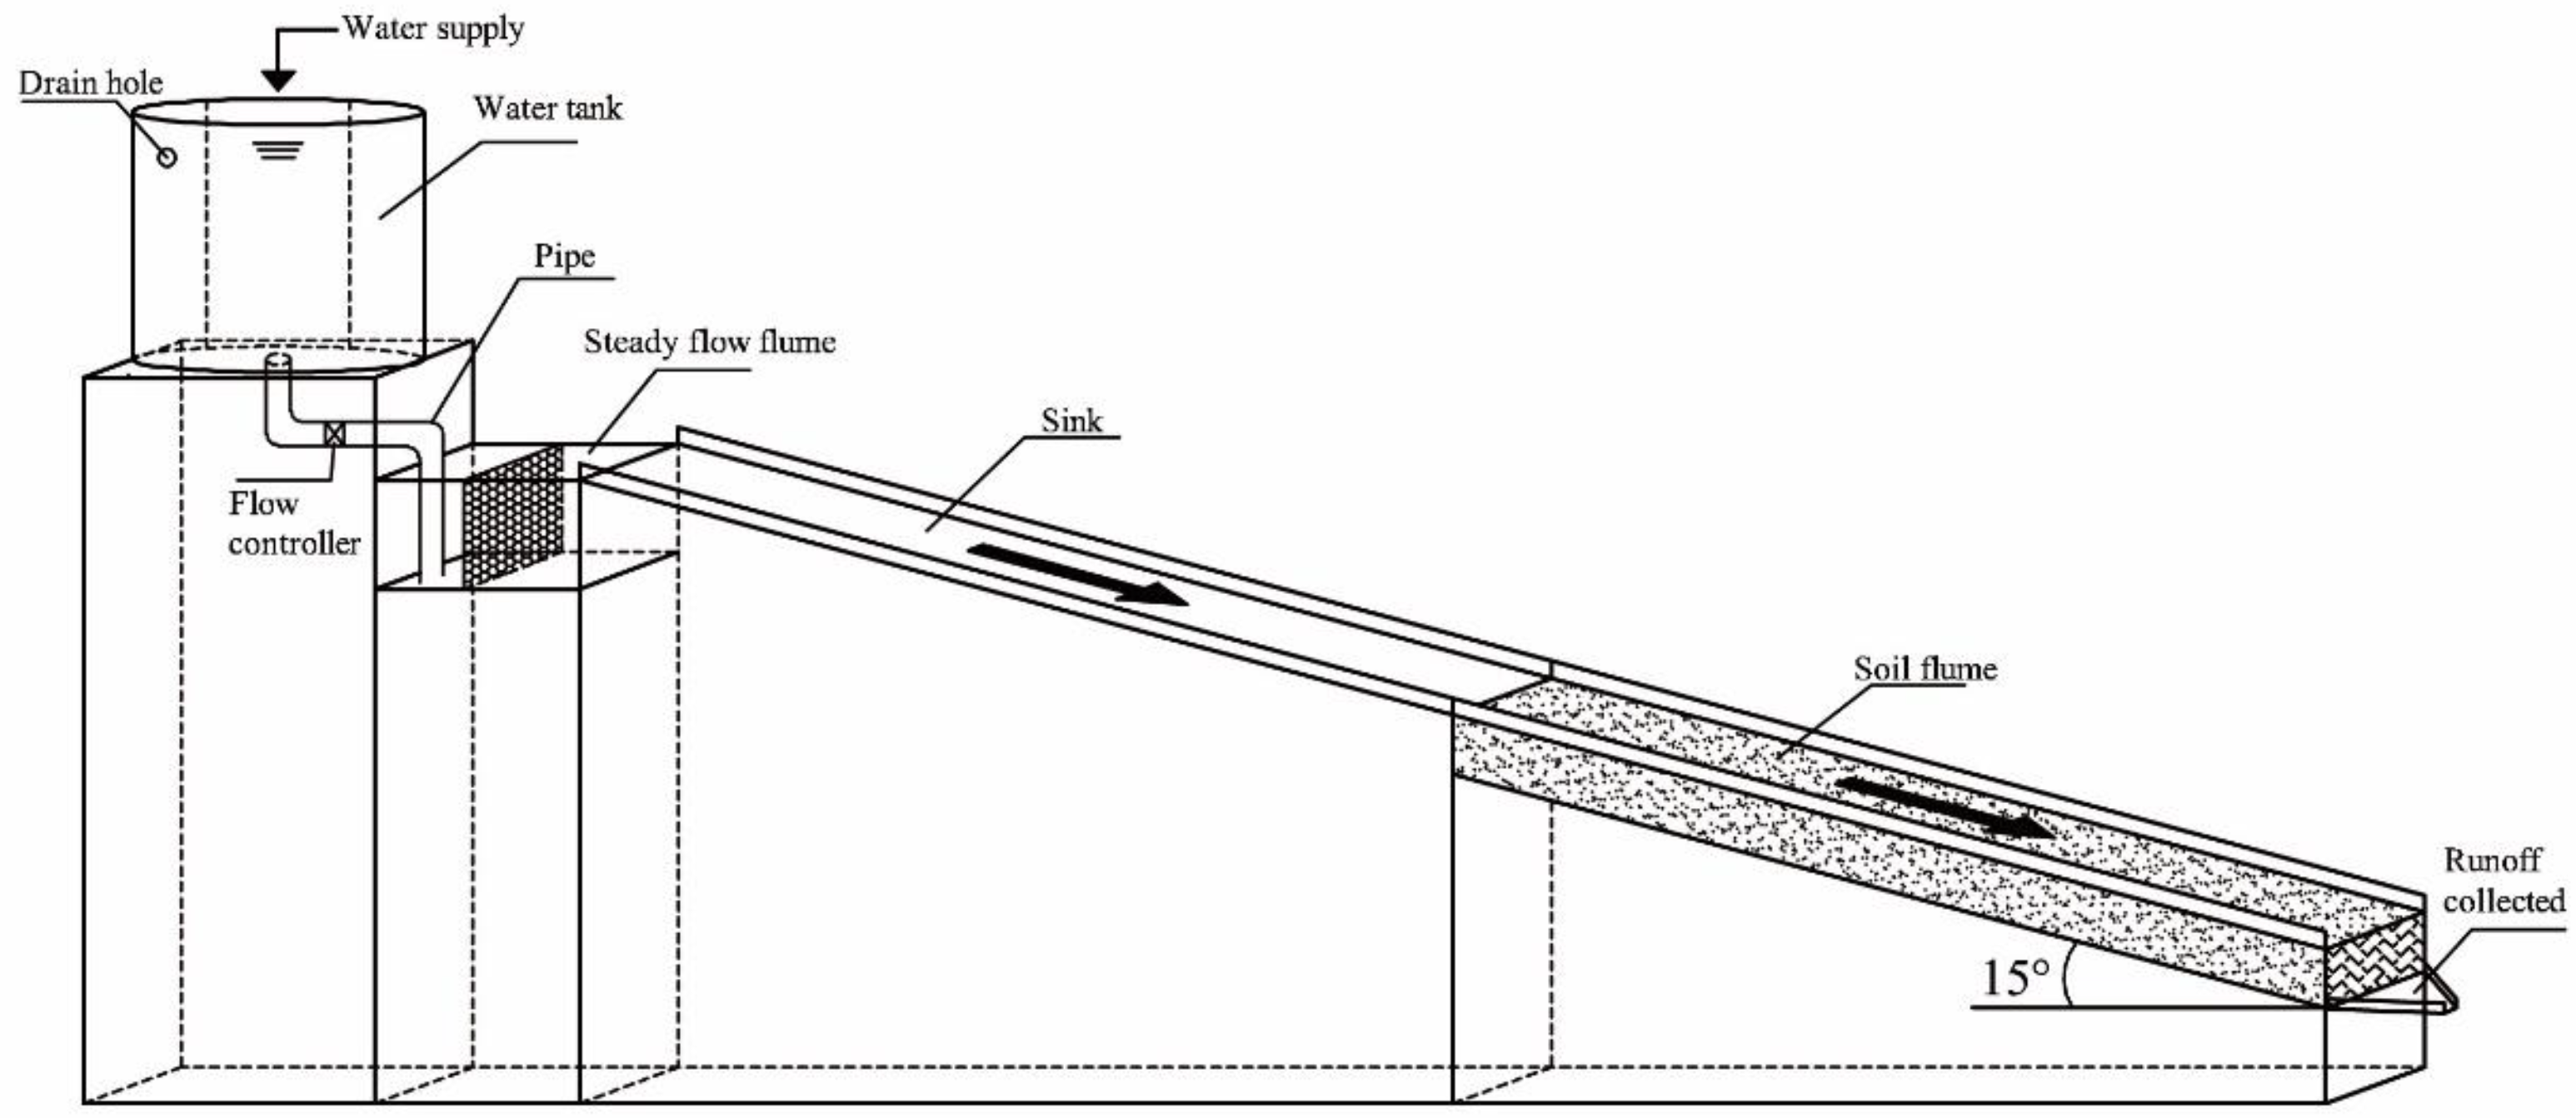
The experiment was performed in a 4 × 0.1 m hydraulic flume. The experiment flume consisted of soil flume (2 m length, 0.2 m width, and 0.2 m depth) and sink (2 m length, 0.2 m width, and 0.05 m depth). The bottom of the sink link with the top of the soil flume are shown in Figure 1 and Figure 2. The layered filling method (5 cm depth each layer) was performed to pack the soil to keep a uniform mean dry soil bulk density of about 1.25 g/cm3 to a depth of 15 cm, and the soil moisture content was about 15%. The soil surface elevation in the middle of the soil-filled flume was lower than that near the flume walls for forbearing the influence of walls. The unfrozen soil-filled flumes were placed at the laboratory with a room temperature of 5 °C to 8 °C. The completely frozen soil-filled flumes were obtained through an ultra-low-temperature freezer where the temperature was set up as −22 °C to −20 °C for 24 h. A shallow-thawed soil flume was obtained via thawing the completely frozen soil flume under room temperature. The thawed depth was frequently measured at different places on the completely frozen soil flume with a needle every 15 min until it reached the thawed depth of 3 cm.
Nine combinations of three flow rates (1, 2, and 4 L/min) [5] with a water temperature of around 5 °C and three soil conditions (unfrozen, shallow-thawed, and frozen) were evaluated under the designed 15° slope, with each combination of flow rate and soil condition tested three times, resulting in a total of 27 experiments. The water flow was supplied by the tank with a drain for stabilizing the water pressure, and a steady flow flume was used to maintain the steady flow by a board with holes (Figure 1). The flow rate was adjusted via a flow controller on the pipe.
The eroded depth of 15 cm on any part of the soil-filled flume was considered as the threshold value for the termination test. A runoff collection device was installed at the bottom of the flume to collect runoff and sediment (Figure 1), which were taken using plastic volume every 1 min per test. The sediments were oven-dried at 105 °C for 24 h before weighing. The width and length of the rill were measured using a ruler after the experiment was finished. Flow velocity was measured using the dye tracing method between two cross-sections [3], and the slope was segregated into four cross-sections: 0 to 0.5 m (S1), 0.5 to 1.0 m (S2), 1.0 to 1.5 m (S3), 1.5 to 2.0 m (S4), and 2.0 to 2.5 m along the slope. Flow velocity was calculated using the distance (0.5 m) divided by the mean travel time and multiplied by a correction factor of 0.65, which adjusted the measured surface flow velocity close to the maximum flow velocity to obtain the mean flow velocity [54].
2.2. Equation and Data Analysis
Potential energy transfers to kinetic energy when the runoff flows from the top to the bottom of the slope. The runoff energy will be consumed due to runoff against the sediment transportation on the slope. The runoff energy consumption between any two sections is calculated based on the energy conservation rule. The elevation of the flume outlet was set as the reference elevation for calculating the potential energy. The runoff energy consumption equations are defined as [41]:
where ρ is the water density (kg/m3); q is the inflow rate (L/min); g is the acceleration due to gravity (m/s2); Li is the distance from the transect site of i to the bottom slope (m); θ is the slope gradient (°); and vi is the transect of i flow velocity (m/s).
The regression analysis and pictures were drawn through OriginPro 8.5 software (OriginLab Inc, Northampton, MA, USA), statistical analysis was via conducted SPSS 16.0 (SPSS Inc, Chicago, IL, USA), and the experimental system was designed by CAD 2010 (Autodesk Inc, Mill Valley, CA, USA).
3. Results
3.1. Characteristics of the Soil Erosion Process and Eroded Rill
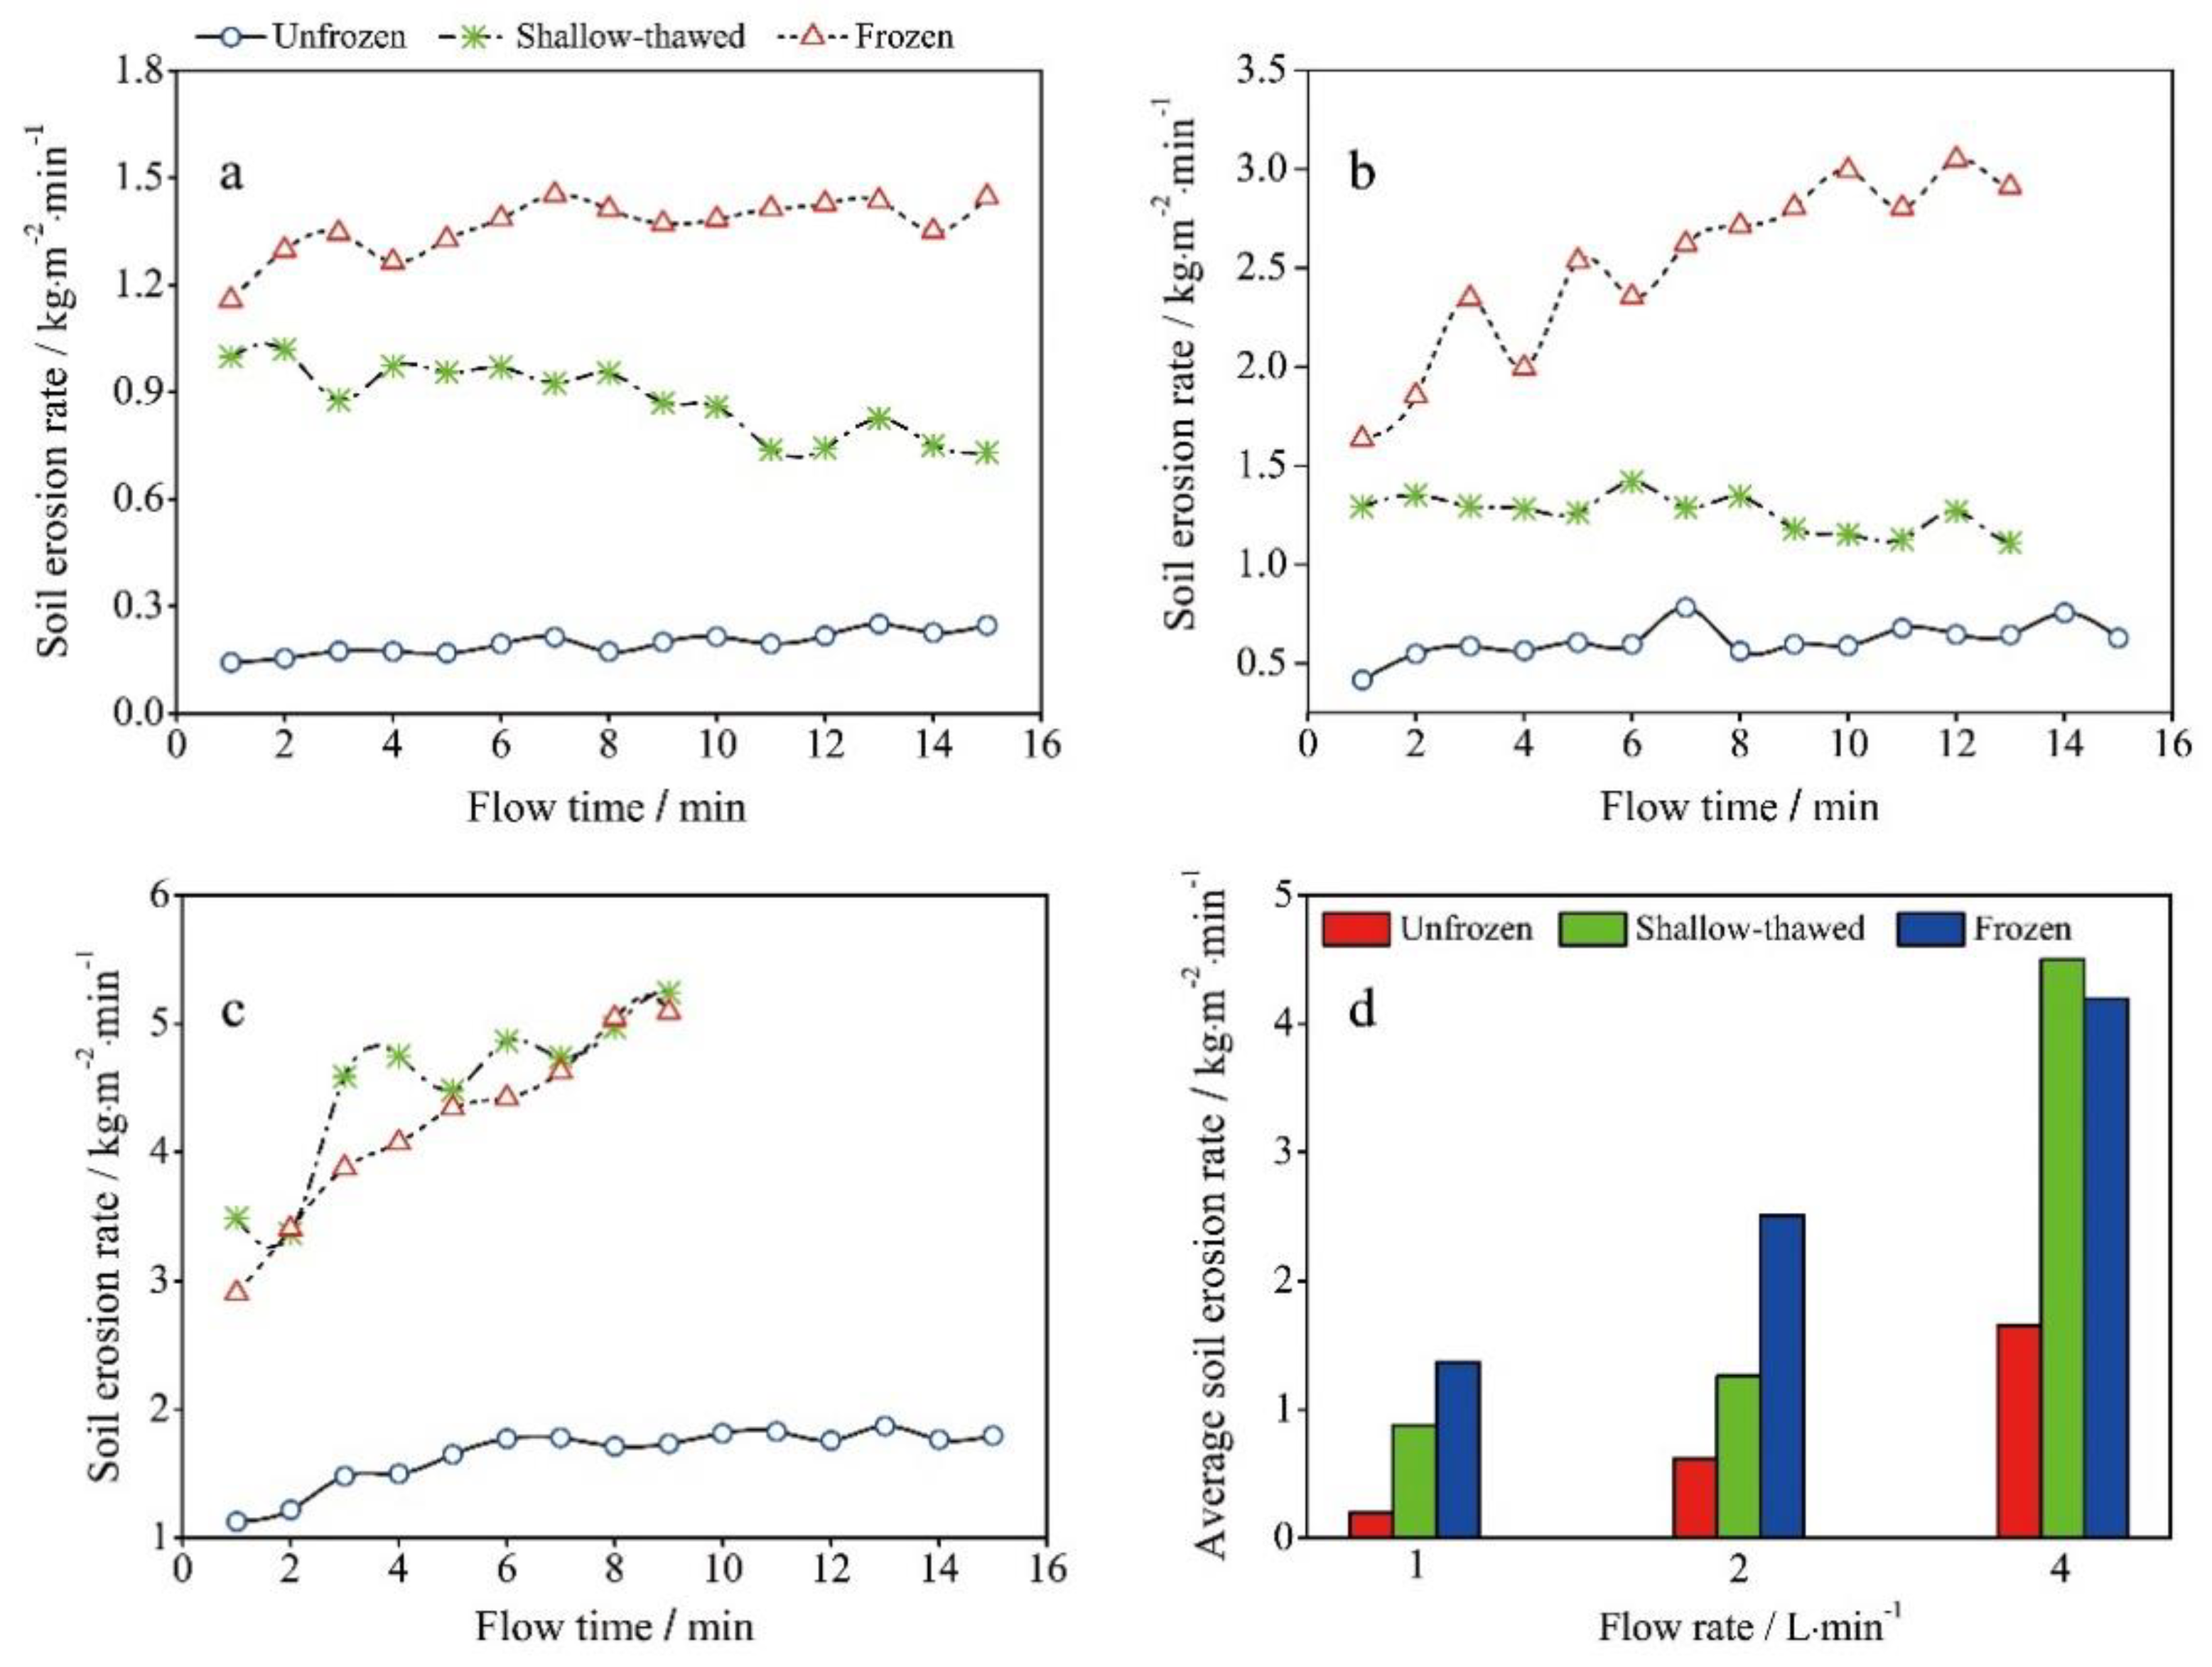
The soil erosion rate was significantly affected by the surface conformation flow rate and its interaction. The changing tendencies of the soil erosion rate were the most dramatic over the frozen slopes compared to those over unfrozen and shallow-thawed slopes at the same flow rate. With time, the soil erosion rate showed a rising trend over unfrozen and frozen slopes for different flow rates. However, the variation tendency of the soil erosion rate appeared to decrease with time on the shallow-thawed slopes, except for the flow rate of 4 L/min (Figure 3c).
A histogram of the average soil erosion rate illustrated that, at the same flow rate, the maximum average soil erosion rate was produced on the frozen slopes, except at 4 L/min, and the minimum average soil erosion rates occurred on the unfrozen slopes (Figure 3d). The average soil erosion rate of the unfrozen slope was compared with the shallow-thawed and frozen slopes. The ratio values are shown in Table 1. The maximum value, which occurred at 1 L/min, was 4.48 between the shallow-thawed and unfrozen slopes. The minimum value, which occurred at 2 L/min, was 2.05 between the shallow-thawed and unfrozen slopes. However, the ratio between the frozen and unfrozen slopes experienced a declining trend with increasing flow rate. At the same flow rate, the shallow-thawed and frozen slopes produced a mean value of 3.08 and 4.53 times the average soil erosion rates of the unfrozen slope, respectively (Table 1).
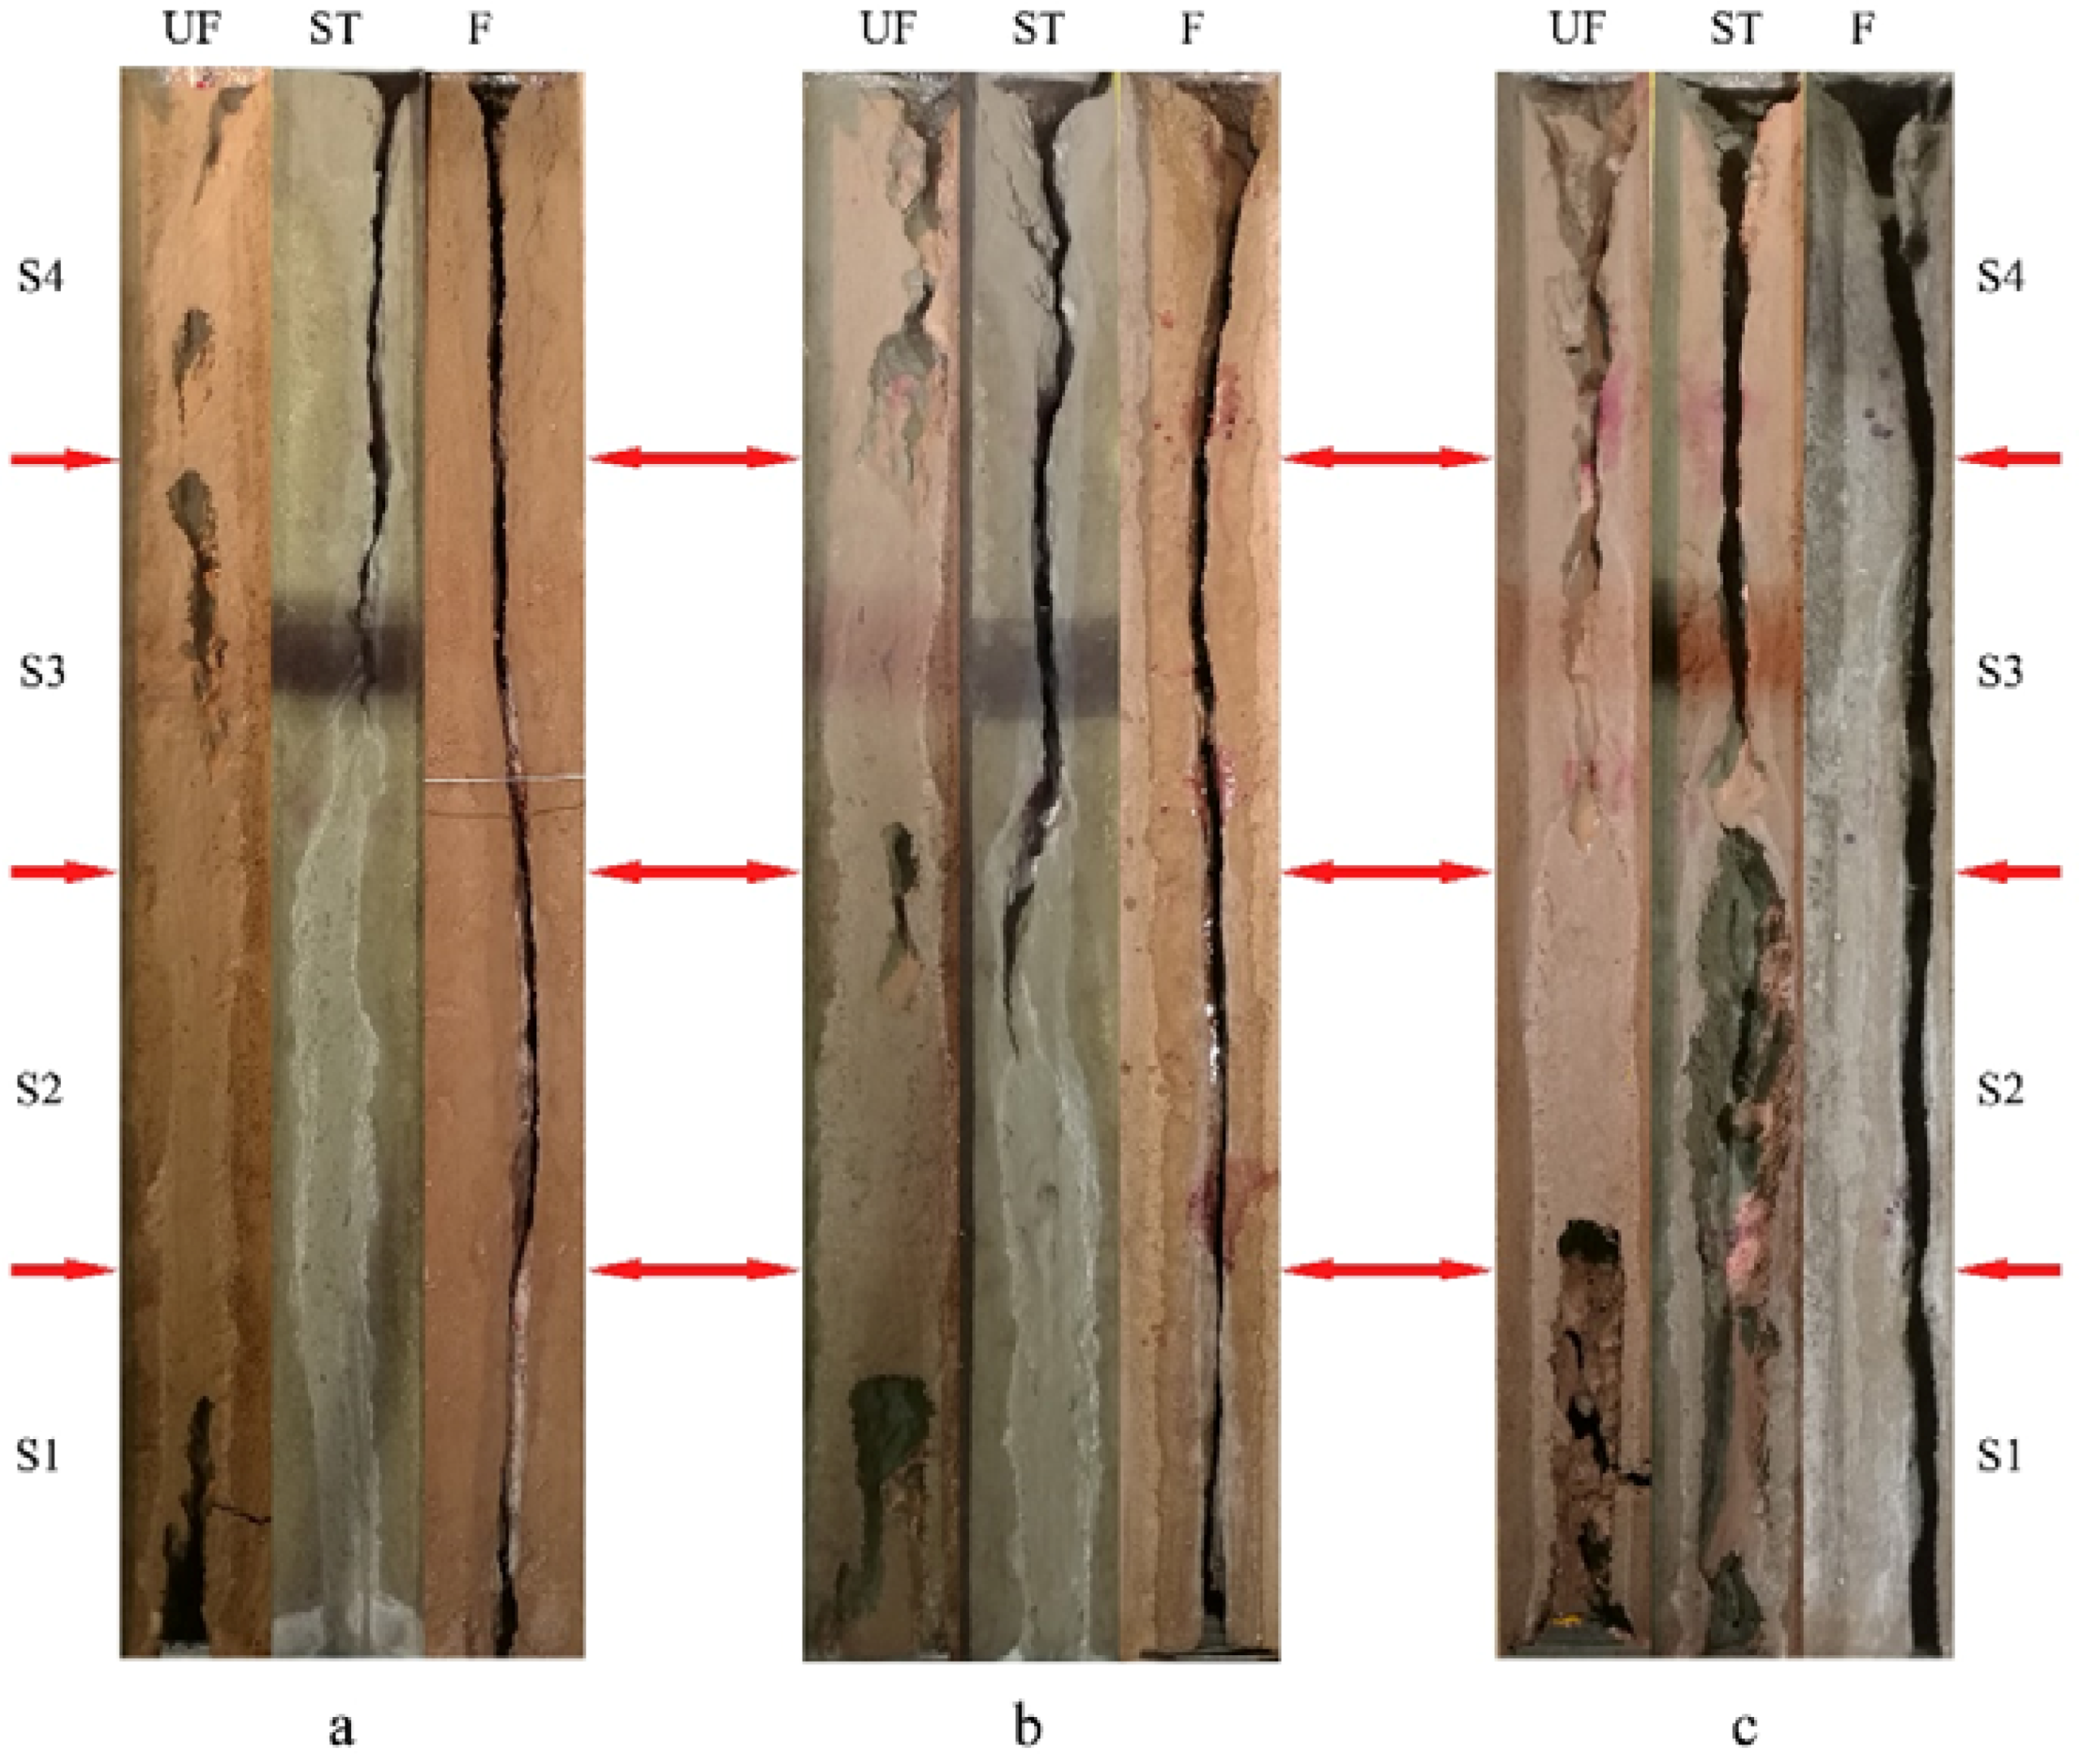
Figure 4 shows the eroded topography for the different soil surfaces and flow rates, which experience significant differences in the surface morphology. Comparing the different soil conditions, a significant difference in the rill patterns was found at the same flow rate. The number of rills on the unfrozen soil slope was 4, 3, and 2 under the flow rate of 1, 2, and 4 L/min, respectively. The values for the number of rills in the thawed-shallow and frozen soil slope were all 1 under the flow rate of 1, 2, and 4 L/min. The rill displayed disconnected distribution patterns on the unfrozen slope, but a connected rill occurred on the shallow-thawed and frozen slopes (Figure 4). During the experimental processes, the rill formation on the unfrozen slope was obviously different from that of the shallow-thawed and frozen slopes. For the unfrozen slope, the rill initially developed on the slope top and bottom, which extended to the slope middle at the same time. However, the rill initially only developed on the slope top and gradually extended to the slope bottom for the shallow-thawed and frozen slopes. The rill length had the following order (Figure 4 and Table 2): unfrozen < shallow-thawed < frozen slopes. The largest mean rill width occurred on the unfrozen slope. The mean rill width that occurred on the shallow-thawed slopes was smaller than that on the frozen slopes, except at 4 L/min (Figure 4 and Table 2). The average rill widths on the unfrozen soil slope were 4.26 cm, 5.29 cm, and 6.13 cm under the flow rate of 1, 2, and 4 L/min, respectively, which increased by 1.87 cm as the flow rate increased from 1 L/min to 4 L/min. The average rill widths on the thawed-shallow soil slope were 2.24 cm, 3.01 cm, and 6.62 cm under the flow rate of 1, 2, and 4 L/min, respectively, which increased by 4.38 cm as the flow rate increased from 1 L/min to 4 L/min. The average rill widths on the thawed-shallow soil slope were 2.37 cm, 3.47 cm, and 3.98 cm under the flow rates of 1, 2, and 4 L/min, respectively, which increased by 1.68 cm as the flow rate increased from 1 L/min to 4 L/min.
Different flow rates resulted in significant differences in rill topography on the same slope. For the unfrozen slope, the length and width of the rill gradually became larger with the increasing flow rate. Comparing S3 and S4 of the unfrozen slope, the rills became connected and extended the slope bottoms when the flow rate ranged from 1 to 4 L/min (Figure 4 and Table 2). For the slope bottom rill on the unfrozen slope, the length gradually increased with the increasing flow rate. S2 of the unfrozen slope developed almost no rill. The rill head gradually extended to the shallow-thawed slope bottom and the rill also became wider when the flow rate ranged from 1 to 4 L/min (Figure 4 and Table 2). However, the rill development on the frozen slope was completely different from that of the unfrozen and shallow-thawed slopes. The rill was instantly connected when the water flowed from the top to the bottom on the frozen slope. The same features of rill formation were present on the frozen slope under different flow rates. There was no significant difference in the rill length on the frozen slope under different flow rates (p > 0.05). The average rill width on the frozen slope was 2.37 cm (1 L/min) < 3.47 cm (2 L/min) < 3.98 cm (4 L/min).
3.2. Variation of the Runoff Energy Consumption over Unfrozen, Shallow-Thawed, and Frozen Slopes
3.2.1. Variation of the Runoff Energy Consumption
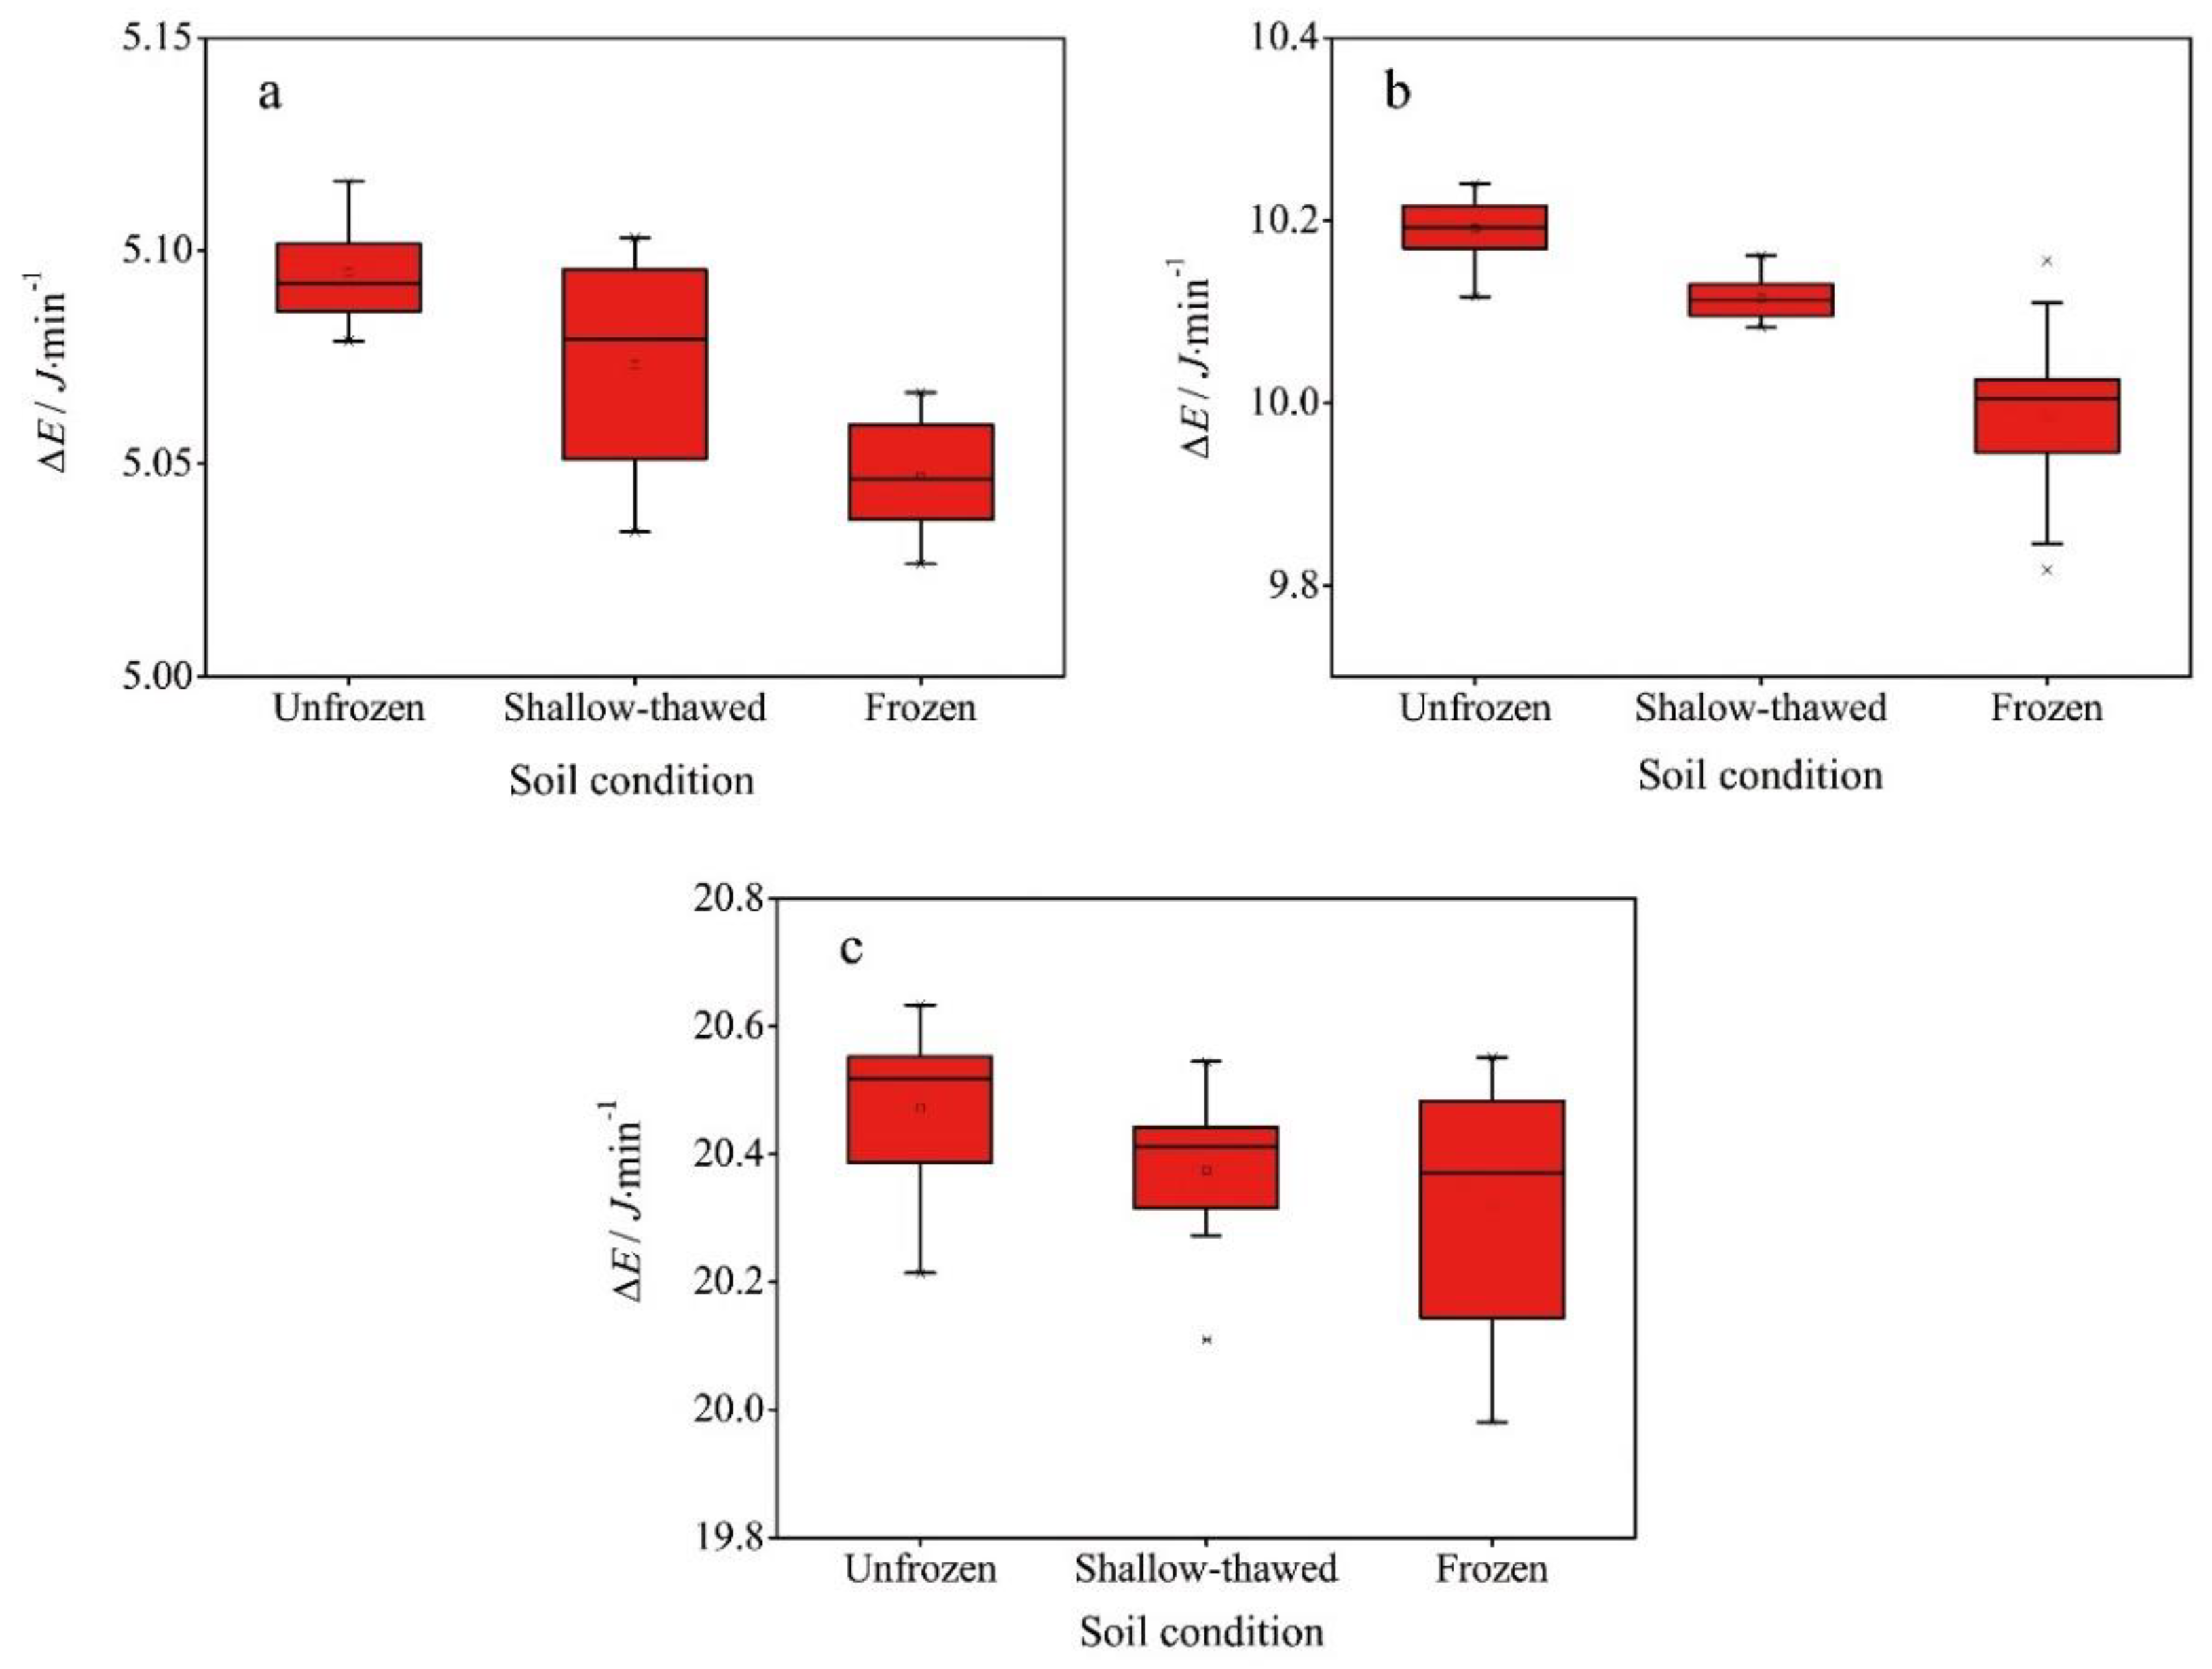
The runoff energy consumption on the unfrozen, shallow-thawed, and frozen slopes for different hydraulic conditions was analyzed. From Figure 5, the box plot shows that the runoff energy consumption value for the different surface conditions ranged from unfrozen > shallow-thawed > frozen slopes at the same flow rate. The runoff energy consumption increased significantly with increasing flow rate (Table 3).
The maximum, minimum, and runoff energy consumptions all reached the greatest values (20.63, 20.61, and 20.47 J/min, respectively) during the flow process under a high flow rate of 4 L/min on the unfrozen slope (Table 3). The results showed that the higher the flow rate, the higher the runoff energy consumption on the slope. During the experimental process, the greatest and least runoff energy consumption occurred on the unfrozen and frozen slopes, respectively (Table 3).
3.2.2. Spatial Distribution of Runoff Energy Consumption
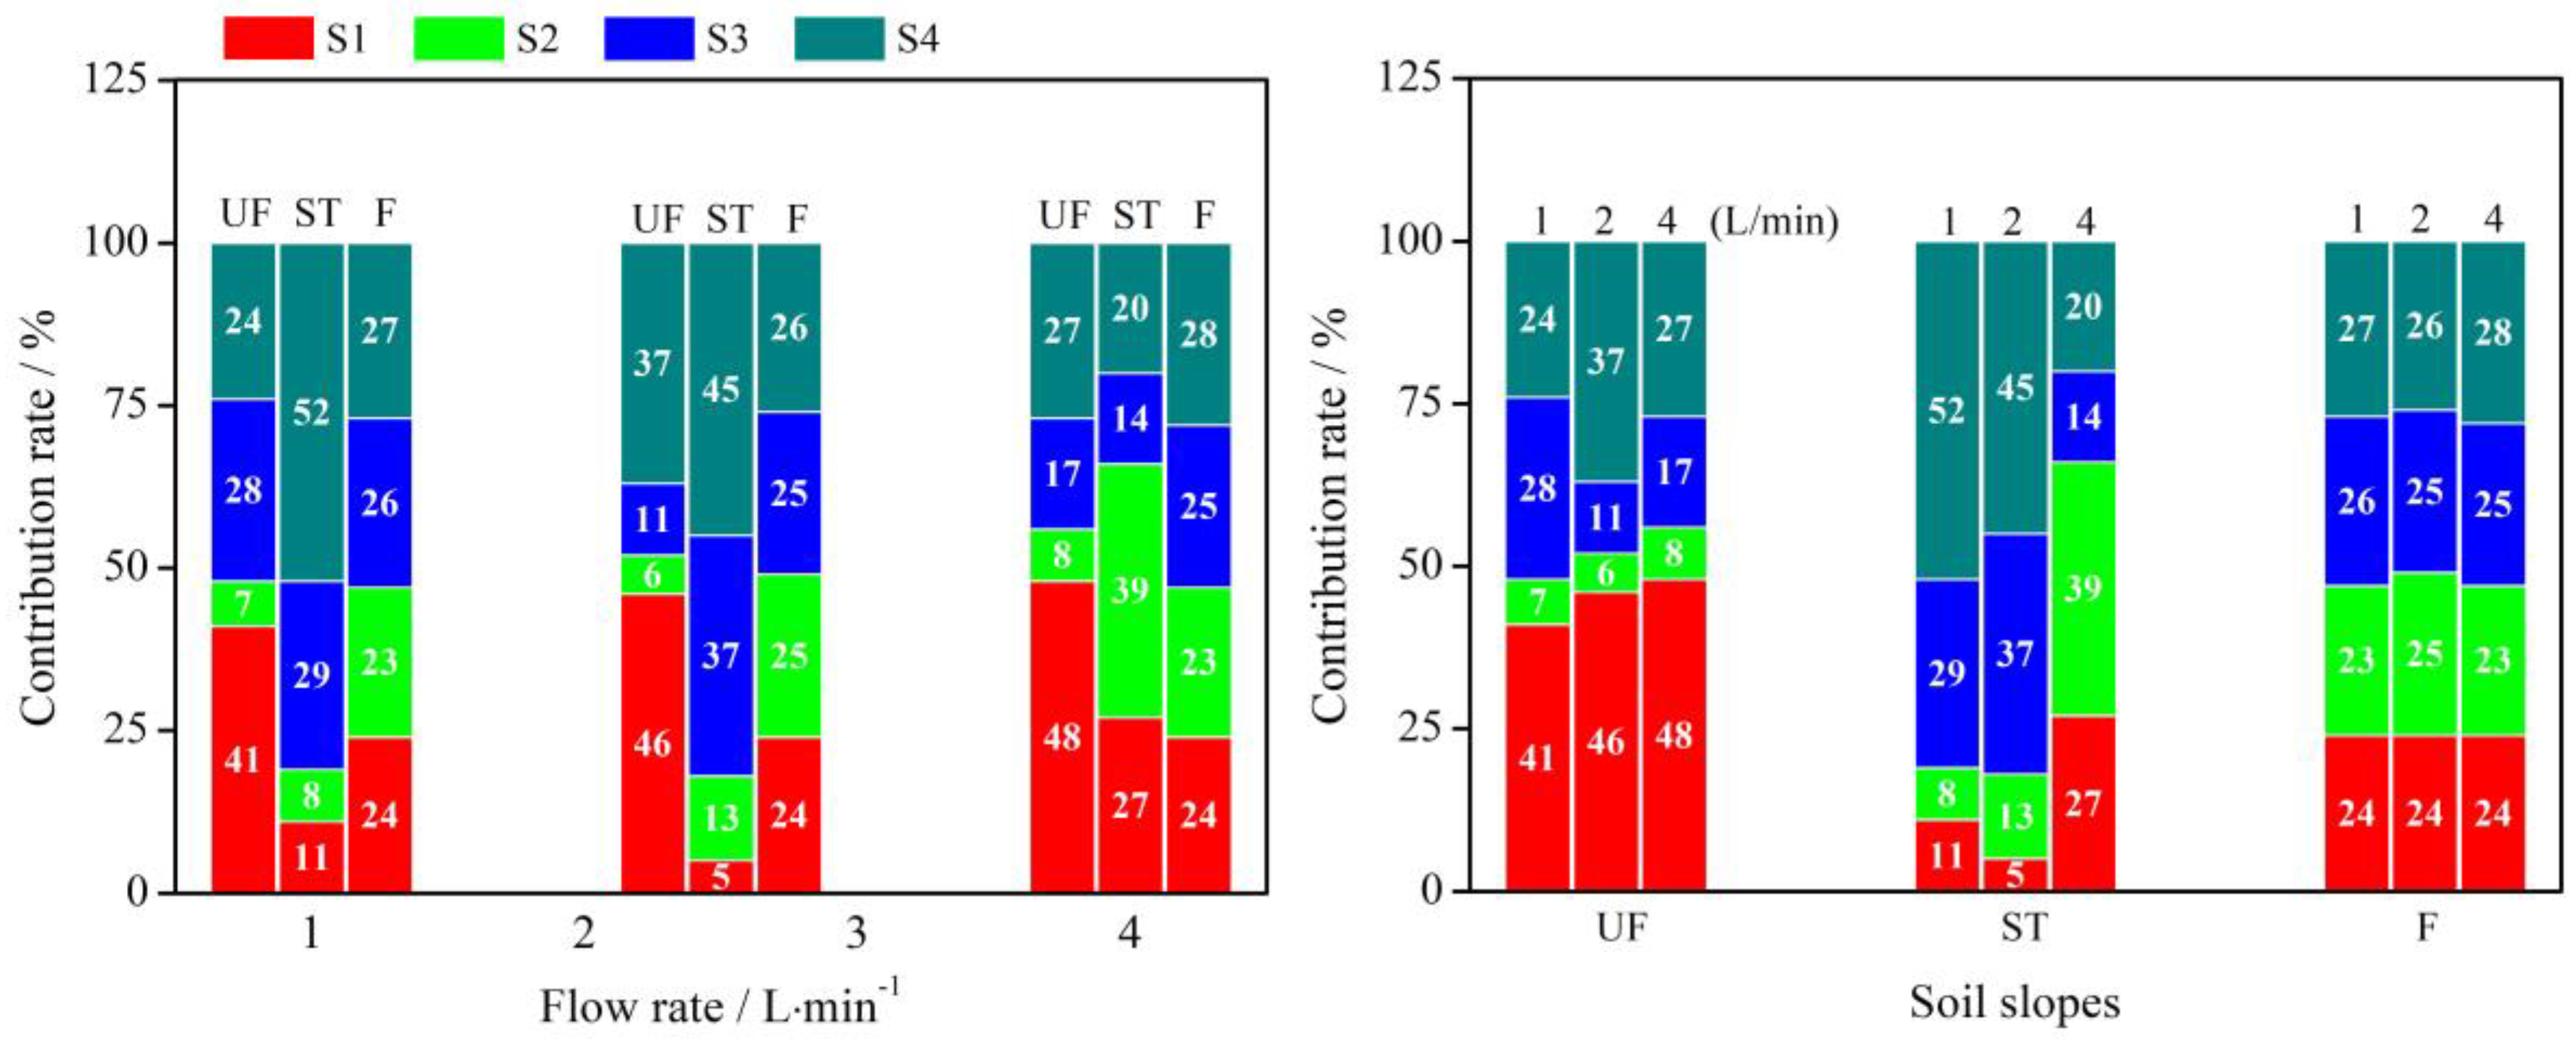
The runoff energy consumption was calculated at every section during the experiment. The histogram illustrates the runoff energy consumption contribution at four sections under different soil conditions and flow rates (Figure 6).
There was a significant difference in the runoff energy consumption contribution over different slopes at the same flow rate. When the flow rate was 1 L/min, the unfrozen, shallow-thawed, and frozen slopes experienced the greatest runoff energy consumption contributions of 41% (S1), 52% (S4), and 27% (S4), respectively (Figure 6 and Table 4). The lowest runoff energy consumption contributions over the unfrozen, shallow-thawed, and frozen slopes were 7% (S2), 8% (S2), and 23% (S2) under the flow rate of 1 L/min (Figure 6 and Table 4). The ranges of the runoff energy consumption contributions on the unfrozen, shallow-thawed, and frozen slopes were 34%, 44%, and 4% at 1 L/min, respectively. For the unfrozen slope, the total runoff energy consumption contribution of S1 and S3 was 69% at 1 L/min. S3 and S4 on the shallow-thawed slope contributed a total of 81% runoff energy consumption at 1 L/min. When the flow rate was 2 L/min, the runoff energy consumption contribution pattern was different from the flow rate of 1 L/min on the unfrozen slope. The runoff energy consumption contribution of 83% was from the total of S1 (46%) and S4 (37%). For the shallow-thawed slope, S3 and S4 contributed, in total, 82% of the runoff energy consumption.
When the flow rate was 2 L/min, the greatest runoff energy consumption contributions for the unfrozen, shallow-thawed, and frozen slopes were 46% (S1), 45% (S4), and 26% (S4), respectively, and the lowest runoff energy consumption contributions were 6% (S2), 5% (S1), and 24% (S4), respectively. The runoff energy consumption contribution ranges on the unfrozen, shallow-thawed, and frozen slopes were 40%, 40%, and 2% at 2 L/min, respectively. The patterns of the runoff energy consumption contribution at 4 L/min were similar to those at 2 L/min, with the exception of the shallow-thawed slope. The runoff energy consumption contribution of 75% on the unfrozen slope came from S1 (48%) and S4 (27%) at 4 L/min. The runoff energy consumption contribution of 66% on the shallow-thawed slope came from S1 (27%) and S2 (39%) at 4 L/min. The runoff energy consumption contribution ranges for the unfrozen, shallow-thawed, and frozen slopes were 40%, 25%, and 5%, respectively, at 2 L/min.
The contributions of runoff energy consumption for the same slope under different flow rates are shown in Figure 6. The greatest and lowest contributions of runoff energy consumption occurred at S1 and S2 for the unfrozen slope. The greatest contribution of the runoff energy consumption increased when the flow rate increased from 1 to 4 L/min. The contributions ranked in order from largest to smallest were: S1 > S3 > S4 > S2 for 1 L/min; S1 > S4 > S3 > S2 for 2 L/min; and S1 > S3 > S4 > S2 for 4 L/min on the unfrozen slope. Differing from the contribution pattern on the unfrozen slope, the shallow-thawed slope had its greatest value in S4 at 1 and 2 L/min. However, the greatest contribution was found in S2 on the shallow-thawed slope at 4 L/min, which was different from 1 and 2 L/min. As the flow rate increased, the greatest contribution of the runoff energy consumption exhibited a gradual downward trend. The contributions were, in order of the greatest to smallest: S4 > S3 > S1 > S2 for 1 L/min; S4 > S3 > S2 > S1 for 2 L/min; and S2 > S1 > S4 > S3 for 4 L/min, on the shallow-thawed slope. There was a significant difference in the runoff energy consumption contributions on the frozen slope when compared with the unfrozen and shallow-thawed slopes. The difference in the runoff energy contribution for each section was less than 5% at the different flow rates, which indicated that there was no significant difference between any sections on the frozen slope.
3.3. Relationship between the Soil Erosion Rate and Runoff Energy Consumption
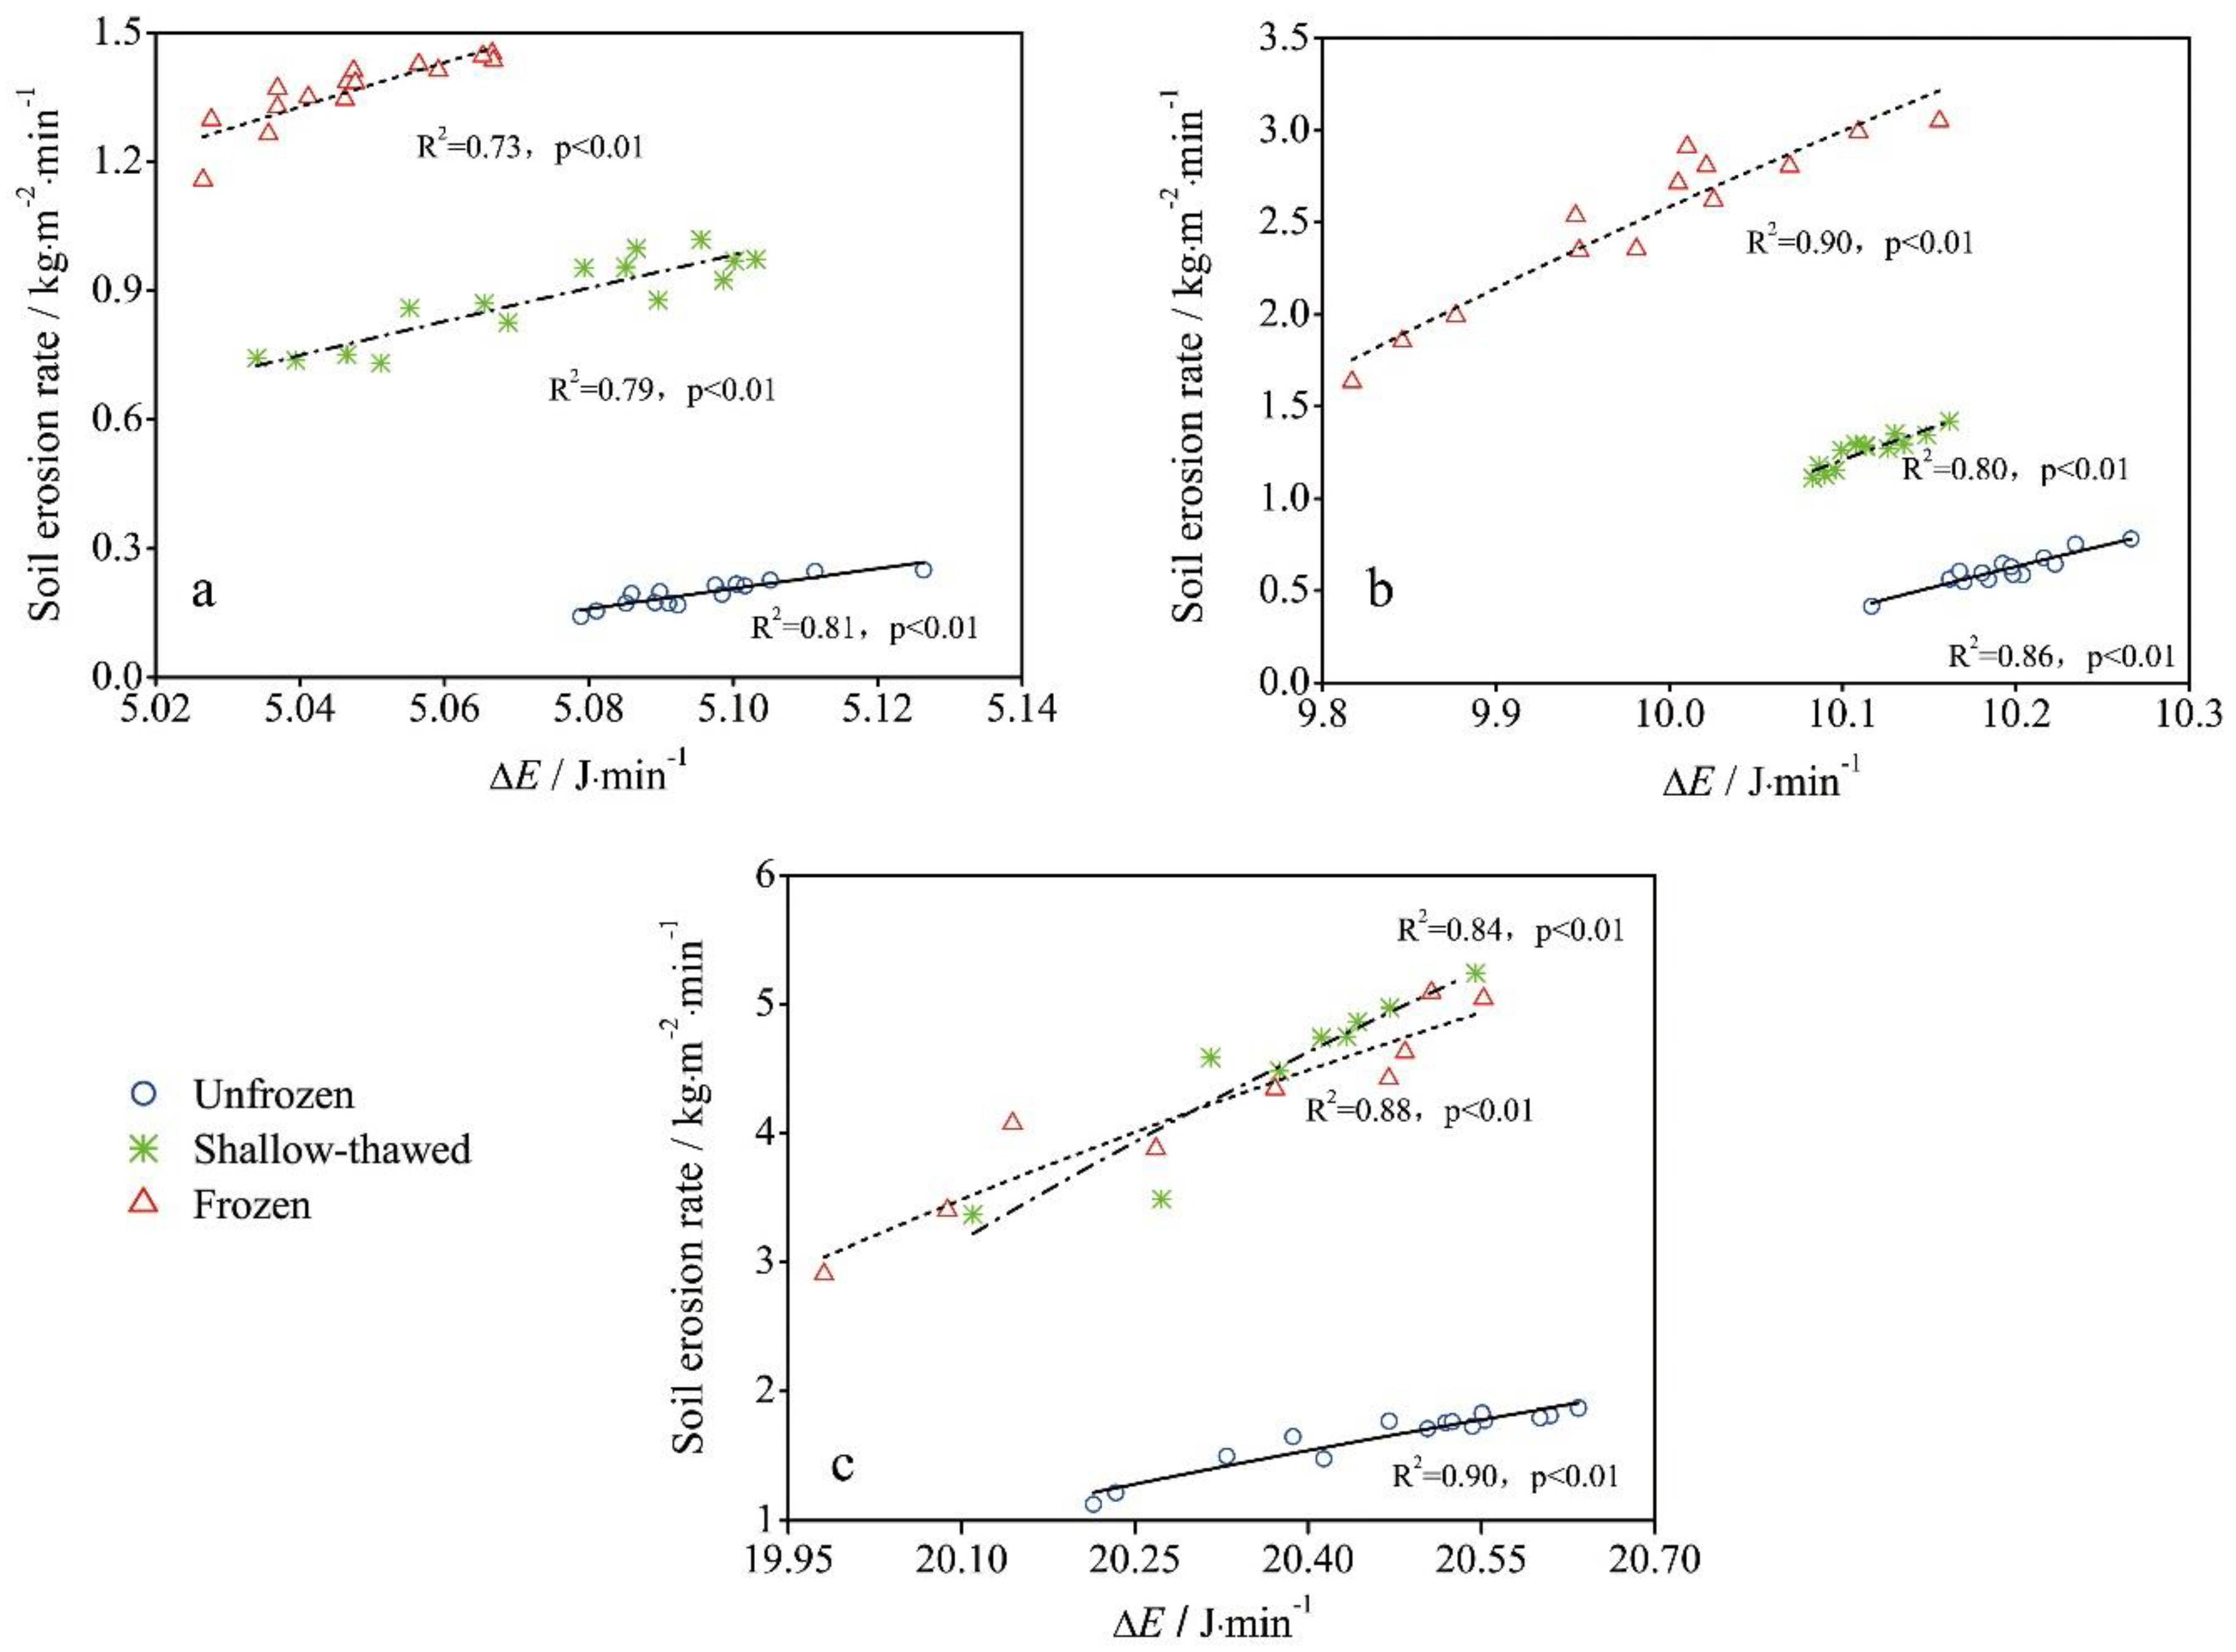
The rill erosion processes were regressed with a mathematical model to relate the soil erosion rate processes to the runoff energy consumption. The relationship between the soil erosion rate and runoff energy consumption was determined using the following model:
where S is the soil erosion rate (kg/m2·min); A is the sediment yield capacity (kg/J); and B is the critical runoff energy consumption (J/min). The physical meanings of the coefficients in the function are as follows: A is a characteristic of the soil detachment capacity dependent on the runoff energy consumption, which does not change with external force; and B is the lowest runoff energy consumption promoting soil detachment, which will vary with the external force. Regression coefficients A and B are shown in Table 5. Determination parameter R2 and correlation test parameter p are presented in Figure 7.
The regression results shown in Figure 7 imply that all of the determination coefficients (R2) were high (ranging from 0.73 to 0.98) and the correlation was significant at the 0.05 and 0.01 levels, which suggests that the model provided a good fit to the experimental data. These findings indicate that the equation based on the runoff energy consumption could forecast the soil erosion rate well for different experimental conditions.
4. Discussion
4.1. Effect of the Freeze and Flow Rate on the Runoff Energy Consumption and Sediment Transport
Figure 3 and Table 1 indicate the high variation of the soil erosion rate changes for high flow rates, which is in agreement with other research findings [3,32,33]. Flow energy, which is expressed by the energy of the runoff water expenditure on the soil surface, is able to reflect the effects of these sub-processes by altering the energy distribution for the detachment and transport of soil materials [55,56]. Therefore, the process of sediment transport is accompanied by runoff energy consumption. A lower infiltration capacity [57,58,59] and smooth surface [32,60] gave the frozen layer a higher runoff mass and flow velocity. Furthermore, the rill morphology affected the runoff energy [3,32,33,61]. Zhang et al. [33] found that the rill wall, which resulted from the penetration of unconnected rills, could obviously decrease the flow velocity. Ban et al. [32] found that headcuts caused localized ‘‘waterfalls”, which were responsible for the non-increasing rill flow velocity. Xiao et al. [3] observed that the runoff energy would be consumed due to pools found during the rill development. From Figure 4, many pools, headcuts, and rill walls were found on the unfrozen slope. The shallow-thawed slope only developed unconnected rills and rill walls. The frozen slope did not develop pools, headcuts, or rill walls, which was in agreement with Ban et al. [32]. Therefore, the frozen slope had a higher flow energy during the experimental processes as a higher runoff energy indicates lower energy consumption during the experiment, frozen soil requires less energy to overcome the frictional force and headcuts when compared with thawed soil, and a larger water flow energy is necessary to maintain a higher flow velocity. This condition resulted in excess energy from water flow on frozen soil depths, potentially increasing sediment delivery. In this experiment, the shallow-thawed and frozen slopes all had a frozen layer, which implied that the runoff masses, in order from largest to smallest, were: frozen > shallow-thawed > unfrozen.
The soil erosion rate for the three slopes, ranging from largest to smallest, were: frozen > shallow-thawed > unfrozen (Figure 3 and Table 1). Previously frozen soil is highly susceptible to riling even from low intensity rainfall and runoff [29], which could occur during much of the Prince Edward Island cool period [62]. Under the same flow conditions, the thawed soil rill transports more sediment than the unfrozen soil rill [6,60]. However, the soil erosion rate on the shallow-thawed slope becomes stronger than that on other slopes at 4 L/min. At the lower rate, lower energy only experienced rill down vertical development. However, the thawed soil layer underwent horizontal development and the frozen soil rill kept developing vertically down for the shallow-thawed soil layer at the higher flow rate. Therefore, the sediment yield for a shallow-thawed slope with the two kinds of soil structures was larger than that of the frozen slope under the flow rate of 4 L/min. Chaplot [12] reported that higher gully bank retreat values were observed at narrow gullies as the collapsed material from narrow gullies is easily evacuated due to its proximity to the channel flow. Compared with this study, a higher soil erosion rate occurred on the frozen slope at the same flow rate, and the rill width of the frozen slope was also the narrowest in the same flow condition. The erosion mechanism was different between Chaplot’s research and this research, though high erosion rates were observed at the narrow rill. The frozen slope had a higher runoff energy to detach and transport sediments. The runoff energy consumption was significantly affected by the topography, flow rate, and sediment yield. The equation showed that mass runoff had a significant correlation with the energy consumption, and larger runoff generated greater energy consumption during the erosion process (Table 5). Complicated topography resulting from serious erosion under a high flow rate consumes more energy, which then requires more total energy consumption to transport the sediment. Therefore, the critical runoff energy consumption becomes greater as the flow rate increases.
4.2. Prediction of the Spatial Distribution of Sediment Depending on the Runoff Energy Consumption
For slope erosion, any section of the soil erosion rate is difficult to measure directly. In contrast, the flow velocity and runoff volume can be measured easily and accurately. The soil erosion rate has a significant relationship with the runoff energy consumption (p < 0.05). This practical aspect implies that the soil erosion rate can be predicted by the runoff energy consumption.
The spatial distribution of the runoff energy consumption depends on the slope condition under the same flow rate. Results from Figure 6a and Table 4 show that the runoff energy consumption was mainly produced down slope for the unfrozen slope and was produced on the upper slope for the shallow-thawed case. For the frozen slope, the range of the spatial distribution changed within 5% (Table 4) and was the average for the four sections. As a result, this implied that soil erosion rates were mainly sourced from the unfrozen down slope, shallow-thawed upper slope, and frozen full slope. The spatial distribution of the soil erosion rate depends on the runoff energy runoff loss and is in agreement with the practical erosion distribution shown in Figure 4. In accordance with the sediment pattern distribution, some retained measures like vegetation should be carried out to transfer runoff energy consumption and prevent scouring erosion.
On the same slope, the flow rate dominated the spatial distribution of the runoff energy consumption. For the unfrozen slope, the runoff energy consumption of S4 and S1 increased as the flow rate increased, which indicated that the erosion of S4 and S1 also increased with the flow rate (Figure 6). The scouring erosion continued to extend as the rill head and upper rill were gradually connected due to an increasing flow rate for the unfrozen slope (Figure 4). The connected rill uses more runoff energy to transport the sediment [33]. For the shallow-thawed slope, the contribution of the runoff energy consumption on S4 gradually decreased with the increasing flow rate (Figure 6), which indicated that the sediment transport capacity became stronger in the other sections. The shallow-thawed slope did not experience scouring erosion. The connected rill from the upper slope gradually extended to the down slope (Figure 4), which implied that the erosion contribution increased from top to bottom as the flow rate increased. For the frozen slope, the contribution of runoff energy consumption did not change with the variation of the flow rate, and the distribution was almost equal for each section. Combined with Figure 6, the results implied that the erosion contribution should be almost equal at each section for the same flow rate. Therefore, appropriate measures should be taken to decrease erosion based on the sediment distribution. For the unfrozen slope, measures should be taken at the bottom slope to prevent scouring erosion under a lower flow rate, and at both the top and bottom slopes, measures should be taken under higher flow rates. For the shallow-thawed and frozen slope, measures should only be implemented on the top slope to consume the runoff energy.
5. Conclusions
In this study, the response of the freeze-thaw soil erosion rate to runoff energy consumption was investigated by rill flow under combinations of three flow rates (1, 2, and 4 L/min) and three soil conditions (unfrozen, shallow-thawed, and frozen). The spatial distribution of erosion along the slope was predicted based on the runoff energy consumption. The spatial distribution of erosion along the slope was predicted based on the runoff energy consumption. The results showed that the shallow-thawed and frozen slope produced a mean value of 3.08 and 4.53 times the average soil erosion rate compared to that on the unfrozen slope at the same flow rate, respectively. The width of the rill gradually became larger as the flow rate increased under different soil slopes. There was no significant difference in the rill length on the frozen slope under different flow rates (p > 0.05). The runoff energy consumption in order showed unfrozen > shallow-thawed > frozen slopes at the same flow rate, and runoff energy consumption increased with the increasing flow rate. The runoff energy consumption of the water-carrying section changed linearly with the soil erosion rate. The spatial distribution of the runoff energy implied that soil erosion rates were mainly sourced from the unfrozen down slope, shallow-thawed upper slope, and frozen full slope.
These findings improve our understanding of the effect of freeze-thaw and flow rate on erosion processes and runoff energy consumption for assessing the erosion model for meltwater erosion. These results were only based on one soil type, so varying responses to the soil erosion rate by meltwater-concentrated flow should be investigated in the future.
Author Contributions
T.W. and P.L. conceived the main idea of this paper. J.H., Z.L., Z.R., S.C., Y.S., and F.W. designed and performed the experiment. T.W. wrote the manuscript and all authors contributed to improving the paper.
Funding
This research was supported by the National Key Research and Development Program of China (No. 2016YFC0402404), the National Natural Science Foundations of China (Nos. 51779204, 51609196, 41601291 and 41731289), the Consultation and Evaluation Project of the Chinese Academy of Sciences (No. 2018-Z02-A-008), and the School Foundation of Xi’an University of Technology (No. 310-252071711).
Acknowledgments
We thank the reviewers for their useful comments and suggestions.
Conflicts of Interest
The authors declare no conflict of interest.
Abbreviations
The following abbreviations are used in this manuscript:
| FT | Freeze-Thaw |
| UF | Unfrozen |
| ST | Shallow-Thawed |
| F | Frozen |
References
- Shi, H.; Shao, M. Soil and water loss from the loess plateau in China. J. Arid Environ. 2000, 45, 9–20. [Google Scholar] [CrossRef]
- Tang, K.L. Soil Erosion in the Loess Plateau. Soil and Water Conservation in China; Chinese Science Press: Beijing, China, 2004; pp. 194–207. (In Chinese) [Google Scholar]
- Xiao, H.; Liu, G.; Liu, P.; Zheng, F.; Zhang, J.; Hu, F. Response of soil erosion rate to the hydraulic parameters of concentrated flow on steep loessial slopes on the Loess Plateau of China. Hydrol. Process. 2017, 31, 2613–2621. [Google Scholar] [CrossRef]
- Wang, S.J. Characteristics of freeze and thaw weathering and its contribution to sediment yield in middle Yellow River Basin. Bull. Soil Water Conserv. 2004, 24, 1–5. (In Chinese) [Google Scholar]
- Li, Q.; Liu, G.B.; Xu, M.X.; Sun, H.; Zhang, Z.; Gao, L.Q. Effect of seasonal freeze-thaw on soil anti-scouribility and its related physical property in hilly loess plateau. Trans. Chin. Soc. Agric. Eng. 2013, 29, 105–112. (In Chinese) [Google Scholar]
- Wang, T.; Li, P.; Ren, Z.; Xu, G.; Li, Z.; Yang, Y.; Yao, J. Effects of freeze-thaw on soil erosion processes and sediment selectivity under simulated rainfall. J. Arid Land 2017, 9, 234–243. [Google Scholar] [CrossRef]
- Emmanuel, J.G.; Douglas, W.B.; Beth, P.S. Modern erosion rates in the High Himalayas of Nepal. Earth Planet. Sci. Lett. 2008, 267, 482–494. [Google Scholar]
- Barnes, N.; Luffman, I.; Nandi, A. Gully erosion and freeze-thaw processes in clay-rich soils, northeast Tennessee, USA. GeoResJ 2016, 9, 67–76. [Google Scholar] [CrossRef]
- Zhang, B.; Xiong, D.; Zhang, G.; Zhang, S.; Wu, H.; Yang, D.; Xiao, L.; Dong, Y.; Su, Z.; Lu, X. Impacts of headcut height on flow energy, sediment yield and surface landform during bank gully erosion processes in the Yuanmou Dry-hot Valley region, southwest China. Earth Surf. Process. Landf. 2018, 43, 2271–2282. [Google Scholar] [CrossRef]
- Vandekerckhove, L.; Poesen, J.; Oostwoud Wijdenes, D.; Gyssels, G. Shortterm bank gully retreat rates in Mediterranean environments. Catena 2001, 44, 133–161. [Google Scholar] [CrossRef]
- Chaplot, V.; Brown, J.; Dlamini, P.; Eustice, T.; Janeau, J.-L.; Jewitt, G.; Lorentz, S.; Martin, L.; Nontokozo-Mchunu, C.; Oakes, E.; et al. Rainfall simulation to identify the storm-scale mechanisms of gully bank retreat. Agric. Water Manag. 2011, 98, 1704–1710. [Google Scholar] [CrossRef] [Green Version]
- Chaplot, V. Impact of terrain attributes, parent material and soil types on gully erosion. Geomorphology 2013, 186, 1–11. [Google Scholar] [CrossRef]
- Bernatek-Jakiel, A.; Wrońska-Wałach, D. Impact of piping on gully development in mid-altitude mountains under a temperate climate: A dendrogeomorphological approach. Catena 2018, 165, 320–332. [Google Scholar] [CrossRef]
- Fox, G.A.; Willson, G.V. The role of subsurface flow in hillslope and stream bank erosion: A review. Soil Sci. Soc. Am. J. 2010, 74, 717–733. [Google Scholar] [CrossRef]
- Sofia, G.; Di Stefano, C.; Ferro, V.; Tarolli, P. Morphological Similarity of channels: from linear erosional features (Rill, Gully) to Alpine rivers. Land Degrad. Dev. 2017, 28, 1717–1728. [Google Scholar] [CrossRef]
- Wells, R.R.; Momm, H.G.; Bennett, S.J.; Gesch, K.R.; Dabney, S.M.; Cruse, R.; Wilson, G.V. A measurement method for rill and ephemeral gully erosion assessments. Soil. Sci. Soc. Am. J. 2016, 80, 203–214. [Google Scholar] [CrossRef]
- Chen, X.Y.; Huang, Y.H.; Zhao, Y.; Ma, B.; Mi, H.X. Comparison of loess and purple rill erosions measured with volume replacement method. J. Hydrol. 2015, 530, 476–483. [Google Scholar] [CrossRef]
- Di Stefano, C.; Ferro, V.; Palmeri, V.; Pampalone, V. Flow resistance equation for rills. Hydrol. Process. 2017, 31, 2793–2801. [Google Scholar] [CrossRef]
- Tian, P.; Xu, X.; Pan, C.; Hsu, K.; Yang, T. Impacts of rainfall and inflow on rill formation and erosion processes on steep hillslopes. J. Hydrol. 2017, 548, 24–39. [Google Scholar] [CrossRef]
- Gatto, L.W. Soil freeze–thaw-induced changes to a simulated rill: Potential impacts on soil erosion. Geomorphology 2000, 32, 147–160. [Google Scholar] [CrossRef]
- Shen, H.; Zheng, F.; Wen, L.; Lu, J.; Jiang, Y. An experimental study of rill erosion and morphology. Geomorphology 2015, 231, 193–201. [Google Scholar] [CrossRef]
- Zhang, P.; Yao, W.; Tang, H.; Wei, G.; Wang, L. Laboratory investigations of rill dynamics on soils of the Loess Plateau of China. Geomorphology 2017, 293, 201–210. [Google Scholar] [CrossRef]
- Qin, C.; Zheng, F.; Wells, R.R.; Xu, X.; Wang, B.; Zhong, K. A laboratory study of channel sidewall expansion in upland concentrated flows. Soil Tillage Res. 2018, 178, 22–31. [Google Scholar] [CrossRef]
- Cerdan, O.; Le Bissonnais, Y.; Couturier, A.; Bourennane, H.; Souchère, V. Rill erosion on cultivated hillslopes during two extreme rainfall events in Normandy, France. Soil Tillage Res. 2002, 67, 99–108. [Google Scholar] [CrossRef]
- Bruno, C.; Di Stefano, C.; Ferro, V. Field investigation on rilling in the experimental Sparacia area, South Italy. Earth Surf. Process. Landf. 2008, 33, 263–279. [Google Scholar] [CrossRef]
- Wang, D.; Wang, Z.; Shen, N.; Chen, H. Modeling soil detachment capacity by rill flow using hydraulic parameters. J. Hydrol. 2016, 535, 473–479. [Google Scholar] [CrossRef]
- Zhang, Q.W.; Lei, T.W.; Zhao, J. Estimation of the detachment rate in eroding rills in flume experiments using an REE tracing method. Geoderma 2008, 147, 8–15. [Google Scholar] [CrossRef]
- Behzadfar, M.; Sadeghi, S.H.; Khanjani, M.J.; Hazbavi, Z. Effects of rates and time of zeolite application on controlling runoff generation and soil loss from a soil subjected to a freeze-thaw cycle. Int. Soil Water Conserv. Res. 2017, 5, 95–101. [Google Scholar] [CrossRef]
- Van Klaveren, R.W. Hydraulic Erosion Resistance of Thawing Soil. Ph.D. dissertation, Washington State University, Pullman, WA, USA, 1987. [Google Scholar]
- Wischmeier, W.H.; Smith, D.D. Predicting Rainfall Erosion Losses: A Guide to Conservation Planning, Agriculture Handbook No. 537; US Department of Agriculture: Washington, DC, USA, 1978; pp. 5–8.
- Frame, P.A.; Burney, J.R.; Edwards, L.M. Laboratory measurements of freeze/thaw, compaction, residue, and slope effects on rill erosion. Can. Agric. Eng. 1992, 34, 143–149. [Google Scholar]
- Ban, Y.Y.; Lei, T.W.; Liu, Z.Q.; Chen, C. Comparison of rill flow velocity over frozen and thawed slopes with electrolyte tracer method. J. Hydrol. 2016, 534, 630–637. [Google Scholar] [CrossRef]
- Zhang, L.T.; Gao, Z.L.; Yang, S.W.; Li, Y.H.; Tian, H.W. Dynamic processes of soil erosion by runoff on engineered landforms derived from expressway construction: A case study of typical steep spoil heap. Catena 2015, 128, 108–121. [Google Scholar] [CrossRef]
- Chen, X.; Huang, Y.; Zhao, Y.; Mo, B.; Mi, H.; Huang, C. Analytical method for determining rill detachment rate of purple soil as compared with that of loess soil. J. Hydrol. 2017, 549, 236–243. [Google Scholar] [CrossRef]
- Wang, Y.; Cao, L.; Fan, J.; Lu, H.; Zhu, Y.; Gu, Y.; Liang, Y. Modelling Soil Detachment of Different Management Practices in the Red Soil Region of China. Land Degrad. Dev. 2017, 28, 1496–1505. [Google Scholar] [CrossRef]
- Wu, B.; Wang, Z.; Zhang, Q.; Shen, N.; Liu, J. Modelling sheet erosion on steep slopes in the loess region of China. J. Hydrol. 2017, 553, 549–558. [Google Scholar] [CrossRef]
- Karimov, V.R.; Sheshukov, A.Y. Effects of Intra-Storm Soil Moisture and Runoff Characteristics on Ephemeral Gully Development: Evidence from a No-Till Field Study. Water 2017, 9, 742. [Google Scholar] [CrossRef]
- Wirtz, S.; Seeger, M.; Ries, J.B. Field experiments for understanding and quantification of rill erosion processes. Catena 2012, 91, 21–34. [Google Scholar] [CrossRef]
- Hairsine, P.B.; Rose, C.W. Modeling water erosion due to overland-flow using physical principles. 2. Rill flow. Water Resour. Res. 1992, 28, 245–250. [Google Scholar] [CrossRef]
- Mirzaee, S.; Ghorbani-Dashtaki, S. Deriving and evaluating hydraulics and detachment models of rill erosion for some calcareous soils. Catena 2018, 164, 107–115. [Google Scholar] [CrossRef]
- Li, Z.B.; Lu, K.X.; Ding, W.F. Experimental Study on Dynamic Processes of Soil Erosion on Loess Slope. J. Soil Water Conserv. 2002, 16, 5–7. (In Chinese) [Google Scholar]
- Cao, L.X.; Zhang, K.L.; Dai, H.L.; Guo, Z.L. Modeling soil detachment on unpaved road surfaces on the loess plateau. Trans. ASABE 2009, 54, 1377–1384. [Google Scholar] [CrossRef]
- Knapen, A.; Smets, T.; Poesen, J. Flow-retarding effects of vegetation and geotextiles on soil detachment during concentrated flow. Hydrol. Process. 2009, 23, 2427–2437. [Google Scholar] [CrossRef]
- Zhang, G.H.; Liu, B.Y.; Nearing, M.A.; Huang, C.H.; Zhang, K.L. Soil detachment by shallow flow. Trans. ASAE 2002, 45, 351–357. [Google Scholar]
- Zhang, G.H.; Liu, B.Y.; Liu, G.B.; He, X.W.; Nearing, M.A. Detachment of undisturbed soil by shallow flow. Soil Sci. Soc. Am. J. 2003, 67, 713–719. [Google Scholar] [CrossRef]
- Li, P.; Li, Z.B.; Zheng, L.Y.; Lu, K.X. Comparisons of dynamic mechanics of soil erosion and sediment yield by runoff on loess slope. J. Soil Water Conserv. 2005, 19, 66–69. (In Chinese) [Google Scholar]
- Nachtergaele, J.; Poesen, J. Spatial and temporal variations in resistance of loess derived soils to ephemeral gully erosion. Eur. J. Soil Sci. 2002, 53, 449–463. [Google Scholar] [CrossRef]
- Li, Z.W.; Zhang, G.H.; Geng, R.; Wang, H.; Zhang, X.C. Land use impacts on soil detachment capacity by overland flow in the Loess Plateau, China. Catena 2015, 124, 9–17. [Google Scholar] [CrossRef]
- Li, G.; Zheng, F.; Lu, J.; Xu, X.; Hu, W.; Han, Y. Inflow rate impact on hillslope erosion processes and flow hydrodynamics. Soil Sci. Soc. Am. J. 2016, 80, 711–719. [Google Scholar] [CrossRef]
- Wang, Y.; Fan, J.; Cao, L.; Zheng, X.; Ren, P.; Zhao, S. The influence of tillage practices on soil detachment in the red soil region of China. Catena 2018, 165, 272–278. [Google Scholar] [CrossRef]
- Starkloff, T.; Hessel, R.; Stolte, J.; Ritsema, C. Catchment hydrology during winter and spring and the link to soil erosion: A case study in Norway. Hydrology 2017, 4, 15. [Google Scholar] [CrossRef]
- Li, G.Y.; Fan, H.M. Effect of freeze-thaw on water stability of aggregates in a black soil of northeast China. Pedosphere 2014, 24, 285–290. [Google Scholar] [CrossRef]
- Xiao, L.; Zhang, Y.; Li, P.; Xu, G.; Shi, P.; Zhang, Y. Effects of freeze-thaw cycles on aggregate-associated organic carbon and glomalin-related soil protein in natural-succession grassland and Chinese pine forest on the Loess Plateau. Geoderma 2019, 334, 1–8. [Google Scholar] [CrossRef]
- Luk, S.H.; Merz, W. Use of the salt tracing technique to determine the velocity of overland flow. Soil Technol. 1992, 5, 289–301. [Google Scholar]
- Meshesha, D.T.; Tsunekawa, A.; Haregeweyn, N. Determination of soil erodibility using fluid energy method and measurement of the eroded mass. Geoderma 2016, 284, 13–21. [Google Scholar] [CrossRef]
- Zhang, Q.W.; Dong, Y.Q.; Li, F.; Zhang, A.P.; Lei, T.W. Quantifying detachment rate of eroding rill or ephemeral gully for WEPP with flume experiments. J. Hydrol. 2014, 519, 2012–2019. [Google Scholar] [CrossRef]
- Lundberg, A.; Ala-Aho, P.; Eklo, O.; Klöve, B.; Kværner, J.; Stumpp, C. Snow and frost: Implications for spatiotemporal infiltration patterns—A review. Hydrol. Process. 2016, 30, 1230–1250. [Google Scholar] [CrossRef]
- Tsutsumi, D.; Fujita, M. Field observations, experiments, and modeling of sediment production from freeze and thaw action on a bare, weathered granite slope in a temperate region of Japan. Geomorphology 2016, 267, 37–47. [Google Scholar] [CrossRef]
- Moghadas, S.; Gustafsson, A.M.; Viklander, P.; Marsalek, J.; Viklander, M. Laboratory study of infiltration into two frozen engineered (sandy) soils recommended for bioretention. Hydrol. Process. 2016, 30, 1251–1264. [Google Scholar] [CrossRef]
- Ban, Y.Y.; Lei, T.W.; Liu, Z.Q.; Chen, C. Comparative study of erosion processes of thawed and non-frozen soil by concentrated meltwater flow. Catena 2017, 148, 153–159. [Google Scholar] [CrossRef]
- Giménez, R.; Planchon, O.; Silvera, N.; Govers, G. Longitudinal velocity patterns and bed morphology interaction in a rill. Earth Surf. Process. Landf. 2004, 29, 105–114. [Google Scholar] [CrossRef]
- Alberto, A.; St-Hilaire, A.; Courtenay, S.C.; Van Den Heuvel, M.R. Monitoring stream sediment loads in response to agriculture in Prince Edward Island, Canada. Environ. Monit. Assess. 2016, 188, 415. [Google Scholar] [CrossRef] [PubMed]
Figure 1.
Schematic diagram of the simulated concentrated flow system.

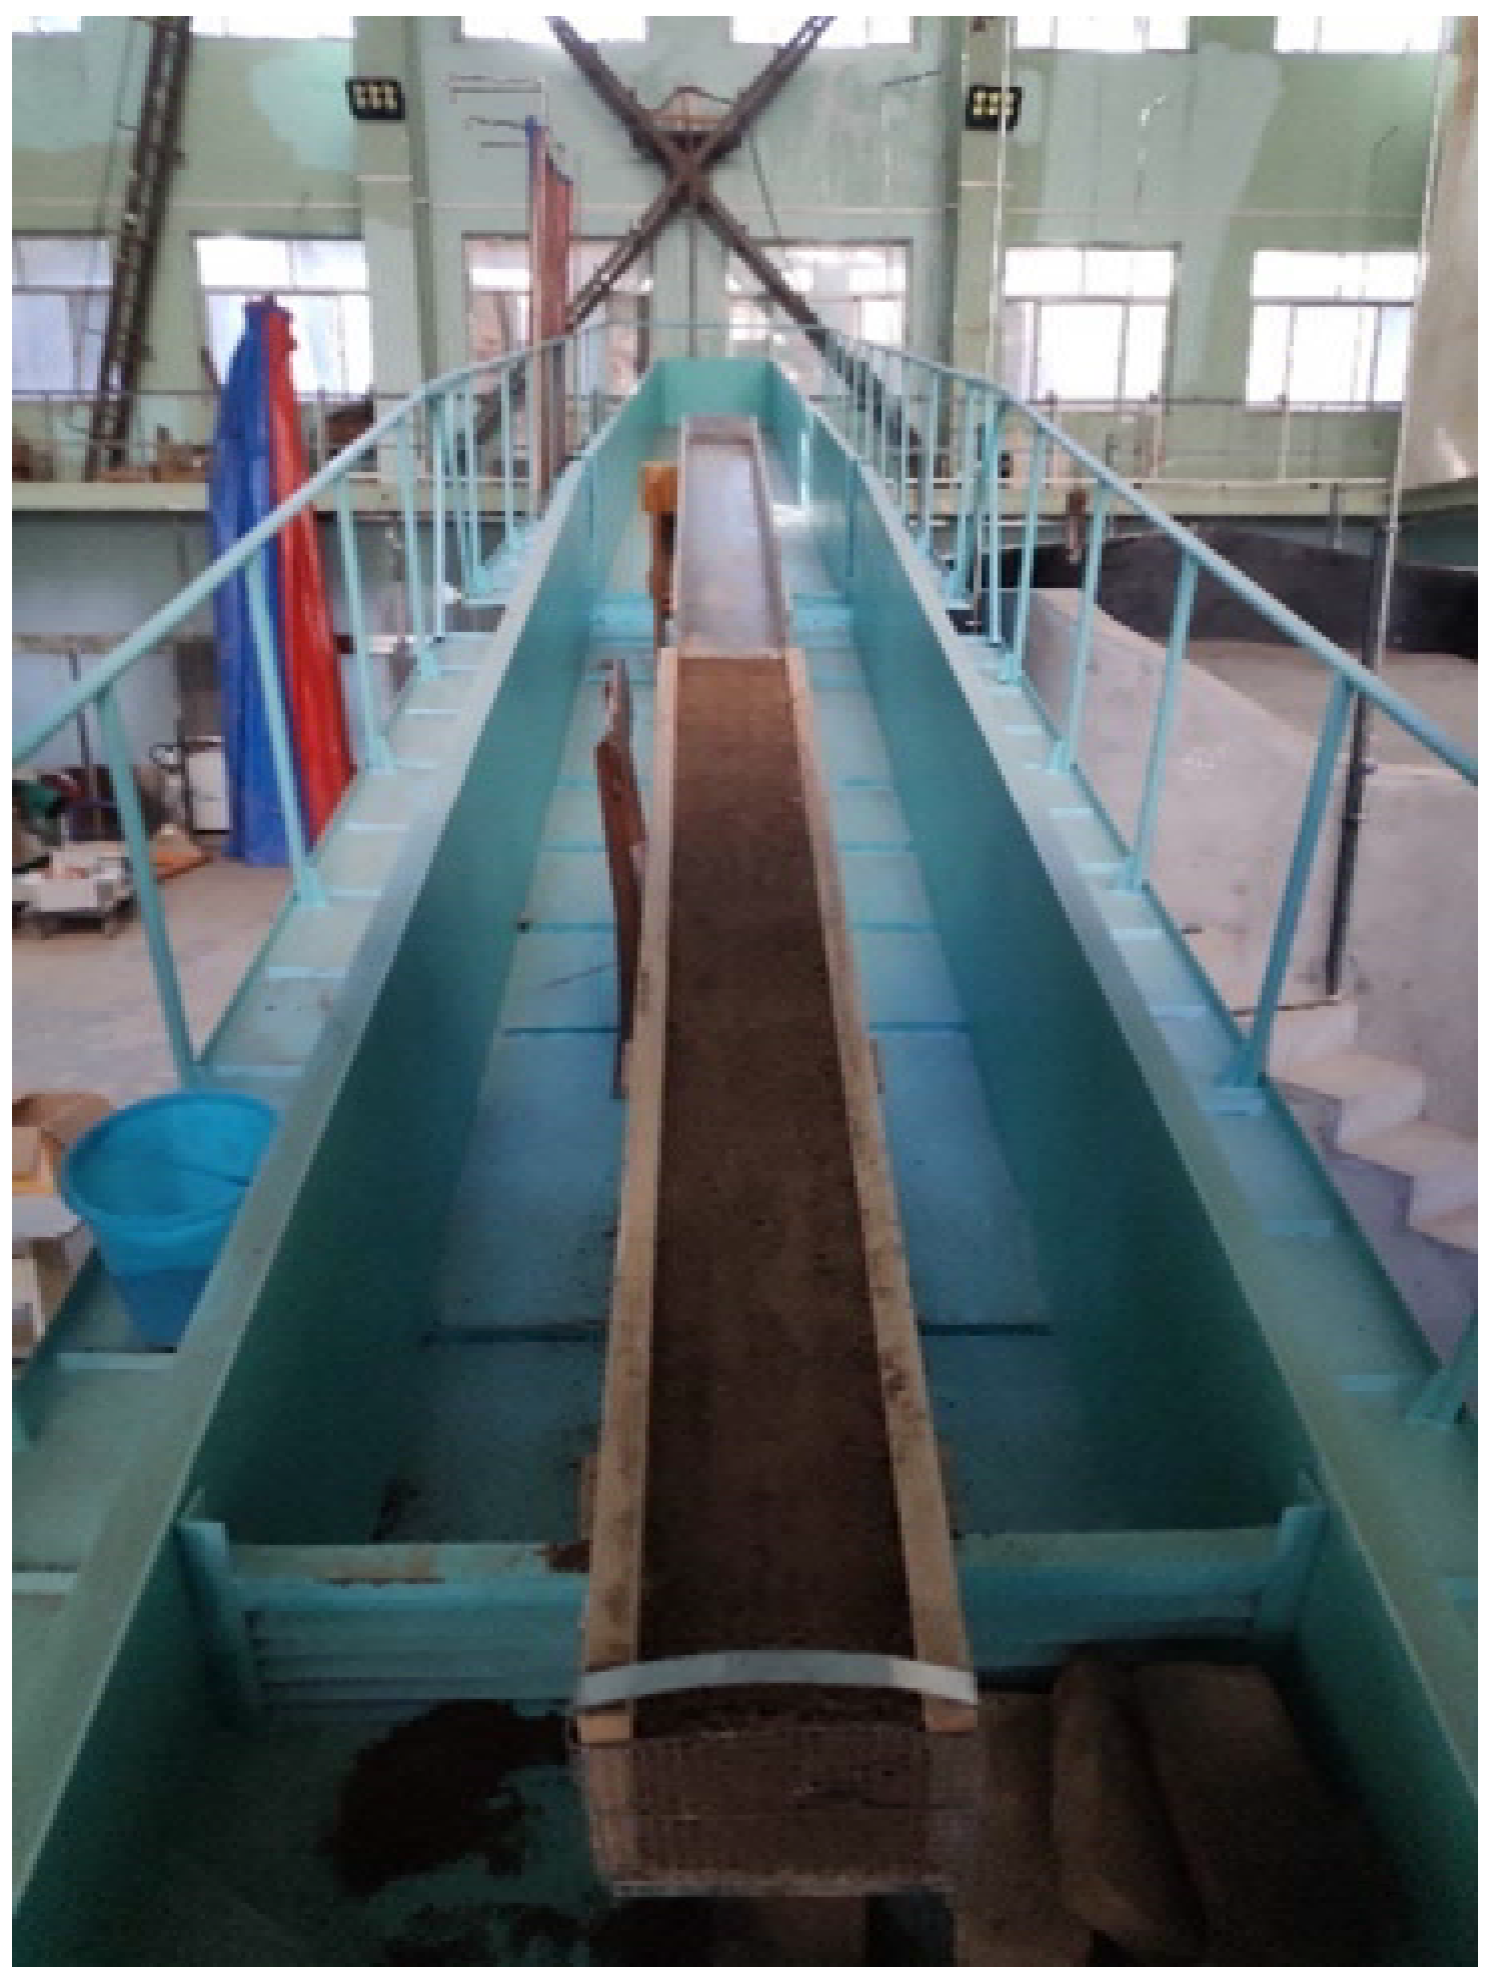
Figure 2.
Photograph of the scouring experiment model.

Figure 3.
Temporal variation in the soil erosion rate over the unfrozen, shallow-thawed, and frozen slopes at 1 L/min (a), 2 L/min (b), and 4 L/min (c). Average soil erosion rate variation (d) over unfrozen, shallow-thawed, and frozen slopes under 1 L/min, 2 L/min, and 4 L/min, respectively.
Figure 3.
Temporal variation in the soil erosion rate over the unfrozen, shallow-thawed, and frozen slopes at 1 L/min (a), 2 L/min (b), and 4 L/min (c). Average soil erosion rate variation (d) over unfrozen, shallow-thawed, and frozen slopes under 1 L/min, 2 L/min, and 4 L/min, respectively.

Figure 4.
Eroded topography on the unfrozen (UF), shallow-thawed (ST), and frozen (F) slopes under the flow rates of 1 L/min (a), 2 L/min (b), and 4 L/min (c).
Figure 4.
Eroded topography on the unfrozen (UF), shallow-thawed (ST), and frozen (F) slopes under the flow rates of 1 L/min (a), 2 L/min (b), and 4 L/min (c).

Figure 5.
The box plot of the energy consumption at different soil conditions at 1 L/min (a), 2 L/min (b), and 4 L/min (c).
Figure 5.
The box plot of the energy consumption at different soil conditions at 1 L/min (a), 2 L/min (b), and 4 L/min (c).

Figure 6.
Spatial distribution of the runoff energy consumptions over the unfrozen (UF), shallow-thawed (ST), and frozen (F) slopes for different flow rates.
Figure 6.
Spatial distribution of the runoff energy consumptions over the unfrozen (UF), shallow-thawed (ST), and frozen (F) slopes for different flow rates.

Figure 7.
Relationship of the soil erosion rate and the runoff energy consumption at 1 L/min (a), 2 L/min (b), and 4 L/min (c) for unfrozen, shallow-thawed, and frozen slopes.
Figure 7.
Relationship of the soil erosion rate and the runoff energy consumption at 1 L/min (a), 2 L/min (b), and 4 L/min (c) for unfrozen, shallow-thawed, and frozen slopes.


Table 1.
The ratio of the soil erosion rates at the same flow rate on different slopes versus the unfrozen slope.
Table 1.
The ratio of the soil erosion rates at the same flow rate on different slopes versus the unfrozen slope.
| Flow Rate/L·min−1 | Shallow-Thawed/Unfrozen | Frozen/Unfrozen |
|---|---|---|
| 1 | 4.48 | 6.96 |
| 2 | 2.05 | 4.09 |
| 4 | 2.72 | 2.54 |
| Mean | 3.08 | 4.53 |
Table 2.
The rill length and width under different slopes and flow rates after erosion (cm).
| Flow Rate/L·min−1 | Unfrozen | Shallow-Thawed | Frozen | ||||||
|---|---|---|---|---|---|---|---|---|---|
| Number | Length | Mean Width | Number | Length | Mean Width | Number | Length | Mean Width | |
| 1 | 4 | 78.57 | 4.26 | 3 | 85.71 | 2.24 | 2 | 200.75 | 2.37 |
| 2 | 1 | 105.71 | 5.29 | 1 | 135.71 | 3.01 | 1 | 202.85 | 3.47 |
| 4 | 1 | 153.14 | 6.13 | 1 | 192.86 | 6.62 | 1 | 201.43 | 3.98 |
Table 3.
The statistics of energy consumption over unfrozen, shallow-thawed, and frozen slopes at different flow rates.
Table 3.
The statistics of energy consumption over unfrozen, shallow-thawed, and frozen slopes at different flow rates.
| Flow Rate/L·min−1 | Energy Consumption/J·min−1 | |||||||||||
|---|---|---|---|---|---|---|---|---|---|---|---|---|
| Unfrozen | Shallow-Thawed | Frozen | ||||||||||
| Max | Min | Range | Average | Max | Min | Range | Average | Max | Min | Range | Average | |
| 1 | 5.12 | 5.08 | 0.04 | 5.09 | 5.10 | 5.03 | 0.07 | 5.07 | 5.07 | 5.03 | 0.04 | 5.05 |
| 2 | 10.24 | 10.12 | 0.12 | 10.19 | 10.16 | 10.08 | 0.08 | 10.11 | 10.16 | 9.82 | 0.34 | 9.99 |
| 4 | 20.63 | 20.21 | 0.42 | 20.47 | 20.54 | 20.11 | 0.44 | 20.38 | 20.55 | 19.98 | 0.57 | 20.32 |
Table 4.
Descriptive statistical contributions of the runoff energy consumption for the four sections during each experiment (%).
Table 4.
Descriptive statistical contributions of the runoff energy consumption for the four sections during each experiment (%).
| Flow Rate/L·min−1 | Unfrozen | Shallow-Thawed | Frozen | ||||||
|---|---|---|---|---|---|---|---|---|---|
| Max. | Min. | Range | Max. | Min. | Range | Max. | Min. | Range | |
| 1 | 41 | 7 | 34 | 52 | 8 | 44 | 27 | 23 | 4 |
| 2 | 46 | 6 | 40 | 45 | 5 | 40 | 26 | 24 | 2 |
| 4 | 48 | 8 | 40 | 39 | 14 | 25 | 28 | 23 | 5 |
Table 5.
Regression parameters between the soil erosion rate and runoff energy consumption for the unfrozen, shallow-thawed, and frozen slopes.
Table 5.
Regression parameters between the soil erosion rate and runoff energy consumption for the unfrozen, shallow-thawed, and frozen slopes.
| Flow Rate/L·min−1 | A | B | ||||
|---|---|---|---|---|---|---|
| Unfrozen | Shallow-Thawed | Frozen | Unfrozen | Shallow-Thawed | Frozen | |
| 1 | 2.65 | 4.7 | 6.35 | 4.01 | 3.87 | 3.82 |
| 2 | 2.85 | 4.55 | 6.4 | 8.95 | 8.78 | 8.59 |
| 4 | 2.85 | 7.95 | 6.3 | 18.68 | 18.61 | 18.36 |
© 2018 by the authors. Licensee MDPI, Basel, Switzerland. This article is an open access article distributed under the terms and conditions of the Creative Commons Attribution (CC BY) license (http://creativecommons.org/licenses/by/4.0/).
Share and Cite
MDPI and ACS Style
Wang, T.; Li, P.; Hou, J.; Li, Z.; Ren, Z.; Cheng, S.; Xu, G.; Su, Y.; Wang, F. Response of the Meltwater Erosion to Runoff Energy Consumption on Loessal Slopes. Water 2018, 10, 1522. https://doi.org/10.3390/w10111522
AMA Style
Wang T, Li P, Hou J, Li Z, Ren Z, Cheng S, Xu G, Su Y, Wang F. Response of the Meltwater Erosion to Runoff Energy Consumption on Loessal Slopes. Water. 2018; 10(11):1522. https://doi.org/10.3390/w10111522
Chicago/Turabian StyleWang, Tian, Peng Li, Jingming Hou, Zhanbin Li, Zongping Ren, Shengdong Cheng, Guoce Xu, Yuanyi Su, and Feichao Wang. 2018. "Response of the Meltwater Erosion to Runoff Energy Consumption on Loessal Slopes" Water 10, no. 11: 1522. https://doi.org/10.3390/w10111522
Note that from the first issue of 2016, this journal uses article numbers instead of page numbers. See further details here.