Stern Twin-Propeller Effects on Harbor Infrastructures. Experimental Analysis
by
 ,
,
Anna Mujal-Colilles
1,* ,
,
Marcel·la Castells
2,
Toni Llull
1,
Xavi Gironella
1 and
Xavier Martínez de Osés
2 1
Marine Engineering Laboratory, Department of Civil and Environmental Engineering, Universitat Politècnica de Catalunya, C/ Jordi Girona 1, 08034 Barcelona, Spain
2
Department of Nautical Science and Engineering, Universitat Politècnica de Catalunya, Pla de Palau, 18, 08003 Barcelona, Spain
*
Author to whom correspondence should be addressed.
Water 2018, 10(11), 1571; https://doi.org/10.3390/w10111571
Submission received: 12 October 2018
/
Revised: 26 October 2018
/
Accepted: 30 October 2018
/
Published: 2 November 2018
(This article belongs to the Section Hydraulics and Hydrodynamics)
Abstract
:The growth of marine traffic in harbors, and the subsequent increase in vessel and propulsion system sizes, produces three linked problems at the harbor basin area: (i) higher erosion rates damaging docking structures; (ii) sedimentation areas reducing the total depth; (iii) resuspension of contaminated materials deposited at the seabed. The published literature demonstrates that there are no formulations for twin stern propellers to compute the maximum scouring depth. Another important limitation is the fact that the formulations proposed only use one type of maneuvering during the experimental campaign, assuming that vessels are constantly being undocked. Trying to reproduce the real arrival and departure maneuvers, 24 different tests were conducted at an experimental laboratory in a medium-scale water tank using a twin propeller model to estimate the consequences and the maximum scouring depth produced by stern propellers during the backward/docking and forward/undocking scenarios. Results confirm that the combination of backward and forward scenario differs substantially from the experiments performed so far in the literature using only an accumulative forward scenario, yielding deeper scouring holes at the harbor basin area. The results presented in this paper can be used as guidelines to estimate the effects of regular vessels at their particular docking location.
1. Introduction
The significant growth experienced by regular shipping lines and the marine transportation industry over the last 20 years is producing severe problems for old marinas designed to host smaller vessels with lower docking frequencies. New, bigger and more powerful propulsion systems and deeper draft vessels are needed nowadays to satisfy the demands on marine traffic. However, this increase in propulsion system and vessel sizes is affecting the docking infrastructures and the operability of the entire harbor. The main problem is the change in bed morphology of the harbor: entrance channels suffer high rates of erosion and the changes on harbor basins seafloor combine both erosion and sedimentation. A recent field study of a particular harbor basin [1], showed that the erosion in these areas of the port can reach a depth up to the same order of magnitude as the stern propeller’s diameter. The effects of the erosion are different depending on the location of the scouring hole. If the erosion is located close to the toe of the docking wall it can seriously affect the stability of the berth infrastructure. On the other hand, if the erosion is located at more central areas of the harbor basin, a problem arises with the deposition of the eroded sediment along the harbor basin, reducing its operability for larger draft vessels and the area has to be dredged often enough for safe navigation (with sufficient keel clearance). Moreover, an environmental problem can also arise from the scouring effects of stern twin propellers of the vessels, and the increase in marine traffic in ports is also increasing the accumulation of heavy contaminants in some areas of the harbor. One of the engineering solutions to improve the water quality of the harbor is to trap the contaminated sediment below a layer of coarser gravel [2]. However, as reported by [3,4], the action of stern propellers over the seafloor can negate the solution and free the contaminated sediment creating an important issue that correlates sediment resuspension of contaminants due to the stern propellers’ effects and water quality requirements of the cruise shipping industry.
Therefore, the growth of marine traffic in harbors and its subsequent increase in vessel and propulsion system sizes produces three linked problems at the seabed of the harbor basins: (i) higher erosion rates damaging docking structures; (ii) sedimentation areas reducing the total depth of the harbor basin and its operability; and (iii) resuspension of contaminated materials deposited at the seabed.
The formulation published and used so far to investigate the erosion rates of ship’s propellers is based on empirical equations with a dependent variable named efflux velocity, . Efflux velocity is defined as the average velocity of the flux nearby a single propeller in a plane parallel to the propeller blades. The first empirical equation for was developed by [5,6], and detailed the expression for based on the application of the momentum and mass conservation equations to an ideal actuator disk. Later, other authors proposed more complicated empirical equations based on the momentum equation, and including the particular characteristics of propellers, such as: the number of blades, the expanded area ratio, the propeller pitch and the hub diameter [5,7,8,9,10,11]. However, the former equations were developed considering a single propeller. The guidelines published in [12] proposed two mathematical methods to extrapolate the efflux velocity of a single propeller to twin propellers, but [13] demonstrated that the empirical formulas to compute efflux velocity clearly overestimated the experimental results of a twin propeller model.
The maximum erosion can be computed either (i) using the efflux velocity to obtain the bed velocity [7,8,14] and then computing the Shields parameter; or (ii) using empirical formulas developed in physical experiments with a single propeller model [15,16,17,18,19,20,21,22]. For the first case, ref. [13] found that bed velocity for twin propellers was estimated properly if the formulation proposed by [8] was used, but [13] did not compute the maximum erosion. In the second case, [1] compared the previous formulations to a real case and concluded that all of them clearly overestimated by far the real scouring actions, and only [17,21], using the confined propeller jet equation, yielded results close to reality, but doubled the real maximum scouring depth. Therefore, no formulations for twin propellers are present in the literature to compute both the efflux velocity and the maximum scouring depth. Another important limitation is the fact that the formulations proposed only use one type of maneuvering during the experimental campaign, assuming that vessels are constantly being undocked at the same point, but never docked.
This paper deals with the results obtained at an experimental laboratory using a twin propeller model to estimate the maximum scouring depth produced by stern propellers. As a novel incorporation, and in order to compare results with the real scouring effects at harbor basin, the research includes two different maneuvering conditions: undocking maneuvering (forward scenario) only to compare twin results with single propeller erosion published in the literature; and, alternatively, docking and undocking maneuvering (back and forth scenario) in the same harbor basin. The experimental setup is described in the second section, while the results are presented in the third section and discussed in the fourth section. The fifth section summarizes the conclusions of the research.
2. Experimental Setup
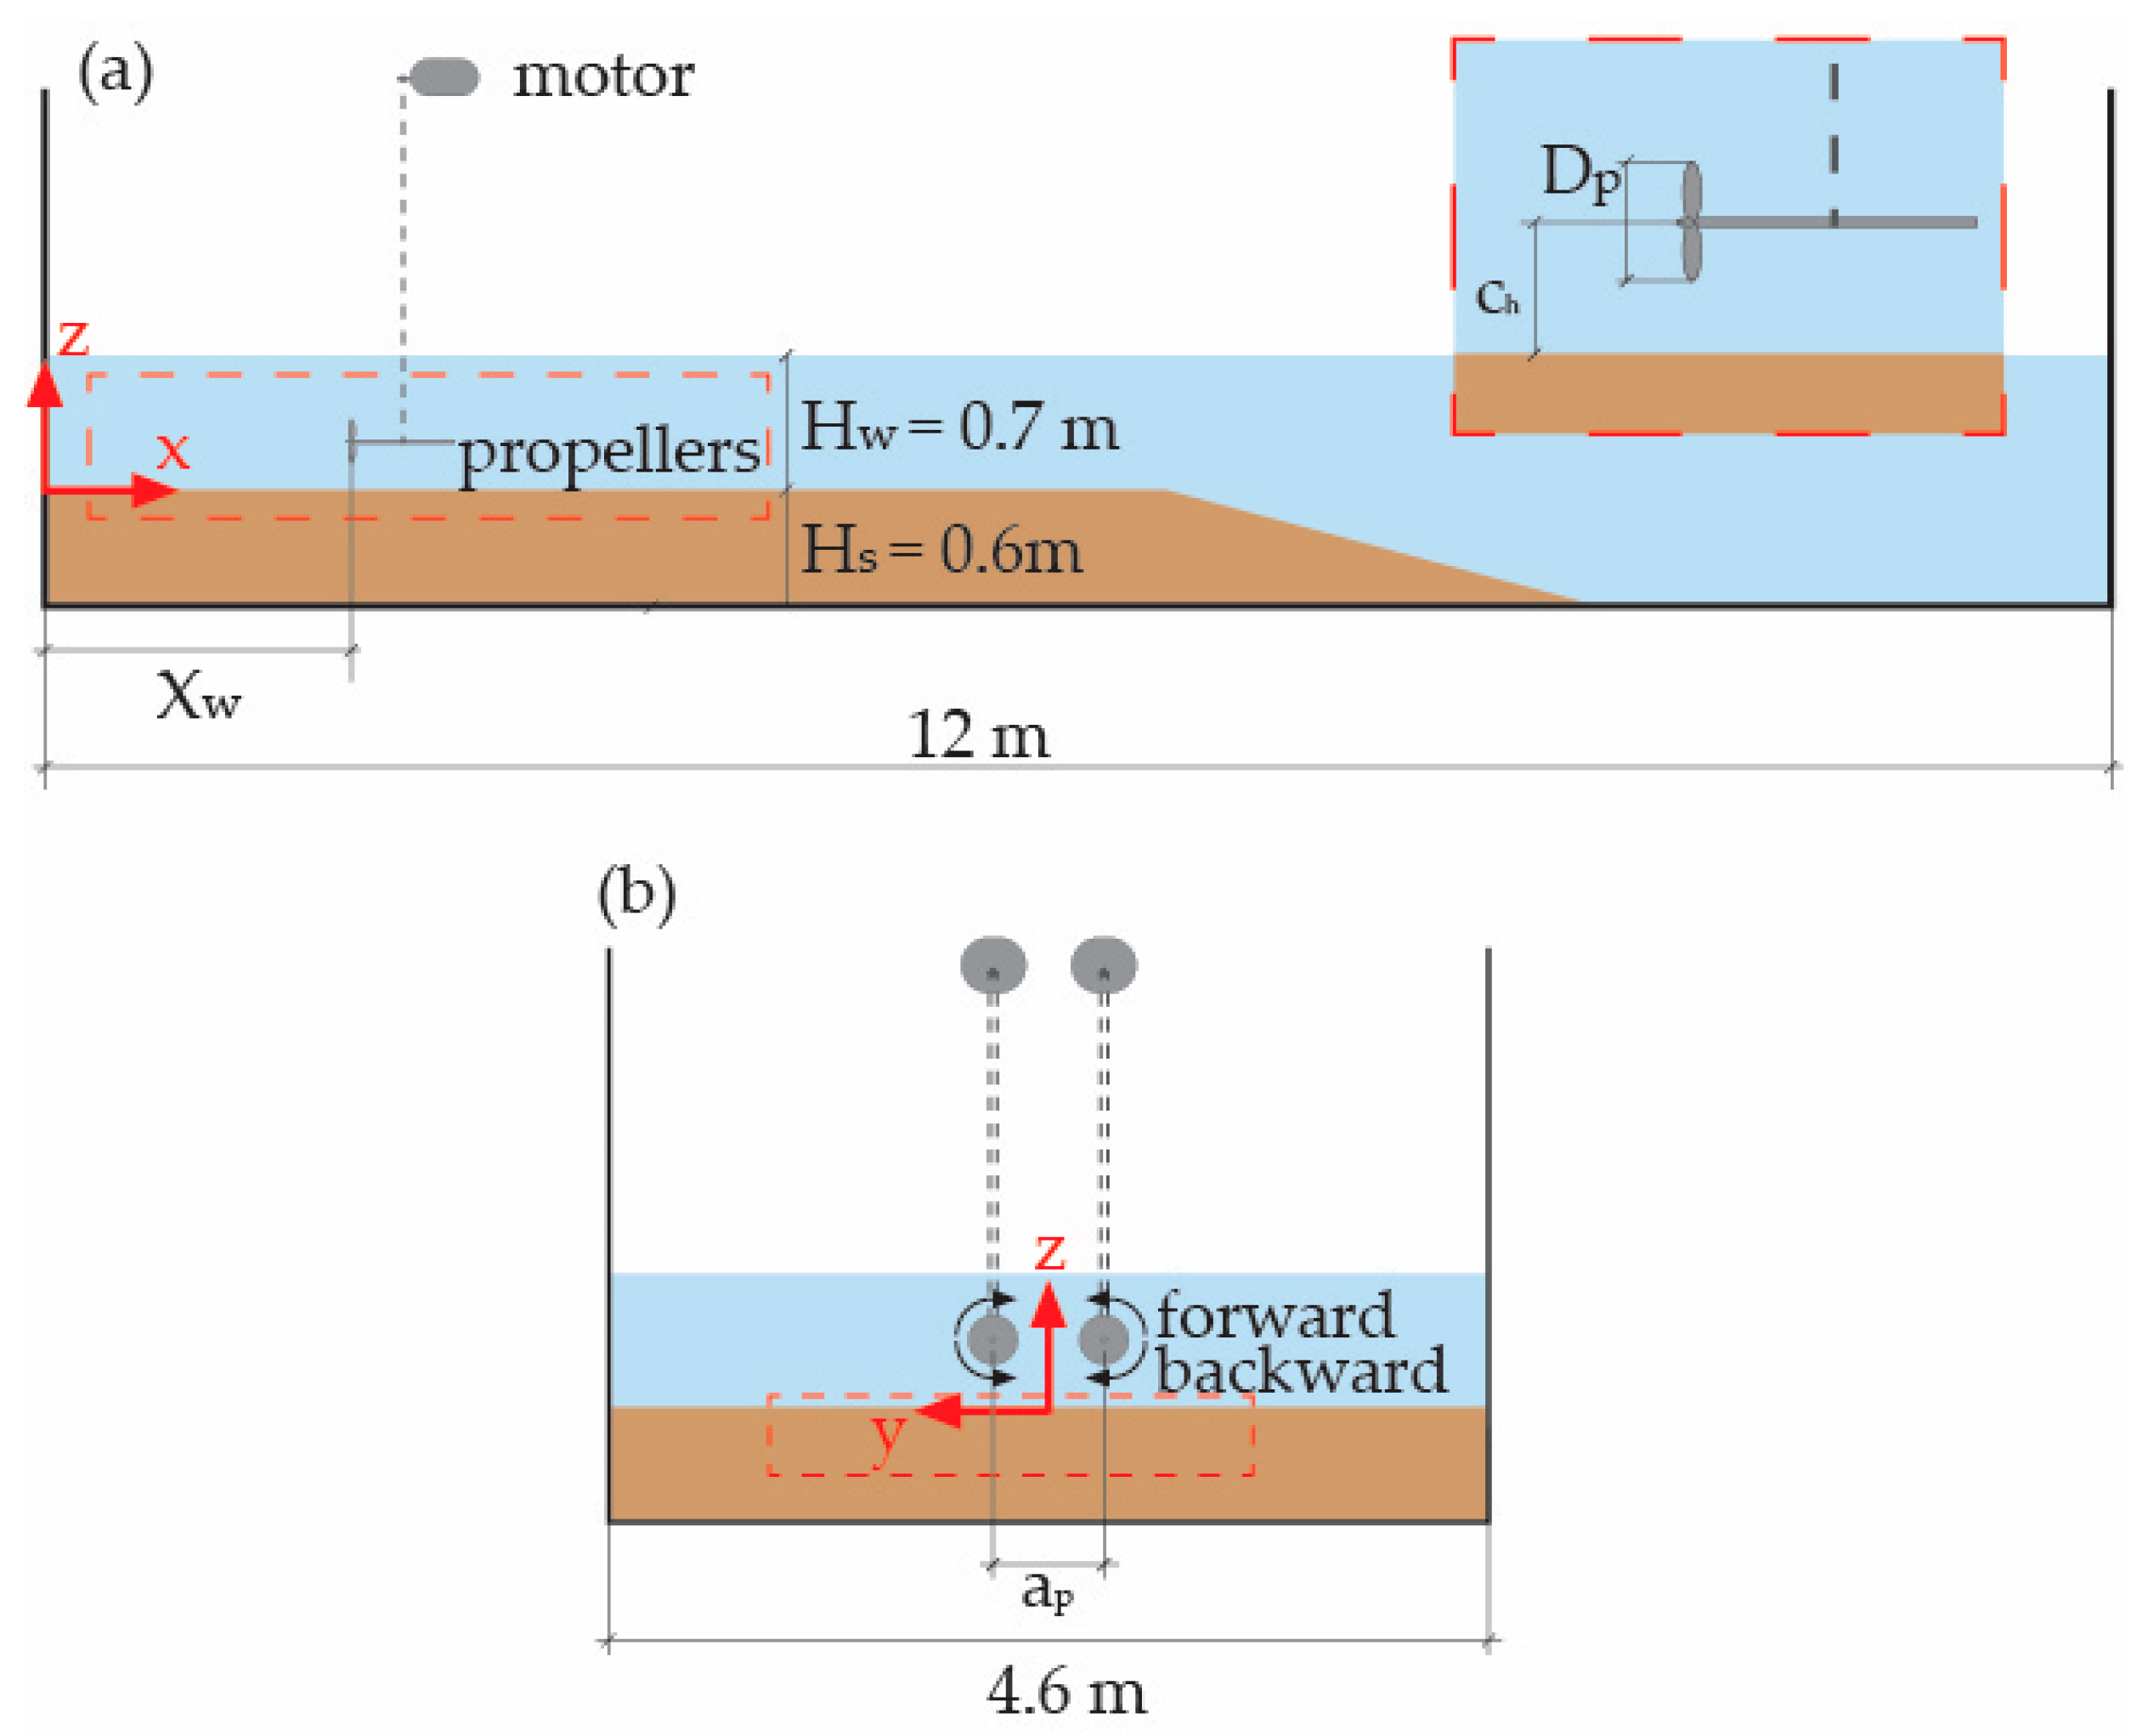
Experiments were conducted in the Marine Engineering Laboratory at the UPC-Barcelona Tech University in a medium-scale water tank named LaBassa [13]. Figure 1 presents a sketch of the tank, where is the diameter of the propellers, is the clearance distance between the center of the propeller and the sediment bed, is the distance between the propeller plane and the front wall, and is the distance between the center of the two propellers.
Initially, the experiment was designed to scale a real Ro-Ro vessel with a daily docking frequency at a particular harbor basin. The scaling factor was set to 1/25 using the Froude number to scale dynamic effects, but including the Reynolds self-similarity criteria found in [23,24] to assure a turbulent flow beyond the propellers and neglect the viscous effects. Twin 4-blade inward rotating propellers with a pitch ratio of 0.9 and an expanded area ratio of 0.75 were used. The diameter of the propellers was 0.25 m and the distance between propellers was 0.6 m. The total duration of a single test was 30 min, scanning the bed sediment evolution at 5 min intervals.
A total of 24 different tests were obtained by combining the following variables: clearance distance, front wall distance, speed rotation, , and the maneuver scenario (forward; back and forth), as detailed in Table 1. Forward maneuvering tests follow the sequence: (i) initialization of the sediment bed to a horizontal plane; (ii) 5 min run at a determined rotation speed; (iii) scanning of the sediment bed; (iv) repeat steps (ii)–(iii) for a total run of 30 min. Back and forth maneuvering tests follow the sequence from the second step: (ii) 5 min run in backward mode; (iii) scanning of the sediment bed; (iv) 5 min run in forward mode; (v) scanning of the sediment bed; (vi) repetition of second to fifth steps for a total run of 30 min.
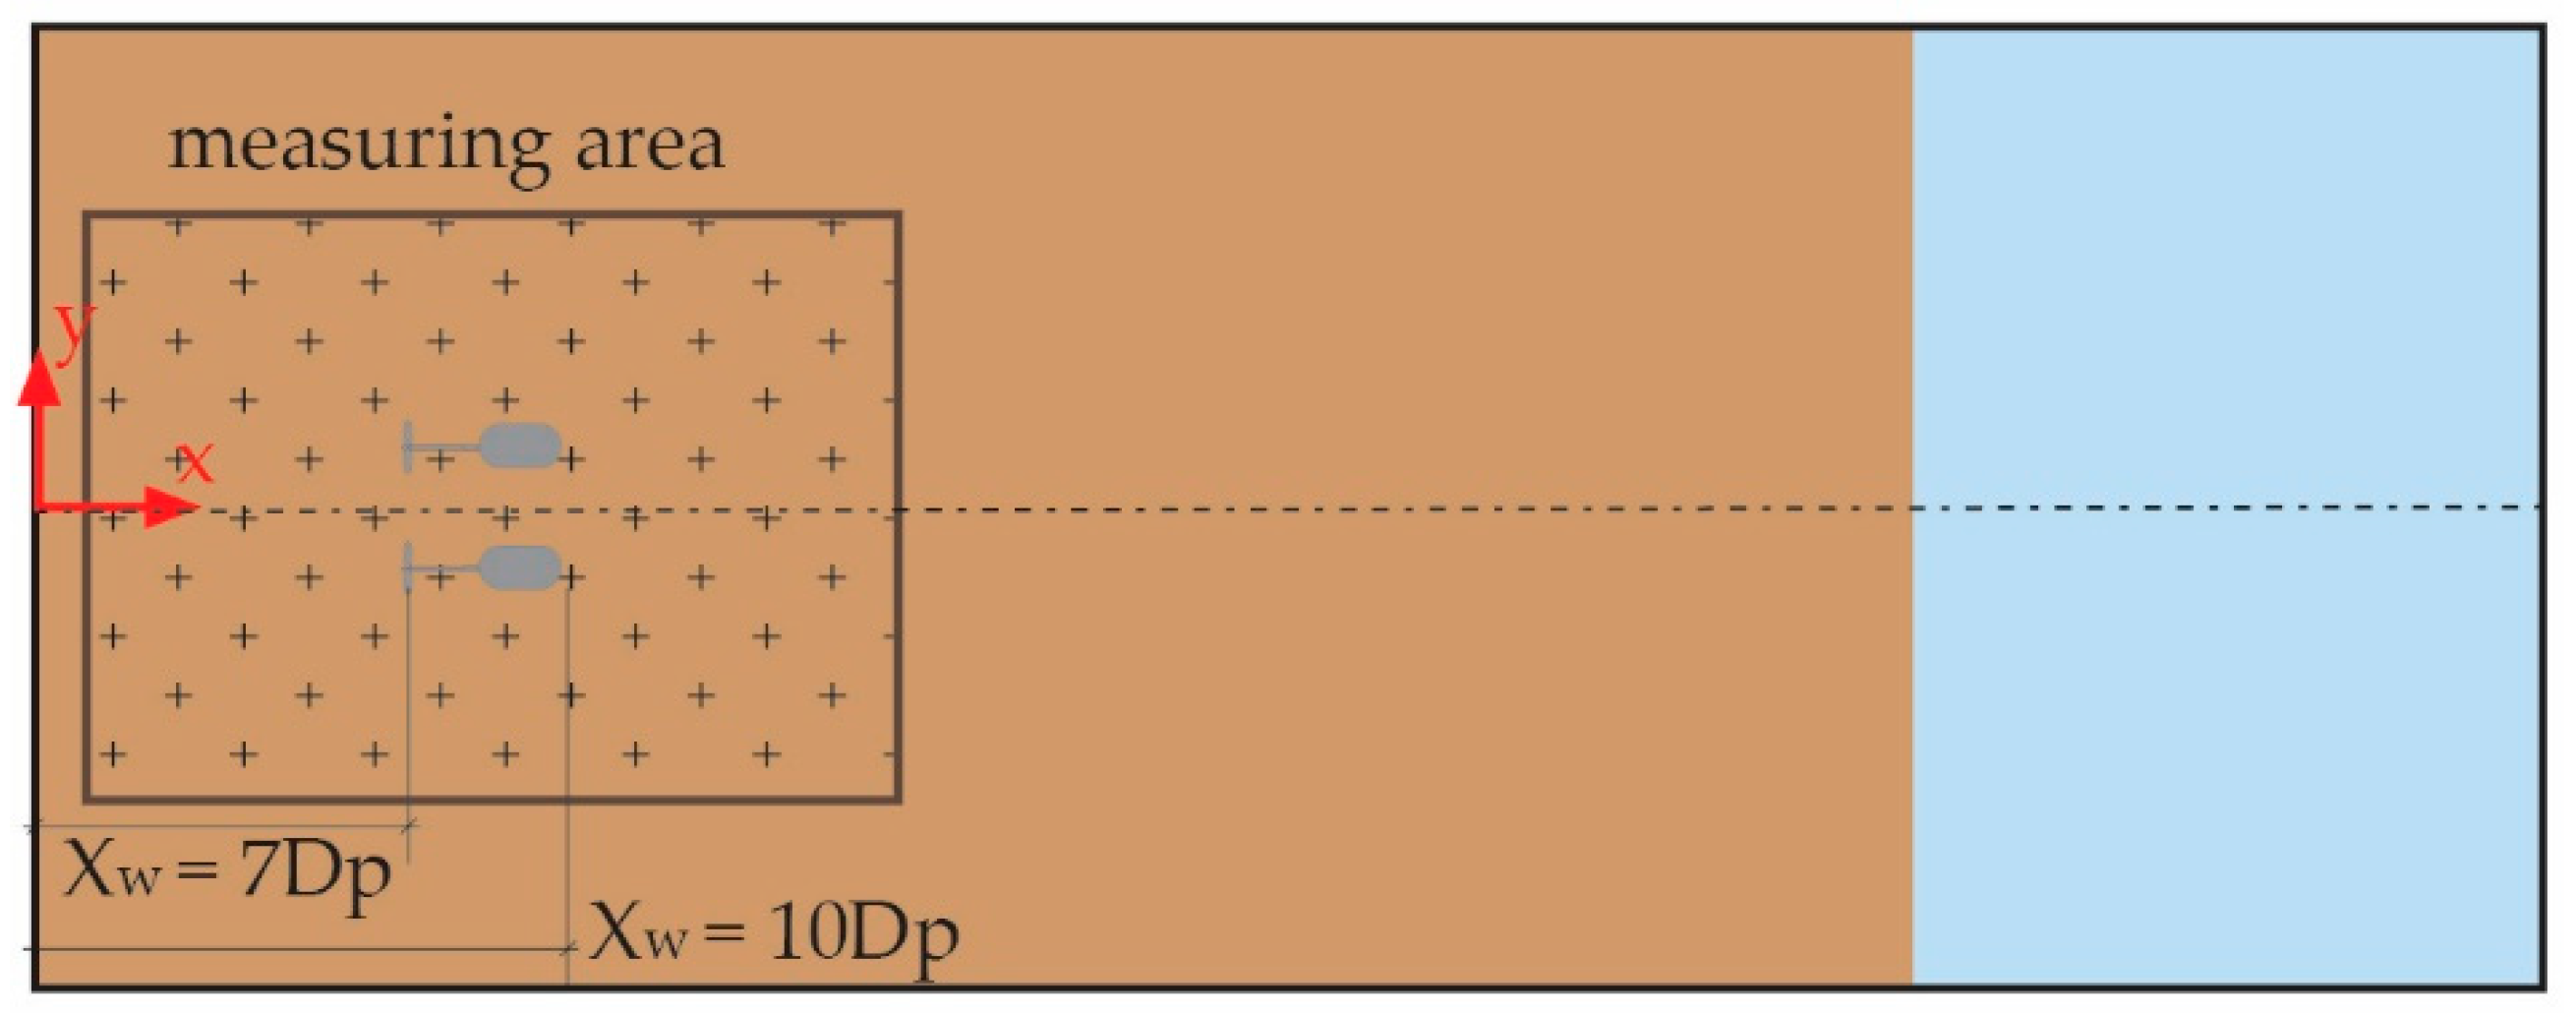
Sediment used in the experiments was a = 250 uniform fine sand. Sediment was not scaled from the prototype due to the limitations of finer sand in model reproductions. Two @ULTRALAB UWS 1M Echo Sounders measured the surface of the sediment bed layer after each 5 min-run. The Echo Sounders were hanging from a mechanized arm covering an area of 3.5 m × 2.8 m with blanking distances at the edges of the tank (0.25 m front wall and 0.9 m at each lateral wall), as shown in Figure 2. Echo Sounders were separated by 7.5 cm in the y direction, and measured at a 40 Hz sampling frequency. Therefore, the 3D render was build up using 40 longitudinal profiles parallel to the long edge of the LaBassa tank.
3. Results
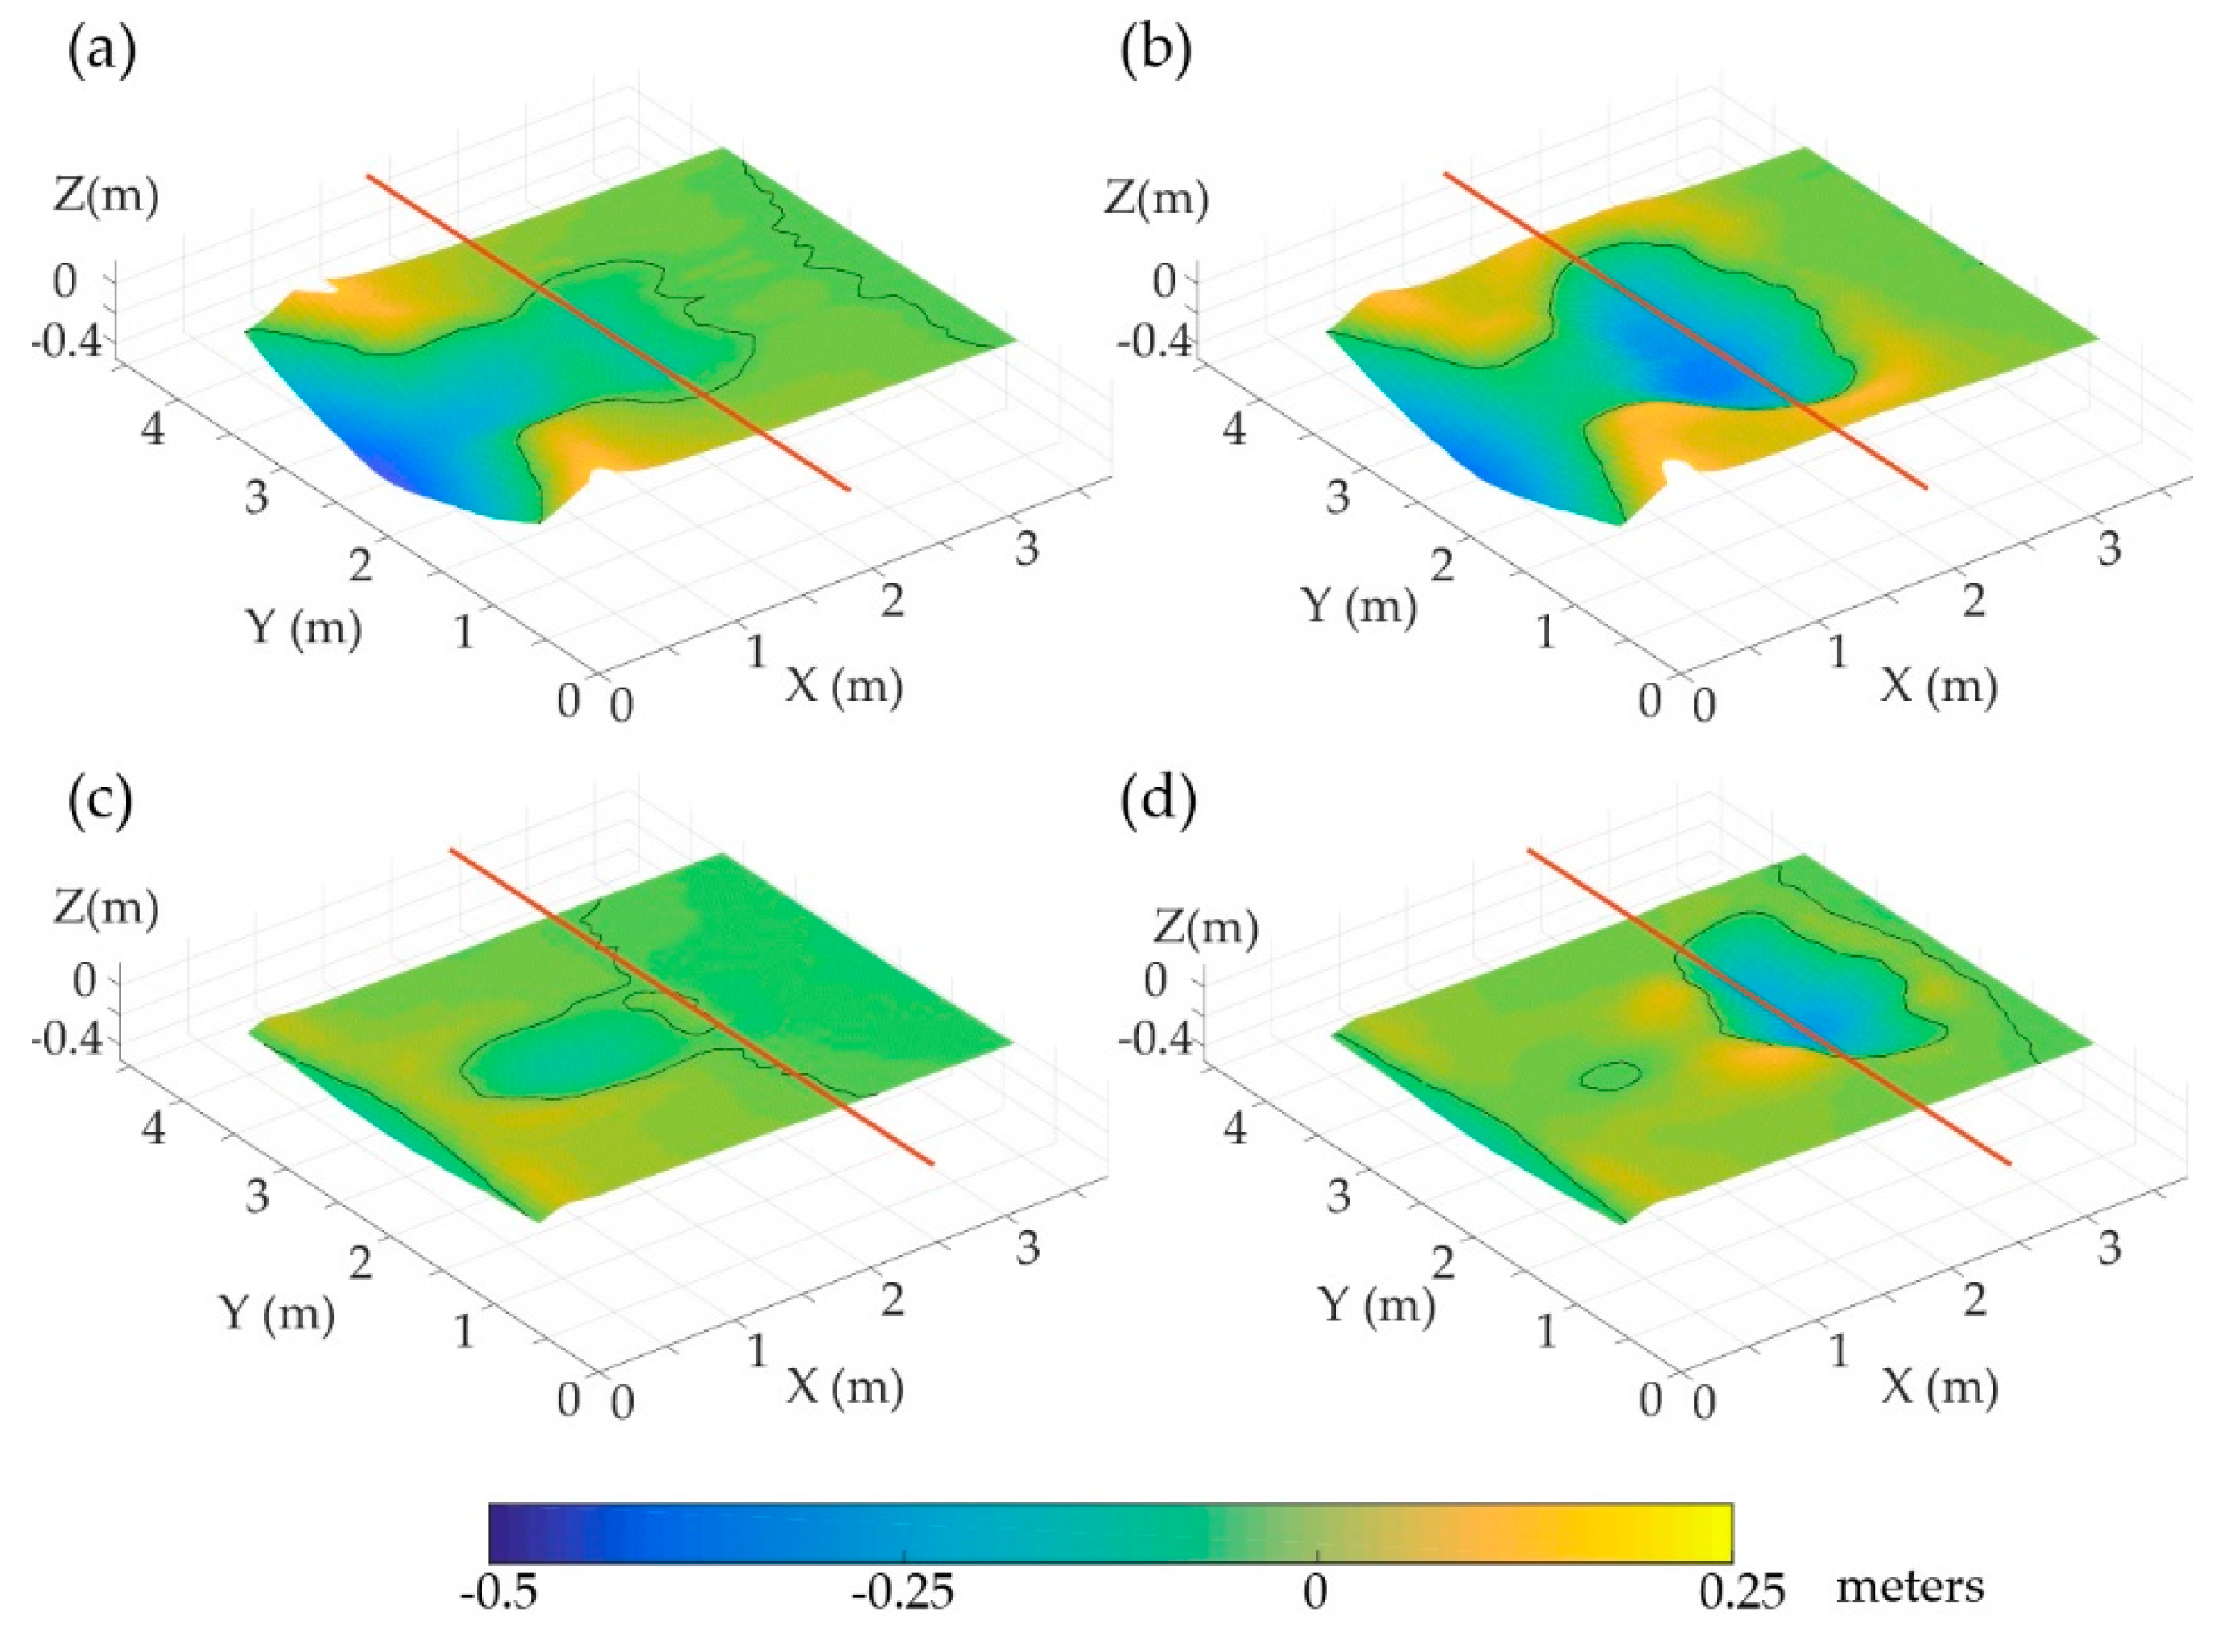
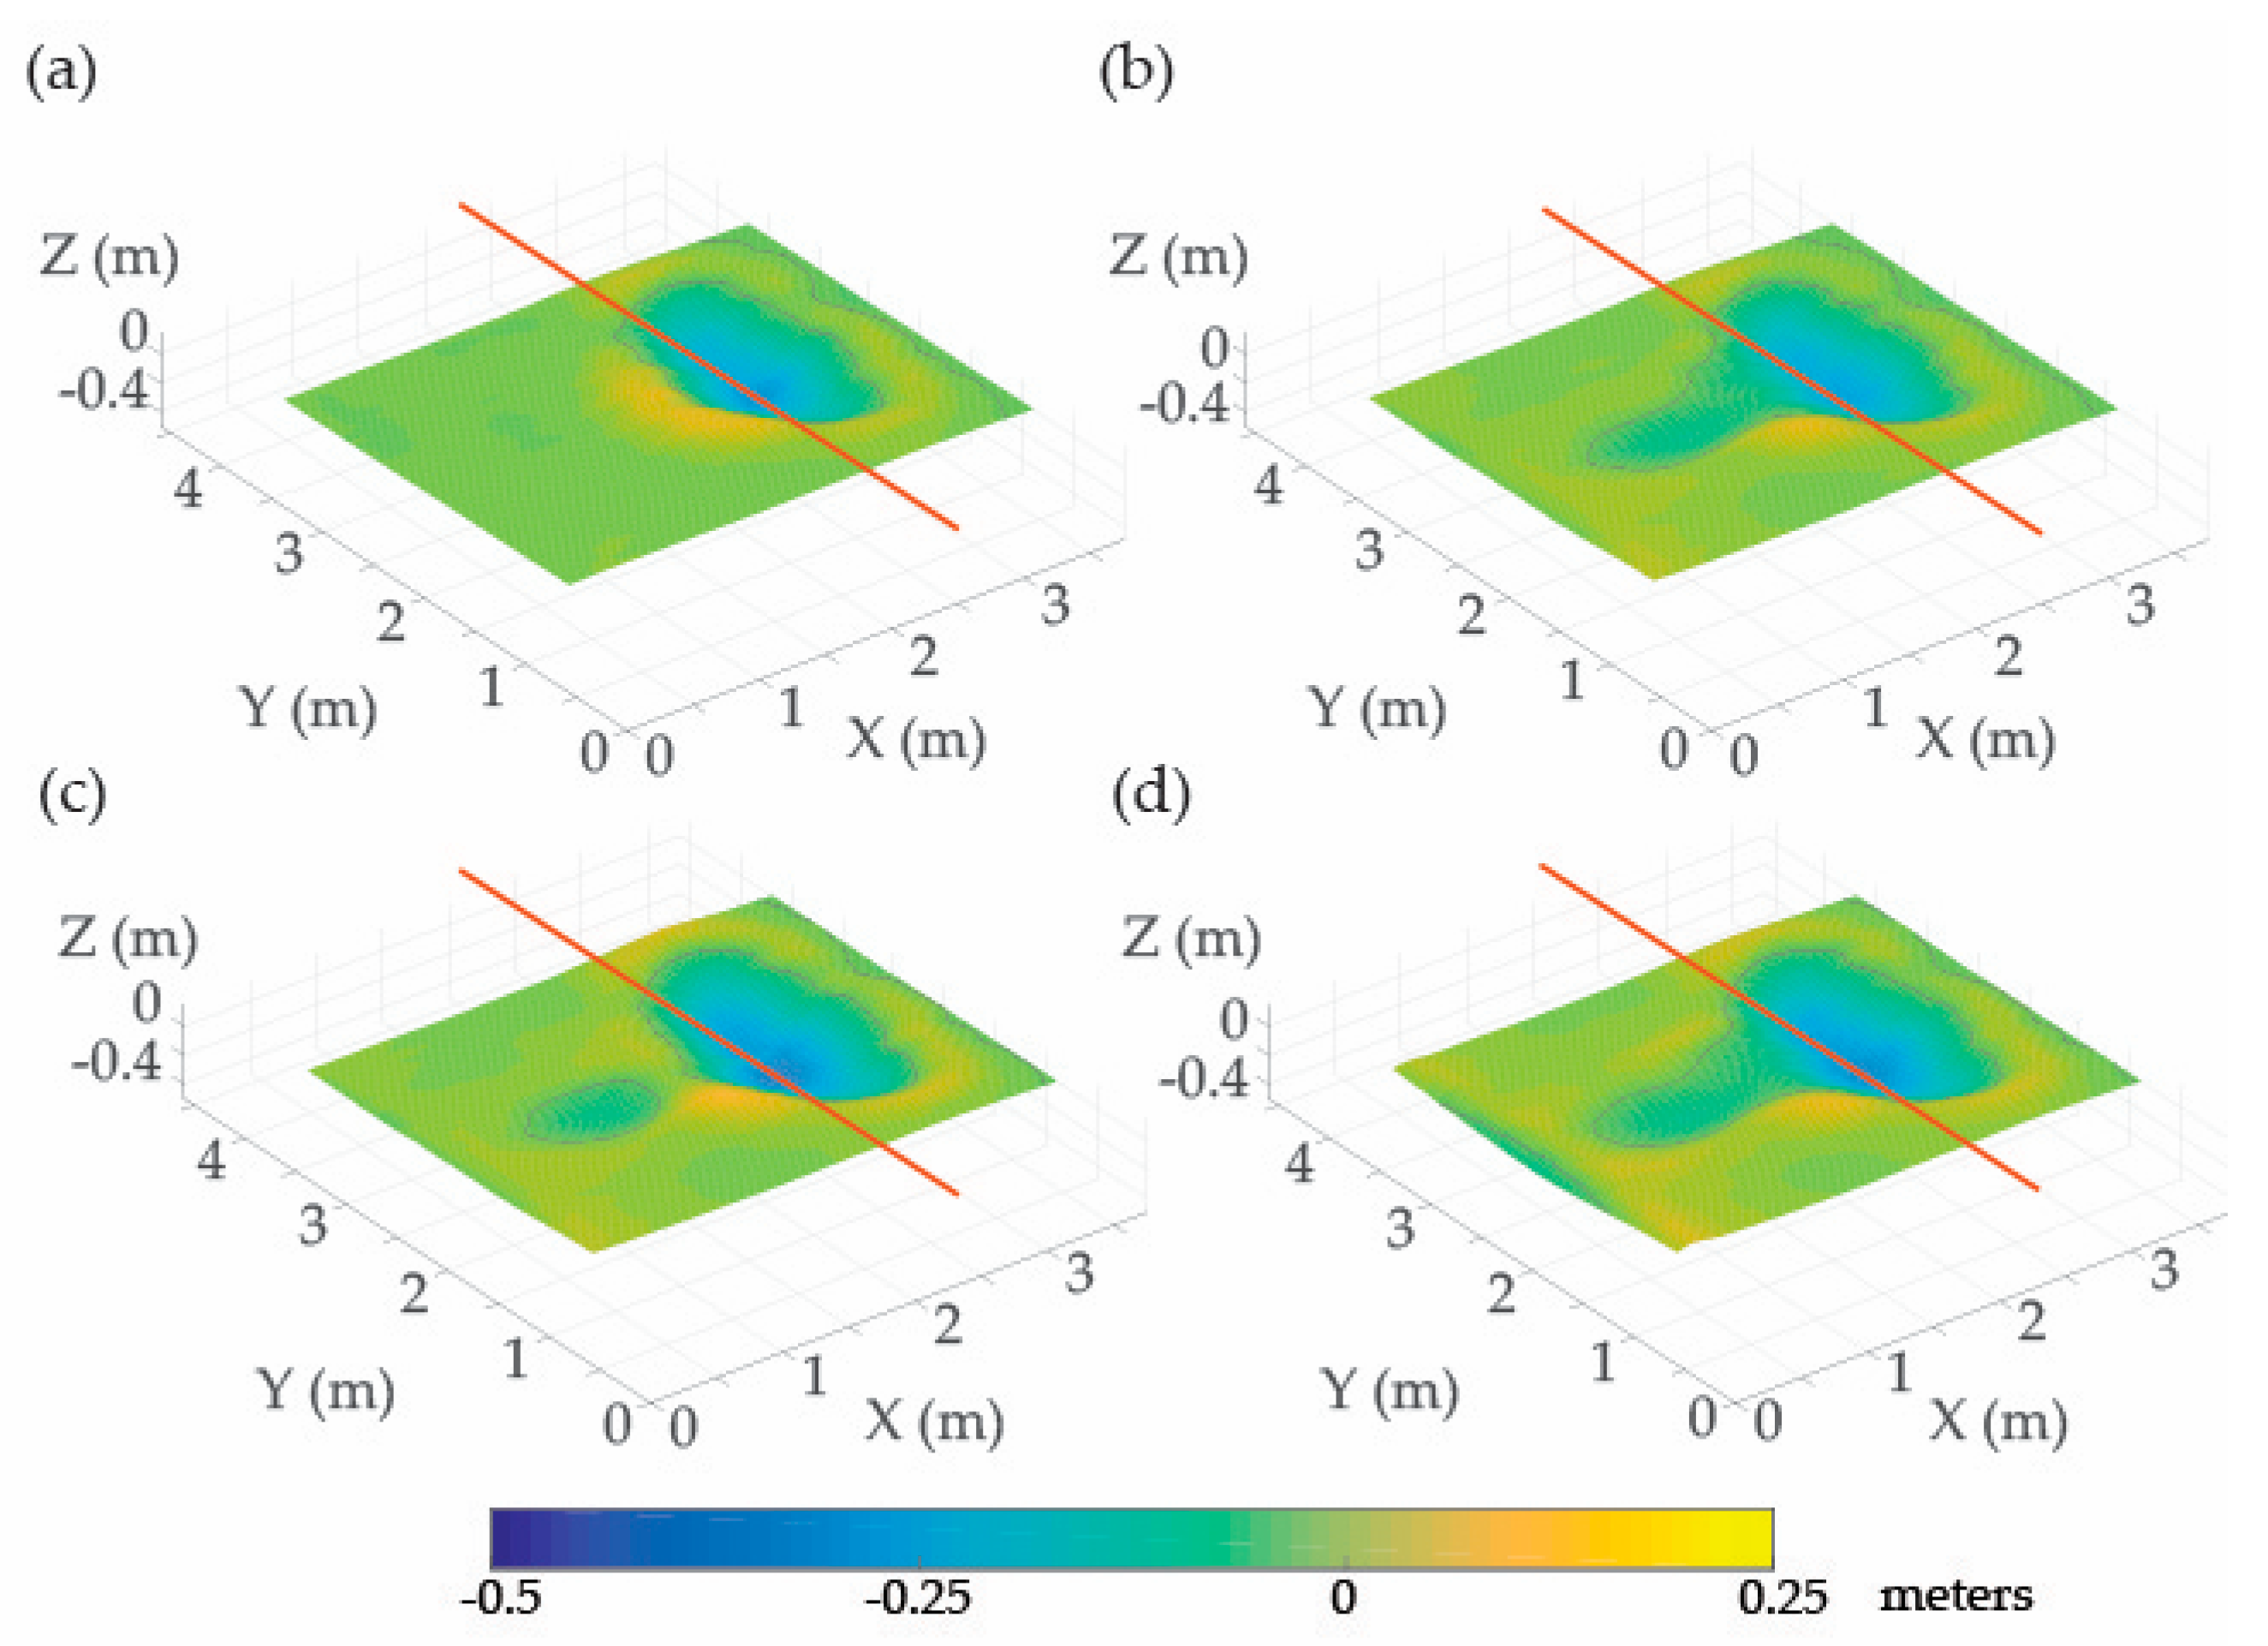
At each test, a scan of the measuring area yielded results like the example shown in Figure 3. Upper plots (Figure 3a,b) represent the situation where the propellers are closer to the sediment bed () and to the front quay wall (). On the contrary, Figure 3c,d, shows the opposite conditions, with the propellers further from sediment bed ) and from the front quay wall ().
The scans provide visual information of the eroded and deposited areas and their morphological shape. Each subplot of Figure 3 indicates the existence of two eroding zones: (i) the scouring hole created below the propellers at the harbor basin area, HB; and (ii) the effects of the jet flow at the vicinity of the front wall (this is at the toe of the docking wall, DW). The former is originated by the direct impact of the jet flow at the sediment bed, whereas the latter is produced by the returning flow with a clear vertical component towards the sediment bed due to the existence of the docking wall. The differences between the two scouring areas were reported in [17], although they are not mentioned explicitly. In their communication, when the propellers are closer to the front wall (), the scouring effects at the harbor basin are limited. However, when the distance increases (), both effects of the propeller jet are detected. These two eroded zones are not always disconnected from each other and can sometimes merge, forming a unique eroded area depending on maneuver scenario, time evolution, and n, , and variables, as will be further detailed in Section 3.1.
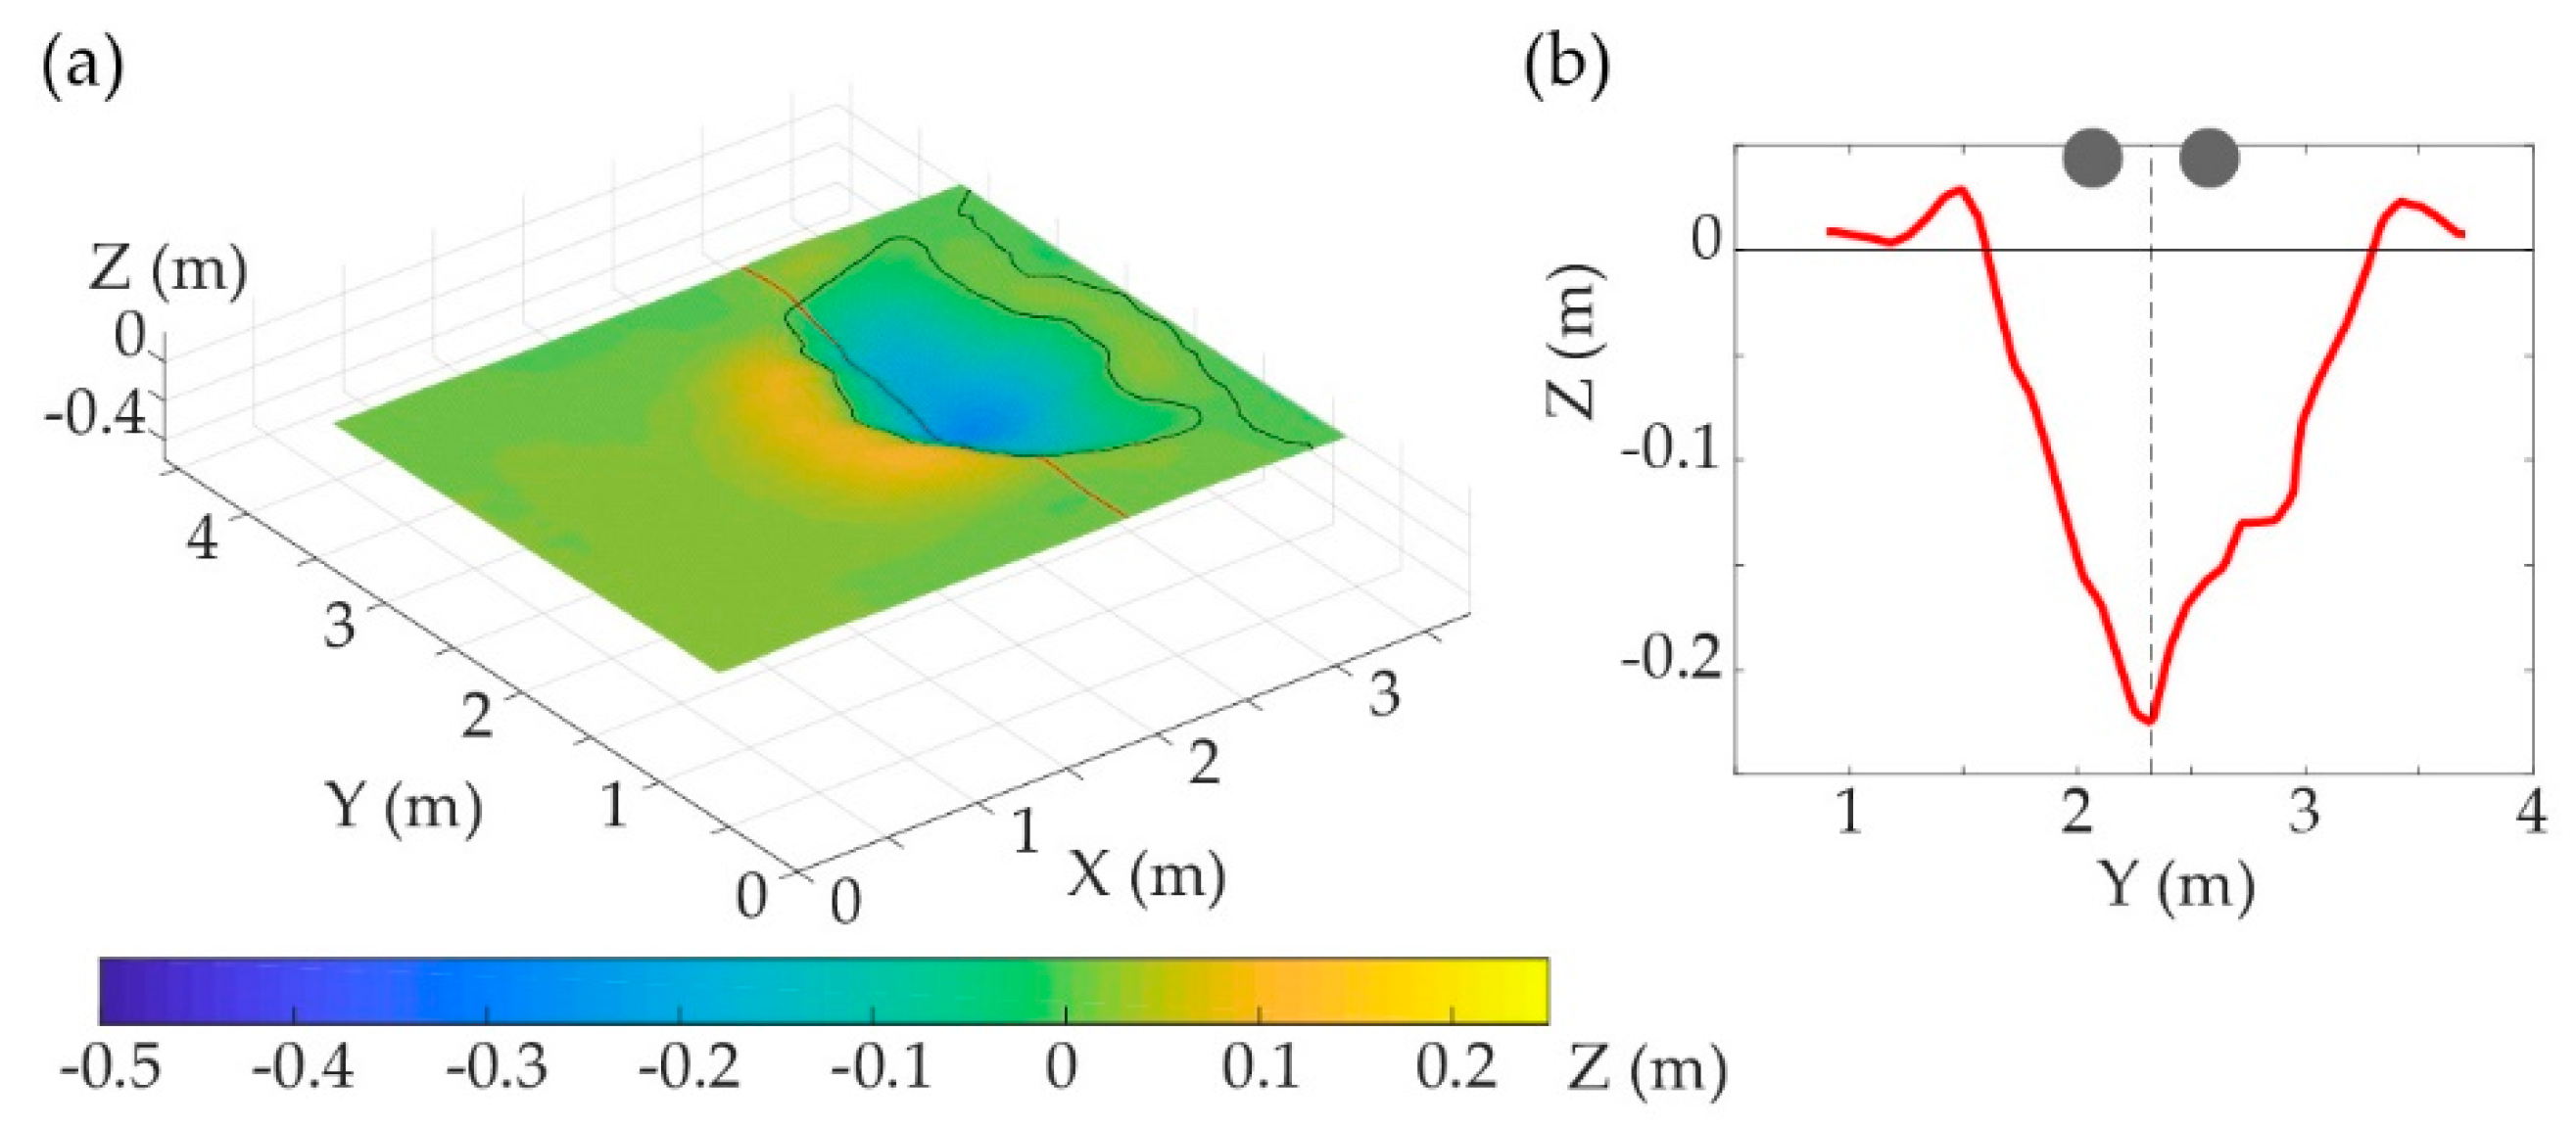
According to the results obtained from the experiments, maximum eroded depth, εmax, is located at the symmetry plane between the propellers, regardless of the engine order (ahead/forward or astern/backward direction). When a twin propeller model rotates inward in the ahead direction (forward scenario), the left-hand propeller rotates to starboard and the right hand to port, and the flux at the symmetry plane between propellers is towards the bed [13], increasing the action of a single propeller due to the sum of each propeller flow. On the contrary, if the twin propeller model is rotating outwards in the astern direction (backward scenario), the right hand propeller rotates to starboard and the left hand to port; thus, the flux at the symmetry plane is moving upwards, and the maximum scouring action should be concentrated below each propeller. However, Figure 4 plots an example of the reality when the astern telegraph order (backward) is used for the first time. The result extends to the rest of backward runs, where the maximum scouring depth is still found at the centerline. Therefore, when the flow of twin propellers reaches the sediment bed, the separated flows of each propeller have already been mixed with maximum velocities at the symmetry plane.
3.1. Forward Tests
In the case of forward tests, the time evolution of the longitudinal profile located at the centerline between the propellers, plotted in Figure 5, helps to understand the merging of the eroded area at the harbor basin and the eroded area close to the toe of the wall, outlined previously. For low-speed revolutions (e.g., 300 rpm, Figure 5a), the scouring profile retains a clear distinction between the two scouring areas. When the revolution speed increases, Figure 5b,c, the separation between the zones is not maintained over time and disappears after 15–20 min of the experiment. After this stage, the erosion at the vicinity of the docking wall dominates the profile.
Figure 5 also identifies the location of a third scouring hole created slightly upstream of the propellers due to the suction effects of the propellers. This zone is thought to be a negative pressure area that is strong enough to resuspend the sediment particles deposited immediately downstream of the propellers.
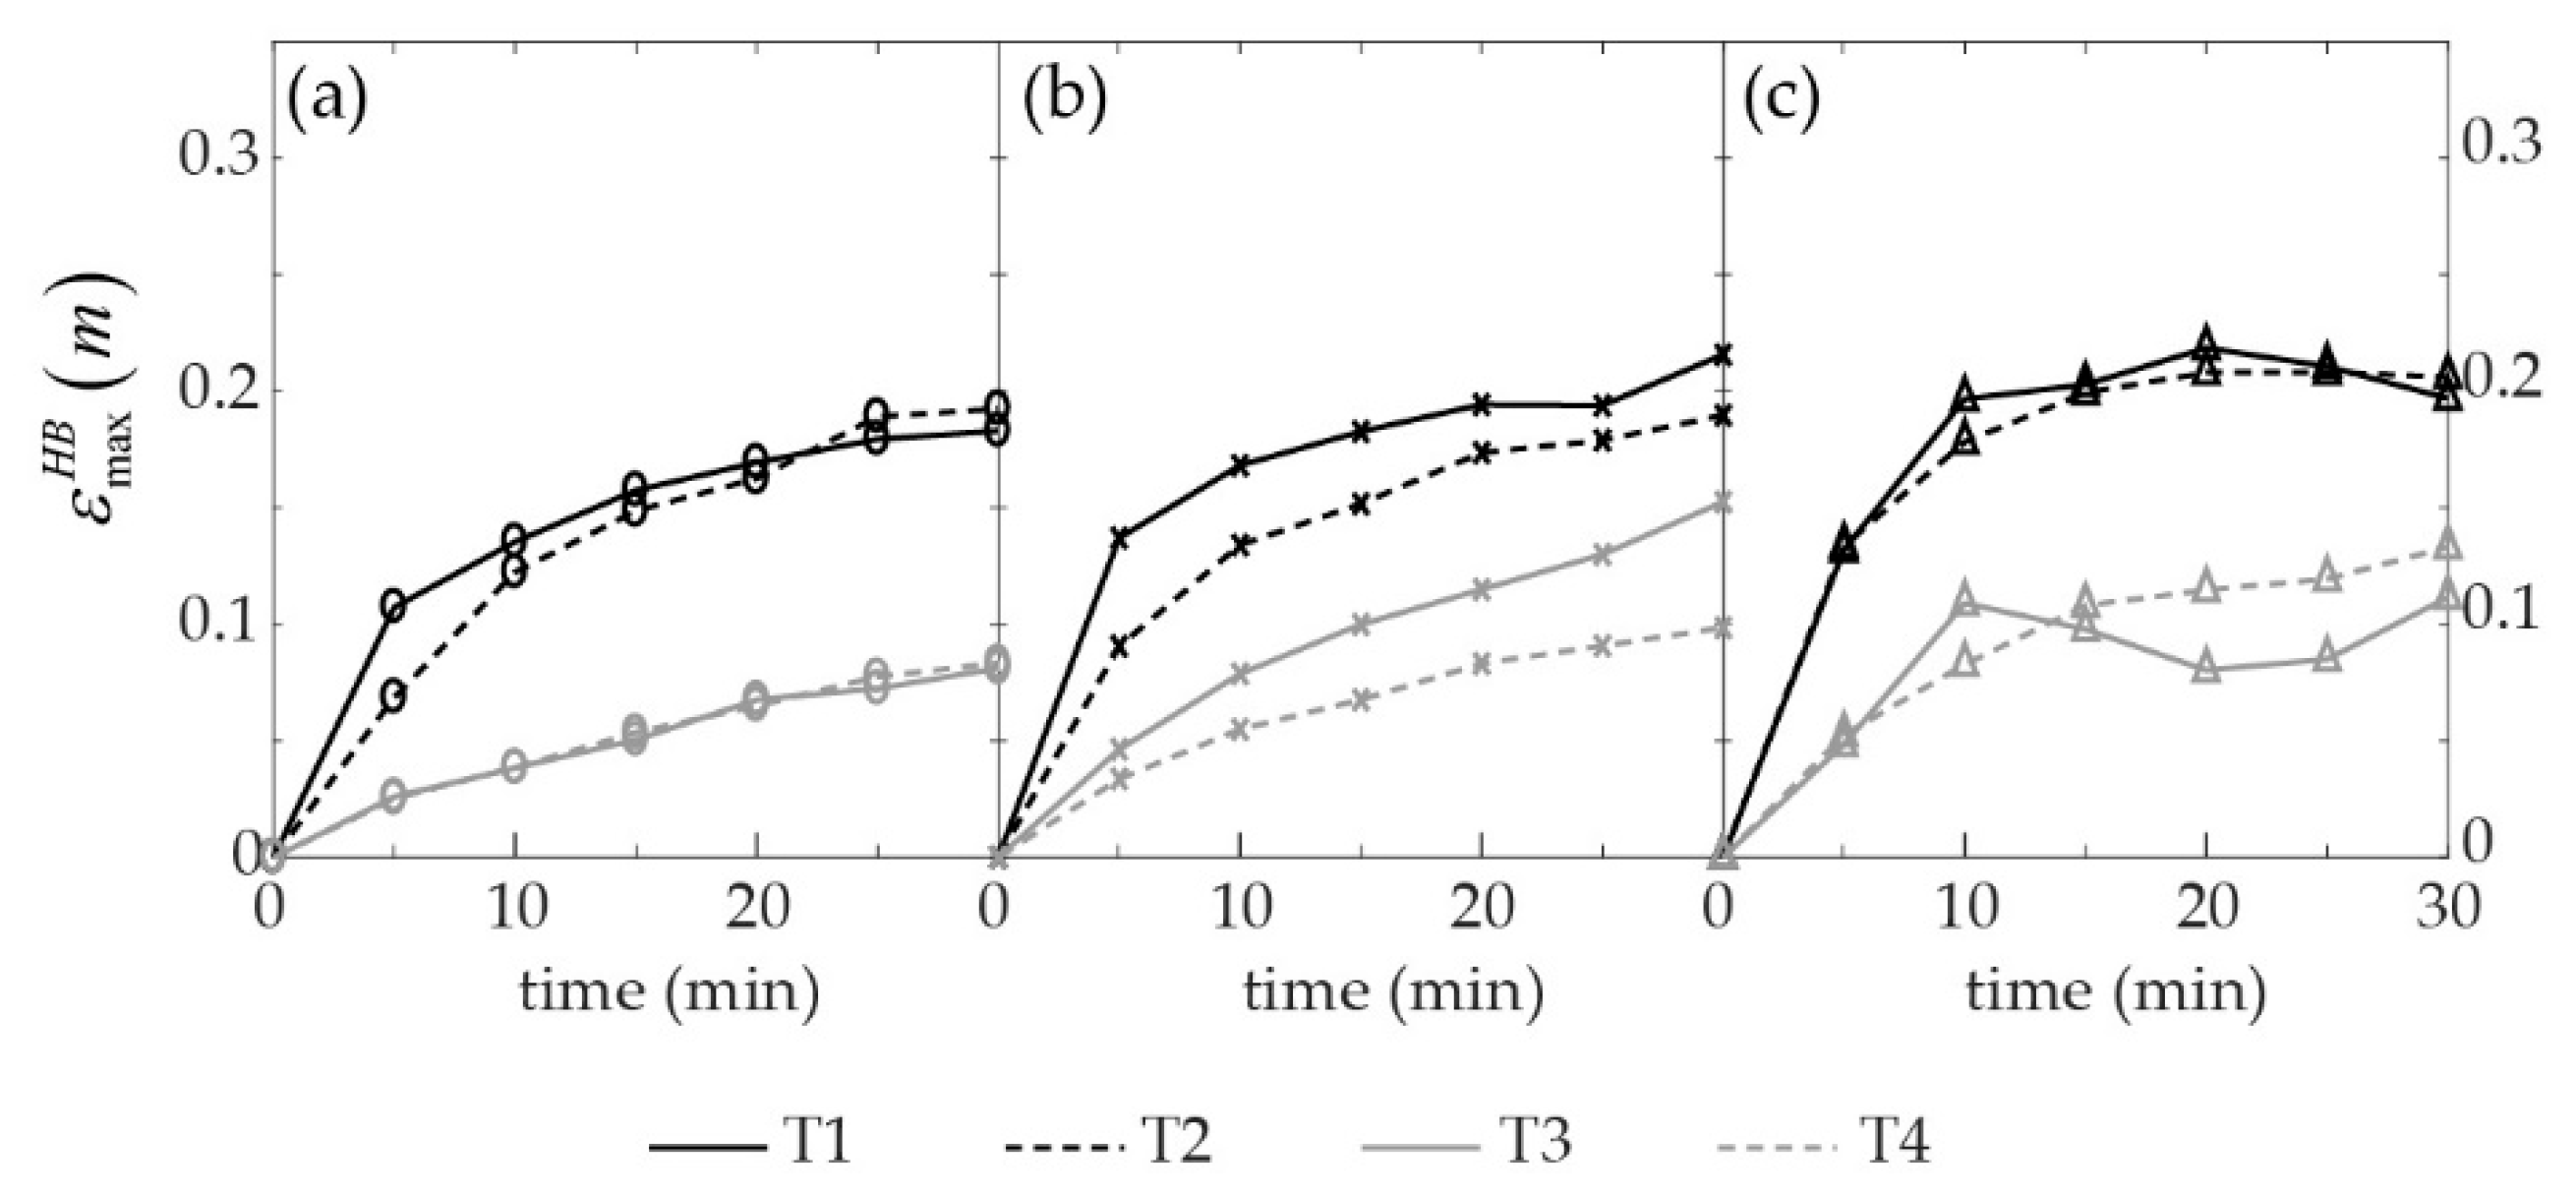
Results of maximum eroded depth due to the impacts of the jet at the harbor basin area, , considering the forward tests are plotted in Figure 6. Lines are colored according to the different scenarios. In general terms, when the propellers are closer to the sediment bed (, black lines), scouring depth is almost twice as high as the results obtained with the propellers are located further from the bed (, gray lines). On the other hand, the distance to the front wall does not seem to play an important role, since the differences between (continuous lines) and (dashed lines) are not significant.
The significant decrease in of T3-fwd-400 rpm, Figure 6c, is caused by the merging of the two scouring areas already discussed at the beginning of this section. In fact, the results of maximum scouring depth at the harbor basin, , are obtained from the centerlines plotted in Figure 5c, where the centerline behavior changes substantially after a 15 min run (yellow line). This also occurs for T1-fwd-400 rpm, Figure 6c, after 20 min, but at smaller magnitudes.
The differences between the revolution speeds in Figure 6 are significant at the early stages of the tests, but become less important after a 30 min run, although maximum scouring depth is always higher for larger values of n. A steady state is considered to be reached after 30 min, according to the results presented in Figure 6, the results obtained using the formula proposed by [17] and the steady-state time established by [25].
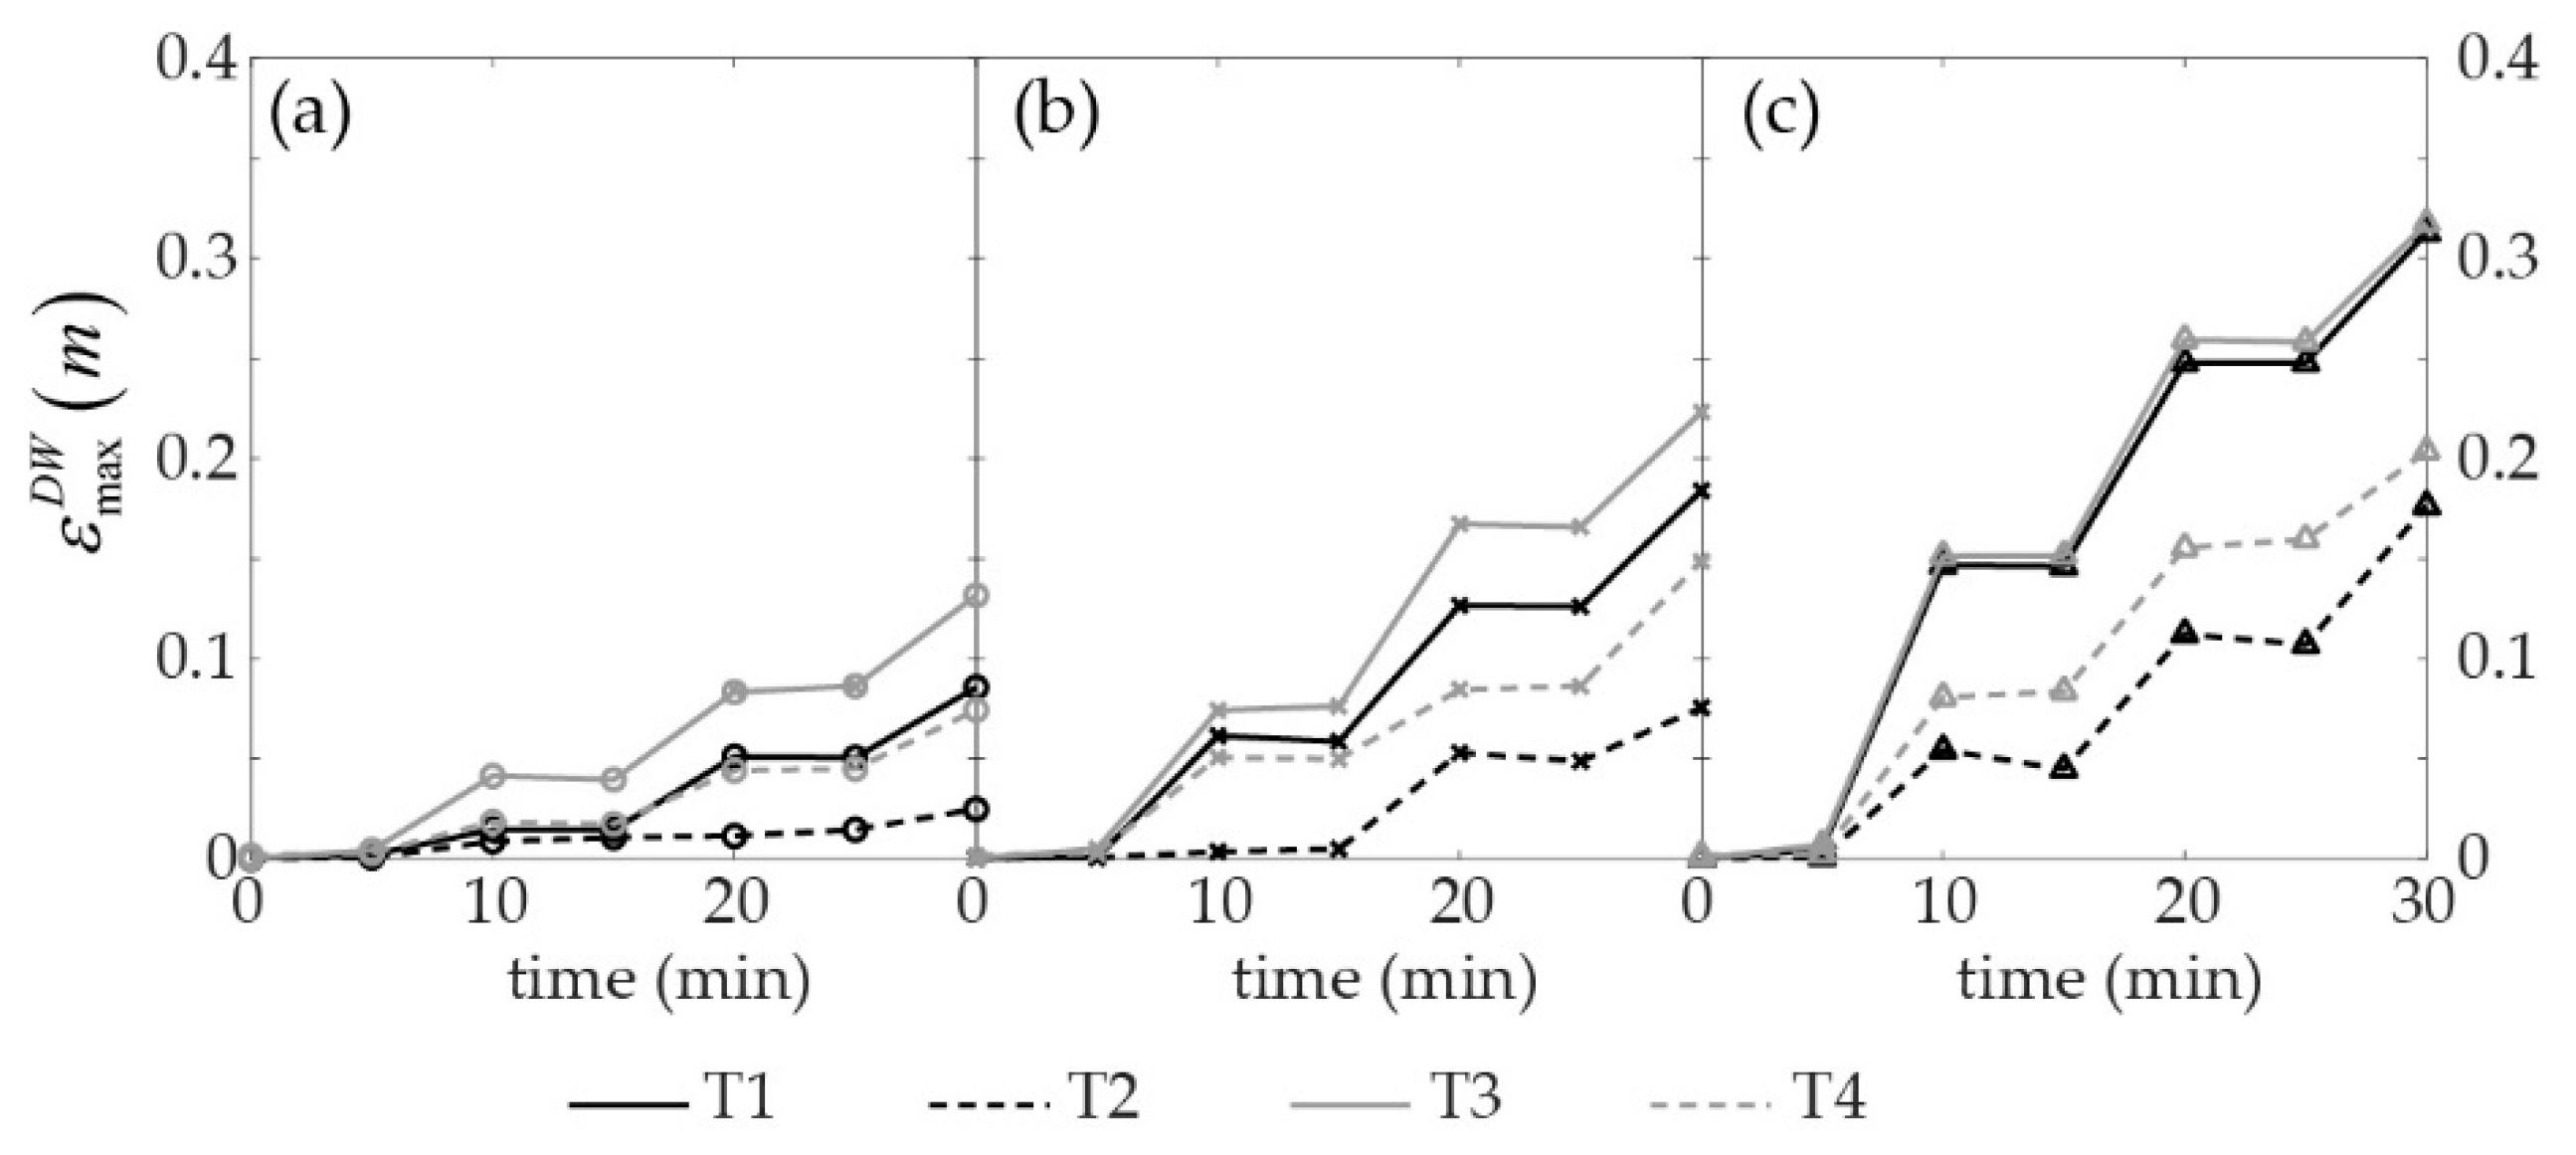
In the vicinity of the docking wall, Figure 7, the evolution of the maximum scouring depth at the docking wall, , has a completely different behavior from the evolution of the maximum scouring depth at the harbor basin, . The blanking area close to the wall in the present experiment (see Figure 2) can reduce the absolute values of maximum eroded depth at the vertical wall by up to 5 cm. However, the results presented herein are used qualitatively to differentiate the two scouring areas and obtain the orders of magnitude of the differences between the evolution of the scouring hole produced by the direct impact of the propeller jet to the sediment bed at the harbor basin area, and the effects of the returning flux at the toe of the docking wall. The differentiation between the two eroded areas clearly indicates that the behavior of the erosion is different, depending on the area of study. Moreover, in the forward scenarios, the final erosion at the vertical wall can reach higher values (in the case of T4-fwd-400 rpm, three times larger) than the maximum erosion depth at the harbor basin area.
Close to the wall, the increase of the erosion is clearly affected by the speed revolution; maximum eroded depth can be two or three times bigger when n increases from 300 rpm, Figure 7a, to 400 rpm, Figure 7c, although the erosion has apparently not reached the asymptotic state.
The maximum erosion at the toe of the vertical wall depends on the clearance distance (black and gray lines in Figure 7), with higher values of when the propellers are further from the sediment bed, this is . Likewise, the distance between the propeller plane and the vertical wall also influences the final results of the maximum scouring depth at the toe of the docking wall. In Figure 7, when the propellers are closer to the vertical wall ( continuous lines), the maximum eroded depth is always higher, regardless of the values of the other variables.
3.2. Back and Forth Tests
The introduction of the back-and-forth scenarios attempts to reproduce the scouring process similar to prototype effects in real harbor basins, since it combines docking and undocking maneuvers. Tests shown in Figure 8 start with a horizontal sediment bed, representing a new or a recently fixed harbor basin. Then a vessel docks at a particular quay using the astern engine telegraph order at the end of the maneuver, in the backwards direction, Figure 8a. Then, the undocking maneuver can start, with the twin propellers working ahead, in the forward direction, Figure 8b.
In Figure 8, a sequence of the back-and-forth scenario shows the evolution of the sediment bed and the formation of three scouring holes: a first one located slightly upstream of the propellers (right side of the red line) and formed mainly during the backward runs (Figure 8a,c); a second one located downstream of the propellers, originated during the forward runs (Figure 8b,d) and similar to the main hole present in the forward scenarios; and, finally, a third one in the vicinity of the front wall, formed by the impact of the propeller flux at the wall during the forward runs (Figure 8b,d). The first two are originated by the impact of the jet flow at the sediment bed, whereas the latter is caused by the returning flux of the original propeller jet. When the vessel finishes the docking maneuver with both propellers working backward/astern, Figure 8a, the sediment erosion is located underneath, slightly upstream of their vertical position. Afterwards, when the undocking maneuver starts, with the twin propellers rotating forward/ahead, the action towards the sediment bed starts downstream of the propellers, as seen in Figure 8b, and the scouring hole created during the previous maneuver reduces its depth slightly (see Figure 9). During the next step, simulating a second docking maneuver consecutive with the two maneuvers previously described, Figure 8c, the scouring hole created downstream of the propeller decreases in depth at the same time as the main scouring hole of the first docking maneuver increases its size. Finally, Figure 8d shows the scan following two backward maneuvers and two forward maneuvers, reproduced intercalatedly and iteratively. In this plot, the last five minutes of the forward run have increased the downstream hole, decreased the upstream hole, and influenced the area close to the wall enough to create the third scouring hole in the vicinity of the vertical front wall. However, this influence on the vertical front wall shows up earlier if the centerline longitudinal profiles are plotted, see Figure 9. The light purple line in Figure 9 is the first erosion profile produced after a 5 min run in astern engine order mode, and the scouring action is concentrated upstream the vertical location of the propellers, whereas the accretion is located both upstream and downstream. However, after a 5 min run in the forward direction (dark purple lines in Figure 9), the scouring action slightly increases the depth of the main scouring hole and, at the same time, reduces the accretion downstream of the propellers, starting a new scouring hole at this particular point, and also starts acting near the vertical wall.
The results of maximum scouring depth in the scenarios combining docking and undocking maneuvers (back-and-forth) at the harbor basin area, , are plotted in Figure 10. In this case, the main differences arise when the rotation speed increases independently of the clearance distance (an unexpected behavior of the erosion in the harbor basin, based on forward engine order scenario in Figure 6, where the effects of the clearance distance are evident). Similarly, no differences among the scenarios with different distances between the propellers and the vertical wall (Xw) are found in Figure 10, showing that this is not a key parameter in the depth of the scouring hole at the harbor basin.
Figure 10 confirms that the combination of backward and forward flux direction, trying to reproduce arrival and departure maneuvers at the real harbor basin, differs substantially from the experiments performed so far in literature, and previously in this article (Figure 6), using only forward engine telegraph orders.
The behavior of ahead and astern direction combining back and forth maneuvering yields interesting results in terms of evolution and maximum scouring depth magnitudes. In Figure 10, when the speed revolution increases, the effects on the sediment bed are more significant, yielding deeper scouring holes at the harbor basin area that are more significant than in the experiments using only the forward maneuver, Figure 6. Apparently, the asymptotic stage is not reached in any of the back-and-forth experiments.
When looking at the effects of the returning flux at the toe of the vertical wall, , Figure 11 plots the maximum eroded depth at the intersection between the sediment bed and the docking wall. In this case, contrary to what succeeded in the forward scenarios, the maximum eroded depth at the toe of the wall is smaller when compared to the maximum eroded depth at the harbor basin area, as seen in Figure 10, except in the cases of final erosion in T3 and T4 for n = 400, where . However, in the same way as in the forward scenario, the erosion in the vicinity of the vertical wall is still growing after 30 min, meaning that the steady state for scouring depth is expected to be higher. Higher rotation speed values yield deeper eroded depth, and the impact of the returning flux on maximum eroded depth is greater when the propellers are located further from the sediment bed. At the same time, lower distances between the propeller plane and the vertical wall, continuous lines in Figure 11, cause deeper scouring holes at the toe.
Figure 11 confirms the information outlined in Figure 9 regarding the influence of the forward runs on the erosion at the toe of the vertical wall. Thus, in Figure 11 starts increasing only when the propellers are working ahead/forward for the first time, at t = 10 min, showing that it already influences this area of the sediment bed. Moreover, astern/backward runs () do not have any influence on the erosion at the toe of the vertical wall, since does not deviate from the value of the previous run.
4. Discussion
The jet flow originated by stern propellers causes severe damage to the toes of the docking structures during approximation and departure maneuvers. However, the evolution of the maneuver along the harbor basin also affects its sediment bed throughout the entire maneuver, producing scouring holes and the motion of eroded sediment. This latter effect has no influence on the stability of harbor structures, but the deposition of the scoured material at other areas of the harbor basin reduces the operability of the basin itself. At the same time, as described in the Introduction section, the effects of the stern propellers during harbor maneuvers can affect particular bed protections designed to trap contaminated sediment below them.
The study of the maximum eroded depth produced by the stern propeller jet flow in different scenarios has led to the definition of the jet itself. In particular, the focus of this study has tried to reproduce the consequences of this jet flow with the influence of a vertical wall simulating the berthing infrastructures during docking and undocking maneuvers. It is important to outline that the width and length of the LaBassa tank were large enough to avoid the influence of the lateral walls and the opposite vertical wall, as concluded by [13]. Moreover, the experimental facility only allowed a fixed configuration with respect to the vertical wall and the sediment bed. However, given the former limitations of the experimental facility, the results presented throughout the document can be used as guidelines to estimate the effects of regular vessels at their particular docking location.
According to the sediment bed 3D scans obtained using 24 different configurations of the location and speed revolution of the propellers during both docking and undocking maneuvers close to a vertical wall, the vessel produces two different erosion areas: (i) nearby the propellers, that is, at the harbor basin area; and (ii) at the toe of the vertical wall. Each scouring hole is caused by the jet flow of the propellers and its interaction with the horizontal (seafloor) and vertical (berthing wall) limits of the basin.
The scouring hole at the harbor basin is originated by the impact of the jet flow with the bed sediment, regardless of the engine telegraph order under which the propellers are running (ahead/forward or astern/backward). Ref. [26] defines the expansion angle as the angle between the impact point of the exterior jet flow and the sediment bed. If the clearance distance is of the order of 20 cm, the expansion angle can be from 13° to 20°, which, in the present experiments, should be a distance of between 70 and 112 cm. However, according to the results obtained, the impact distance from the propeller plane to the maximum erosion depth in the harbor basin is around 70 cm in T1-fwd and below 70 cm in T2-fwd. When the propellers are rotating astern, the distance is reduced substantially to down to 30 cm. In the case of , according to [26], the expansion angle should reduce to 10° and, therefore, the jet may impact 230 cm downstream of the propeller plane. In the present experiments, the jet impacted the sediment bed at a distance of around 100 cm. These differences from the results presented by [26] are mainly due to the influence of the vertical wall, particularly when the clearance distance is larger.
The results of maximum scouring depth at the harbor basin depend on the successive engine telegraph orders in which the propellers are rotating. When the experiments are performed using only the forward direction, the maximum erosion depth depends mainly on the speed rotation and the clearance distance, with a slight influence on the distance between the stern propeller plane and the vertical wall. Moreover, at large values of speed rotation, the scouring hole at the harbor basin merges with the scouring hole at the toe of the vertical wall when the propellers are in the closer position with respect to this vertical wall. If the scenario combining back-and-forth tests is used, the maximum eroded depth only changes with the rotation speed, see Figure 10, with no influence on the clearance distance and the distance to the vertical wall. This combination of engine telegraph order yields interesting results in terms of the formation of the scouring holes. The experiments were performed starting with astern/backward engine telegraph orders, and the first scouring hole at the harbor basin was formed upstream the propellers, at a shorter distance from them. The depth of this hole, Figure 10, is almost twice as large as the depth of the first five minute run in the ahead/forward engine telegraph order, as shown in Figure 6. Actually, the depth of the scouring hole obtained at the end of the experiments is significantly larger when the two telegraph orders (ahead/astern) are combined. When [1] computed the maximum eroded depth using the formulas presented in the literature, they concluded that only two equations, [17,21], yielded feasible results, although they were twice the real value. The formulas were presented after experimental work using either a single propeller in forward continuous mode or a simple jet impacting a sediment bed, respectively. The final results of maximum scouring depth when back-and-forth combinations are used are not twice the final scouring depth using only ahead/forward engine telegraph order, if we compare Figure 6 and Figure 10, although they are still higher. Therefore, the previous equations should still be used, bearing in mind that they clearly overestimate the maximum eroded depth.
The scouring hole at the toe of the vertical wall is caused by the returning flux of the propellers. The vertical component of the flux at the wall erodes the area at the intersection between the vertical wall and the sediment bed. In some particular cases of the only forward scenarios, Figure 7, for low speed revolution, the initial stages of the sediment bed evolution cloase to the toe of the wall present a small sedimentation. This is an apparent sedimentation produced by the lack of data at areas close to the vertical wall due to the blank measuring area, 25 cm, as seen in Figure 2. Thus, small erosion at the toe of the wall shall be expected.
The results indicate that the influence of the revolution speed is the most important in the erosion phenomenon close to the toe of the wall, rather than other variables, regardless of the direction of propeller rotation in which the experiments were performed. In general terms, maximum values of are obtained for minimum values of , as expected, since the jet is more energetic when it impacts the wall, and thus the returning flux has a higher velocity. Surprisingly, this is not the case for minimum values of the clearance distance ; according to Figure 7 and Figure 11, the scouring holes at the toe of the vertical wall are deeper when the propellers are further from the sediment bed (gray lines). This can be explained by the variation in the impact angle; the impact angle decreases for larger values of , and the distance at which the jet impacts the sediment bed increases, being closer to the vertical wall. Therefore, the loss of momentum due to the impact of the sediment bed is produced at areas closer to the vertical wall, and the flux velocities reaching the wall are higher. The results obtained from the equation proposed by [17] for the maximum scouring depth in the presence of a vertical wall estimate a maximum erosion for of between 15 and 25 cm, which is congruent with the results obtained for maximum scouring depth in the harbor basin (see Figure 6), but underestimates the erosion at the toe of the vertical wall (see Figure 7). Moreover, maximum scouring depth in the vicinity of the docking wall did not reach the steady state during the presented experiments, meaning that the maximum erosion depth should be expected to be larger than the present results. In the case of , the equation proposed by [17] yields results for maximum erosion depth of 25 to 35 cm, higher than for , which are only valid for the results obtained at the docking wall, although they overestimate the minimum values (see Figure 7).
In the scenario combining back-and-forth tests, the erosion at the toe of the wall starts only when the ahead/forward engine telegraph order is run, which is at 10 min. The astern/backward engine telegraph order, and therefore the docking maneuver, does not have any impact on the erosion close to the vertical wall, Figure 11. However, the erosion in this area is not exactly equal to the accretion of the harbor basin scoured hole in Figure 10. In fact, the erosion produced by the ahead/forward engine telegraph orders is larger than the sedimentation occurred at the scouring hole of the harbor basin, indicating that other accretion areas are produced when the propellers rotate inwards.
5. Conclusions
The analysis of experimental work performed to estimate the scouring effects produced by stern propellers during docking and undocking maneuvers has pointed out the need to include the effects of twin propeller configurations and propeller rotation direction. The present contribution introduced the use of twin propeller experimental results and the description of the consequences and erosion evolution of the sediment bed when incorporating back-and-forth scenarios.
During docking and undocking maneuvers, the effects of stern propellers can be divided into two different actions: (i) the impact of the propeller flow on the sediment bed, producing important scouring holes at the harbor basin area; and (ii) the impact of the propeller flow on the docking wall, and its subsequent returning flux, eroding the toe of the vertical wall.
The use of a continuous ahead/forward scenario in the experiments presented in the literature underestimates the maximum erosion depth at the harbor basin, and overestimates the effects at the toe of the wall. This is due to the importance that the forward scenario has with regard to erosion rates, since the backward scenario creates deeper scouring holes than the forward rotating direction using the same revolution speed. However, the present experiments did not reach the asymptotic state, and the erosion at the toe of the vertical wall in the back-and-forth scenarios should continue increasing, reaching the maximum values of the continuous forward scenarios.
The variables used in the present experiments also play an important role when comparing the continuous-forward scenarios and the back-and-forth scenarios. Apparently, neither the clearance distance nor the distance to the vertical wall seem to influence the maximum eroded depth at the harbor basin for back-and-forth scenarios, although they are important in the erosion at the toe of the docking wall. As expected, when the propellers are closer to the vertical wall, the effects on the maximum eroded depth are more significant. On the contrary, further distances to the sediment bed produce deeper scouring holes at the toe. This indicates that and increase in draft particulars may not increase the final erosion depth, but further research is needed along these lines.
The results presented in this contribution highlight the need to further investigate the consequences of stern propellers on seafloors. The increase in the problems produced by docking vessels in several harbors requires the existence of a tool available to harbor authorities to predict scouring processes and prevent them. More experimental and field data is needed in order to better predict both the potential erosion and sedimentation at the harbor basin.
Author Contributions
A.M.-C. and X.G. conceived and designed the experiments; A.M.-C. and T.L. performed the experiments and analyzed the data; M.l.C., X.G. and X.M.d.O. contributed on the analysis tools; A.M.-C. and M.l.C. wrote the paper.
Funding
This work has been supported by MINECO (Ministerio de Economía y Competitividad) and FEDER (Unión Europea—Fondo Europeo de Desarrollo Regional “Una Manera de hacer Europa”) from the Spanish Government through project TRA2015-70473-R.
Acknowledgments
We greatly acknowledge the technical staff of the UPC CIEMLAB for their support throughout the experiments: Joaquim Sospedra, Jordi Cateura and Òscar Galego.
Conflicts of Interest
The authors declare no conflict of interest.
References
- Mujal-Colilles, A.; Gironella, X.; Sanchez-Arcilla, A.; Polo, C.P.; Garcia-Leon, M. Erosion caused by propeller jets in a low energy harbour basin. J. Hydraul. Res. 2017, 55, 121–128. [Google Scholar] [CrossRef]
- Wang, T.S.; Whelan, M.; Keith, D.; Verduin, J.; Brown, P. Design of the Campbell shipyard sediment remediation project, San Diego, California. In Proceedings of the 26th Annual WEDA Conference, San Diego, CA, USA, 25–28 June 2006; pp. 309–322. [Google Scholar]
- Ebbesmeyer, C.C.; Francisco, M.D.; Boatman, C.D.; Norton, D.; Michelsen, T. Currents generated by vessel traffic along Seattle’s waterfront. In Proceedings of the ‘Challenges of Our Changing Global Environment’, OCEANS ’95 MTS/IEEE, San Diego, CA, USA, 9–12 October 1995; Volume 1, pp. 26–41. [Google Scholar]
- Hayes, D.; Chintamaneni, R.; Bommareddy, P. Propwash Impacts on Water Quality around Dredging and Other Marine Construction Activities. 2009. Available online: https://www.westerndredging.org/phocadownload/ConferencePresentations/2010_SanJuanPR/Session1-DredgingResearch/ (accessed on 21 March 2015).
- Albertson, M.L.; Dai, Y.B.; Jensen, R.A. Diffusion of submerged jets. ASCE Trans. Pap. 1950, 2409, 639–664. [Google Scholar]
- Robakiewicz, W. Theories and the hydraulic investigations applied to the analysis of the jet behind the screw. Rozpr. Hydrotech. 1966, 19. [Google Scholar]
- Blaaw, H.G.; van de Kaa, E.J. Erosion of bottom and sloping banks caused by the screw race of manoeuvring ships. In Proceedings of the 7th International Harbour Congress, Antwerp, Belgium, 22–26 May 1978. [Google Scholar]
- Fuehrer, M.; Römish, K.; Engelke, G. Criteria for dimensioning the bottom and slope protections and for applying the new methods of protecting navigation canals. In Proceedings of the PIANC XXVth Congress, Edinburgh, UK, June 1981. [Google Scholar]
- Stewart, D.P.J. Characteristics of a Ship’s Screw Wash and the Influence of Quay Wall Proximity. Ph.D. Thesis, Queen’s University of Belfast, Belfast, UK, 1992. [Google Scholar]
- Hashmi, N. Erosion of a Granular Bed at a Quay Wall by a Ship’s Screw Wash. Ph.D. Thesis, Queen’s University of Belfast, Belfast, UK, 1993. [Google Scholar]
- Hamill, G.; McGarvey, J.A. Designing for propeller action in harbours. Coast. Eng. Proc. 1996, 1, 4451–4463. [Google Scholar]
- PIANC. Guidelines for Protecting Berthing Structures from Scour Caused by Ships; Report n° 180; The World Association for Waterborne Transportation Infrastructure: Burxelles, Belgique, 2015. [Google Scholar]
- Mujal-Colilles, A.; Gironella, X.; Crespo, A.J.C.; Sanchez-Arcilla, A. Study of the Bed Velocity Induced by Twin Propellers. J. Waterw. Port Coast. Ocean Eng. 2017, 143, 04017013. [Google Scholar] [CrossRef]
- Blokland, T.; Smedes, R.H. In Situ tests of current velocities and stone movements caused. In Proceedings of the 11th International Harbour Congress, Antwerpen, Belgium, 17–21 June 1996. [Google Scholar]
- Hamill, G. Characteristics of the Screw Wash of a Manoeuvring Ship and the Resulting Bed Scour. Ph.D. Thesis, Queen’s University of Belfast, Belfast, UK, 1987. [Google Scholar]
- Chiew, Y.; Lim, S. Local scour by a deeply submerged horizontal circular jet. J. Hydraul. Eng. 1996, 122, 529–532. [Google Scholar] [CrossRef]
- Hamill, G.; Johnston, H.T.; Stewart, D. Propeller Wash Scour Near Quay Walls. J. Waterw. Port Coast. Ocean Eng. 1999, 125, 170–175. [Google Scholar] [CrossRef]
- Canepa, S.; Hager, W.H. Effect of Jet Air Content on Plunge Pool Scour. J. Hydraul. Eng. 2003, 129, 358–365. [Google Scholar] [CrossRef]
- Chiew, Y.; Hong, J.; Susanto, I.; Cheng, N. Local scour by offset and propeller jets. In Proceedings of the 6th International Conference on Scour and Erosion (ICSE6), Paris, France, 27–31 August 2012; pp. 949–956. [Google Scholar]
- Del Estado, P. Obras de Atraque y Amarre: Criterios generales y Factores del Proyecto (R.O.M. 2.0-11). 2012. Available online: http://www.puertos.es/es-es/ROM/Documents/-ROM%202.0%20Present.pdf (accessed on 15 February 2013).
- Hong, J.-H.; Chiew, Y.-M.; Susanto, I.; Cheng, N.-S. Evolution of scour induced by propeller wash. In Proceedings of the 6th International Conference on Scour and Erosion (ICSE6), Paris, France, 27–31 August 2012; p. 147. [Google Scholar]
- Hong, J.-H.; Chiew, Y.-M.; Cheng, N.-S. Scour Caused by a Propeller Jet. J. Hydraul. Eng. 2013, 139, 1003–1012. [Google Scholar] [CrossRef]
- Verheij, H. Comparison of Water Jets and Conventional Propeller Jets. 1983. Available online: https://repository.tudelft.nl/islandora/object/uuid:de1e07e6-d4e1-4513-b4fd-84b50ac2f0e0/datastream/OBJ1/download (accessed on 28 September 2017).
- Martín-Vide, J.; Cisneros, A.; Dolz, J. Similarity for Turbulent Mixing Vessels. Reynolds Number Effect. In Proceedings of the XXIII Congress, IAHR, Ottawa, ON, Canada, 21–25 August 1989; Volume 1. [Google Scholar]
- Hamill, G. The scouring action of the propeller jet produced by a slowly manoeuvring ship. Bull. Perm. Int. Assoc. Navig. Congr. 1988, 62, 85–110. [Google Scholar]
- Johnston, H.T.; Hamill, G.; Wilson, P.R.; Ryan, D. Influence of a boundary on the development of a propeller wash. Ocean Eng. 2013, 61, 50–55. [Google Scholar] [CrossRef]
Figure 1.
Schematic view of LaBassa tank. (a) Lateral view with a zoom on at the helices zone; (b) Front view. Hw is the water height and Hs is the sediment height.
Figure 1.
Schematic view of LaBassa tank. (a) Lateral view with a zoom on at the helices zone; (b) Front view. Hw is the water height and Hs is the sediment height.

Figure 2.
Scaled plain view of LaBassa. Cross zone covers the zone measured with the Echo Sounds.

Figure 3.
Sediment bed scanning results after 30 min of propeller run. Black lines represent z = 0. Red lines indicate the position of the propeller planes. (a) T1-fwd, n = 400 rpm, (b) T1-b&f, n = 400 rpm; (c) T4-fwd, n = 300 rpm; (d) T4-b&f, n = 300 rpm.
Figure 3.
Sediment bed scanning results after 30 min of propeller run. Black lines represent z = 0. Red lines indicate the position of the propeller planes. (a) T1-fwd, n = 400 rpm, (b) T1-b&f, n = 400 rpm; (c) T4-fwd, n = 300 rpm; (d) T4-b&f, n = 300 rpm.

Figure 4.
Transversal profile of T4-b&f, n = 400 rpm, t = 5min. (a) 3D scan of the sediment bed. Red line: transversal profile located at x = 2.5 m; (b) Transversal profile. Dashed line: symmetry plane between propellers. Gray ellipses: distorted sketch of the propellers using real location with respect to the y axis.

Figure 5.
Longitudinal profiles of T3-fwd located at centerline between propellers. Red line indicates the position of the propellers. Gray dashed line separates the docking wall scouring area (left of the dashed line) and harbor basin scouring area (right of the dashed line). (a) 300 rpm; (b) 350 rpm; (c) 400 rpm.

Figure 6.
Maximum scouring depth of forward scenarios due to the impact of the propeller jet at the harbor basin area. Black lines , gray lines , continuous lines = 7, dashed lines = 10. (a) 300 rpm; (b) 350 rpm; (c) 400 rpm.
Figure 6.
Maximum scouring depth of forward scenarios due to the impact of the propeller jet at the harbor basin area. Black lines , gray lines , continuous lines = 7, dashed lines = 10. (a) 300 rpm; (b) 350 rpm; (c) 400 rpm.

Figure 7.
Maximum scouring depth of forward scenarios due to the impact of the returning flux at the docking wall. Black lines , gray lines , continuous lines = 7, dashed lines = 10. (a) 300 rpm; (b) 350 rpm; (c) 400 rpm. Negative values indicate deposition, whereas positive values are erosion.
Figure 7.
Maximum scouring depth of forward scenarios due to the impact of the returning flux at the docking wall. Black lines , gray lines , continuous lines = 7, dashed lines = 10. (a) 300 rpm; (b) 350 rpm; (c) 400 rpm. Negative values indicate deposition, whereas positive values are erosion.

Figure 8.
3D scans of the sediment bed for the T2-b&f scenario, n = 350 rpm. (a) t = 5 min—backward; (b) t = 10 min—forward; (c) t = 15 min—backward; (d) t = 20 min—forward.
Figure 8.
3D scans of the sediment bed for the T2-b&f scenario, n = 350 rpm. (a) t = 5 min—backward; (b) t = 10 min—forward; (c) t = 15 min—backward; (d) t = 20 min—forward.

Figure 9.
Time evolution of the centerline longitudinal profile between propellers for the T2 b&f scenario. Red line indicates the position of the propellers. (a) 300 rpm; (b) 350 rpm; (c) 400 rpm.
Figure 9.
Time evolution of the centerline longitudinal profile between propellers for the T2 b&f scenario. Red line indicates the position of the propellers. (a) 300 rpm; (b) 350 rpm; (c) 400 rpm.

Figure 10.
Maximum scouring depth of back-and-forth scenarios due to the impact of the propeller jet at the harbor basin area. Black lines , gray lines . Continuous lines = 7, dashed lines = 10. (a) 300 rpm; (b) 350 rpm; (c) 400 rpm.
Figure 10.
Maximum scouring depth of back-and-forth scenarios due to the impact of the propeller jet at the harbor basin area. Black lines , gray lines . Continuous lines = 7, dashed lines = 10. (a) 300 rpm; (b) 350 rpm; (c) 400 rpm.

Figure 11.
Maximum scouring depth of back-and-forth scenarios due to the impact of the returning flux at the docking wall. Black lines , gray lines , Continuous lines = 7, dashed lines = 10. (a) 300 rpm; (b) 350 rpm; (c) 400 rpm.
Figure 11.
Maximum scouring depth of back-and-forth scenarios due to the impact of the returning flux at the docking wall. Black lines , gray lines , Continuous lines = 7, dashed lines = 10. (a) 300 rpm; (b) 350 rpm; (c) 400 rpm.


Table 1.
Tests description. Each test contains 3 different values of n (300, 350, 400) and an analysis of the sediment bed evolution every 5 min. Total duration of a single test: 30 min.
Table 1.
Tests description. Each test contains 3 different values of n (300, 350, 400) and an analysis of the sediment bed evolution every 5 min. Total duration of a single test: 30 min.
| (m) | Xw (m) | Maneuver | Test | n (rpm) | Time (min) |
|---|---|---|---|---|---|
| Forward | T1-fwd | 300 350 400 | 0-5-…-30 | ||
| Back & Forth | T1-b&f | ||||
| Forward | T2-fwd | ||||
| Back & Forth | T2-b&f | ||||
| Forward | T3-fwd | ||||
| Back & Forth | T3-b&f | ||||
| Forward | T4-fwd | ||||
| Back & Forth | T4-b&f |
© 2018 by the authors. Licensee MDPI, Basel, Switzerland. This article is an open access article distributed under the terms and conditions of the Creative Commons Attribution (CC BY) license (http://creativecommons.org/licenses/by/4.0/).
Share and Cite
MDPI and ACS Style
Mujal-Colilles, A.; Castells, M.; Llull, T.; Gironella, X.; Martínez de Osés, X. Stern Twin-Propeller Effects on Harbor Infrastructures. Experimental Analysis. Water 2018, 10, 1571. https://doi.org/10.3390/w10111571
AMA Style
Mujal-Colilles A, Castells M, Llull T, Gironella X, Martínez de Osés X. Stern Twin-Propeller Effects on Harbor Infrastructures. Experimental Analysis. Water. 2018; 10(11):1571. https://doi.org/10.3390/w10111571
Chicago/Turabian StyleMujal-Colilles, Anna, Marcel·la Castells, Toni Llull, Xavi Gironella, and Xavier Martínez de Osés. 2018. "Stern Twin-Propeller Effects on Harbor Infrastructures. Experimental Analysis" Water 10, no. 11: 1571. https://doi.org/10.3390/w10111571
Note that from the first issue of 2016, this journal uses article numbers instead of page numbers. See further details here.