Article

Soil Salinity Assessment Using Saturated Paste and Mass Soil:Water 1:1 and 1:5 Ratios Extracts

Department of Natural Resources Development and Agricultural Engineering, Agricultural University of Athens, Greece, 75 Iera Odos Street, 11855 Athens, Greece
*
Author to whom correspondence should be addressed.
Water 2018, 10(11), 1589; https://doi.org/10.3390/w10111589
Submission received: 17 October 2018 / Revised: 2 November 2018 / Accepted: 2 November 2018 / Published: 6 November 2018
(This article belongs to the Special Issue Insights on the Water–Energy–Food Nexus)

Abstract

:
Soil salinization is directly related to the quantity and quality of food production, and often, to increased energy demands for high-quality irrigation water. Reliable monitoring of soil salinity based on a less laborious method than the soil saturated paste (SP) extract methodology is required. In the present study, an attempt is made to relate the electrical conductivity (EC) of the soil saturated paste (SP) extract (ECe) with the EC determined in the 1:1 and 1:5 soil over water mass ratios, (soil:water) extracts (EC1:1 and EC1:5). ECe, EC1:1, and EC1:5 values were obtained for 198 soil samples from five different locations in Greece. The results have shown that strong linear relationships exist between the ECe and the EC1:1 and EC1:5 values (R2 > 0.93), and that the slopes of these linear relationships decreased from coarse to fine soil types. For 123 soil samples, the concentrations of Κ+, Νa+, Ca2+, Mg2+, and Cl were also determined in the extracts of the three applied methodologies. Ion concentrations in the 1:1 and 1:5 extracts were highly correlated with the respective ion concentrations in the SP extracts. These findings strongly suggest that EC1:1 and EC1:5 values can be safely used for the estimation of ECe.

1. Introduction

All terrestrial life ultimately depends on soil and water. So commonplace and seemingly abundant are these ecosystem components that we tend to treat them with contempt [1]. Today, the explosive growth of human population makes it necessary to increase productivity. Intensification of irrigated agriculture is no longer the solution. The ability of natural resources (soil and water) to produce food is limited, and the exploitation of land and water resources beyond certain limits will result in soil degradation and lower productivity. Modern irrigated agriculture, exercised in arid or semi-arid places, depends to a large extent on water that is abstracted from underground aquifers. A direct consequence of this is the necessity of pumping water from deeper and deeper wells, which requires the use of larger and larger amounts of energy. Moreover, overexploitation of unconfined underground aquifers in coastal areas leads gradually to reversing the direction of the hydraulic head gradient, and inevitably, to sea-water intrusion, with its adverse effects on water quality manifesting in secondary soil salinization.
Soil salinity is a basic factor that, to a large extent, determines soil suitability for agricultural productivity. Apart from secondary soil salinization, another predominant mechanism for salt accumulation in irrigated agricultural soils is evapotranspiration, a process that promotes salts concentration in the remaining soil water. The problem of soil salinity is growing in arid and semi-arid regions. Approximately 995 million hectares of land around the world are estimated to suffer from salinity problems [2]. Adequate knowledge of the amount and distribution of salt is required for the management of saline soils. Soil salinity assessment is based on measurements of the electrical conductivity of saturated paste extracts (ECe); this has been established as the standard method [3]. In addition, ECe simulates a naturally-occurring state of the soil solution, and can be related to plant-growth response. Unfortunately, this method is tedious, time consuming, and requires skills and expertise to reach saturation point, especially for clay soils [3]. ECe determination in SP extracts from a large number of soil samples, as in cases of salinity monitoring that involves repeated soil sampling from different parts of the field during the growing season, appears to be difficult and laborious [4].
For these reasons, instead of measuring ECe, many researchers have suggested that it would be easier to determine EC in various soil over water mass ratios (soil:water) extracts, such as 1:1, 1:2, 1:2.5, 1:5. The most widely-used soil over water mass ratios, (soil:water), are the 1:1 and the 1:5. The ratio of 1:5 is preferred for the assessment of soil salinity in Australia and China [5,6], while the ratio 1:1 is commonly used in the United States [6]. Predetermined and fixed soil over water mass ratios applied in various methodologies result in time reductions for the preparation and acquisition of the extracts, in comparison to the ECe methodology. However, due to the higher dilution of soil solutions, ion concentrations and EC1:1 and EC1:5 values are usually lower than those obtained by the ECe protocol. It is to be noted that soil over water mass ratios are weakly correlated with actual soil conditions. These methods can be very useful in practice when one is not interested in determining the absolute EC values or the absolute soil-salt concentration, but rather, is seeking to determine their relative changes. A serious disadvantage of methods measuring EC in the various soil over water mass ratios extracts is the effect of higher water quantities on the solubility of less soluble salts such as gypsum or lime. For gypsum, as the dilution increases, the concentration of all ions decreases, except of the Ca2+ and the SO42− concentrations, that remain relatively constant. In this respect, due to the presence of less soluble salts in soils containing gypsum or lime, as the degree of dilution increases, ions concentration changes considerably in relation to their respective concentrations in the natural soil solution [3,7,8].
Although strong linear relationships between ECe and EC1:1 or EC1:5 have been reported, the coefficients entering these relationships are not constant, but vary according to the area of interest. The causes leading to such variation are not yet clear. The relationship between ECe and EC of different soil-water extracts is affected by the soil texture and the presence of salts and gypsum in the soil [3]. The equilibration time and method are probably additional factors that have led to the observed differences among various models [9]. Thus, a better understanding of the transferability of these models would provide managers with more information about the accuracy of the ECe values derived from non-local EC conversion models. The respective ECe = f (EC1:1) and ECe = f (EC1:5) equations, together with the appropriate references, are given Table 1.
The relationship ECe = f (EC1:1), as proposed by USDA [3], has the form ECe = 3 (EC1:1). However, this model was not weighted for soil texture or organic matter-content effects on the composition and EC of soil extracts [10]. Sonmez et al. [8] and Franzen [10] studied the EC relationships in three different soil types and proposed a different equation for each soil type (Coarse, Medium, Fine).
The possibility for the ECe prediction from EC1:5 measurements has been investigated in a number of regions worldwide [4,8,9,11,12,13,14]. In these studies, soil texture, specific salts presence, and organic matter content effects were taken into consideration [8,11,12,14,15]. Less examined is the subject of EC1:5 measurement in relation to the methodology, followed for the acquisition of the soil over water mass ratio extract [7].
Slavich and Petterson [12] gave an expression for the multiplicative f factor in the ECe = f EC1:5 relationship according to the Equation (1) below, where θSP denotes the saturation percentage.
f = 2.46 + 3.03 θ SP
Moreover, these authors presented the range and the values of θSP as a function of clay content. From Equation (1), the increase of θSP leads to a decrease of f. In other words, the conversion rate increases as the soil becomes coarser.
Visconti et al. [18] presented ECe = f (EC1:5) relationships for soils with gypsum mass percentages between 0.2–1.5% and >1.5%. They concluded that when the gypsum mass percentage is less than 0.2%, the relationship ECe = f (EC1:5) is strongly linear.
Khorsandi and Yazdi [4], comparing ECe and EC1:5 values for soils from Iran, suggested that gypsum concentration has by far a greater impact on the accuracy of ECe predicting models than soil texture.
He et al. [7,9] tested three agitation methods for the determination of the EC1:5; for each method, nine agitation times were applied. The three agitation methods were (i) shaking plus centrifuging; (ii) shaking; and (iii) stirring. They report that different methods of 1:5 soil over water mass ratio preparation could yield different EC1:5 values. These authors also found that agitation time depends on the ECe value, and proposed a higher agitation time if ECe < 4 dS m−1. He et al. [9] presented ECe = f (EC1:5) models for each different method of acquiring values of EC1:5. Their results indicate that for all the tested soil samples, the ln-transformed model is better than the non-transformed and the exponential models. Moreover, when the ECe data were separated at ECe = 4 dS m−1, very good results were obtained for ECe < 4 dS m−1 from the quadratic curvilinear model.
Aboukila and Norton [11] proposed a correlation equation ECe = f (EC1:5) for ECe values up to 10.3 dS m−1 for the clay agricultural soils of north Egypt, while Aboukila and Abdelaty [15] presented the respective equation for coarse soils. It was observed from these two equations that the slope of the lines was higher for the coarse soils.
Very few works from those mentioned above studied simultaneously the relationships between the ion concentrations obtained by the different methodologies. USDA [3], Sonmez et al. [8], Hong and Henry [16], and Zhang et al. [17] presented relationships between the ion concentrations for the methods ECe and the EC1:1. Sonmez et al. [8] and Ozkan et al. [14] presented relationships between the ion concentrations for the methods ECe and the EC1:5. Sonmez et al. [8] presented the distinct relationships between the ion concentrations for the three methodologies (ECe, EC1:1 and EC1:5) for each soil type (sandy, loamy, clay).
To estimate ions concentration in ECe method extracts, from EC1:1 method extracts data, USDA [3] proposed the conversion coefficients 2.78 and 1.67 for the monovalent and for the divalent ions respectively based on the chemical solubility in aqueous systems”.
The lack of substantial research on the relationships between the various methods and the produced equations could lead to incorrect estimations of the ion concentrations in SP extracts, especially when these equations are to be applied in areas with different soil types [10].
In Greece, quite often, the EC1:1 and EC1:5 methods are used for soil salinity assessment. Nonetheless, no equations relating ECe and EC1:1 or EC1:5, as well as ion concentrations, are proposed or used.
The present work aims to investigate (i) the relationships ECe = f (EC1:1) and ECe = f (EC1:5) for soil samples collected from five areas of Greece, and to compare the estimated ECe values with ECe values derived from models developed for other regions in the world; and (ii) the relationships between major cations and Cl anion concentrations of saturation paste extract and of the respective ion concentrations in 1:1 and 1:5 extracts.

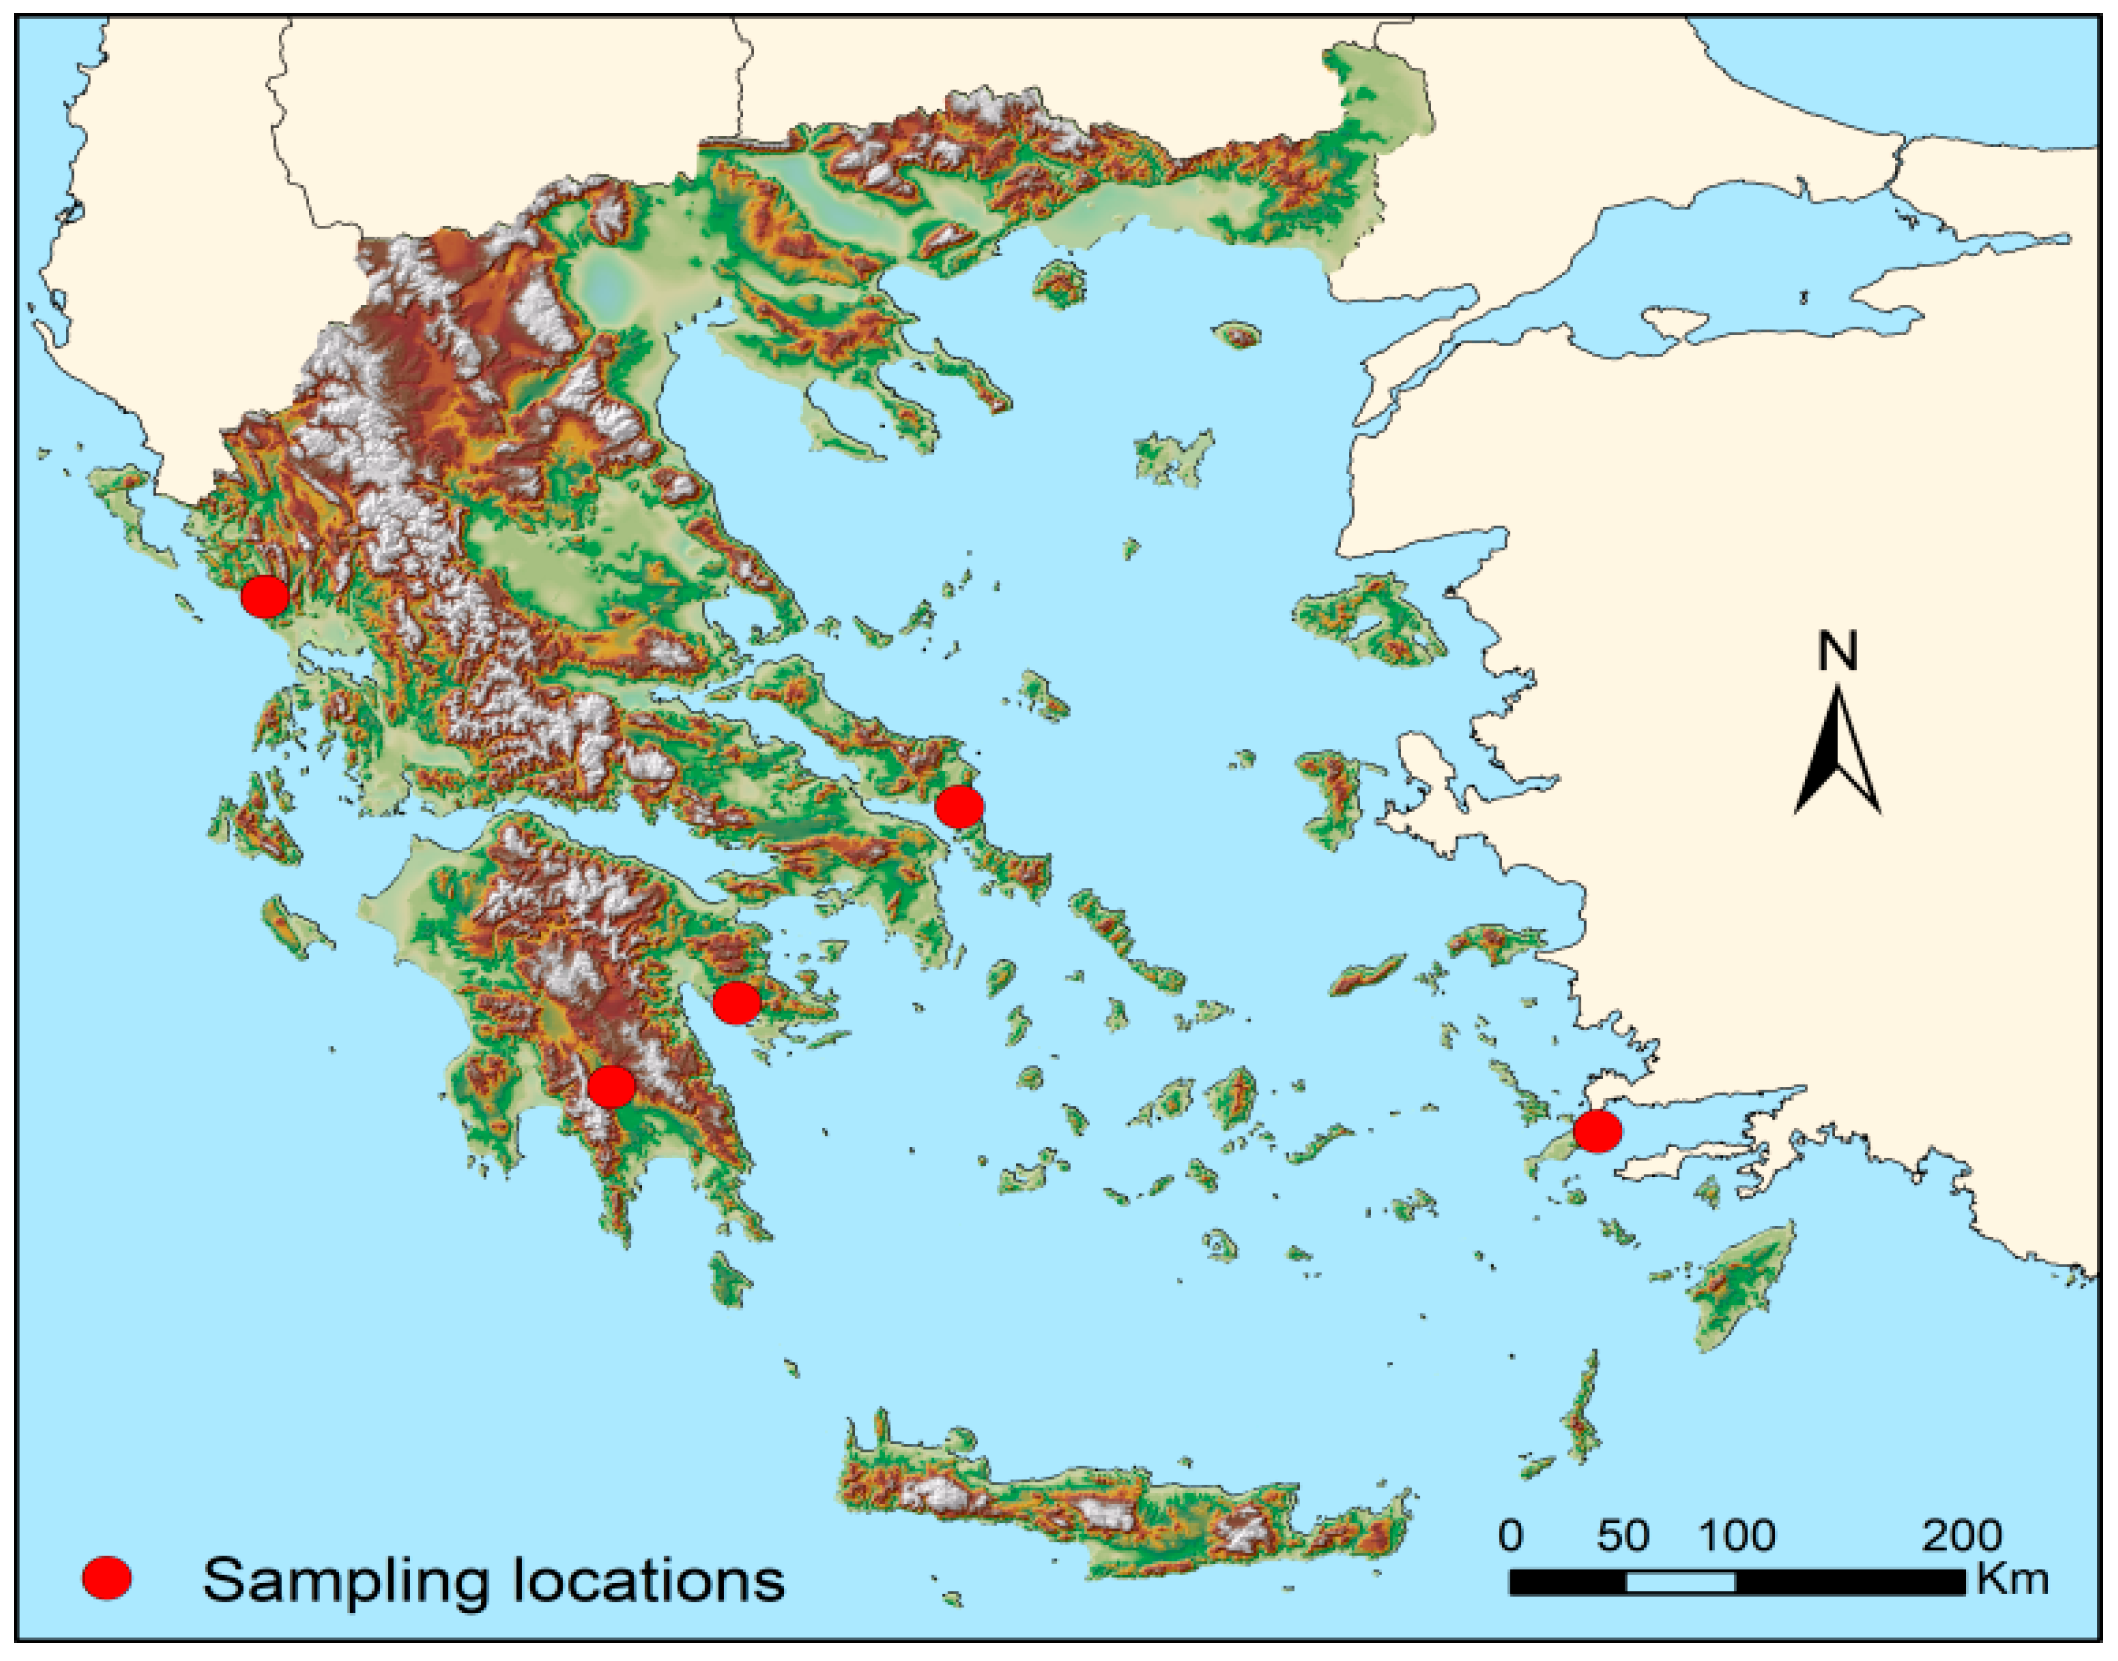
2. Materials and Methods
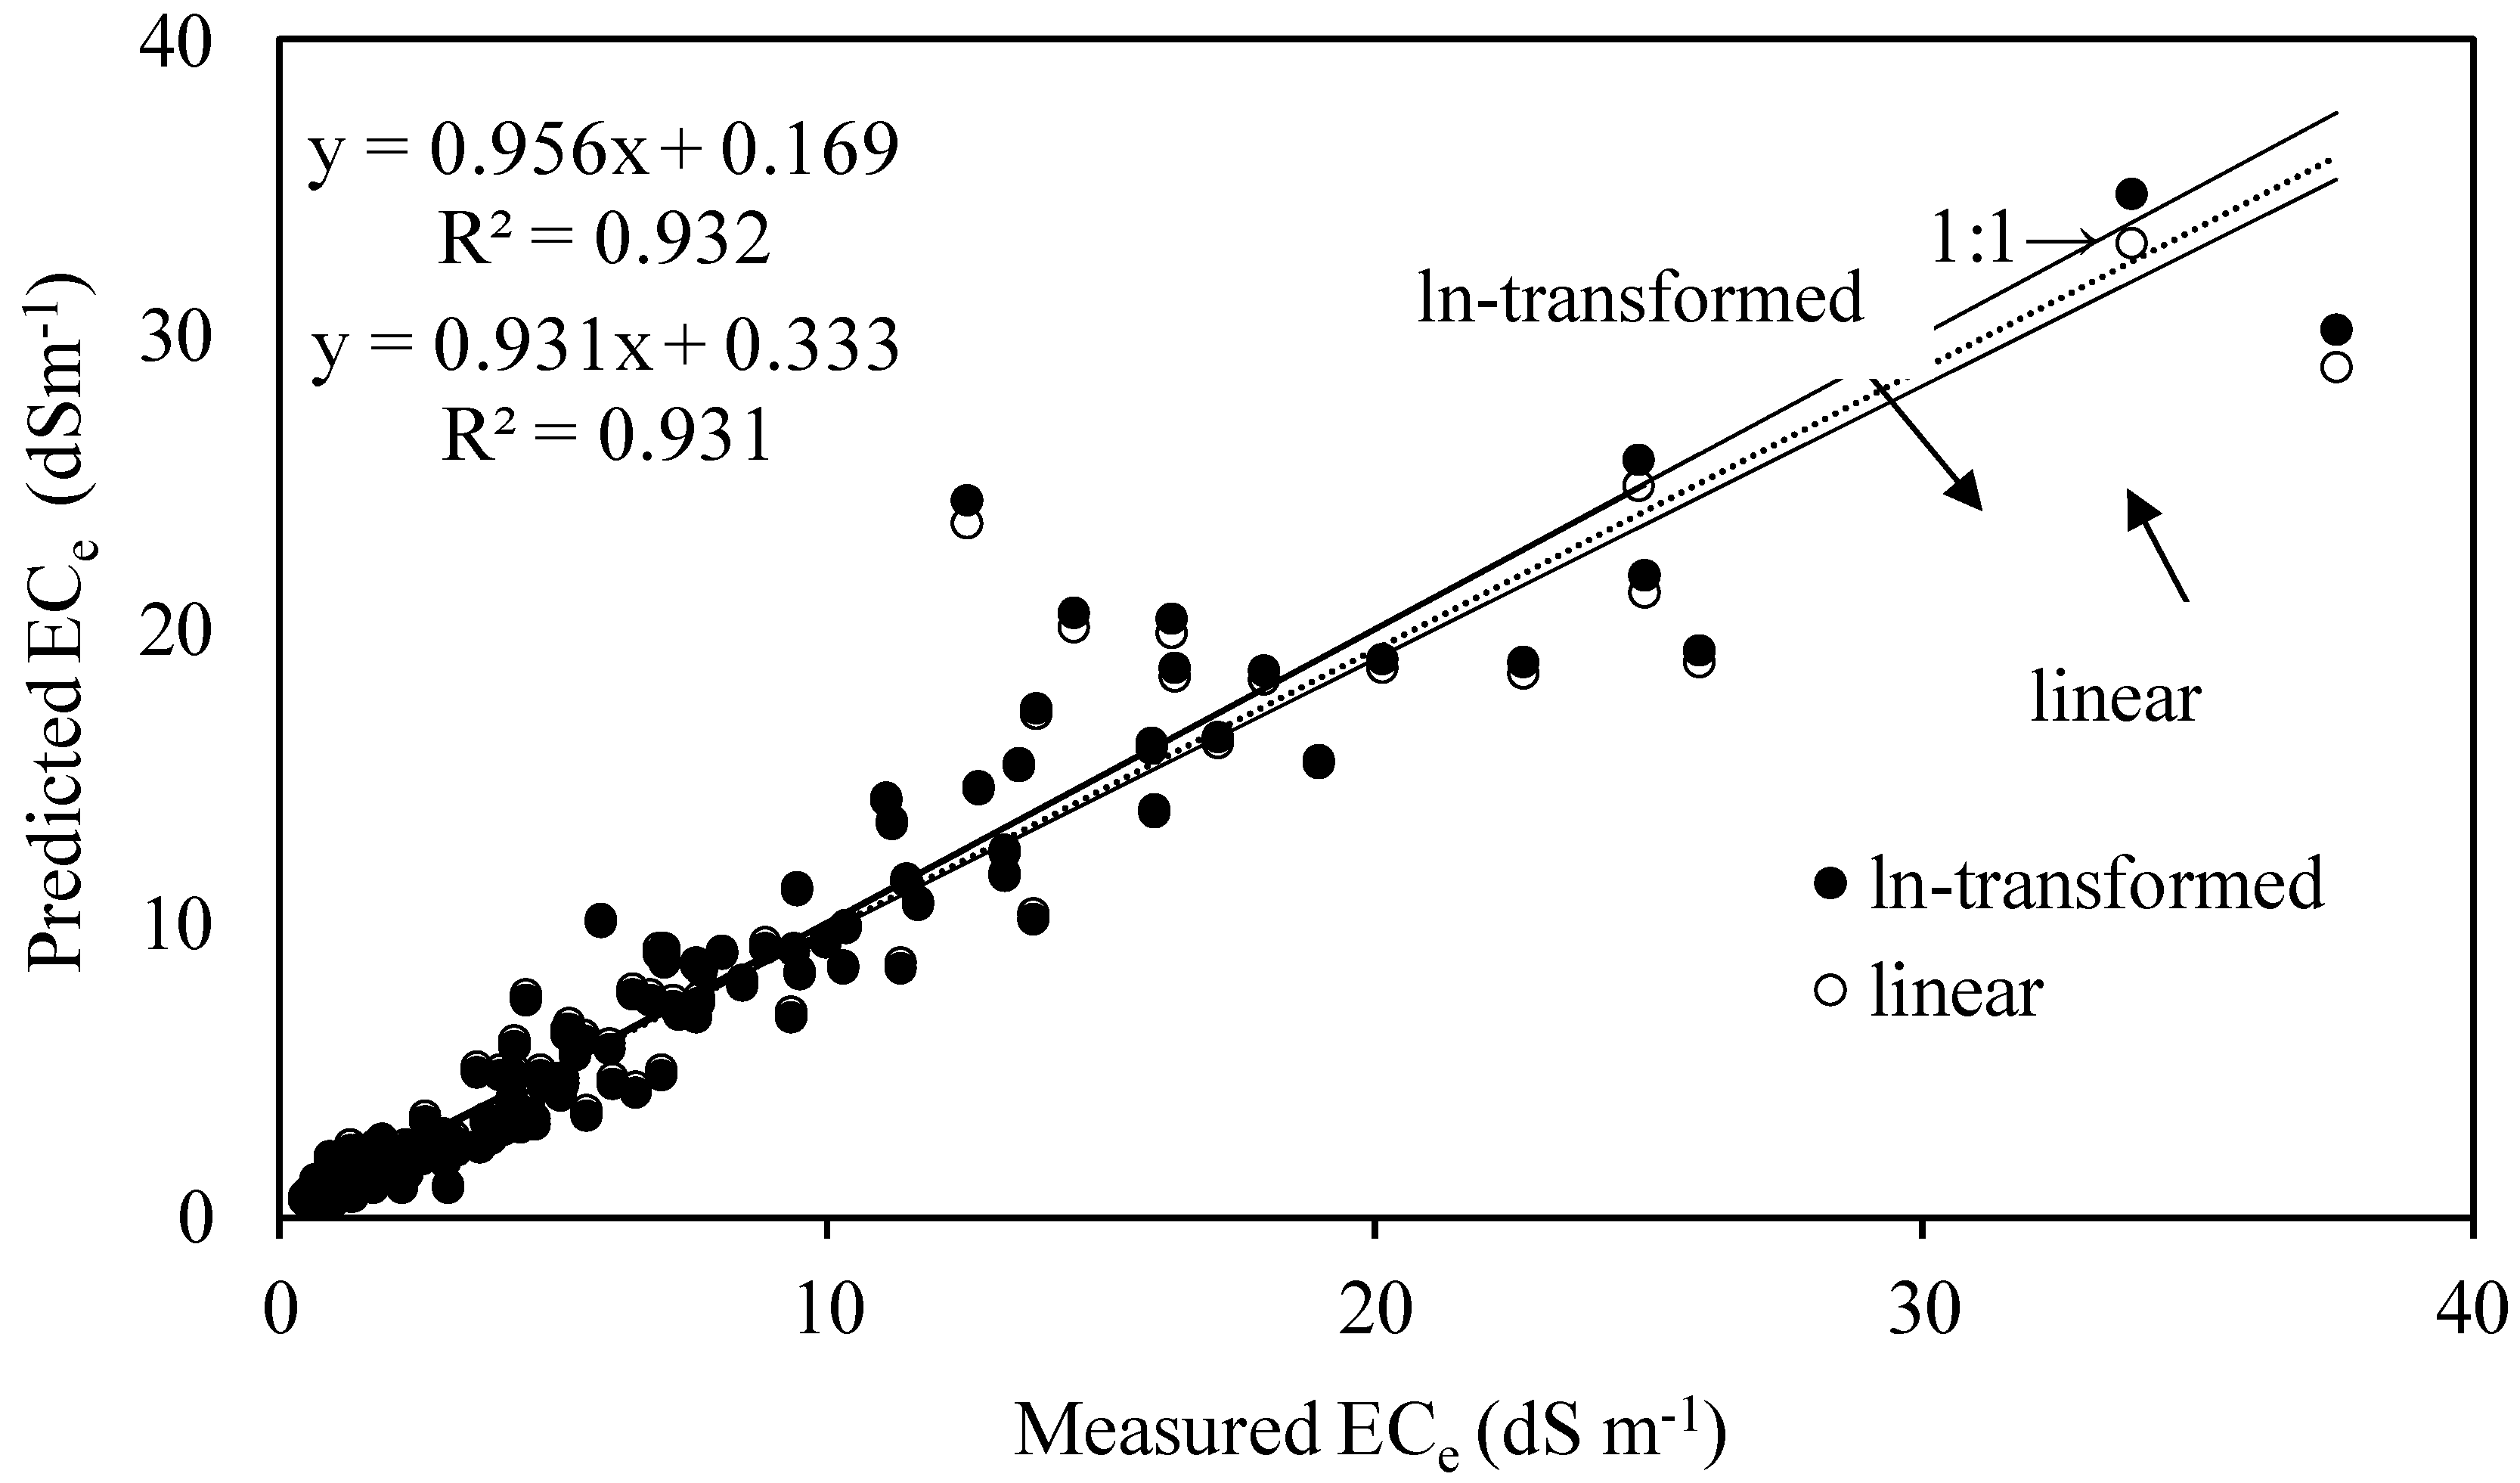
A total of 198 surface soil samples (0–15 cm depth) presenting low organic carbon content (less than 1% for most cases) were collected from five areas over Greece, and more specifically, from the Prefectures of Evia (49 samples), Lakonia (12 samples), Preveza (7 samples), Argolida (90 samples), and from the island of Kos (40 samples) (Figure 1). Most of the soils were under different crop cultivations, while some were non-cultivated. The selected soils represent irrigated soils of different soil salinity levels. Soil samples from Argolis were collected after the end of the irrigation period, i.e., August, and at the end of the rainy season, i.e., March of the next year. Soil sample collection from the other areas was performed during the irrigation season (June to August).
The mean value of the rainfall per year (mm) in each prefecture was: Argolida 500, Evia 500, Laconia 750, Preveza 1000, and Kos 550 mm, respectively.
After collection, the soil samples were transferred to the Agricultural Hydraulics Laboratory and left to air dry. The air-drying process, depending on the soil type of the sample and its initial soil moisture, could last for three to seven days. Afterwards, the samples were ground and passed through a 2 mm sieve. Using the standard method [19], for the preparation of the saturated pastes, 350 g of air-dried soil were used and the soil pastes were left for 24 h to reach equilibrium. Subsequently, the vacuum extracts were collected and electrical conductivity ECe was measured by a conductivity meter (WTW, Cond 315i). For the saturation percentage determination (SP%), a subsample of each paste was oven dried at 104 °C for 24 h.
For the 1:1 soil over water ratio in 100 g of soil sample, 100 mL distilled water was added and the mixture was shaken for 1 min by hand, 4 times at 30 min-intervals, and soon thereafter, the extract was obtained [8,19]. For the 1:5 soil over water ratio in 50 g of soil, 250 mL distilled water was added and the same process was followed.
ECe, EC1:1, and EC1:5 values were determined for all 198 samples. while for 123 soil samples, the concentrations of K+, Na+ Ca2+, Mg2+ and Cl were also measured in the extracts of the three applied methods. In the various soil solution extracts, K+ and Na+ concentrations were determined by flame photometer, and Ca2+ and Mg2+ concentrations by an atomic absorption spectrometer (Varian AA-300). For quality control, internal standards provided by Merck were used, and a control sample was analyzed every 20 samples. Reproducibility was tested by re-analyzing 30% of the samples. The analytical precision, estimated as relative standard deviation (RSD) of three measurements, was less than 3% for AAS and flame photometer determinations. Potentiometric titration with silver nitrate was used to determine Cl concentrations.
Statistical analysis of the data concerning both the electrical conductivities ECe, EC1:1, EC1:5, as well as the ion concentrations of K+, Na+, Ca2+, Mg2+, and Cl, as well as the SP, included their mean, median, and minimum-maximum values, and their standard error. For the relationships ECe = f (EC1:1) and ECe = f (EC1:5), a least-squared linear regression was performed and the coefficient of determination R2 was evaluated. The R2 coefficient assesses how well a model (in our case the aforementioned relationships) explains and predicts future outcomes, and is used as a guideline to measure the accuracy of the model. Statistical analysis was performed using IBM SPSS Statistics 20 software.

3. Results

3.1. Electrical Conductivity and Ions Concentration in the Extracts of the Three Methods

According to [20], the ECe, EC1:1, and EC1:5 values of the 198 soil samples were classified into three classes, i.e., 0–2, 2–4 και > 4 dS m−1, presented in Table 2 along with their respective percentages. The soil sample electrical conductivities varied between 0.47 and 37.5 dS m−1 for the saturation paste extract, from 0.16 to 20.1 dS m−1 for the 1:1 extract, and from 0.10 to 5.08 for the 1:5 extract. From these findings, it is obvious that a wide range of EC values was used to compare the SP method with the EC1:1 and the EC1:5 methods.
According to the measured Saturation Percentage values (SP%), 30 samples (15.1%) showed SP% values ranging between 20 and 45%, and 168 samples (84.9%) exhibited SP% values > 45%. Thus, the great majority of the soil samples correspond to fine soil textures [12].
The mean EC value for the SP extract was approximately 2 and 6.5 times higher than the EC values in the 1:1 and 1:5 extracts respectively (Table 2). Our expression for the relationship ECe = f (EC1:1) is almost identical to that of [8,17], who reported approximately twofold dilution when they compared the EC value of SP extract to that of 1:1 soil/water extract. For the relationship ECe = f (EC1:5), the results of the present study are similar to those of [11], who reported that the mean ECe value was 5.7 times higher than EC1:5. In contrast, [8] reported a stronger dilution effect, since they found that the mean ECe value was 8 times higher than the mean EC1:5 value.
Mean ion concentrations in the extracts of the different methodologies applied on the 123 soil samples showed similar trends to the relationships between the corresponding electrical conductivities (Table 3). Depending on the ion, the mean ion concentrations in the SP extract were higher, from 1.5 to 1.9 and from 4.11 to 7.5 times, compared to the respective ion concentrations in the EC1:1 and EC1:5 extracts.

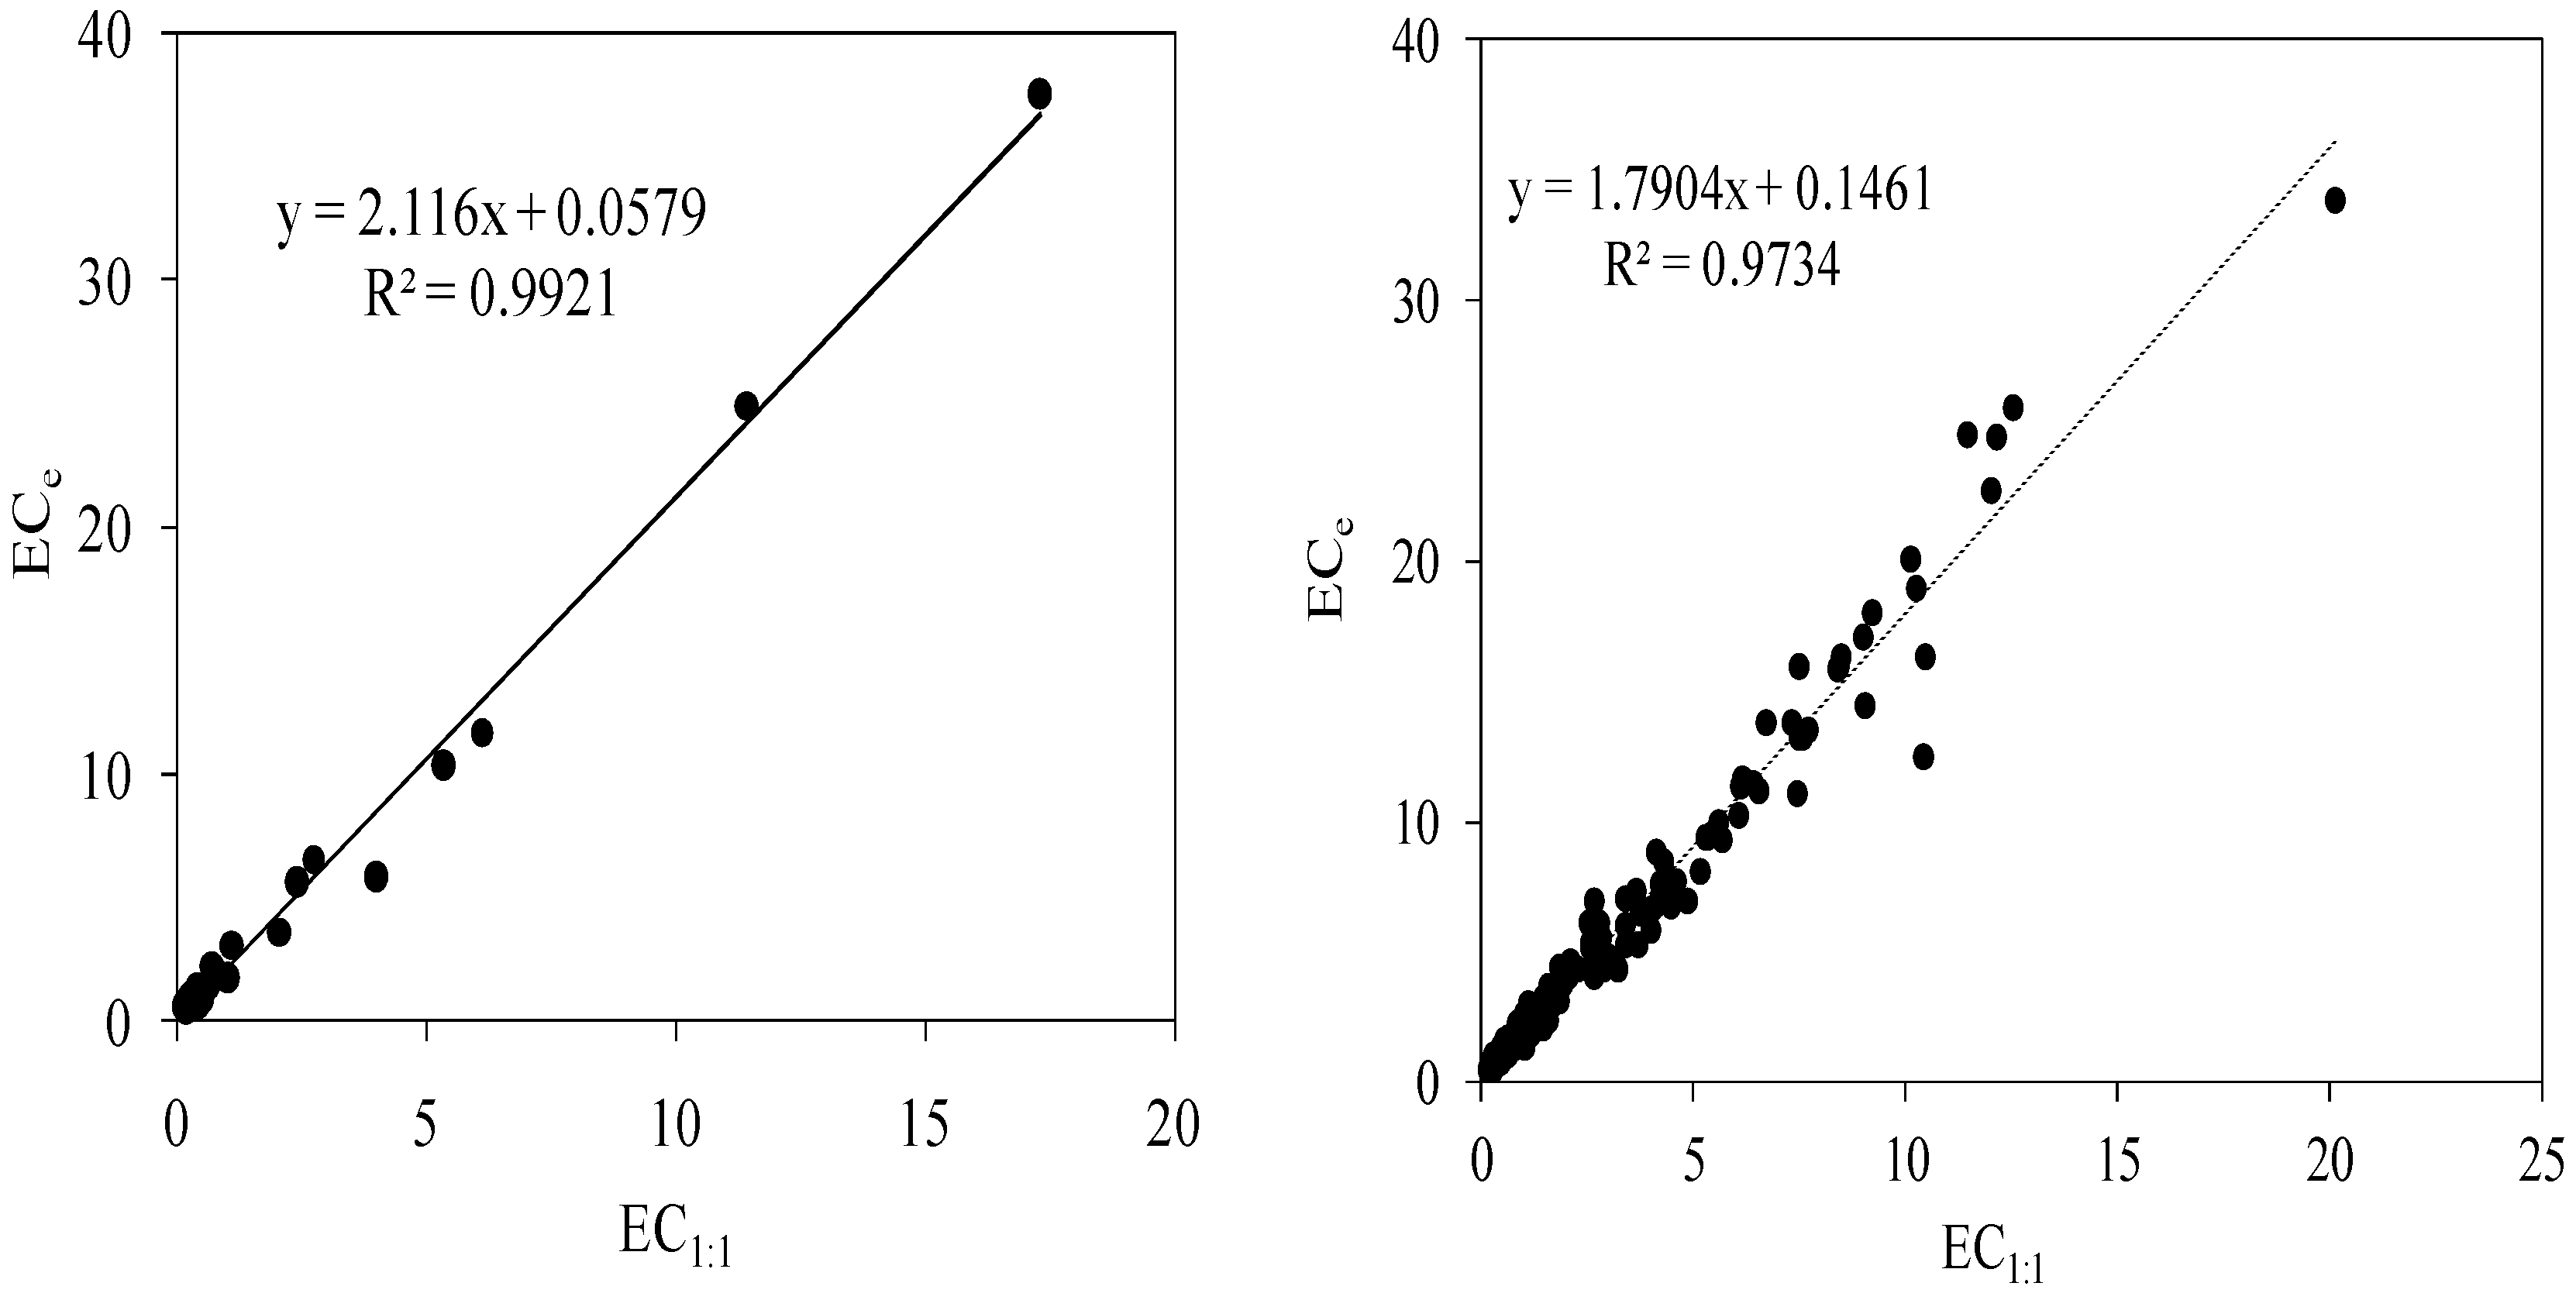
3.2. The Relationship between ECe and 1:1 Method

For all studied soil samples, the linear relationship between ECe and EC1:1 values is presented in Figure 2. The produced equation was ECe = 1.83 × EC1:1 − 0.117 and the coefficient of determination value was close to unity (R2 = 0.973).
These results are similar to the findings of other researchers, since strong linear relationships between ECe and EC1:1 are reported in the literature. According to the findings of this study, the slope value of ECe = f (EC1:1) relationship was 1.83, close to the slope values of 1.56 and 1.79 (for combined soil textures) reported by [16], and by [17] and to the slope value of 2.03 reported by [8], for fine textured soils. Nonetheless, significantly different slope values were produced by [3] and [10], who found slope values of 3 for the fine textured soils and 2.96 for combined soil textures. Further data processing indicated that neither the slope value (1.847) nor the coefficient of determination (R2 = 0.97) changed significantly by fitting the data to linear correlation with an intercept equal to zero (i.e., the line passes from the origin), suggesting that the produced ECe = f (EC1:1) equation can be reliably applied, even for soils with extremely low salinity levels.
The studied soil samples were grouped according to their Saturation Percentage (SP%) values, and two ECe = f (EC1:1) linear curve fitting prediction equations were produced (Figure 3).
Both the slope and the coefficient of determination values were higher for the soils with SP% values in the range 20–45%. Indeed, for SP% values between 20 and 45%, slope and R2 values were 2.11 and 0.992, while for SP% > 45%, the respective values were 1.79 and 0.973. This outcome indicates that the ECe versus EC1:1 relationship was affected by the soil type, since the saturation percentage depends strongly on the clay content, as well as on the type of the clay [12,13]. When the soil texture changes from coarse to fine, a decreasing slope trend was observed in accordance with the results of [8,10,16]. The stronger ECe versus EC1:1 relationship for coarser soils suggests that for soils with values of SP% < 45%, ECe can be predicted accurately from EC1:1 data. Furthermore, in this study, the characteristics of ECe = f (EC1:1) equation for all soils (Figure 2) are almost identical to those of the ECe = f (EC1:1) equation for fine-textured soils (Figure 3 right). However, this is a reasonable result considering that most of the studied soil samples were of fine texture.
A strong linear relationship was also found between the ion concentrations in the SP and the 1:1 extracts (N = 123), with coefficients of determination (R2) ranging from 0.88 to 0.973 (Table 4). The obtained relationships are shown with or without intercept to facilitate the comparison with similar published findings. In most cases, R2 values suggest strong or sufficient linearity. However, stronger relations were observed for K+ and Cl than for Na+, Ca2+, and Mg2+, implying that further detailed characterization of the studied soils is needed to elucidate these results. The slope values of the ion concentration equations for monovalent ions (Κ+, Νa+ and Cl) were certainly lower than those reported by [3] (2.78) while those for divalent ions (Ca2+ and Mg2+) were very similar (1.67).

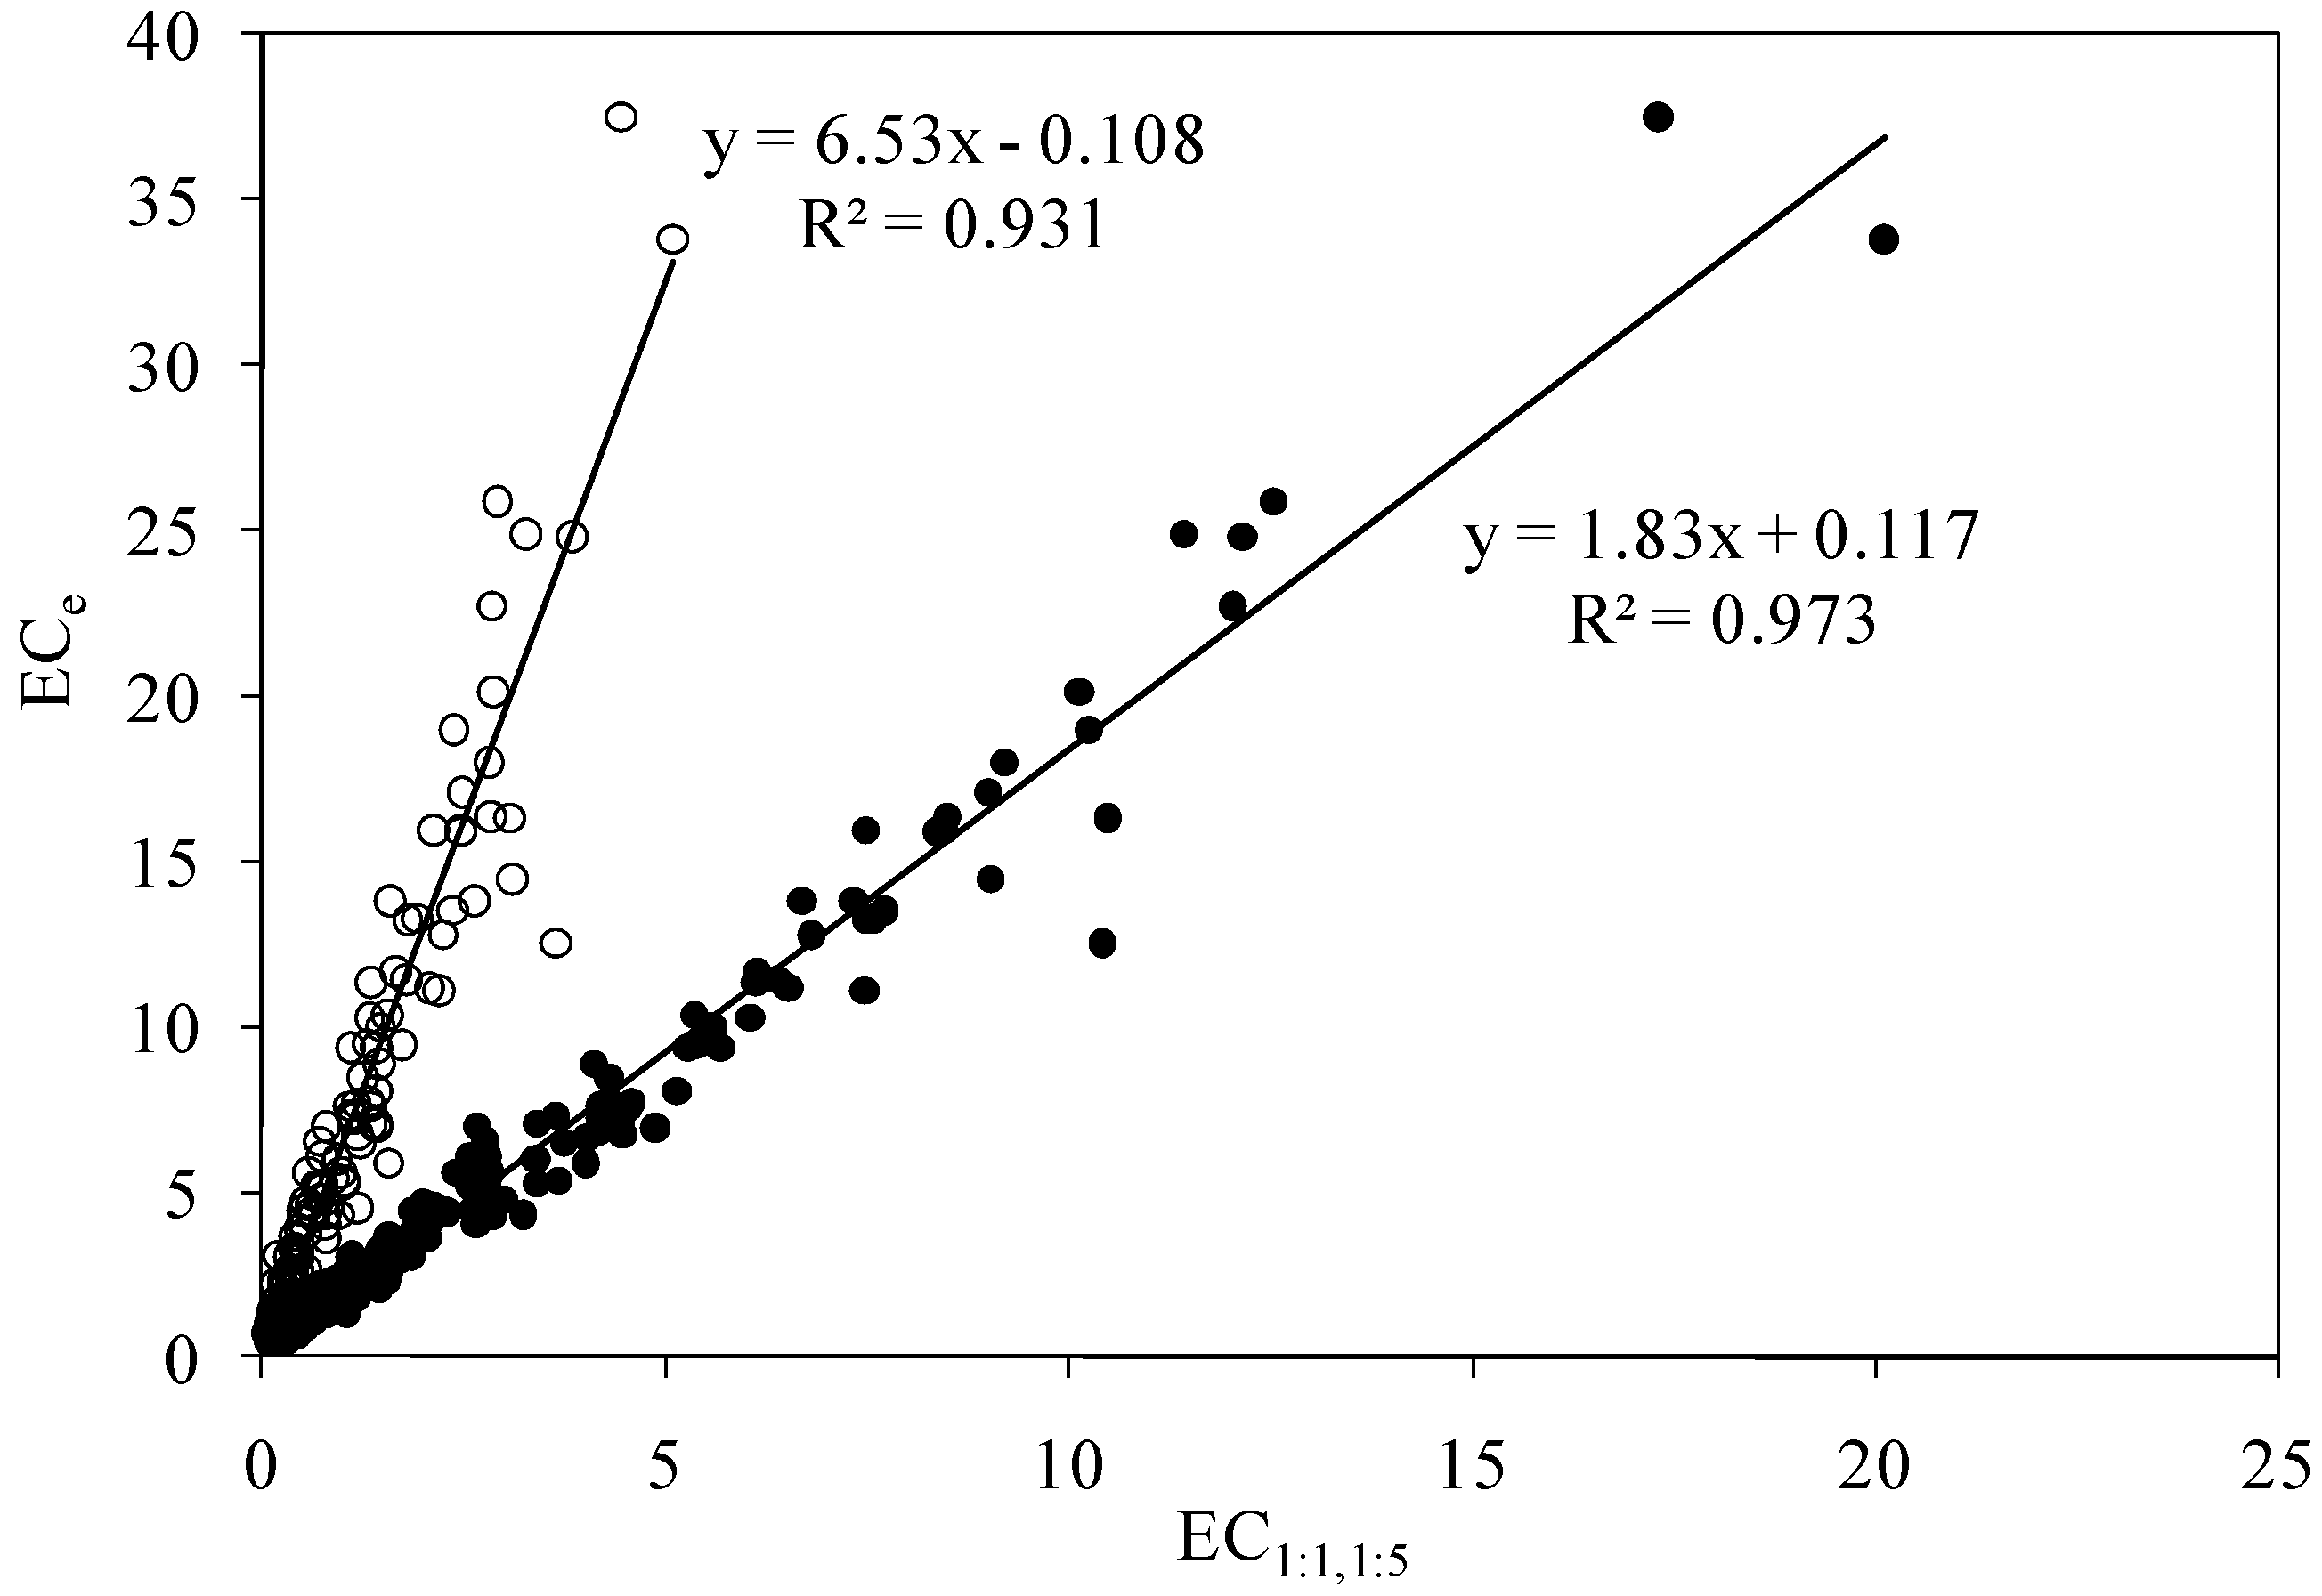
3.3. The Relationship between ECe and 1:5 Method

In Figure 2, the relationship between ECe and EC1:5 is also shown. The ECe = f (EC1:5) relationship is given by the expression ECe = 6.53 × EC1:5 − 0.108, and the coefficient of determination (R2 = 0.931) indicates a strong linearity. By imposing the line to pass from the origin, the slope value remained practically unaffected, while the respective equation is ECe = 6.47 × EC1:5. These findings are similar to those of other researchers [4,8,11,12,14] who also reported strong linearity for the ECe = f (EC1:5) relationship. Nevertheless, our results do not match exactly with the findings of other studies but lie in between them, since our slope value was lower than that found by [4] (7.94), and higher than that obtained by [11] (5.04).
These differences may be attributed to the clay content and the clay type of the examined soils. However, the observed variation of the results among the various studies can be most likely attributed to the different methodologies used for the EC1:5 determinations. Such differences seem to be a key factor that considerably affects the ECe and EC1:5 relationship [9]. This is further supported by the fact that the soils examined in the present work presented similar characteristics, negligible gypsum contents, and medium to fine textures, as did those in the works used for comparison. Therefore, the different methodology applied in the present work for the acquisition of the EC1:5 values appears to be the chief factor for the observed deviating results from those reported in other studies. Apart from this, another probable factor that could have affected the acquisition of EC1:5 in this work is, compared to the other similar works, the broad range of the ECe values from which the ECe = f (EC1:5) relationship was estimated. Thus, these two factors can be considered as being responsible for the fact that our findings produced slope values for the ECe = f (EC1:5) expression that were close but not identical to similar findings presented in the literature.
The predicted ECe values obtained by the ln-transformed (ln(ECe) = f (ln(EC1:5)) and by the linear models (ECe = f (EC1:5) were plotted against the actually measured ECe values (Figure 4).
As is shown in Figure 4, values predicted by the ln-transformed model ECe values are closer to the 1:1 line, and provide better results than the ECe values obtained by the linear model. This is in line with [9], who reported strong linear relations between the measured and the values predicted by ln-transformed model ECe values for the four cases of equilibrium they examined to determine EC1:5. It must be noted that the majority of the soil samples (67%) that these authors used in their work had SP% values in the range 20–45%, while in the present work, only the 15.1% of the soils are included in this range. Therefore, the ln-transformed model seems to have a general validity for all soil types, and in this sense, it is a reliable methodology for the estimation of ECe from EC1:5 measurements.
In addition, the determination of the ECe = f (EC1:5) relationship according to SP% values of the tested soils samples produced higher slope values for SP% in the range of 20–45%, indicating that the finer the soil texture, the lower the slope of the estimating equation (data not shown).
The linear equations included in Table 5 show that the ion concentrations in the SP extracts are highly related to the respective ion concentrations obtained for the 1:5 extracts. The R2 values for all ion equations, except Na+, are lower in comparison to the respective R2 values of the 1:1 method (Table 4), indicating that ions concentrations in 1:1 extracts are better estimators for the actual ion concentrations in the SP extracts. The lowest coefficients οf determination were obtained for Ca2+ and Mg2+. In all cases except Κ+, the slope values are lower than those mentioned by [8] either for combined soil texture or for fine textured soils.

4. Conclusions

The results of this study support that it is possible to accomplish a high degree of accuracy for ECe predictions from the more easily measured EC values in the 1:1 and 1:5 soil/water mass ratios extracts using the obtained relationships. Comparing ECe = f (EC1:1) and ECe = f (EC1:5) relationships, a higher coefficient of determination was found for ECe = f (EC1:1), suggesting that, under the experimental conditions of this work, EC values of 1:1 extracts appear to be better estimators for ECe. However, the ln-transformed model provided quite accurate results for the estimation of ECe from the EC1:5 measurements. The slope values in both 1:1 and 1:5 are higher for coarse (20% < SP < 45%) than for fine soils (SP > 45%).
Differences between the slope value of the relationship ECe = f (EC1:5) and the slope values of similar relationships reported by other researchers could be attributed mainly to the different methodologies used for the EC1:5 measurements, to diverse physicochemical soil characteristics, and to the wider range of the ECe values used in this work.
Based on the results of the highly-correlated equations obtained, it can be concluded that the 1:1 and 1:5 methods can be used to estimate the ion concentration in the SP extract.
No doubt, additional work is needed to further improve the accuracy of ECe predictions through the EC1:1 or EC1:5 methodologies by including more data for soil samples from other regions of the country.

Author Contributions

All Authors contributed equally to this work.

Funding

This research received no external funding.

Conflicts of Interest

The authors declare no conflict of interest.

References

  1. Hillel, D. Out of the Earth: Civilization and the Life of the Soil. Soil Sci. 1991, 152, 138. [Google Scholar] [CrossRef]
  2. Szabolcs, I. Agronomical and ecological impact of irrigation on soil and water salinity. In Advances in Soil Science; Stewart, B.A., Ed.; Springer: Berlin, Germany, 1986. [Google Scholar]
  3. United States Salinity Laboratory. Diagnoses and Improvement of Saline and Alkali Soils; Agriculture Handbook No 60; USDA: Washington, DC, USA, 1954.
  4. Khorsandi, F.; Yazdi, F.A. Gypsum and texture effects on the estimation of saturated paste electrical conductivity by two extraction methods. Commun. Soil Sci. Plant Anal. 2007, 38, 1105–1117. [Google Scholar] [CrossRef]
  5. Rayment, G.E.; Lyons, D.J. Soil Chemical Analysis Methods-Australia; CSIRO Publishing: Collingwood, VIC, Australia, 2011. [Google Scholar]
  6. Wang, Y.; Wang, Z.X.; Lian, X.J.; Xiao, H.; Wang, L.Y.; He, H.D. Measurements of soil electrical conductivity in Tianjin coastal area. Tianjin Agric. Sci. 2011, 17, 18–21. [Google Scholar]
  7. He, Y.; DeSutter, T.; Prunty, L.; Hopkins, D.; Jia, X.; Wysocki, D. Evaluation of 1:5 soil to water extract electrical conductivity methods. Geoderma 2012, 185–186, 12–17. [Google Scholar] [CrossRef]
  8. Sonmez, J.S.; Buyuktas, D.; Okturen, F.; Citak, S. Assessment of different soil to water ratios (1:1, 1:2:5, 1:5) in soil salinity studies. Geoderma 2008, 144, 361–369. [Google Scholar] [CrossRef]
  9. He, Y.; DeSutter, T.; Hopkins, D.; Jia, X.; Wysocki, D. Predicting ECe of the saturated paste extract from value of EC1:5. Can. J. Soil Sci. 2013, 93, 585–594. [Google Scholar] [CrossRef]
  10. Franzen, D. Managing Saline Soils in North Dakota; North Dakota State University Extension Service: Fargo, ND, USA, 2003; Available online: http://www.ag.ndsu.cdu/pubs/plantsci/soilfert/sf1087-1.html (accessed on 10 October 2006).
  11. Aboukila, E.F.; Norton, J.B. Estimation of saturated soil paste salinity from soil water extracts. Soil Sci. 2017, 182, 107–113. [Google Scholar] [CrossRef]
  12. Chi, M.C.; Wang, Z.C. Characterizing salt affected soils of Songnen Plain using saturated paste and 1:5 soil to water extraction methods. Arid Land Res. Manag. 2010, 24, 1–11. [Google Scholar] [CrossRef]
  13. Slavich, P.G.; Petterson, G.H. Estimating the electrical conductivity of saturated paste extracts from 1:5 soil: water suspensions and texture. Aust. J. Soil Res. 1993, 31, 73–81. [Google Scholar] [CrossRef]
  14. Ozcan, H.; Ekinci, H.; Yigini, Y.; Yuksel, O. Comparison of four soil salinity extraction methods. In Proceedings of the 18th International Soil Meeting on “Soil Sustaining Life on Earth, Managing Soil and Technology”, Şanlıurfa, Turkey, 22–26 May 2006; pp. 697–703. [Google Scholar]
  15. Aboukila, E.F.; Abdelaty, E.F. Assessment of Saturated Soil Paste Salinity from 1:2.5 and 1:5 Soil-Water Extracts for Coarse Textured Soils. Alex. Sci. Exch. J. 2018, 38, 722–732. [Google Scholar] [CrossRef]
  16. Hogg, T.J.; Henry, J.L. Comparison of 1:1 and 1:2 suspensions and extracts with the saturation extracts in estimating salinity in Saskatchewan. Can. J. Soil Sci. 1984, 64, 699–704. [Google Scholar] [CrossRef]
  17. Zhang, H.; Schroder, J.L.; Pittman, J.J.; Wang, J.J.; Payton, M.E. Soil salinity using saturated paste and 1:1 soil to water extract. Soil Sci. Soc. Am. J. 2005, 69, 1146–1151. [Google Scholar] [CrossRef]
  18. Visconti, F.; de Paz, J.M.; Rubio, J.L. What information does the electrical conductivity of soil water extracts of 1 and 5 ratio (w/v) provide for soil salinity assessment of agricultural irrigated lands? Geoderma 2010, 154, 387–397. [Google Scholar] [CrossRef]
  19. Rhoades, J.D. Soluble salts. In Methods of Soil Analysis, 2nd ed.; Page, A.L., Ed.; Agronomy Monograph No 9; American Society of Agronomy, Inc.: Madison, WI, USA, 1982; Part 2; pp. 167–179. [Google Scholar]
  20. Kargas, G.; Chatzigiakoumis, I.; Kollias, A.; Spiliotis, D.; Kerkides, P. An Investigation of the Relationship between the Electrical Conductivity of the Soil Saturated Paste Extract ECe with the Respective Values of the Mass Soil/Water Ratios 1:1 and 1:5 (EC1:1 and EC1:5). Proceedings 2018, 2, 661. [Google Scholar] [CrossRef]
Figure 1. The sampling locations.
Water 10 01589 g001
Figure 2. The ECe = f (EC1:1) and ECe = f (EC1:5) relationships for combined soil texture data (N = 198). Dark circles for ECe = f (EC1:1) and open circles for ECe = f (EC1:5) relationships. The values of EC in dS m−1).
Water 10 01589 g002
Figure 3. The ECe = f (EC1:1) relationships according to the Saturation Percentage (SP%) values. SP% values between 20 and 45% (N = 30) (left), and SP% values > 45% (N = 168) (right).
Water 10 01589 g003
Figure 4. The relationships between the measured ECe values and the estimated ECe values from the ln-transformed model (Pred ECe = 0.956ECe + 0.169) and the linear expression (Pred ECe = 0.931ECe + 0.333) (N = 198).
Water 10 01589 g004
Table 1. The ECe = f (EC1:5) and ECe = f (EC1:1) relationships as proposed by several researchers.
ReferencesRegression Equation
USDA (1954) [3]ECe = 3 (EC1:1) f
Khorsandi and Yazdi [4]ECe = 7.94 (EC1:5) + 0.27 d
ECe = 9.14 (EC1:5) − 15.72 e
Sonmez et al. [8]ECe = 2.03 (EC1:1) − 0.41 c
ECe = 7.36 (EC1:5) − 0.24 c
Frazen [10]ECe = 2.96 (EC1:1) − 0.95
Αboukila and Norton [11]ECe = 5.04 (EC1:5) + 0.37 c
Chi and Wang [12]ECe = 11.74 (EC1:5) − 6.15
ECe = 11.04 (EC1:5) − 2.41
ECe = 11.68 (EC1:5) − 5.77
Slavich and Petterson [13]ECe = f (EC1:5)
Ozkan et al. [14]ECe = 1.93 (EC1:1) − 0.57 f
ECe = 5.97 (EC1:5) − 1.17 f
Aboukila and Abdelaty [15]
Hong and Henry [16]
Zhang et al. [17]
Visconti et al. [18]
ECe = 7.46 (EC1:5) + 0.43 a
ECe = 1.56 (EC1:1) − 0.06 f
ECe = 1.79 (EC1:1) + 1.46 f
ECe = 5.7 (EC1:5) − 0.2
This studyECe = 1.83 (EC1:1) + 0.117 c
ECe = 6.53 (EC1:5) − 0.108 c
The indices a,b,c refer to coarse, medium and fine soils respectively. The indices d and e refer to the presence or absence of gypsum, respectively. The equation of [18] refers to a gypsum mass percentage <0.2%. Chi and Wang [12] presented cases considering the range of θSP variation. Their first equation corresponds to a range of θSP between 20% and 45%, while their second to a range between 45% and 63%. The third equation corresponds to the full range of θSP variation, i.e., between 20% and 63%. The index f refers to combined soil texture.
Table 2. Population of samples in the three EC classes according to ECe, EC1:1 and EC1:5 values (N = 198).
Range of EC (dS m−1)ECeEC1:1EC1:5
No of Samples% of SamplesNo of Samples% of SamplesNo of Samples% of Samples
0–2995012362.117688.9
2–42211.12713.62010.1
>47738.94824.321
Mean value4.89 2.61 0.76
median2.26 1.04 0.34
Table 3. Statistical indices for the values of ion concentrations in the extracts of SP, and 1:1 and 1:5 soil/water ratios methods (meq L−1) (N = 123).
StatisticK+Na+Ca2+Mg2+Cl
SP
Mean2.8227.6329.721.1824.8
Median1.0412.2121.915.4114.5
Standard error0.475.022.652.362.92
Minimum0.051.471.551.202.00
Maximum33.3090.4374.05132.90101.60
1:1
Mean1.8018.8018.8311.2114.69
Median0.707.1712.327.417.00
Standard error0.273.551.821.132.56
Minimum0.021.411.500.651.00
Maximum17.6978.4146.7064.5844.60
1:5
Mean0.684.535.482.823.65
Median0.342.043.621.832.25
Standard error0.080.7680.520.310.49
Minimum0.020.760.450.080.70
Maximum4.9724.215.0524.009.40
Table 4. Regression equations describing the relation between EC1:1 and saturated paste extracts ECe (N = 198) and ion concentrations, along with the coefficients of determination (R2) (N = 123).
With InterceptWithout Intercept
ParameterRegression EquationR2Regression EquationR2
ECECe = 1.83 (1:1) + 0.1170.973ECe = 1.84 (1:1)0.97
ClECe = 1.97 (1:1) + 0.5820.963ECe = 1.99 (1:1)0.962
K+ECe = 1.69 (1:1) − 0.2720.967ECe = 1.64 (1:1)0.963
Na+ECe = 1.24 (1:1) + 2.440.884ECe = 1.26 (1:1)0.882
Ca2+ECe = 1.42 (1:1) + 3.860.890ECe = 1.52 (1:1)0.880
Mg2+ECe = 1.96 (1:1) − 0.9480.894ECe = 1.92 (1:1)0.893
Table 5. Regression equations describing the relation between EC1:5 and saturated paste extracts ECe (N = 198) and ion concentrations along with the coefficients of determination (R2) (N = 123).
With InterceptWithout Intercept
ParameterRegression EquationR2Regression EquationR2
ECECe = 6.53 (1:5) − 0.100.931ECe = 6.47 (1:5)0.931
ClECe = 8.53 (1:5) − 3.900.927ECe = 7.87 (1:5)0.918
K+ECe = 5.88 (1:5) − 1.030.948ECe = 5.29 (1:5)0.924
Na+ECe = 6.17 (1:5) − 0.820.939ECe = 6.12 (1:5)0.938
Ca2+ECe = 4.7 (1:5) + 4.330.824ECe = 5.10 (1:5)0.810
Mg2+ECe = 6.8 (1:5) + 1.610.860ECe = 7.04 (1:5)0.859

