Capillary Nanofiltration under Anoxic Conditions as Post-Treatment after Bank Filtration


1
Kompetenzzentrum Wasser Berlin (KWB), Cicerostraße 24, 10709 Berlin, Germany
2
Pentair X-Flow, Marssteden 50, 7547 TC Enschede, The Netherlands
3
Berliner Wasserbetriebe (BWB), Cicerostraße 24, 10709 Berlin, Germany
*
Authors to whom correspondence should be addressed.
Water 2018, 10(11), 1599; https://doi.org/10.3390/w10111599
Submission received: 28 September 2018
/
Revised: 25 October 2018
/
Accepted: 1 November 2018
/
Published: 7 November 2018
(This article belongs to the Special Issue Efficiency of Bank Filtration and Post-Treatment)
Abstract
:Bank filtration schemes for the production of drinking water are increasingly affected by constituents such as sulphate and organic micropollutants (OMP) in the source water. Within the European project AquaNES, the combination of bank filtration followed by capillary nanofiltration (capNF) is being demonstrated as a potential solution for these challenges at pilot scale. As the bank filtration process reliably reduces total organic carbon and dissolved organic carbon (DOC), biopolymers, algae and particles, membrane fouling is reduced resulting in long term operational stability of capNF systems. Iron and manganese fouling could be reduced with the possibility of anoxic operation of capNF. With the newly developed membrane module HF-TNF a good retention of sulphate (67–71%), selected micropollutants (e.g., EDTA: 84–92%) and hardness (41–55%) was achieved together with further removal of DOC (82–87%). Fouling and scaling could be handled with a good cleaning concept with acid and caustic. With the combination of bank filtration and capNF a possibility for treatment of anoxic well water without further pre-treatment was demonstrated and retention of selected current water pollutants was shown.
1. Introduction
The present work was developed within the European project AquaNES. The goal of the project is to demonstrate the benefits of the combination of natural treatment processes with engineered systems as sustainable adaptations to e.g., water scarcity, high nutrient loads and organic micropollutants (OMP) in the water cycle.
Bank filtration schemes for the production of drinking water are increasingly affected worldwide by e.g., OMP, pathogens, nitrate or sulphate in the source water, flood and low water or riverbed clogging [1,2,3,4,5,6,7]. Within AquaNES new technology components were integrated and monitoring and operating regimes were adopted to further optimize water treatment in bank filtration schemes for these new requirements.
In Berlin, drinking water is produced from 54% bank filtrate, 16% groundwater recharge and 30% ground water [8]. One challenge for the drinking water supply is the increasing sulphate concentration in raw water. Background concentrations for sulphate in ground water of Berlin are mostly >100 mg/L, in the inner city >360 mg/L [9]. Selected wells already exceed the limit for drinking water of 250 mg/L [10], reaching up to 900 mg/L at some eastern locations along the Havel River [11]. Sulphate in groundwater originates from different sources: leaching of dumps of building rubble and debris from the Second World War [12], domestic waste water [13] and oxidation of sulphide containing organic material [11].
The other source of sulphate in drinking water wells is the input by bank filtrate: higher sulphate concentration in the Spree River is caused by release of sulphate from dump sediments of abandoned open pit lignite mines upstream of Berlin. In the Spree River concentrations up to 320 mg/L sulphate [5] were measured. During subsurface passage of bank filtrate sulphate is either not affected [14] or only marginally attenuated under anaerobic conditions (sulphate reduction) [15]. Good sulphate removal from drinking water can be reached with technologies such as ion exchange, nanofiltration (NF), reverse osmosis and low pressure reverse osmosis, here retentions of >90% were observed [16,17]. Retention values depend on operational parameters, feed water quality and initial sulphate concentrations. Different agricultural residues were tested as raw materials to produce anion adsorbent, e.g., rice straw [18]. In addition, studies for adsorption of sulphate to synthesized zeolite [19] or kaolinite [20] were carried out.
The complexing agent ethylendiamintetraacetic acid (EDTA) is used in a wide range of applications, e.g., in photographic industries, cleaning agents, cosmetics and agriculture. EDTA is not easily biodegradable or adsorbable and can pass the drinking water processing steps [21,22]. EDTA enters the environment mostly via waste water (e.g., infiltration of waste water treatment plant effluent [23]). At water works, the main source of EDTA is leaching from former sewage irrigation fields and increasing concentrations are expected in the future. In addition, bank filtrate from a water body receiving wastewater treatment plant effluent is a (minor) source of EDTA. The health orientation value for drinking water is 10 µg/L, the measured values in drinking water are in this range [24].
Nanofiltration is a pressure driven membrane filtration process. The separation performance is located between ultrafiltration and reverse osmosis with a typical molecular weight cut-off (MWCO) between 200–1000 Da and a required feed pressure of 5–30 bar. Mono-valent ions and small molecules pass the membrane, whereas multi-valent ions and other molecules such as biopolymers and large organic micropollutants are retained. The negatively charged membrane surface leads to an increased retention of charged molecules. Nanofiltration is used for treatment of drinking water, surface water, urban and industrial waste water for e.g., softening, color removal and removal of turbidity, dissolved organic matter and microorganisms [25,26,27,28]. In case of industrial processes the membrane can be used for the separation of valuable components. Nanofiltration membranes are produced as spiral-wound, tubular or capillary modules, each of them has their own benefits: spiral-wound modules have the advantages of high packing density and low costs, tubular modules require less pre-treatment and capillary modules do not need expensive pre-treatment and can be backwashed [29].
For this study, a commercially available capillary membrane was upgraded with a new coating, enabling the retention of sulphate and selected OMPs at lower feed pressure compared to conventional sulphate removal technologies. The new developed membrane is applied for the first time to demonstrate the long-term stability for treatment of well water (ground water and bank filtrate) under anoxic to suboxic conditions. The main goal is to show the removal of selected compounds as well as the benefit of bank filtration to prevent biofouling of the membrane in comparison to direct surface water treatment via capNF.
Different studies show the possibility of anoxic operation of nanofiltration at higher iron concentrations up to 8 mg/L for the production of drinking water from ground water and bank filtrate [30,31,32,33]. In all former studies spiral wound membrane modules were used, which cannot be backwashed and are harder to clean. To overcome these disadvantages, a capillary module is applied in this study to demonstrate the benefits of better cleaning properties.
2. Materials and Methods
2.1. Feed Water Source
The water works Tiefwerder is one of nine water works supplying drinking water to the city of Berlin. A mixture of groundwater and bank filtrate is extracted by 55 wells along the river Havel with a well depth of 30–100 m. The water treatment consists only of aeration followed by rapid filtration to remove iron and manganese. Disinfection is not required but possible if necessary. The site was selected because of higher sulphate concentrations [12] and elevated EDTA concentrations in single wells [24].
Data shown in this paper were collected during two different periods of operation: during the first period drinking water was used as feed water whereas during the second period well water (ground water and bank filtrate) from a collecting line of one well field was used. The operation with drinking water as feed water was carried out to get a baseline for the operational conditions. For an intensive sampling campaign during the well water period it was possible to operate only wells with higher concentrations of sulphate and EDTA to increase feed concentrations of these contaminants.
2.2. Capillary Nanofiltration
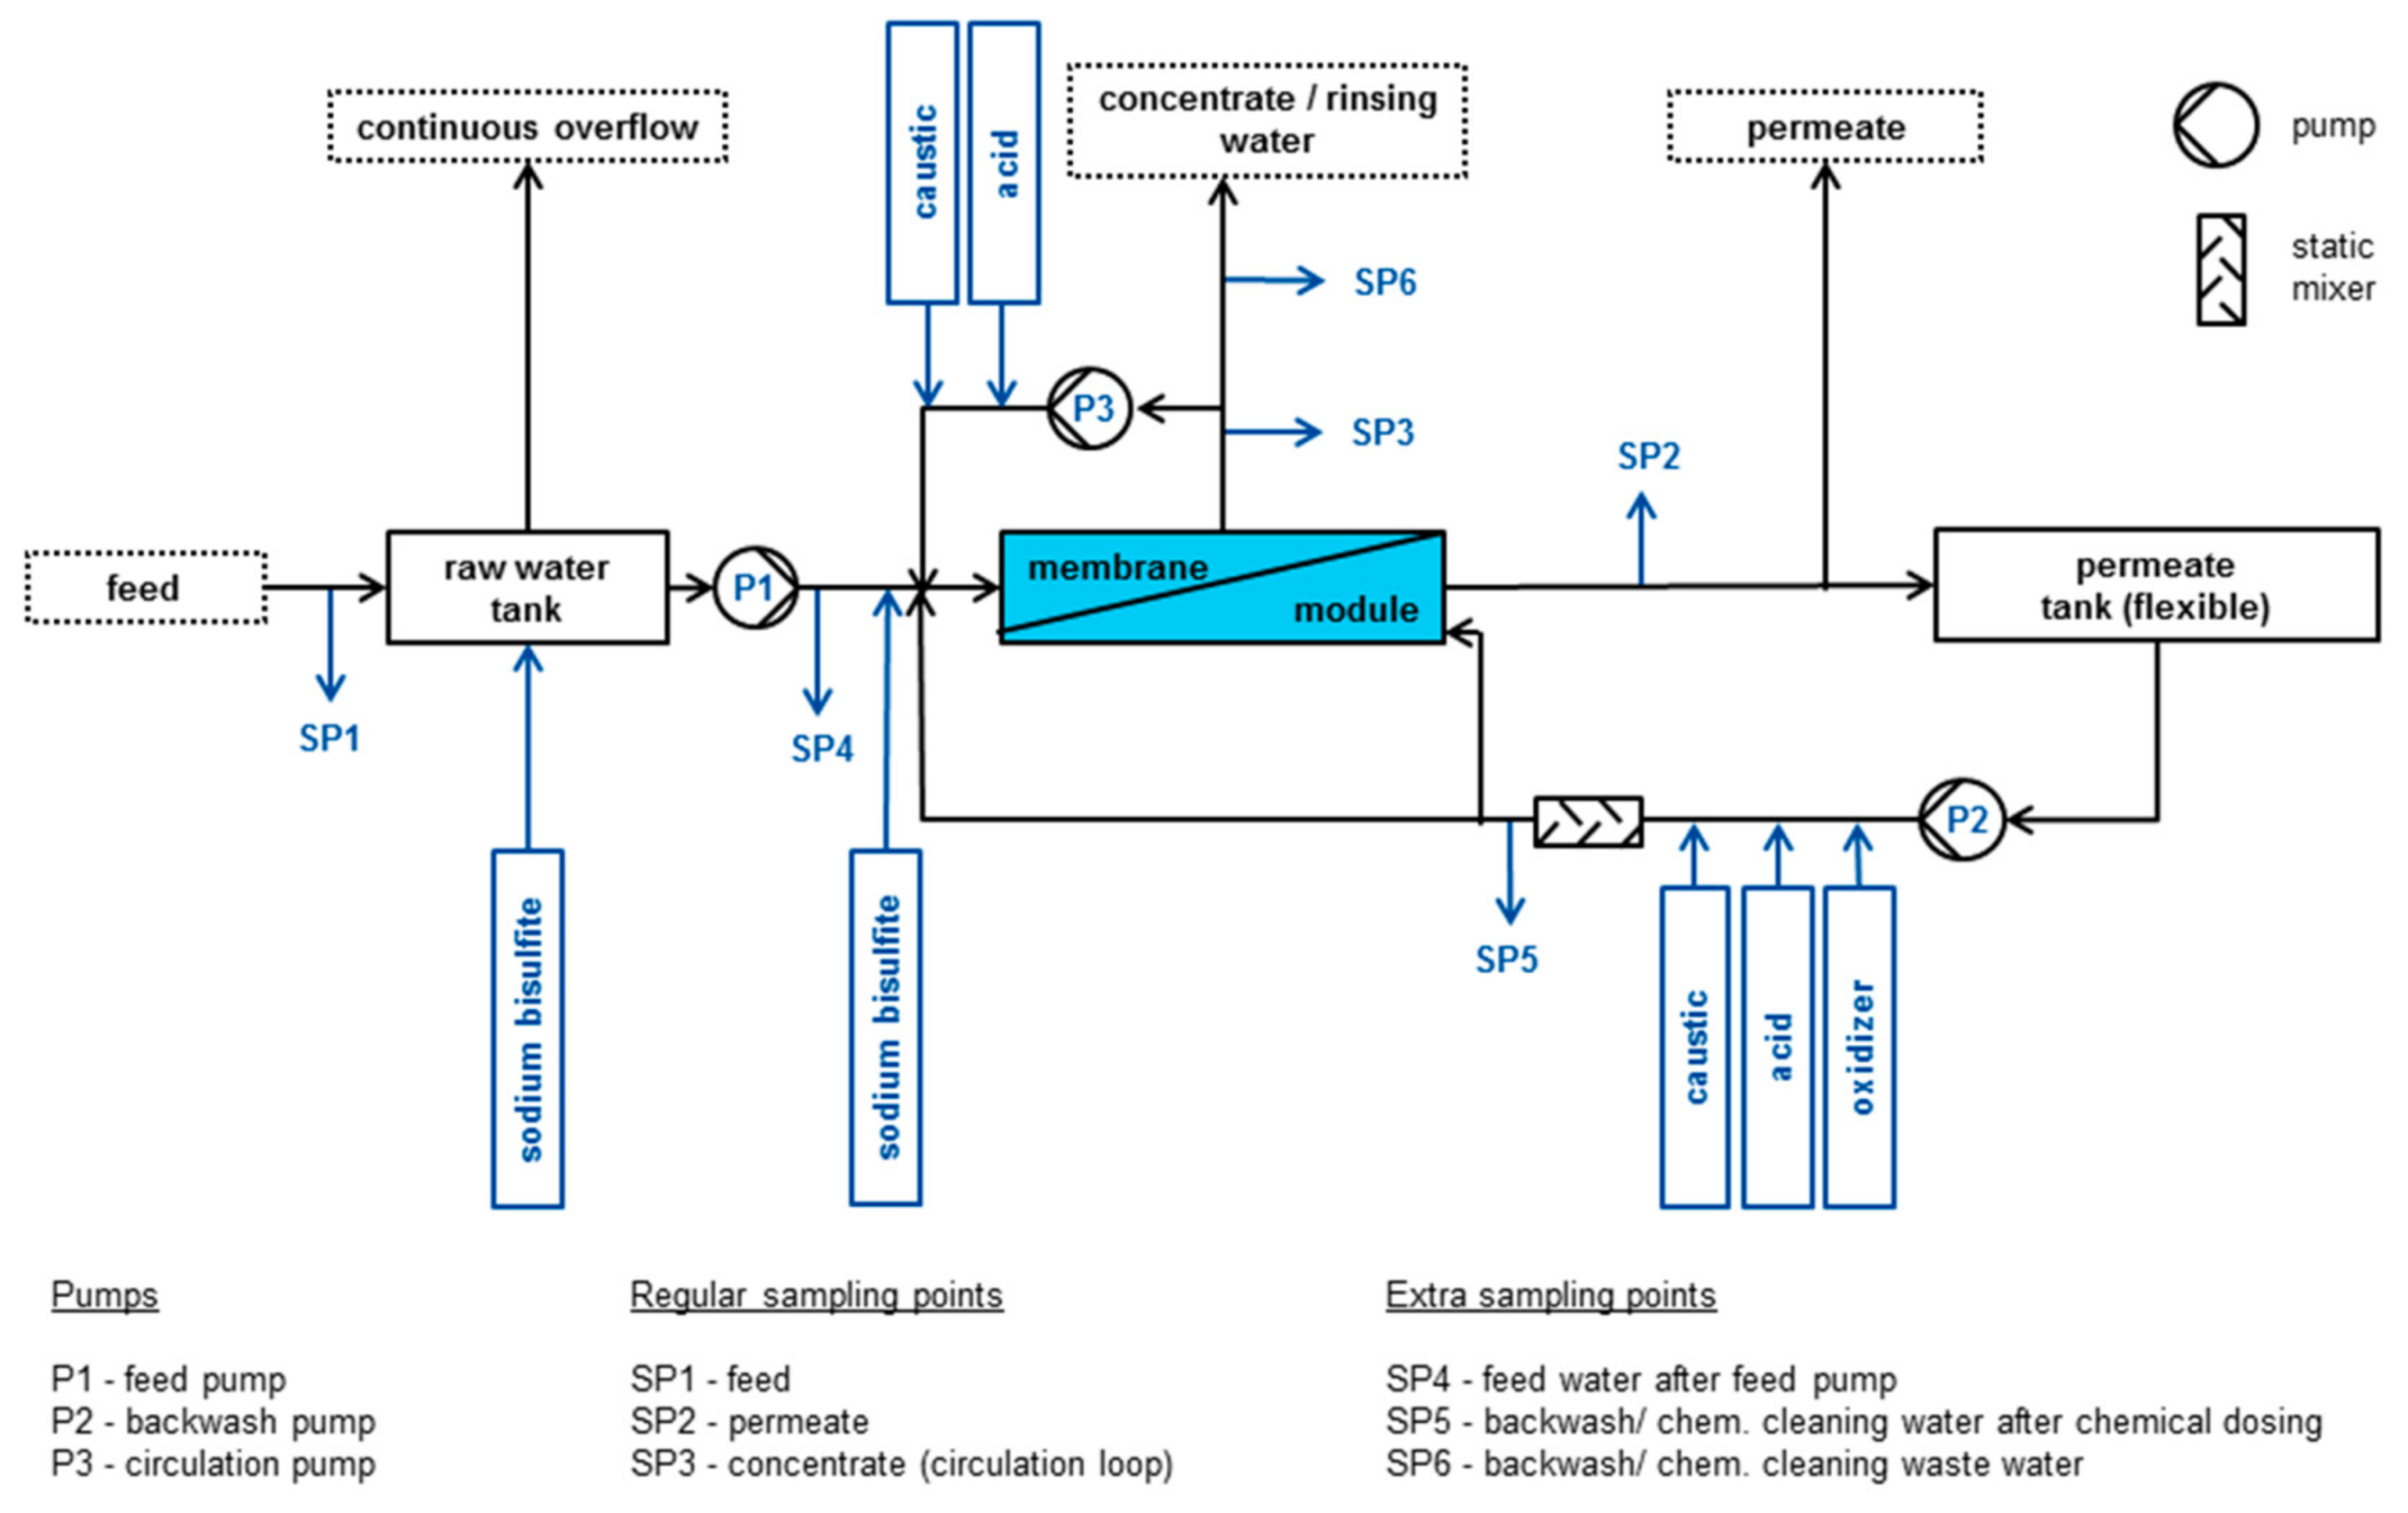
The pilot plant was planned and built by Pentair X-Flow BV and is equipped with a new developed capNF module (HF-TNF). A schematic overview is shown in Figure 1. The filtration direction of the capillaries is inside-out. The plant is operated in feed and bleed mode, this means, during filtration a part of the concentrate is discharged and another part is recirculated over the membrane to increase the cross-flow velocity and therefore reduce concentration polarization and scaling (precipitations) on the feed side. Part of the permeate is stored in the permeate tank for backwash and cleaning and the excess permeate is drained in a nearby infiltration pond. All pumps are flow controlled and equipped with frequency converters. The membrane area is 40 m2 and simulates one stage of a full-scale system. Operation with oxic, suboxic and anoxic feed water is possible. A chemical cabinet with four storage tanks and dosing pumps is available for flexible dosing of chemicals e.g., for membrane cleaning. The pilot plant is placed in a 40 ft. container and equipped with remote control for decentralized operation.
One challenge for the treatment of anoxic source water is the operation under anoxic process conditions, as potential iron and manganese precipitation within the membrane material can result in irreversible loss of permeability. As permeate is used for hydraulic backwash cleaning after each filtration cycle, oxygen input needs to be prevented when tank levels change. Various measures were implemented to operate the capNF system under anoxic conditions: a flexible permeate tank (that prevents the entry of oxygen in permeate used for backwash), a continuously overflowing feed tank, oxidation-reduction potential (ORP) online measurements in feed, permeate and concentrate. Especially for removal of oxygen during start-up phase and after maintenance the option to dose sodium bi-sulphite to feed water was implemented. To prevent the influence of sodium bi-sulphite on water samples, the pilot plant was operated at least four days without sodium bi-sulphite before sampling. The plant is equipped with online measurements for operational parameters (flow, pressure, tank level, temperature) and for water quality parameter (conductivity, pH, ORP, color, turbidity, UV254).
Different operational parameters were tested to investigate the efficiency of the membrane system including variation of:
- flux (15/22.5/27.5/30 L/m2·h)
- recovery (rec) (50/75/85%)
- cross-flow velocity (cfv) (0.2/0.5/1.0 m/s)
2.3. Membrane
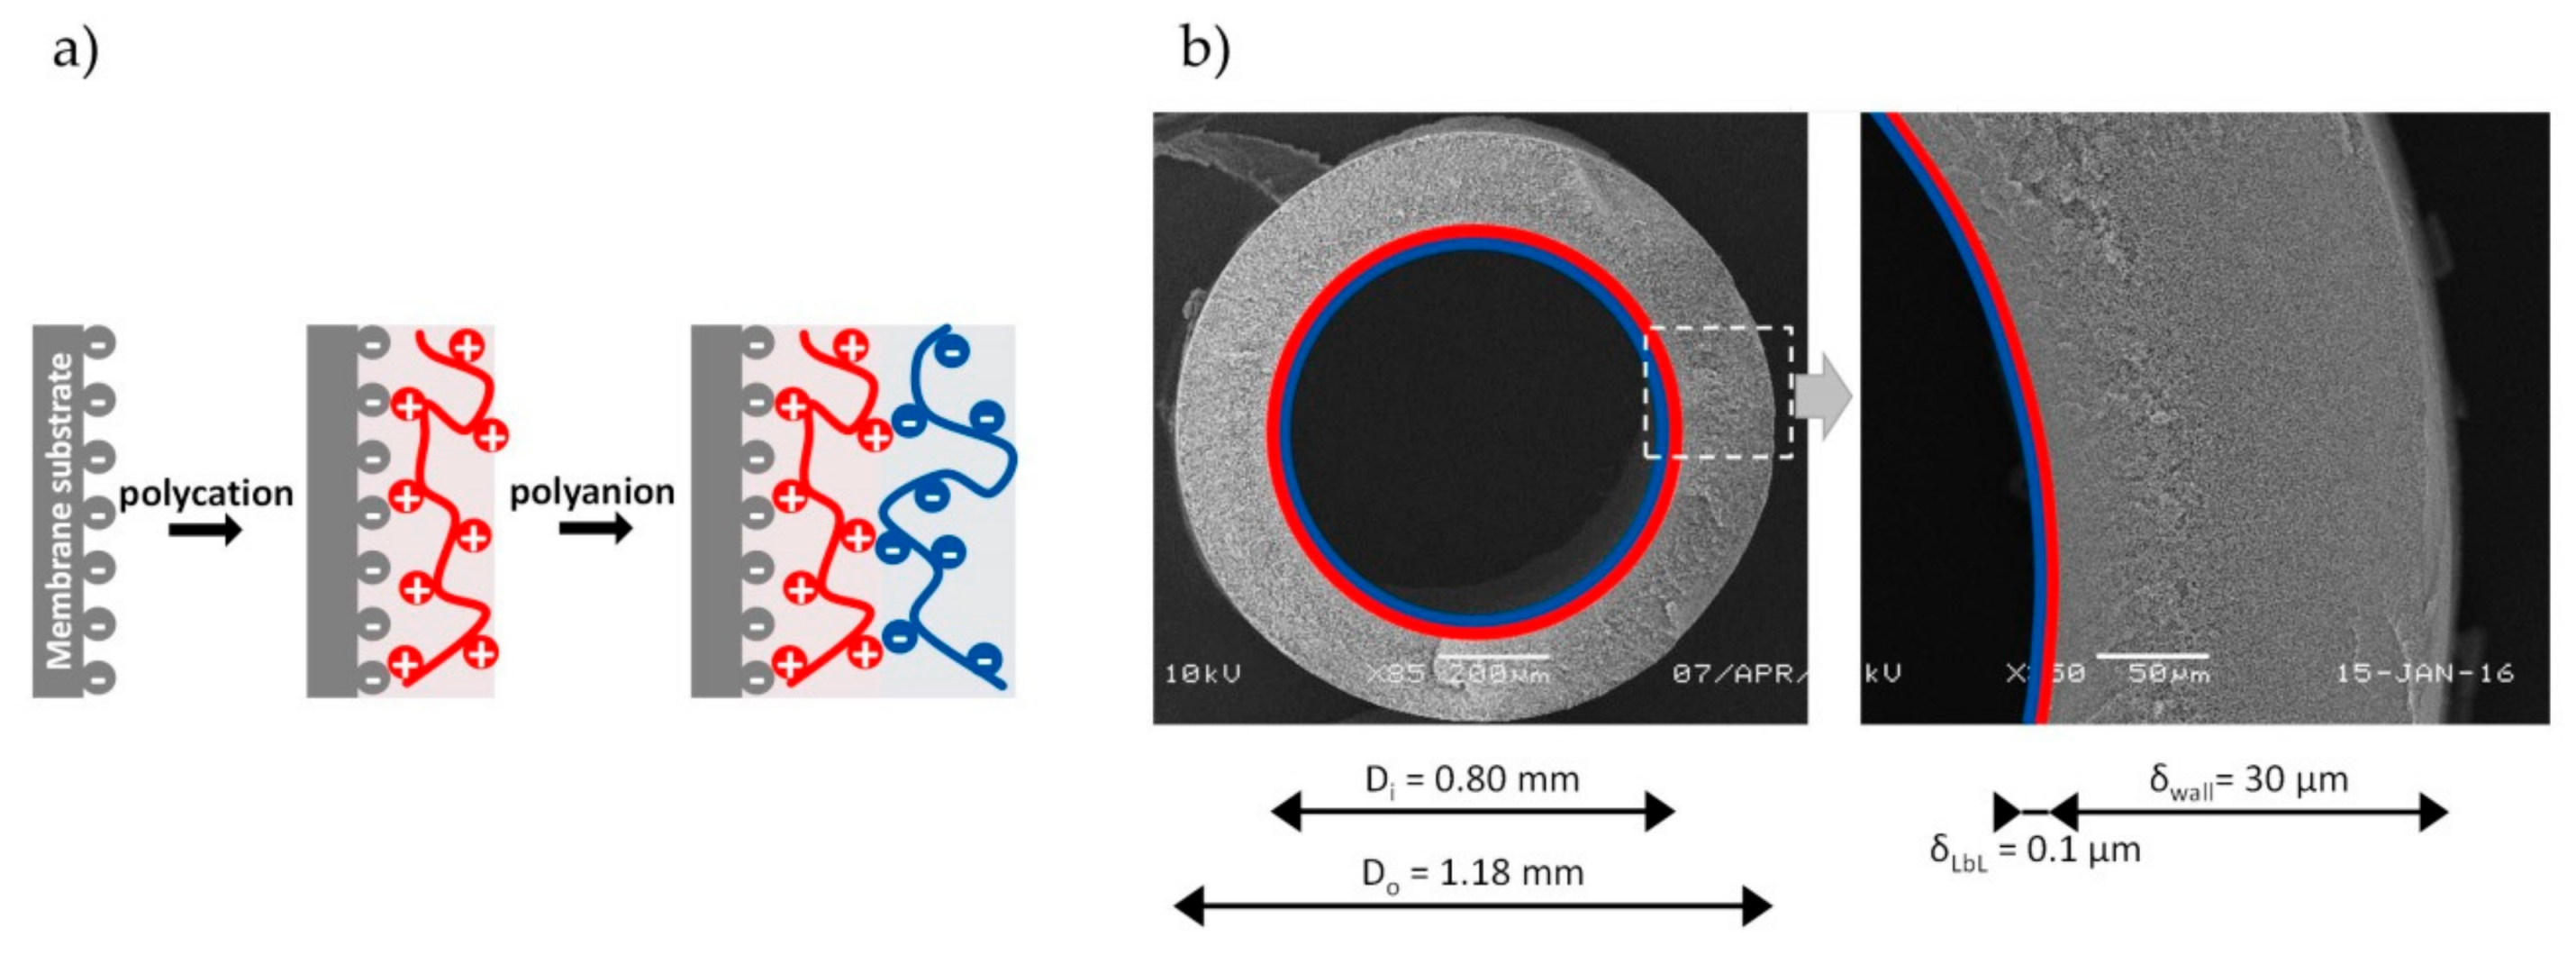
Based on the already existing capillary open NF-membrane HFW1000 (Pentair X-Flow, Enschede, The Netherlands) a new tighter membrane (HF-TNF) was developed and full-scale test modules were produced for the Berlin capNF-pilot of the AquaNES project. The new membrane was improved for high retention of sulphate and removal of specific OMPs (such as EDTA) by applying specific extra coatings using Layer-by-Layer (LbL) technology as demonstrated in the research project LbLBRANE (EC 7th Framework Programme, Grant Agreement no. 281047) [34]. The principle of LbL technology is shown in Figure 2.
Both, the membrane fibers of the relatively open HFW1000 membrane and the HF-TNF, are manufactured from polyethersulfone (PES) and modified PES. The HF-TNF membrane has a negatively charged surface which ensures a strong binding with the positively charged polyelectrolytes to form coated layers. The MWCO of the HF-TNF is about 200–300 Da, estimated from retention measurements with organic substances with specific molecular weights such as polyethyleen glycol.
In total 11.376 capillary membrane fibers with an inner diameter of 0.8 mm and a length of 1.5 m are potted in a module resulting in a surface area of 40 m2. The outside diameter of the module housing is 0.2 m. With the coated separation layer on the inside of the fibers the optimal filtration direction is inside-out which reduces the risk of abrasive wear. With outside-in filtration, the separating layer is on the outside and the membrane is vulnerable for outside influences such as the movement of fibers against each other causing damage to the separating layer. Moreover, with inside-out filtration concentration polarization can be controlled more precisely resulting in a better permeate quality.
The HF-TNF module can be operated with a maximum system pressure of 7.0 bar, a maximum TMP of 6.0 bar and a maximum backflush pressure of also 6.0 bar. The operation temperature can be 0–40 °C. During filtration a pH from 3–11 and during chemical cleaning a pH of 2–12 is possible. The membrane is also resistant to chlorine, allowing the application of 200 mg/L NaOCl for cleaning.
2.4. Online Data and Water Analysis
Online data (pressure, flow rate, level, pH, ORP, T, UV254, color, turbidity) are logged every 20 s. Details on measured parameters, measuring locations and details of probes can be found in appendix, Table A2. In addition, several calculated values were monitored and evaluated such as salt retention, recovery, cross-flow velocity, permeability, resistance, transmembrane pressure (TMP), pressure drop and flux. Online data were analyzed using a software tool [36] that was developed within AquaNES with the free software R [37].
Regular sampling of feed, concentrate and permeate water was carried out every second week, during intensive sampling two times per week and complemented with occasional sampling of wastewater streams. Values for pH, temperature, ORP and oxygen were determined weekly using the portable multi-parameter probe SmarTROLL™ MP from In-Situ. All other chemical parameters were analyzed in the laboratory of Berliner Wasserbetriebe, including sulphate, DOC, iron species, manganese species, UV254, color (436 nm), total hardness, Ca, Mg and conductivity. Furthermore, selected organic micropollutants were analyzed, e.g., gabapentin, acesulfame, vinyl chloride, EDTA, methyl tertiary butyl ether (MTBE), tertiary butyl alcohol (TBA), carbamazepine-10,11-trans dihydrodiol (CBZD), valsartan acid, formylaminoantipyrine (FAA) and phenylethyl-malonamide (PEMA)). All parameters, measuring methods and limits of quantification (LOQ) can be found in appendix, Table A3. For results <LOQ a value of ½ LOQ was used for calculations and figures.
2.5. Calculation of Energy Consumption
Calculation of the energy consumption was performed according to Sethi et al. [38]. The main part of energy is consumed by pumps (feed pump, circulation pump, backwash pump). The energy demand of the feed pump (Efilt) during filtration is calculated as follows:
where pfilt is the pressure downstream of the feed pump during filtration; filt is the volumetric filtration flow rate, ηfilt is the efficiency of feed pump during filtration and tfilt is the filtration time. An efficiency of 0.7 was estimated for all pumps. For calculation of the energy demand of the circulation pump the axial pressure drop over the module length (Δpm) is used:
with:
where U0 is the average cfv at the entrance of a capillary; Dcap is the diameter of the capillary and Lcap the length of a capillary; Am is the total membrane surface and ηc is the efficiency of circulation pump during filtration.
The energy demand of the backwash and feed pumps was calculated according to Equation (1):
where pbw is the pressure downstream the backwash pump; bw is the volumetric flow rate during backwash and ηbw is the efficiency of the backwash pump; pff is the pressure downstream of the feed pump during forward flush; ff is the volumetric flow rate of forward flush and ηff is the efficiency of feed pump during forward flush. tbw and tff are the times for backwash and forward flush, respectively.
The specific energy consumption per m3 produced permeate was calculated as following:
where perm is the volumetric flow rate of permeate.
2.6. Chemical Cleaning
For the membrane cleaning, hydraulic and chemical procedures are available. The hydraulic cleaning consists of forward flush (with feed water), backwash (with permeate) and flush with permeate; backwash and forward flush can be carried out at the same time. The filtration cycle during the main trial period was one hour followed by a hydraulic cleaning. For optimizing of operation filtration cycles up to three days were tested.
The chemical cleaning was always started with a hydraulic cleaning. Chemicals were flushed in together with permeate and circulated on the feed side of the membrane. After circulation the chemicals were flushed out with permeate, followed by another hydraulic cleaning. Different chemicals were tested for cleaning: hydrochloric acid, sodium hydroxide and ascorbic acid, all chemicals and concentrations can be found in appendix Table A5. The cleaning interval was varied as well as the chemical concentrations, temperature and soaking/circulation time. To evaluate the success of the cleaning, online data for permeability, TMP and pressure drop of the membrane were recorded and analyzed.
3. Results and Discussion
3.1. Operational Parameters and Energy Consumption
During the first phase of operation with drinking water as feed different fluxes were tested (see Section 2.2). As a flux of 30 L/m2·h exceeded the maximum allowed TMP for this membrane (5.5 bar), the highest flux applied was reduced to 27.5 L/m² h.
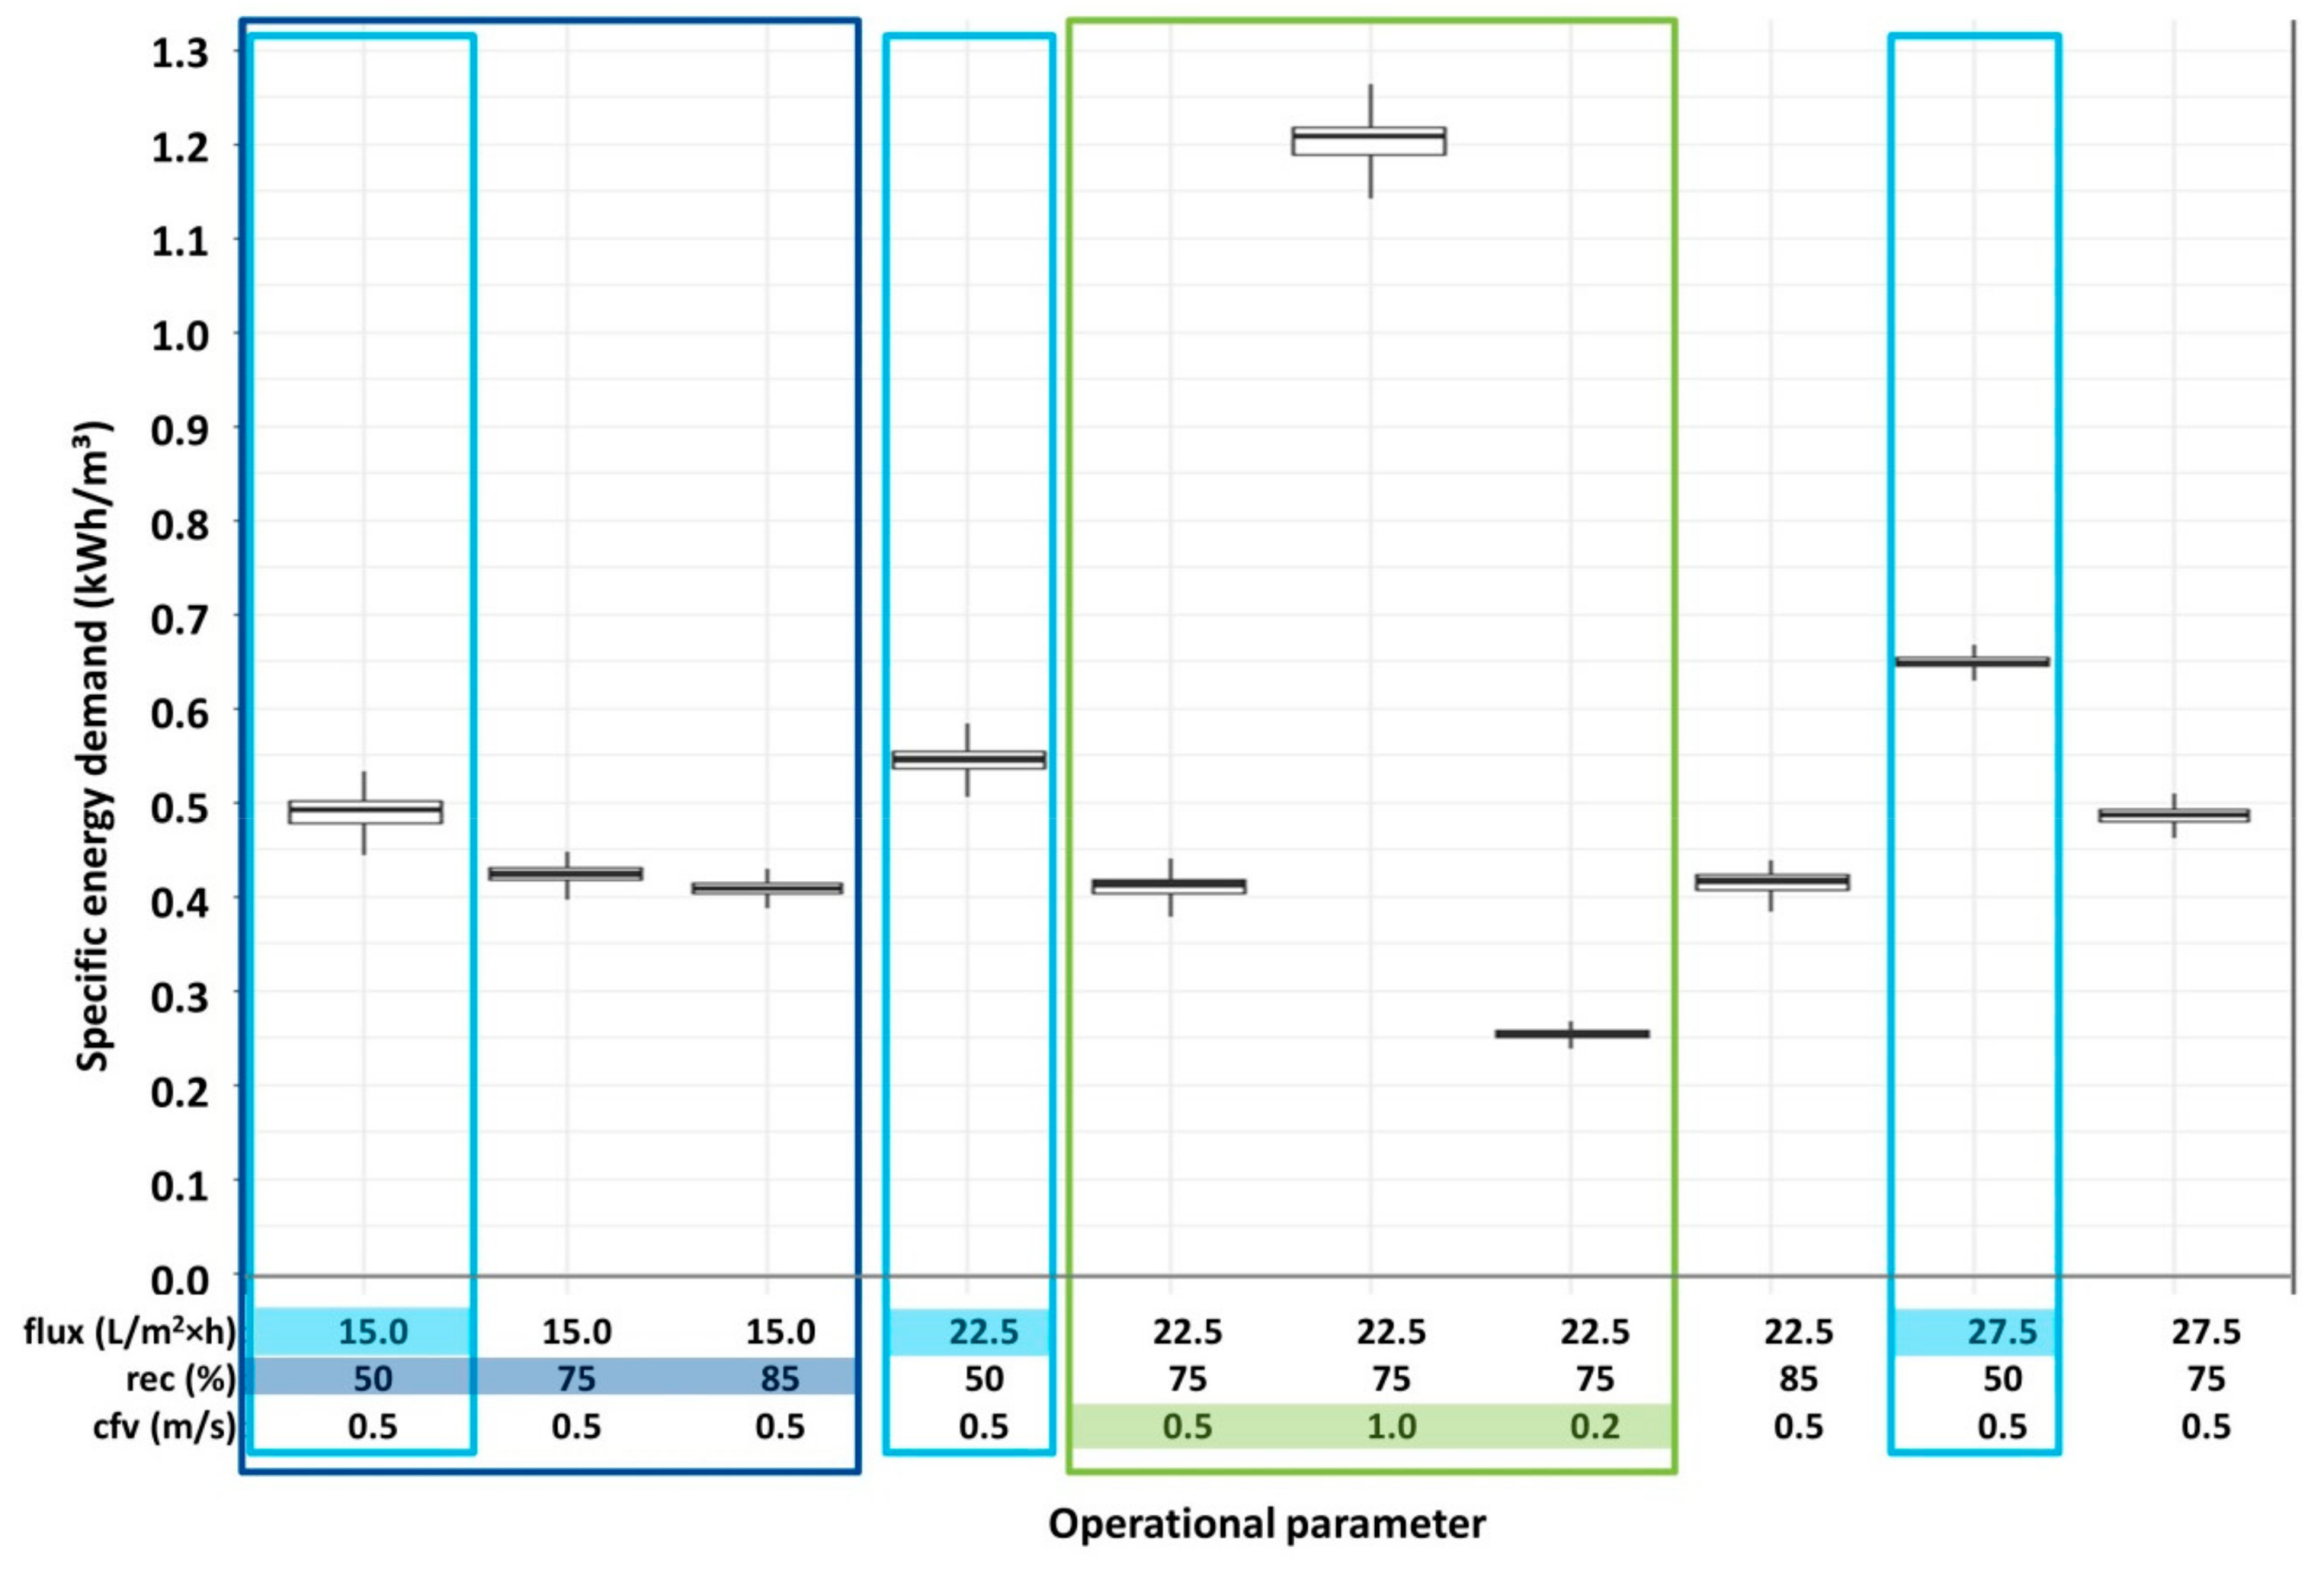
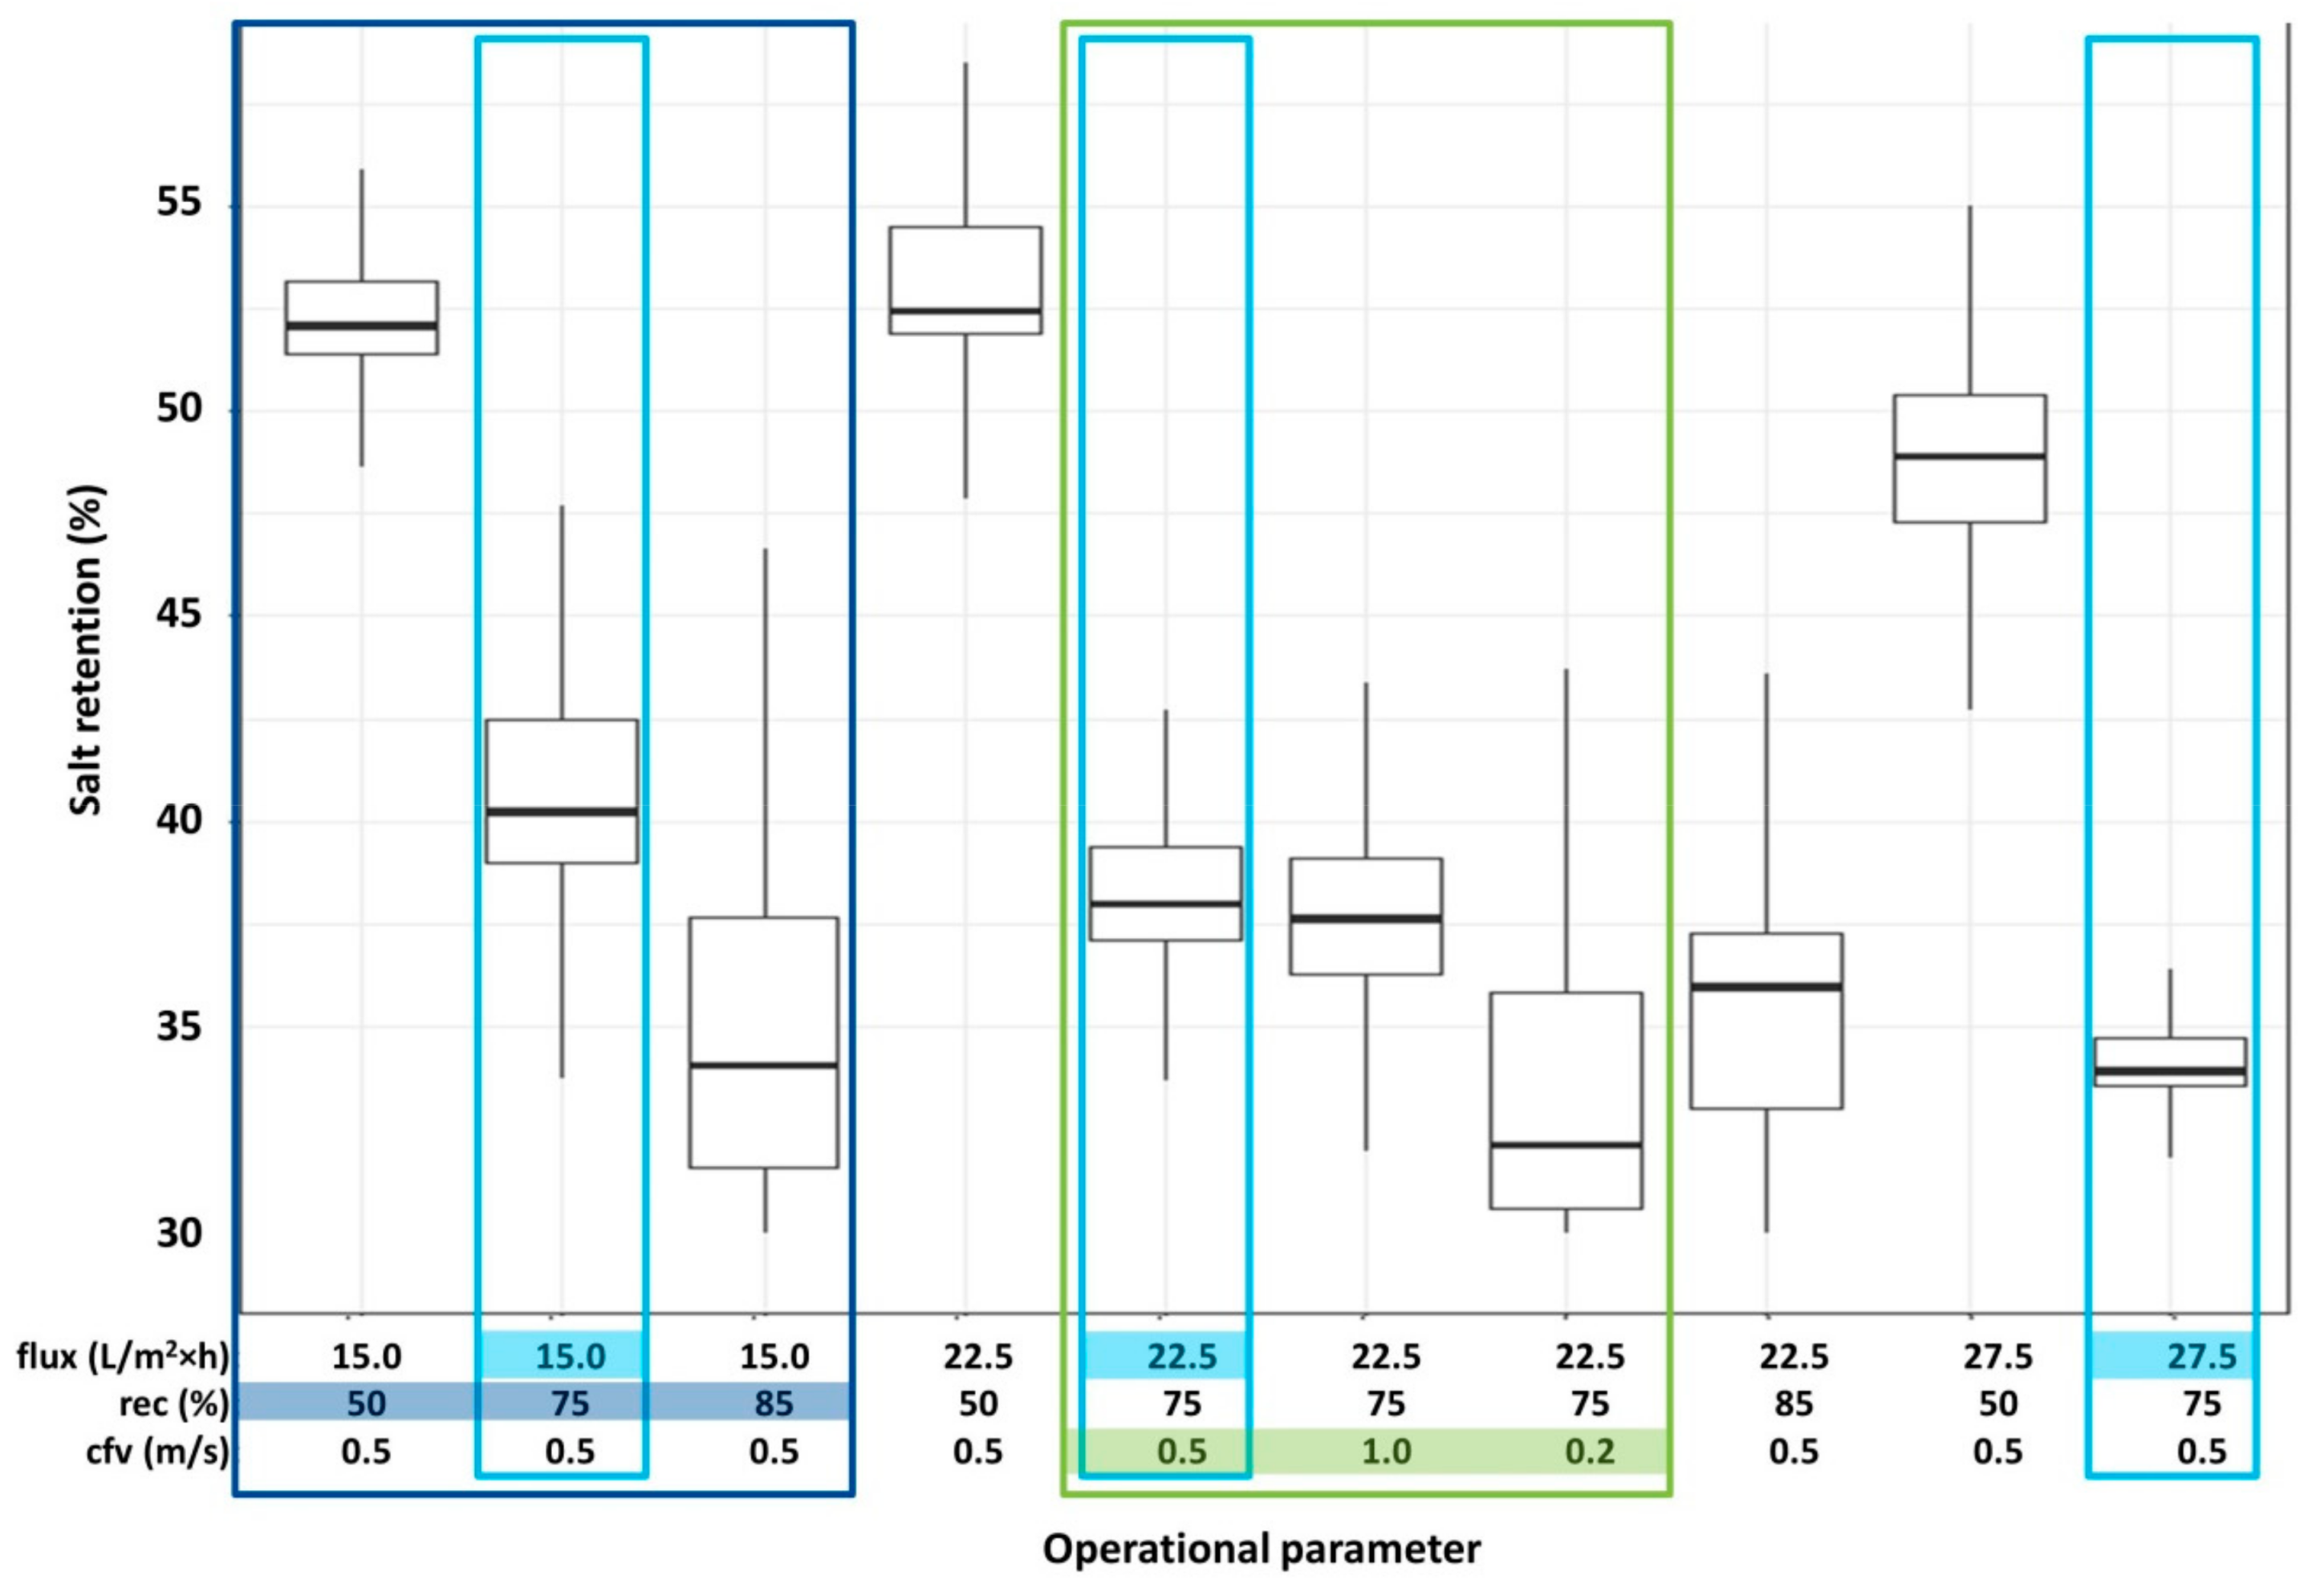
In Figure 3, the specific energy consumption for operation of the capNF system is shown for different operational phases with varying flux, recovery and cross-flow velocity. Main energy consumption is caused by the feed and circulation pumps, whereas the cleaning only had a minor influence. In Figure 4 the salt retention is displayed, calculated from the conductivity of feed water and permeate.
Increase of flux from 15.0 L/m2·h to 22.5 L/m2·h (at constant rec and cfv, see light blue boxes in Figure 3) resulted in an only minor increase of the specific energy consumption, whereas further increase to 27.5 L/m2·h resulted in an increase by 31%. As salt retention only decreased slightly (5–15%, see Figure 4) for increasing flux, a flux of 22.5 L/m2·h was selected for long term operation.
Increase of recovery from 50% to 75% (at constant flux and cfv, see dark blue box in Figure 3) resulted in 23% lower specific energy consumption, with not much change with further increase to 85%. Salt retention decreased by about 23–35% for increasing recovery (Figure 4). Therefore, a recovery setting of 75% was preferred for long term operation.
Increase of cfv from 0.5 to 1.0 m/s (at constant flux and rec, see green box in Figure 3) resulted in an increase of specific energy consumption by almost 200% with similar salt retention. With a lower cfv of 0.2 m/s the energy consumption decreased by about 39% compared to 0.5 m/s, but with decreasing salt retention by about 16% (Figure 4). As a higher fouling rate is expected with a low cfv, a cfv setting of 0.5 m/s was selected for further operation.
Salt retention is automatically calculated using the online conductivity measurement values in feed and permeate. The behavior during flux variation is not consistent. Increase of flux from 15.0 L/m2·h to 22.5 L/m2·h and further to 27.5 L/m2·h (at constant rec and cfv, see light blue boxes in Figure 4) for a recovery of 75% resulted in a slight decrease of salt retention (2–4%), whereas for recovery of 50% and 85% no decrease or rather very slight increase of salt retention (0.5–2%) with the increase of flux from 15.0 L/m2·h to 22.5 L/m2·h and with further increase to 27.5 L/m2·h in slight decrease (2.5%) was observed.
Increase of recovery (at constant flux and cfv, see dark blue box in Figure 4) resulted in a clear decreasing salt retention (18% in total).
Between cfv of 0.5 and 1.0 m/s (at constant flux and rec, see green box in Figure 4) only a marginal difference of 0.5% is visible, but with further decrease to 0.2 m/s also the salt retention decreases by about 5.5%.
Due to retention of dissolved salts an interface directly at the membrane surface with higher salt concentration is formed (concentration polarization). This causes an increased concentration gradient and therefore an increased permeation of salts; the thicker the interface the higher the concentration gradient. The thickness of interface increases with increasing flux, increasing recovery and decreasing cfv. These effects could be observed with the available data. The thickness can be decreased e.g., with an increase of cfv with increase of turbulence, with the effect of less concentration polarization and higher salt retention. In this case with cfv of 0.2–1.0 m/s only laminar flow conditions occur with calculated Reynolds numbers of about 160–800.
In summary, specific energy consumption increased with increasing flux and cfv and decreasing rec (see Figure 3). For salt retention, retention decreases with increasing flux and recovery and decreasing cross-flow velocity (see Figure 4). Same behavior was found for the retention of other compounds such as sulphate and DOC (not shown). But it must be noted: the additional energy consumption of capNF is in the same range as the total specific energy consumption for drinking water supply in Germany (0.51 kWh/m3 [39]).
The contribution of the hydraulic cleaning to the total energy consumption is very low (about 0.5%) compared to the feed and circulation pumps, which are the main energy consumers. Therefore, an increase of filtration time and consequential reduction of hydraulic cleaning only has a minor effect on the overall energy consumption. A potential for improving the energy consumption could be a further reduction of cfv, mainly values between 0.2 and 0.5 m/s should be tested, to get a sufficient retention together with low energy consumption. However, the increase of scaling or fouling on the feed side has to be observed with decreasing cfv. Further increase of recovery could also be an option to reduce the energy consumption of the filtration.
For the switch to well water sodium bi-sulphite was dosed to the feed water to remove all oxygen from pipes and membrane module. This procedure was also applied before and after every rebuilding, air integrity tests or other maintenance.
Operation with well water started with a low flux (15 L/m² h), low recovery (50%) and filtration time of 60 min to get the direct comparison with start conditions with drinking water. During this period no increase of TMP could be observed. Subsequently, the flux was increased to 22.5 L/m2·h and the recovery set to 75%. With these settings a rapid increase of TMP was observed, the chemical cleaning could not control this increase and the flux and recovery had to be set back to start conditions until a suitable cleaning concept was found (see Section 3.3). With the improved cleaning concept the operation was possible with a flux of 22.5 L/m2·h and recovery of 75% without problems.
As every backwash causes an interruption of production as well as a consumption of permeate with increasing amount of waste water, it was tested to increase the filtration time from 60 min to 24 h and further up to 72 h. It was observed that the increase of TMP was slower at 24 h and 72 h filtration time compared to 60 min, which was not expected. The filtration with these increased intervals was possible without any problems. The reason for the slower increase of TMP was assumed to be caused by lower entrance of oxygen via the permeate outlet. Although a flexible tank is installed to prevent the entrance of oxygen, a small amount of oxygen can enter the permeate side of the membrane with every backwash due to decreasing tank level. As a consequence, a higher amount of iron and manganese precipitation could be formed with increasing backwash frequency. However, a lower backwash frequency also results in longer stagnation of water in the permeate tank, which could lead to microbiological growth. To prevent this, an exchange with fresh permeate should be considered.
3.2. Retention of Compounds
In Table 1 selected parameters for feed water, permeate and concentrate are shown (see Table A1 in appendix for more detailed version). During the tests with well water the feed temperature was between 11 and 14 °C, the pH about 7, the ORP about 100 mV and the oxygen concentration below LOQ.
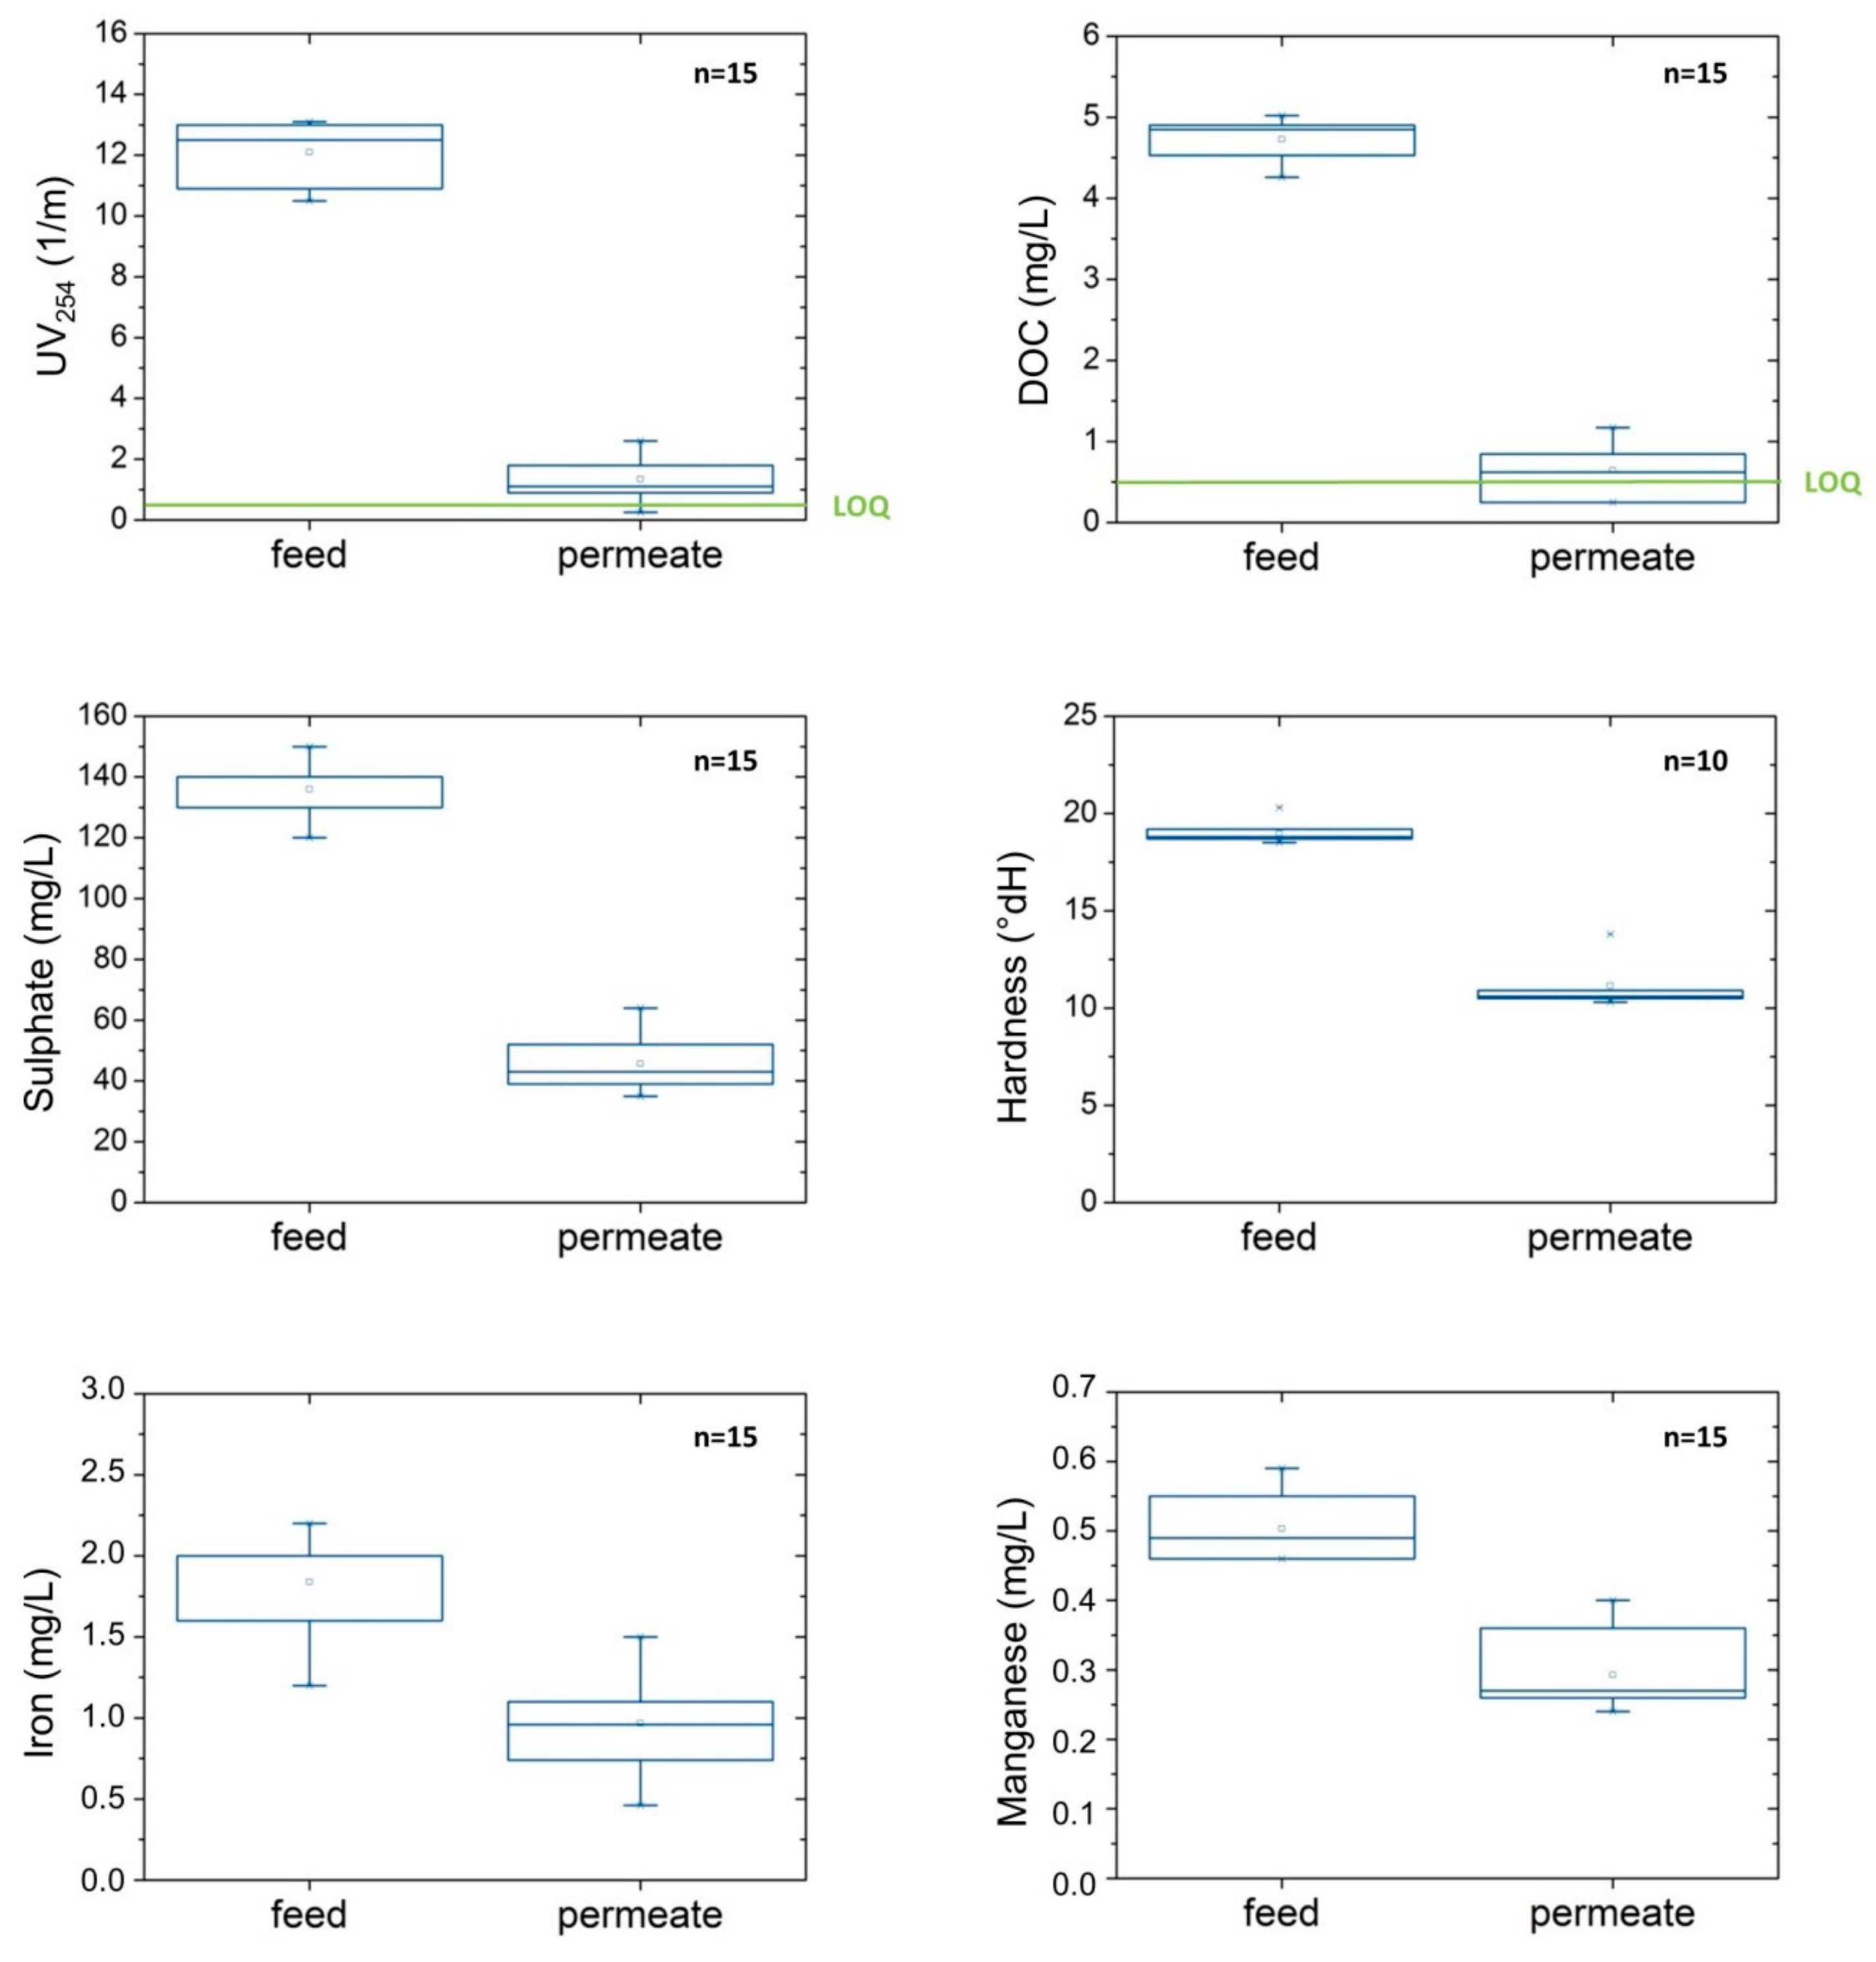
In Figure 5, feed and permeate concentrations for selected parameters are shown. High retentions were found for UV254, DOC and sulphate: UV254 could be reduced by 85–89%, DOC by 82–87% (four permeate samples <LOQ (<0.5 mg/L)) and sulphate by 67–71%. Medium retentions were determined for hardness (41–55%), calcium (40–54%) and magnesium (50–64%), as well as for iron species (48–49%) and manganese species (42%). Only minor retention was observed for conductivity (22–32%) since monovalent ions are hardly retained by capNF.
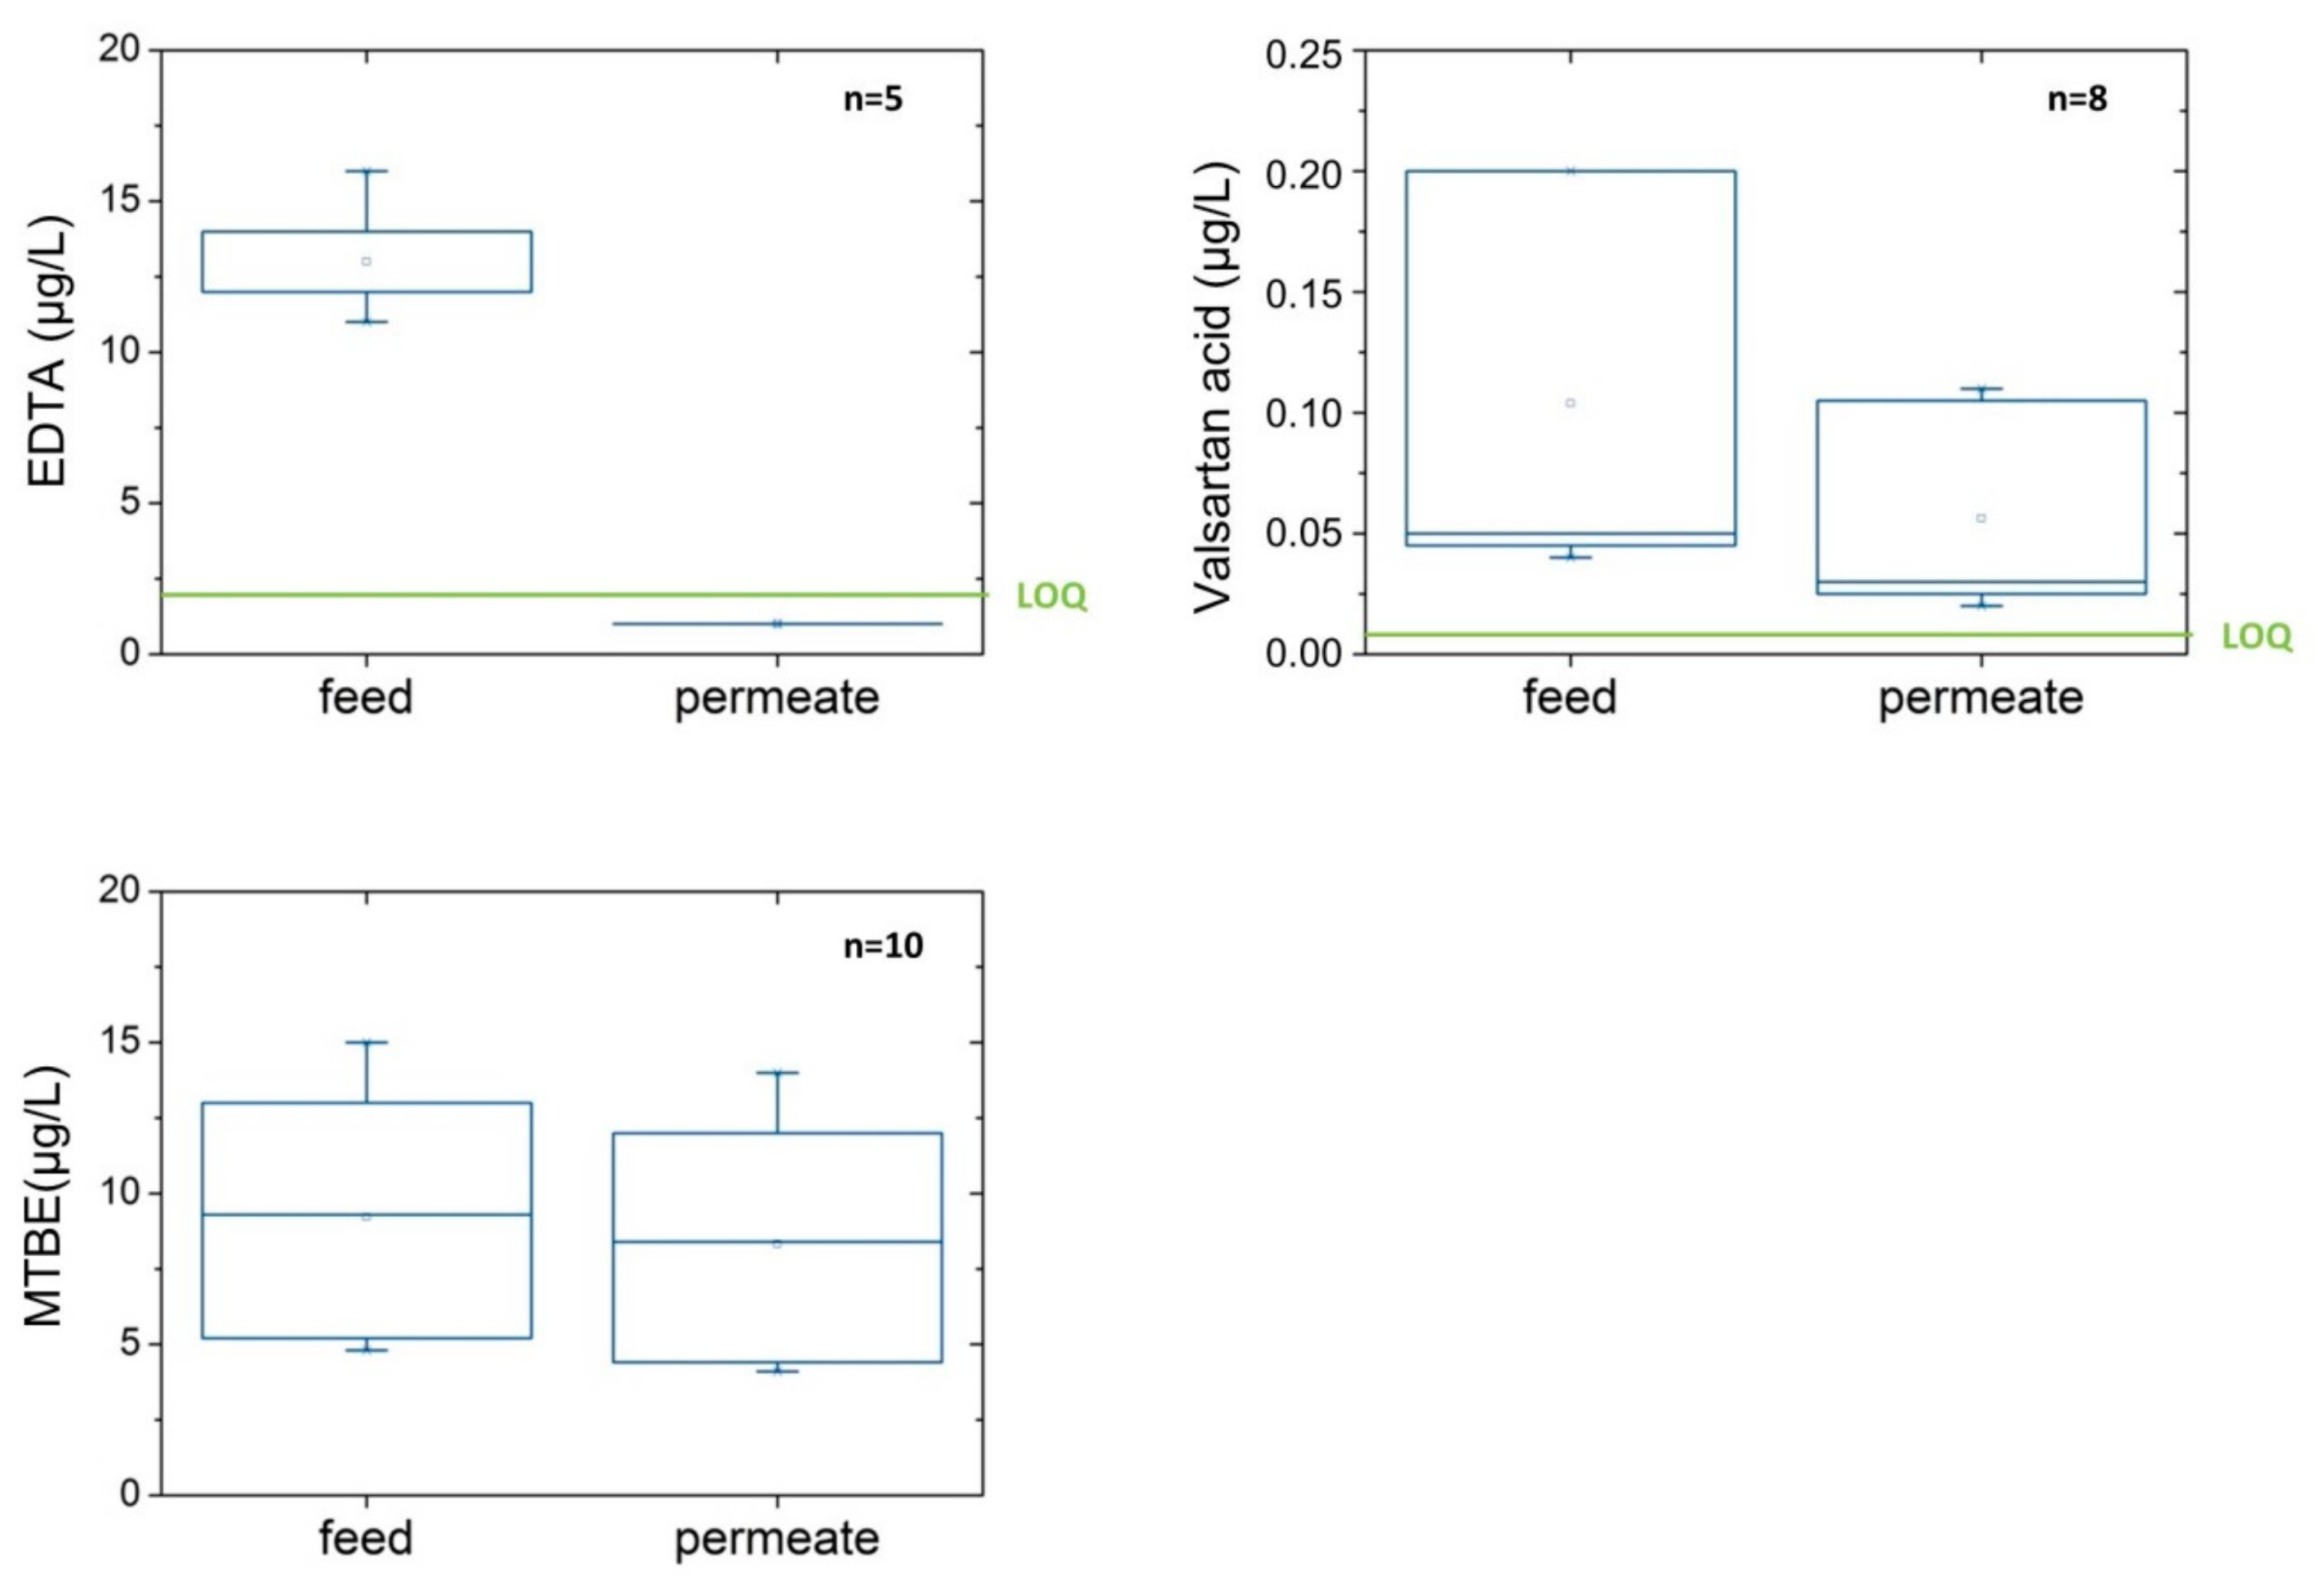
In Figure 6, feed and permeate concentrations for selected OMPs are displayed. High retention of 84–92% was found for EDTA, medium retention of 44–58% for valsartan acid (similar for Gabapentin and FAA) and only minor or no retention for MTBE (also for TBA, acesulfame and vinyl chloride).
For iopamidol (LOQ = 0.02 µg/L), candesartan (LOQ = 0.01 µg/L) and olmesartan (LOQ = 0.01 µg/L) the permeate concentration was always <LOQ. As the feed concentration was less than 5 times of LOQ, the retention was not calculated. For CBZD, PEMA; primidone, gaba-lactam and carbamazepine retention could not be determined too, as the feed and permeate concentrations were only slightly above LOQ.
In Table 2, feed concentrations and calculated retentions of selected parameters are compared for the sampling campaigns using drinking water and well water as feed. If the permeate concentration was below limit of quantification (LOQ), a value of ½ LOQ was used for calculation of the retention. In this case only feed concentration values of 5 times LOQ were used for calculation, otherwise no retention was calculated to prevent a high calculation failure.
The commercial available module HFW 1000 was developed for removal of color and natural organic matter; the new membrane HF-TNF was developed for improved retention of sulphate and selected OMPs. A comparison of both membranes can be found in Table 3.
About the same retention of UV254 was observed with a slightly higher retention of DOC. A much better retention is shown for bivalent ions such as hardness (Mg2+ and Ca2+).
Using capNF, the sulphate retention of about 67% could be sufficient for decentralized treatment of water from wells with higher concentrations of sulphate without using high pressure technology.
For OMP, the retention depends on size, structure and charge of the molecule. The MWCO for the new HF-TNF membrane is 200–300 Da. For molecules with higher molecular weight (MW) such as EDTA (MW: 292.24 g/mol), FAA (231.251 g/mol), gabapentin (171.24 g/mol) and valsartan acid (266.08 g/mol) a medium/high retention was expected and could be confirmed by the laboratory results. Molecules with a lower MW such as MTBE (88.15 g/mol), TBA (74.12 g/mol) and vinyl chloride (62.50 g/mol) showed no or only minor retention, which was also expected. The weight of the molecules iopamidol (MW: 777.08 g/mol), candesartan (MW: 440.45/610.66 g/mol) and olmesartan (558.585 g/mol) is clearly above the MWCO of the membrane; a medium/high retention could be expected but could not be calculated due to low feed concentrations. Nevertheless, the permeate concentrations are always below LOQ. For CBZD (MW: 270.288 g/mol), PEMA (MW: 206.24 g/mol); primidone (MW: 218.252 g/mol), gaba-lactam (MW: 153.225 g/mol) and carbamazepine (MW: 236.27 g/mol) the feed concentration is slightly >LOQ too, but retention could hardly or not be detected. The weight of all molecules is in the range or below the MWCO; therefore medium/low or no retention was expected but could also not be shown with these low feed concentrations. The MW and the structure of OMP can be found in appendix, Table A4.
The measured MTBE and TBA pollutions in well water of the water works are caused by a former fuel depot in an industrial area. The derived no-effect level (DNEL) for ground water for MTBE of 5 μg/L was defined by LAWA [42,43], only single wells show an elevated concentration; in drinking water the measured values are much lower. For TBA, a DNEL for ground water of 2 mg/L was defined by UBA [24,43], the measured values are far below DNEL. The pollution by vinyl chloride is caused by volatile chlorinated hydrocarbon contaminant plumes from a legacy from an industrial area. Because of carcinogenicity the limit value for drinking water is 0.5 μg/L [10]. Vinyl chloride is volatile and completely removed by common aeration of raw water [24,43].
For iron a reduction of 48% was observed, for manganese a reduction of 42%. In the present case the permeate concentrations are 0.97 ± 0.29 mg/L iron and 0.29 ± 0.06 mg/L manganese, this means a further treatment step is necessary to keep the limits for drinking water (iron: <0.2 mg/L; manganese <0.05 mg/L) [10]. Permeate could be fed back to the common drinking water treatment process of aeration and filtration to remove iron and manganese residues.
3.3. Hydraulical and Chemical Cleaning
Using drinking water as feed, no increase of TMP could be observed during all tested operational settings. Nevertheless, after each filtration cycle of 60 min a backwash was executed. Chemical cleaning was carried out before each change of operational parameters to set back the membrane starting conditions for the next test.
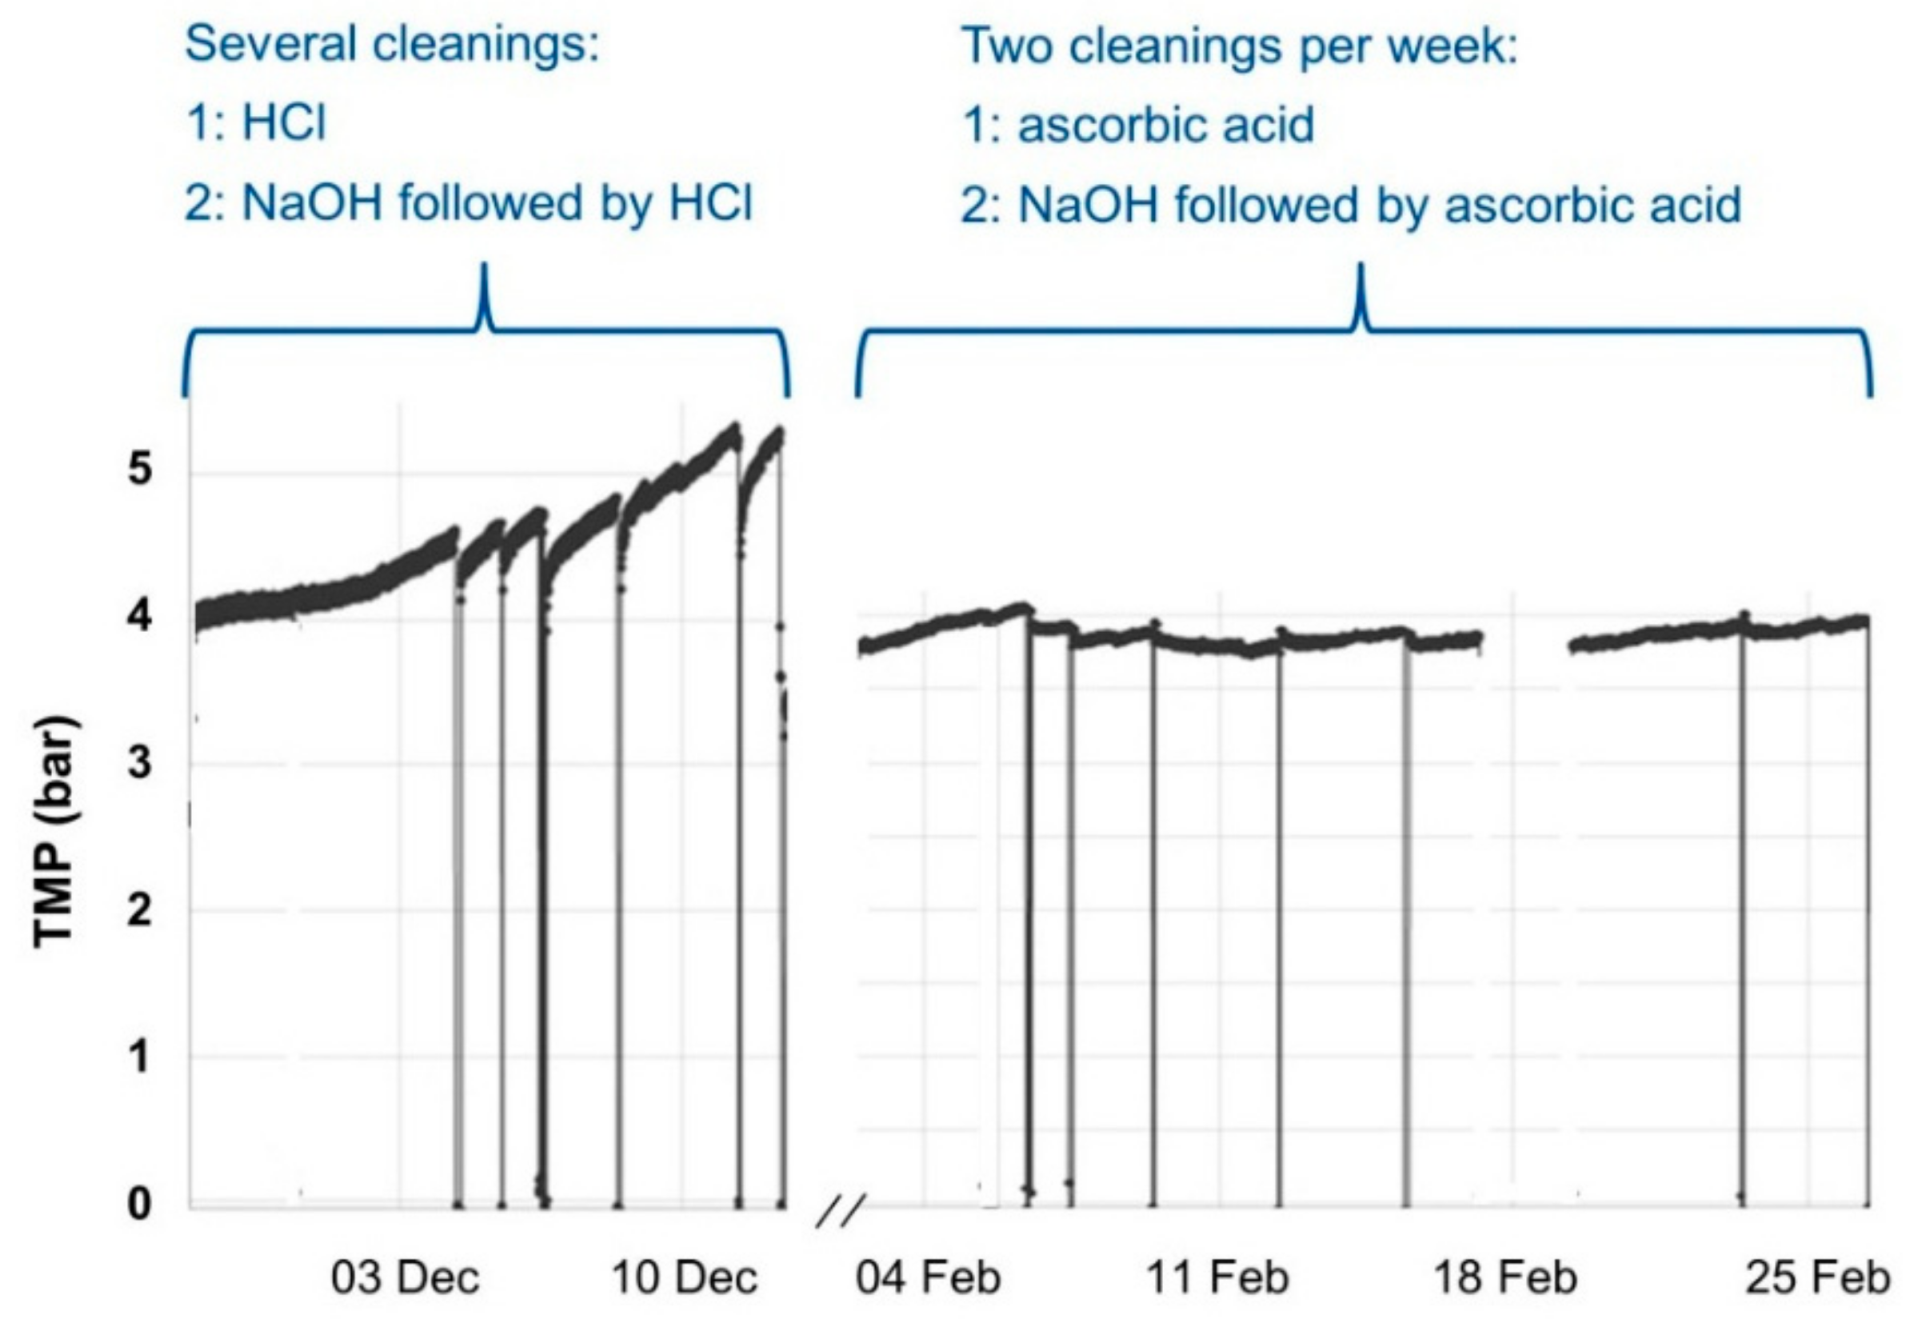
With well water as feed source and a flux of 15 L/m2·h, recovery of 50% and cross-flow velocity of 0.5 m/s, only a slight increase of TMP of about 0.15 bar during the first days was visible, therefore preventive weekly chemical cleaning was carried out. With a higher flux of 22.5 L/m2·h and higher recovery of 75% the TMP increased rapidly, which indicates a high fouling potential of the feed water. With hydraulic cleaning and chemical cleaning with HCl and NaOH it was not possible to restore the starting TMP. As tests with higher chemical concentrations and higher temperature during the cleaning process did not show any success, HCl was exchanged with ascorbic acid which resulted in a successful restoration of the TMP to start conditions (see Figure 7).
A second acid cleaning after caustic cleaning is necessary to prevent high pH values and precipitation of feed water compounds during the following first filtration cycle. With adaptation of the control software the use of two kinds of acid for the chemical cleaning process was possible. To reduce the consumption of the more expensive ascorbic acid, the second acid cleaning to lower the pH inside the module was carried out with HCl.
Main fouling was expected from precipitation of iron and manganese due to dissolved iron and manganese concentrations in well water. The common used cleaning concept with HCl and NaOH was not successful for well water as feed water. With the change from HCl to ascorbic acid for chemical cleaning the initial TMP could be restored. The reductive dissolution of iron from fouled membranes using ascorbic acid was already described in former studies [44,45].
However, with the use of ascorbic acid the amount and costs for chemical cleaning increase. The goal, to reduce the amount or replace ascorbic acid, is still in progress. As first successful step the second acid cleaning to lower the pH is now carried out with HCl instead of ascorbic acid, resulting in a reduction of ascorbic acid consumption by 50%. Tests with reduced ascorbic acid amounts and adjustment of pH with HCl during the first acid cleaning were also carried out, here first positive results could be observed but longer test duration is necessary. In further trials e.g., citric acid could be tested as cheaper alternative, but was found to be less effective in other studies [45]. Also, oxalic acid could be another substitute because of its reducing properties.
The backwash showed no additional positive effect on membrane performance, a reduction of backwash intervals was possible without any problems. The disadvantage of oxygen introduction to the backwash process is caused by insufficient exclusion from ambient air at the pilot plant. As each hydraulic cleaning cause an interruption of the production process and consumption of permeate, the increase of filtration time is recommended.
3.4. Online Probes
Several online probes are installed in feed, circulation, concentrate and permeate pipes. The measuring values are regularly compared with manual measurements and lab results. The s::can probes for turbidity, UV254 and colour showed iron/manganese fouling in bypass hoses and on measuring window. A regular (weekly) cleaning with HCl (5%) was necessary to produce usable results. The Endress + Hauser probes for conductivity (conductive measuring principle) showed no stable measuring values after switch to operation with well water, here also iron/manganese precipitation were found. After cleaning of probes with HCl (5%) the measured values decrease within a few hours, the evaluation of this data was not possible. It was decided to install new probes with inductive measuring principle (Endress + Hauser, Indumax CLS50D); this allows measurement without media contact. After installation of the new probes a stable measuring value was observed for conductivity with much less cleaning effort.
3.5. Concentrate Discharge
During operation of capNF about 25% of concentrate will be discarded continuously. The drainage or treatment of such waste water is a significant problem and cost factor in membrane processes. Different possibilities exist for handling of concentrate: in most cases it is discharged to the receiving water body, sporadically discharged to the sewer for further treatment [46]. However, other technologies for zero liquid discharge (ZLD) are currently under investigation. ZLD is a concept to avoid liquid waste in membrane processes with the possibility to reuse water and salts. In [47] thermal processes for concentrate (brine) treatment are described as not economical because of high investment costs and high energy consumption. To reduce costs, membrane processes for post-treatment of brine are tested to reach higher brine concentrations and thus reduce liquid waste prior thermal treatment. One challenge is the presence of compounds which cause fouling and scaling during membrane processes. These compounds must be removed via pre-treatment, depending on brine source and typical contaminants, promising technologies include chemical precipitation or coagulation, electrocoagulation, ion exchange or adsorption [47].
4. Conclusions
The results of the tests have shown that the operation of capillary nanofiltration under anoxic conditions is possible at a flux up to 22.5 L/m2·h and a recovery up to 75%. Pre-treatment via bank filtration resulted in low organic fouling. The fouling caused by precipitation of iron and manganese could be removed with an optimized operation and cleaning concept using effective chemicals.
With the new developed HF-TNF membrane module good retentions of DOC (82–87%), sulphate (67–71%) and hardness (41–55%) could be demonstrated. In addition, micropollutants were retained depending on size and charge of the molecule, e.g., EDTA (84–92%).
Results indicate that a stable long-term operation of the membrane system is possible. With a filtration time of 24 h and backwash with forward flush after each cycle the operation was stable. A two-weekly chemical cleaning with ascorbic acid/HCl and caustic led to an effective reduction of slowly increasing TMP.
Author Contributions
Conceptualization, M.U. and S.A.; Methodology, V.L., M.U. and W.D.; Validation, J.J. and V.L.; Formal Analysis, V.L. and J.J.; Investigation, J.J. and V.L.; Data Curation, J.J.; Writing-Original Draft Preparation, J.J. and V.L.; Writing-Review & Editing, W.D., S.A. and M.U.; Visualization, J.J.; Supervision, M.U.; Project Administration, W.D.; Funding Acquisition, M.U. and S.A.
Funding
The AquaNES project has received funding from the European Union’s Horizon 2020 research and innovation programme under grant agreement no. 689450.
Acknowledgments
We thank all the colleagues of Berliner Wasserbetriebe for providing the infrastructure, supporting the installation of the plant and carrying out the lab analysis. The operation of the pilot plant would not have been possible without the following persons: Henry Hamberg, Michael Rustler, Jan Schütz, Timo Hoff, Victoire Schellenberg, Charlotte Rohde and Carolin Flöter.
Conflicts of Interest
The authors declare no conflict of interest. The funders had no role in the design of the study; in the collection, analyses, or interpretation of data; in the writing of the manuscript, and in the decision to publish the results.
Abbreviations
| capNF | capillary nanofiltration |
| CBZD | Carbamazepine-10,11-trans dihydrodiol |
| cfv | cross-flow velocity |
| DNEL | derived no-effect level |
| DOC | dissolved organic carbon |
| EDTA | Ethylendiamintetraacetic acid |
| FAA | Formylaminoantipyrine |
| LbL | Layer-by-Layer |
| LOQ | limit of quantification |
| MTBE | Methyl tertiary butyl ether |
| MW | molecular weight |
| MWCO | molecular weight cut-off |
| NF | nanofiltration |
| OMP | organic micropollutants |
| ORP | oxidation-reduction potential |
| PEMA | Phenylethyl-malonamide |
| PES | polyethersulfone |
| rec | recovery |
| TBA | Tertiary butyl alcohol |
| TMP | transmembrane pressure |
| UV254 | absorption of ultraviolet light (wave length: 254 nm) |
| ZLD | zero liquid discharge |
Appendix A

Table A1.
Water quality feed, permeate, and concentrate; feed: well water.
| Parameter | Unit | Feed | Permeate | Concentrate | |||||||
|---|---|---|---|---|---|---|---|---|---|---|---|
| (a) | (b) | (a) | (b) | ||||||||
| Temperature | °C | 12.8 4 | ±0.92 | 12.0 2 | ±0.12 | 13.0 5 | ±0.83 | 11.9 2 | ±0.15 | 13.1 6 | ±0.83 |
| pH | – | 7.0 4 | ±0.21 | 7.6 2 | ±0.31 | 7.0 5 | ±0.16 | 7.7 2 | ±0.34 | 7.1 6 | ±0.16 |
| ORP | mV | −100 8 | ±26 | – | – | −80 9 | ±25 | – | – | – | – |
| Oxygen | mg/L | <LOQ | – | – | 0.2 7 | ±0.14 | – | – | – | – | |
| Conductivity | µS/cm | 961 4 | ±80 | 932 2 | ± 19 | 744 5 | ±101 | 1162 2 | ±38 | 1549 5 | ±93 |
| Color436nm | 1/m | 0.3 1 | ±0.00 | <LOQ 2 | <LOQ 3 | 0.5 2 | ±0.00 | 1.0 3 | ±0.14 | ||
| UV254 | 1/m | 11.6 1 | ±0.13 | 4.3 2 | ±0.26 | 1.0 3 | ±0.14 | 19.0 2 | ±1.42 | 39.3 3 | ±3.18 |
| DOC | mg/L | 4.8 1 | ±0.15 | 1.9 2 | ±0.10 | 0.6 3 | ±0.02 | 7.4 2 | ±0.43 | 15.5 3 | ±1.06 |
| Fe total | mg/L | 1.8 1 | ±0.23 | 1.6 2 | ±0.17 | 0.6 3 | ±0.21 | 2.6 2 | ±0.35 | 3.3 3 | ±1.70 |
| Mn total | mg/L | 0.5 1 | ±0.02 | 0.4 2 | ±0.05 | 0.2 3 | ±0.00 | 0.6 2 | ±0.08 | 1.2 3 | ±0.14 |
| Sulphate | mg/L | 131 1 | ±0.92 | 73 2 | ±3.06 | 36 3 | ±0.71 | 200 2 | ±0.00 | 395 3 | ±7.07 |
(a) flux = 15 L/m² h, rec = 50%, cfv = 0.5 m/s; (b) flux = 22.5 L/m² h, rec = 75%, cfv = 0.5 m/s; 1 n = 5; 2 n = 3; 3 n = 2; 4 n = 60; 5 n = 51; 6 n = 33; 7 n = 12; 8 n = 17; 9 n = 16. ORP: oxidation-reduction potential; DOC: dissolved organic carbon.
Table A2.
Online measuring probes for operational and water quality parameter; unit, measuring place, measuring probe, measuring method.
Table A2.
Online measuring probes for operational and water quality parameter; unit, measuring place, measuring probe, measuring method.
| Parameter | Unit | Measuring Place | Measuring Probe | Measuring Method |
|---|---|---|---|---|
| Level | % | feed tank, | Endress + Hauser Liquiphant M | submerged gauge pressure sensor |
| permeate tank | Endress + Hauser Prosonic M | reflection ultrasonic pulses | ||
| T | °C | feed | Endress + Hauser Omnigrad M TR10 | resistance thermometer |
| Flow | m3/h | feed, concentrate, circulation, backwash | Endress + Hauser Promag 10P25 | magnetic induction |
| Pressure | bar | feed before/after restriction, feed, permeate, concentrate, backwash before/after restriction | Endress + Hauser Cerabar M | pressure-dependent change in capacitance |
| pH | - | feed, circulation | Endress + Hauser Memosens CPS16D | glass electrode with Ag/AgCl reference |
| ORP | mV | feed, permeate, concentrate (circulation) | Pt electrode with Ag/AgCl reference | |
| T | °C | circulation | NTC 30kΩ | |
| Conductivity | µS/cm | feed, permeate, concentrate (circulation) | Endress+Hauser Condumax CLS21D (old) Indumax CLS50D (new) | resistance between 2 electrodes (old) digital inductive (new) |
| Turbidity UV254 | NTU 1/m | feed, permeate | i::scan V1 Y04 | ISO7027/EPA 180.1 multi-wavelength photometer with narrow band light source |
Table A3.
Analyzed parameter (manual and laboratory), unit, limit of quantification (LOQ), measuring method.
Table A3.
Analyzed parameter (manual and laboratory), unit, limit of quantification (LOQ), measuring method.
| Parameter | Unit | LOQ | Measuring Method |
|---|---|---|---|
| Calcium | mg/L | 0.8 | DIN EN ISO 11885 (E22) |
| Color436nm | 1/m | 0.2 | DIN EN ISO 7887 (C01) |
| Conductivity | µS/cm | - | DIN EN 27888 (C08) |
| DOC | mg/L | 0.5 | DIN EN 1484 (H03) |
| Fe2+ | mg/L | 0.03 | DIN 38406-E01 |
| Fedissolved | mg/L | 0.03 | DIN EN ISO 11885 (E22) |
| Fetotal | mg/L | 0.03 | DIN EN ISO 11885 (E22) |
| Hardness | °dH | - | DIN 38409-H06 |
| Magnesium | mg/L | 0.1 | DIN EN ISO 11885 (E22) |
| Mndissolved | mg/L | 0.01 | DIN EN ISO 11885 (E22) |
| Mntotal | mg/L | 0.01 | DIN EN ISO 11885 (E22) |
| Sulphate | mg/L | 6.0 | DIN EN ISO 10304-1 (D20) |
| UV254 | 1/m | 0.5 | DIN 38404-C03 |
| Acid capacity | mmol/L | 0.02 | DIN 38409-H07-1/2 |
| Base capacity | mmol/L | 0.02 | DIN 38409-H07-2 |
| Calcite dissolving capacity | mmol/L | - | DIN 38404-C10-R3 |
| Chloride | mg/L | 5.0 | DIN EN ISO 10304-1 (D20) |
| Hydrogen carbonate | mg/L | - | calculated using DIN 38409-7 |
| Nitrate | mg/L | 0.2 | DIN EN ISO 10304-1 (D20) |
| Nitrate-N | mg/L | 0.05 | DIN EN ISO 10304-1 (D20) |
| Potassium | mg/L | 0.02 | DIN EN ISO 11885 (E22) |
| Sodium | mg/L | 0.5 | DIN EN ISO 11885 (E22) |
| Acesulfame | µg/L | 0.1 | DIN 38407-F47 |
| Candesartan | µg/L | 0.01 | DIN 38407-F47 |
| Carbamazepine | µg/L | 0.01 | DIN 38407-F47 |
| CBZD | µg/L | 0.02 | DIN 38407-F47 |
| EDTA | µg/L | 2.0 | DIN EN ISO 16588 (P10) |
| FAA | µg/L | 0.01 | DIN 38407-F47 |
| Gaba-lactam | µg/L | 0.01 | DIN 38407-F47 |
| Gabapentin | µg/L | 0.01 | DIN 38407-F47 |
| Iopamidol | µg/L | 0.02 | DIN 38407-F36 |
| MTBE | µg/L | 0.03 | DIN 38407-F43 |
| Olmesartan | µg/L | 0.01 | DIN 38407-F47 |
| PEMA | µg/L | 0.01 | DIN 38407-F47 |
| Primidone | µg/L | 0.01 | DIN 38407-F47 |
| TBA | µg/L | 1.0 | DIN 38407-F43 |
| Valsartan acid | µg/L | 0.01 | DIN 38407-F47 |
| Vinyl chloride | µg/L | 0.1 | DIN EN ISO 10301 (F04) |
| pH | - | 0.01 | Std. Methods 4500-H+ EPA 150.2 (SmarTROLL™) |
| T | °C | −5.0 | EPA 170.1 (SmarTROLL™) |
| ORP | mV | ±1400 | Std. Methods 2580 (SmarTROLL™) |
| Conductivity | µS/cm | 5.0 | Std. Methods 2510 EPA 120.1 (SmarTROLL™) |
| Oxygen | mg/L | 0.1 | EPA-approved In-Situ Methods 1002-8-2009 1003-8-2009 1004-8-2009 (SmarTROLL™) |
Table A4.
Analyzed organic micropollutants, molecular weight, structure.
| Parameter | Molecular Weight (g/mol) 1 | Structure 1 | Parameter | Molecular Weight (g/mol) 1 | Structure 1 |
|---|---|---|---|---|---|
| Vinyl chloride | 62.50 |  | TBA | 74.12 |  |
| MTBE | 88.15 |  | Gabalactam | 153.225 |  |
| Gabapentin | 171.24 |  | Acesulfame | 201.24 |  |
| PEMA | 206.24 |  | Primidone | 218.252 |  |
| FAA | 231.25 |  | Carba- mazepine | 236.27 |  |
| Valsartan acid | 266.08 |  | CBZD | 270.29 |  |
| EDTA | 292.24 |  | Cande-sartan | 440.45 (candesartan) 610.66 (candesartan- cilexetil) |  |
| Olmesartan | 446.51 |  | Iopamidol | 777.08 |  |
1 all data and pictures from [48].
Table A5.
Cleaning chemicals.
| Chemical | Concentration (wt. %) | Active stock Concentration (g/L) |
|---|---|---|
| HCl | 25 | 280 |
| NaOH | 35 | 483 |
| Ascorbic acid | 20 | 200 |
| NaHSO3 | 39 | 522.6 |
References
- Ascott, M.J.; Lapworth, D.J.; Gooddy, D.C.; Sage, R.C.; Karapanos, I. Impacts of extreme flooding on riverbank filtration water quality. Sci. Total Environ. 2016, 554–555, 89–101. [Google Scholar] [CrossRef] [PubMed]
- Przybyłek, J.; Dragon, K.; Kaczmarek, P.M.J. Hydrogeological investigations of river bed clogging at a river bank filtration site along the River Warta, Poland. Geologos 2017, 23, 201–214. [Google Scholar] [CrossRef] [Green Version]
- Kaczmarek, P.M.J. Hydraulic conductivity changes in river valley sediments caused by river bank filtration—An analysis of specific well capacity. Geologos 2017, 23, 123–129. [Google Scholar] [CrossRef]
- Uhlmann, W.; Zimmermann, K. Fallanalyse der Sulfatbelastung in der Spree 2014/2015; Senatsverwaltung für Stadtentwicklung und Umwelt Berlin: Berlin, Germany, 2015. [Google Scholar]
- SenStadtUm Berlin and MWE Brandenburg. Sulfatgespräche der Länder Berlin und Brandenburg—Aktueller Sachstand und Maßnahmen zur Beherrschung der Bergbaulich Bedingten Stoffeinträge; Senatsverwaltung für Stadtentwicklung und Umwelt des Landes Berlin; Ministerium für Wirtschaft und Energie des Landes Brandenburg: Berlin, Germany, 2016. [Google Scholar]
- Galloway, J.N.; Aber, J.D.; Erisman, J.W.; Seitzinger, S.P.; Howarth, R.W.; Cowling, E.B.; Cosby, B.J. The Nitrogen Cascade. BioScience 2003, 53, 341–356. [Google Scholar] [CrossRef]
- Heberer, T. Occurrence, fate, and removal of pharmaceutical residues in the aquatic environment: A review of recent research data. Toxicol. Lett. 2002, 131, 5–17. [Google Scholar] [CrossRef]
- Destatis. Trinkwasser Wird Überwiegend aus Grundwasser Gewonnen; Statistisches Bundesamt Pressestelle: Wiesbaden, Germany, 2013. [Google Scholar]
- SenUVK. Grundwasser in BerlinVorkommen Nutzung Schutz Gefährdung; Senatsverwaltung für Umwelt, Verkehr und Klimaschutz: Berlin, Germany, 2007. [Google Scholar]
- Bundesgesundheitsamt. Verordnung über die Qualität von Wasser für den Menschlichen Gebrauch (Trinkwasserverordnung-TrinkwV). Available online: http://www.gesetze-im-internet.de/trinkwv_2001/BJNR095910001.html#BJNR095910001BJNG000201310 (accessed on 12 September 2018).
- SenStadt Berlin. Qualität des oberflächennahen Grundwassers, Senat für Stadtentwicklung und Umwelt, Umweltatlas. Available online: www.stadtentwicklung.berlin.de/umwelt/umweltatlas/ka204.htm (accessed on 8 April 2018).
- SenStadtUm. Das Grundwasser in Berlin—Bedeutung, Probleme, Sanierungskonzeptionen; Senatsverwaltung für Stadtentwicklung und Umwelt des Landes Berlin: Berlin, Germany, 1986. [Google Scholar]
- Wurl, J. Die geologischen, hydraulischen und hydrochemischen Verhältnisse in den südwestlichen Stadtbezirken von Berlin; Fachbereich Geowiss., FU: Berlin, Germany, 1995; 3-89582-003-2 978-3-89582-003-8. [Google Scholar]
- Schmidt, C.K.; Lange, F.T.; Brauch, H.-J.; Kühn, W. Experiences with Riverbank Filtration and Infiltration in Germany; DVGW-Water Technology Center (TZW): Karlsruhe, Germany, 2003. [Google Scholar]
- Ziegler, D. Untersuchung zur Nachhaltigen Wirkung der Uferfiltration im Wasserkreislauf Berlins; Technische Universität Berlin: Berlin, Germany, 2001. [Google Scholar]
- Darbi, A.; Viraraghavan, T.; Jin, Y.-C.; Braul, L.; Corkal, D. Sulfate Removal from Water. Water Qual. Res. J. Can. 2003, 88, 169–182. [Google Scholar] [CrossRef]
- Lipp, P.; Gronki, T.; Lueke, J.; Lanfervoss, A.; Baldauf, G. Sulphate Removal from Ground Water—A Case Study. gwf-Wasser/Abwasser 2011, 152, 46–51. [Google Scholar]
- Cao, W.; Dang, Z.; Zhou, X.-Q.; Yi, X.-Y.; Wu, P.-X.; Zhu, N.-W.; Lu, G.-N. Removal of sulphate from aqueous solution using modified rice straw: Preparation, characterization and adsorption performance. Carbohydr. Polym. 2011, 85, 571–577. [Google Scholar] [CrossRef]
- Liu, H.; Li, F.; Zhang, G. Experimental Study on Adsorption Removal of Sulfate with Synthesized Zeolite Made from Fly Ash. In Proceedings of the 4th International Conference on Bioinformatics and Biomedical Engineering, Chengdu, China, 18–20 June 2010. [Google Scholar]
- Rao, S.M.; Sridharan, A. Mechanism of Sulfate Adsorption by Kaolinite. Clays Clay Miner. 1984, 32, 414–418. [Google Scholar] [CrossRef]
- Lindner, K.; Knepper, T.P.; Müller, J.; Karrenbrock, F.; Rörden, O.; Brauch, H.-J.; Sacher, F. Entwicklung von Verfahren zur Bestimmung und Beurteilung der Trinkwassergängigkeit von Organischen Einzelstoffen; Internationale Arbeitsgemeinschaft der Wasserwerke im Rheineinzugsgebiet: Köln, Germany, 2000. [Google Scholar]
- Lindner, K.; Knepper, T.P.; Müller, J.; Karrenbrock, F.; Rörden, O.; Juchem, H.; Brauch, H.-J.; Sacher, F. Bestimmung und Beurteilung der Mikrobiellen Abbaubarkeit von Organischen Einzelstoffen bei Umweltrelevanten Konzentrationen in Gewässern; Internationale Arbeitsgemeinschaft der Wasserwerke im Rheineinzugsgebiet: Köln, Germany, 2003. [Google Scholar]
- Wisotzky, F.; Jakschik, S.; Denzig, D. Herkunft und Dauer einer EDTA-Belastung im Grundwasser zweier Trinkwassereinzugsgebiete. gwf-Wasser/Abwasser 2010, 3, 278–284. [Google Scholar]
- Krueger-Marondel, J. Senatsverwaltung für Umwelt, Verkehr und Klimaschutz, Berlin, Germany. Personal communication, 2018. [Google Scholar]
- Samhaber, W.M. Erfahrungen und Anwendungspotential der Nanofiltration; Institut für Verfahrenstechnik, Johannes Kepler Universität Linz: Linz, Austria, 2006. [Google Scholar]
- Cadotte, J.; Forester, R.; Kim, M.; Petersen, R.; Stocker, T. Nanofiltration membranes broaden the use of membrane separation technology. Desalination 1988, 70, 77–88. [Google Scholar] [CrossRef]
- Raman, L.P.; Cheryna, M.; Rajagopalan, N. Consider nanofiltration for membrane separations. Chem. Eng. Prog. 1994, 90, 68–74. [Google Scholar]
- Hilal, N.; Al-Zoubi, H.; Darwish, N.A.; Mohamma, A.W.; Abu Arabi, M. A comprehensive review of nanofiltration membranes: Treatment, pretreatment, modelling, and atomic force microscopy. Desalination 2004, 170, 281–308. [Google Scholar] [CrossRef]
- Radier, R.G.J.; van Oers, C.W.; Steenbergen, A.; Wessling, M. Desalting a process cooling water using nanofiltration. Sep. Purif. Technol. 2001, 22–23, 159–168. [Google Scholar] [CrossRef]
- Hiemstra, P.; van Paassen, J.; Rietman, B.; Verdouw, J. Aerobic versus Anaerobic Nanofiltration: Fouling of Membranes. In Proceedings of the AWWA Membrane Technology Conference, Long Beach, CA, USA, 28 February–3 March 1999; pp. 55–82. [Google Scholar]
- Nederlof, M.M.; Kruithof, J.C.; Taylor, J.S.; van der Kooij, D.; Schippers, J.C. Comparison of NF/RO membrane performance in integrated membrane systems. Desalination 2000, 131, 257–269. [Google Scholar] [CrossRef]
- Vrouwenvelder, J.S.; Kruithof, J.C.; Van Loosdrecht, M.C.M. Integrated approach for biofouling control. Water Sci. Technol. 2010, 62, 2477–2490. [Google Scholar] [CrossRef] [PubMed]
- Beyer, F.; Rietman, B.M.; Zwijnenburg, A.; van den Brink, P.; Vrouwenvelder, J.S.; Jarzembowska, M.; Laurinonyte, J.; Stams, A.J.M.; Plugge, C.M. Long-term performance and fouling analysis of full-scale direct nanofiltration (NF) installations treating anoxic groundwater. J. Membr. Sci. 2014, 468, 339–348. [Google Scholar] [CrossRef]
- Potreck, J. Enhanced membrane retention and mass transfer through smart surface modification. In Proceedings of the EuroMebrane 2015, Aachen, Germany, 6–10 September 2015. [Google Scholar]
- Vriezekolk, E.; Pacak, A.; Potreck, J. Poster presentation: Layer-by-layer nanofiltration membranes; From fundamental research to large-scale membrane modules. In Proceedings of the Imagine Membrane, Azores, Portugal, 24–29 September 2017. [Google Scholar]
- Rustler, M. Aquanes Report; Version v.0.5.0; Zenodo: Genève, Switzerland, 2018. [Google Scholar] [CrossRef]
- R Development Core Team. R: A Language and Environment for Statistical Computing. 2017. Available online: www.R-project.org/ (accessed on 12 September 2018).
- Sethi, S.; Wiesner, M.R. Cost Modeling and Estimation of Crossflow Membrane Filtration Processes. Environ. Eng. Sci. 2000, 17, 61–79. [Google Scholar] [CrossRef]
- Arbeitsgemeinschaft Trinkwassertalsperren e. V.; Bundesverband der Energie und Wasserwirtschaft e. V.; Deutscher Bund der verbandlichen Wasserwirtschaft e. V.; Deutscher Verein des Gas und Wasserfaches e. V.—Technisch-wissenschaftlicher Verein; Deutsche Vereinigung für Wasserwirtschaft, Abwasser und Abfall e. V.; Verband kommunaler Unternehmen e. V. Branchenbild der deutschen Wasserwirtschaft 2015; wvgw Wirtschafts- und Verlagsgesellschaft Gas und Wasser: Bonn, Germany, 2015. [Google Scholar]
- Keucken, A.; Wang, Y.; Tng, K.H.; Leslie, G.; Spanjer, T.; Köhler, S.J. Optimizing hollow fibre nanofiltration for organic matter rich lake water. Water 2016, 8, 430. [Google Scholar] [CrossRef]
- Heidfors, I.; Vredenbregt, L.H.J.; Homes, A.; van Es, M.B. Pilot testing with hollow fiber nano filtration membranes for removal of NOM from surface water in Sweden. In Proceedings of the NOM 6 2015 (6th Specialist Conference on Natural Organic Matter in Drinking Water), Malmö, Sweden, 7–10 September 2015. [Google Scholar]
- Dieter, H.H.; Frank, D.; Gihr, R.; Konietzka, R.; Moll, B.; Stockerl, R.; von der Trenck, T.; Schudoma, D.; Zedler, B.; Brodsky, J. Ableitung von Geringfügigkeitsschwellenwerten für das Grundwasser—Aktualisierte und Überarbeitete Fassung 2016. Available online: www.lawa.de/documents/Geringfuegigkeits_Bericht_Seite_001-028_6df.pdf (accessed on 12 September 2018).
- Möller, K.; Kade, N.; Havermeier, L.; Paproth, F.; Burgschweiger, J.; Wittstock, E.; Günther, M.; Naumann, K.; Broll, J. Wasserversorgungskonzept für Berlin und für das von den BWB Versorgte Umland (Entwicklung bis 2040); Berliner Wasserbetriebe: Berlin, Germany, 2008. [Google Scholar]
- Zhang, Z.; Bligh, M.W.; Waite, T.D. Ascorbic acid-mediated reductive cleaning of iron-fouled membranes from submerged membrane bioreactors. J. Membr. Sci. 2015, 477, 194–202. [Google Scholar] [CrossRef]
- Zhang, Z.; Bligh, M.W.; Wang, Y.; Leslie, G.L.; Bustamante, H.; Waite, T.D. Cleaning strategies for iron-fouled membranes from submerged membrane bioreactor treatment of wastewaters. J. Membr. Sci. 2015, 475, 9–21. [Google Scholar] [CrossRef]
- Müller, U.; Baldauf, G.; Osmera, S.; Göttsche, R. Erfassung und Bewertung von Nanofiltrations und Niederdruckumkehrosmoseanlagen in der Öffentlichen Wasserversorgung in Deutschland; DVGW-Technologiezentrum Wasser Karlsruhe (TZW): Karlsruhe, Germany, 2009. [Google Scholar]
- Semblante, G.U.; Lee, J.Z.; Lee, L.Y.; Ong, S.L.; Ng, H.Y. Brine pre-treatment technologies for zero liquid discharge systems. Brine Pre-Treat. Technol. Zero Liq. Discharge Syst. 2018, 441, 96–111. [Google Scholar] [CrossRef]
- PubChem Substance and Compound databases. PubChem—Open Chemistry Database. Available online: https://pubchem.ncbi.nlm.nih.gov (accessed on 22 August 2018).
Figure 1.
Settings and sampling points of the pilot plant.

Figure 2.
Principle of LbL technology: sequentially coating of a support membrane with charged polyelectrolytes (a), Microscopic pictures of a capillary fiber cross-cut showing coating layers including some characteristic dimensions (b) [35].
Figure 2.
Principle of LbL technology: sequentially coating of a support membrane with charged polyelectrolytes (a), Microscopic pictures of a capillary fiber cross-cut showing coating layers including some characteristic dimensions (b) [35].

Figure 3.
Specific energy demand (kWh/m3 permeate) for different operational parameter (drinking water as feed source), light blue: increase of flux at constant rec and cfv, dark blue: increase of recovery at constant flux and cfv, green: increase of cfv at constant flux and rec.
Figure 3.
Specific energy demand (kWh/m3 permeate) for different operational parameter (drinking water as feed source), light blue: increase of flux at constant rec and cfv, dark blue: increase of recovery at constant flux and cfv, green: increase of cfv at constant flux and rec.

Figure 4.
Salt retention (%) for different operational parameter (drinking water as feed source), light blue: increase of flux at constant rec and cfv, dark blue: increase of recovery at constant flux and cfv, green: increase of cfv at constant flux and rec.
Figure 4.
Salt retention (%) for different operational parameter (drinking water as feed source), light blue: increase of flux at constant rec and cfv, dark blue: increase of recovery at constant flux and cfv, green: increase of cfv at constant flux and rec.

Figure 5.
Feed and permeate concentrations of selected compounds; well water as feed; for permeate <LOQ the ½ LOQ was used.
Figure 5.
Feed and permeate concentrations of selected compounds; well water as feed; for permeate <LOQ the ½ LOQ was used.

Figure 6.
Feed and permeate concentrations of selected OMP; well water as feed; for permeate <LOQ the ½ LOQ was used.
Figure 6.
Feed and permeate concentrations of selected OMP; well water as feed; for permeate <LOQ the ½ LOQ was used.

Figure 7.
TMP trend and cleaning strategies; well water as feed water source, flux 22.5 L/m² h, rec 75%, cfv 0.5 m/s. each vertical line marks a chemical cleaning.
Figure 7.
TMP trend and cleaning strategies; well water as feed water source, flux 22.5 L/m² h, rec 75%, cfv 0.5 m/s. each vertical line marks a chemical cleaning.

Table 1.
Water quality feed, permeate, and concentrate; feed: well water.
| Parameter | Unit | Feed | Permeate * | Concentrate * | ||||||
|---|---|---|---|---|---|---|---|---|---|---|
| Temperature | °C | 12.8 | ±0.92 | (n = 60) | 13.0 | ±0.83 | (n = 51) | 13.1 | ±0.83 | (n = 33) |
| pH | – | 7.0 | ±0.21 | (n = 60) | 7.0 | ±0.16 | (n = 51) | 7.1 | ±0.16 | (n = 33) |
| ORP | mV | −100 | ±26 | (n = 17) | -80 | ±25 | (n = 16) | n.d. ** | ||
| Oxygen | mg/l | <LOQ | (n = 16) | 0.2 | ±0.14 | (n = 12) | n.d. ** | |||
| Conductivity | µS/cm | 961 | ±80 | (n = 60) | 744 | ±101 | (n = 51) | 1549 | ±93 | (n = 51) |
| Color436nm | 1/m | 0.3 | ±0.00 | (n = 5) | <LOQ | (n = 2) | 1.0 | ±0.14 | (n = 2) | |
| UV254 | 1/m | 11.6 | ±0.13 | (n = 5) | 1.0 | ±0.14 | (n = 2) | 39.3 | ±3.18 | (n = 2) |
| DOC | mg/l | 4.8 | ±0.15 | (n = 5) | 0.6 | ±0.02 | (n = 2) | 15.5 | ±1.06 | (n = 2) |
* flux = 22.5 L/m² h, rec = 75%, cfv = 0.5 m/s; ** n.d.: not determined.
Table 2.
Feed concentrations (average and standard deviations) and retentions (average and standard deviations) of selected parameters during drinking water and well water period (for permeate <LOQ the ½ LOQ was used).
Table 2.
Feed concentrations (average and standard deviations) and retentions (average and standard deviations) of selected parameters during drinking water and well water period (for permeate <LOQ the ½ LOQ was used).
| Parameter | Unit | Feed: Drinking Water 1 | Feed: Well Water 2 | ||||||||
|---|---|---|---|---|---|---|---|---|---|---|---|
| Feed | Retention (%) | Feed | Retention (%) | ||||||||
| UV254 | 1/m | 8.7 | ±0.23 | 85 | ±6.5 | (n = 9) | 12.1 | ±1.01 | 89 | ±5.5 | (n = 15) |
| DOC | mg/L | 3.8 | ±0.21 | 82 | ±7.8 | (n = 11) | 4.7 | ±0.24 | 87 | ±6.4 | (n = 15) |
| Sulphate | mg/L | 149.1 | ±9.44 | 71 | ±8.5 | (n = 11) | 136.0 | ±7.37 | 67 | ±5.5 | (n = 16) |
| Mg | mg/L | 10.7 | ±0.43 | 64 | ±13.8 | (n = 5) | 11.7 | ±0.49 | 50 | ±6.0 | (n = 10) |
| Hardness | °dH | 20.5 | ±0.66 | 55 | ±14.7 | (n = 5) | 18.8 | ±0.51 | 41 | ±5.2 | (n = 10) |
| Ca | mg/L | 128.6 | ±4.93 | 54 | ±14.8 | (n = 5) | 115.1 | ±3.16 | 40 | ±5.0 | (n =10) |
| Fetotal | mg/L | <LOQ | – | (n = 11) | 1.8 | ±0.29 | 48 | ±8.7 | (n = 15) | ||
| Fe2+ | mg/L | <LOQ | – | (n = 11) | 1.6 | ±0.28 | 48 | ±7.7 | (n = 15) | ||
| Fedissolved | mg/L | <LOQ | – | (n = 11) | 1.8 | ±0.31 | 49 | ±8.0 | (n = 14) | ||
| Mntotal | mg/L | <LOQ | – | (n = 11) | 0.5 | ±0.05 | 42 | ±5.8 | (n = 15) | ||
| Mndissolved | mg/L | <LOQ | – | (n = 11) | 0.5 | ±0.05 | 42 | ±6.0 | (n = 15) | ||
| Conductivity | µS/cm | 948.0 | ±71.0 | 32 | ±5.8 | (n = 11) | 970.0 | ±78.3 | 22 | ±4.3 | (n = 40) |
| Color | 1/m | 0.2 | ±0.04 | – | (n = 5) 4 | 0.3 | ±0.05 | – | (n = 15) 4 | ||
| EDTA | µg/L | 11.0 | ±0.00 | 84 | ±10.3 | (n = 2) | 12.3 | ±3.73 | 92 | ±1.1 | (n = 5) |
| Gabapentin | µg/L | 0.1 | ±0.04 | 55 | ±12.1 | (n = 4) | 0.05 | ±0.03 | 46 | ±10.6 | (n = 8) 3 |
| Valsartan acid | µg/L | 0.2 | ±0.06 | 58 | ±11.5 | (n = 4) | 0.1 | ±0.08 | 44 | ±10.2 | (n = 8) |
| FAA | µg/L | 0.05 | ±0.01 | 57 | ±13.9 | (n = 4) | 0.1 | ±0.01 | 41 | ±7.3 | (n = 8) 3 |
| MTBE | µg/L | 0.6 | ±0.32 | 14 | ±13.6 | (n = 3) | 9.2 | ±4.04 | 10 | ±9.2 | (n = 10) |
| TBA | µg/L | <LOQ | – | (n = 3) | 5.4 | ±2.87 | 8 | ±6.7 | (n = 10) | ||
| Acesulfame | µg/L | 0.7 | ±0.16 | 24 | ±9.5 | (n = 4) | 0.7 | ±0.08 | −5 | ±2.1 | (n = 8) |
| Vinyl chloride | µg/L | <LOQ | – | (n = 4) | 1.6 | ±0.47 | −13 | ±14.1 | (n = 10) | ||
1 Variation of operational parameters (flux = 15.0–27.5 L/m² h, rec = 50–85%, cfv = 0.2–1.0 m/s); 2 No variation of operational parameters (flux = 22.5 L/m² h, rec = 75%, cfv = 0.5 m/s); 3 Feed and permeate values near LOQ; 4 Feed values near LOQ, permeate values <LOQ.
Table 3.
Comparison of commercial available module HFW 1000 with new developed membrane HF-TNF using literature data [40,41] and data from pilot tests.
| Parameter | Unit | HFW 1000 | HF-TNF |
|---|---|---|---|
| MWCO | Da | ~1000 | ~200–300 |
| Flux | L/(m2·h) | 10–20 | 22.5 |
| Permeability | L/(m2·h·bar) | 11.0–13.6 | 6.0–7.7 |
| Resistance × 1013 | 1/m | 2.65–3.23 | 4.6–6.3 |
| TMP | bar | 1.1–2.8 | 3.6–4.6 |
| Pressure drop | bar | 0.5–0.7 | 0.35–0.50 |
| Sulphate removal | % | n.d. * | 67 ± 5.5 |
| DOC removal | % | 70–80 | 87 ± 6.4 |
| UV254 removal | % | 80–90 | 89 ± 5.5 |
| Hardness removal | % | <20 | 41 ± 5.2 |
* n.d.: not determined; MWCO: molecular weight cut-off; TMP: transmembrane pressure; DOC: dissolved organic carbon.
© 2018 by the authors. Licensee MDPI, Basel, Switzerland. This article is an open access article distributed under the terms and conditions of the Creative Commons Attribution (CC BY) license (http://creativecommons.org/licenses/by/4.0/).
Share and Cite
MDPI and ACS Style
Jährig, J.; Vredenbregt, L.; Wicke, D.; Miehe, U.; Sperlich, A. Capillary Nanofiltration under Anoxic Conditions as Post-Treatment after Bank Filtration. Water 2018, 10, 1599. https://doi.org/10.3390/w10111599
AMA Style
Jährig J, Vredenbregt L, Wicke D, Miehe U, Sperlich A. Capillary Nanofiltration under Anoxic Conditions as Post-Treatment after Bank Filtration. Water. 2018; 10(11):1599. https://doi.org/10.3390/w10111599
Chicago/Turabian StyleJährig, Jeannette, Leo Vredenbregt, Daniel Wicke, Ulf Miehe, and Alexander Sperlich. 2018. "Capillary Nanofiltration under Anoxic Conditions as Post-Treatment after Bank Filtration" Water 10, no. 11: 1599. https://doi.org/10.3390/w10111599
Note that from the first issue of 2016, this journal uses article numbers instead of page numbers. See further details here.