Treatment Efficiency of Diffuse Agricultural Pollution in a Constructed Wetland Impacted by Groundwater Seepage


1
Institute of Ecology and Earth Sciences, Department of Geography, University of Tartu, 50410 Tartu, Estonia
2
Department of Environmental Science, Policy and Management, University of California, Berkeley, CA 94720, USA
*
Author to whom correspondence should be addressed.
Water 2018, 10(11), 1601; https://doi.org/10.3390/w10111601
Submission received: 18 October 2018
/
Revised: 6 November 2018
/
Accepted: 6 November 2018
/
Published: 8 November 2018
(This article belongs to the Special Issue Agro-Industrial Wastewater Treatment with Decentralized Biological Treatment Methods)
Abstract
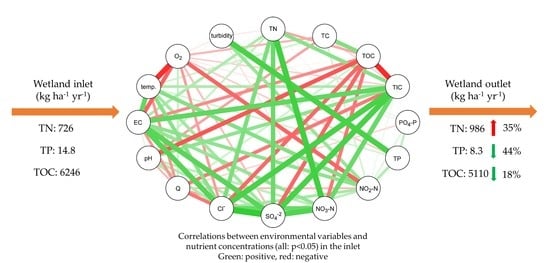
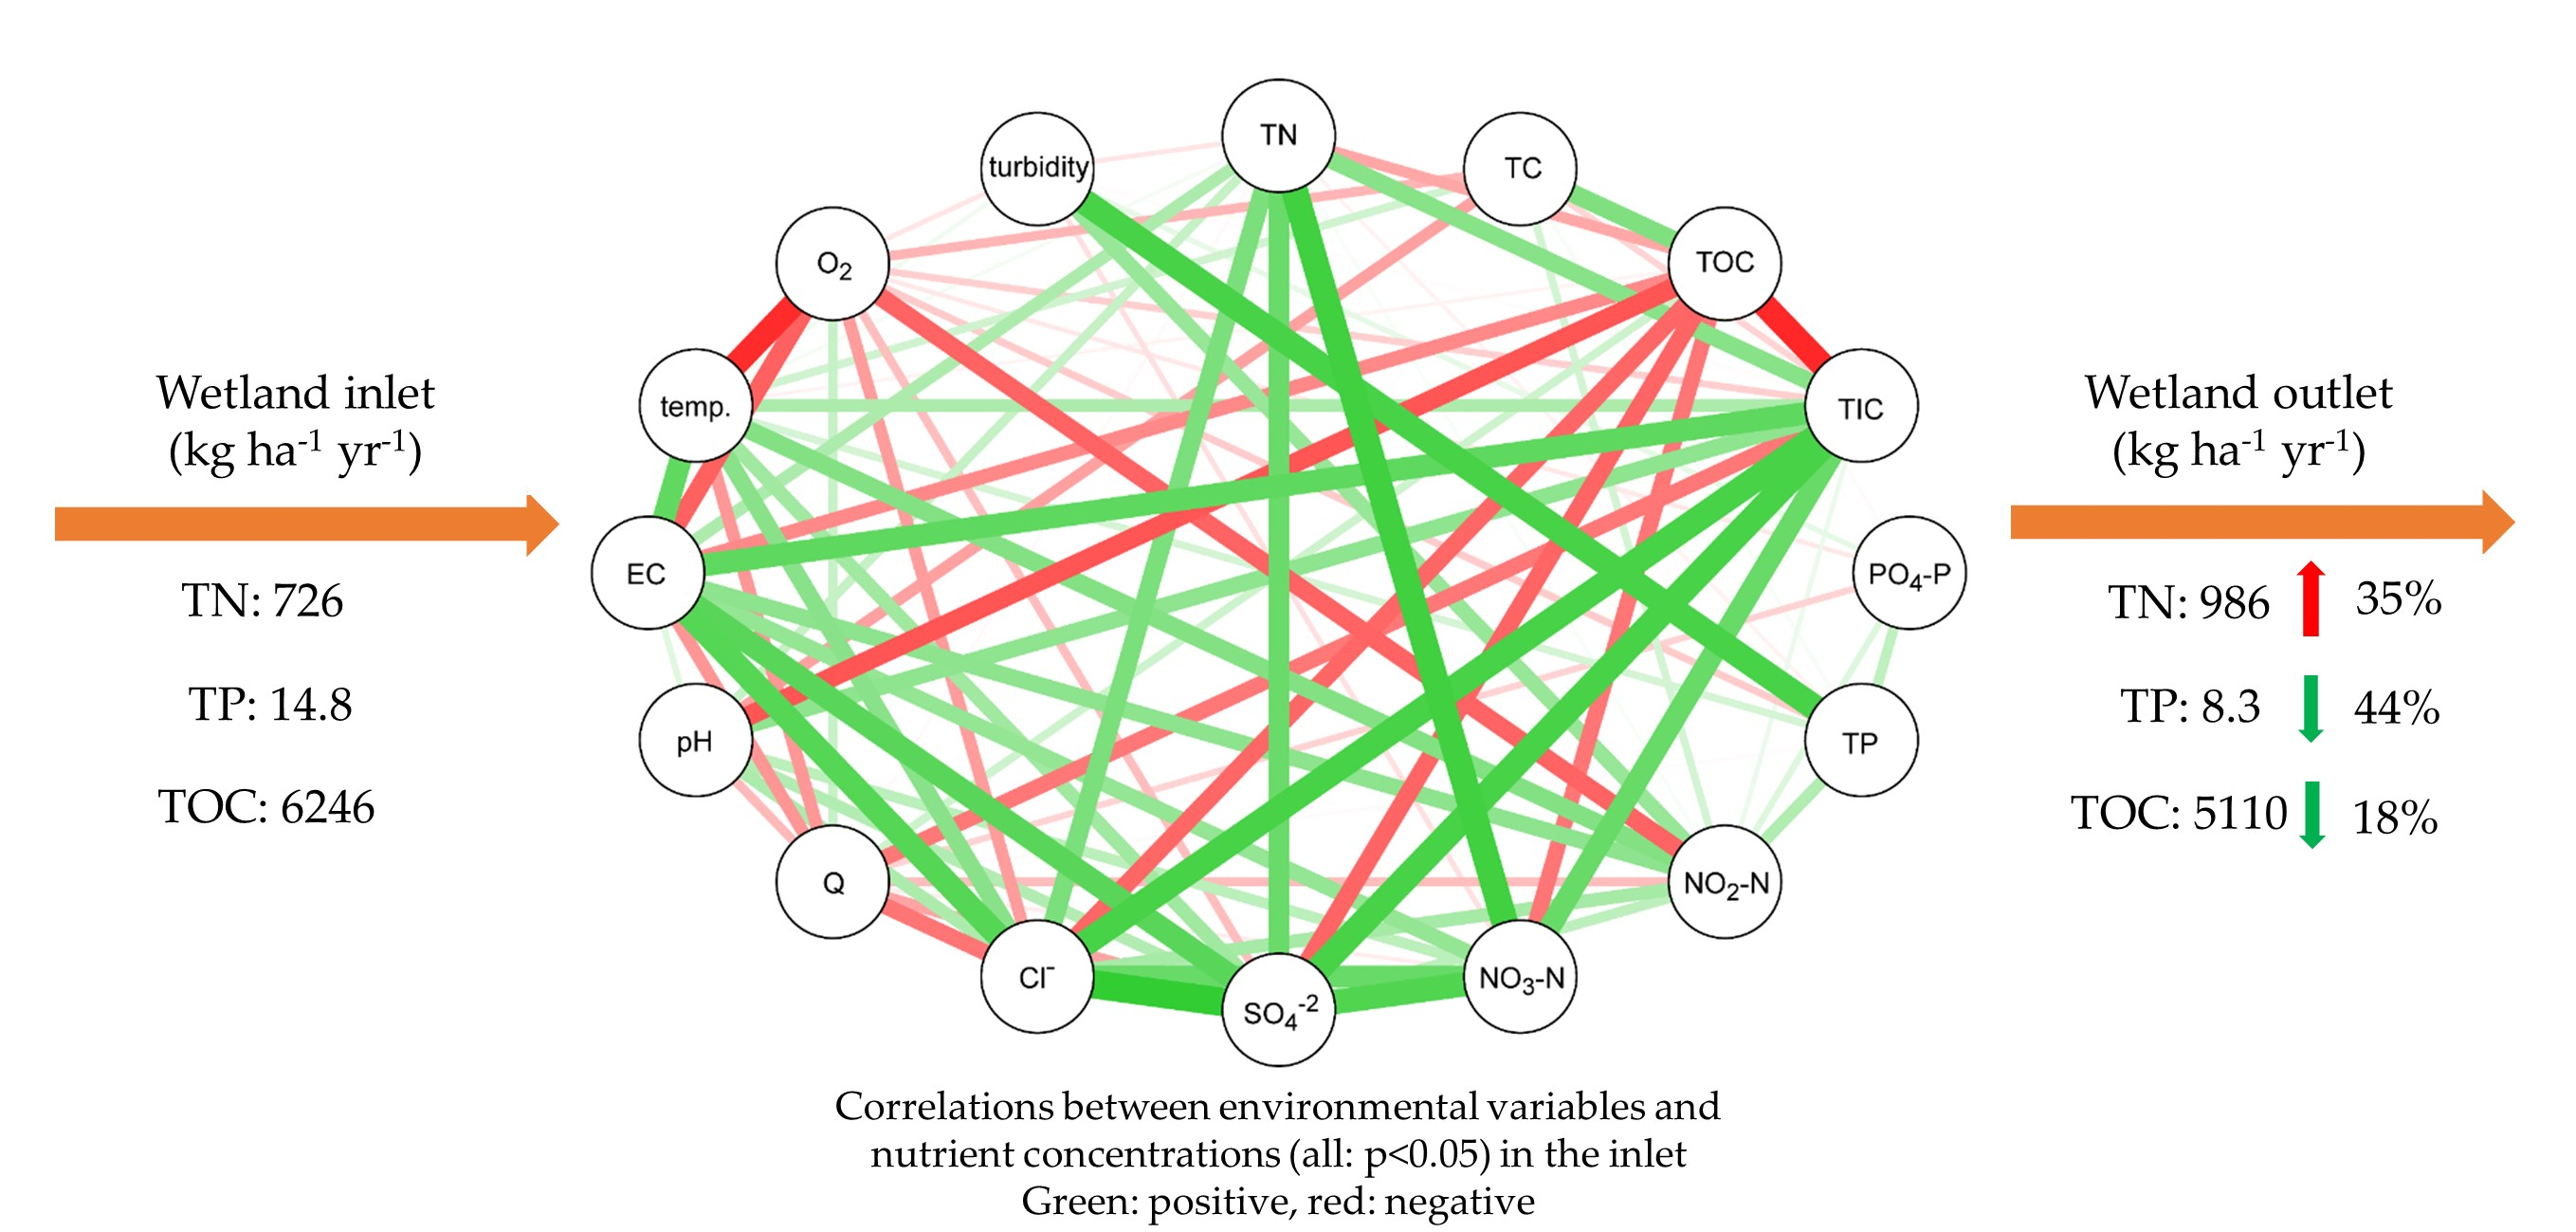
:Diffuse agricultural pollution degrades water quality and is one of the main causes of eutrophication; therefore, it is important to reduce it. Constructed wetlands (CW) can be used as an effective measure for water quality improvement. There are two possible ways to establish surface flow CWs, in-stream and off-stream. We studied treatment efficiency of the in-stream free surface flow (FSW) Vända CW in southern Estonia from March 2017 until July 2018. The CW consists of two shallow-water parts planted with cattail (Typha latifolia). According to our analyses, the CW reduced total phosphorus (TP) and phosphate (PO4-P) by 20.5% and 16.3%, respectively, however, in summer, phosphorus removal was twice as high. We saw significant logarithmic correlation between flow rates and log TP and log PO4-P removal efficiency (rs = 0.53, rs = 0.63, p < 0.01 respectively). Yearly reduction of total organic carbon was 12.4% while total inorganic carbon increased by 9.7% due to groundwater seepage. Groundwater inflow also increased the concentration of total nitrogen in the outlet by 27.7% and nitrate concentration by 31.6%. In-stream FWS CWs are a promising measure to reduce diffuse pollution from agriculture; however, our experience and literature data prove that there are several factors that can influence CWs’ treatment efficiency.
1. Introduction
The growing population demands food, which in turn, affects agriculture and other land management. This causes land use changes and intensifies fertilizer use, which increases the impact of diffuse pollution on water quality [1]. Nutrient runoff from intensively managed agricultural land causes water quality degradation, increases plant growth, loss of biodiversity, and other problems related to eutrophication [2,3]. Sources and spread of diffuse pollution in landscapes are difficult to locate and control due to their large scale and diffuse nature, as they are strongly influenced by human activities and climate conditions [4]. Therefore, it is important to prevent it. Several legal regulations have been created, but nutrients still transfer to water bodies [4]. It is necessary to use measures for diffuse pollution reduction, such as creating surface-flow constructed wetlands.
Constructed wetlands (CW) can effectively reduce nutrient loads downstream and therefore improve water quality through natural water treatment mechanisms, such as uptake by vegetation, microbial processes and sedimentation and filtration [5,6,7,8]. In addition to those, CWs also provide other important environmental services—they increase biodiversity, create habitats for amphibians, birds and mammals, serve as water reservoirs during drought, and buffer storm waters much like natural wetlands [7,8].
Based on the location of the wetland related to the stream, there are two ways to establish surface flow CWs—directly into the stream (in-stream) or adjacent to the stream (off-stream). Due to off-stream wetlands being located near the stream or ditch channel, only about one third of stream water passes through the CW for purification [9,10]. In CWs that are located directly in the flow path, all stream water flows through the wetland and different nutrient reduction processes can take place as the flow rate is decreased due to banks widening [11,12,13]. In-stream CWs are less common than off-stream CWs. Off-stream CWs have a more stable flow rate and nutrient reduction efficiency, however, in-stream CWs usually have higher hydraulic loads [14,15,16], which may reduce nutrient reduction efficacy during peak flow events. Nonetheless, in-stream CWs are useful, as according to Arheimer and Pers [17], off-stream wetlands treat only 30% of stream flow while in-stream wetlands reduce nutrient concentration from an entire stream [17]. In-stream wetlands are usually permanently flooded, which favours higher permanent plant cover (50–90%) compared with off-stream wetlands (10–20%) [12], and, therefore, favours higher nutrient removal. In-stream FWS CWs are highly influenced by climate and flow rate, thus nutrient removal efficiency is also related to the wetland/catchment ratio, which should be at least 0.5% [5,6].
According to previous studies, free-water surface-flow (FWS) CWs have shown high nutrient removal efficiencies, especially for nitrogen (N) and phosphorus (P) from agricultural runoff [5,6,14,15,18,19]; however, the efficacy in the in-stream wetlands is affected by several factors, such as flow rate, wetland/catchment ratio, vegetation and temperature [5,16,20]. Thus, previous studies report various outcomes. In a 100 m long and 7 m wide ditch with intensive macrophyte growth receiving outlet from a wastewater treatment plant and runoff from adjacent fertilized fields (“bioditch”), the concentration of total N (TN) and total P (TP) was reduced by 66% and 69%, respectively [21]. In other FWS CW systems, TP removal efficiency has been reported to be 3–80% [5,18,19,20,22,23]. TN and nitrate (NO3-N) removal efficiency were measured up to 36% and 50%, respectively [5,24], whereas Braskerud [15] reported significantly lower TN retention, only 3–15%.
One factor affecting wetland operation and nutrient removal efficiency is groundwater seepage to the wetland. That increases flow rate in the wetland [25], which in turn may decrease water retention time and increase nutrient concentration if the groundwater has high nutrient concentration. Groundwater contains, in most cases, several ions that are not characteristic of surface water and wetlands. Due to those, groundwater usually has higher electrical conductivity (EC) and seepage to the wetland may increase EC and concentration of the ions. Groundwater has lower water temperature [26], which may decrease surface-water temperature and therefore depress microbial activities and removal processes.
The aim of this study was to evaluate the efficiency of an in-stream FWS CW to reduce non-point source agricultural pollution in the northern climate and evaluate the impact of groundwater to the nutrient removal efficiency.
2. Materials and Methods
2.1. Site Description
The Vända FWS CW (58°17′ N, 26°43′ E) is located in the 2.2 km2 Vända sub-catchment that is part of the 258 km2 Porijõgi river catchment in southeaster Estonia. Approximately 62% of the Vända sub-catchment is intensively managed arable land, about 32% natural areas and 8% other land use types. The region experiences a temperate climate, with four near-equal length seasons. The growing season typically extends from late April to September. The mean annual air temperature is 6.3 °C and mean annual precipitation is 726 mm recorded at the nearby Tartu Observatory weather station in Tõravere.
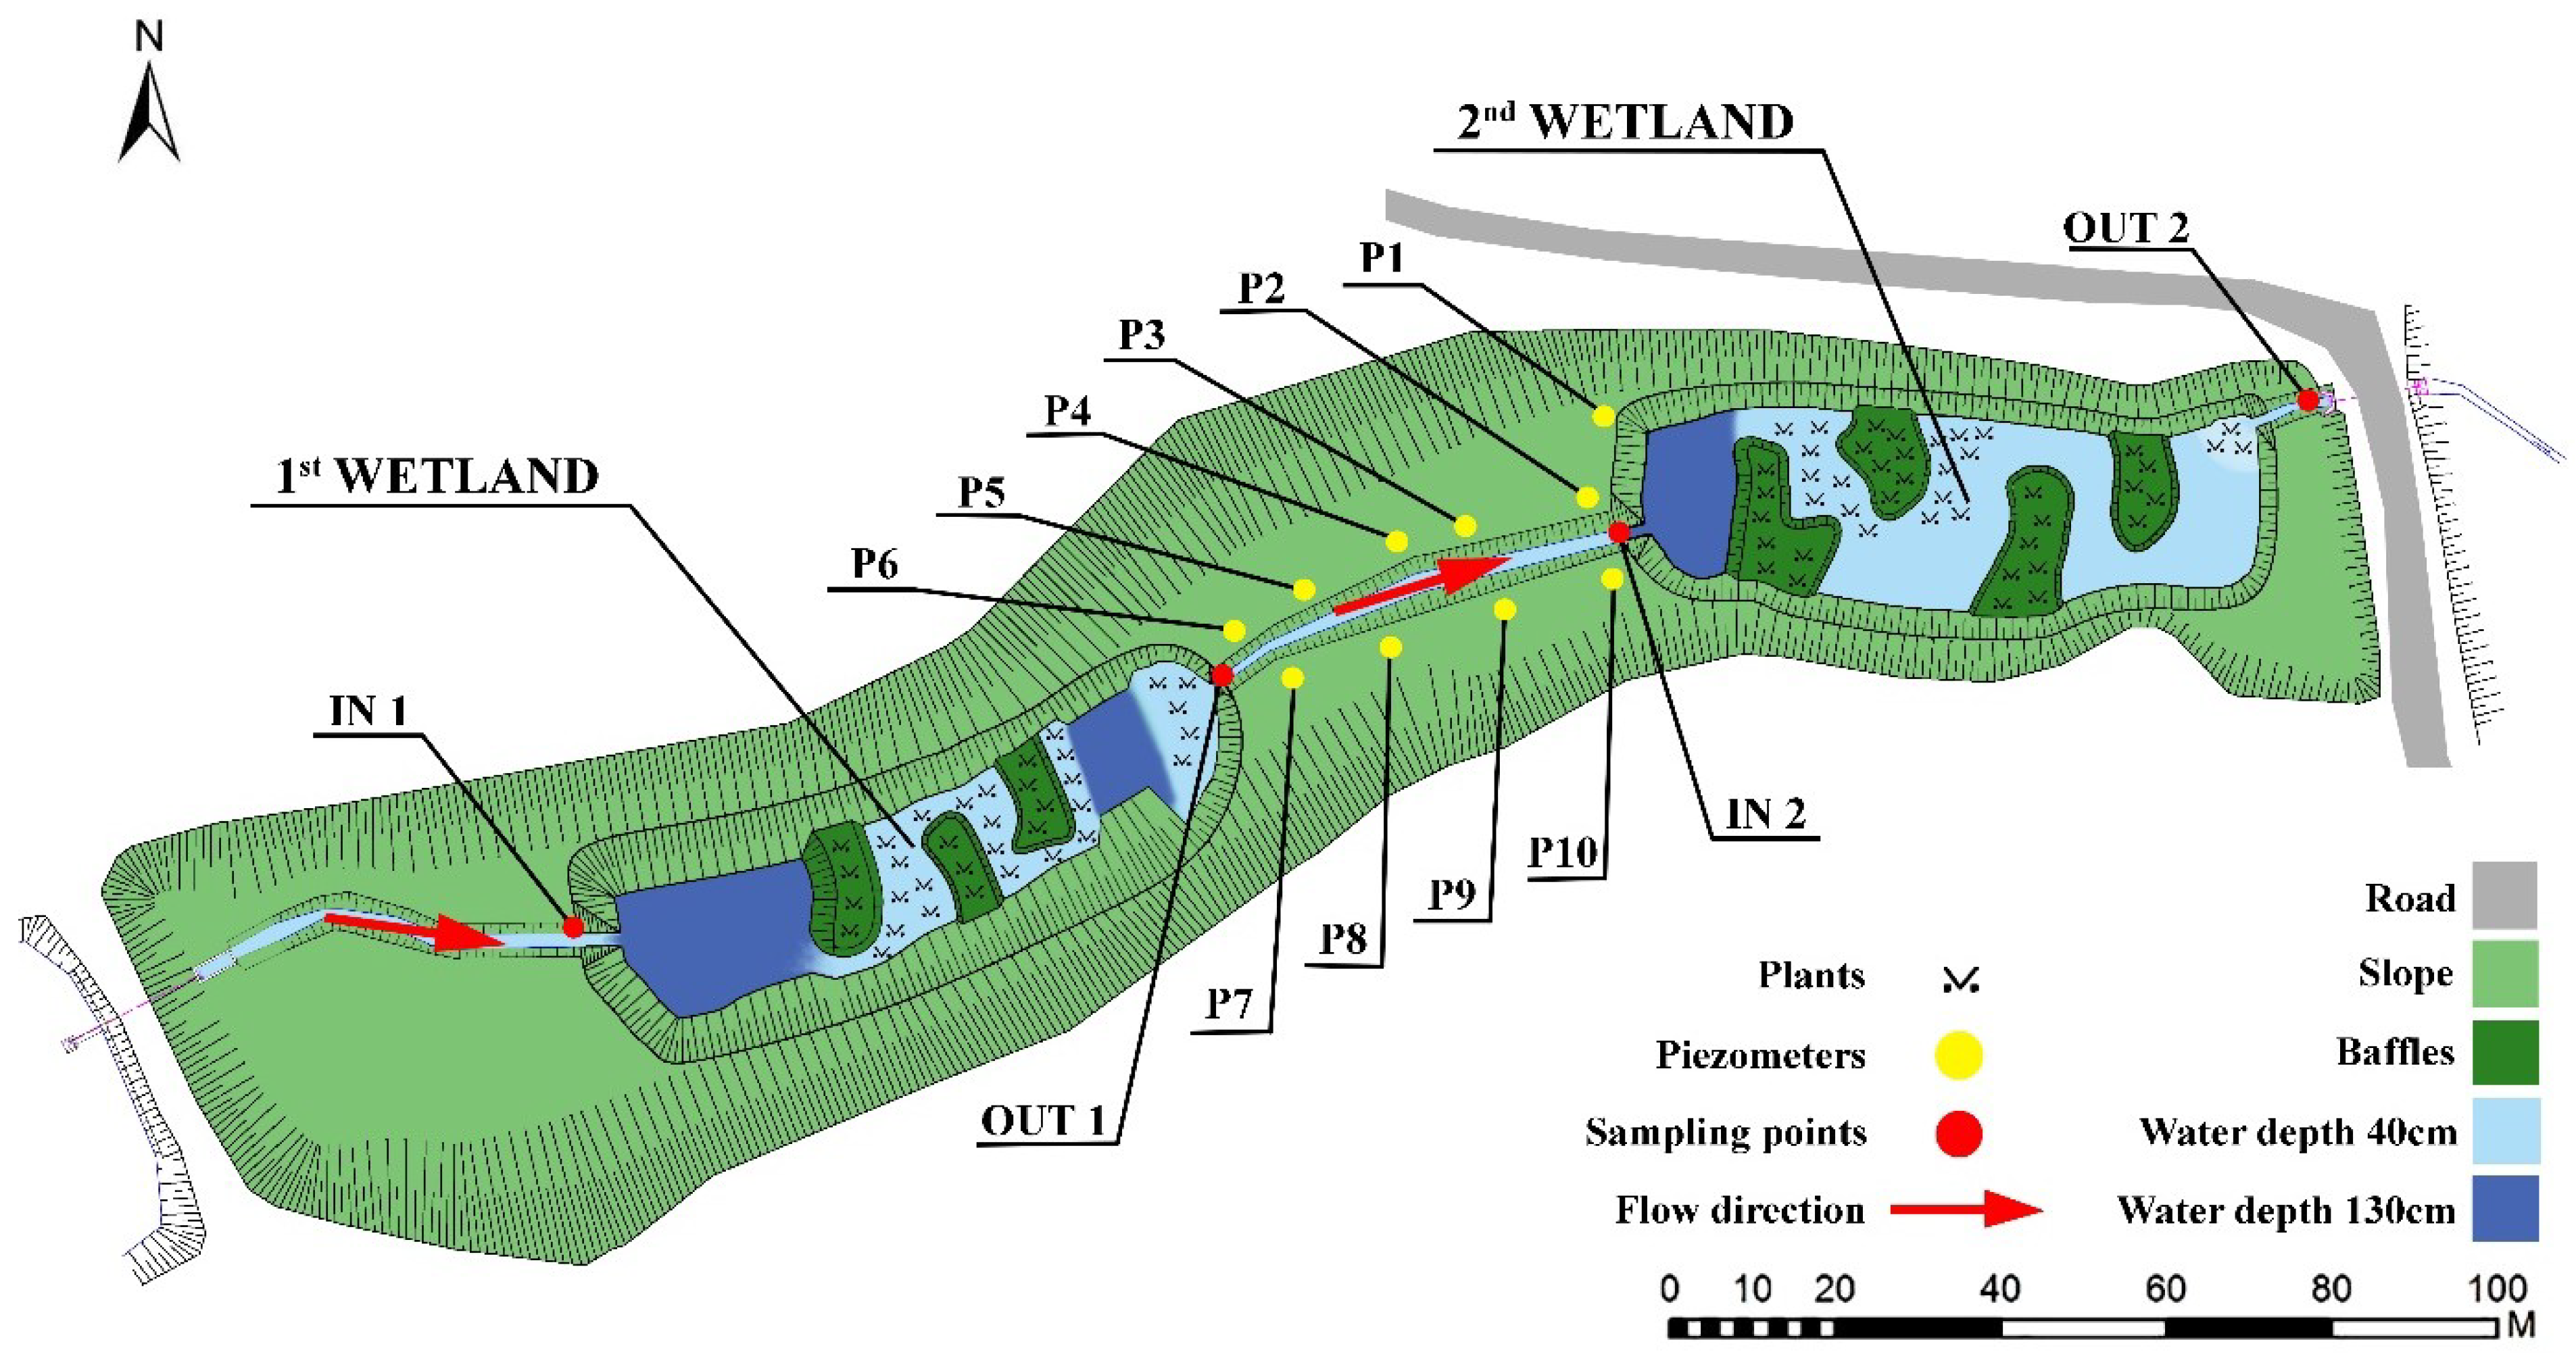
For decades, both surface water and groundwater have been impacted by the nutrient runoff and leaching from surrounding agricultural fields. Until 2015, when Vända FWS CW was established, no water protection measures had been used to control or reduce diffuse pollution [1,21,27]. The Vända FWS CW consists of two shallow water wetlands with a total area of around 4500 m2 (Figure 1), which is approximately 0.5% of the upstream catchment area. Right after construction works in July 2015, the first CW was planted with cattail (Typha latifolia) and common reed (Phragmites australis) while the second wetland was left to colonize naturally. After 3 years, the first wetlands have shown significantly higher vegetation coverage, being approximately 51%, while in the second wetland it was only 10.5%. Average daily flow rate in the CW is highly dependent on the season and rainfall and therefore it fluctuates between 10 to 1250 m3, with hydrological retention time from minutes (peak flow) to 4 days. Due to its location in a valley, the CW is also highly impacted by the groundwater seepage since no specific insulation materials such as geomembrane or clay were used.
2.2. Water Sampling and Analysis
Water samples were collected biweekly since March 2017 and during the study period, a total of 132 samples was taken. Each time, the samples were collected from the inlet (in 1 and in 2) and outlet (out 1 and out 2) of both CWs. Portable device (YSI ProDSS) (YSI Inc., Yellow Springs, OH, USA) was used to measure six parameters on the site, such as pH, turbidity (from spring 2018), temperature, oxygen concentration, redox potential and electrical conductivity (EC). We used SonTek FlowTracker (YSI Inc., Yellow Springs, OH, USA) handheld acoustic Doppler velocimeter to measure flow rate. At the laboratory, total nitrogen (TN) and carbon forms such as total organic carbon (TOC), total carbon (TC) and total inorganic carbon (TIC) were analysed with a Vario TOC cube (Elementar GmbH, Langenselbold, Germany). Spectrophotometry was used to analyse concentrations of total phosphorus (TP) and phosphate (PO4-P) and ion chromatography was used to determine concentrations of nitrate (NO3-N), nitrite (NO2-N), sulphate (SO42−) and chlorine (Cl−). The analyses were performed following the standard methods [28]. Removal efficiency (RE) of nutrients and carbon was calculated based on the differences between concentrations in the inlet and outlet points (Equation (1)).
where: Cin—inflow concentration (mg·L−1); Cout—outflow concentration (mg·L−1).
Since previous water analyses showed remarkable nutrient (especially nitrogen compounds) concentration changes between two wetlands, we installed 10 piezometers in the summer of 2018 to locate the area where groundwater might enter the ditch. We measured flow rate in each piezometer as well as analysed NO3-N, TN, TC, TOC and TIC concentrations.
2.3. Statistical Analysis
Shapiro-Wilk tests were used to check the normality of variables. As the distribution of data deviated from normality, the nonparametric Mann-Whitney U test and Spearman’s rank correlation were applied to compare the inlet and outlet of the system and both wetlands. Spearman’s rank correlation was used to determine relationships between water parameters. The analyses were performed using Statistica 10.0 (StatSoft Inc., Tulsa, OK, USA) and R software’s (version 3.4.4., R Core Team, Vienna, Austria). The level of significance of p < 0.05 was accepted in all cases.
3. Results and Discussion
3.1. Water Quality Changes
3.1.1. Carbon
The average TC loading to the CW was 8328 kg C ha−1·year−1, of which TOC constituted about 75%. Average TC and TOC concentrations in the Vända CW decreased from 68.2 mg·L−1 and 44.5 mg·L−1 at the inlet to 66.3 mg·L−1 and 39.7 mg·L−1 at the outlet, respectively, but average TIC concentration in the wetland increased from 30.3 mg·L−1 to 31.0 mg·L−1. TOC removal efficiency in the Vända CW was 12.4%, being higher in summer (21.2%) and resulting in a total removal of 1136 kg TOC ha−1·year−1 during the study period. Kovacic et al. [29] reported TOC removal in a range 2–17%. TIC concentration increased by 9.7% through the wetland system. Since TIC concentration increased, it also affected TC removal, which was only 2.9%. There were slight differences in the removal efficiencies of carbon fractions between the two wetlands, but they were not significant (Figure 2d).
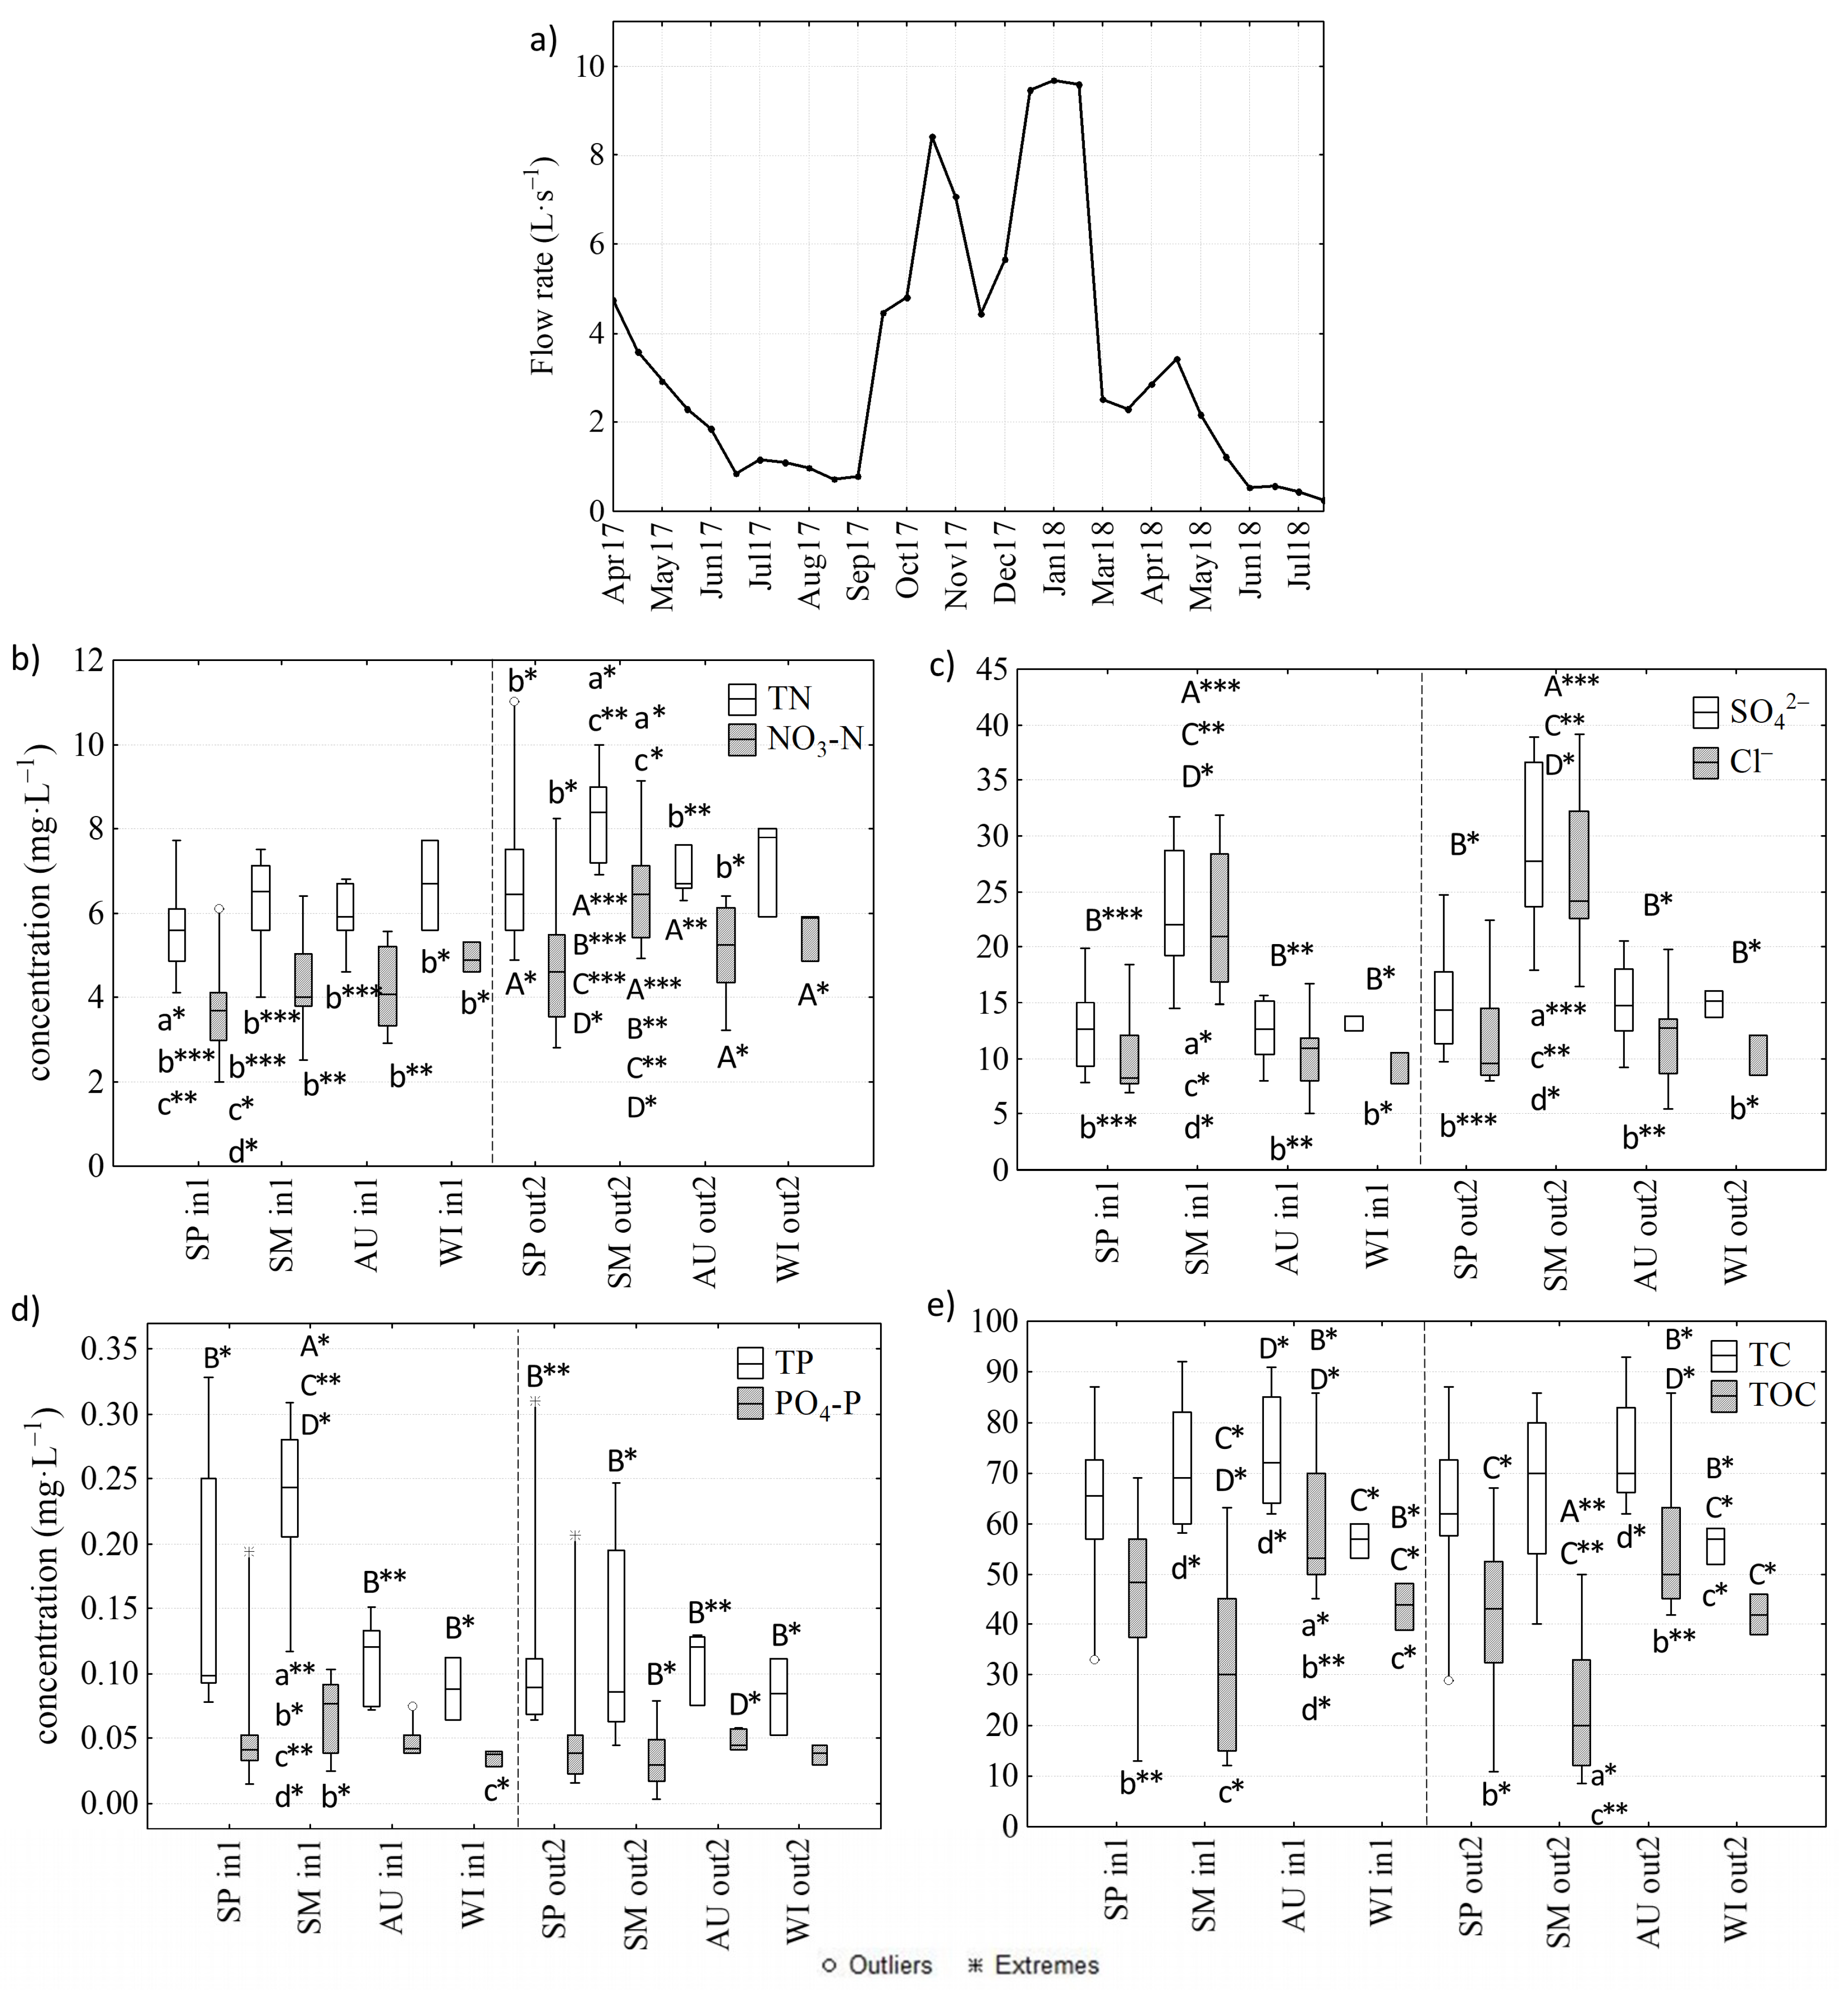
Carbon in CWs is usually removed by sedimentation, litter fall, chemical precipitation and microbial activity, which are influenced by flow rate changes. Increased flow rate reduces water residence time, which inhibits the removal processes [5]. TOC concentration had significant positive correlation with flow rate (rs = 0.43, p < 0.01) showing that the higher flow rate increased TOC concentration at the inlet (Figure 3e). However, inlet TIC concentration had a negative correlation with flow rate (rs = −0.71, p < 0.05), indicating the impact of groundwater during low flow, when the proportion of groundwater increased.
3.1.2. Phosphorus
The average TP loading to the CW during the study period was 14.8 kg P ha−1·year−1. Average TP concentration decreased from 0.17 mg·L−1 to 0.12 mg·L−1 through the entire wetland system, but main concentration decrease occurred in the first wetland, where average TP concentration decreased from 0.17 to 0.13 mg·L−1. This yielded a 14.7% removal efficiency in the first wetland, and 1.9% in the second wetland, but overall removal efficiency was 20.5% during the study period (Figure 2c). In total, during the study period, CW retained 6.5 kg P ha−1·year−1. Phosphorus removal efficiency peaked in the summer (42.5%), particularly in July 2018 (72.7%). The results are similar to some previous studies [14,18,20,23]. Since phosphorus removal is extremely dependent on parameters like wetland/catchment ratio and water retention time, previous studies have reported various outcomes from 3% to 62% [5,18,19,22]. In some peak flow cases, wetlands have become sources of phosphorus due to the turbulent water, which can release some phosphorus from sediments [19]. Dal Ferro et al. [13] also reported increased phosphorus concentration in the outlet of the CW probably due to decaying plants and translocation of nutrients or algal and microbial activity. In the first and second wetland of Vända, the decrease of PO4-P concentration was from 0.055 to 0.045 mg·L−1, resulting in retentions of 4.6% and 11.4% in the first and second wetland, respectively. PO4-P removal efficiency of the system during the study period was 16.3% (Figure 2c) which peaked at 52.3% in the summer. This suggests that the lower flow rate and higher hydraulic retention time favour TP removal in wetlands as TP is mainly removed by sedimentation and filtration [7]. Higher PO4-P removal rate in summer is also affected by water temperature and oxygen concentration due to its dissolved form. PO4-P removal in summer is mostly related to microbial activity and vegetation uptake [30,31]. PO4-P removal efficiency strongly correlated (rs = 0.75, p < 0.001) with water temperature, indicating that higher temperature favoured vegetation growth, and nutrient uptake by macrophytes and microbial activities, which play an important role in phosphorus removal. Similar results are shown in other studies [5,6,30].
We saw a strong negative correlation between oxygen concentration and phosphorus removal efficiency in the wetland (rs = 0.63, p < 0.001 for PO4-P). According to Kjaergaard et al. [31], anaerobic conditions induce the release of phosphorus from the wetland soil, although in aerobic conditions, the phosphorus might also be released into water depending on the pH level [31,32]. Our results show higher phosphorus removal efficiency with lower oxygen concentration in the water, which suggests that the wetland soil is in an oxic state and acts as a sink of phosphorus. Its removal efficiency is indirectly affected by oxygen availability [33]; thus, with lower temperatures, when dissolved oxygen (DO) concentration is higher, phosphorus removal is lower. Higher DO values occur during the winter and the colder period, when oxygen solubility in water is high, and lower values occur during the summer [33].
We also saw strong logarithmic correlation between log PO4-P and log TP removal efficiencies and flow rate (rs = 0.63, rs = 0.53, p < 0.01 respectively). Lower flow rate induces better removal efficiency due to the longer water retention time providing time for the nutrient removal processes. TP and PO4-P concentrations are usually lower during a dry season. In the rainy season, the inlet concentrations increase significantly. Phosphorus concentration was higher in the spring, due to fertilizer application and increased surface runoff, but with a lower flow rate during summer, concentrations in the outlet decreased significantly (Figure 3d). One of the main reasons for the TP increase is surface runoff from the agricultural fields during heavy rainfall or snowmelt [34]. We saw a strong linear correlation (rs = 0.86, p < 0.001) between TP concentration and turbidity which clearly shows that phosphorus is partly transported in particulate form [35].
3.1.3. Nitrogen Compounds
Contrary to expectations, NO3-N, NO2-N and TN concentrations increased in the Vända CW. The average TN loading to the CW was 726 kg N ha−1·year−1, which increased significantly after passing the wetland system. Average increase in NO3-N concentration was from 4.1 mg·L−1 to 5.4 mg·L−1, NO2-N and TN concentrations increased from 0.036 mg·L−1 and 5.9 mg·L−1 to 0.037 mg·L−1 and 7.5 mg·L−1, respectively. In the first wetland TN, NO3-N, NO2-N concentrations increased 8.3%, 9.1% and 11.6%, respectively. In the second wetland, the NO3-N concentration increased 2.8% and NO2-N concentration increased 4.6%, respectively, but TN concentration in the second wetland decreased by 0.4% (Figure 2a). Through the entire wetland system, nitrogen concentrations increased significantly about 27.7% for TN and for NO3-N and NO2-N the increase was 31.6% and 15.1%, respectively. For TN and NO3-N, the higher increase in concentrations occurred during summer, when the average increase in concentration was up to 45%. In total, during the study period, the wetland system resulted in approximately 260 kg N ha−1·year−1 leaving CW. These results are surprising, as previous studies have reported much higher nitrogen removal efficiencies [4,6], although some studies have reported quite low removal efficiencies for total nitrogen in colder climates [15,23]. As seen in Figure 3b, the higher concentration of nitrogen compounds occurred mostly during spring and summer. In spring, the higher concentrations are expected due to higher nutrient runoff from fields but the higher inlet and outlet concentrations in the summer indicate disturbances in the system. Nitrogen removal from CWs is highly dependent on different factors. For example, temperature, carbon and dissolved oxygen concentration and water residence time are main factors that support or disturb the nitrogen treatment processes such as nitrification, denitrification, ammonification, volatilization and plant uptake [8]. Most of the processes have a greater influence during warmer periods with the lower flow rate and help to decrease even higher loads of nitrogen compounds [36].
Nitrification and denitrification are dependent on the microbial activity and the growth of nitrifying and denitrifying bacteria depends on the temperature, dissolved oxygen concentration and pH level [37]. Mean temperature in the study period was 9.9 °C and in summer 17.5 °C, average pH level was 7.6 and average DO concentration was 10.7 mg·L−1. We saw a positive correlation between NO3-N and TN inlet concentration with pH level (rs = 0.36 and rs = 0.38, p < 0.01, respectively), which can indicate that nitrifying bacterial growth and the nitrification process is favoured. The optimum pH value for the nitrification and denitrification processes is 7–7.5 [38,39], which is similar to our results. However, some studies have shown that plants can acidify the surrounding area and lower pH which can affect some denitrifying bacteria [40].
Nitrification processes where ammonium is oxidised to nitrate occurs in aerobic areas of FWS CWs [7], while denitrification, the reduction of NO3-N to N2O and N2, proceeds in anoxic and suboxic water zones [24]. Our results showed a strong negative correlation with DO (rs = −0.85, p < 0.001) and inlet NO2-N concentration. This indicates that at higher DO concentrations, nitrification is favoured, and in summer, NO2-N reduction was up to 3.9%. Higher DO concentration will also supress denitrifiers and, therefore, conversion of nitrate to gaseous nitrogen forms (N2 and N2O) is inhibited.
3.2. Groundwater Influence
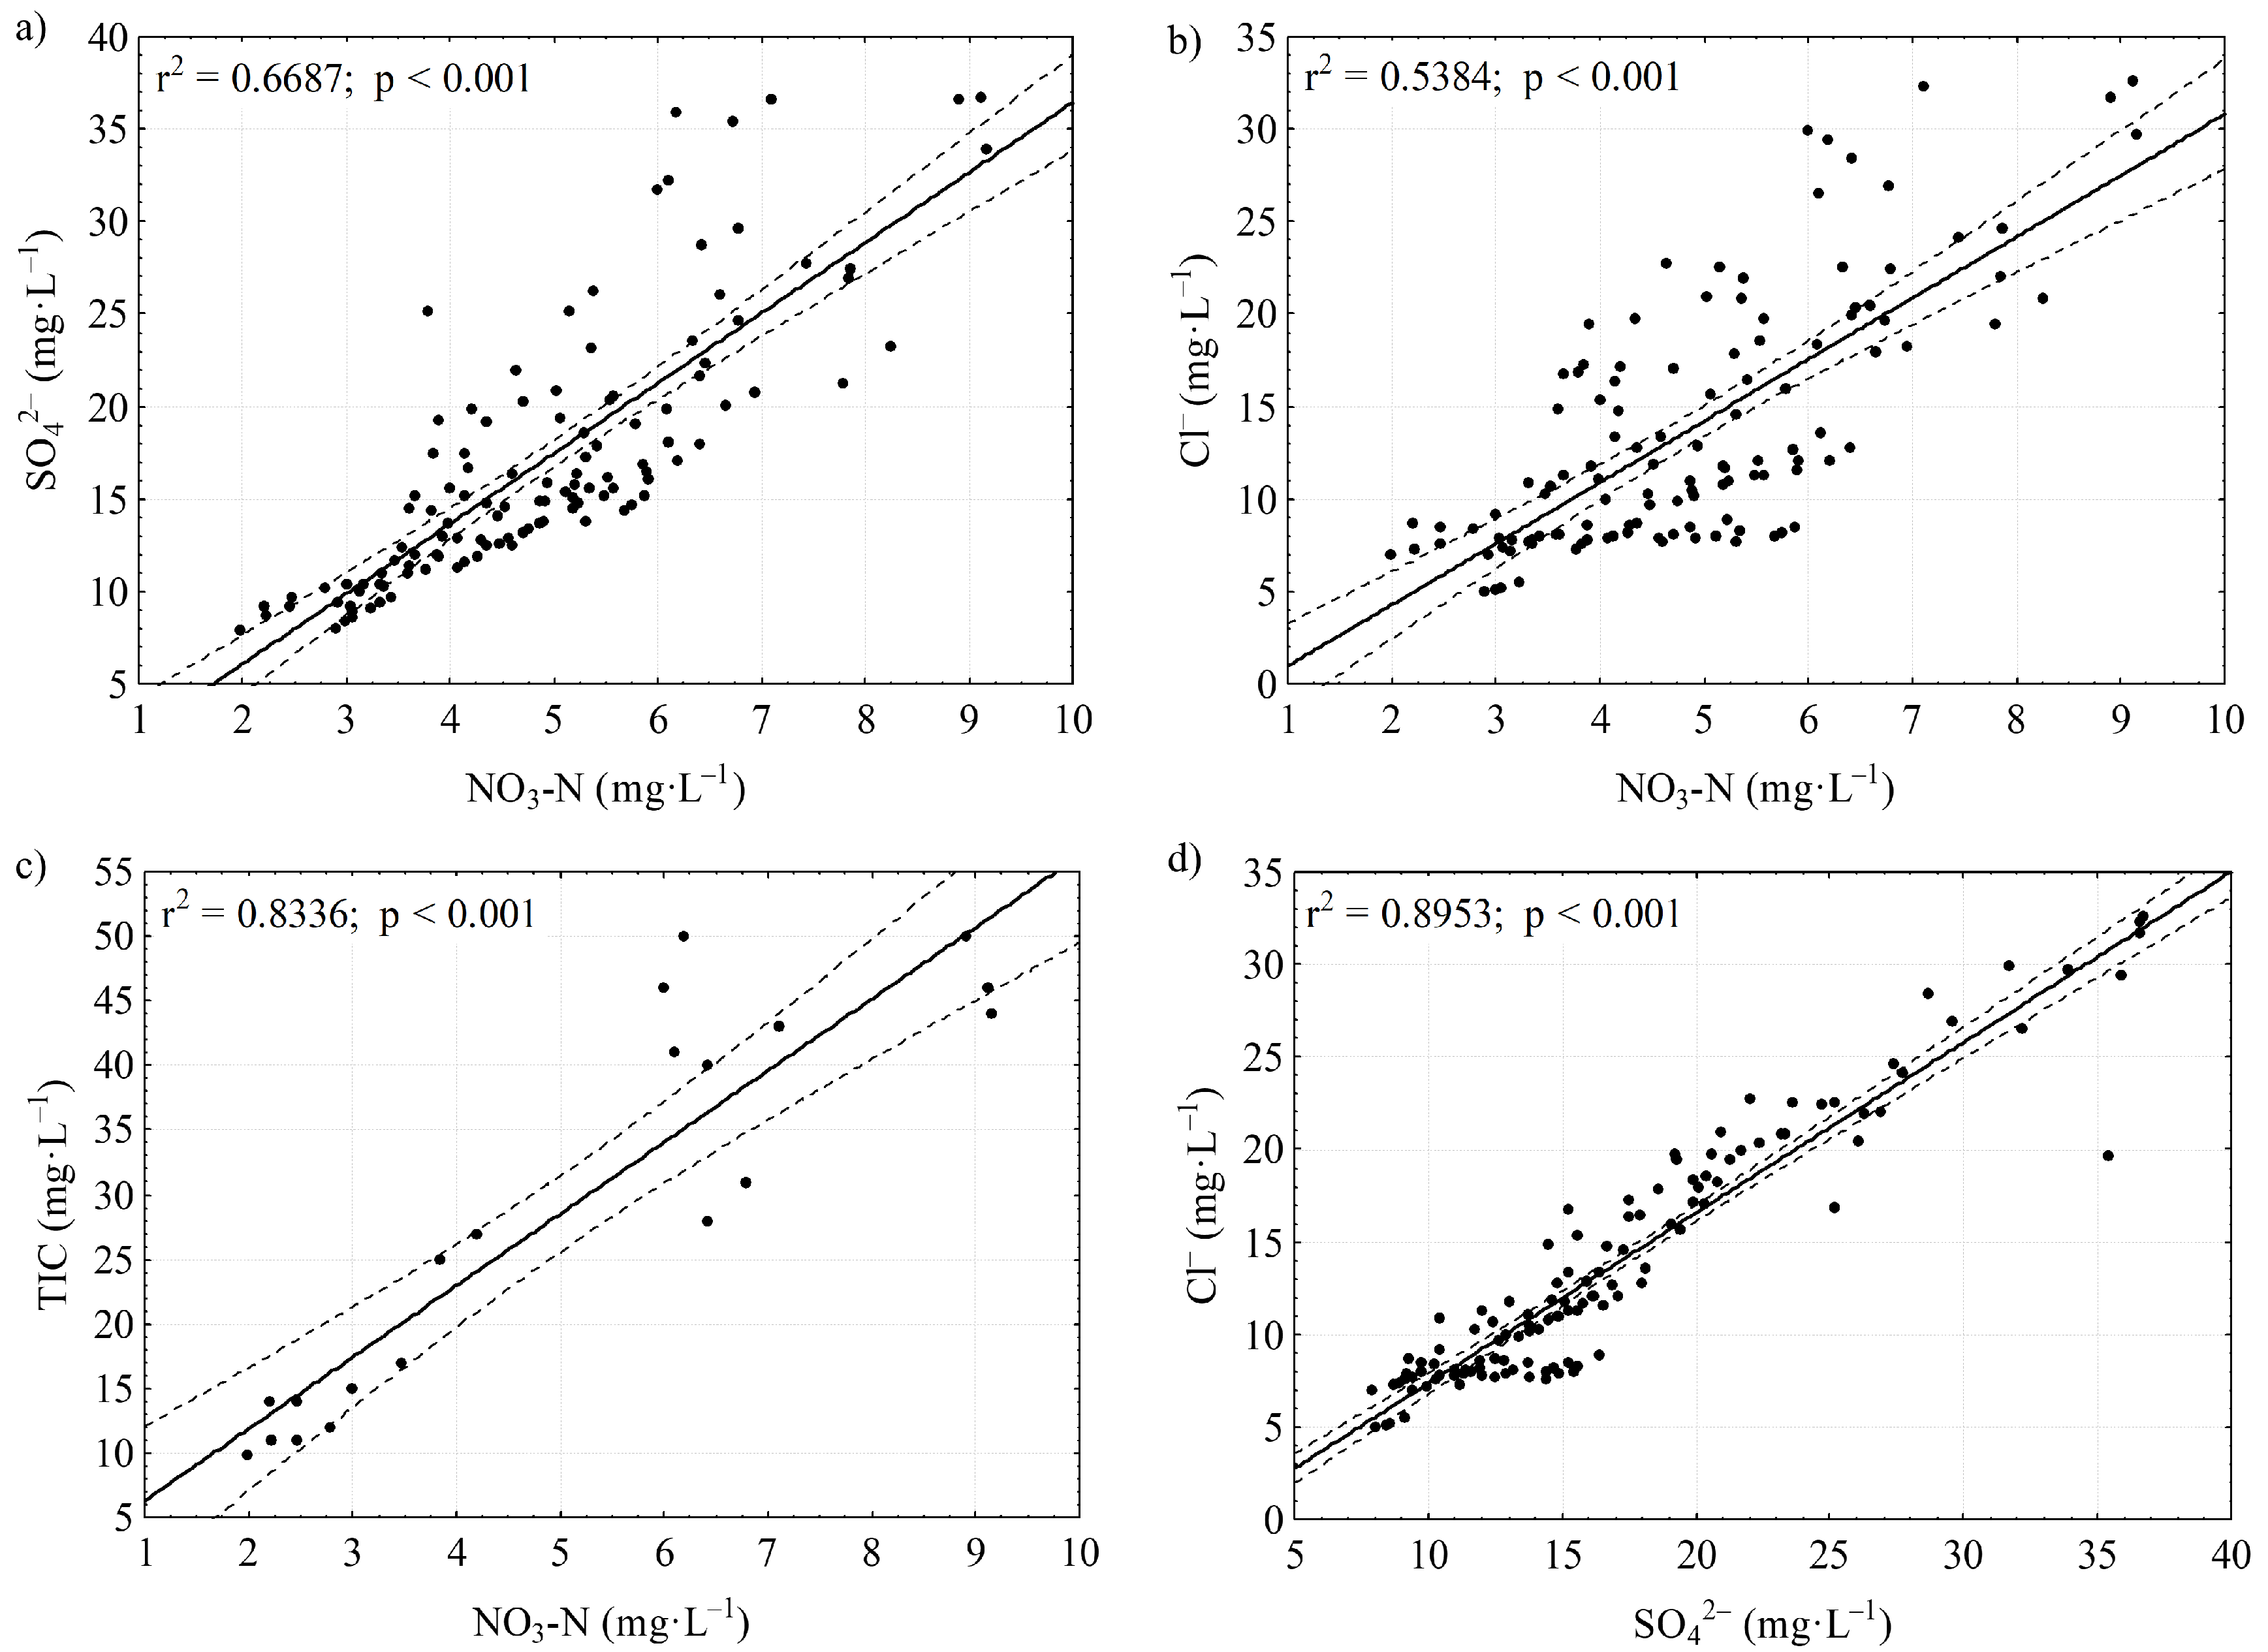
The year-round increased concentration of TN, NO3-N, SO42− and Cl− in the wetland clearly showed that groundwater had a remarkably high influence on treatment efficiency, especially in terms of nitrogen removal. Higher NO3-N and TN concentrations were mainly observed in the summer during low flow rate (Figure 3b), which suggests the addition of nitrogen to the wetland by groundwater seepage, since no runoff came from the fields. In addition to NO3-N, other pollutants, such as SO42−, Cl−, PO4-P and TIC can refer to groundwater seepage. Higher inlet and outlet SO42− and Cl− concentrations were also observable in the summer during the low flow rate (Figure 3c). TIC shows concentration of carbonates in the water, and its increase indicates groundwater seepage [41]. TIC, SO42− and Cl− inlet concentrations had a strong positive correlation with EC (rs = 0.77, rs = 0.79, rs = 0.77, p < 0.01, respectively), indicating that the additional groundwater increases not only the nitrogen compounds but also TIC concentration and ions such as SO42− and Cl−, likewise, EC increased by 15% from inlet to outlet. Figure 4 illustrates a strong linear correlation of NO3-N concentration with SO42− (a), Cl− (b) and TIC (c), indicating that the nitrate addition to the wetland originates from groundwater seepage, which lowers the nitrogen treatment efficiency and wetland becomes a source of nitrogen. We did not see a similar trend between NO3-N and PO4-P, probably due to the iron-rich soils which bind to phosphorus [42]. Concentration of SO42− and Cl− increased 25.2% and 18.7% during the low flow rate, respectively. Overall increase of SO42− and Cl− during the study period was 20.7% and 15.8%, respectively, and Cl− increased more in the second wetland (Figure 2b), which refers to more intense groundwater seepage into the second wetland. Inlet SO42− concentration correlated strongly with Cl− (Figure 4d), which implies the same groundwater source. High NO3-N concentration in groundwater has been a regular problem in the area, especially during the Soviet period when fertiliser use was significantly higher [27]. Results from groundwater analyses from 10 piezometers installed in June 2018 revealed that TN concentration was in the range of 0.6–21 mg·L−1 with an average flow rate of 9.5 L·d−1. We estimated groundwater inflow of around 90 kg of nitrogen during the sampling period. Therefore, groundwater seepage could explain most of the nitrogen increase in the CW. Our results confirm that the fertilizers added to the surrounding fields are still highly affecting the groundwater and in addition to surface runoff, the groundwater can have a significant impact on the overall CW treatment efficiency.
4. Conclusions
Treatment efficiency of the Vända in-stream CW showed a strong seasonal dynamic over the study period, depending on nutrient runoff from the surrounding fields, fertilization, and groundwater seepage and rainfall/snowmelt events. Overall TP and PO4-P removal efficiency was 20.5% and 16.3%, respectively, which doubled during the summer. Phosphorus removal had strong relation with flow rate and was inhibited during peak flow events. Concentration of nitrogen compounds TN, NO3-N, NO2-N increased in the wetland by 27.7%, 31.6% and 15.1%, respectively, and the increases were even higher during summer. The source was groundwater seepage. This was evidenced by the increased concentration of SO42−, Cl− and TIC, in strong correlation with the NO3-N. TOC concentration in the outlet decreased 12.4%, however, TIC concentration increased by 9.7% due to groundwater seepage, therefore, resulting in an overall TC reduction of 2.9%. Several physical-chemical parameters such as turbidity, DO concentration and EC indicated much about the activity and changed through the wetland system. Our study showed that the efficiency of the CW could be seriously affected by groundwater, which can be avoided if an impermeable layer is used during construction works. On the other hand, CWs can still reduce some of the pollution originating from the groundwater, therefore making these systems more multifunctional. Further studies are however needed to investigate the total amount of pollutants entering to the wetland via groundwater and how to increase the efficiency of the wetland to reduce the groundwater pollution.
Author Contributions
K.K. (Kuno Kasak) and Ü.M. conceived and designed the experiments; K.K. (Keit Kill) performed the experiments; K.K. (Keit Kill) and K.K. (Kuno Kasak) analyzed the data and made visualizations; R.L. made a schematic overview of the system; Ü.M. contributed materials/analysis tools; K.K. (Keit Kill), K.K. (Kuno Kasak), J.P. and Ü.M. wrote and edited the paper.
Funding
This research was funded by the Estonian Research Council (the IUT2-16 and PUTJD715 grants) and the EU through the European Regional Development Fund (Centre of Excellence EcolChange, Estonia).
Acknowledgments
We thank Estonian Fund for Nature and WWF (World Wide Fund for Nature) for supporting the Vända FWS CW construction works.
Conflicts of Interest
The authors declare no conflict of interest.
References
- Pärn, J.; Henine, H.; Kasak, K.; Kauer, K.; Sohar, K.; Tournebize, J.; Uuemaa, E.; Välik, K.; Mander, Ü. Nitrogen and phosphorus discharge from small agricultural catchments predicted from land use and hydroclimate. Land Use Policy 2018, 75, 260–268. [Google Scholar] [CrossRef]
- Ronnberg, C.; Bonsdorff, E. Baltic Sea eutrophication: Area-specific ecological consequences. Hydrobiologia 2004, 514, 227–241. [Google Scholar] [CrossRef]
- Bouraoui, F.; Grizzetti, B. Long term change of nutrient concentrations of rivers discharging in European seas. Sci. Total Environ. 2011, 409, 4899–4916. [Google Scholar] [CrossRef] [PubMed]
- Borin, M.; Tocchetto, D. Five year water and nitrogen balance for a constructed surface flow wetland treating agricultural drainage waters. Sci. Total Environ. 2007, 380, 38–47. [Google Scholar] [CrossRef] [PubMed]
- Koskiaho, J.; Ekholm, P.; Raty, M.; Riihimaki, J.; Puustinen, M. Retaining agricultural nutrients in constructed wetlands—Experiences under boreal conditions. Ecol. Eng. 2003, 20, 89–103. [Google Scholar] [CrossRef]
- Koskiaho, J.; Puustinen, M. Function and potential of constructed wetlands for the control of N and P transport from agriculture and peat production in boreal climate. J. Environ. Sci. Health Part A 2005, 40, 1265–1279. [Google Scholar] [CrossRef]
- Kadlec, R.H.; Wallace, S.D. Treatment Wetlands, 2nd ed.; CRC Press: Boca Raton, FL, USA, 2009. [Google Scholar]
- Mitsch, W.J.; Gosselink, J.G. Wetlands, 5th ed.; John Wiley and Sons: Hoboken, NJ, USA, 2015. [Google Scholar]
- Mander, Ü.; Tournebize, J.; Tonderski, K.; Verhoeven, J.T.A.; Mitsch, W.J. Planning and establishment principles for constructed wetlands and riparian buffer zones in agricultural catchments. Ecol. Eng. 2017, 103, 296–300. [Google Scholar] [CrossRef]
- Tournebize, J.; Chaumont, C.; Mander, Ü. Implications for constructed wetlands to mitigate nitrate and pesticide pollution in agricultural drained watersheds. Ecol. Eng. 2017, 103, 415–425. [Google Scholar] [CrossRef]
- Bendoricchio, G.; Cin, L.D.; Persson, J. Guidlines for free water surface wetland design. EcoSys Bd 2000, 8, 51–91. [Google Scholar]
- Darwiche-Criado, N.; Comin, F.A.; Masip, A.; Garcia, M.; Eismann, S.G.; Sorando, R. Effects of wetland restoration on nitrate removal in an irrigated agricultural area: The role of in-stream and off-stream wetlands. Ecol. Eng. 2017, 103, 426–435. [Google Scholar] [CrossRef]
- Dal Ferro, N.; Ibrahim, H.M.S.; Borin, M. Newly-established free water-surface constructed wetland to treat agricultural waters in the low-lying Venetian plain: Performance on nitrogen and phosphorus removal. Sci. Total Environ. 2018, 639, 852–859. [Google Scholar] [CrossRef] [PubMed]
- Braskerud, B.C. Factors affecting phosphorus retention in small constructed wetlands treating agricultural non-point source pollution. Ecol. Eng. 2002, 19, 41–61. [Google Scholar] [CrossRef]
- Braskerud, B.C. Factors affecting nitrogen retention in small constructed wetlands treating agricultural non-point source pollution. Ecol. Eng. 2002, 18, 351–370. [Google Scholar] [CrossRef]
- Tanner, C.C.; Kadlec, R.H. Influence of hydrological regime on wetland attenuation of diffuse agricultural nitrate losses. Ecol. Eng. 2013, 56, 79–88. [Google Scholar] [CrossRef]
- Arheimer, B.; Pers, B.C. Lessons learned? Effects of nutrient reductions from constructing wetlands in 1996–2006 across Sweden. Ecol. Eng. 2017, 103, 404–414. [Google Scholar] [CrossRef]
- Diaz, F.J.; O’Geen, A.T.; Dahlgren, R.A. Agricultural pollutant removal by constructed wetlands: Implications for water management and design. Agric. Water Manag. 2012, 104, 171–183. [Google Scholar] [CrossRef]
- Johannesson, K.M.; Tonderski, K.S.; Ehde, P.M.; Weisner, S.E.B. Temporal phosphorus dynamics affecting retention estimates in agricultural constructed wetlands. Ecol. Eng. 2017, 103, 436–445. [Google Scholar] [CrossRef]
- Tonderski, K.S.; Arheimer, B.; Pers, C.B. Modeling the impact of potential wetlands on phosphorus retention in a Swedish catchment. Ambio 2005, 34, 544–551. [Google Scholar] [CrossRef] [PubMed]
- Mander, Ü.; Mauring, T. Constructed wetlands for wastewater treatment in Estonia. Water Sci. Technol. 1997, 35, 323–330. [Google Scholar] [CrossRef]
- Kynkaanniemi, P.; Ulen, B.; Torstensson, G.; Tonderski, K.S. Phosphorus retention in a newly constructed wetland receiving agricultural tile drainage water. J. Environ. Qual. 2013, 42, 596–605. [Google Scholar] [CrossRef] [PubMed]
- Grinberga, L.; Lagzdins, A. Nutrient removal by subsurface flow constructed wetland in the farm Mezaciruli. Res. Rural Dev. 2017, 160–165. [Google Scholar] [CrossRef]
- Tournebize, J.; Chaumont, C.; Fesneau, C.; Guenne, A.; Vincent, B.; Garnier, J.; Mander, Ü. Long-term nitrate removal in a buffering pond-reservoir system receiving water from an agricultural drained catchment. Ecol. Eng. 2015, 80, 32–45. [Google Scholar] [CrossRef]
- Tanner, C.C.; Nguyen, M.L.; Sukias, J.P.S. Nutrient removal by a constructed wetland treating subsurface drainage from grazed dairy pasture. Agric. Ecosyst. Environ. 2005, 105, 145–162. [Google Scholar] [CrossRef]
- Eser, P.; Rosen, M.R. The influence of groundwater hydrology and stratigraphy on the hydrochemistry of Stump Bay, South Taupo Wetland, New Zealand. J. Hydrol. 1999, 220, 27–47. [Google Scholar] [CrossRef]
- Mander, Ü.; Järvet, A. Buffering role of small reservoirs in agricultural catchments. Int. Rev. Hydrobiol. 1998, 83, 639–646. [Google Scholar]
- APHA-AWWA-WEF. Standard Methods for the Examination of Water and Wastewater, 21th ed.; American Public Health Association: Washington, DC, USA, 2005. [Google Scholar]
- Kovacic, D.A.; Twait, R.M.; Wallace, M.P.; Bowling, J.M. Use of created wetlands to improve water quality in the Midwest—Lake Bloomington case study. Ecol. Eng. 2006, 28, 258–270. [Google Scholar] [CrossRef]
- Lu, S.Y.; Wu, F.C.; Lu, Y.; Xiang, C.S.; Zhang, P.Y.; Jin, C.X. Phosphorus removal from agricultural runoff by constructed wetland. Ecol. Eng. 2009, 35, 402–409. [Google Scholar] [CrossRef]
- Kjaergaard, C.; Heiberg, L.; Jensen, H.S.; Hansen, H.C.B. Phosphorus mobilization in rewetted peat and sand at variable flow rate and redox regimes. Geoderma 2012, 173, 311–321. [Google Scholar] [CrossRef]
- Wang, M.; Zhang, D.Q.; Dong, J.W.; Tan, S.K. Constructed wetlands for wastewater treatment in cold climate—A review. J. Environ. Sci. Chin. 2017, 57, 293–311. [Google Scholar] [CrossRef] [PubMed]
- Akratos, C.S.; Tsihrintzis, V.A. Effect of temperature, HRT, vegetation and porous media on removal efficiency of pilot-scale horizontal subsurface flow constructed wetlands. Ecol. Eng. 2007, 29, 173–191. [Google Scholar] [CrossRef]
- Pionke, H.B.; Gburek, W.J.; Sharpley, A.N. Critical source area controls on water quality in an agricultural watershed located in the Chesapeake Basin. Ecol. Eng. 2000, 14, 325–335. [Google Scholar] [CrossRef]
- Grayson, R.B.; Finlayson, B.L.; Gippel, C.J.; Hart, B.T. The potential of field turbidity measurements for the computation of total phosphorus and suspended solids loads. J. Environ. Manag. 1996, 47, 257–267. [Google Scholar] [CrossRef]
- O’Geen, A.T.; Budd, R.; Gan, J.; Maynard, J.J.; Parikh, S.J.; Dahlgren, R.A. Mitigating nonpoint source pollution in agriculture with constructed and restored wetlands. Adv. Agron. 2010, 108, 1–76. [Google Scholar] [CrossRef]
- Mayo, A.W.; Muraza, M.; Norbert, J. Modelling nitrogen transformation and removal in mara river basin wetlands upstream of lake Victoria. Phys. Chem. Earth 2018, 105, 136–146. [Google Scholar] [CrossRef]
- Saleh-Lakha, S.; Leon-Velarde, C.G.; Chen, S.; Lee, S.; Shannon, K.; Fabri, M.; Downing, G.; Keown, B. A study to assess the numbers and prevalence of Bacillus cereus and its toxins in pasteurized fluid milk. J. Food Prot. 2017, 80, 1085–1089. [Google Scholar] [CrossRef] [PubMed]
- Saleh-Lakha, S.; Shannon, K.E.; Henderson, S.L.; Goyer, C.; Trevors, J.T.; Zebarth, B.J.; Burton, D.L. Effect of pH and temperature on denitrification gene expression and activity in Pseudomonas mandelii. Appl. Environ. Microbiol. 2009, 75, 3903–3911. [Google Scholar] [CrossRef] [PubMed]
- Kasak, K.; Truu, J.; Ostonen, I.; Sarjas, J.; Oopkaup, K.; Paiste, P.; Kõiv-Vainik, M.; Mander, Ü.; Truu, M. Biochar enhances plant growth and nutrient removal in horizontal subsurface flow constructed wetlands. Sci. Total Environ. 2018, 639, 67–74. [Google Scholar] [CrossRef] [PubMed]
- Jarvie, H.P.; King, S.M.; Neal, C. Inorganic carbon dominates total dissolved carbon concentrations and fluxes in British rivers: Application of the THINCARB model—Thermodynamic modelling of inorganic carbon in freshwaters. Sci. Total Environ. 2017, 575, 496–512. [Google Scholar] [CrossRef] [PubMed]
- Fink, J.R.; Inda, A.V.; Tiecher, T.; Barron, V. Iron oxides and organic matter on soil phosphorus availability. Cienc. Agrotecnol. 2016, 40, 369–379. [Google Scholar] [CrossRef] [Green Version]
Figure 1.
Layout of the Vända free water surface constructed wetland system (0.45 ha) capturing runoff from 2.2 km2 catchment area.
Figure 1.
Layout of the Vända free water surface constructed wetland system (0.45 ha) capturing runoff from 2.2 km2 catchment area.

Figure 2.
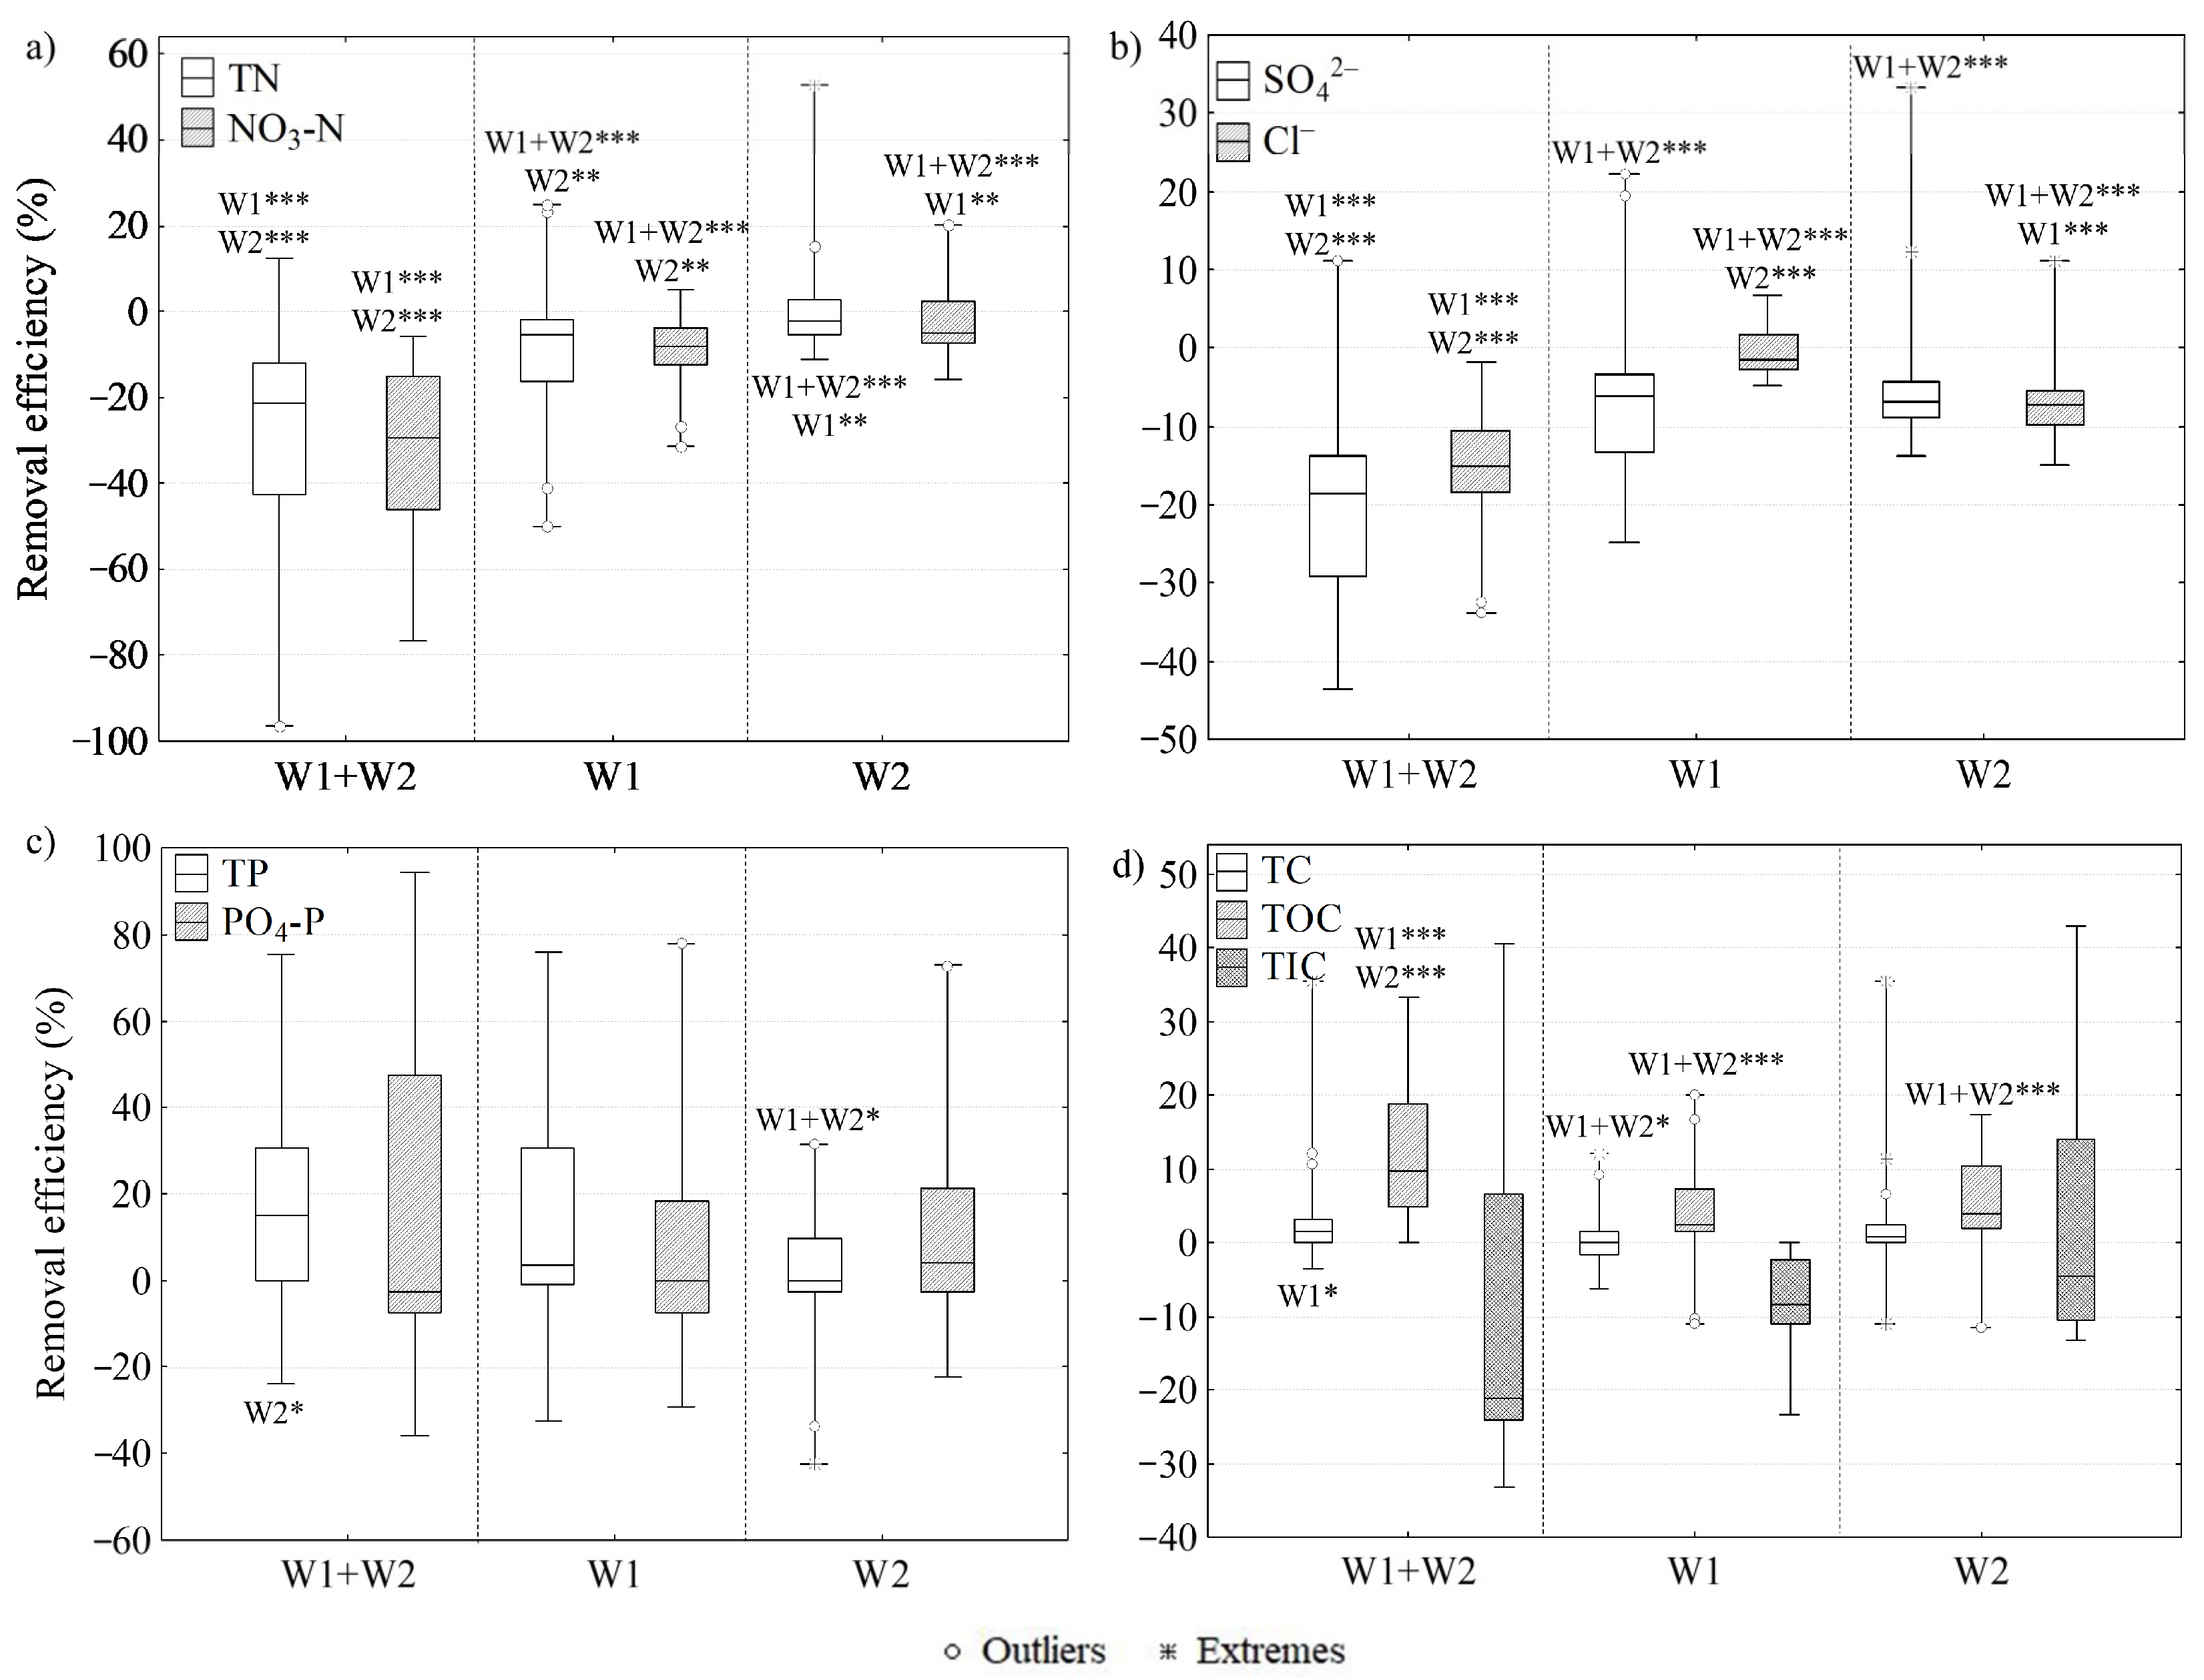
Removal efficiencies (%) of first wetland (W1), second wetland (W2) and their combination (W1 + W2) during the study period for (a) total nitrogen (TN), nitrate (NO3-N), (b) sulphate (SO42−), chlorine (Cl−), (c) phosphate (PO4-P), total phosphorus (TP) and (d) total carbon (TC), total organic carbon (TOC) and total inorganic carbon (TIC). Median, min/max, 25% and 75% quartile values are presented. Asterisks with numbers denote statistically significant differences between first wetland (W1), second wetland (W2) and their combination together (W1 + W2), according to the Mann-Whitney U test: *** p < 0.001, ** p < 0.01, * p < 0.05.
Figure 2.
Removal efficiencies (%) of first wetland (W1), second wetland (W2) and their combination (W1 + W2) during the study period for (a) total nitrogen (TN), nitrate (NO3-N), (b) sulphate (SO42−), chlorine (Cl−), (c) phosphate (PO4-P), total phosphorus (TP) and (d) total carbon (TC), total organic carbon (TOC) and total inorganic carbon (TIC). Median, min/max, 25% and 75% quartile values are presented. Asterisks with numbers denote statistically significant differences between first wetland (W1), second wetland (W2) and their combination together (W1 + W2), according to the Mann-Whitney U test: *** p < 0.001, ** p < 0.01, * p < 0.05.

Figure 3.
(a) Flow rate (L·s−1) changes in the study period. Inlet (in1) and outlet (out2) concentrations of (b) total nitrogen (TN) and nitrate (NO3-N), (c) sulphate (SO42−) and chlorine (Cl−), (d) phosphate (PO4-P) and total phosphorus (TP), (e) total carbon (TC) and total organic carbon (TOC) in spring (SP), summer (SM), autumn (AU) and winter (WI). Median, min/max and 25% and 75% quartile values are presented. Asterisks with letters indicate statistically significant differences between seasonal inlet and outlet concentrations, according to the Mann-Whitney U test: *** p < 0.001, ** p < 0.01, * p < 0.05. Capital letters indicate significant seasonal differences (p < 0.05) for left-side boxes; small letters show differences for right-side boxes.

Figure 4.
Linear correlations between (a) sulphate (SO42−) and nitrate (NO3-N); (b) chlorine (Cl−) and nitrate (NO3-N); (c) total inorganic carbon (TIC) and nitrate (NO3-N); (d) chlorine (Cl−) and sulphate (SO42−) concentrations measured from inlets and outlets of the wetlands. Dashed line represents 95% confidence interval.

© 2018 by the authors. Licensee MDPI, Basel, Switzerland. This article is an open access article distributed under the terms and conditions of the Creative Commons Attribution (CC BY) license (http://creativecommons.org/licenses/by/4.0/).
Share and Cite
MDPI and ACS Style
Kill, K.; Pärn, J.; Lust, R.; Mander, Ü.; Kasak, K. Treatment Efficiency of Diffuse Agricultural Pollution in a Constructed Wetland Impacted by Groundwater Seepage. Water 2018, 10, 1601. https://doi.org/10.3390/w10111601
AMA Style
Kill K, Pärn J, Lust R, Mander Ü, Kasak K. Treatment Efficiency of Diffuse Agricultural Pollution in a Constructed Wetland Impacted by Groundwater Seepage. Water. 2018; 10(11):1601. https://doi.org/10.3390/w10111601
Chicago/Turabian StyleKill, Keit, Jaan Pärn, Rauno Lust, Ülo Mander, and Kuno Kasak. 2018. "Treatment Efficiency of Diffuse Agricultural Pollution in a Constructed Wetland Impacted by Groundwater Seepage" Water 10, no. 11: 1601. https://doi.org/10.3390/w10111601
Note that from the first issue of 2016, this journal uses article numbers instead of page numbers. See further details here.