Optimal Scale of Urbanization with Scarce Water Resources: A Case Study in an Arid and Semi-Arid Area of China

State Key Laboratory of Eco-hydraulics in Northwest Arid Region of China, Xi’an University of Technology, Xi’an 710048, China
*
Author to whom correspondence should be addressed.
Water 2018, 10(11), 1602; https://doi.org/10.3390/w10111602
Submission received: 10 October 2018
/
Revised: 3 November 2018
/
Accepted: 5 November 2018
/
Published: 8 November 2018
(This article belongs to the Section Water Resources Management, Policy and Governance)
Abstract
:A complex interwoven relationship exists between water resources and urbanization, which is of much interest in international water science research. To study the urban development in large cities facing water deficiency problems, it is important to identify rational thresholds of urbanization to achieve optimal utilization of limited water resources, and to promote sustainable economic and population growth and social development. A multi-objective optimization model is proposed to search for the optimal scale of urbanization of large cities with limited water resources. To solve a large-dimensional multi-objective optimization problem, the non-dominated sorting genetic algorithm (NSGA-II) is improved to the OENSGA-II based on the orthogonal generation method and the E-optimality method and applied to a typical arid city, Xi’an of China, which underwent rapid urbanization in recent years. For Xi’an, a statistically significant positive correlation is found between urbanization rate (Ur) and gross domestic product (GDP), domestic water, tertiary industry water, and ecological water. However, Ur is negatively correlated with the primary industry water. If the current urbanization trend continues, the water resources available are far from sufficient to support the future city of Xi’an. In this work, it was found that, by implementing restrictive water resources management and water saving measures, the economic threshold of Xi’an could be raised to 1890.3 and 2403.3 billion yuan, while the population threshold could be raised to 11.0 and 13.9 million, and Ur to 79.9% and 85.9% in 2020 and 2030, respectively. The corresponding maximum urban area to be constructed based on the projected population will be 964.81 and 1197.6 km2 in those years. It will be prudent for Xi’an to practice strict water resource management, and to allocate its water resources among various water sectors effectively and equitably to avoid major water shortage problems in the future.
1. Introduction
According to the Global Risk Report of the World Economic Forum (2017) [1,2], water crisis was identified as one of the top five global risks in terms of impact on society for the seventh consecutive year since 2011, ahead of climate change, extreme weather events, food crises, and social instability. Water resources play an important role in the development of any urban river basin because it is a major driver behind man’s economic and social expediency, and it is essential in the habitability of the urban area [3]. Hence, the occurrence of any water crisis, especially in a large area over a prolonged period, will inevitably affect the urban development and the livelihood of its residents. In many countries across the world, especially among developing countries, water resources are developed primarily to promote economic growth, to raise the living standards of people, and to expand the scale of urbanization of urban areas [4]. As a city expands and its population grows, we expect that urbanization will lead to an increase in the consumption of water, inter-basin water transfer, and the amount of water supplied and sewage produced, which in turn will affect the availability of water and the environment [5,6].
As a result, many governments struggle to reconcile available water supply with growing demand [7]. In recent years, Mexico City (Mexico), Santiago (Chile), Delhi (India), and northwestern China experienced serious water shortages. Therefore, these countries have to restrict the use of water, including industrial water use, and, in some cases, invest heavily in major projects to divert water supplies from a far distance [8,9,10,11]. These measures could alleviate water shortage problems temporarily, but a more pragmatic approach is to try achieving the sustainable development of a city with a limited amount of water resources.
In recent years, research related to urbanization and water resource utilization mainly focused on water resource carrying capacity [12], relationships between urbanization indices and indices on water resource utilization [13], the relationship between urbanization and domestic water consumption [14] and between urban development and water utilization amount and efficiency [15], and the harmonious coordination between urban development and water resource utilization [16]. Many studies focus on the negative effect of a lack of water resources on urban development and the interaction between the degree of urbanization and the utilization of water resources, while only a few studies explore what level of urbanization could be supported with a limited amount of water resources [17,18]. Many past studies depended on results derived from individual indicators rather than considering all aspects of urban development as a more comprehensive approach to obtaining an integrated, optimal solution. Given that the lack of water resources will affect various aspects of urban development, we believe that research on the optimization of urban development and water resource utilization should be formulated in a multi-objective optimization framework and solved using an effective optimization algorithm.
Various optimization algorithms were developed and applied to many fields of study, such as genetic algorithms [19], the cuckoo optimization algorithm [20], artificial neural networks [21], and the harmony search algorithm [22], as well as their modified versions [23]. Among them, the evolutionary search, non-dominated sorting genetic algorithm (NSGA-II) [24] is one of the most popular multi-objective genetic algorithms, because it avoids the complexity of non-inferior ranking genetic algorithms and it is very efficient computationally. However, the search space for an optimization problem with strict constraint conditions can be small, which could result in selecting poor initial population, leading to an excessive search in non-promising search areas [25]. Furthermore, for large-dimensional multi-objective optimization problems (LMOPs) with more than three targets, it tends to be challenging for NSGA-II to meet the convergence requirements because of the increased probability of non-domination between individuals, which would reduce the performance of the algorithm. In this study, a new method called OENSGA-II, based on the orthogonal generation method and the E-optimality method, is proposed to generate more promising initial population, which will further enhance the effectiveness of the dominant features of NSGA-II.
The primary objectives of this study were to investigate interactions between the degrees of urbanization and the status of water resource utilization, and to explore the additional potential of cities undergo rapid development. As a multi-objective optimization model developed to improve the original NSGA-II algorithm, OENSGA-II is set up to address these issues. Xi’an, a typical water-deficient city in China compounded with multiple problems evolved from rapid urbanization, was chosen as a case study to explore optimal thresholds related to the scale of urbanization under scarce water resources. In the latter section, the urbanization process of Xi’an was divided first, and then the correlations between urbanization rate (Ur) and gross domestic product (GDP), water consumption of five sectors, and water utilization rate were analyzed. Simultaneously, the variations of water utilization status and structure, and the relationship between industrial structure and water use efficiency were discussed. Finally, three schemes with diverse water constraints were put forward to compare the city scale in current and future years. This study is expected to contribute to more effective water resource management and the optimal development of urban developing in water-scarce cities. Moreover, it is also expected that this study could attract the attention of the urban cities which pertinaciously chase after better economic benefits and blindly expand the urban scale regardless of water scarcity.
2. Study Area and Data
2.1. Overview of Xi’an
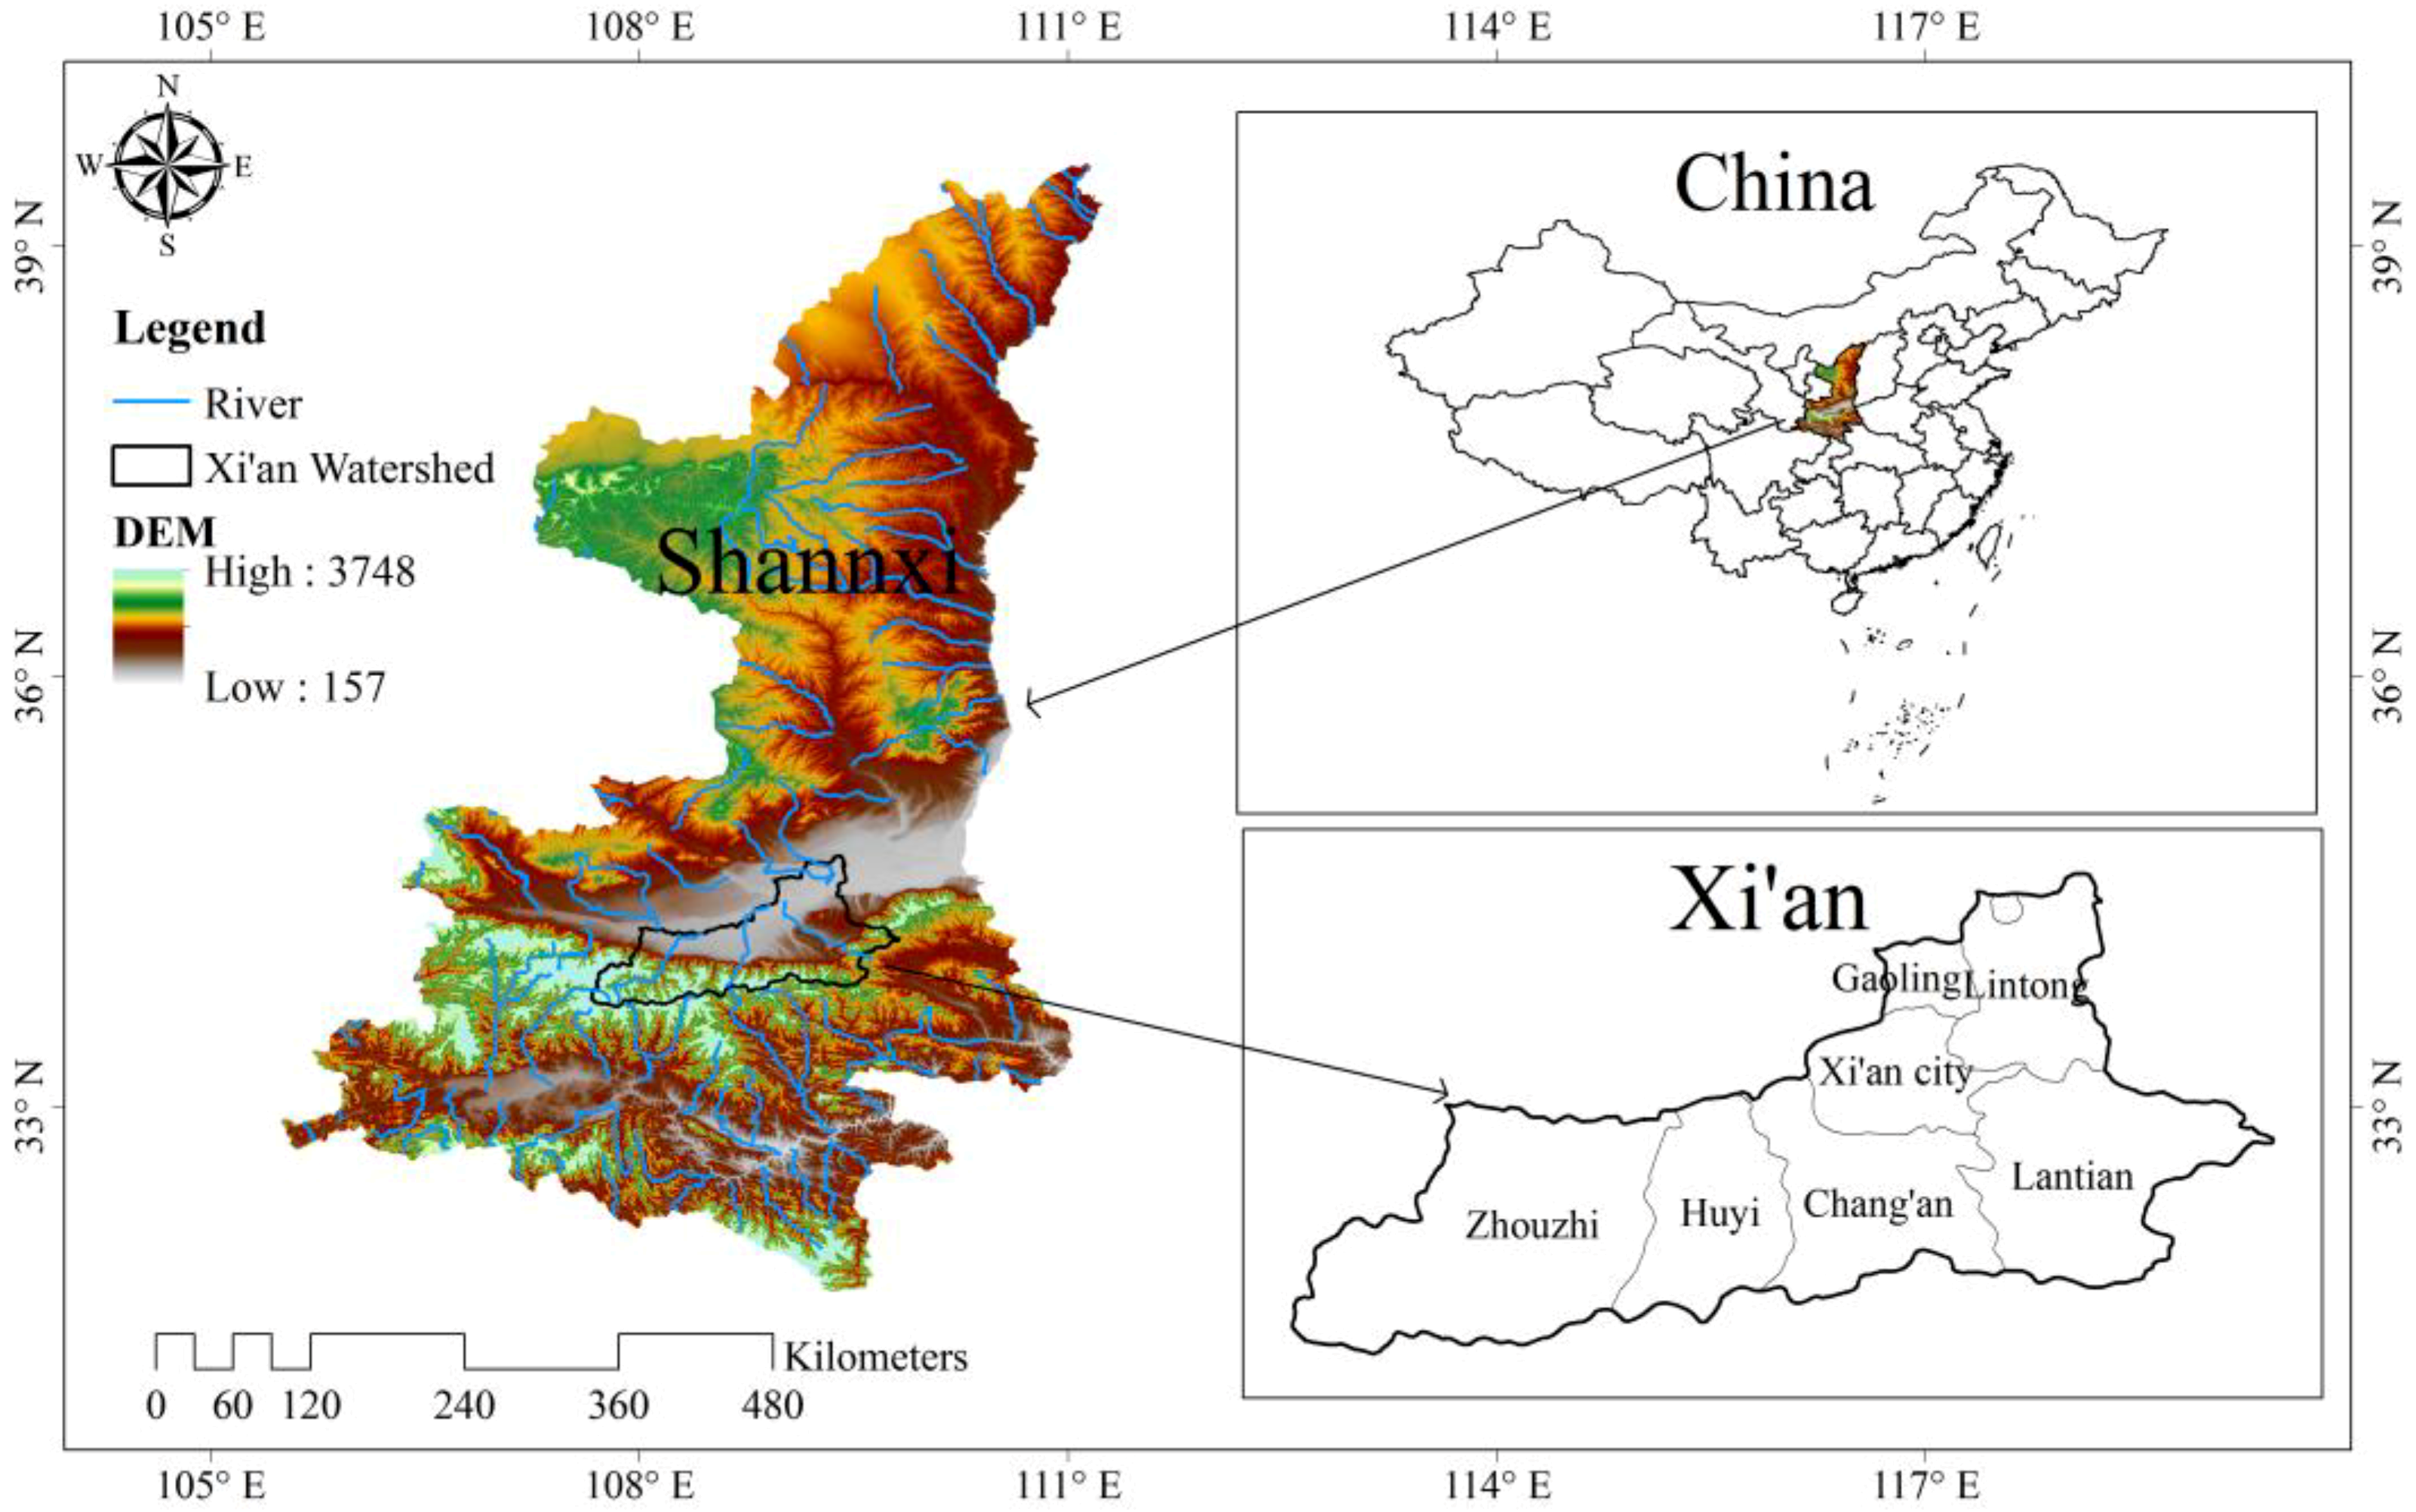
As the largest central city of northwestern China, Xi’an is a typical city facing severe water shortages (Figure 1). Xi’an has 13 administrative regions, including 11 districts and 2 counties, with a total area of 10,108 km2. Among them, seven districts are located in the downtown area in Xi’an, and four districts and two counties lay in the remaining areas. At present, the per capita water resources in Xi’an are about 235 m3, only 1/7.5 of the national average of China (2086 m3), which is well below the internationally accepted absolute water scarcity level (<500 m3 per year per capita). With the rapid expansion of various cities across China, the economic and social development of China became increasingly dependent on water resources. At present, the development and utilization of surface water in Xi’an is 41.56%, which surpasses the internationally recommended surface water resource development and utilization upper cordon. About 98.68% of groundwater resources are exploited, which is not sustainable, as it far exceeds the rate of replacement of groundwater resources. There is no new source of groundwater to exploit.
Rapid urbanization brought about by the fast economic growth and growing urban population further exacerbated the severity of water shortage problems of Xi’an. The gross domestic product (GDP) of Xi’an was 8.95 billion United States dollars (USD) in 2001, which is equivalent to 1297 USD per capita, and the GDP grew to 93.8 billion USD by 2016 (based on the exchange rate of 2016). The urban area of Xi’an expanded rapidly from 187 km2 in 2001 to 553.29 km2 in 2016, almost triple in a short 15-year period. Simultaneously, the total population of Xi’an increased from 6.09 million (urban population accounts for 45.3%) in 1990 to 8.83 million (73.5%) in 2016. The rapid development of many cities is achieved upon the excessive, non-sustainable consumption of water resources [26]. As a result, in the context of rapid urbanization, water resource issues are becoming more and more crucial, especially in Xi’an which is a city suffering from water shortage problems, which is a bottleneck in the sustainable development of Xi’an.
2.2. Data Sources
In this study, the data of the study case include the administrative division, economy (GDP, three-industry added value, and population), water resource utilization (total water resources, domestic water, three-industry water consumption, ecological water consumption, and 104 industrial output value water consumption), agriculture (cultivated land area and grain yield), water pollution (sewage discharge coefficient, sewage discharge concentration, and sewage treatment capacity), land use (urban built-up area), and socio-economic development planning indicators and water resources management indicators.
Data on administrative division, economic development, population, agriculture, and land use were from the Xi’an Statistics Bureau (1952–2016). Data on water consumption of five water use sectors were from the Xi’an Water Resources Bureau (1980–2016) and the Xi’an Statistics Bureau (1980–2016). Data on total available water and water consumption of the 104 yuan industrial output value were from the Shaanxi Province Water Resources Bureau (1980–2016) and the Shaanxi Province Statistical Bureau (1986–2016). Data on sewage discharge were from the Xi’an Statistics Bureau (1952–2016), and the data of Sewage discharge coefficient and sewage treatment capacity were from the water resources section in the master plan of Xi’an City.
The social and economic development planning indicators are from 12th and 13th Five-Year Plans on the Economy, Society, and Development of Xi’an City. The population data for planning years were from the “Population Development Plan (2016–2030)”. The indices of domestic water quota and industrial water saving quota were from “the Water Quota of Shaanxi Province” and “the standard of water quantity for city’s residential use”. The cultivated area index in planning year were from land-use comprehensive planning in Xi’an. The land-use indicators, such as the control area of arable land and the scale of construction land, were from the overall planning of land use in Xi’an city (2006–2020). The main water use control index of Xi’an in various industries was from the implementation plan of the strictest water resource management system of Xi’an, research on the control index of water efficiency in the district of Shaanxi Province (2015–2030), and opinions of the State Council on the implementation of the strictest water resource management system (2015–2030).
3. Research Methodology
3.1. Multi-Objective Optimization Model
The primary objective of the multi-objective model developed in this study was to determine the optimal thresholds of urbanization. Four sub-functions of maximizing economic benefits (EB), maximizing population (POP), maximizing food production (FP), and minimizing pollutant emissions (PE) were selected to guide the scale of urban development comprehensively. The total water resource consumption accounts for the water consumption of n key aspects of urban development: industrial water of three industries (primary, secondary and tertiary sector), domestic water, and ecological water (). Total i water sources () and m regions () form the city’s water distribution network.
The model can be generally expressed as
where A (hm2) is available arable land, j denotes the quantity of crops in irrigable field, and k represents the number of crops in paddy field.
The specific sub-functions are as follows:
where UI (yuan/ m3) denotes the unit economic benefit per m3 of water consumption by water users, while UC (yuan/ m3) denotes the cost associated with a unit of water consumption, POPurban represents the urban population, (ton/hm2) is the grain yield of irrigated crops and paddy field crops, is the sewage discharge coefficient, and is the concentration of pollutants in the sewage.
POPurban was deduced by the application of a two-dimensional theory proposed by Zhao et al. (2009) [27], which assesses the urban population based on water quantity and quality. In the two-dimensional theory, the population threshold is described as
where are the urban population related to certain water quantity and quality attributes, respectively; is the minimum between , which represents the population threshold; (104 m3) denotes the amount of available water resources; (m3/per) is the water consumption per urban resident; (104 m3) represents capacity of river self-purification, which is related to the upper limit of total sewage discharged in the basin; and (m3/per) is the amount of per capita sewage discharge.
The objective function is restricted by the physical constraints. The total water consumption is limited to within the total amount of water available , which is the minimum of the natural available water resources () and the total water-use control indicator () (Equations (7) and (8)). is the irrigation quota for per unit area of farmland (m3/hm2) and denotes the utilization efficiency of agricultural water. According to the water right of local agriculture, the general irrigation water would not be permitted to be greater than that of the primary industry (Equation (9)). The EB of the city is between the maximum and the minimum of projected GDP; the total population POP of the city is between the maximum and the minimum of the projected population (Equations (10) and (11)). The projection is obtained by an exponential smoothing method fitted to historical data. R is the maximum capacity of sewage discharge that is sustainable environmentally. If the restriction on sewage discharge is not followed, the water self-purification ability of the system will not be able to achieve the water quality required, which would lead to contamination of the available water resources, and its sustainable and desired utilization. The constraints can be described as follows:
The final constraints are variables that represent non-negative constraints.
3.2. OENSGA-II Optimization Algorithm
NSGA-II is an effective, multi-objective optimization algorithm developed by Deb et al. [24]. However, it may suffer from potential premature convergence to a local rather than a global optimum solution. In this paper, we propose a new method to improve the performance of the NSGA-II algorithm, known as the OENSGA-II algorithm. The key improvement mainly includes the initial population orthogonal generation method and E-optimality.
This population orthogonal generation method can generate an initial population of points scattered uniformly over the feasible solution space. Leung et al. [28] initialized the population by designing orthogonal matrices in a genetic algorithm (GA), so that individuals in the population would distribute over the total search space evenly and improve the effectiveness of the algorithm. The method can reduce the number of experiments significantly and can still achieve superior results. This approach was proven to be efficient and, therefore, it was widely used in many fields [29,30]. Details of the procedures are given in Leung et al. [28].
The concept of E-optimality, proposed by Reference [31] for multi-objective optimization, not only considers the difference in the number of superior and inferior objectives between two feasible solutions, but it also considers the values of improved objective functions underlying the hypothesis that all objectives in the problem have equal importance. Numerical experiments show that the definition of E-optimality is better than that of the Pareto optimality when more than three objective functions are involved [31].
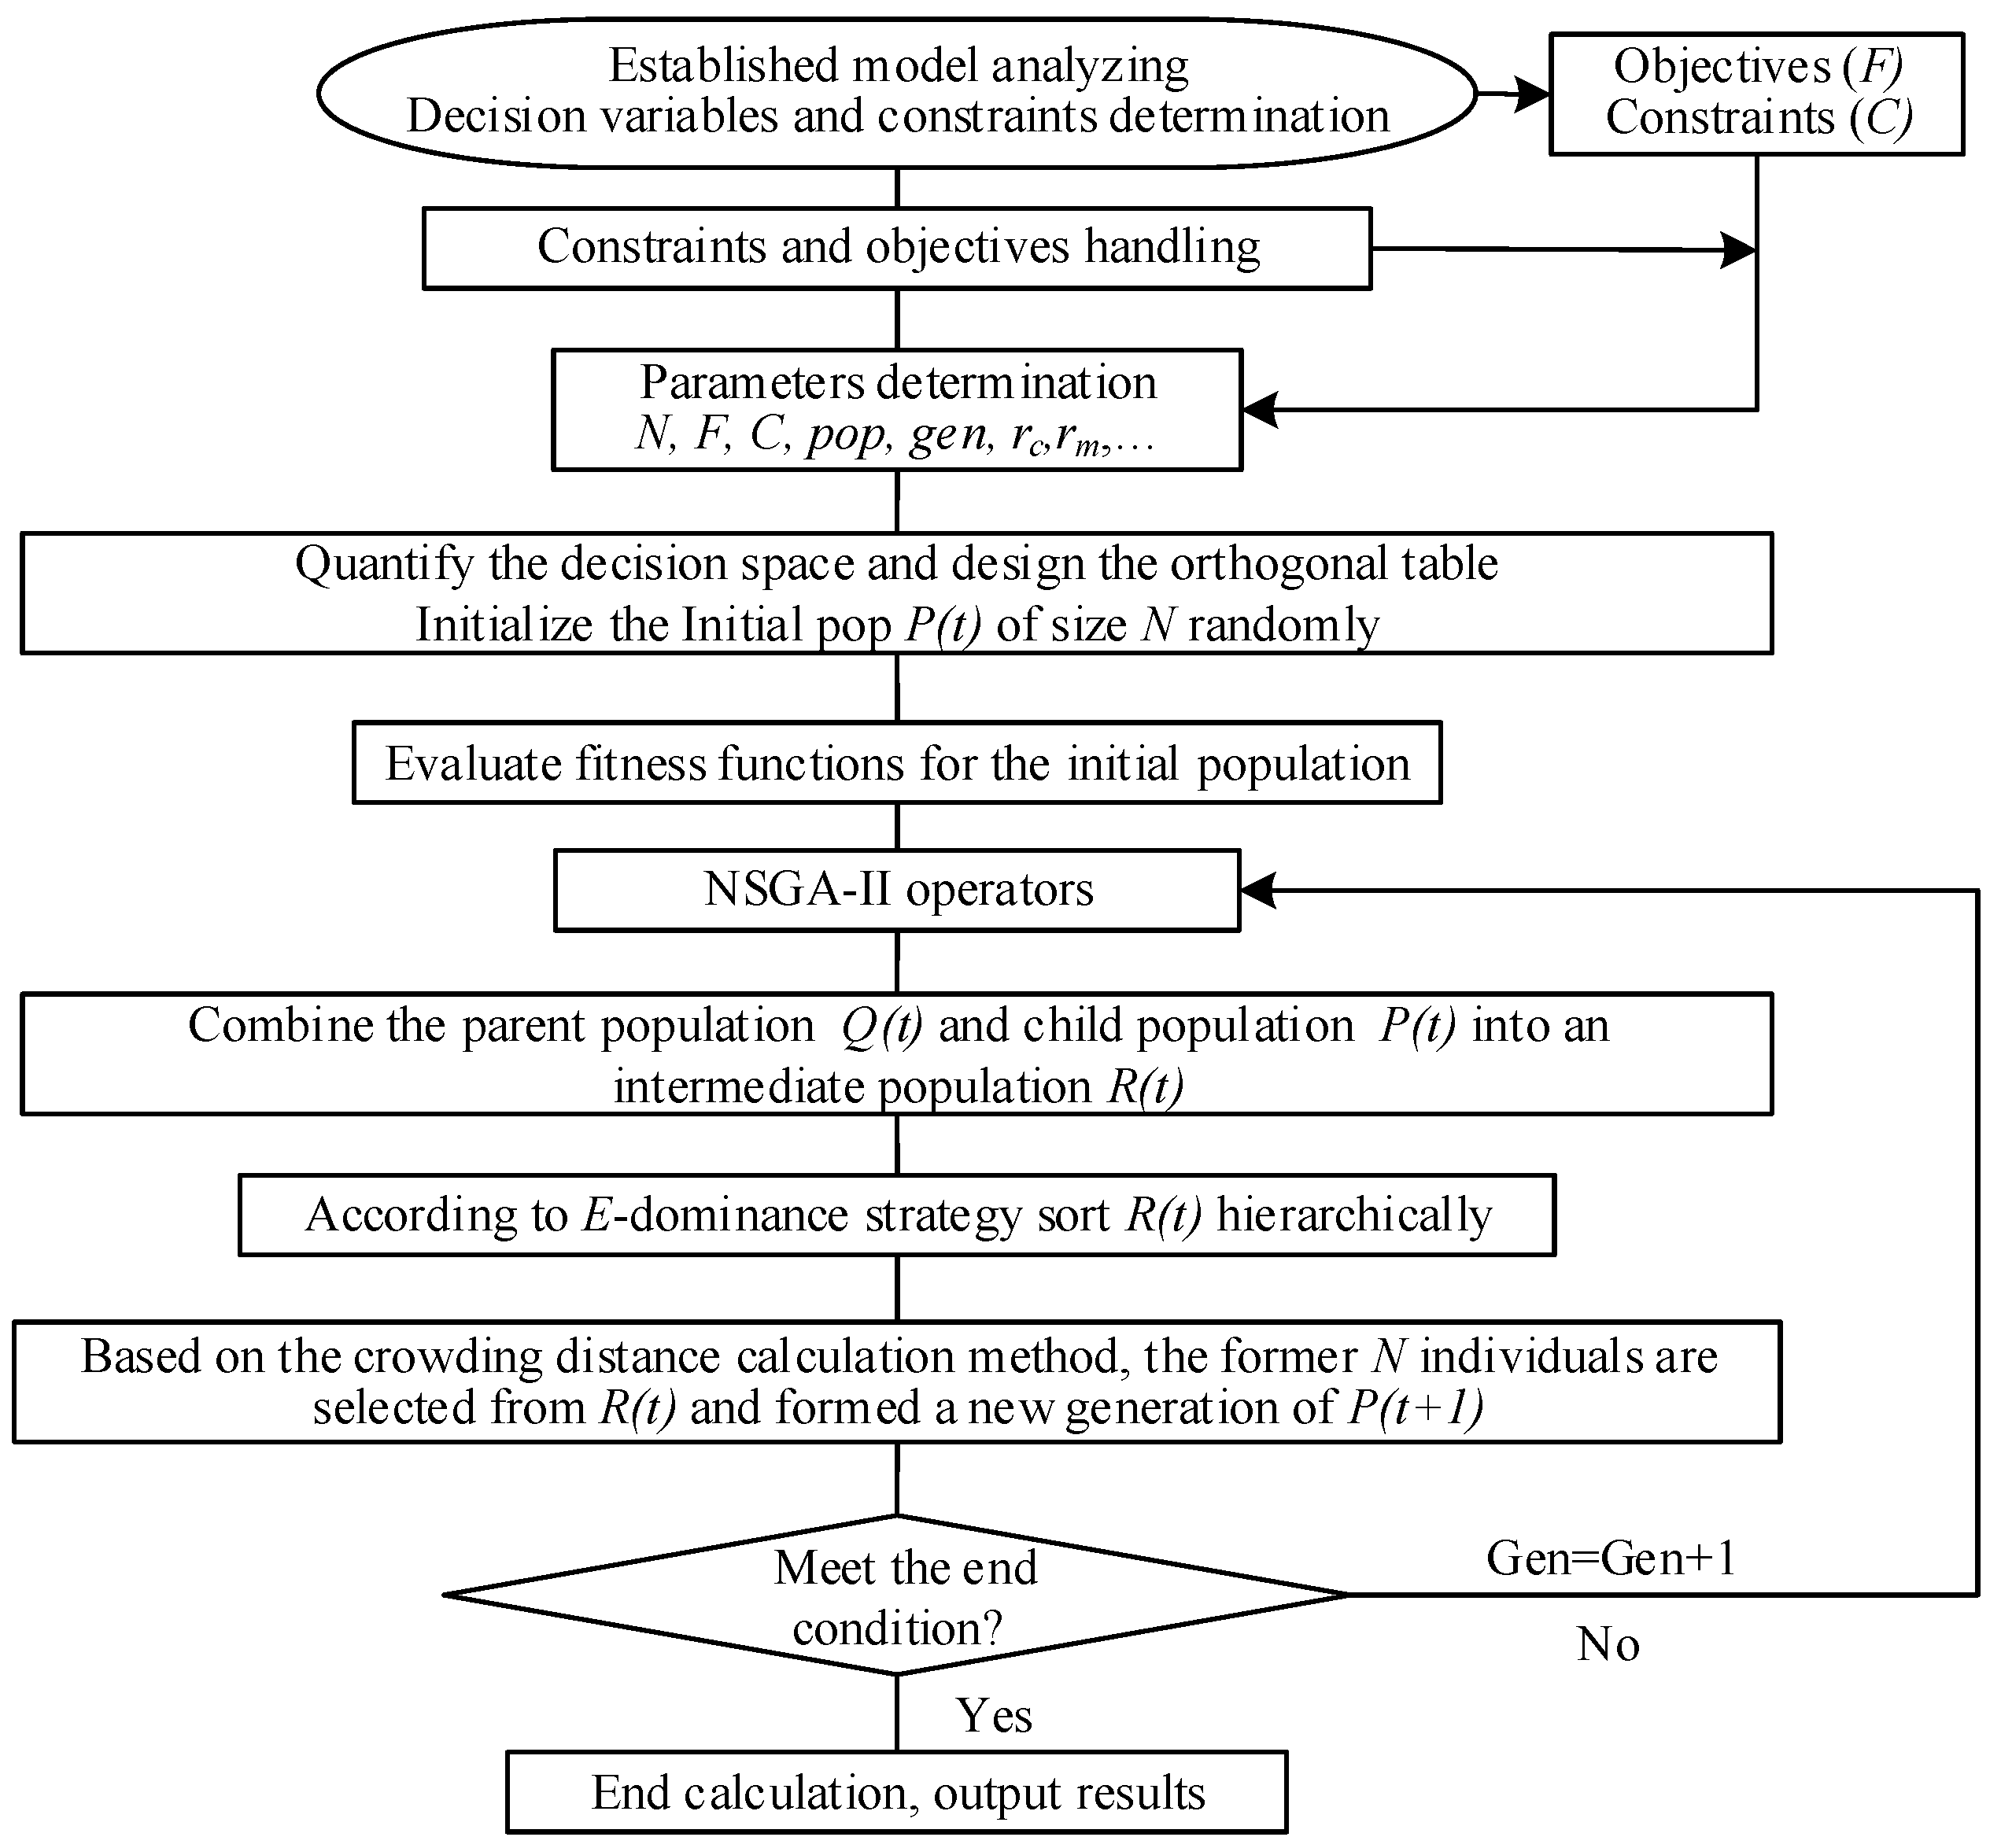
In this study, the E-optimality is a selection strategy to judge the pros and cons of different choices as the optimal solution. By combining the population orthogonal generation method and E-optimality, the proposed OE-strategy is designed to improve the performance of NSGA-II, named herein as OENSGA-II, shown in Figure 2.
3.3. Scenario Setting
Xi’an was selected as a typical city in this study. According to the urban planning of Xi’an, measures including water conservation plans, new water supply projects, urban water transfer projects, etc. will be implemented in the near future. On the basis of the actual status of Xi’an, the proposed optimization scenarios described below were considered.
Natural development type (Scheme 1): It is assumed that Xi’an will continue following the trend of past urban developments, irrespective of the government’s development plan to strictly manage water resource systems according to the guidelines provided.
Target-oriented type (Scheme 2): The indicators required in the government’s scheme in strictly managing water resource systems for economic and social development include both expected and constraint indices. In Scheme 2, constraint indicators must be completed, while expected indicators continue evolving in accordance with current trends, without the influence of any of the above constraints.
Strict constraint type (Scheme 3): Various stringent indicators representing physical water resource constraints will be implemented to achieve economic benefits, and to support the urbanization scale and the population no less than the government’s targets. In Scheme 3, expected indicators are projected to be completed as constraint indicators. This scheme could also investigate the largest scale to which Xi’an can be developed realistically under the rigid, physical constraints of water availability and the required standard in water quality.
The primary indices for water utilization in Xi’an are listed in Table 1 for implementing the water resource management system and urban development of Xi’an strictly according to the government’s plans.
4. Results and Discussion
This section is divided into subheadings, providing a concise and precise description of the experimental results, their interpretation, and the experimental conclusions that were drawn.
4.1. Division of the Urbanization Progress
From 1952 to 2016, Xi’an’s Ur increased from 22.8% to 73.5%, and its population grew from 2.48 to 8.83 million. Northam [32] depicted the urbanization process as an attenuated “S” curve, which includes an initial stage, an acceleration stage, and a terminal stage. According to Northam’s urbanization process theory and its urbanization characteristics, Xi’an went through all three stages (Figure 3). Figure 3 illustrates that the GDP, total water consumption, and industrial added value all show distinct characteristics corresponding to Ur in different stages.
Initial stage (before 1978): With a low Ur that fluctuated around or below 30% for an extended period, its economic development progressed slowly.
Acceleration stage (1978–2011): Over this period of rapid urban development, the Ur increased from 32.1% to 70.1%, completing the middle stage of urbanization. This acceleration stage can be divided into two periods. First period (1978–1990): The rate of urbanization grew to 49.96% until 1990, with an average annual growth rate of 1.38%. Second period (1991–2011): With the industrial structure being well established, the process of urbanization gradually slowed down, averaging an annual growth rate of 0.96%. At this stage, the added value of the secondary industry increased very rapidly and there was a slight decrease in total water consumption.
Terminal stage (2011 onward): As Ur exceeded 70%, the city was socially well developed, its industry entered the mature stage, and water supply facilities were well established and comprehensive. The added value of the secondary industry slowed down, and that of the tertiary industry increased significantly. GDP continued growing rapidly, with a slight rise in total water consumption.
4.2. Correlations between Urbanization Rate and Urban Water Resources
Consistent with the growth in Ur is the rapid growth of GDP. The correlation coefficient between Ur and GDP was found to be positive and statistically significant (Table 2). In contrast to the findings of past studies, higher Ur does not necessarily result in more water consumption, and the relationship between water consumption and Ur is non-significant statistically. The same applies to water consumption and the secondary industry. Unlike Ur and GDP, with the development and progress of the city, the total water consumption declined from 2000–2010. In addition, the water consumption of the domestic, tertiary industry, and the ecological aspects show significant positive correlations with the growth of Ur. Specially, it is noteworthy that the primary industry water use and Ur has a highly negative correlation, which means that the lower the water consumption of the primary industry, the higher the Ur. Allied to this is the limited availability of water. As the water consumption of the primary industry increases, less water can be assigned to other sectors. With more economic benefits, the industry sector and the service sector are the keys to the development of urbanization. Consequently, this led to a negative correlation between primary industry water use and Ur. Meanwhile, agricultural land was occupied for the expansion of industrial land and construction areas, and cultivated land area reduced year after year (from 3.3 × 10⁵ hm2 in 1991 to 2.3 × 10⁵ hm2 in 2016), which was also an important reason. In addition, the utilization rate of water resources of Xi’an fluctuated between 66.26% and 81.47% for many years, averaging at 73.09% (Table 2), which is very high.
From the beginning of the second period (acceleration stage), Xi’an began entering into a more mature stage. Therefore, its urban development and its water utilization after 1991 for the past 25 years (1991–2016) should provide a better study period for analyzing the three industrial developments and the utilization of its water resources.
4.3. Variations of Water Resource Utilization Status and Structure
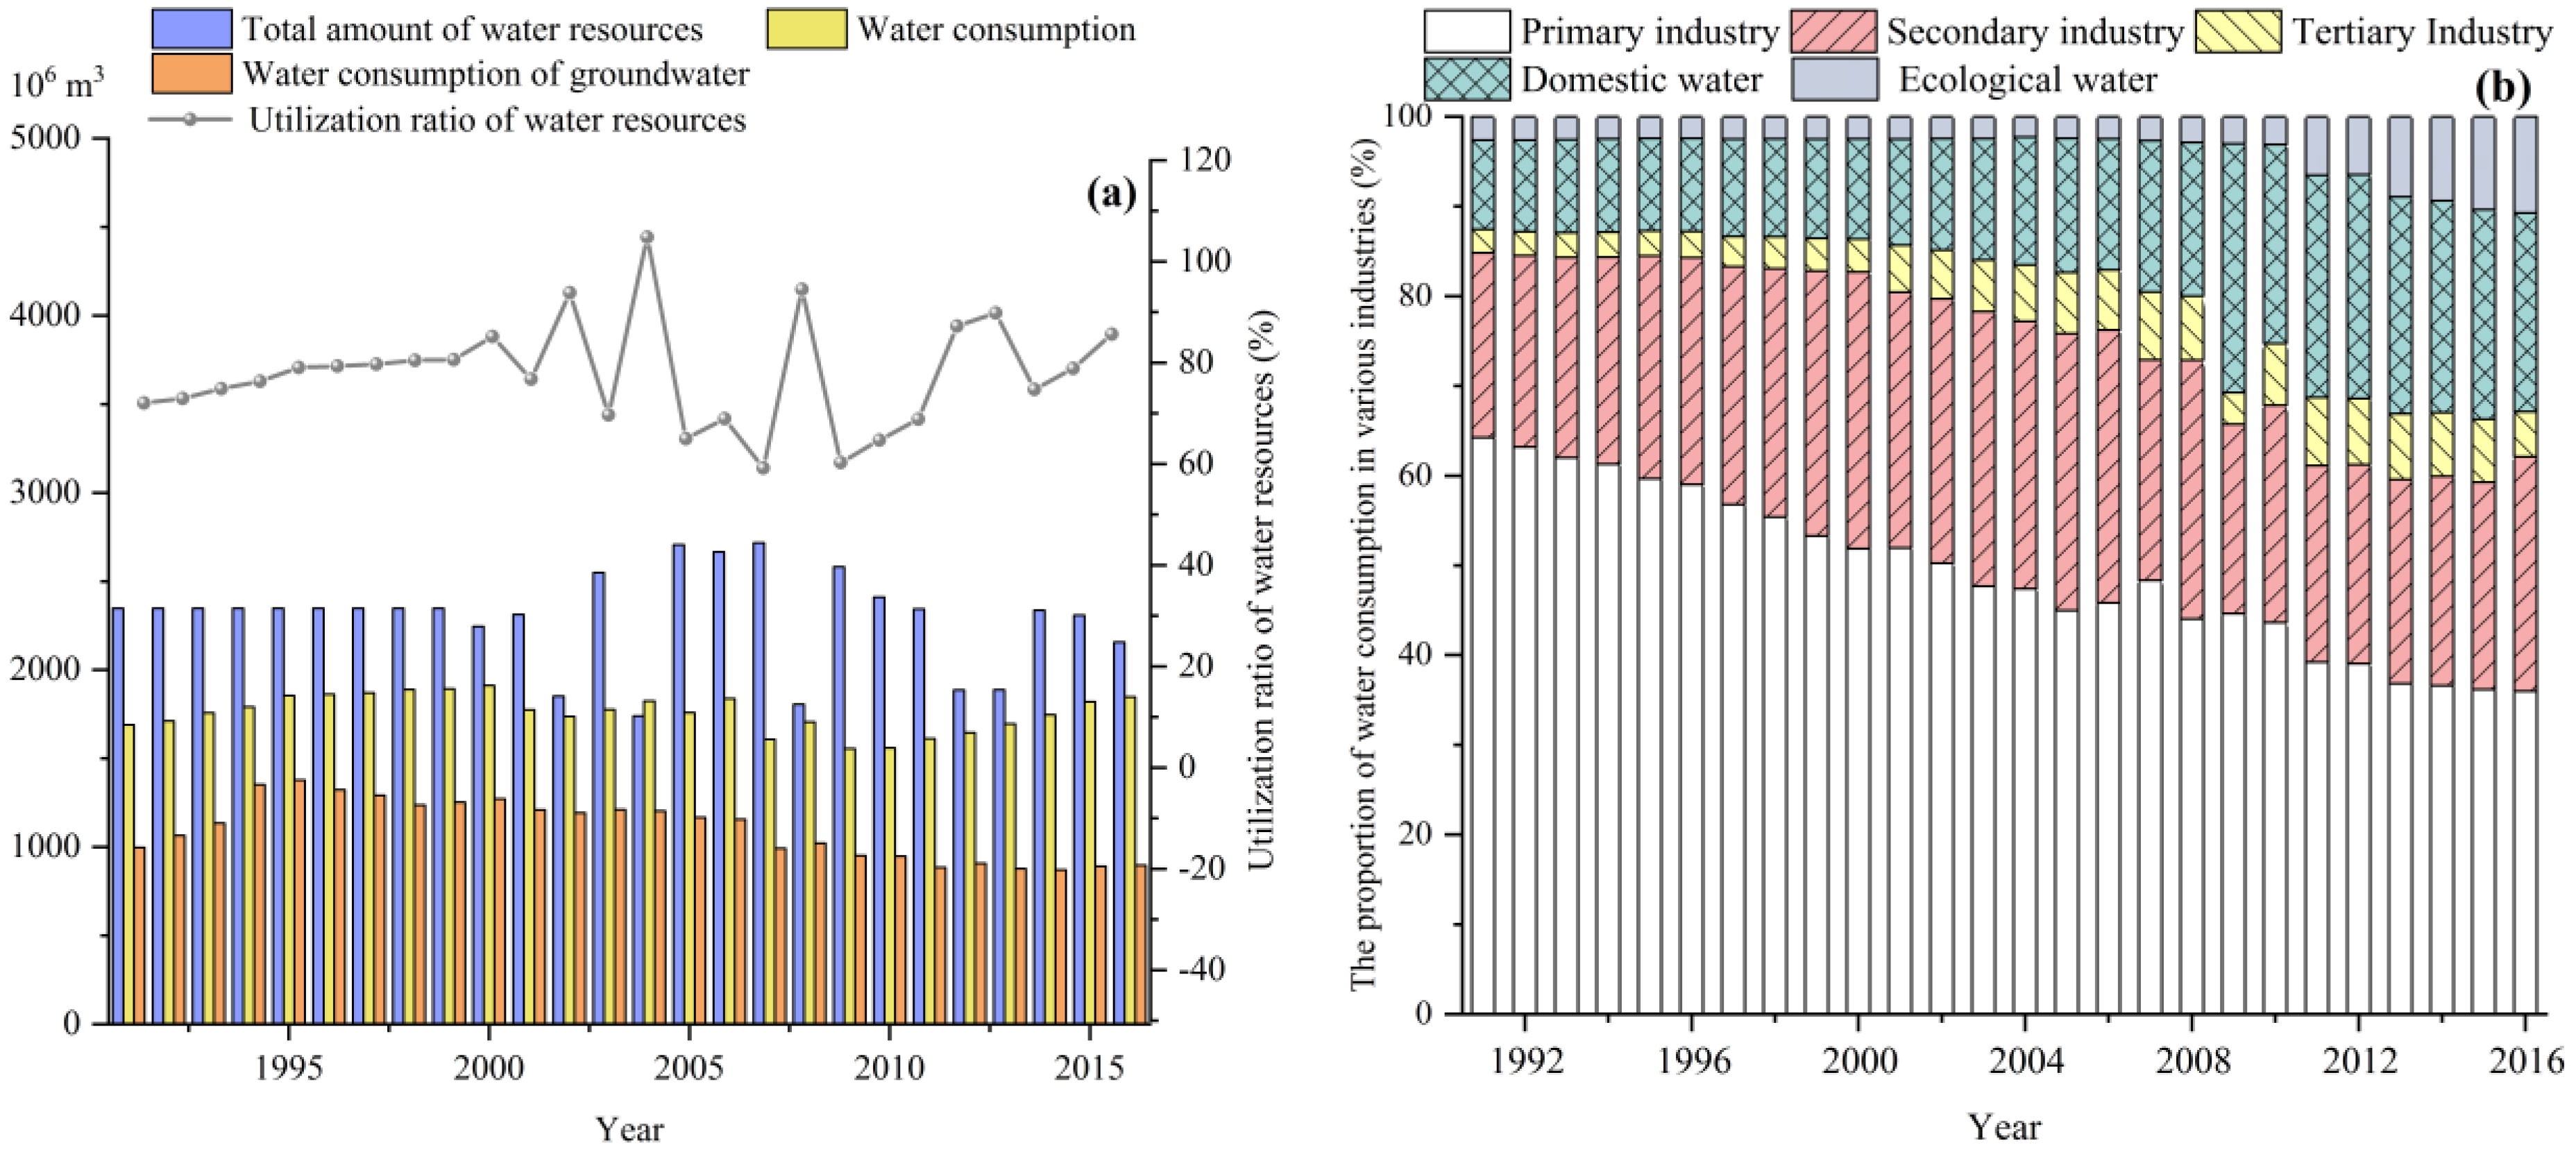
The total water consumption of Xi’an did not fluctuate over a wide range in the past (Figure 4a) because of the limitation of water available; however, consumption was extensive. The utilization of water resources fluctuated around 80% and peaked at 104.8% in 2004 (Figure 4a). For any region, the threshold of water resource utilization can vary, but the utilization of water resources should be lower than the threshold of 50% [33], which Xi’an far exceeds. Moreover, in 2016, 48.52% of the water consumed came from groundwater sources (Figure 4a). Although the proportion of water drawn from groundwater sources slowed down, it is still at an unsustainable rate.
Generally speaking, the proportion of water consumption by an industry could reflect its level of development and scale of urbanization to some extent [34]. Figure 4b shows that, even though the proportion of agricultural water consumption declined noticeably in recent years, agriculture is still a major water sector in Xi’an where the agricultural water consumption in 2016 was 664.26 million m3 or 36% of the total, compared to the 1991–2016 average of 49.2%. As the largest water-consuming sector, however, agriculture brings the lowest economic benefits to Xi’an. It should be noted that, in the future, Xi’an may mainly depend on improving the agricultural water efficiency to allocate water resources more rationally.
The limited water resources of a river basin should be allocated equitably among different water sectors and regions adapting to rapid urbanization [35]. For Xi’an, in 2016, the water consumption of the three industries, and the domestic and ecological sectors were 36.0%, 26.2%, 5.0%, 22.2%, and 10.7%, respectively, while the corresponding proportions in 1991 were 64.3%, 20.6%, 2.6%, 9.9%, and 2.6%, respectively. Therefore, the utilization of water resources changed over time between different water sectors, with the tendency of moving from sectors of low water-use efficiency to sectors of high water-use efficiency, such as from agriculture to secondary and tertiary industries. It is worth mentioning that from 1991 to 2016, the change in secondary industry water use was only 5.6%; however, the inside of the industry is quite different. In 2015 and before, the industrial development in Xi’an depended mainly on the manufacture of motor vehicles and other transportation equipment, while 2016 was a turning point at which the manufacture of computers, communication equipment, and other equipment became the largest value-added industry (Xi’an Statistics Bureau (1991–2016)). Improved technology is the main symbol of urban modernization, which coincides with the rapid development of urbanization in Xi’an. Heavy industry is gradually transforming to fine industry, and the industrial water consumption quota is also relatively reduced. The growing water consumption trends of the tertiary industry and the ecological sector show that the infrastructure and the economic structure of Xi’an are gradually developing toward a more optimized direction.
4.4. Correlations between Industrial Structure and Water Utilization Efficiency
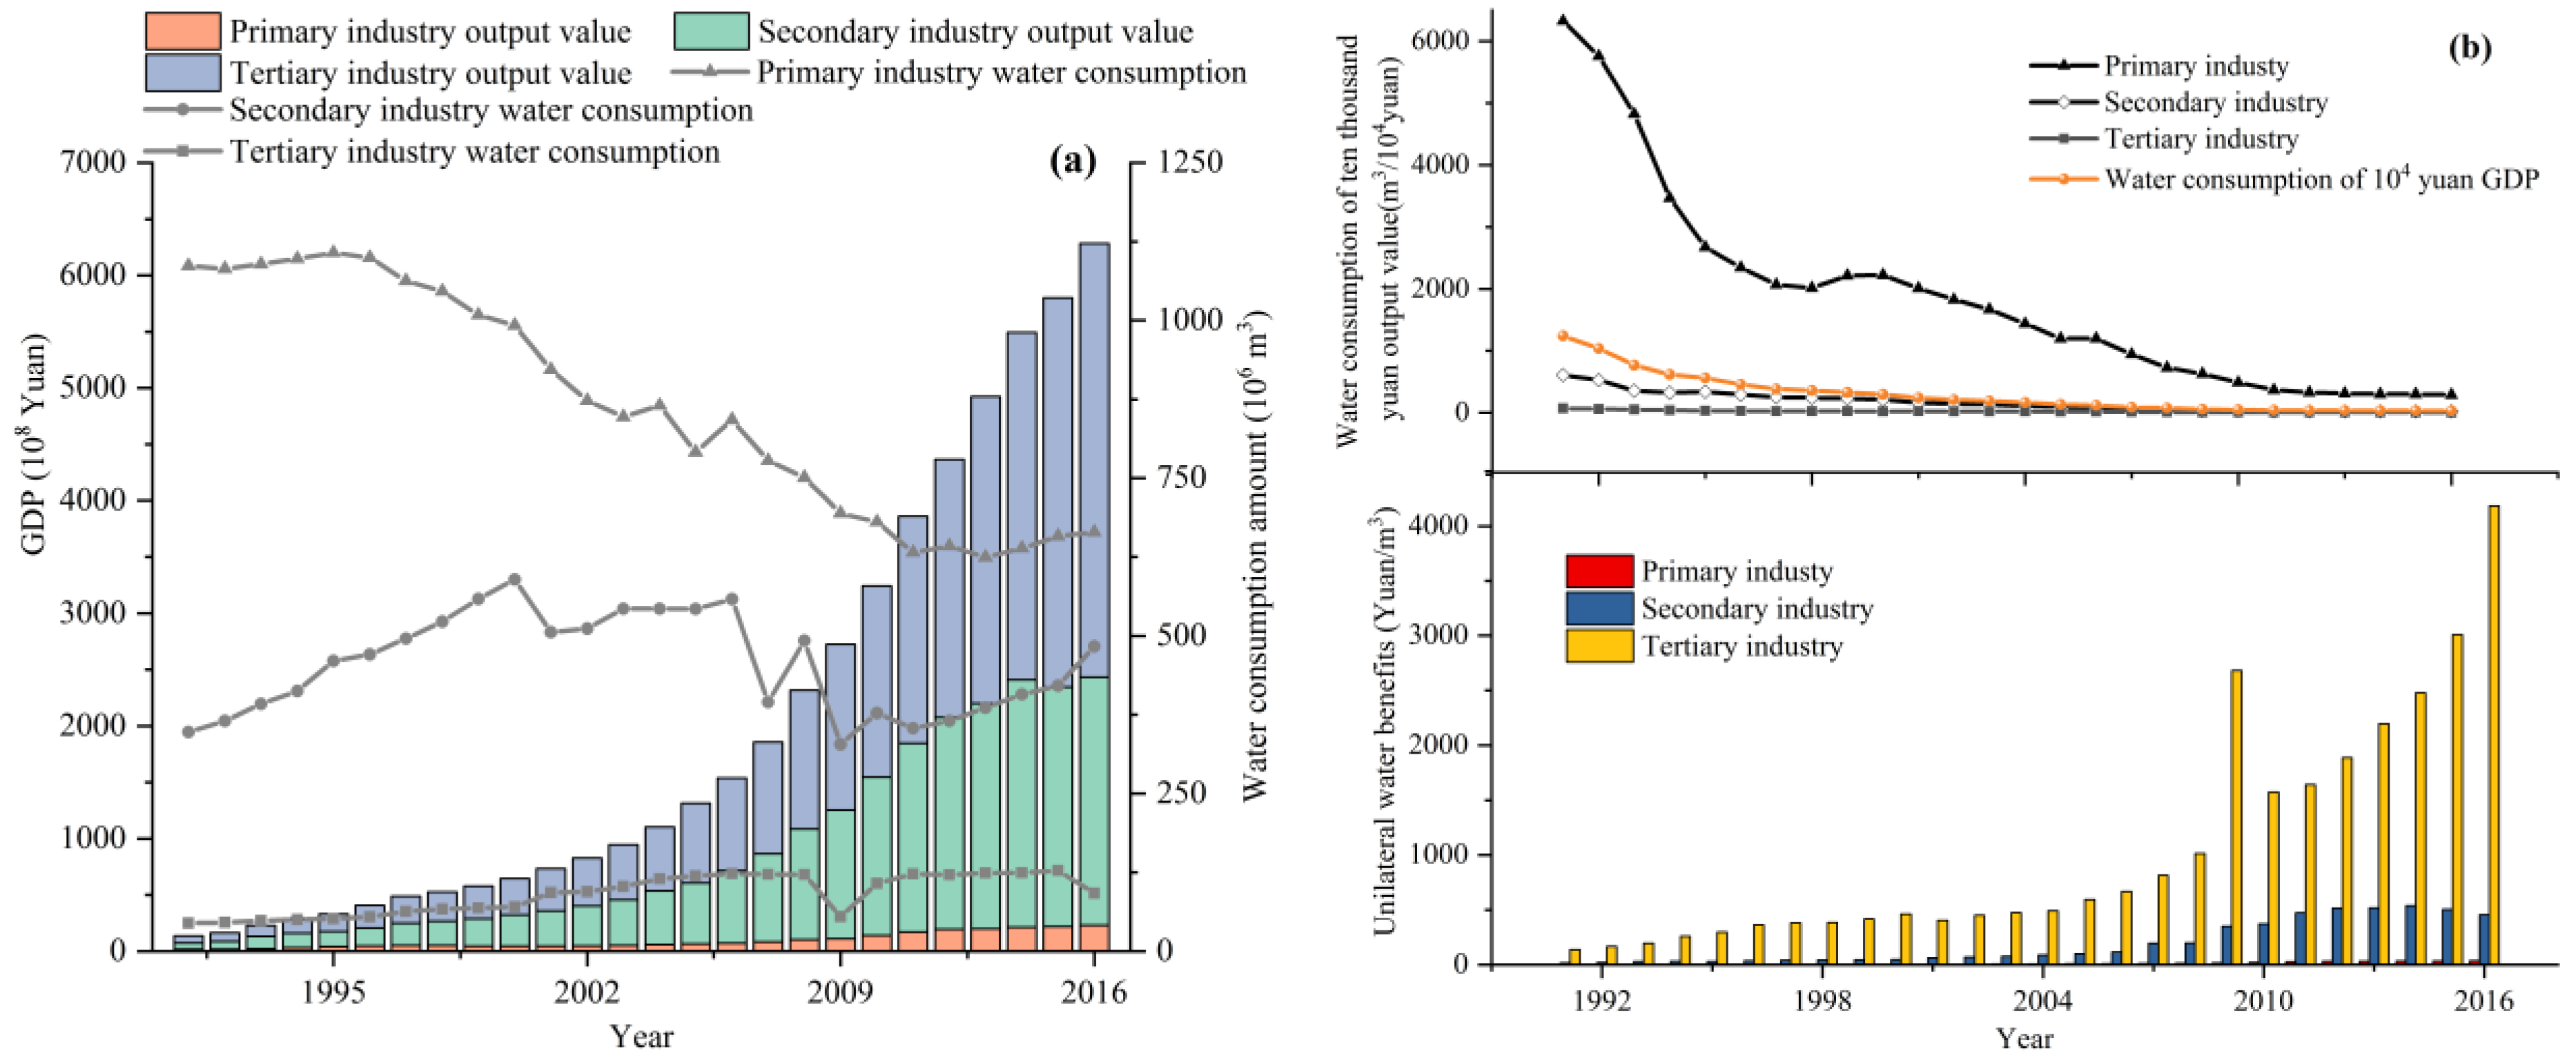
In 2016, the GDP of Xi’an was 628.27 billion yuan, which is 46 times that of 1991, and the average annual growth rate was 16.76%. The proportions of the three industries changed from 11.96:43.04:45.00 in 1991 to 3.69:35.02:61.29 in 2016 (Figure 5a). The total output of the tertiary industry was always the highest and it is gradually increasing. The industrial structure was always of the order, tertiary to secondary to primary, which demonstrates that the economic development of Xi’an is becoming more and more optimized. Ironically, between the three industries (Figure 5a), the primary industry with the lowest annual output had a water consumption far exceeding that of the second and the tertiary industries, which implies that the structure of water sectors in Xi’an still has much room for improvement.
With a higher Ur, the amount of water consumption per ten thousand yuan of GDP changed sharply from 1241.65 to 29.39 m3/104 yuan over 25 years (Figure 5b). Similarly, the amount of water consumption per ten thousand yuan of output for the three industries of Xi’an continued declining, from 6326.43, 609.22, and 71.72 m3/104 yuan in 1991 to only 286.31, 21.96, and 2.39 m3/104 yuan in 2016. However, even though water-saving measures were effectively carried out, there is still room for further water saving. Compared to developed cities of other countries, the water consumption per ten thousand yuan GDP in Japan and the United Kingdom is 10.4 and 15.1 m3/104 yuan, respectively (water conservation planning in Beijing (2006–2020)). The water efficiency of secondary and tertiary industries was relatively high, especially that of the latter. It seems that higher urbanization is conducive to optimizing the allocation of resources and the efficiency of resource utilization; however, at the same time, it will cause the urban water consumption to increase over time. With the lowest water consumption per ten thousand yuan output, the third industry had the highest utilization efficiency. The economic benefit of industrial water was 4182.81 yuan/m3 in 2016, compared to only 139.42 yuan/m3 in 1991, which demonstrates the tremendous improvement in the efficiency of industrial operations of Xi’an as it becomes more and more urbanized.
4.5. Optimal Thresholds for Urbanization
For the three scenarios—natural development type, target-oriented type, and strict constraint type—the multi-objective optimization model was solved using OENSGA-II. Optimal thresholds for the scale of urbanization in Xi’an with scarce water resources are shown in Table 3.
4.5.1. Scheme 1
In Scheme 1, in accordance with the current growth rate and the pattern of population and economic development, the demand for water resources of Xi’an will continue increasing substantially if the existing development mode is maintained. By 2020 and 2030, the level of urbanization rate Xi’an is projected to be 78.2% and 83.1% respectively, while its population will increase to 10.4 million and 12 million respectively, and the corresponding domestic residential water consumption will increase to 5.3 and 6.1 × 10⁸ m3, respectively. Agriculture will remain as the largest water consumption sector. However, arable land will undergo a consistent declining trend, decreasing by 8000 and 16,000 hectares, respectively. The water consumption of the three industries are projected to increase substantially, especially the tertiary industry, whose total amount will be 2.4 times and 3.9 times of the current consumption in 2020 and 2030. It is noted that the growth of ecological water consumption is also significant, which demonstrates that the ecological environment protection policy is effective. Finally, under the natural development type, Xi’an’s GDP will further improve, with the GDP threshold estimated to increase to 1260.3 and 1923.1 billion yuan, respectively, almost twice and three times that of 2016, but at a cost of much higher water consumption and sewage emissions.
However, we should be vigilant that in the light of the master plan of Xi’an city, the estimated currently available water resources are only about 1.894 billion m3, and yet, in 2016, Xi’an’s consumption already reached 1.85 billion m3, or 97.7% of what is available. There are new water supply and water transfer projects under construction so that, by the 2020 and 2030, the amount of water available in Xi’an will be increased to 2.302 and 2.519 billion m3, respectively. According to the natural development type, Xi’an’s usable water quantity is far from sufficient to support the city’s urbanization and industrial development (Table 3). The hindrance of limited water resources to urban development is more obvious under the natural development type.
4.5.2. Scheme 2
According to the government’s target for urbanization and economic growth, by 2020 and 2030, the Ur of Xi’an is projected to be about 79.5% and 82.9%, and the corresponding population will be 10.9 and 12.3 million, respectively. This figure completes the planned Ur of Xi’an, namely 75% in 2020, and 80% in 2030. Compared to 2016, the water consumption for the tertiary industry is projected to increase by 400% in 2020 and 467% in 2030. The proportions of water used in the three industries are projected to change from 35.7:25.9:4.9 in 2016 to 30.8:28.8:9.2 in 2020 and 26.0:32.5:12.0 in 2030. Moreover, agriculture will no longer be a major water sector. To achieve the economic growth target, it seems rational to re-distribute the utilization of water available for Xi’an, such that the tertiary industry with the lowest water consumption will be allocated with more water. By 2020 and 2030, the GDP threshold is projected to increase to 1808.7 and 2074.4 billion yuan, respectively.
Under Scheme 2, the water resources are expected to support more population and economic growth than Scheme 1, theoretically. However, despite utilizing its available water resources at full capacity, the economic growth is projected to slow down from 2020 to 2030, and the Ur rate (82.9%) is lower than that of Scheme 1 (83.1%).
4.5.3. Scheme 3
Scheme 3 represents the implementation of the most stringent water-saving measures under very restrictive water constraints. By implementing effective irrigation practices and various water-saving measures, the agricultural water consumption in Xi’an is projected to fall by 19.7% in 2020 and by 27.3% in 2030. Furthermore, to safeguard food security and agrarian protection policy, the common arable land is expected to only decrease marginally by about 1.7% and 5.2% in 2020 and 2030, respectively. The sewage treatment capacity will be upgraded from 232.7 m3/d in 2016 to 357 m3/d in 2020 and 580 m3/d in 2030, to improve the water quality of treated sewage and to reduce the amount of sewage discharged, in order to achieve the goal of high yield, low consumption, and emission reduction for Xi’an.
Under Scheme 3, the GDP threshold is expected to increase to 1890.3 and 2403.3 billion yuan in 2020 and 2030, respectively. The proportions of water used in the three industries are projected to change to 22.8:26.7:16.4 in 2020 and to 19.0:29.4:19.4 in 2030. Therefore, with the limited amount of water resources available, the rational approach is to allocate water resources more optimally between different water sectors, and, at the same time, economic and social development will continue progressing.
4.5.4. Scheme Comparison
The objectives under the three schemes are drawn in Figure 6 to compare them more evidently. In each scheme, the future years are much more progressive than the current year. Upon comparing Schemes 1–3 (Figure 6), one can observe the significant reduction of Obj 4 (the amount of sewage discharged). Scheme 1 indicates that, even with a significant increase in the number of sewage treatment plants and the improvement of sewage treatment efficiency, the amount of sewage discharged into the environment will still be far from ideal or acceptable. Under Schemes 1–3, only Obj 3 of the four targets is projected to decrease marginally, while other objectives are expected to increase, particularly the GDP. It is noted that the GDP growth will be constrained by the availability of water resources, which will affect the economic development of Xi’an in 2030. Under Scheme 3, the economic threshold of Xi’an is projected to increase to 1890.3 and 2403.3 billion yuan, and the population to 11.0 and 13.9 million, in 2020 and 2030, respectively. Apparently, given its restrictive water constraints, implementing the most stringent water-saving and management measures seems to be the feasible solution for Xi’an.
4.6. Estimation of City Construction Scale
According to the recommendations of the comments on the Xi’an city master plan (2008–2020) and the overall plan of land use in Xi’an (2014), the land area to undergo urban construction per capita should be 110 m2 in 2020 and 100 m2 in 2030. With respect to the projected urban population of Schemes 1–3 for Xi’an, the recommended urban construction areas are shown in Table 4. Achieving such targets means fulfilling the scale of urban construction land area of 960 km2 in 2020 recommended in the master plan of Xi’an city (revised in 2016). To be able to control the scale of urban construction, the most fundamental measure is to control the population, especially the urban population. In other words, rapid urbanization is often the result of a massive increase in urban population. Based on the three schemes, the scale of urban construction is projected to increase by 1–2 times in 2030 compared to 2016. If the urban infrastructure falls behind the influx of urban population, then problems of over-crowding in limited dwelling space and shortages in water availability will emerge. It is a concern worthy of serious consideration for the city of Xi’an.
5. Conclusions
To explore rational thresholds of urbanization with limited water resources is of significance for attaining sustainable development and the economic growth of large cities. With water resources as the primary controlling factor, a multi-objective model was developed to optimize the economic and population growth and social development in a typical arid city, Xi’an of China. The OENSGA-II algorithm based on the OE-strategy was proposed to obtain optimal thresholds of urban development.
The case study of Xi’an indicates that a higher Ur may not necessarily result in more total water consumption, but will result in more GDP, domestic water, tertiary industry water, and ecological water. With limited water resources available, meeting the future water demand in Xi’an will mainly depend on improving the agricultural water efficiency and the increase in water delivered to the tertiary industry. Additionally, there is evidence in Scheme 1 that the availability of water will not be sufficient to sustain the current trend of urban development. Scheme 3 is recommended because, with the implementation of the strictest water resource management, the thresholds of GDP can be extended to 1890.3 and 2403.3 billion yuan, and the population to 11.0 and 13.9 million (corresponding Ur of 79.9% and 85.9%) in 2020 and 2030, respectively. The maximum urban area to be constructed based on the projected population will be 964.81 and 1197.6 km2 in 2020 and 2030, respectively. It will be prudent for Xi’an to practice strict water resource management, and to allocate its water resources among various water sectors effectively and equitably to avoid major water shortage problems in the future.
It can be inferred that investigating the water deficit problems in rapidly urbanizing cities is essential for the economic and social development of large cities and the effective and equitable allocation of future water resources to competing water sectors. Moreover, it is also expected that this study could attract the attention of the urban cities which pertinaciously chase after better economic benefits and blindly expand the urban scale regardless of water scarcity. Moreover, it deserves attention in future studies whether the urban water shortage crisis and water resource distribution are changing under the impacts of climate change, which will require further efforts in future prospects.
Author Contributions
S.L. and N.W. designed the concept and methodology developed in this article and selected the case study, together with the other co-authors; S.L. prepared the initial draft manuscript and analyzed the results under supervision of N.W. and J.X.; R.J. and M.Z. made the final editing and revision work. All authors read and approved the manuscript to submission.
Funding
This study was supported by the National Key Research and Development Program of China (2016YFC0401408), the National Natural Science Foundation of China (41471451, 51509201 and 51679188), and the Ministry of Land and Resources of China public science and technology research funds projects (201411008-2).
Acknowledgments
The authors would like to thank all the teachers and students who participated this study with great cooperation and thank for all the funders for this research.
Conflicts of Interest
The authors declare no conflict of interest.
References
- World Economic Forum. The Global Risks Report 2016, 11th ed.; World Economic Forum: Geneva, Switzerland, 2017; p. 103. Available online: http://www3.weforum.org/docs/GRR/WEF_GRR16.pdf (accessed on 14 January 2016).
- Dos Santos, S.; Adams, E.A.; Neville, G.; Wada, Y.; de Sherbinin, A.; Bernhardt, E.M.; Adamo, S.B. Urban Growth and Water Access in Sub-Saharan Africa: Progress, Challenges, and Emerging Research Directions. Sci. Total Environ. 2017, 607, 497–508. [Google Scholar] [CrossRef] [PubMed]
- McDonald, R.I.; Weber, K.; Padowski, J.; Flörke, M.; Schneider, C.; Green, P.A.; Gleeson, T.; Eckman, S.; Lehner, B.; Balk, D.; et al. Water on an urban planet: Urbanization and the reach of urban water infrastructure. Glob. Environ. Chang. 2014, 27, 96–105. [Google Scholar] [CrossRef] [Green Version]
- Gleick, P.H. Water and conflict: Fresh water resources and international security. Int. Secur. 1993, 18, 79–112. [Google Scholar] [CrossRef]
- Hao, L.; Sun, G.; Liu, Y.; Wan, J.; Qin, M.; Qian, H.; Chen, J. Urbanization dramatically altered the water balances of a paddy field dominated basin in Southern China. Hydrol. Earth Syst. Sci. 2015, 12, 1941–1972. [Google Scholar] [CrossRef]
- Bhaskar, A.S.; Welty, C.; Maxwell, R.M.; Miller, A.J. Untangling the effects of urban development on subsurface storage in Baltimore. Water Resour. Res. 2015, 51, 1158–1181. [Google Scholar] [CrossRef] [Green Version]
- Clifford Holmes, J.K.; Slinger, J.H.; Musango, J.K.; Brent, A.C.; Palmer, C.G. Using system dynamics to explore the water supply and demand dilemmas of a small South African municipality. In Proceedings of the 32nd International Conference of the System Dynamics Society, Delft, The Netherlands, 20–24 July 2014. [Google Scholar]
- Schteingart, M. The environmental problems associated with urban development in Mexico City. Environ. Urban. 1989, 1, 40–50. [Google Scholar] [CrossRef] [Green Version]
- Zheng, C.; Liu, J.; Cao, G.; Kendy, E.; Wang, H.; Jia, Y. Can China cope with its water crisis?—Perspectives from the North China Plain. Groundwater 2010, 48, 350–354. [Google Scholar] [CrossRef] [PubMed]
- Hanjra, M.A.; Qureshi, M.E. Global water crisis and future food security in an era of climate change. Food Policy 2010, 35, 365–377. [Google Scholar] [CrossRef]
- Narula, K.K.; Fishman, R.; Modi, V.; Polycarpou, L. Addressing the Water Crisis in Gujarat, India; Columbia Water Center, Earth Institute, Columbia University: New York, NY, USA, 2011. [Google Scholar]
- Ait-Aoudia, M.N.; Berezowska-Azzag, E. Water resources carrying capacity assessment: The case of Algeria’s capital city. Habitat Int. 2016, 58, 51–58. [Google Scholar] [CrossRef]
- Sudha, M.C.; Ravichandran, S.; Sakthivadivel, R. Water bodies protection index for assessing the sustainability status of lakes under the influence of urbanization: A case study of South Chennai, India. Environ. Dev. Sustain. 2013, 15, 1157–1171. [Google Scholar] [CrossRef]
- Rockaway, T.D.; Coomes, P.A.; Rivard, J.; Kornstein, B. Residential water use trends in North America. J. Am. Water Works Assoc. 2011, 103, 76–89. [Google Scholar] [CrossRef]
- Sun, Y.Z.; Lu, C.X.; Xie, G.D.; Li, N.; Hu, X. The conjunction between urban development and the utilization of water resources in Beijing. Resour. Sci. 2015, 37, 1124–1132. [Google Scholar]
- Derui, Y.; Yimin, H. Research Report on construction of water-saving Society in Xi’an city. Res. Water Conserv. Dev. 2009, 9, 11–15. [Google Scholar]
- Yang, X.M.; Yang, T.B.; Shi, P.J.; Wu, W.J.; Liu, H. Coupling effect of water resources-urbanization composite system in northwest arid region of China: A case of Shiyang River Basin. Arid Land Geogr. 2014, 37, 19–30. [Google Scholar]
- Feng, Z.K.; Niu, W.J.; Cheng, C.T.; Lund, J.R. Optimizing hydropower reservoirs operation via an orthogonal progressive optimality algorithm. J. Water Resour. Plan. Manag. 2018, 144, 04018001. [Google Scholar] [CrossRef]
- Asadi, E.; da Silva, M.G.; Antunes, C.H.; Dias, L.; Glicksman, L. Multi-objective optimization for building retrofit: A model using genetic algorithm and artificial neural network and an application. Energy Build. 2014, 81, 444–456. [Google Scholar] [CrossRef] [Green Version]
- Rajabioun, R. Cuckoo optimization algorithm. Appl. Soft Comput. 2011, 11, 5508–5518. [Google Scholar] [CrossRef]
- Al-Zahrani, M.A.; Abo-Monasar, A. Urban residential water demand prediction based on artificial neural networks and time series models. Water Resour. Manag. 2015, 29, 3651–3662. [Google Scholar] [CrossRef]
- Bashiri-Atrabi, H.; Qaderi, K.; Rheinheimer, D.E.; Sharifi, E. Application of harmony search algorithm to reservoir operation optimization. Water Resour. Manag. 2015, 29, 5729–5748. [Google Scholar] [CrossRef]
- Srinivasan, K.; Kumar, K. Multi-Objective Simulation-Optimization Model for Long-term Reservoir Operation using Piecewise Linear Hedging Rule. Water Resour. Manag. 2018, 32, 1901–1911. [Google Scholar] [CrossRef]
- Deb, K.; Pratap, A.; Agarwal, S.; Meyarivan, T. A fast and elitist multiobjective genetic algorithm NSGA-II. IEEE Trans. Evol. Comput. 2002, 6, 182–197. [Google Scholar] [CrossRef]
- Chen, Y.; Su, S.; Mou, J. Analysis and improvement of the effect of random number on the computational efficiency of genetic algorithm. Aerosp. Comput. 2008, 38, 17. [Google Scholar]
- Xue, L.; Qiu, G. Water resources and water environment problems in Xi’an during the rapid urbanization process. Environ. Dev. 2013, 9, 1–8. [Google Scholar]
- Zhao, J.; Wang, Z. Computable model for carry capacity of two dimensional water resources and its application. J. Hydroelectr. Eng. 2009, 28, 176–180. [Google Scholar]
- Leung, Y.W.; Wang, Y. An orthogonal genetic algorithm with quantization for global numerical optimization. IEEE Trans. Evol. Comput. 2001, 5, 41–53. [Google Scholar] [CrossRef]
- Dai, C.; Wang, Y.; Ye, M.; Xue, X.; Liu, H. An orthogonal evolutionary algorithm with learning automata for multi-objective optimization. IEEE Trans. Cybern. 2016, 46, 3306–3319. [Google Scholar] [CrossRef] [PubMed]
- Feng, H.Y.; Shi, P.J.; Zhou, W.X.; Chen, J.Y.; Zhang, X.B. Threshold Analysis of Urbanization with the Constraint of “Three Red Lines” on Water Resources Management: A Case Study of Zhangye City. J. Nat. Resour. 2018, 33, 287–301. [Google Scholar]
- Kang, Z.; Kang, L.; Zou, X.; Liu, M.; Li, C.; Yang, M.; Li, Y.; Chen, Y.; Zeng, S. A new evolutionary decision theory for many-objective optimization problems. In International Symposium on Intelligence Computation and Applications; Springer: Berlin/Heidelberg, Germany, 2007; pp. 1–11. [Google Scholar]
- Northam, R.M. Urban Geography; John Wiley & Son Inc.: New York, NY, USA, 1975; pp. 53–54. [Google Scholar]
- Wang, X.Q.; Zhang, Y. The allowable exploitation rate of river water resources of the seven major rivers in China. J. Nat. Resour. 2008, 23, 500–506. [Google Scholar]
- Zhang, Z.W.; Yang, D.G.; Zhang, X.L.; Chen, H.J.; Zhang, Y.Q. Correlation between comprehensive urbanization scale and water resource in Urumqi during 1995–2007. J. Desert Res. 2011, 31, 536–542. [Google Scholar]
- Bao, C.; Fang, C.L. Water resources flows related to urbanization in China: Challenges and perspectives for water management and urban development. Water Resour. Manag. 2012, 26, 531–552. [Google Scholar] [CrossRef]
Figure 1.
Location and administrative divisions of the study area.

Figure 2.
Flow chart of non-dominated sorting genetic algorithm (NSGA-II) based on the orthogonal generation method and the E-optimality method (OENSGA-II).
Figure 2.
Flow chart of non-dominated sorting genetic algorithm (NSGA-II) based on the orthogonal generation method and the E-optimality method (OENSGA-II).

Figure 3.
The variations of urbanization rate (Ur), total water consumption, added value of three industries, and gross domestic product (GDP) of Xi’an over time. GDP is the sum of three industrial added values; the data of total water consumption are from 1980 to 2016. The red line represents the Ur value from 1952–2016, and the white line represents the total water consumption from 1980–2016.

Figure 4.
Status of water utilization and consumption of various industries in Xi’an. (a) The changes of water utilization ratio, total water amount, water consumption and groundwater consumption from 1991 to 2016; (b) The proportion of water consumption of five water sectors from 1991 to 2016.
Figure 4.
Status of water utilization and consumption of various industries in Xi’an. (a) The changes of water utilization ratio, total water amount, water consumption and groundwater consumption from 1991 to 2016; (b) The proportion of water consumption of five water sectors from 1991 to 2016.

Figure 5.
Changes in the industrial structure and the water utilization of Xi’an city. (a) illustrates the relationship between the three industrial water consumption and their output value; (b) illustrates the variations of water consumption of ten thousand yuan output value of three industries and GDP and unilateral water benefits of three industries.

Figure 6.
Optimal solutions of multi-objective optimization model in Schemes 1–3. (a–c) illustrates the four objectives of the three schemes respectively.
Figure 6.
Optimal solutions of multi-objective optimization model in Schemes 1–3. (a–c) illustrates the four objectives of the three schemes respectively.


Table 1.
Main control index of water utilization of different industry in Xi’an City.
| Type | Number | Index | Current | 2020 | 2030 | Property |
|---|---|---|---|---|---|---|
| Comprehensive water-saving | 1 | Water use amount (108 m3) | 18.2 | 21.13 | 23.52 | Constraint |
| 2 | Water consumption of 104 yuan gross domestic product (GDP) (m3/104 yuan) | 31.33 | 25 | 20 | Expected | |
| 3 | Leakage rate of pipe net (%) | 11.64 | 10 | 9 | Expected | |
| Agricultural | 4 | Effective utilization coefficient of farmland irrigation water (%) | 0.705 | 0.72 | 0.75 | Constraint |
| 5 | Amount of irrigation water per unit area (m3/ha) | 2440.57 | 2036.76 | 1932.61 | Expected | |
| Industrial | 6 | Water consumption of 104 yuan added industrial value (m3/104 yuan) | 27.31 | 19 | 10 | Constraint |
| 7 | Reuse rate of industrial water (%) | 76 | 80 | 90 | Expected | |
| Living | 8 | Per capita daily water consumption of urban residents (L/day) | 141.89 | 130 | 108.95 | Expected |
| 9 | Prevalence of water-saving appliances (%) | 98 | 98.5 | 99 | Constraint | |
| Environmental | 10 | Water quality compliance rate (%) | 56.3 | 65 | 70 | Constraint |
| 11 | Centralized treatment rate of urban sewage (%) | 95 | 96 | 98 | Expected | |
| 12 | Sewage treatment capacity (m3/d) | 232.7 | 357 | 580 | Expected |
Table 2.
Correlations between urbanization rate (Ur) and GDP in five uses of water and the utilization rate of water resources.
Table 2.
Correlations between urbanization rate (Ur) and GDP in five uses of water and the utilization rate of water resources.
| Type | Average | SD | Pearson | Spearman | Kendall | ||||
|---|---|---|---|---|---|---|---|---|---|
| Cr | p | Cr | p | Cr | p | ||||
| GDP (109 yuan) | 296.8 | 208.2 | 0.79 * | <0.0001 | 1.00 * | <0.0001 | 1.00 | <0.0001 | |
| Water consumed (108 m3) | Domestic water | 3.2 | 1.04 | 0.89 * | <0.0001 | 0.86 * | <0.0001 | 0.77 * | <0.0001 |
| Primary industry | 7.8 | 1.91 | −0.96 * | <0.0001 | −0.89 * | <0.0001 | −0.75 * | <0.0001 | |
| Secondary industry | 4.2 | 0.88 | 0.18 | 0.52 | 0.05 | 0.85 | 0.07 | 0.73 | |
| Tertiary industry | 1.0 | 0.35 | 0.79 * | <0.0001 | 0.60 * | 0.02 | 0.49 * | 0.01 | |
| Ecological | 0.9 | 0.59 | 0.56 * | 0.03 | 0.93 * | <0.0001 | 0.83 * | <0.0001 | |
| Total | 17.2 | 1.10 | −0.13 | 0.64 | −0.05 | 0.87 | 0.03 | 0.88 | |
| Utilization rate of water resources (%) | 73.1 | 4.69 | −0.13 | 0.64 | −0.05 | 0.87 | 0.03 | 0.88 | |
Note: * represents a significant correlation at the 0.05 confidence level; SD stands for the standard deviation; Cr represents the correlation coefficient; p is the p-value.
Table 3.
The optimal thresholds of the urbanization scale of Xi’an in Schemes 1–3.
| Scenarios | 2016 | Scheme 1 | Scheme 2 | Scheme 3 | ||||
|---|---|---|---|---|---|---|---|---|
| Year | 2020 | 2030 | 2020 | 2030 | 2020 | 2030 | ||
| Water consumption (108 m3) | Primary industry | 6.6 | 7.4 | 7.6 | 5.9 | 6.2 | 5.3 | 4.8 |
| Secondary industry | 4.8 | 6.9 | 9.5 | 6.2 | 6.5 | 6.2 | 7.4 | |
| Tertiary industry | 0.9 | 2.2 | 3.5 | 3.6 | 4.2 | 3.8 | 4.9 | |
| Domestic water | 4.1 | 5.3 | 6.1 | 5.2 | 6.1 | 5.5 | 5.4 | |
| Ecological water | 2.0 | 2.2 | 2.5 | 2.2 | 2.2 | 2.4 | 2.7 | |
| Total | 18.5 | 24.0 | 29.2 | 23.1 | 25.2 | 23.1 | 25.2 | |
| Permanent population (million) | Urban | 6.5 | 8.1 | 10.0 | 8.7 | 10.2 | 8.8 | 12.0 |
| Rural | 2.3 | 2.3 | 2.0 | 2.2 | 2.1 | 2.2 | 2.0 | |
| Total | 8.8 | 10.4 | 12.0 | 10.9 | 12.3 | 11.0 | 13.9 | |
| Ur (%) | 73.4 | 78.2 | 83.1 | 79.5 | 82.9 | 79.9 | 85.9 | |
| GDP (billion yuan) | 628.3 | 1260.3 | 1923.1 | 1808.7 | 2074.4 | 1890.3 | 2403.3 | |
| Cultivated land (104 ha) | 23.1 | 22.3 | 21.5 | 22.8 | 22.1 | 22.7 | 21.9 | |
| Sewage discharged (108 m3) | 7.1 | 10.4 | 12.4 | 7.5 | 8.3 | 6.4 | 7.0 | |
Table 4.
The optimal thresholds of urbanization scale of Xi’an in Schemes 1–3.
| Scenarios | Scheme 1 | Scheme 2 | Scheme 3 | |||||
|---|---|---|---|---|---|---|---|---|
| Year | unit | 2016 | 2020 | 2030 | 2020 | 2030 | 2020 | 2030 |
| Urban population | million | 88.32 | 81.23 | 99.77 | 86.8 | 102.1 | 87.71 | 119.76 |
| Construction area | km2 | 553.29 | 893.53 | 997.7 | 954.8 | 1021 | 964.81 | 1197.6 |
© 2018 by the authors. Licensee MDPI, Basel, Switzerland. This article is an open access article distributed under the terms and conditions of the Creative Commons Attribution (CC BY) license (http://creativecommons.org/licenses/by/4.0/).
Share and Cite
MDPI and ACS Style
Liu, S.; Wang, N.; Xie, J.; Jiang, R.; Zhao, M. Optimal Scale of Urbanization with Scarce Water Resources: A Case Study in an Arid and Semi-Arid Area of China. Water 2018, 10, 1602. https://doi.org/10.3390/w10111602
AMA Style
Liu S, Wang N, Xie J, Jiang R, Zhao M. Optimal Scale of Urbanization with Scarce Water Resources: A Case Study in an Arid and Semi-Arid Area of China. Water. 2018; 10(11):1602. https://doi.org/10.3390/w10111602
Chicago/Turabian StyleLiu, Siyuan, Ni Wang, Jiancang Xie, Rengui Jiang, and Menglong Zhao. 2018. "Optimal Scale of Urbanization with Scarce Water Resources: A Case Study in an Arid and Semi-Arid Area of China" Water 10, no. 11: 1602. https://doi.org/10.3390/w10111602
Note that from the first issue of 2016, this journal uses article numbers instead of page numbers. See further details here.