Water Footprint for Pulse, Cereal, and Oilseed Crops in Saskatchewan, Canada
by
 ,
,
Dianyuan Ding
1,2,3,†, 
Ying Zhao
1,2,4,†,
Hui Guo
4,
Xueyan Li
1,*,
Jeff Schoenau
2 and
Bingcheng Si
2,* 1
College of Resources and Environmental Engineering, Ludong University, Yantai 264025, China
2
Department of Soil Science, University of Saskatchewan, Saskatoon, SK S7N 5A8, Canada
3
School of Hydraulic Energy and Power Engineering, Yangzhou University, Yangzhou 225127, China
4
Xinjiang Institute of Ecology and Geography, Chinese Academy of Sciences, Urumqi 830011, China
*
Authors to whom correspondence should be addressed.
†
These authors contributed equally to this work.
Water 2018, 10(11), 1609; https://doi.org/10.3390/w10111609
Submission received: 2 October 2018
/
Revised: 5 November 2018
/
Accepted: 6 November 2018
/
Published: 9 November 2018
(This article belongs to the Special Issue Advances in Agriculture Water Efficiency)
Abstract
:The water footprint (WF) of crop production is a friendly approach for the analysis of water resource consumption in agricultural production systems. This study assessed the inter-annual variability of the total WF of three types of main crops, namely, cereal (i.e., spring wheat and barley), oilseed (i.e., canola and sunflower) and pulse (i.e., lentils and chickpea), from the perspective of yield and protein. It also determined the major factors that influence the WFs in Saskatchewan province of Canada. Over the period of 1965–2014, the annual precipitation in Saskatchewan fluctuated considerably but increased slightly with time. The grain yield-based WF ranged between 1.08 and 1.80, 0.90 and 1.38, 1.71 and 2.58, 1.94 and 4.28, 1.47 and 2.37, and 1.39 and 1.79 m3 kg−1; whereas the protein yield-based WF ranged between 7.69 and 10.44, 8.27 and 16.47, 3.79 and 7.75, 4.86 and 11.17, 5.09 and 7.42, and 5.51 and 10.69 m3 kg−1 for spring wheat, barley, canola, sunflower, lentils, and chickpea, respectively. All the WFs of crops generally decreased with time, which could be attributed to precipitation factors. In addition, the scientific and technological progress and agricultural inputs also evidently influenced the grain yield-based WFs of all crops. Pulse crops had a higher grain yield-based WF (an average of 1.59 m3 kg−1 for pulse crops and 1.18 m3 kg−1 for cereal crops) but a lower protein yield-based WF (an average of 6.58 m3 kg−1 for pulse crops and 9.25 m3 kg−1 for cereal crops) than cereal crops. Under conditions of improved protein consumption and healthy living in the future, pulse crops may be a preferred crop.
1. Introduction
During the past three decades, environmental and economic advantages of crop diversification have promoted a steady increase in the production of alternative oilseeds and pulse crops in northern high-latitude areas such as Northwest Europe [1], Northeast Eurasia and Siberia steppes [2], Northwest China [3], and the Northern Great Plains of North America [4]. The inclusion of oilseed and pulses in the traditional cereal-based cropping systems has been shown to improve nutrient use efficiency [5], overall productivity [6], and economic sustainability [4]. The water consumption for food production is by far the greatest form of societal use of water, and agriculture is the largest user of water at the global level at present [7]. Increasing competition for water resources, coupled with changes in temperature, precipitation, and evapotranspiration (ET), may have significant effect on water use in agriculture production at regional and national scales [8]. As Canada’s leading agri-food exporter to the world, Saskatchewan has 44% of the country’s total cultivated farmland. Evaluation of water resource utilization during agricultural production may become a consideration to improve agricultural water management practices in this region and beyond. In a world with continuously increasing pressure on water resources, concerns over sufficiency of water resources for short- and long-term food security and human welfare have emerged. Moreover, climate change has affected elements of the hydrologic cycle, such as precipitation redistribution, along with surface and groundwater cycling [9].
Intensification and diversification of traditional wheat-fallow cropping systems in the semiarid regions of Canadian prairies can lead to sustainable cropping systems [10]. However, producers need alternative crops to develop sustainable crop rotations [11,12]. The area seeded to pulse and oilseed crops on Canadian prairies has been increasing with the onset of crop diversification initiatives [4]. Increased research and extension support, increased awareness of the sustainability of cropping practices, market changes, and changes in government policies are driving crop diversification in the Northern Great Plains [4]. However, recent reviews on the adaptability of alternate crops highlight the need for additional information on the agronomy and crop water use relationships in this region [13,14,15].
In dry regions, broadleaf crops, including legumes, have been used to replace conventional summer fallow in the past 30 years [3], and its effects on water utilization in comparison to fallow are of interest [16]. The term “legume” refers to the plants whose fruit is enclosed in a pod. Pulses are part of the legume family, however, the term “pulse” refers only to the dried seed or grain and thus pulse crops are considered to represent all grain legumes. Dry peas, lentils, chickpea, and edible bean are common types of pulses in Western Canada. Similar to all legumes, pulses are nitrogen-fixing crops that improve the environmental sustainability of annual cropping systems by reducing the need for chemical fertilizers and enhancing soil quality [17,18]. The inclusion of annual pulses further reduces nitrate leaching, and increases wheat grain protein concentration compared with wheat monoculture grown annually, thereby improving economic returns to producers, diversifying and lengthening crop rotations and reducing the requirement for nitrogen fertilizer. Although those findings have assisted Canadian producers in identifying cropping systems that produce safe and nutritious food and conserve soil quality, information on the amount of water utilized is lacking.
Water stress is the most important factor limiting crop production in semiarid prairies [19]. Increasing cropping intensity in the region implies a reduction in fallow area [4], which results in less frequent recharge of the soil moisture profile. For example, in 2010, of the 7.2 million acres of pulses grown in Canada, only 0.7% of the pulse area was irrigated. Thus, reliance on low and erratically distributed rainfall for crop production is increasing [20,21]. Understanding seed yield responses of alternate crops to a range of water regimes and to establishing water use seed yield relationships over a range of environments are important to reduce the risk of extended rotations without fallow. In Saskatchewan, results from a long-term study at Swift Current established lentil as a viable crop for semiarid prairies [10]. Other studies have also identified pea and chickpea as suitable potential pulse crops, especially with stubble cropping, for the region [22,23]. Angadi et al. compared the yield and water use efficiency (WUE) for three pulses (i.e., chickpea, lentil, and pea), two oilseed crops (i.e., canola and mustard), and one cereal crop (i.e., wheat) under three moisture conditions (i.e., drought, normal rainfall, and irrigation) over four years [24]. Of the crops studied, wheat and pea had the highest yields and highest WUE, whereas pea used the least amount of water. Chickpea and lentil produced good yields even when water was limited. Consequently, Angadi et al. concluded that pulse crops such as lentil (Lens culinaris L.) and chickpea (Cicer arietinum L.) are well adapted to the semiarid conditions of Canadian prairies with the high-potential production. Pulse crops use less water and can tolerate drought stress better than wheat or canola. They also use water differently compared with other crops grown in rotation, thereby extracting water from a shallower depth and leaving more water deep in the soil for the following year’s cereal or oilseed crops. Among oilseeds, mustard was reported to be more tolerant to heat and water stress (drought) in comparison with canola. Furthermore, Gan et al. showed that yield and protein content increased when durum was grown after pulses or oilseeds rather than spring wheat but was highest after pulses [25].
This study hypothesizes that oilseed and pulse crops have water use characteristics different from cereals and that water distribution patterns in soil profile under oilseed and pulses may be interactively influenced by water availability under the semiarid environment of the Northern Great Plains of North America. To best evaluate water resource utilization, appropriate statistical methods, along with suitable spatial and temporal scales must be used. In previous relevant studies, WUE and irrigation efficiency (IE) have been used to evaluate the effectiveness of crop water management practices [26,27]. However, both indices have disadvantages. Particularly, WUE is incomparable among different locations due to its crop-dependent characteristics, and the precipitation and crop yield are not considered in the IE. Given the large land mass and climatic variability in Saskatchewan, Canada, a comprehensive WUE measure is needed. The water footprint (WF), a relatively new index, is a comprehensive indicator that can capture water utilization influence in cropping systems effectively [28,29,30]. It is defined as the volume of water used to produce a particular good, measured at the point of production. This good may be yield, protein, calories, or some other measurement of output. The concept of WF has been used at global, national and regional scales from the perspective of crop production and water consumption [8,31,32,33]. For example, Sun et al. evaluated the WF of wheat, maize, and rice at the regional scale in China and assessed the water-saving benefits of virtual water flows related to the effective transfer of the three crops between regions [34].
Previous studies on WF are mainly based on crop yield [30,31,35]. Although yield is a comprehensive index for assessing productivity, it may underestimate the contribution of some crops, such as pulse crops with relatively low yield but high protein contents. Pulses are important protein amendment in people’s daily diet in many countries because proteins perform a vast array of functions within living organisms. Therefore, the WF based on the protein content in grains should also be compared with that based on crop whole-grain yield among different crops. The objectives of the present study are as follows: (1) to calculate yield- and protein-based WF for the three types of main crops (i.e., cereal, oilseed, and pulse) produced in Saskatchewan Province from 1965 to 2014; (2) to identify the major influencing factors on WFs; and (3) to demonstrate the benefits of using diversified cropping systems in decreasing WF and assess strategies for WF.
2. Materials and Methods
2.1. Study Area
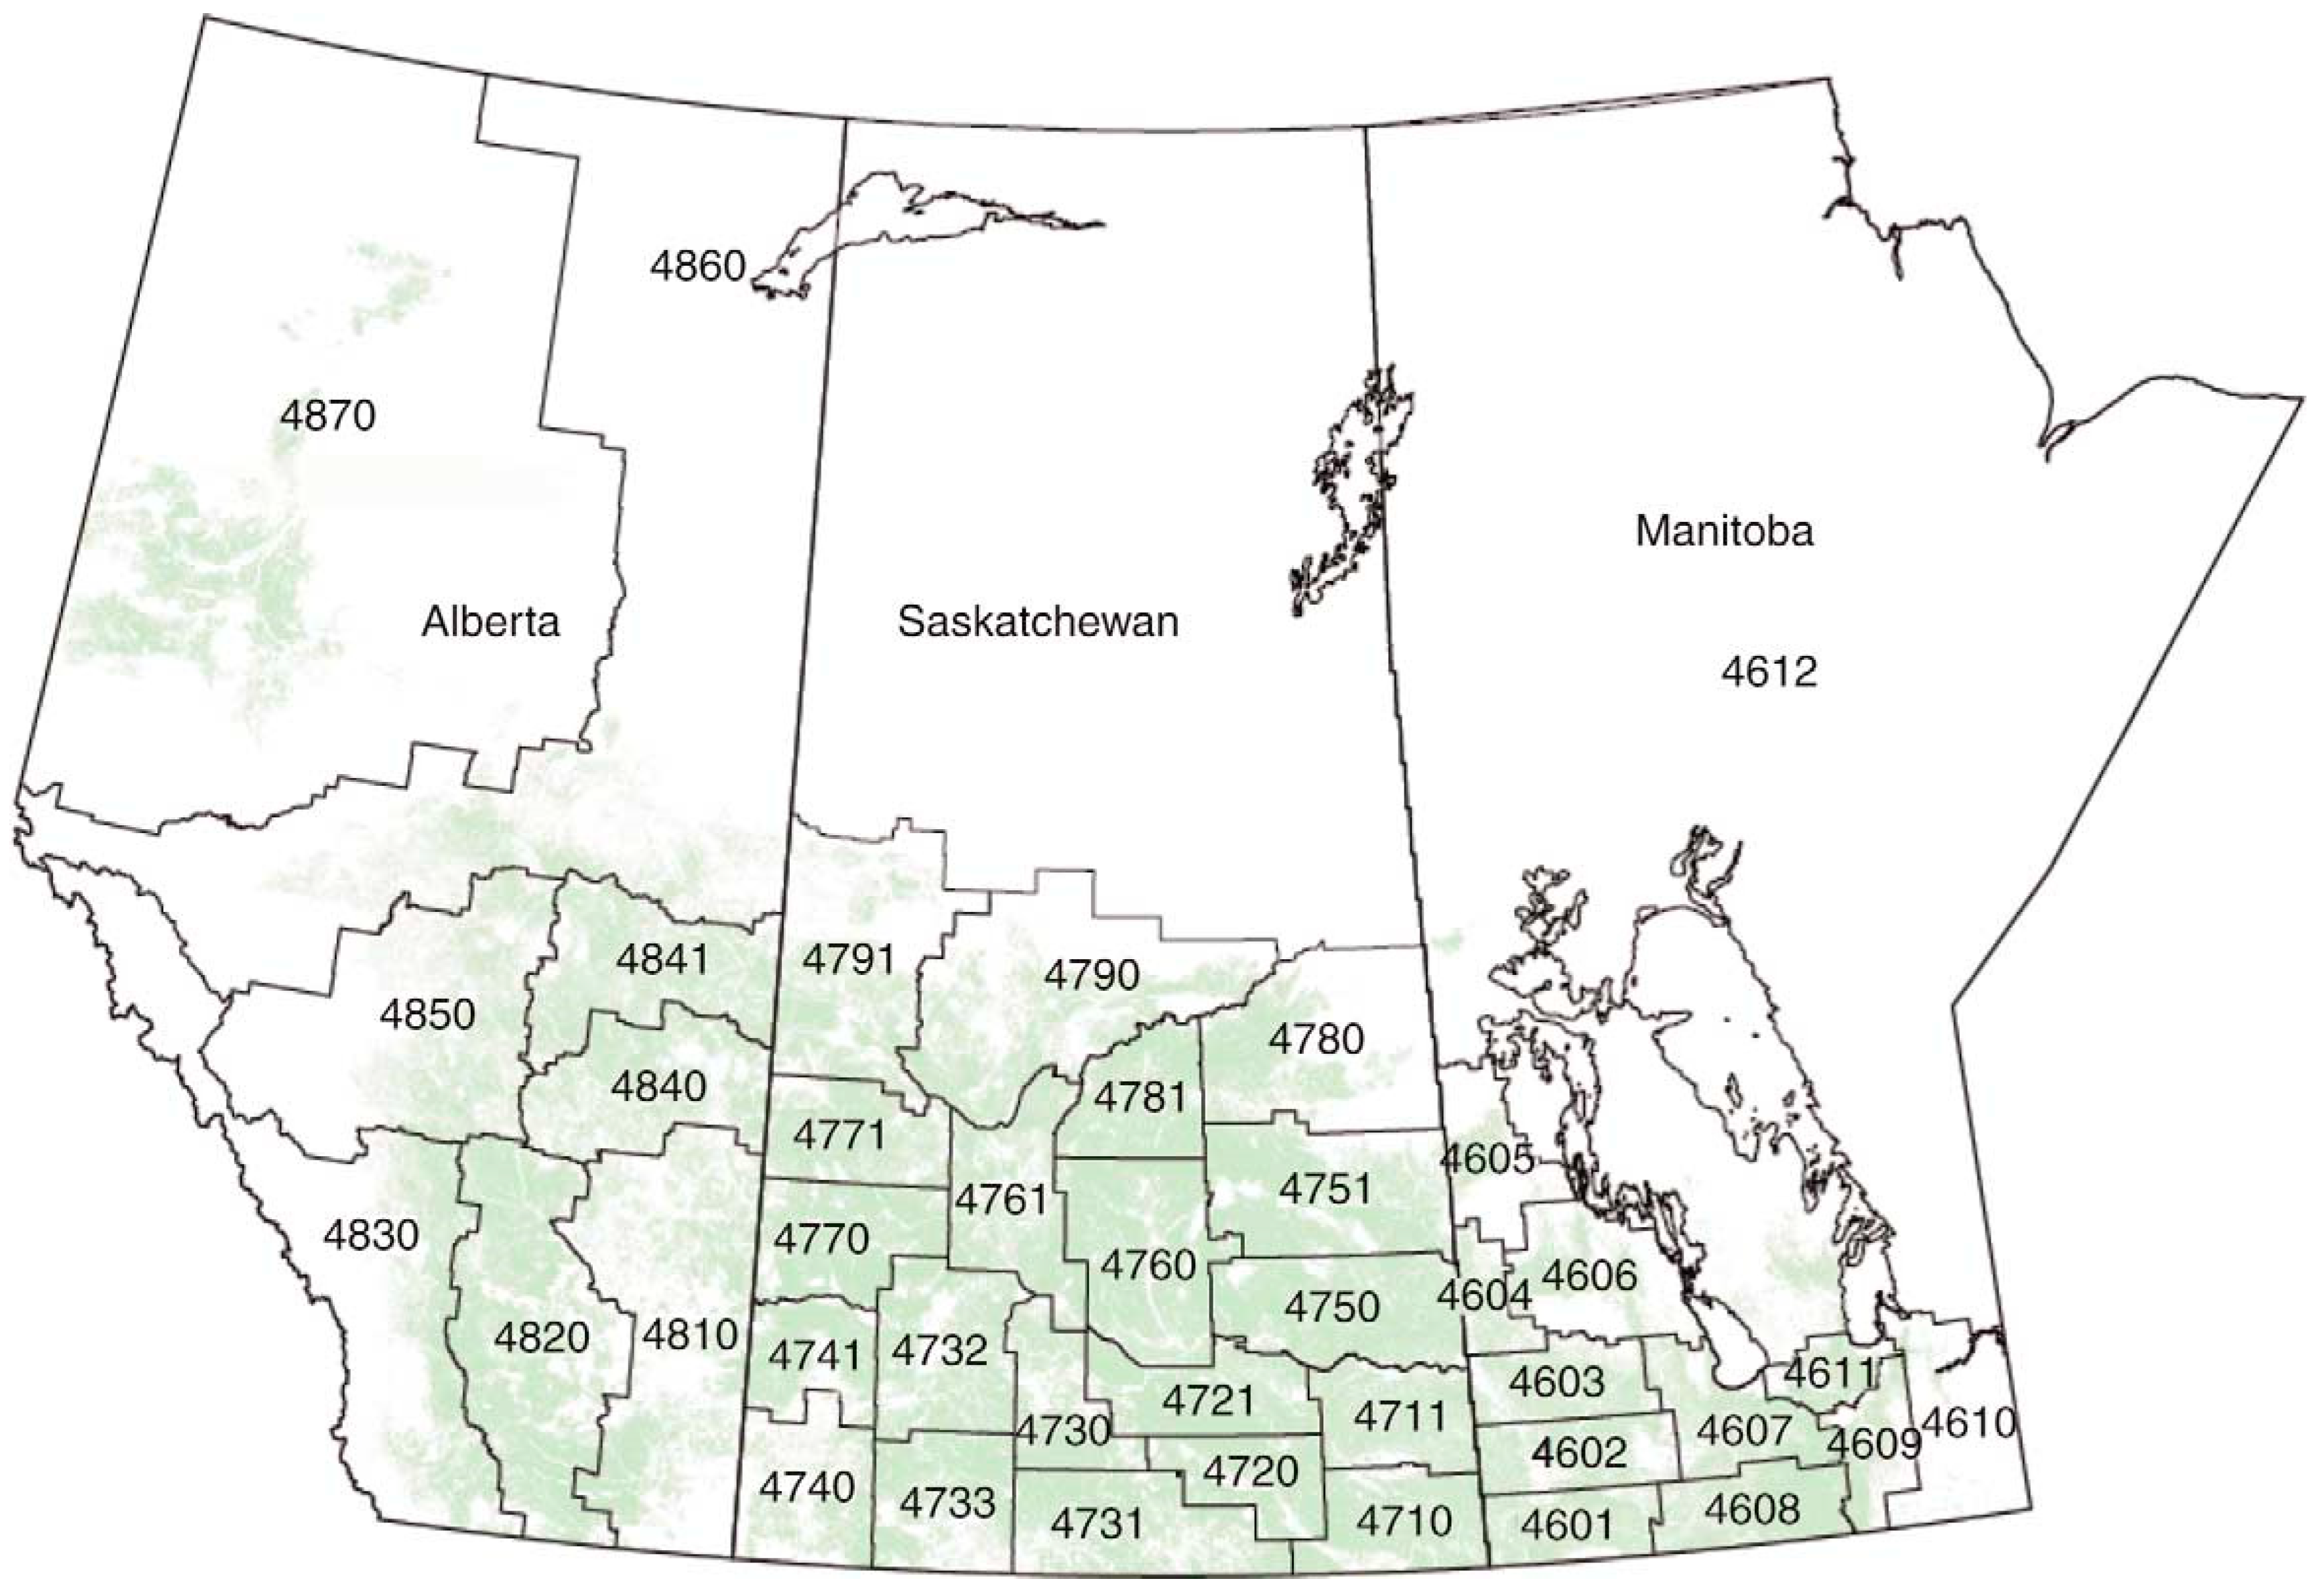
Saskatchewan is located between Alberta and Manitoba, in Western Canada. Its climate is characterized by warm, dry summers and cold, dry winters. The long-term annual mean air temperature is 2.6 °C and precipitation (rainfall + snow) is 432 mm based on the historical weather data. Similar to most mid-latitude continental climate zones, the majority (2/3) of precipitation is obtained from summer rainfall (May to September, inclusive). Given the cold winter, the melting of the accumulated snow pack in spring is also an important factor in recharging soil profiles with water for the following growing season. In a cultivated area, a gradual increase is observed in the availability of moisture from the dry southwest to the more humid northeast. Study areas are shown in Figure 1. There are 20 crop districts from NO.4710 to NO.4791 and they are used to collect the agricultural production data (e.g., acreage, yield and so on).
2.2. Data Description
Data were available from 1965 to 2014, which provided a maximum of coupled weather-yield record of 50 years. Each crop district within the province was considered as one sample, providing a total of 700 samples for the analysis. Many other relevant variables, such as soil moisture or type, were not considered because data at this level of detail is unavailable, thereby generally limiting the analysis to meteorological station data. Six crops (i.e., two cereals, two oilseeds, and two pulses; Table 1) were used for the analysis.
Three categories of data were available as follows: meteorological (https://www.canada.ca/en/services/environment/weather/data-research.html), agricultural, and socio-economic (https://www150.statcan.gc.ca/n1//en/type/data?MM=1), which were collected from provincial and national government websites and other government documents (http://www.saskatchewan.ca; http://www.agriculture.gov.sk.ca/crop-report). Depending on the source, the resolution of the data varied in this study. However, all the data could potentially be aggregated or disaggregated into the 20 crop district scale. The current investigation was mainly focused on the total water footprint trend among several individual crops; thus, the data were initially analyzed on a provincial scale, the results of which are reported in this study.
- (1)
- Meteorological data include monthly maximum, minimum and average temperature, relative humidity, precipitation, wind speed, and sunshine hours.
- (2)
- Agricultural data include crop type (e.g., pulses, cereals, and oilseeds), crop yield, crop kernel protein content (mean and ranges of protein contents where available for a crop), seeded area and date, harvest date, soil type, groundwater, tillage and rotation type, rain-fed or irrigated land, and agricultural inputs (e.g., fertilizer, pesticide, machinery power, and irrigation amount). Specifically, crop data were obtained and referenced to CROPWAT standardized crop database according to Allen et al. and several FAO publications [36,37].
- (3)
- Socio-economic data include crop input expenses for farms and sales to farms, population, labor, prices of crops (retail and wholesale), crop export and imports, and crop consumption per capita.
2.3. CROPWAT Model
The CROPWAT 8.0 model was used to calculate the WFs. It is a decision support tool developed by the Land and Water Development Division of FAO [38]. It can be used to calculate crop ET and irrigation requirements (IRs) based on soil, meteorological, and crop data. Moreover, this model can be used to make the irrigation schedules under different field management conditions and establish water supply schemes for different crop patterns [38]. The CROPWAT model uses the FAO Penman–Monteith equation for calculating reference crop ET, which then calculates the crop water requirement (CWR) of different crop types on the basis of the following assumptions:
- (1)
- Crops are planted under optimum soil water conditions, and the crop develops without shortage of soil water.
- (2)
- Crop ET under standard conditions is the ET from disease-free, well-fertilized crops grown in large fields with 100% coverage.
- (3)
- Crop coefficients are selected depending on the single crop per year coefficient approach. In the crop directory of the CROPWAT package, sets of crop parameters are available for different crops. The crop parameters used as input data to CROPWAT are the crop coefficients in different crop development stages (i.e., initial, middle and late stage), the length of each crop in each development stage, the root depth and the planting date (Table 1).
IR or additional water supply from the surface and ground (blue water) includes water received before the growing period, such as infiltrated snow melt water that has transitioned to the growing period. Consequently, blue WF covers the water entering into and replenishing the stored soil moisture reserve before seeding. Meanwhile, the CROPWAT 8.0 model calculates the ET for the crop that is assumed to grow without water stress, which may not be the case at all times, thereby overestimating the water consumption [39]. The calculated values can also be seen as conservative, because they exclude inevitable losses (e.g., during transport and application of water) and required losses, such as drainage. The calculated CWRs differ considerably over the specific crops, which is mainly due to the differences in crop coefficients.
2.4. WF Calculation Methodology
2.4.1. Calculation of the WF
Following Hoekstra and Chapagain and Hoekstra et al. [40,41], the WF (m3 of water per kg−1 of crop) for crop type i (WFi), is calculated as [42,43]:
where is the water consumption during the growing period of crop i (m3 ha−1), is the yield (for grain yield-based WF) or protein amount (for protein yield-based WF) of crop i (kg ha−1), and is the ET during the growing period of crop i (mm); the factor 10 is the conversion coefficient that converts water depth (mm) into water volume (m3). Protein amount is calculated by multiplying the crop grain yield (kg ha−1) and protein content (kg kg−1). Protein contents for a crop changed with time and space; thus, spatiotemporal dependent protein data were used in this study.
The actual crop ET (ETa, mm/day) depends on climate parameters (that determine the potential ET), crop characteristics, and soil water availability, as shown as follows [36].
where is the crop coefficient, is a dimensionless transpiration reduction factor dependent on available soil water and the reference evapotranspiration (mm day−1). The crop coefficient varies in time, as a function of the plant growth stage, can be estimated with the CROPWAT model. During the initial and mid-season stages of the crop development, is a constant and equals and , respectively. During the crop development and late season stages, varies linearly and linear interpolation is applied for days within the development and late growing seasons.
Theoretically, the value of Ks is calculated on a daily basis as a function of the maximum and actual available soil moisture in the root zone. However, the information on soil water status is generally scarce and variable. Such information is also unavailable for long-term and larger-scaled analyses. To account for the effects of water stress, we employed a linear relationship between yield and the crop ET proposed by Doorenbos and Kassam (1979) [44]:
where is a yield response factor (water stress coefficient), is the actual harvested yield (kg ha−1), is the maximum yield (kg ha−1), is the actual crop evapotranspiration in mm/period, and CWR is the crop water requirement in mm/period (which is equal to Kc × ET0). The values for individual periods and the complete growing period are given in [44] and are set in the current study as 1.15 for spring wheat or barley in the whole growing period.
On the basis of the above-mentioned equation, the values of CWR, ETa and required to estimate the WF in wheat production were calculated following the method and assumptions provided by Allen et al. for the case of crop growth under non-optimal conditions [36]. From the perspective of field water balance in dry and flat areas, the difference between ETa and effective rainfall during the crop growth period could be equated to soil water storage change. In dryland agriculture, the initial soil water storage during the seeding period performs a major function in plant water use. In Saskatchewan, which is a northern prairie environment, the irrigated land area is considerably small relative to the dryland area. Hence, the contribution of soil water storage change is considered to be around a third of the annual precipitation from the snowmelt water. Snowmelt occurs largely in spring and thus contributes to the soil water needed to satisfy the crop water demands during the growing season. In using the approach described in this section, only the consumptive soil water use of crops on the field is considered. Hence, the losses of snowmelt water via runoff from the field are excluded. Similarly, IR, which is determined on the basis of root zone depletion, may be calculated by the difference between the CWR and the effective rainfall during the crop growth period. In this way, the irrigation amount is assumed to satisfy the blue water requirement during the crop growing season for an optimum condition and is therefore used to assess irrigation if it is applicable.
2.4.2. Analysis of Influencing Factors
The WF reflects the crop water consumption, which can be influenced by climatic factors (e.g., precipitation and temperature), agricultural inputs (e.g., application of agricultural machinery, chemical fertilizer, irrigation, labor, and water saving technology), scientific and technological progress (e.g., new crop cultivars and improved tillage and agronomic management), and crop grain price (or food price index) [45,46]. In this study, the annual precipitation, seasonal precipitation (crop growing season), average daily temperature, agricultural inputs, agricultural product price (or food price index), and scientific and technological advancement (i.e., progress index) were regarded as the main potential factors influencing crop WFs. The scientific and technological advancement component involves many diverse factors. To simplify the analysis, we assumed that this component was proportional to yield at a relatively stationary stage, the duration of which was supposed to be one decade. That is, one significant scientific and technological advancement event in agriculture happens every decade. Scientific and technological progress could be reflected by the progress index, i.e., the ratio of the average grain yield of a decade to the average grain yield of the first decade.
To ascertain the dominant factor, we performed path coefficient analyses and consequently identified the relationship between the WFs and the impact factors (data were normalized). Path analysis is a straightforward extension of multiple regressions. It aims to provide estimates of the magnitude and significance of hypothesized causal connections between sets of variables. Path analysis could also be used to determine the influence of independent factors on dependent factors [43] and calculate simple correlations between pairs of independent factors [47,48]. In this study, WFi was selected as the dependent variable, and the above influencing factors of crop WFs were selected as independent variables.
3. Results and Discussion
3.1. Temporal Variations of Effective Precipitation, CWR, and IR
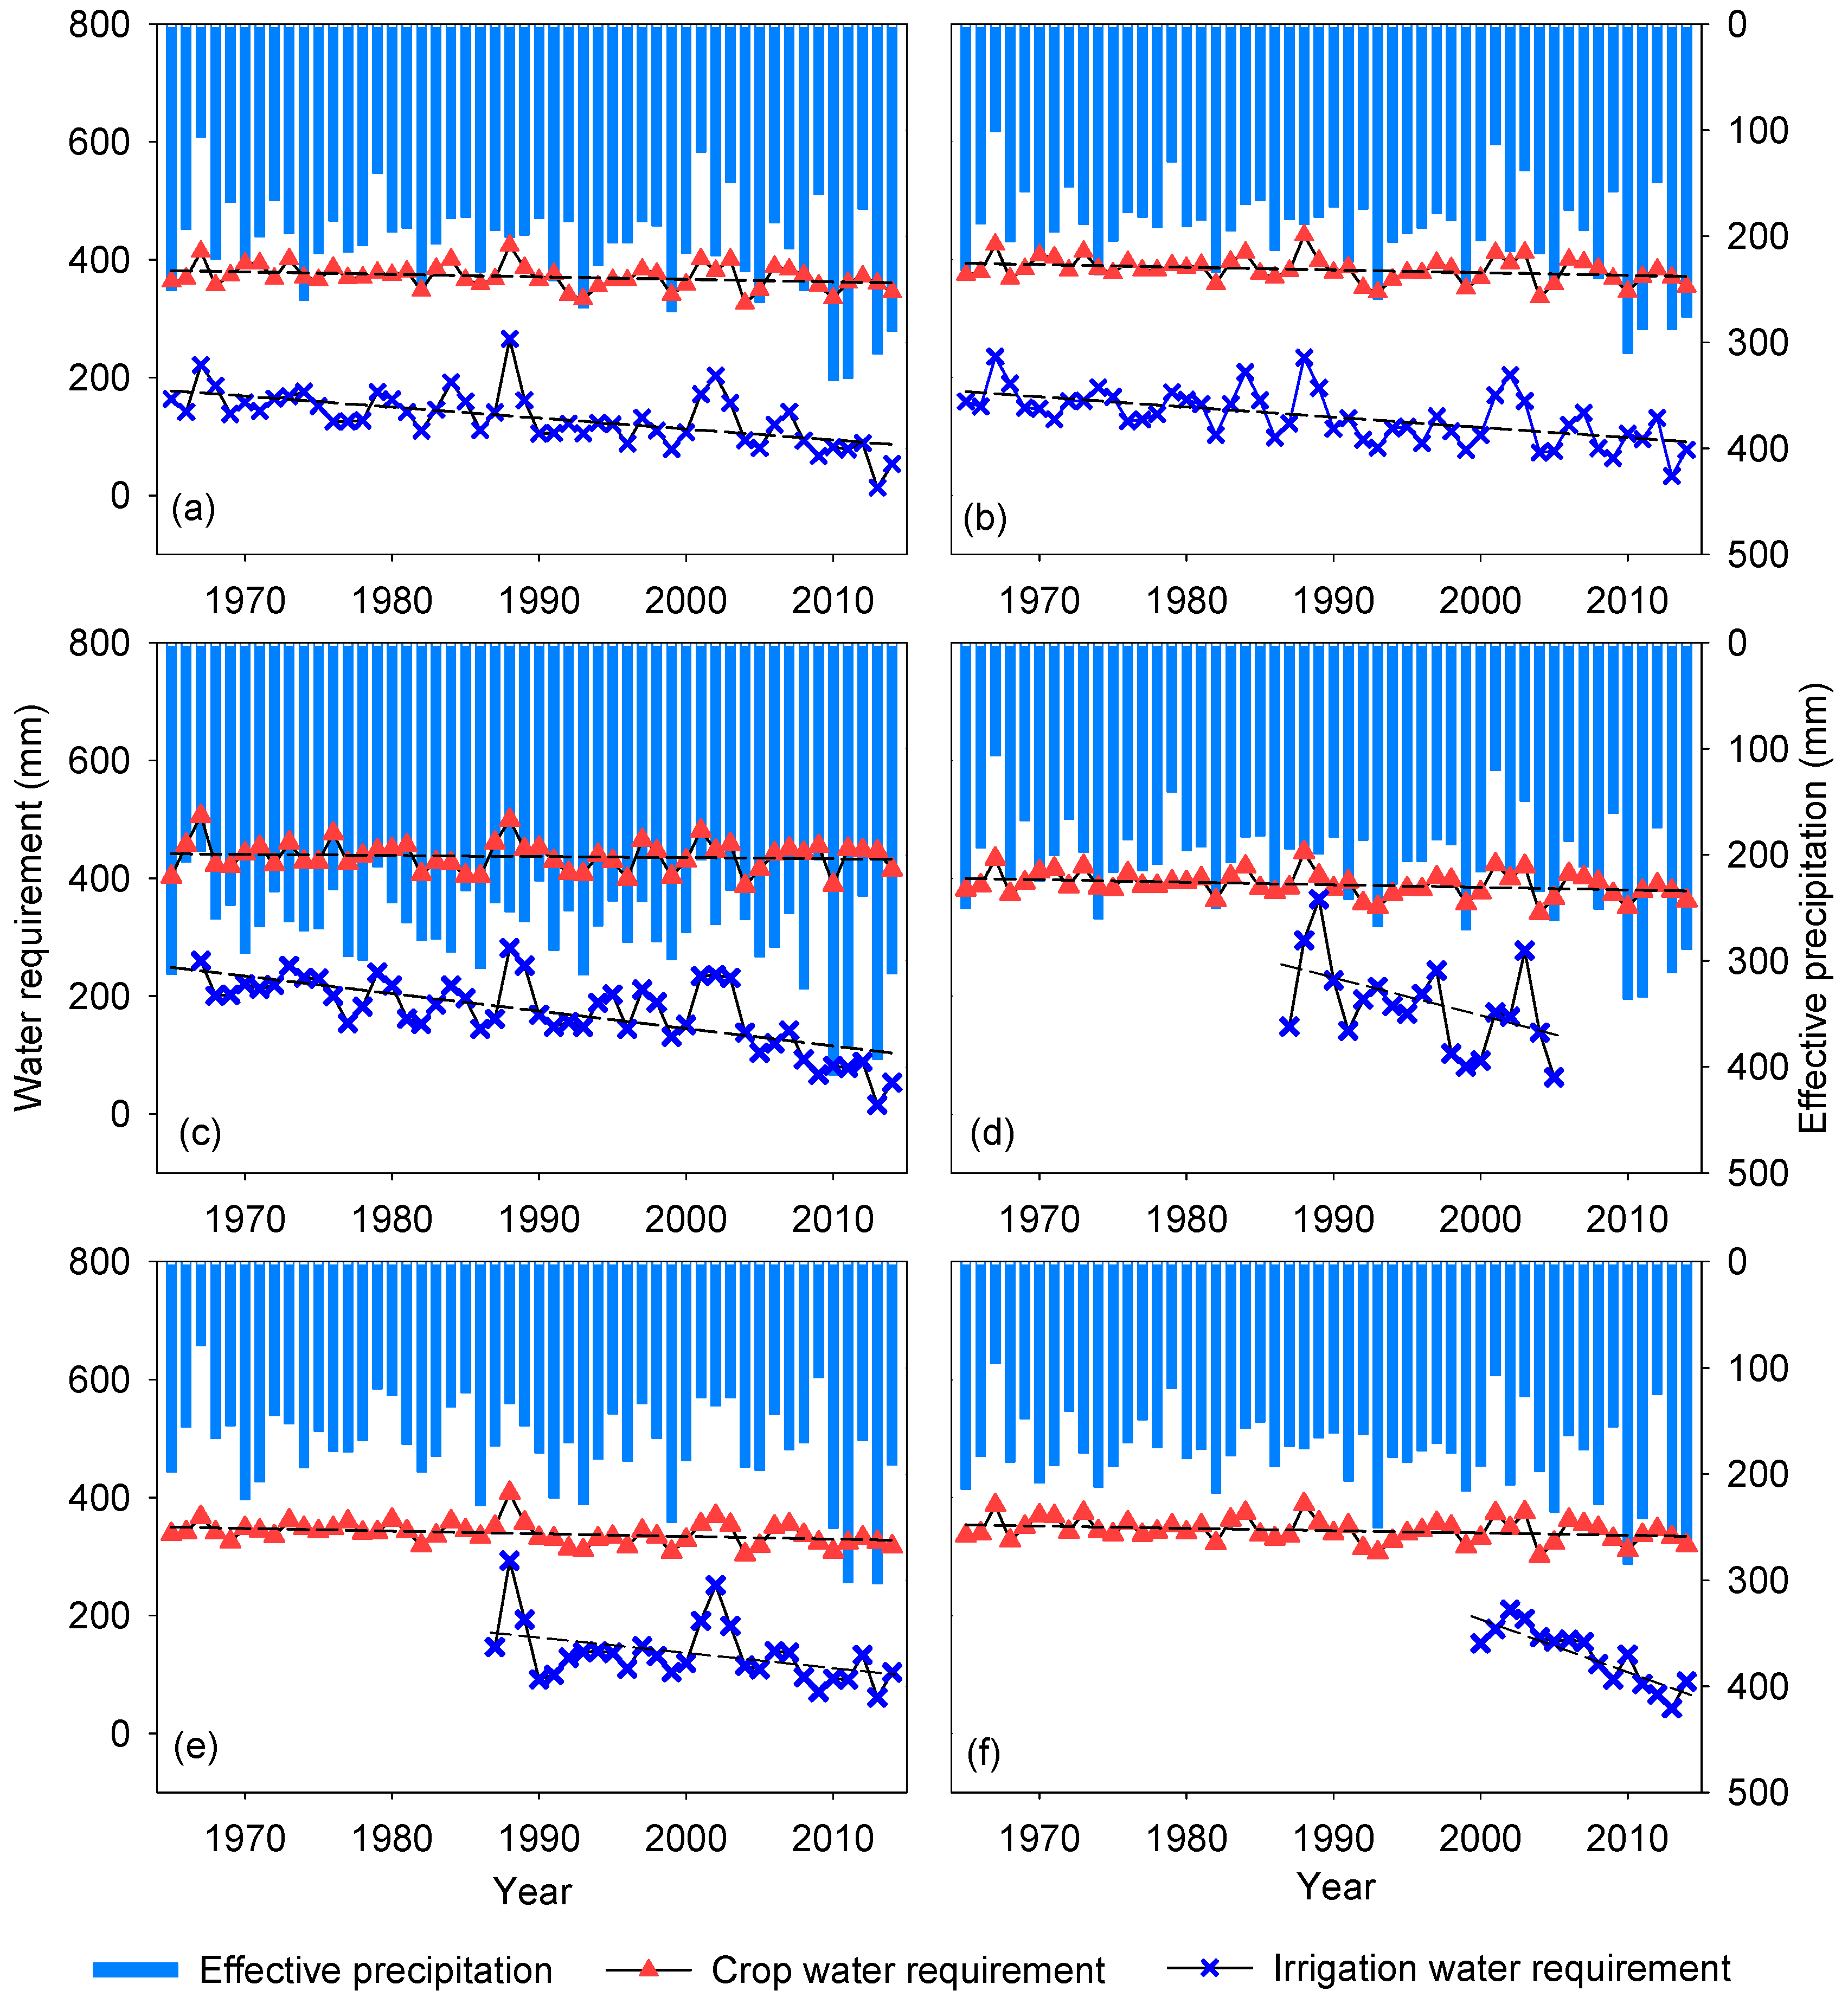
From 1964 to 2014, the mean CWRs were 371.1, 382.8, 437.2, 389.4, 339.1, and 344.4 mm, and all the CWR values showed a decreasing trend with 4.6, 4.3, 1.8, 4.3, 4.5, and 3.9 mm decade−1 for spring wheat, barley, canola, sunflower, lentil, and chickpea, respectively (Figure 2). In line with a slight increase in annual precipitation, the effective precipitations during crop growing seasons increased at rates of 12.3, 9.9, 10.7, 11.2, 8.0, and 8.5 mm decade−1 for spring wheat, barley, canola, sunflower, lentil, and chickpea, respectively. As a result of the increasing effective precipitation, the crop IRs showed reduction trends with 18.6, 17.4, 29.6, 66.0, 26.2, and 111.3 mm decade−1 for spring wheat, barley, canola, sunflower, lentil, and chickpea, respectively, during their planting years (Figure 2). The increasing effective precipitation significantly reduced the crop IRs. The large decreasing rates for sunflower and chickpea may be attributed to the greatly increased annual precipitation in the recent two decades.
3.2. Crop Yields and Seeding Area
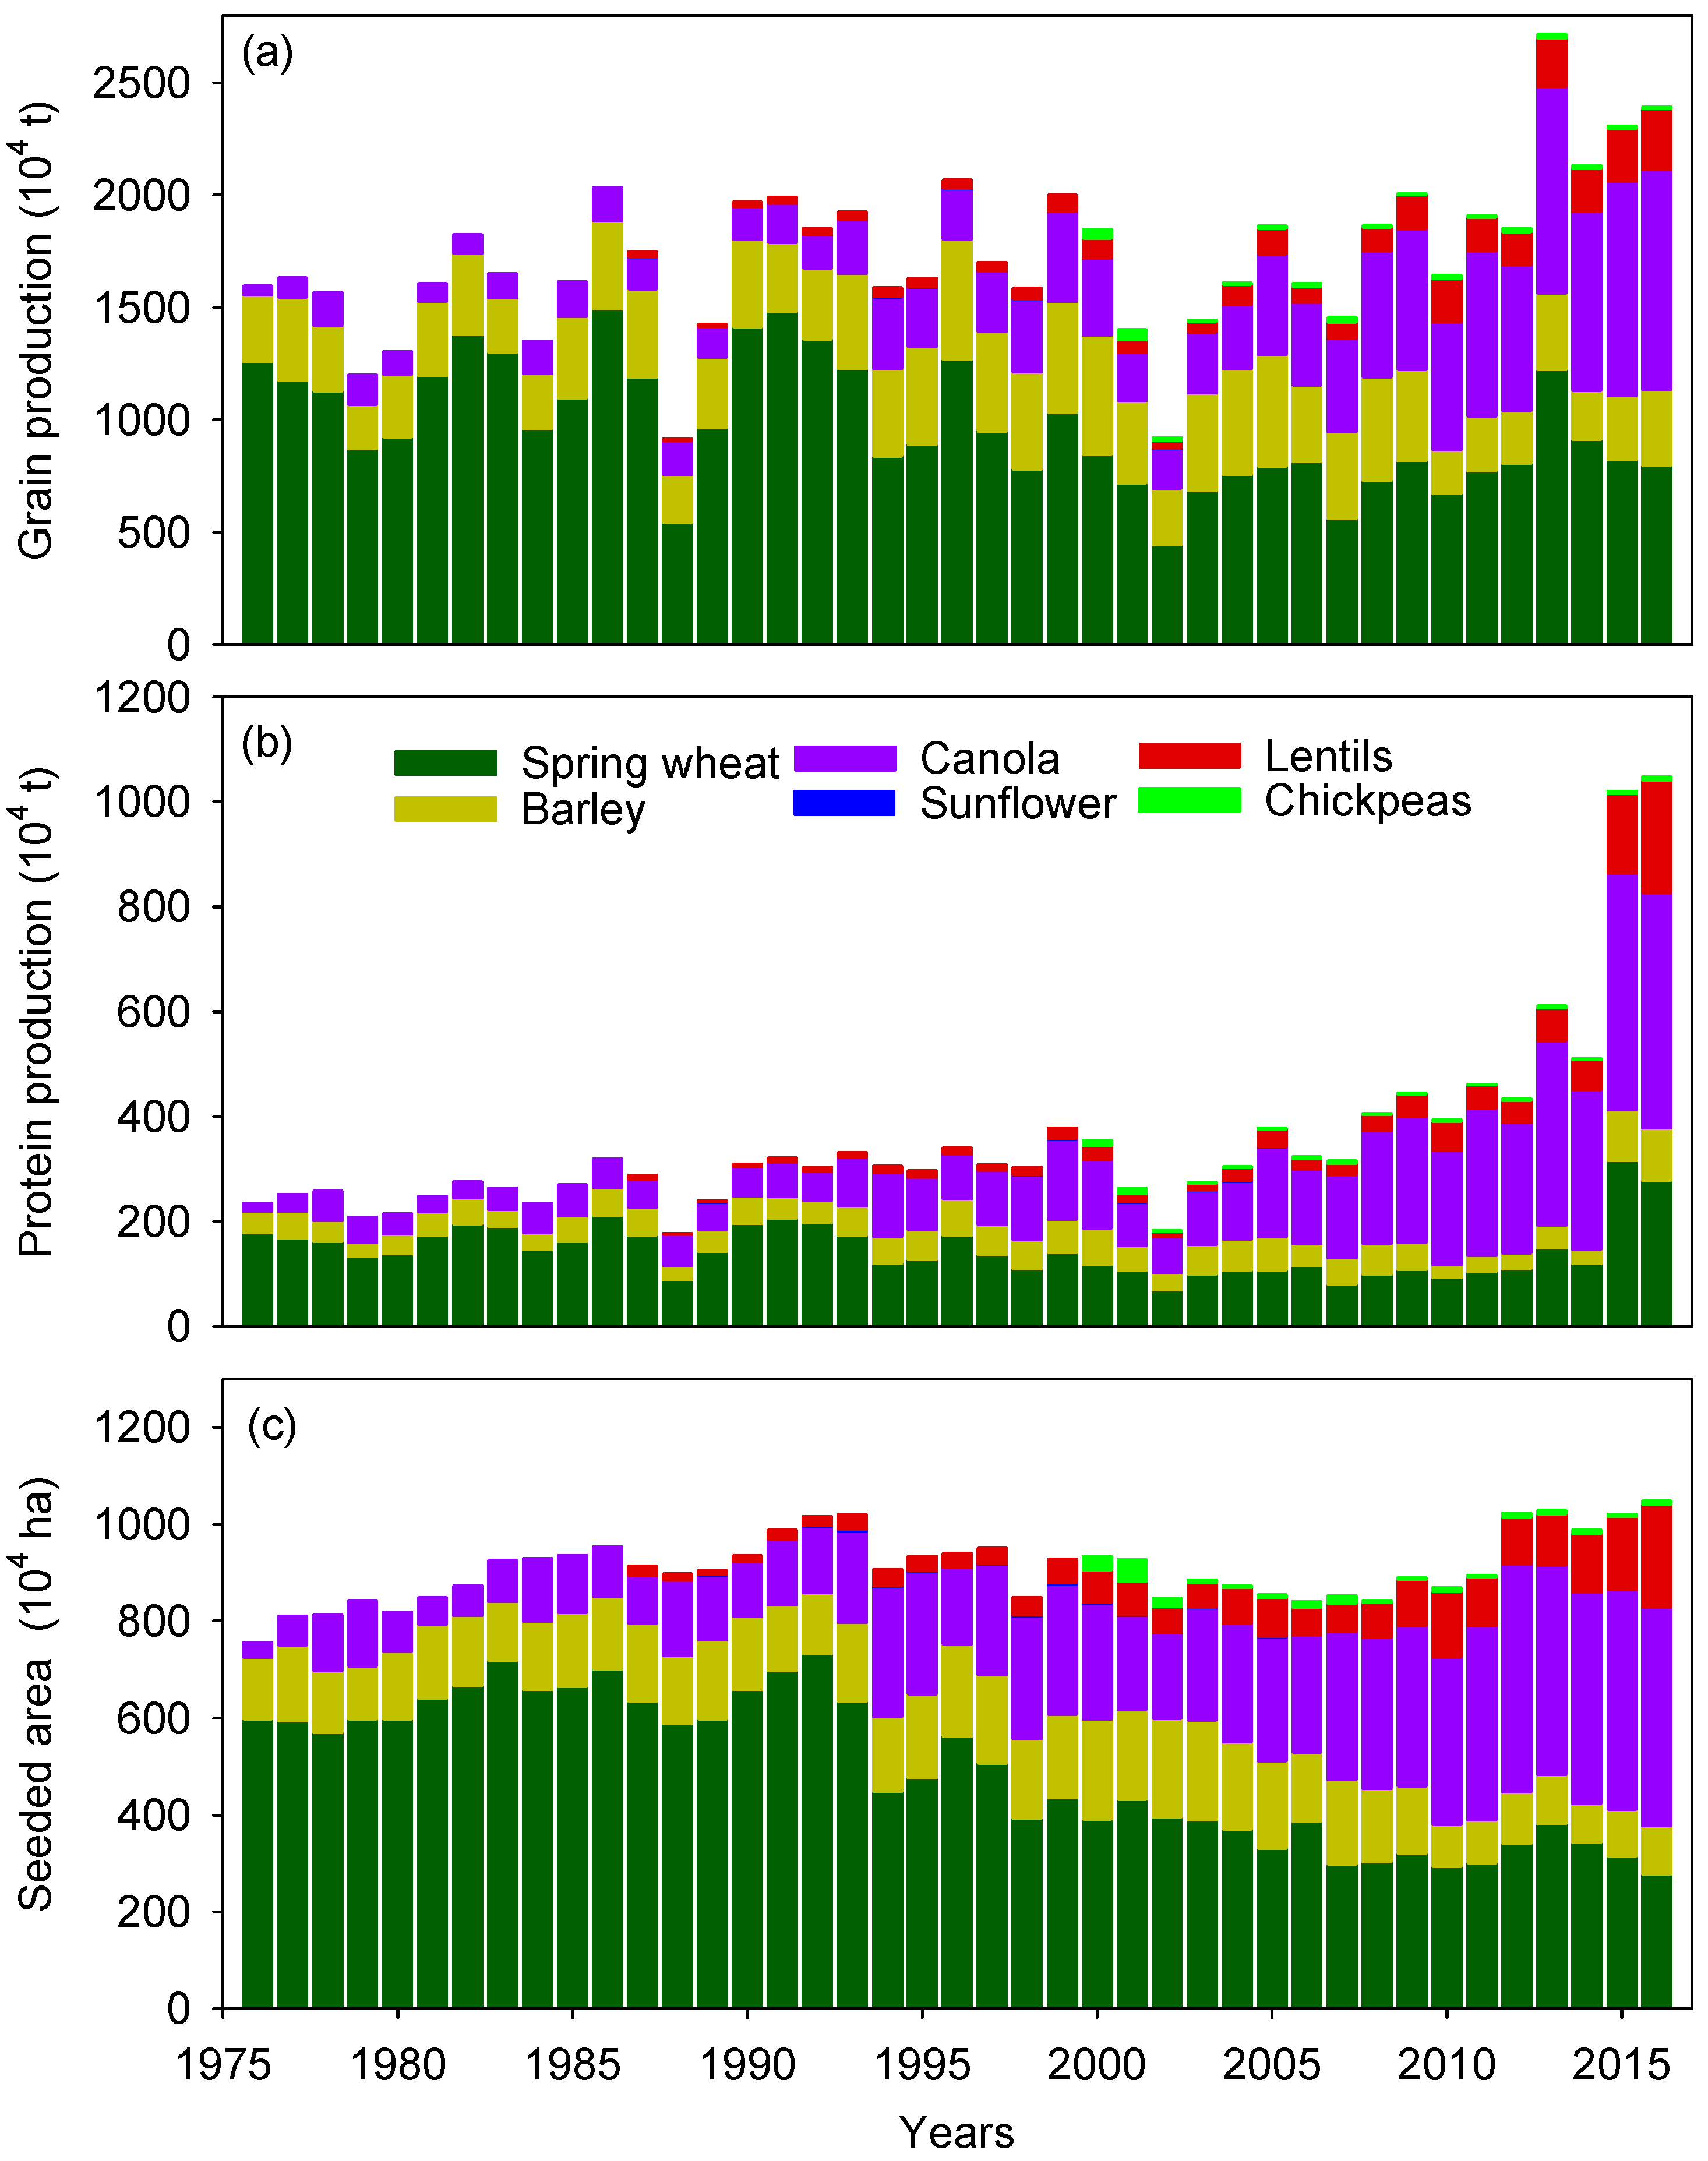
The total crop grain production of cereal crops (i.e., spring wheat and barley) in Saskatchewan before the 2000s was most dominant among the production of six crops. Subsequently, the total production of oilseed crops (i.e., canola and sunflower) and pulses (i.e., lentil and chickpea) evidently increased (Figure 3a). From 2000, the production of cereal crops continuously decreased, while the production of canola and lentil increased significantly. The canola production presented the largest increase among these crops. Even from 2015, the sum of canola and lentil production was similar to the total production of cereal crops (Figure 3a).
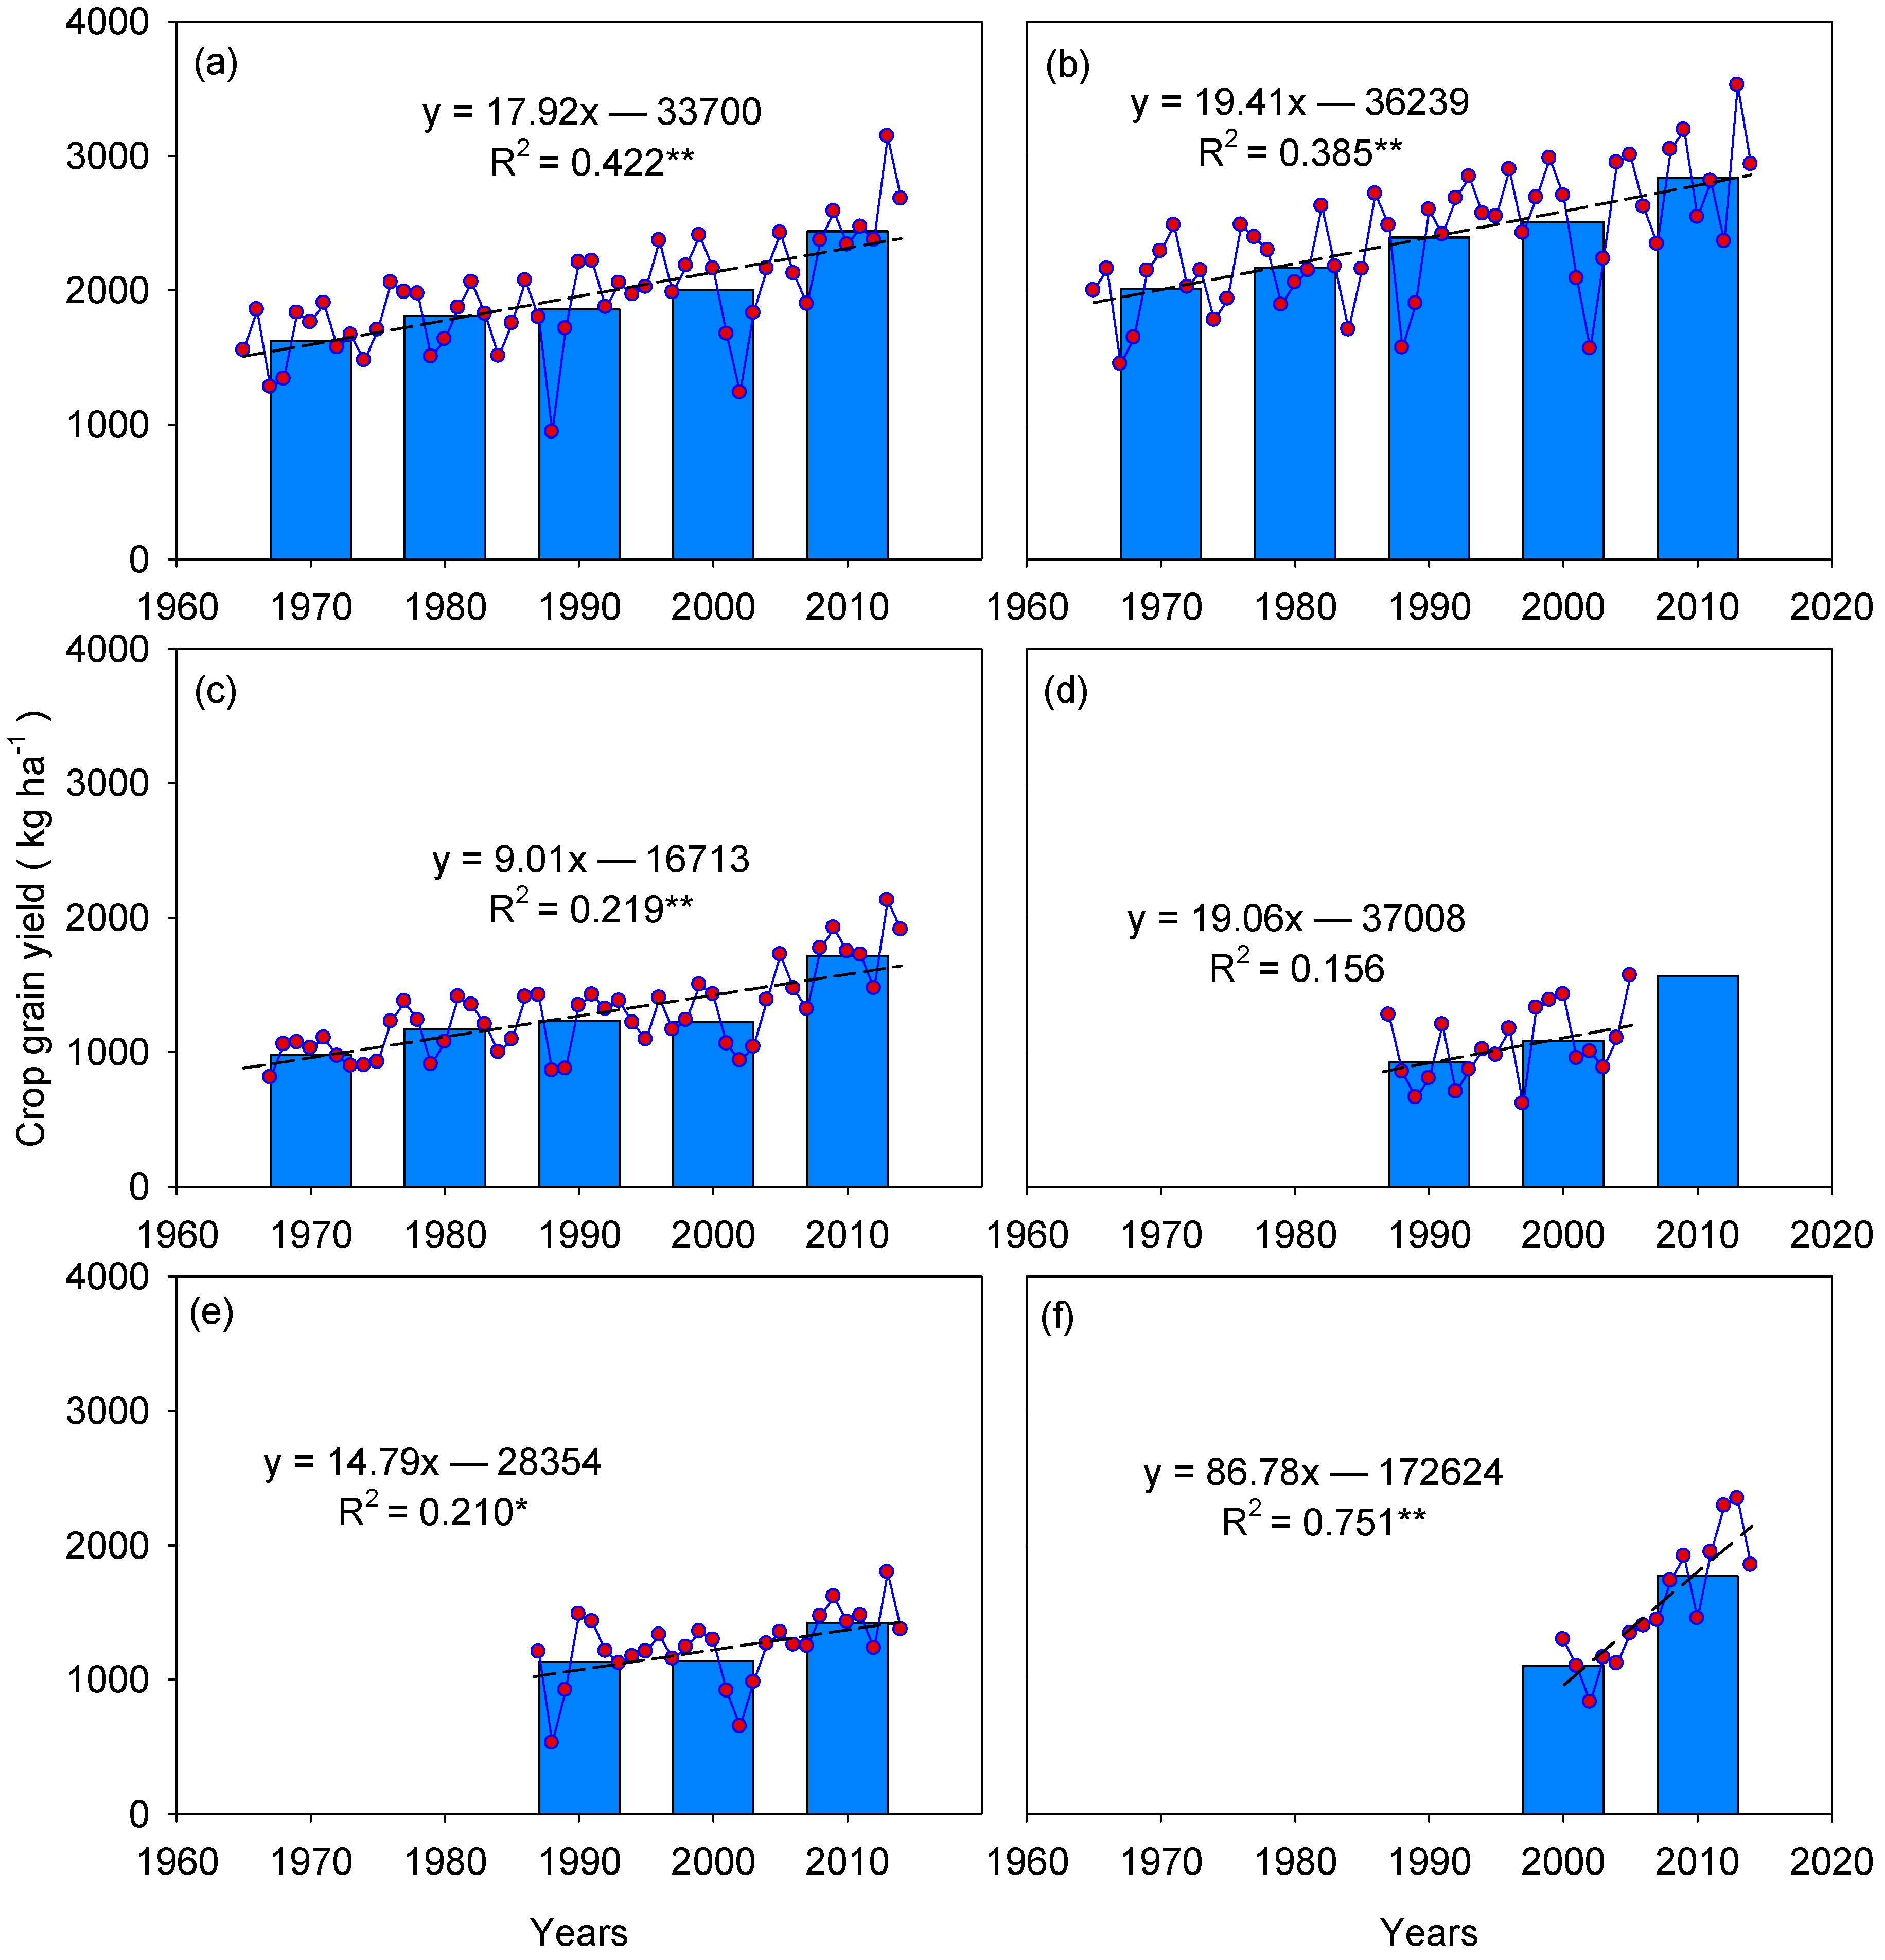
All the crop grain yields showed increasing tendencies (Figure 4) over time. The grain yield of spring wheat ranged from 1623 kg ha−1 to 2440 kg ha−1 with an increasing rate of 179.2 kg ha−1 decade−1. The grain yield of barley ranged from 2010 kg ha−1 to 2837 kg ha−1 with an increasing rate of 194.1 kg ha−1 decade−1. The grain yield of canola ranged from 977 kg ha−1 to 1716 kg ha−1 with an increasing rate of 90.1 kg ha−1 decade−1. The grain yield of sunflower ranged from 920 kg ha−1 to 1566 kg ha−1 with an increasing rate of 190.6 kg ha−1 decade−1. The grain yield of lentil ranged from 1132 kg ha−1 to 1423 kg ha−1 with an increasing rate of 147.9 kg ha−1 decade−1. The grain yield of chickpea ranged from 1100 kg ha−1 to 1771 kg ha−1 with an increasing rate of 867.8 kg ha−1 decade−1. On average, barley had the largest grain yield (2383 kg ha−1), followed by spring wheat (1946 kg ha−1) and chickpea (1547 kg ha−1). The grain yield of canola (1275 kg ha−1) was similar to that of lentil (1238 kg ha−1). Sunflower (1039 kg ha−1) had the lowest grain yield among these crops. Consistent with previous short-term studies, these results suggest that under the semiarid environments of the Northern Great Plains, oilseeds and pulses produce lower seed yields than cereal crops do regardless of water availability. Oilseeds and pulses crops seem to have similar/comparable yields. A previous study reported that yields of canola are consistently lower than the yields of pulse crops; the same is not true in the current study. Pulse crops have complex growth habits and vary in maturity and determinancy [14]. Mild water stress is essential for initiating seed filling in indeterminate pulse crops such as lentil [49]. This characteristic is also true for lentil and chickpea, both of which fail to switch from the vegetative phase to the reproductive phase at high water availability under cool, wet conditions such as those observed in 1996. Therefore, Miller et al. reported that the final relationship between seed yield and water use is often weak for some pulse crops [14].
The protein production of cereal crops accounted for a large proportion of the crop protein produced before the 1990s in Saskatchewan and the values for pulse crops increased slowly from 1987 (Figure 3b). The total protein production of oilseed and pulse crops became similar to that of the cereal crops around 2005, and it eventually exceeded cereal crop protein production after 2005 (Figure 3b). The protein production of pulse crops at a significant increasing rate contributed substantially to the increase of the total protein production after 2015 (Figure 3b).
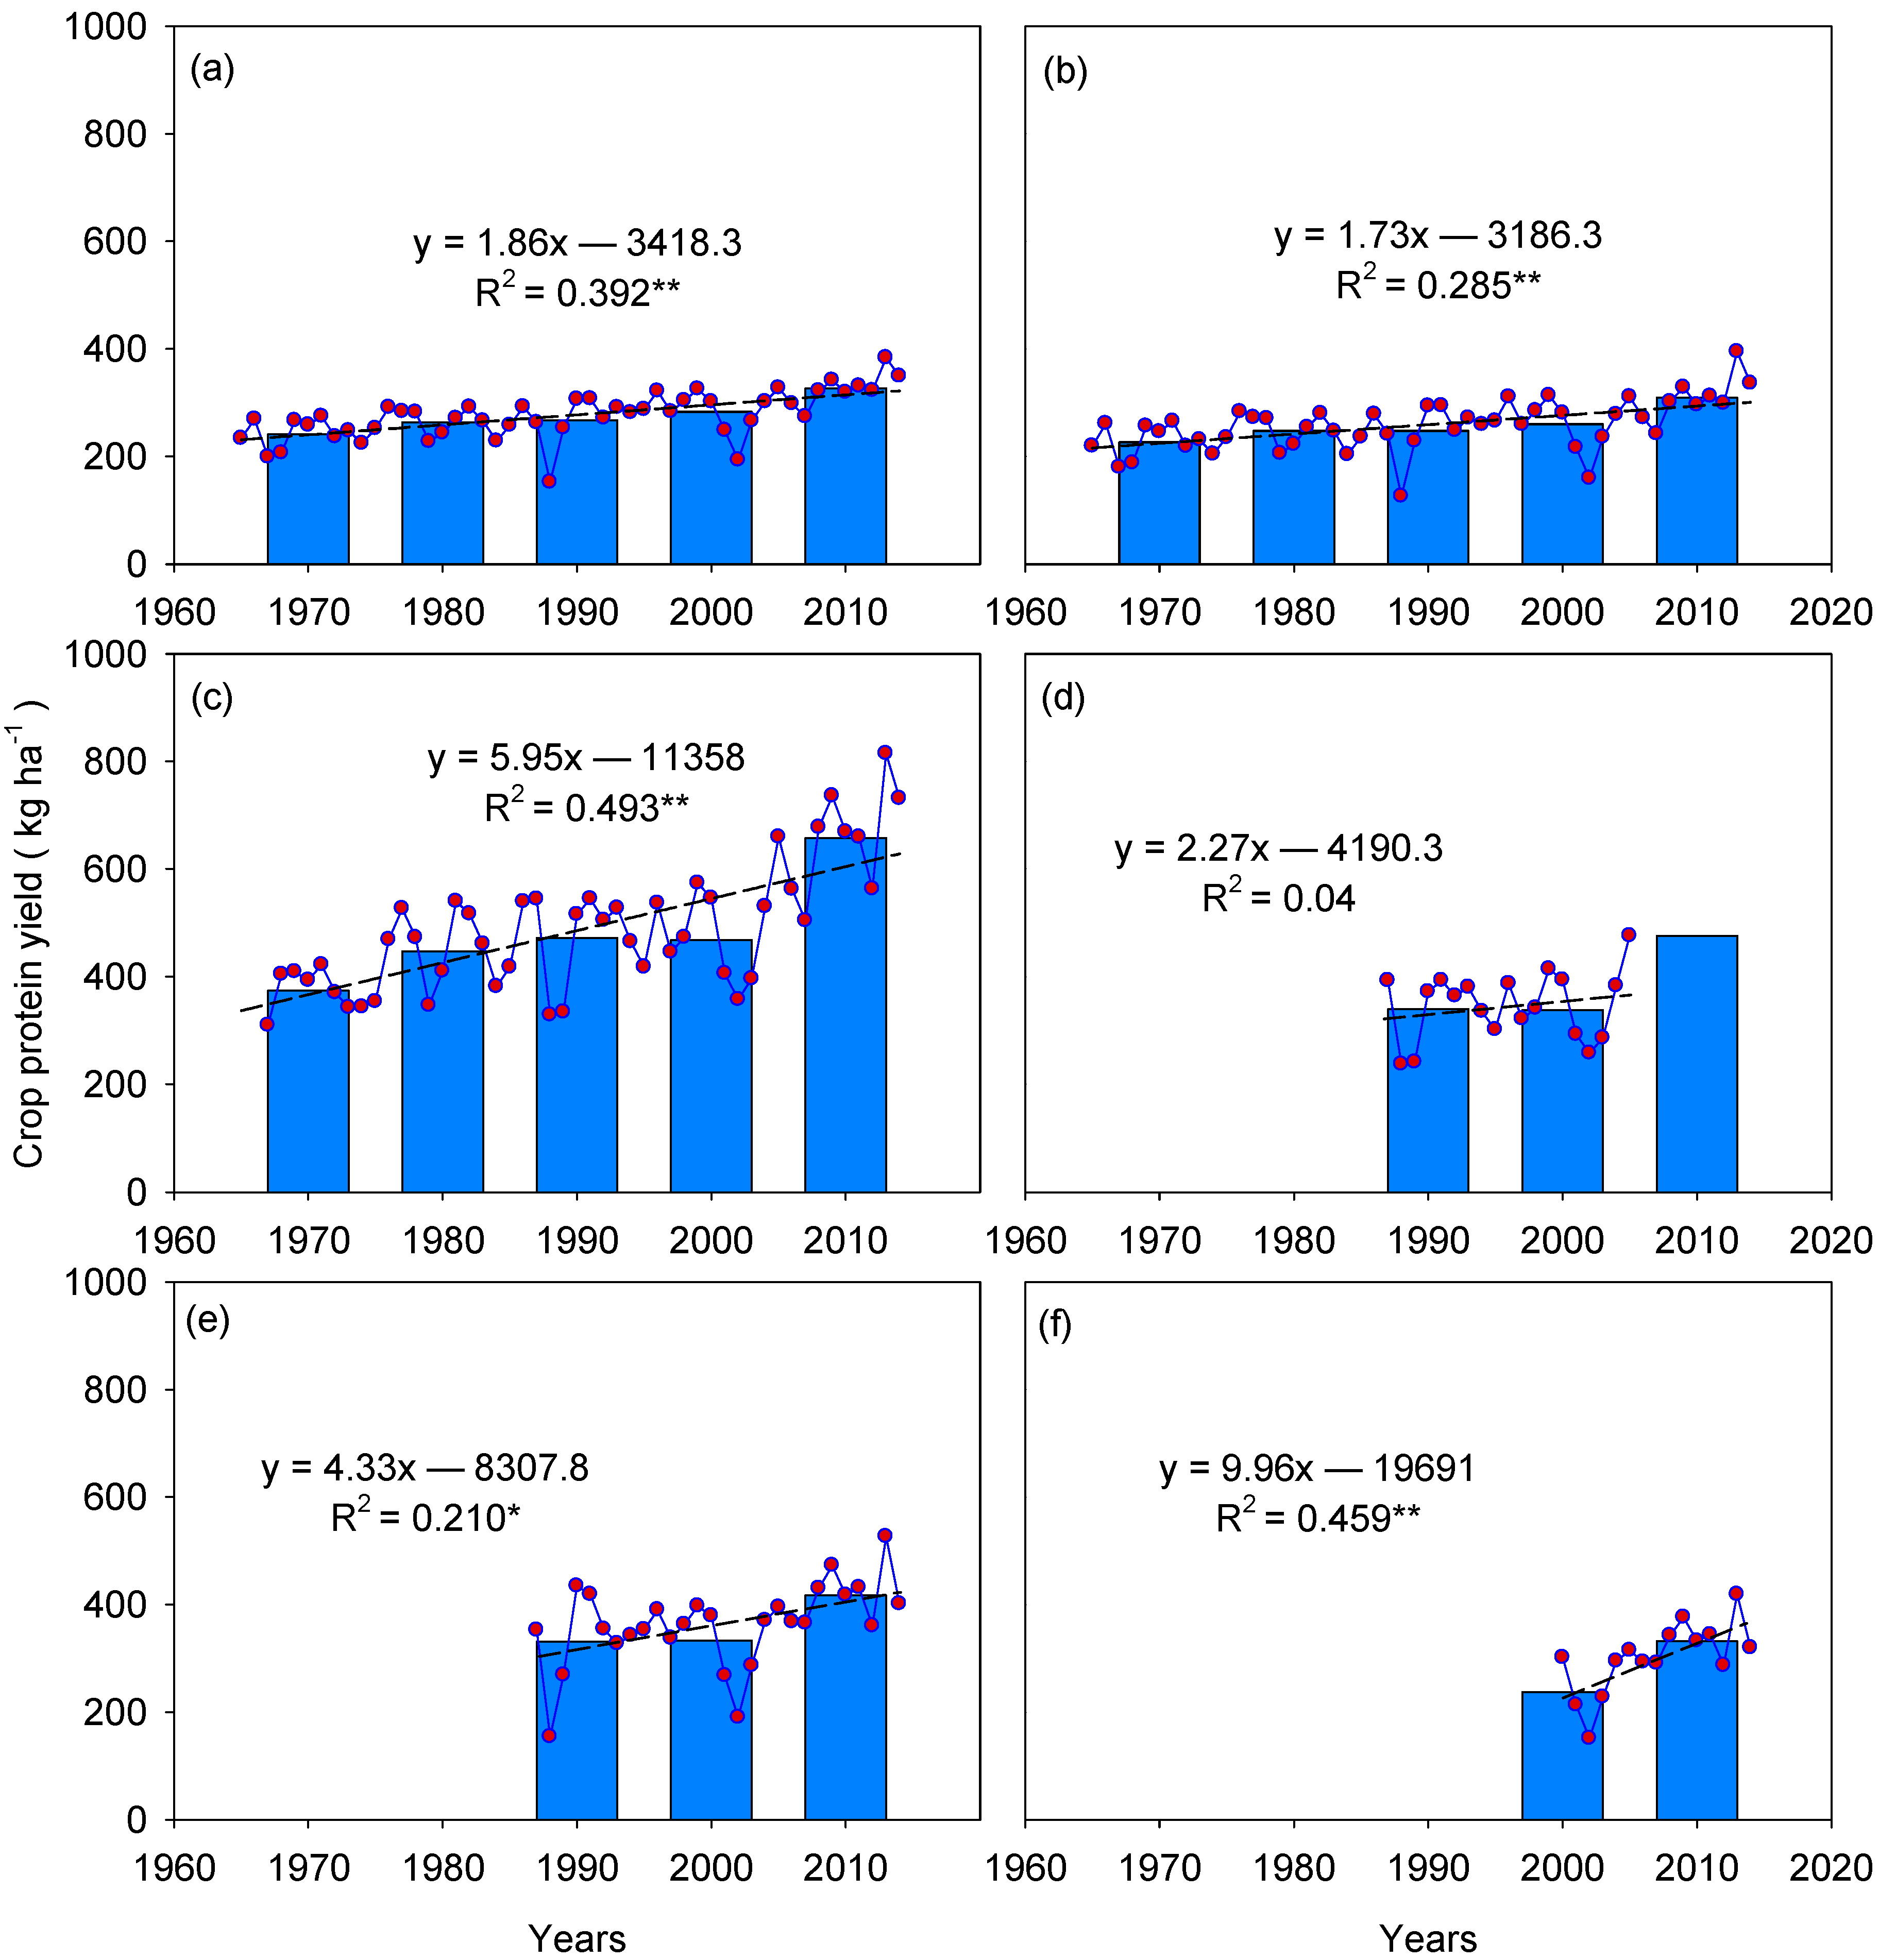
All the crop protein yields showed increasing trends (Figure 5). Chickpea showed the largest increasing rate of protein yield at 99.6 kg ha−1 decade−1, followed by canola (59.5 kg ha−1 decade−1), lentil (43.3 kg ha−1 decade−1), and sunflower (22.7 kg ha−1 decade−1). The protein yields of spring wheat and barley showed relatively low increasing rates of 18.6 and 17.3 kg ha−1 decade−1, respectively (Figure 5). The protein yield of spring wheat ranged from 242 kg ha−1 to 327 kg ha−1 with an average of 276 kg ha−1. The protein yield of barley ranged from 227 kg ha−1 to 309 kg ha−1 with an average of 258 kg ha−1. The protein yield of canola ranged from 374 kg ha−1 to 657 kg ha−1 with an average of 488 kg ha−1. The protein yield of sunflower ranged from 339 kg h−1 to 476 kg h−1 with an average of 346 kg ha−1. The protein yield of lentil ranged from 331 kg ha−1 to 417 kg ha−1 with an average of 363 kg ha−1. The protein yield of chickpea ranged from 237 kg ha−1 to 332 kg ha−1 with an average of 301 kg ha−1. As a result of the different crop protein contents, oilseed crops had the largest protein yield among all crops, followed by pulse crops and cereal crops (Figure 5).
The change trends of crop grain and protein production could be explained by the changes in their seeded areas (Figure 3c). Canola’s seeded area in Saskatchewan before the 1990s was obviously small, and pulse crops began to be planted on a wide scale starting from 1987 (Figure 3c). After the 1990s, the seeded area of oilseed crops markedly increased and pulse crop acreage showed a slowly increasing trend. The total seeded areas of oilseed crops and pulse crops became larger than that of cereal crops from 2010 onwards (Figure 3c). With the increasing seeded area of canola, its grain and protein production occupies a large proportion in the current crop system (Figure 3c).
3.3. Changes of Crop Actual Evapotranspiration and Soil Water Storage
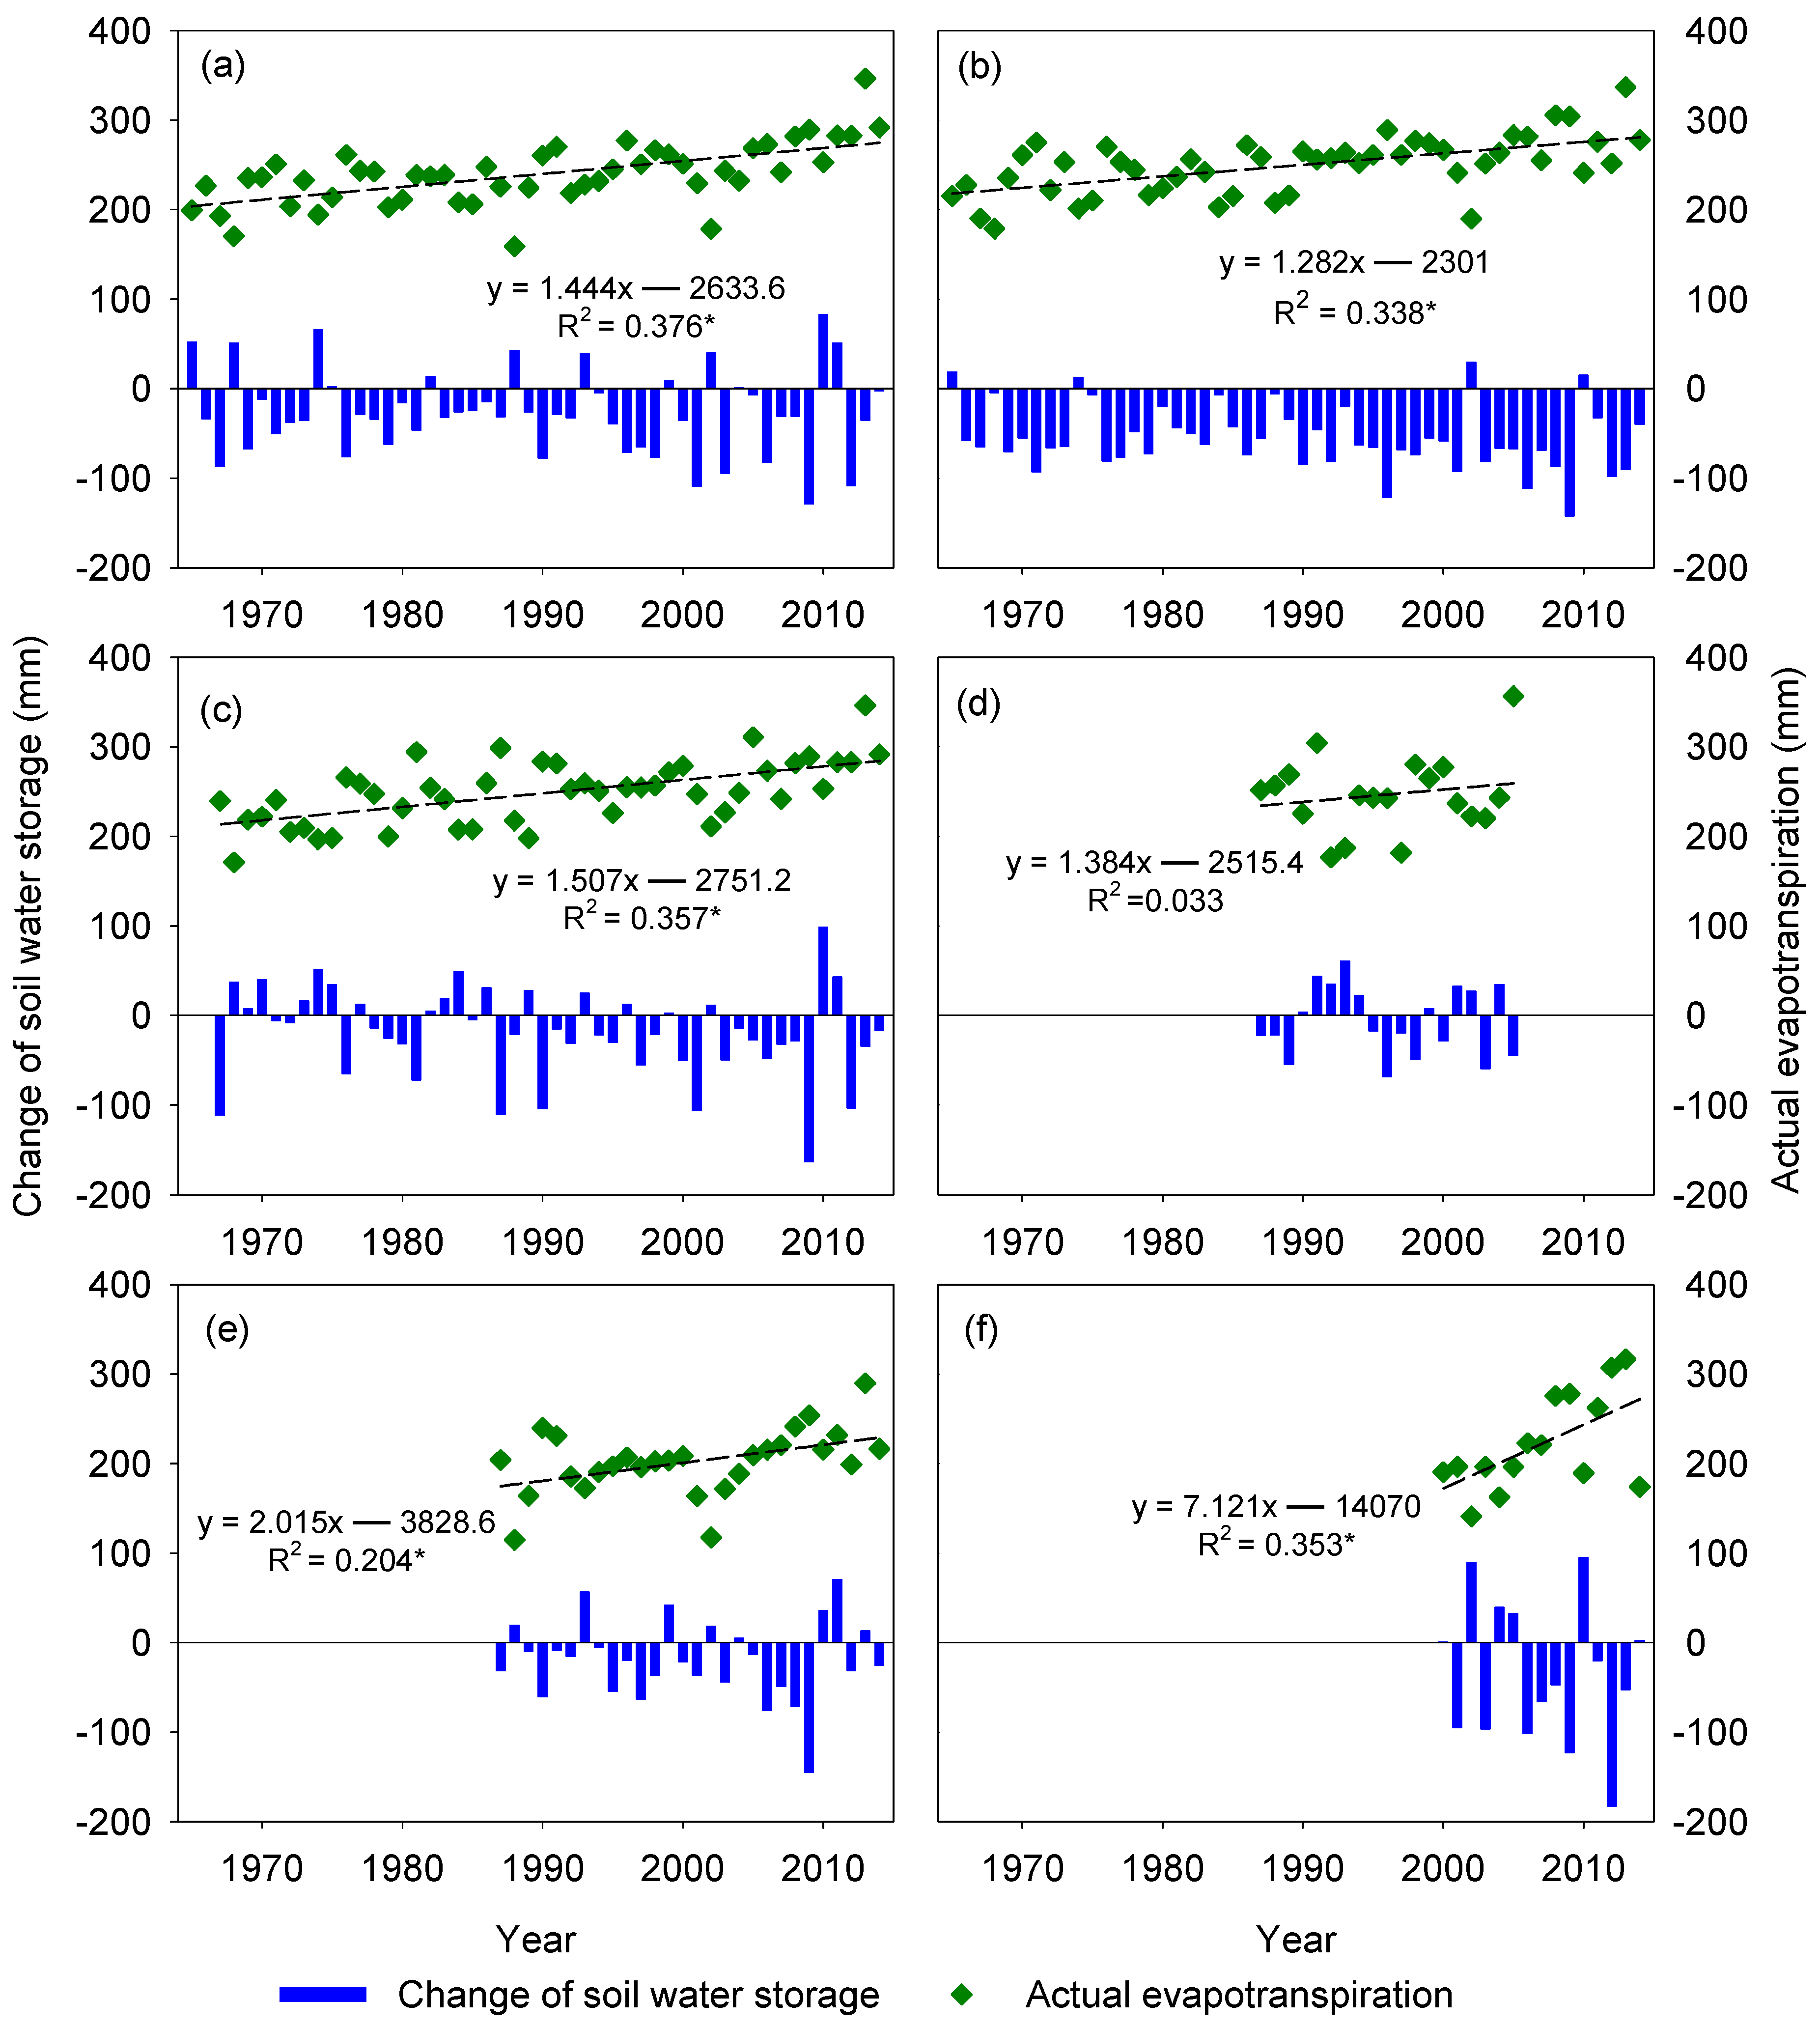
In terms of averages, the values of ETa for wheat, barley, canola, sunflower, lentil, and chickpea were 239.2, 249.4, 248.8, 246.7, 201.8, and 222.0 mm, respectively. ET rates are usually greater in annual legumes than in other grain crops such as spring wheat in semiarid conditions [50], due to the slow canopy cover by annual grain legumes [51]. In the present study, the values of ETa for cereal crops and oilseeds were approximately equal but greater than that for pulses under rain-fed conditions. However, during wetter years, the three types of crops did not differ. ETa did not differ among the types of cereal crops or among oilseeds. Few data points were available for sunflower. Therefore, the yield water use relationship for sunflower is more uncertain than that of the other crops and may be biased due to the few observations under conditions of low water use.
From the perspective of field water balance, the difference between ETa and effective precipitation during the crop growth period equals soil water storage change. The change of soil water storage indicates that cereal crops use more soil water than oilseeds and pulse crops do (Figure 6). In dryland agriculture, the initial soil water storage stored before seeding is important to plant water use. In Saskatchewan, the contribution of soil water storage change is around a third of the annual precipitation from snowmelt water because the water for irrigation is applied only to a small proportion of total crop land acreage in Saskatchewan. Deep-rooted crops such as Brassica oilseeds and wheat tend to use similar amounts of water, whereas shallow rooted crops such as chickpea and lentil use slightly less water because the available soil water within the rooting zone is an important contributor to crop yield, and because crops tend to use much or all the available water within the rooting zone under the water-limited conditions of the semiarid prairies [23,52,53].
The ability of crops to adapt to different water conditions is important because moisture for crop growth is frequently in short supply. Chickpea and lentil can be well suited to semiarid climates where water supply is variable and drought is frequent. In fact, some drought stress is required in the latter part of the life cycle of these pulse crops to achieve a timely maturity and high yields because certain degrees of stress during maturation help to complete indeterminate growth [54]. For this reason, lentil and chickpea are suitable for continuous cropping systems where late-season drought stress usually occurs in most years.
3.4. Species-Dependent Variations of Water Footprint
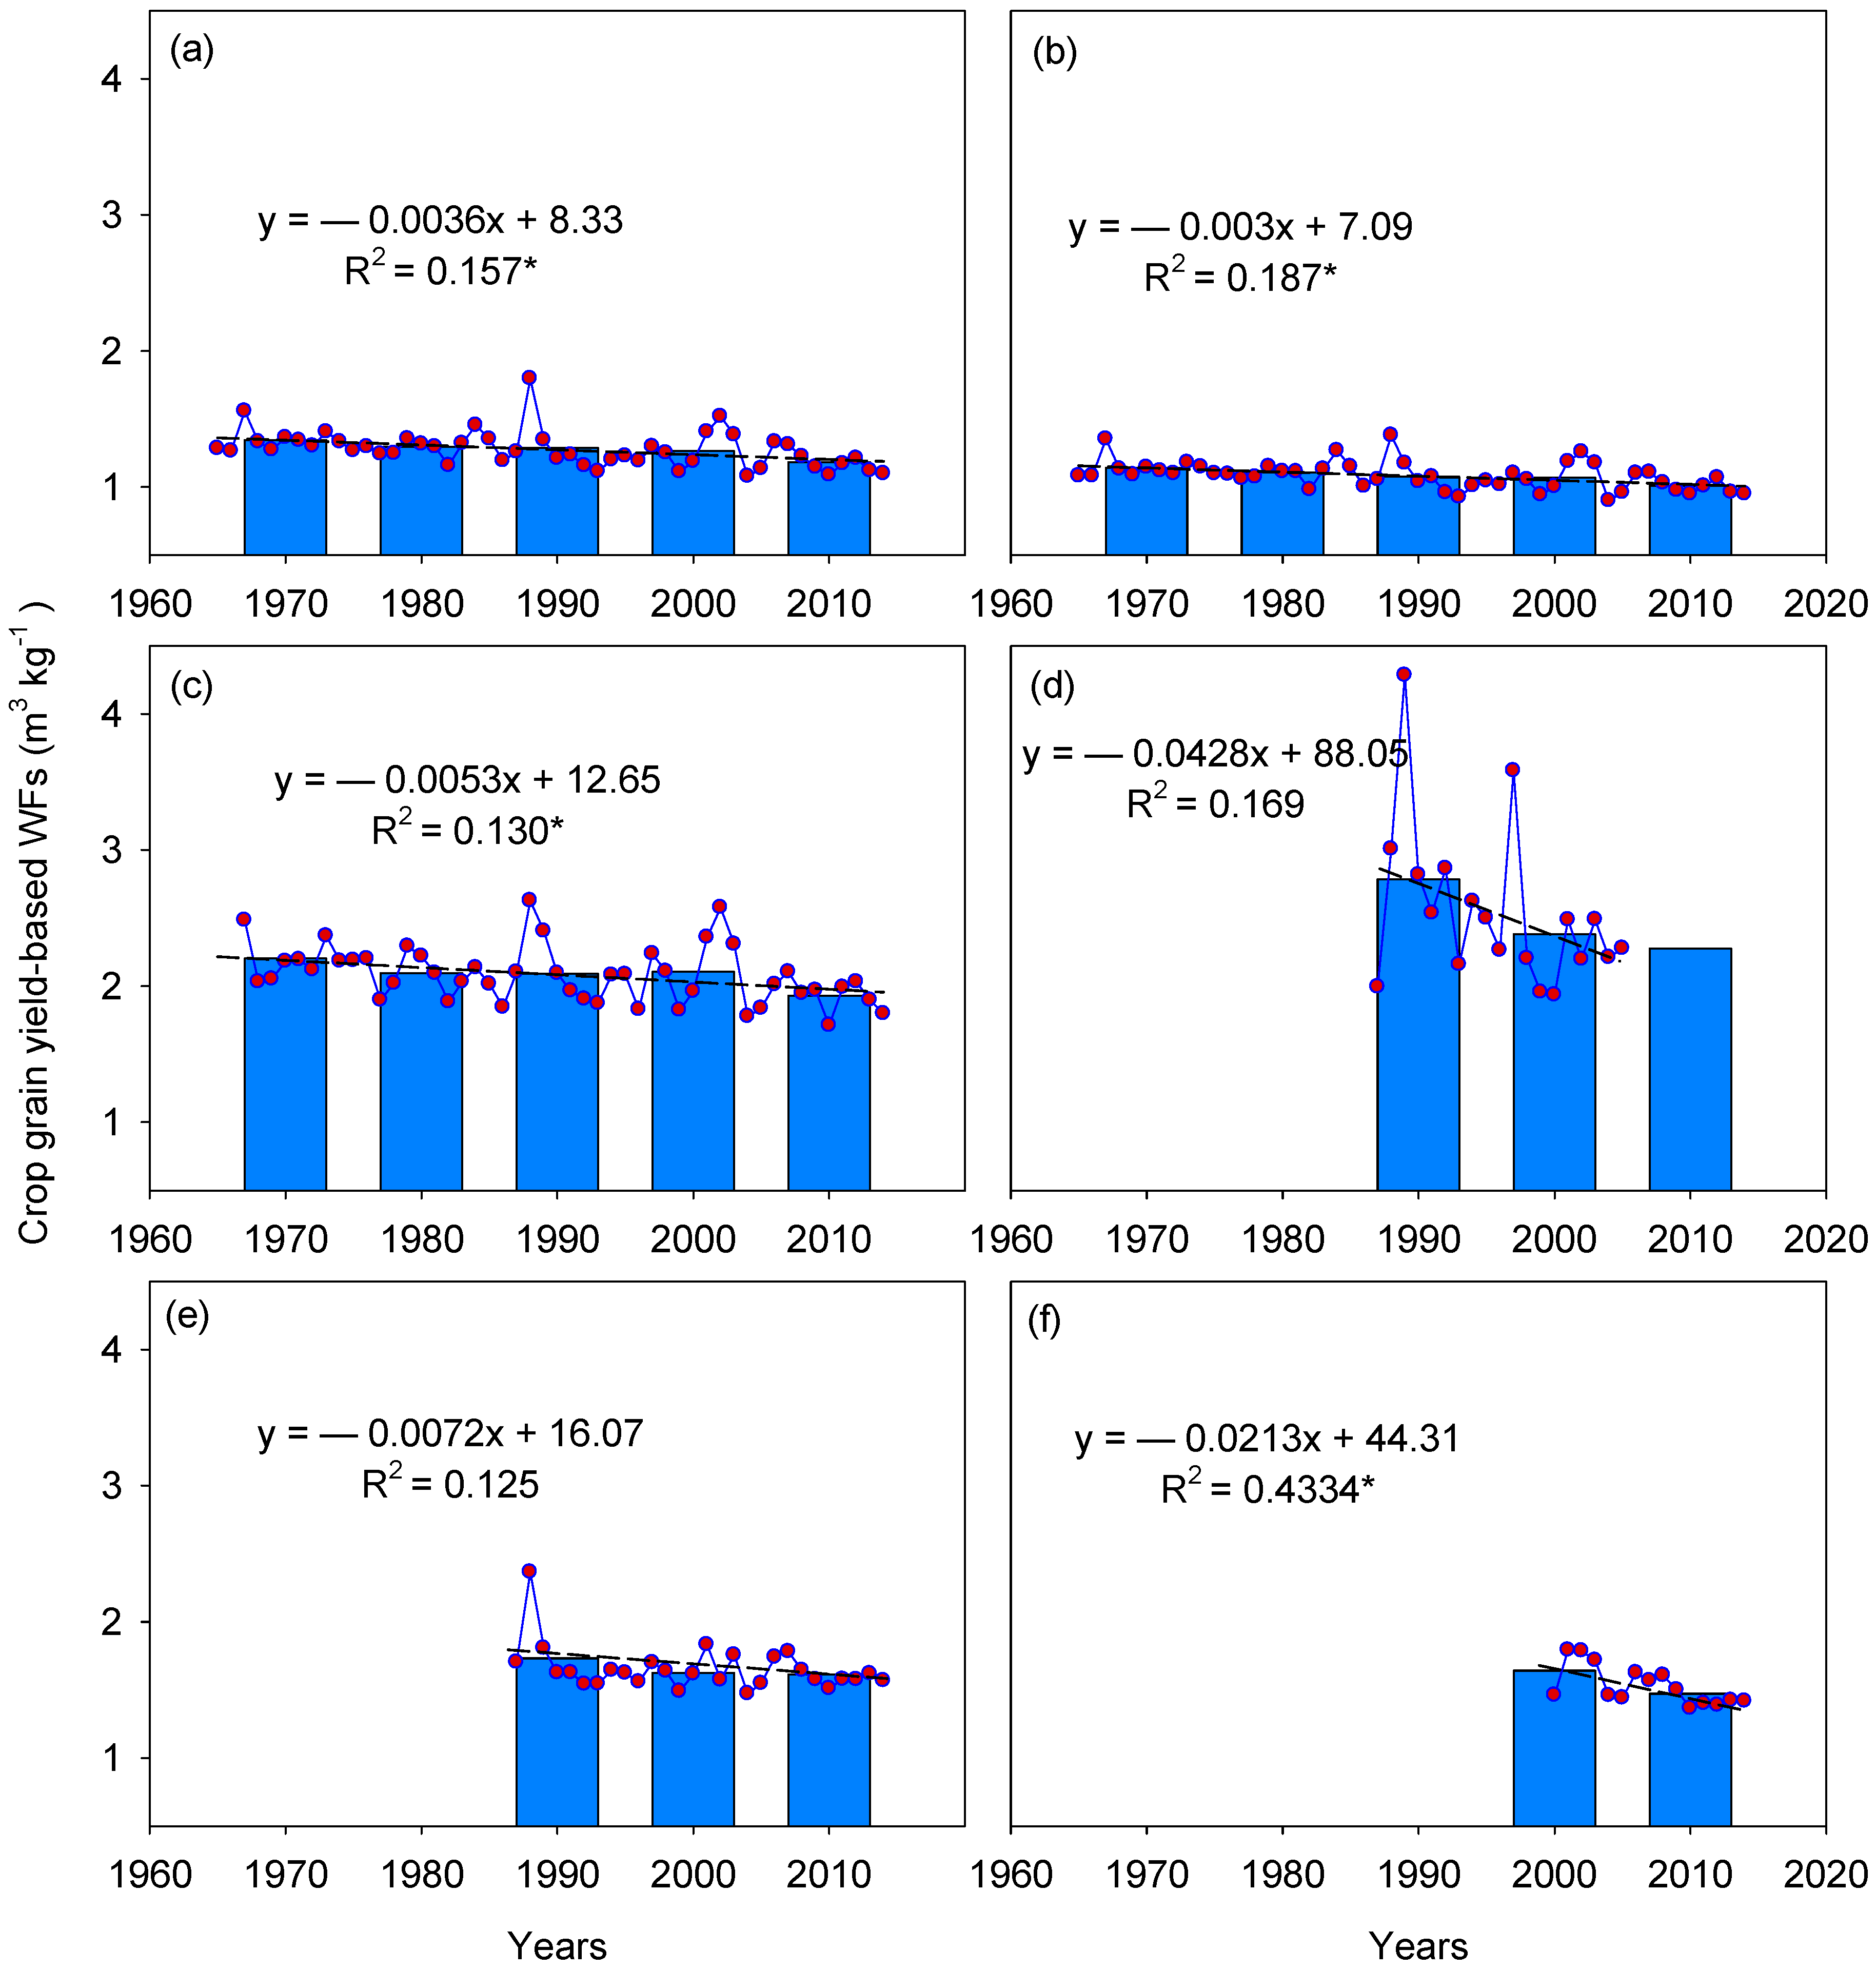
All crop grain yield-based WFs exhibited a downward trend. The decreasing rates of the grain yield-based WFs of spring wheat, barley, canola, sunflower, lentils, and chickpea were 0.036, 0.030, 0.053, 0.428, 0.072, and 0.213 m3 kg−1 decade−1, respectively (Figure 7). The grain yield-based WF of spring wheat ranged from 1.08 m3 kg−1 to 1.80 m3 kg−1 with an average of 1.28 m3 kg−1, The grain yield-based WF of barley ranged from 0.90 m3 kg−1 to 1.38 m3 kg−1 with an average of 1.08 m3 kg−1. The grain yield-based WF of canola ranged from 1.71 m3 kg−1 to 2.58 m3 kg−1 with an average of 2.08 m3 kg−1. The grain yield-based WF of sunflower ranged from1.94 m3 kg−1 to 4.28 m3 kg−1 with an average of 2.55 m3 kg−1. The grain yield-based WF of lentil ranged from 1.47 m3 kg−1 to 2.37 m3 kg−1 with an average of 1.65 m3 kg−1. The grain yield-based WF of chickpea ranged from 1.39 m3 kg−1 to 1.79 m3 kg−1 with an average of 1.53 m3 kg−1 (Figure 7). Sunflower showed the highest grain yield-based WF, followed by canola, lentil, and chickpea. The grain yield-based WFs of spring wheat and barley were the lowest due to their large grain yields (Figure 4). Pulses and oilseeds showed similar grain yields (Figure 4), but the grain yield-based WF of the former was much lower than that of latter because of relatively low ETa value of pulses (Figure 6). For the same crop types, no significant differences were observed in grain yields or WFs.
The average regional estimates of the WF of spring wheat in Alberta, Saskatchewan, and Manitoba over the 1976–2006 period (calculated as evapotranspiration from seeding to harvest divided by grain yield) were derived from Statistics Canada records by Qian et al. as 1.15, 1.18, and 1.20 m3 kg−1, respectively [55]. Miller et al. reported that the grain yield-based WF of lentil ranges from 1.89 m3 kg−1 to 3.70 m3 kg−1 [22]. As for chickpea, the average WF values are 1.47 m3 kg−1 in the study of Angadi et al. [24] and 2.63 m3 kg−1 in the study of Miller et al. [22]. The WFs in the current study showed similar value ranges. The magnitude of environmental influence varies depending on crop species. For example, De Jong and Cameron (1980) found that the average WF of wheat grown in the humid environment of Saskatoon, Saskatchewan, is 1.22 m3 kg−1, which is substantially lower than that of rapeseed and flax (i.e., 3.70 m3 kg−1) [56]. The slow-developing chickpea canopy, which results in substantial evaporative losses during the early growth stages, may lead to high WFs [57]. However, the post-anthesis growth phase of chickpea accounts for >50% of its life cycle [58], and chickpea plants are able to extract water deep in the soil profile as they root to 100 cm [59]. These attributes may allow the chickpea crop to adapt to intermittent periods of drought in a semiarid environment.
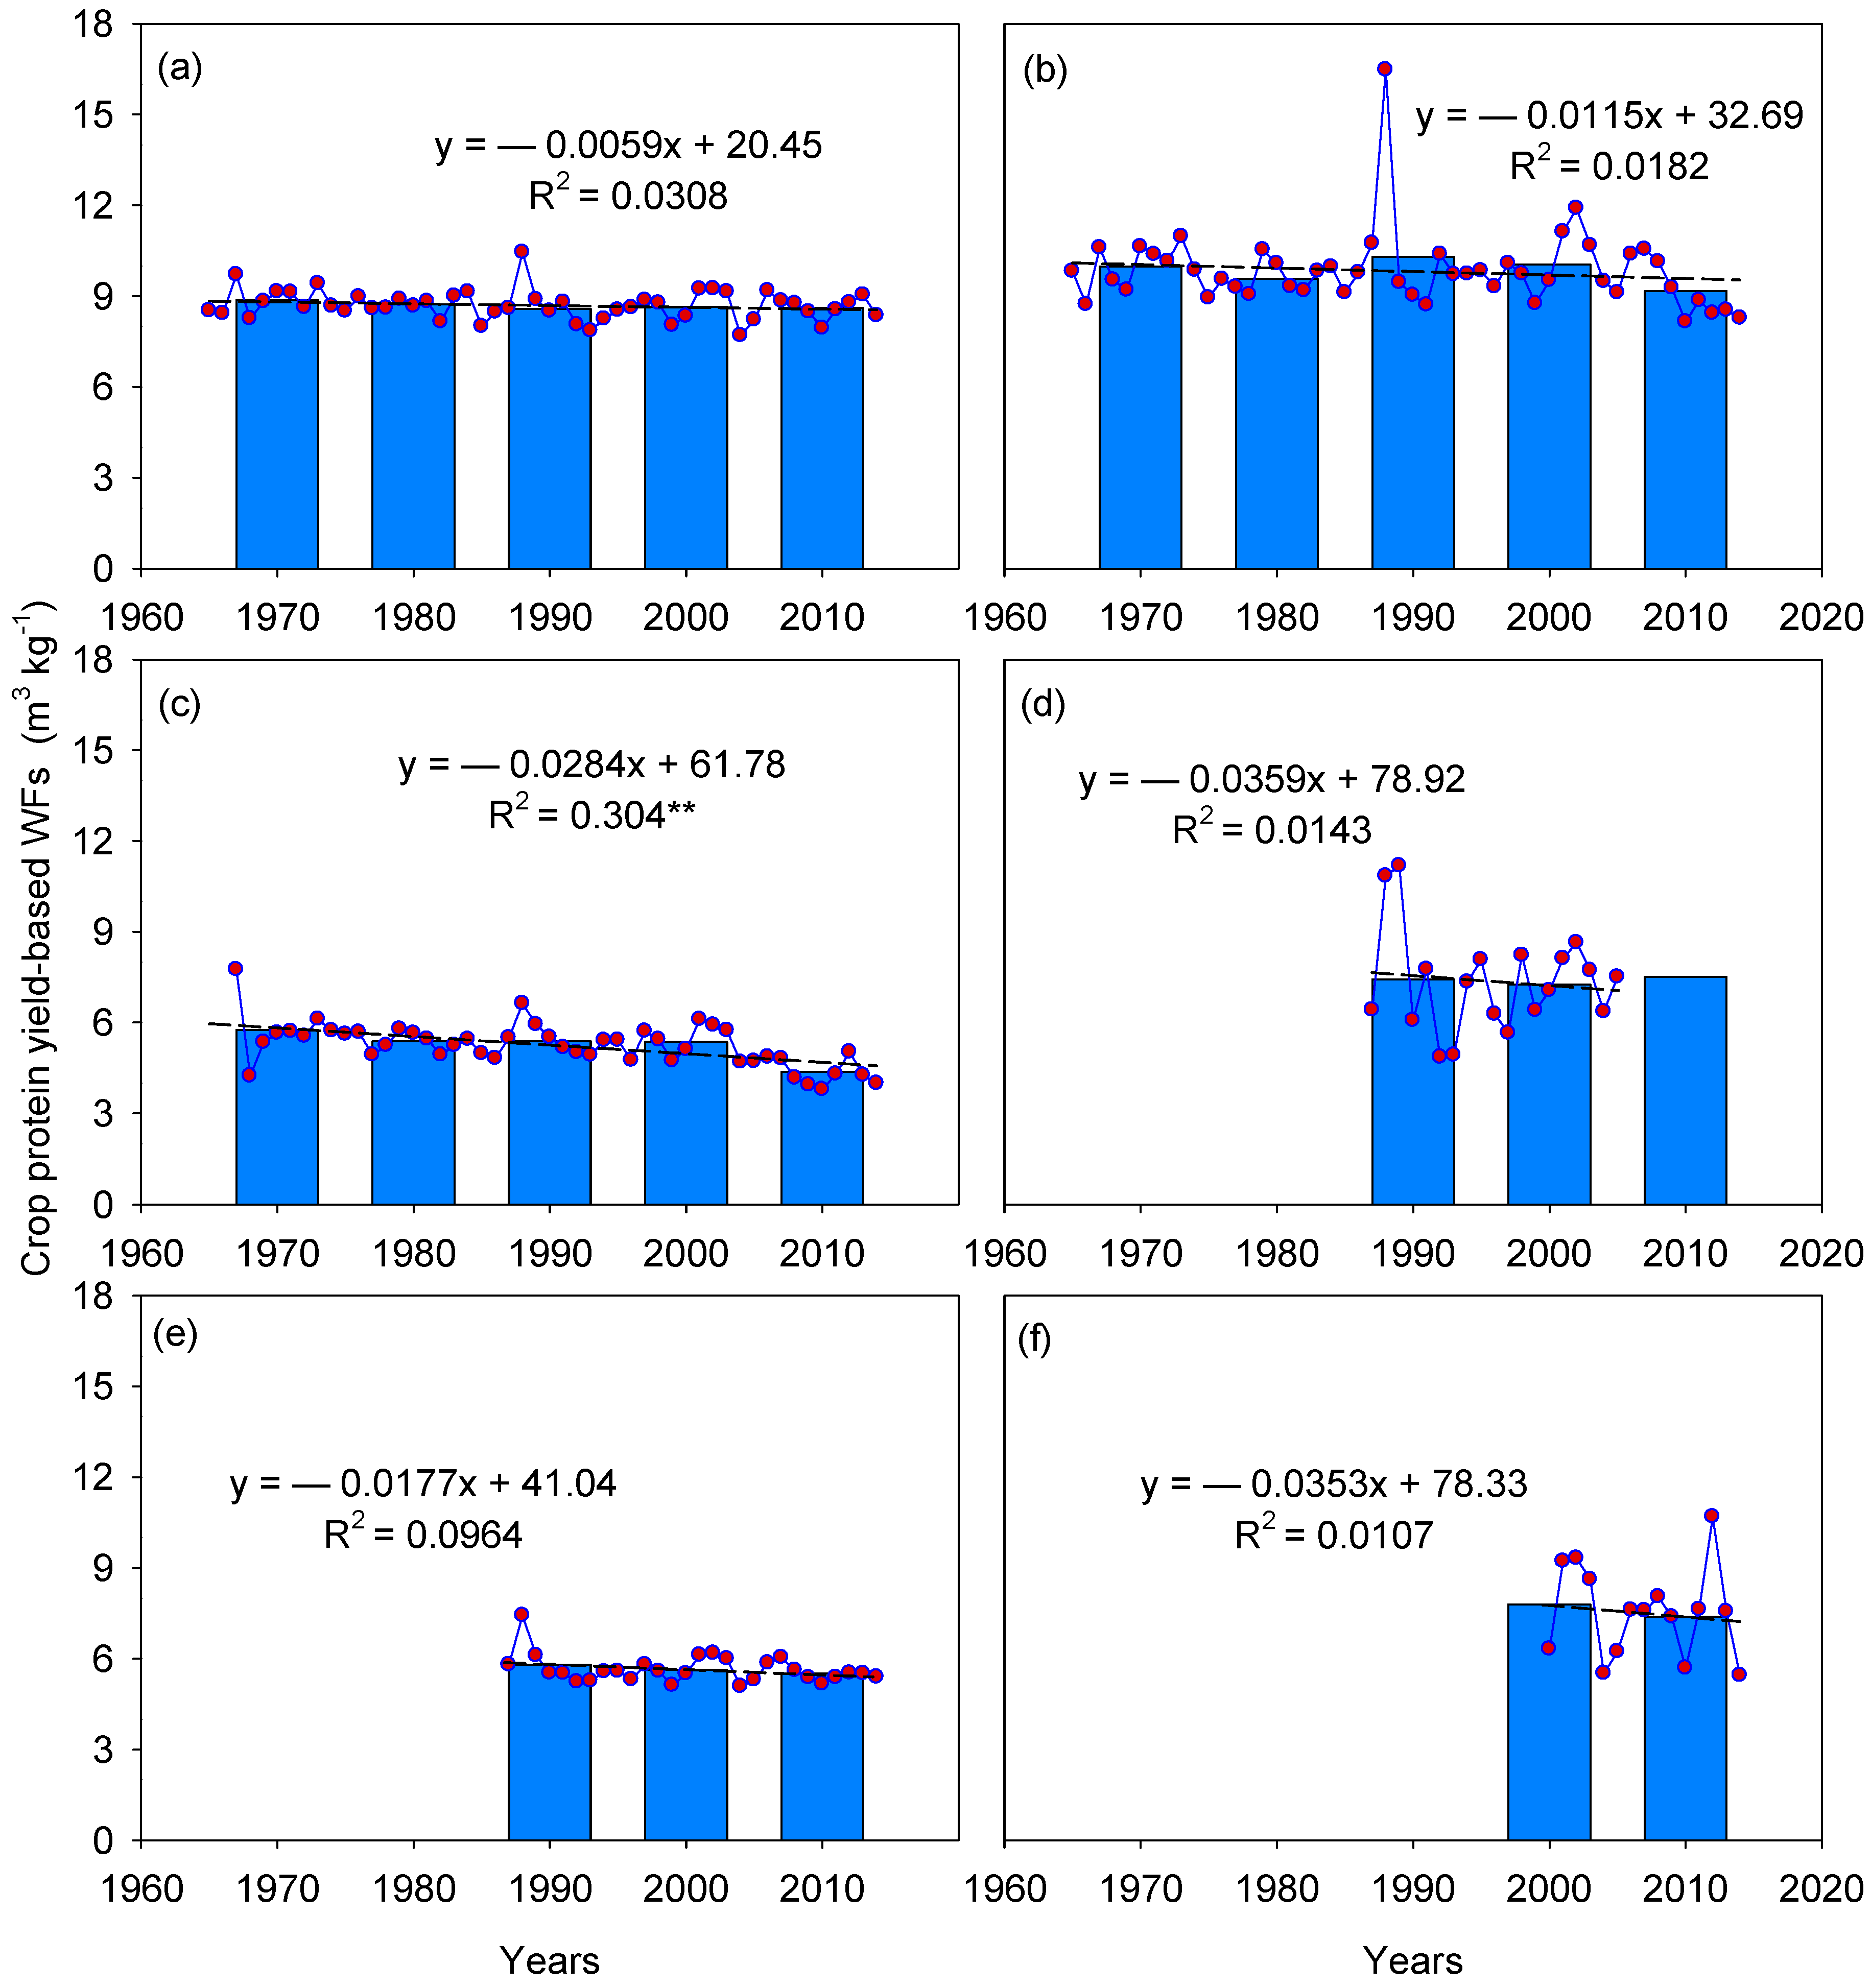
The protein yield-based WF of spring wheat ranged from 7.69 m3 kg−1 to 10.44 m3 kg−1 with an average of 8.69 m3 kg−1. The protein yield-based WF of barley ranged from 8.27 m3 kg−1 to 16.47 m3 kg−1 with an average of 9.81 m3 kg−1. The protein yield-based WF of canola ranged from 3.79 m3 kg−1 to 7.75 m3 kg−1 with an average of 5.23 m3 kg−1. The protein yield-based WF of sunflower ranged from 4.86 m3 kg−1 to 11.17 m3 kg−1 with an average of 7.33 m3 kg−1. The protein yield-based WF of lentil ranged from 5.09 m3 kg−1 to 7.42 m3 kg−1 with an average of 5.64 m3 kg−1. The protein yield-based WF of chickpea ranged from 5.51 to 10.69 m3 kg−1 with an average of 7.52 m3 kg−1 (Figure 8). Barley had the largest protein yield-based WF, followed by spring wheat, chickpea, and sunflower. Canola and lentil had the lowest protein yield-based WF. As the ETa values for cereal crops and oilseeds were generally similar, the high protein yield of oilseeds led to their low protein yield-based WF. For pulses, ETa was lower and the large protein yields led to the relatively low protein yield-based WFs relative to the values of cereal crops. During the plant years of crops, the decreasing rate of the protein yield-based WF of spring wheat, barley, canola, sunflower, lentils, and chickpea were 0.059, 0.115, 0.284, 0.359, 0.177, and 0.353 m3 kg−1 decade−1, respectively (Figure 8). Although the seeded areas of pulses did not change considerably in the recent decades, their crop yield increased quickly and greatly contributed to the increase of their protein yield and the decrease of their protein yield-based WF.
3.5. Factors Influencing WFs
Given the dominance of rain-fed production in Saskatchewan, cereal grain yields positively correlated with annual precipitation. To distinguish the roles of technological progress and precipitation in WFs, we calculated the grain yield increment caused by precipitation increment on the basis of precipitation use efficiency. The tendency of the original average grain yield minus the above grain yield increment in one decade was mainly induced with the scientific and technological progress. Then, the progress index was evaluated with the remaining average grain yield. The average values of precipitation use efficiency of spring wheat, barley, canola, sunflower, lentils, and chick peas was 3.43, 4.15, 3.32, 3.27, 3.07, and 1.47 kg mm−1, respectively. As we assumed, the average grain yield and progress index increased with time (Table 2).
The crop ranking in the grain yield-based WFs differed greatly from that in the protein yield-based WFs mainly because of the different crop types. As shown in Figure 4 and Figure 5, cereal crops had large grain yields, but their protein yield was lower than that of oilseeds and pulses because of the latter’s greater protein content [60,61,62,63,64,65]; in this case, oilseeds and pulses had relatively larger protein yields and lower protein yield-based WFs.
Among the influencing factors, annual precipitation had the largest path coefficient for the grain yield-based WFs of spring wheat, barley, sunflower, lentil, and chickpea (Table 3). Scientific and technological progress had the largest path coefficient for the grain yield-based WFs of canola. Agricultural inputs had the second largest path coefficient for the grain yield-based WFs of spring wheat, canola, and lentil. Seasonal precipitation had the second largest path coefficient for the grain yield-based WFs of barley and sunflower. Population had the second largest path coefficient for the grain yield-based WFs of chickpea. Among the other factors, average daily temperature had the smallest path coefficient for the grain yield-based WFs of spring wheat, barley, sunflower, lentil, and chickpea. Agricultural product price had the smallest path coefficient for the grain yield-based WFs of canola (Table 3).
Annual precipitation had the largest path coefficient for the protein yield-based WFs of spring wheat, barley, canola, and lentil. Agricultural product price had the largest path coefficient for the protein yield-based WFs of canola; seasonal precipitation had the largest path coefficient for the protein yield-based WFs of chickpea (Table 4) and the second largest path coefficient for the protein yield-based WFs of spring wheat and canola. Agricultural product price had the second largest path coefficient for the protein yield-based WFs of barley. Agricultural inputs had the second largest path coefficient for the protein yield-based WFs of sunflower and lentil. Annual precipitation had the second largest path coefficient for the protein yield-based WFs of chickpea. Average daily temperature had the smallest path coefficient for the protein yield-based WFs of spring wheat, barley, sunflower, and lentil. Scientific and technological progress and agricultural inputs had the smallest path coefficient for the protein yield-based WFs of canola and chickpea, respectively (Table 4).
The quantity and distribution of precipitation were key meteorological factors for crop production because most of the farms in Saskatchewan were rain-fed and increasing precipitation in water limited semi-arid to sub-humid environments generally leads to improved crop production. Following the precipitation factors, scientific and technological progress and agricultural inputs evidently influenced the grain yield-based WFs of all crops. Overall, cultural practices including cropping system, cultivar, soil fertility and inoculation all had significant impacts on crop WFs, although the degree of the impact varied with the cultural practices evaluated. Correlation analysis showed that crop WFs were negatively correlated with crop grain, or protein yields, but were not related to the total amount of water used by the crop. Therefore, the improvement of cultural practices promoting general plant health and development of cultivars with improved yield potential using the same amount of water will be of great importance in improving crop WFs.
Technological advances in crop production have been found to be the principal contributors to offset WF increase [46]. In this study, scientific and technological progress was also a major factor influencing WFs in Saskatchewan. The adaptation strategies should be considered to avoid or at least reduce the negative effects of climate change on the WFs. Practically, farmers have adopted field management approaches such as reduced or zero tillage that help to mitigate the adverse impact of climate change [66]. More soil water is conserved in summer fallow under reduced tillage compared with conventional tillage methods [66,67]. New crop cultivars with improved shoot and root architecture would promote the effective capture and utilization of solar radiation, carbon dioxide, and rain and soil stored water; thus, they are recommended to cope with climate change [68,69]. New crop cultivars are expected to perform well with respect to WUE when they are bred for high yields in semi-arid conditions [70,71]. Moreover, adaptation strategies, which exploit the possible positive climate factors, should be considered. We should also be prepared to take advantage of opportunities of climate change such as increasing heat, solar radiation and precipitation to promote crop production. Temperature, the amount and timing of rainfall, wind, and evaporation all influence the need for supplemental water for optimum plant growth [72].
3.6. Reduction Potential of Crop WFs
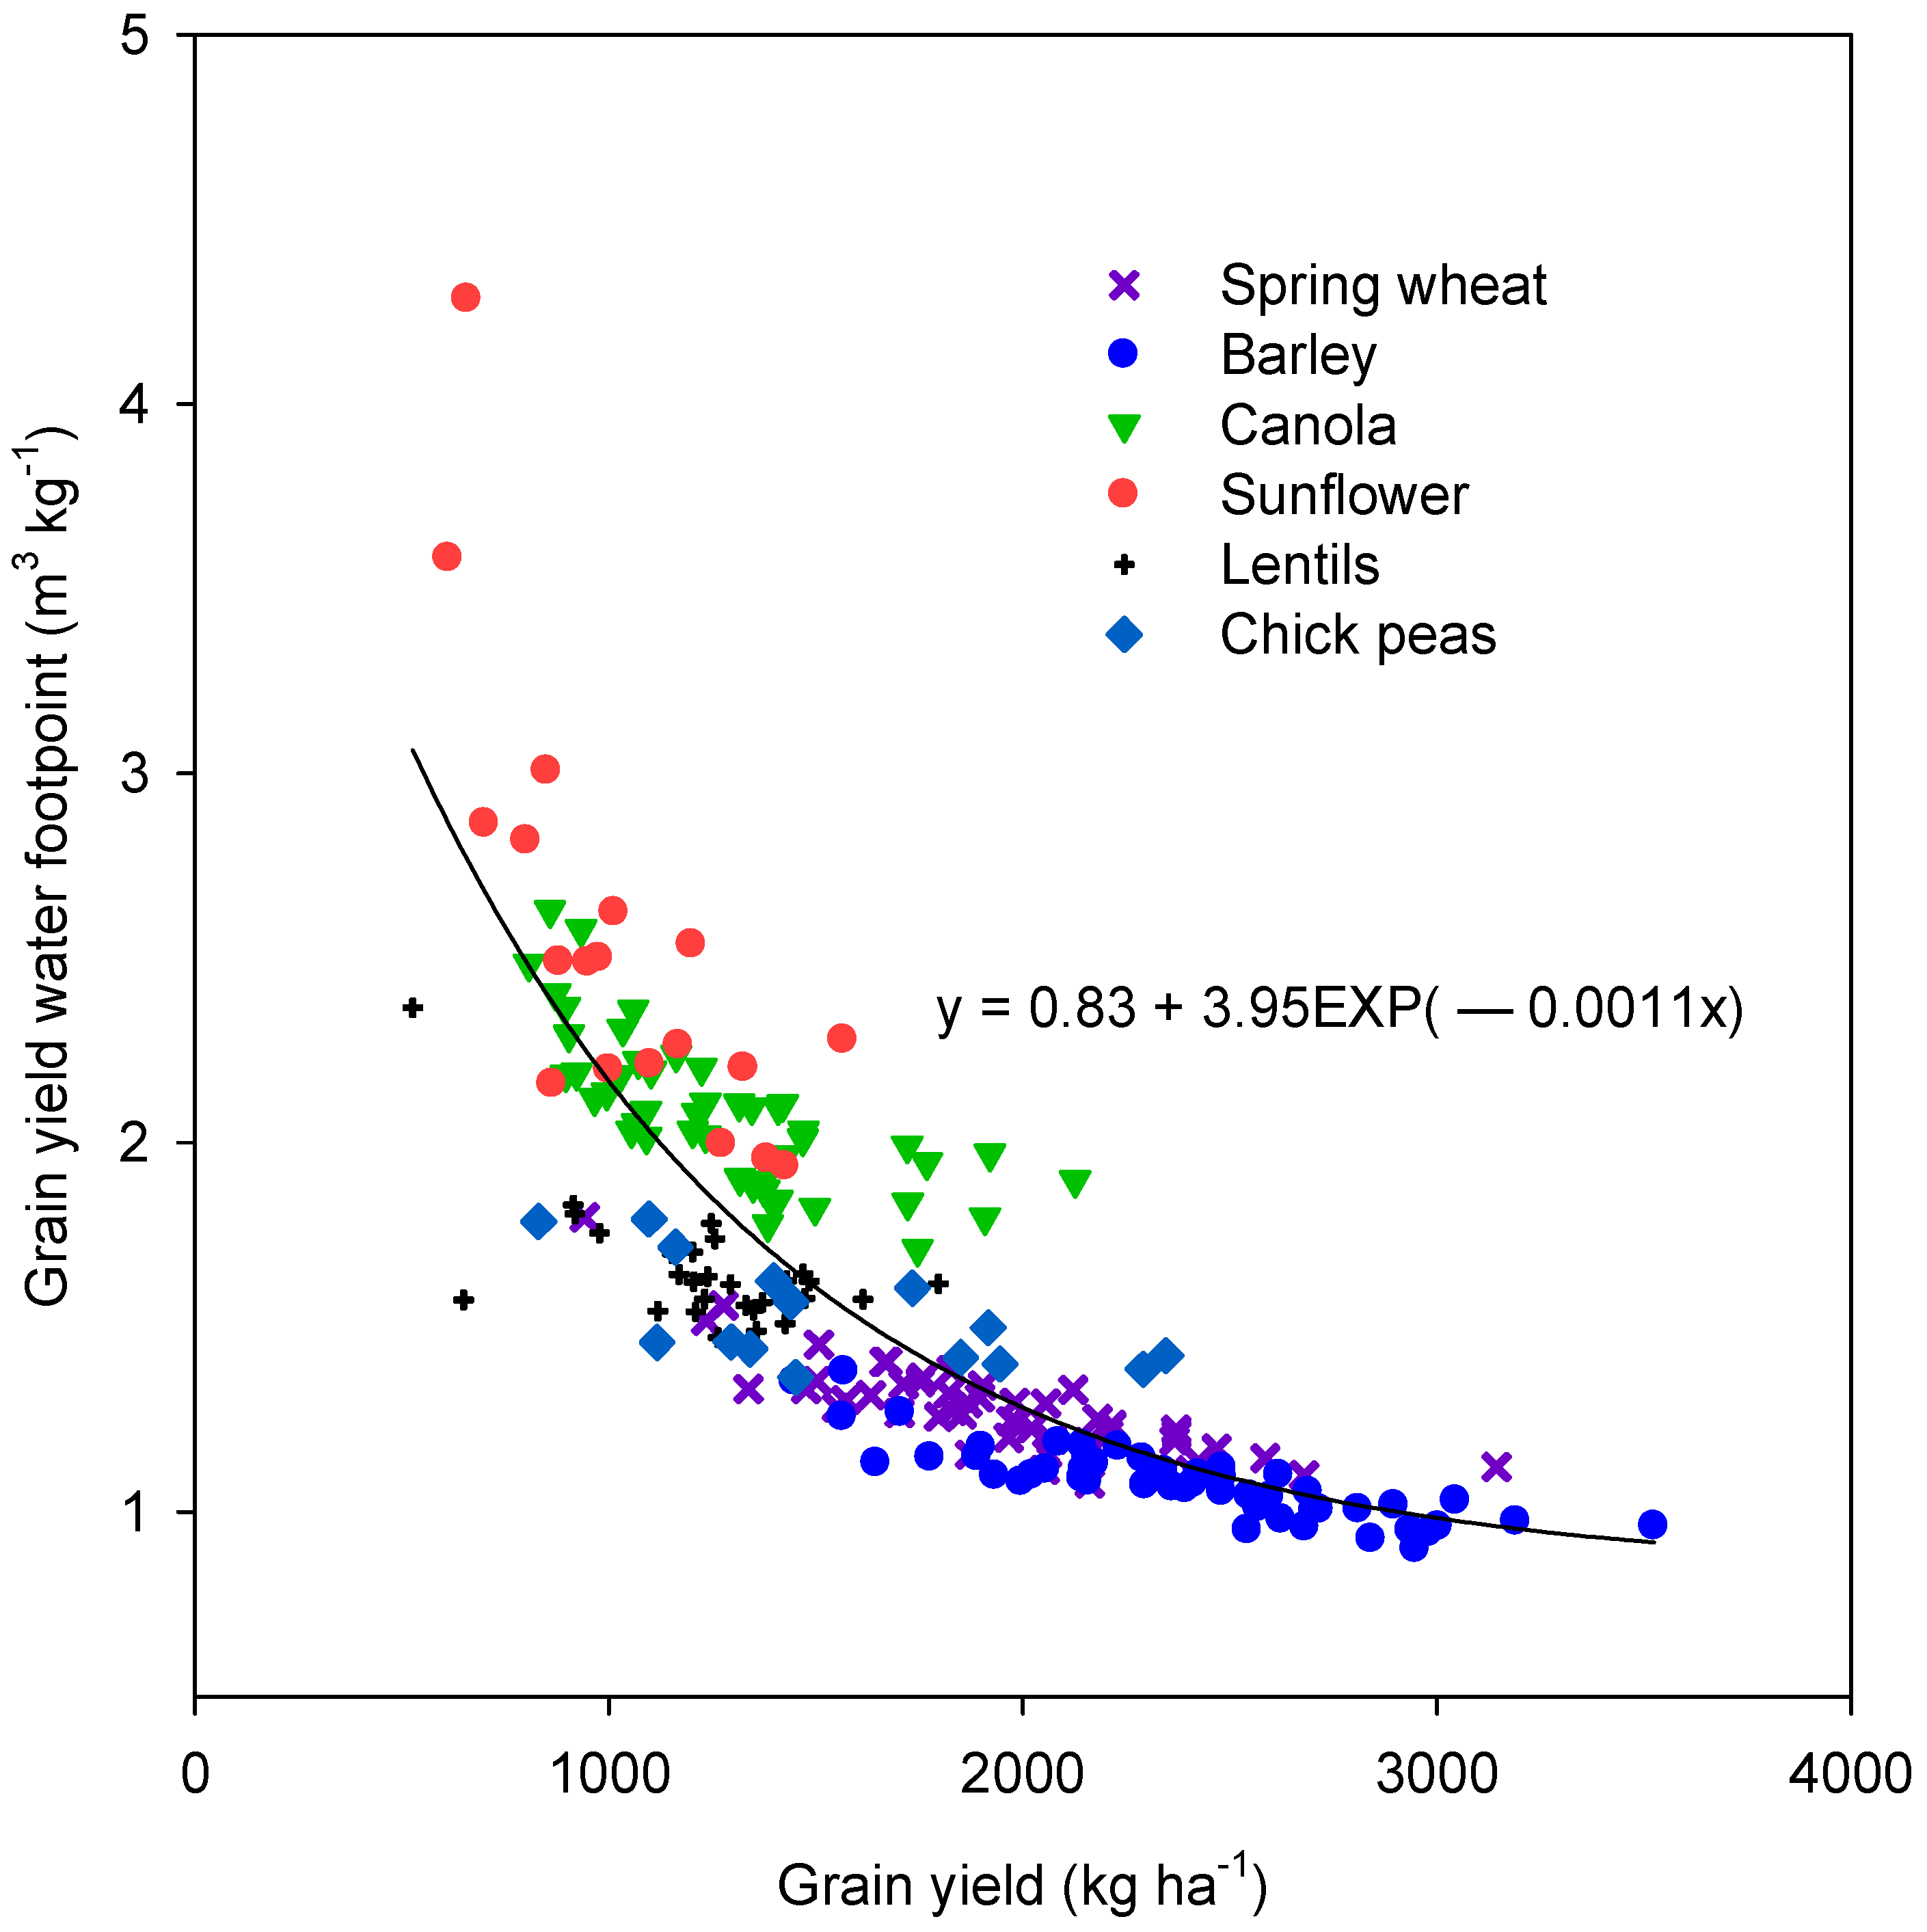
Three stages can be parsed out from the exponential curve (Figure 9): stage I with yield <1500 kg ha−1 (the WFs significantly decreased with the increasing grain yields), stage II with yield range between 1500 and 2500 kg ha−1 (the WFs slowly decreased with increased grain yields), and stage III with yield >2500 kg ha−1 (the WFs were nearly stable with increased grain yields). Most of the data fell into stage I for sunflower and canola (Figure 9), indicating the large opportunity to improve those crops’ WFs. For lentil and chickpea, many of the data points fell into stage I, but those data points showed a relatively slow decreasing trend; the other data points that fell into stage II showed a stable trend (Figure 9). Most of the data points for spring wheat and barley fell into stages II and III, respectively. In stage III, barley had more data points than spring wheat did.
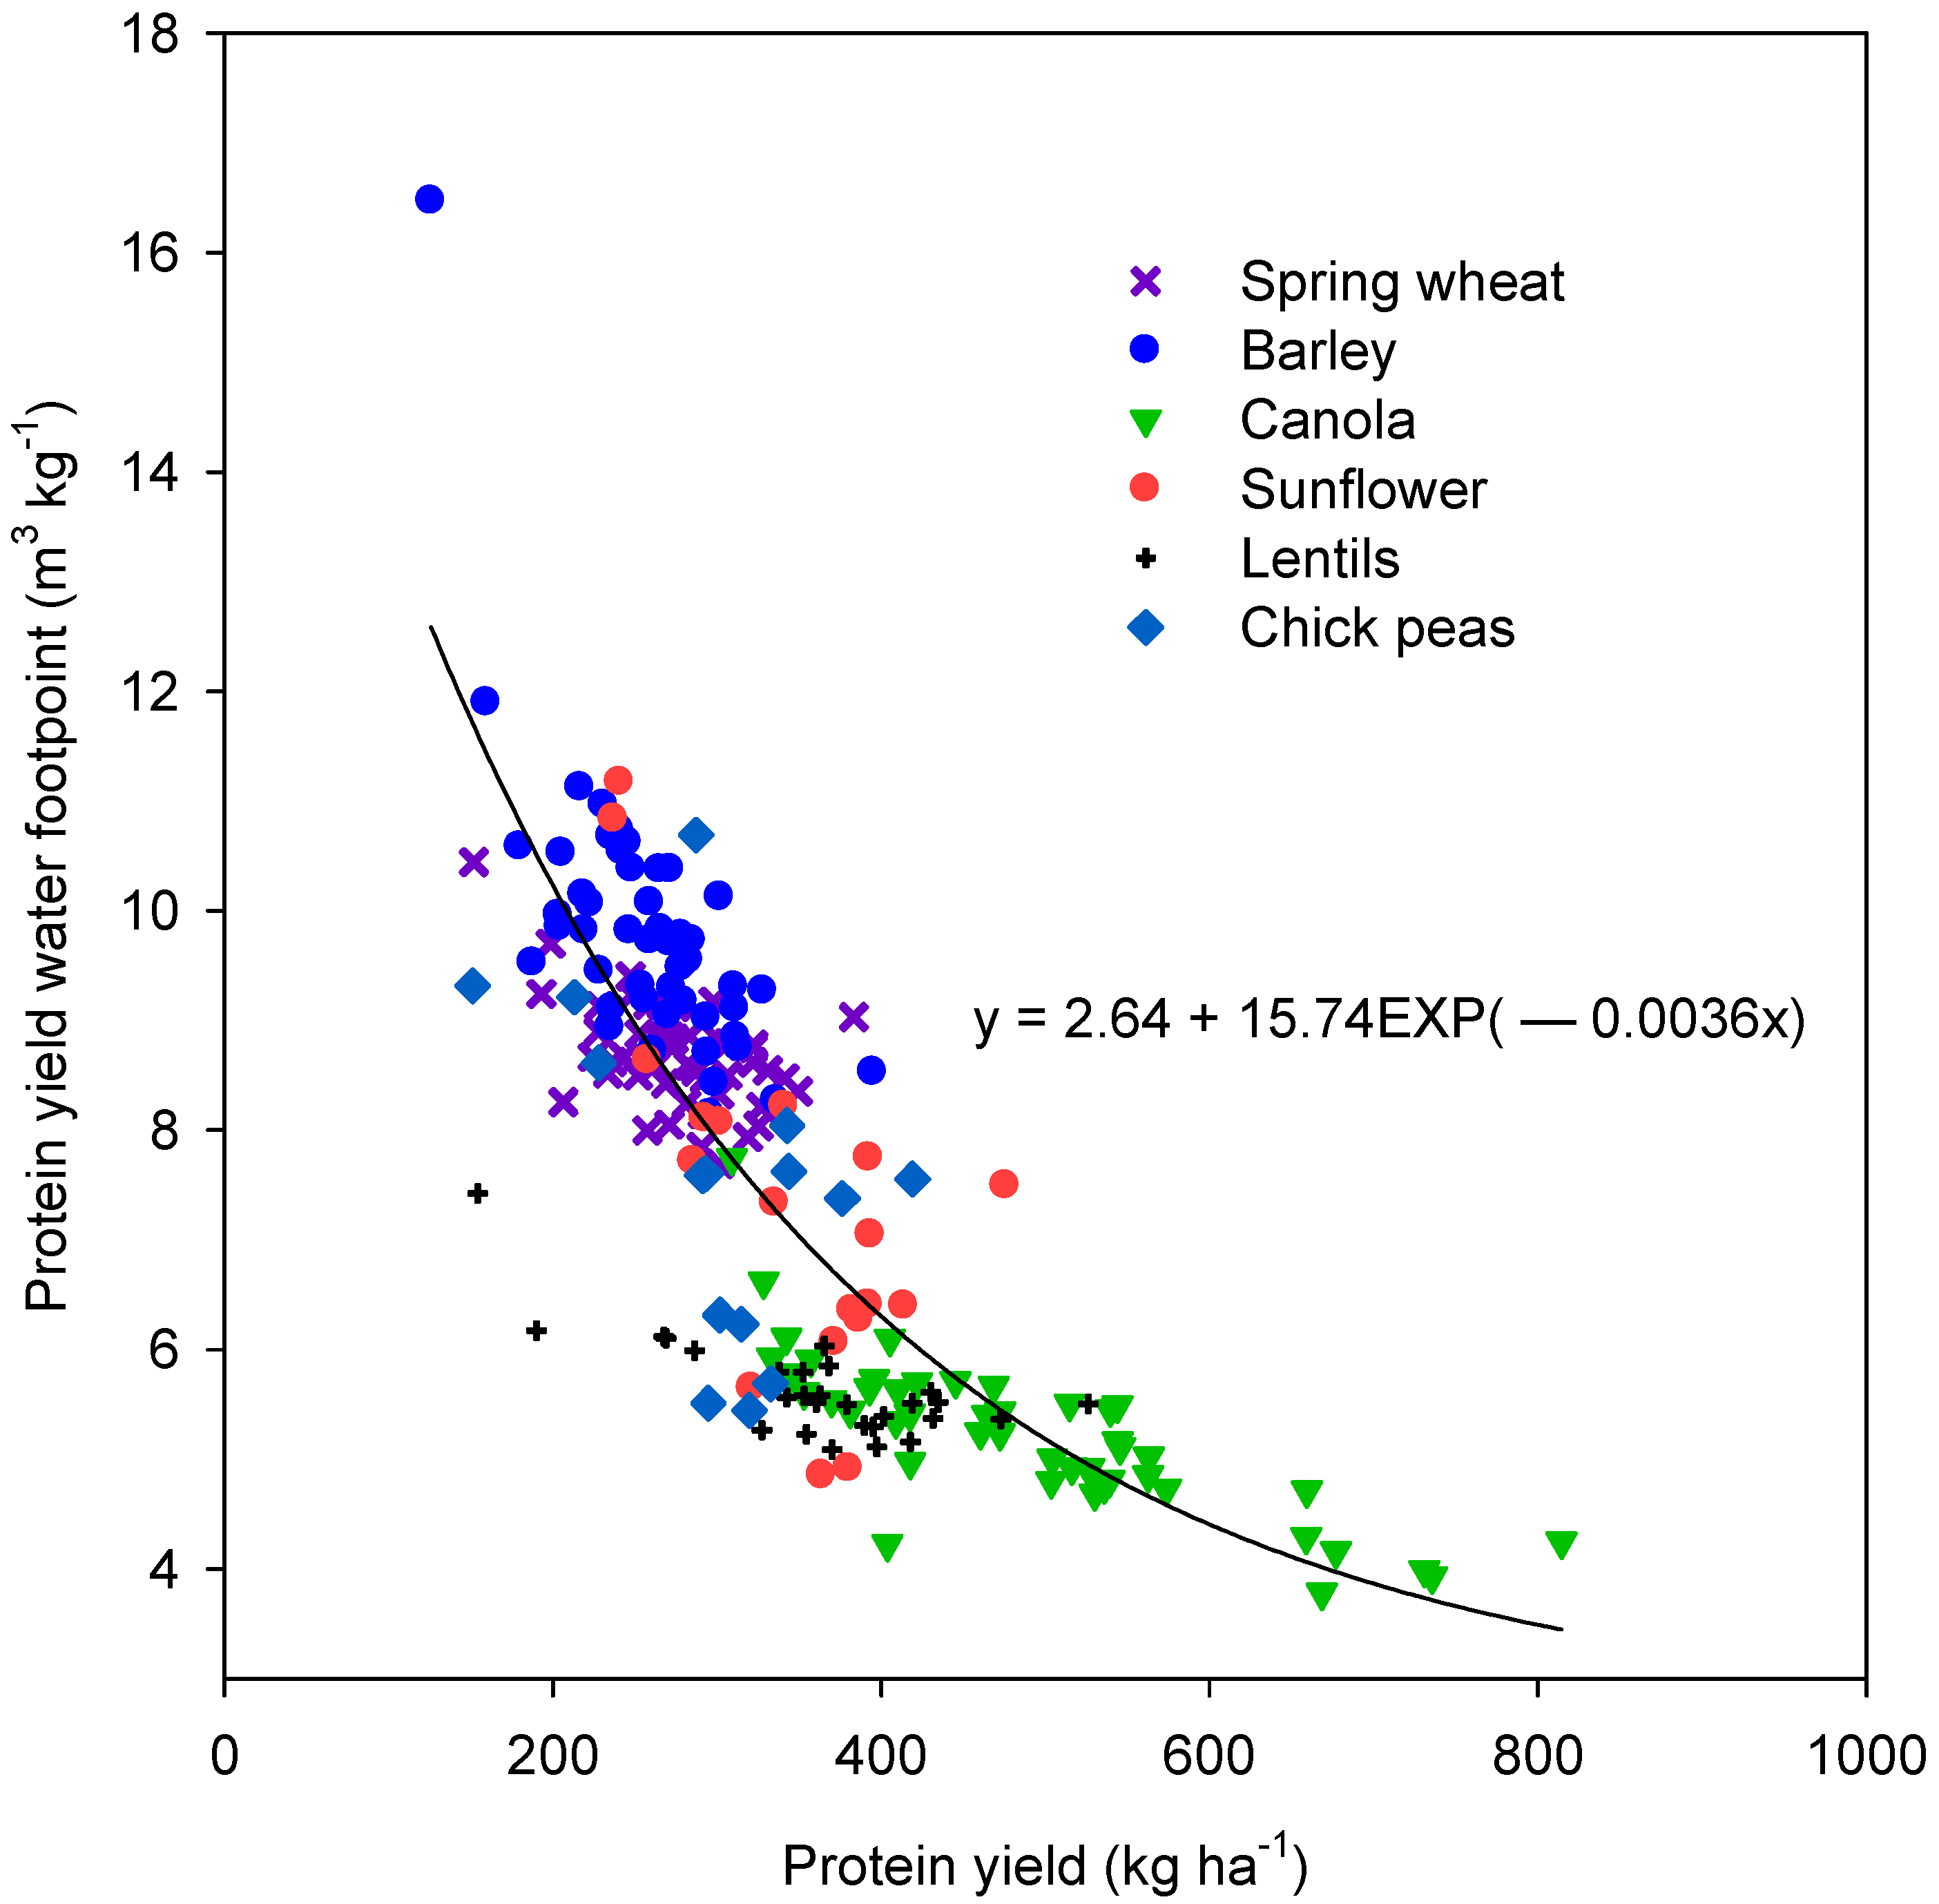
Three stages can also be identified from the relationship between protein yield-based WFs and protein yields (Figure 10): stage I with protein yield <400 kg ha−1 (the total protein-based WF significantly decreased with increasing protein yields), stage II with protein yield between 400 and 600 kg ha−1 (the protein yield-based WFs slowly decreased with increasing protein yields), and stage III with protein yield >600 kg ha−1 (the protein yield-based WFs were nearly stable with increasing protein yields). Most data points of spring wheat, barley, sunflower, and chickpea fell into stage I, and some of the sunflower data points fell into stage II (Figure 10). Although some data points of lentil fell into stage I, these points showed a relatively slow decreasing trend. Most data points of canola fell into stage III. The data points of spring wheat, barley, sunflower, and chickpea were mixed with a limited range in protein yield between 200 and 400 kg ha−1 (Figure 10). Meanwhile, the protein yields of canola and lentil had relatively large value ranges between 300 and 800 kg ha−1 and between 180 and 550 kg ha−1, respectively. These findings, together with the relative low protein yield-based WFs of canola and lentil, implied that their protein yields had good adaptability to the local social-economic and environmental conditions in Saskatchewan.
The relationship between grain yield and water use provides information to help fit these crops into a rotation for semiarid prairies. The grain yields of wheat and pea are responsive to water availability, but they maintain appreciable (500 kg ha−1) grain yield production even under extreme drought conditions. The yield plasticity of these crops makes them ideally suited to semiarid climates where water supply is variable and drought is frequent. In addition, some drought stress can increase the yields of lentil and chickpea, and these crops maintain some yield (300 kg ha−1) under severe drought conditions. Hence, lentil and chickpea are suitable for production on crop stubble where drought stress is expected in a dry year. Although their grain yield was not particularly responsive to water availability, the Brassica oilseeds produced well under conditions with large amounts of available water. Brassica oilseeds require more water to achieve a given production level and to maintain a high harvest index. Therefore, Brassica oilseeds are not as well adapted to semiarid climate as wheat or pulse crops are [24].
The differences between wheat, pea, and Brassica oilseeds in terms of physiological responses to drought help explain the grain yield differences observed in this study. Angadi et al. found that high-yielding crops such as pea and wheat maintain tissue turgor over a wider range of water stress levels in comparison with Brassica oilseeds [73]. Pea has a more plastic cell wall than other crops that helps it to maintain higher tissue turgor. Meanwhile, wheat, despite experiencing the highest stress levels (lowest cell water potential), maintained positive tissue turgor through osmotic adjustment. Over the same range of water availabilities, Brassica oilseeds produced low yields because they responded to intermediate water stress with poor osmotic adjustment and rigid tissue, resulting in early turgor loss. Turgor maintenance over a wide range of tissue water potentials enables the translocation of photosynthates to the grains. Thus, pulses are more adapted to water stress than Brassica oilseeds are.
3.7. Implications of Current Study
This study provides a long-term analysis of crop WFs for a Canadian prairie scenario over the past five decades. The analysis encompasses grain and protein yield-based WFs, which were determined for the three main types of crops, namely, cereals, oilseeds, and pulses. The WFs and the virtual water flow assessment can help inform production and trade decisions, promote the production of goods most suited to local environmental conditions, enhance the marketing of identified agriculture products produced in Saskatchewan as having low WFs, and assist in the development and adoption of technology that promotes WUE. For instance, the WF assessment in this study indicated that the considerable potential to improve WFs in crop production, especially in areas where low yields are identified and production limitations can be overcome. Moreover, the decreasing crop grain yield-based WFs over time implies that efforts to improve rainfall WUE in Saskatchewan have been successful over the past five decades.
Pulse production has risen in importance over the past decades so as to increase the site-specific productivity in Saskatchewan and the competitiveness of small-scale farmers around the world. Pulse cropping not only provides excellent income opportunities for growers but also serves as a pivotal approach to provide healthy diets to consumers and meeting the global demand for protein. In this respect, pulses have a low protein yield-based WF. In addition to the known benefits of pulses, (1) pulses use half the non-renewable energy inputs of other crops; (2) pulses are a low carbon footprint food; and (3) pulses improve the sustainability of cropping systems. The results indicated that pulse crops such as lentil and chickpea can potentially reduce the protein-based WFs in our food production system. Moreover, the results should help demonstrate the major role of pulses in improving the sustainability of agriculture, particularly in prairie areas, and its positive impact on the environment.
4. Conclusions
This study showed that crop species plays a major role in the improvement of soil water use and its efficiency. The study included two pulses (lentil and chickpea) as well as spring wheat, barley, canola, and sunflower. Of the crops studied, wheat and barley had the highest yields and highest WUE, and wheat used the least amount of water. Chickpea and lentil produced good yields even when water was limited. Under severe drought conditions, in which some crops did not produce any appreciable yields, chickpea and lentil were able to maintain some yields. We conclude that pulse crops are well-suited to low moisture conditions. Whereas the water use of lentil and chickpea were generally similar, and the water use among oilseeds, pulses, and wheat showed great difference. Comparatively, the grain yield-based WFs of pulse was higher than those of cereal crops, whereas the protein yield-based WFs in pulse crops tended to be low because of their high protein content. Under the conditions of improved protein consumption and healthy living in the future, pulse crops may be a preferred crop. The findings from this study can be used to develop rotation systems for efficient water use.
Author Contributions
D.D. and Y.Z. analyzed the data; Y.Z., H.G. and B.S. contributed reagents/materials/analysis tools; Y.Z. and D.D. wrote the manuscript. X.L., J.S., and B.S. reviewed and edited the manuscript.
Funding
The research was funded by the Saskatchewan Pulse Growers [No. AGR1611].
Conflicts of Interest
The authors declare no conflict of interest.
References
- Knights, E.I.; Acikgoz, A.; Warkentin, T.; Bejiga, G.; Yadav, S.S.; Sandhul, I.S. Area, production distribution. In Chickpea Breeding and Management; Yadav, S.S., Redden, R.J., Chen, W., Sharma, S., Eds.; CABI International: Cambridge, MA, USA, 2007; pp. 167–179. [Google Scholar]
- Suleimenov, M. Dryland agriculture in northeastern Europe and northwest Asia. In Dryland Agriculture, 2nd ed.; Agronomy Monograph No. 23; ASA-CSSA-SSSA: Madison, WI, USA, 2006; pp. 625–670. [Google Scholar]
- Gan, Y.; Goddard, T. Roles of annual legumes in no-till farming systems. In No-Till Farming Systems, World Association of Soil and Water Conservation; Goddard, T., Zoebisch, M.A., Gan, Y., Ellis, W., Watson, A., Sombatpanit, S., Eds.; Funny Publication: Bangkok, Thailand, 2008; pp. 279–289. [Google Scholar]
- Zentner, R.P.; Wall, D.D.; Nagy, C.N.; Smith, E.G.; Young, D.L.; Miller, P.R.; Campbell, C.A.; McConkey, B.G.; Brandt, S.A.; Lafond, G.P.; et al. Economics of crop diversification and soil tillage opportunities in the Canadian Prairies. Agron. J. 2002, 94, 216–230. [Google Scholar] [CrossRef]
- Walley, F.L.; Clayton, G.W.; Miller, P.R.; Carr, P.M.; Lafond, G.P. Nitrogen economy of pulse crop production in the northern Great Plains. Agron. J. 2007, 99, 1710–1718. [Google Scholar] [CrossRef]
- Shiklomanov, I.A.; Rodda, J.C. World Water Resources at the Beginning of the Twenty-First Century; Cambridge University Press: Cambridge, UK, 2003. [Google Scholar]
- Sun, S.; Wu, P.; Wang, Y.; Zhao, X. Temporal variability of water footprint for Maize production: The case of Beijing from 1978 to 2008. Water Resour. Manag. 2013, 27, 2447–2463. [Google Scholar] [CrossRef]
- IPCC. Climate Change: Synthesis Report. Contribution of Working Groups I, II and III to the Fourth Assessment Report of the Intergovernmental Panel on Climate Change; IPCC: Geneva, Switzerland, 2007; p. 104. [Google Scholar]
- Zentner, R.P.; Campbell, C.A.; Biederbeck, V.O.; Miller, P.R.; Selles, F.; Fernandez, M.R. In search of sustainable cropping system for the semiarid Canadian prairies. J. Sustain. Agric. 2001, 18, 117–136. [Google Scholar] [CrossRef]
- Peterson, G.A.; Westfall, D.G. Managing precipitation use in sustainable dryland agroecosystems. Ann. Appl. Biol. 2004, 144, 127–138. [Google Scholar] [CrossRef]
- Felter, D.G.; Lyon, D.J.; Nielsen, D.C. Evaluating crops for a flexible summer fallow cropping system. Agron. J. 2006, 89, 1510–1517. [Google Scholar] [CrossRef]
- Johnston, A.M.; Tanaka, D.L.; Miller, P.R.; Brandt, S.A.; Nielsen, D.C.; Lafond, G.P.; Riveland, N.R. Oilseed crops for semiarid cropping systems in the Northern Great Plains. Agron. J. 2002, 94, 231–240. [Google Scholar] [CrossRef]
- Miller, P.R.; McConkey, B.G.; Clayton, G.W.; Brandt, S.A.; Staricka, J.A.; Johnston, A.M.; Lafond, G.P.; Schatz, B.G.; Baltensperger, D.D.; Neill, K.E. Pulse Crop Adaptation in the Northern Great Plains. Agron. J. 2002, 94, 261–272. [Google Scholar] [CrossRef]
- Passioura, J. Increasing crop productivity when water is scarce- from breeding to field management. Agric. Water Manag. 2006, 80, 176–196. [Google Scholar] [CrossRef]
- Campbell, C.A.; Zentner, R.P.; Janzen, H.H.; Bowren, K.E. Crop Rotation Studies on the Canadian Prairies; Publ #184/E; Canadian Govt. Publ. Centre, Supply & Services Canada: Hull, QC, Canada, 1990; p. 133. [Google Scholar]
- Subbarao, G.V.; Johansen, C.; Slinkard, A.E.; Nageshwara Rao, R.C.; Saxena, N.P.; Chauhan, Y.S. Strategies for improving drought resistance in grain legumes. Crit. Rev. Plant Sci. 1995, 14, 469–523. [Google Scholar] [CrossRef]
- Tonitto, C.; David, M.B.; Drinkwater, L.E. Replacing bare fallows with cover crops in fertilizer-intensive cropping systems: A Meta-analysis of crop yield and N dynamics. Agric. Ecosyst. Environ. 2006, 112, 58–72. [Google Scholar] [CrossRef]
- Campbell, C.A.; Zentner, R.P.; McConkey, B.G.; Selles, F. Effect of nitrogen and snow management on efficiency of water use by spring wheat grown annually on zero-tillage. Can. J. Plant Sci. 1992, 72, 271–279. [Google Scholar] [CrossRef] [Green Version]
- Akinremi, O.O.; McGinn, S.M.; Cutforth, H. Seasonal and spatial patterns of rainfall trends on the Canadian Prairies. J. Clim. 2000, 14, 2177–2182. [Google Scholar] [CrossRef]
- Cutforth, H.W. Climate change in the semiarid prairie of southwestern Saskatchewan: Temperature, precipitation, wind and incoming solar energy. Can. J. Soil Sci. 2000, 80, 375–385. [Google Scholar] [CrossRef]
- Miller, P.R.; McDonald, C.L.; Derksen, D.A.; Waddington, J. The adaptation of seven broadleaf crops to the dry semiarid prairie. Can. J. Plant Sci. 2001, 81, 29–43. [Google Scholar] [CrossRef] [Green Version]
- Miller, P.R.; Holmes, J.A. Cropping sequence effects of four broadleaf crops on four cereal crops in the northern Great Plains. Agron. J. 2005, 97, 189–200. [Google Scholar] [CrossRef]
- Angadi, S.V.; McConkey, B.G.; Cutforth, H.W.; Miller, P.R.; Ulrich, D.; Selles, F.; Volkmar, K.M.; Entz, M.H.; Brandt, S.A. Adaptation of alternative pulse and oilseed crops to the semiarid Canadian Prairie: Seed yield and water use efficiency. Can. J. Plant Sci. 2008, 88, 425–438. [Google Scholar] [CrossRef] [Green Version]
- Gan, Y.T.; Campbell, C.A.; Liu, L.; Basnyat, P.; McDonald, C.L. Water use and distribution profile under pulse and oilseed crops in semiarid northern high latitude areas. Agric. Water Manag. 2009, 96, 337–348. [Google Scholar] [CrossRef]
- Katerji, N.; Campi, P.; Mastrorilli, M. Productivity, evapotranspiration, and water use efficiency of corn and tomato crops simulated by AquaCrop under contrasting water stress conditions in the Mediterranean region. Agric. Water Manag. 2013, 130, 14–26. [Google Scholar] [CrossRef]
- Zwart, S.J.; Bastiaanssen, W.G.M. Review of measured crop water productivity values for irrigated wheat, rice, cotton, and maize. Agric. Water Manag. 2004, 69, 115–133. [Google Scholar] [CrossRef]
- Hoekstra, A.Y. Virtual Water Trade: Proceedings of the International Expert Meeting on Virtual Water Trade; Value of Water Research Report Series No. 12; UNESCO-IHE: Delft, The Netherlands, 2003. [Google Scholar]
- Hoekstra, A.Y.; Mekonnen, M.M. The water footprint of humanity. Proc. Natl. Acad. Sci. USA 2012, 109, 3232–3237. [Google Scholar] [CrossRef] [PubMed] [Green Version]
- Hoekstra, A.Y.; Wiedmann, T.O. Humanity’s unsustainable environmental footprint. Science 2014, 344, 1114–1117. [Google Scholar] [CrossRef] [PubMed]
- Ercin, A.E.; Hoekstra, A.Y. Water footprint scenarios for 2050: A global analysis. Environ. Int. 2014, 64, 71–82. [Google Scholar] [CrossRef] [PubMed]
- Ma, J.; Wang, D.X.; Lai, H.L.; Wang, Y. Water footprint: An application in water resources research. Resour. Sci. 2005, 27, 96–100. (In Chinese) [Google Scholar]
- Mekonnen, M.M.; Hoekstra, A.Y. The green, blue and grey water footprint of crops and derived crop products. Hydrol. Earth Syst. Sci. 2011, 15, 1577–1600. [Google Scholar] [CrossRef] [Green Version]
- Sun, S.K.; Wu, P.T.; Wang, Y.B.; Zhao, X.N.; Liu, J.; Zhang, X.H. The temporal and spatial variability of water footprint of grain: A case study of an irrigation district in China from 1960 to 2008. J. Food Agric. Environ. 2012, 10, 1246–1251. [Google Scholar]
- Hoekstra, A.Y.; Hung, P.Q. Virtual water trade. A quantification of virtual water flows between nations in relation to international crop trade. Value Water Res. Rep. Ser. 2002, 11, 166. [Google Scholar]
- Allen, R.G.; Pereira, L.S.; Raes, D.; Smith, M. Crop Evapotranspiration-Guidelines for Computing Crop Water Requirements-FAO Irrigation and Drainage Paper 56; FAO: Rome, Italy, 1998. [Google Scholar]
- FAO—Food and Agriculture Organization of the United Nations. FAOSTAT, 2017. Available online: http://www.fao.org/faostat/en/#data (accessed on 25 February 2018).
- FAO. CropWat 8.0, Edited, Land and Water Development Division; Food and Agriculture Organization of the United Nations: Rome, Italy, 2009. [Google Scholar]
- Hoekstra, A.Y.; Hung, P.Q. Globalization of water resources: International virtual water flows in relation to crop trade. Glob. Environ. Chang. 2005, 15, 45–56. [Google Scholar] [CrossRef]
- Hoekstra, A.Y.; Chapagain, A.K. Globalization of Water: Sharing the Planet’s Freshwater Resources; Blackwell Publishing: Oxford, UK, 2008. [Google Scholar]
- Hoekstra, A.Y.; Chapagain, A.K.; Aldaya, M.M.; Mekonnen, M.M. The Water Footprint Assessment Manual: Setting the Global Standard; Earthscan: London, UK, 2011. [Google Scholar]
- Shipley, B. Cause and Correlation in Biology: A User’s Guide to Path Analysis, Structural Equations and Causal Inference; Cambridge University Press: Cambridge, UK, 2000. [Google Scholar]
- Wright, S. The method of path coefficients. Ann. Math Stat. 1934, 5, 161–215. [Google Scholar] [CrossRef]
- Doorenbos, J.; Kassam, A.H. Yield response to water. Irrig. Drain. Pap. 1979, 33, 257. [Google Scholar]
- Zhao, C.; Chen, B. Driving force analysis of the agricultural water footprint in China based on the LMDI method. Environ. Sci. Technol. 2014, 48, 12723–12731. [Google Scholar] [CrossRef] [PubMed]
- Xu, Y.; Huang, K.; Yu, Y.; Wang, X. Changes in water footprint of crop production in Beijing from 1978 to 2012: A logarithmic mean Divisia index decomposition analysis. J. Clean. Prod. 2015, 87, 180–187. [Google Scholar] [CrossRef]
- Yuan, Z.F.; Zhou, J.Y.; Guo, M.C.; Lei, X.Q.; Xie, X.L. Decision coefficient-the decision index of path analysis. J. Northwest Sci. Tech. Univ. Agric. For. 2001, 29, 133–135. [Google Scholar]
- Zhang, P.; Wang, Y.K.; Zhan, J.W.; Zhang, L.J. Simulation of stem diameter maximum daily shrinkage for peach under full. Irrig. Trans. CSAE 2010, 6, 38–43. [Google Scholar]
- Turner, N.C. Further progress in crop water relations. Adv. Agron. 1997, 58, 293–335. [Google Scholar]
- Cutforth, H.W.; Angadi, S.V.; McConkey, B.G.; Entz, M.H.; Ulrich, D.; Volkmar, K.M.; Miller, P.R.; Brandt, S.A. Comparing plant water relations for wheat with alternative pulse and oilseed crops grown in the semiarid Canadian prairie. Can. J. Plant Sci. 2009, 89, 823–835. [Google Scholar] [CrossRef] [Green Version]
- Thomson, B.D.; Siddique, K.H.M.; Barr, M.D.; Wilson, J.M. Grain legume species in low rainfall Mediterranean-type environments. I. Phenology and seed yield. Field Crops Res. 1997, 54, 173–187. [Google Scholar] [CrossRef]
- Merrill, S.D.; Tanaka, D.L.; Hanson, J.D. Root length growth of eight crop species in Haplustoll soils. Soil Sci. Soc. Am. J. 2002, 66, 913–923. [Google Scholar] [CrossRef]
- Miller, P.R.; Gan, Y.; McConkey, B.G.; McDonald, C.L. Pulse crops in the Northern Great Plains. I. Grain productivity and residual effects on soil water and nitrogen. Agron. J. 2003, 95, 972–979. [Google Scholar] [CrossRef]
- Gan, Y.T.; Wang, J.; Bing, D.J.; Miller, P.R.; McDonald, C.L. Water use of pulse crops at various plant densities under fallow and stubble conditions in a semiarid environment. Can. J. Plant Sci. 2007, 87, 719–722. [Google Scholar] [CrossRef] [Green Version]
- Qian, B.D.; De Jong, R.; Gameda, S. Multivariate analysis of water-related agroclimatic factors limiting spring wheat yields on the Canadian prairies. Eur. J. Agron. 2009, 30, 140–150. [Google Scholar] [CrossRef]
- De Jong, E.; Cameron, D.R. Efficiency of water use by agriculture for dryland crop production. In Prairie Production Symp. Soils and Land Resources; Advisory Committee to the Canadian Wheat Board: Saskatoon, SK, Canada, 1980. [Google Scholar]
- Zhang, H.; Pala, M.; Oweis, T.; Harris, H. Water use and water-use efficiency of chickpea and lentil in a Mediterranean environment. Aust. J. Agric. Res. 2000, 51, 295–304. [Google Scholar] [CrossRef]
- Miller, P.R.; Brandt, S.A.; McDonald, C.L.; Waddington, J. Chickpea, lentil, and pea response to delayed spring seeding on the Northern Great Plains. Can. J. Plant Sci. 2006, 86, 1059–1070. [Google Scholar] [CrossRef]
- Liu, L.P.; Gan, Y.T.; Bueckert, R.; Van Rees, K.; Warkentin, T.D. Fine root distributions in oilseed and pulse crops. Crop Sci. 2010, 50, 222–226. [Google Scholar] [CrossRef]
- Bell, J.M. Factors affecting the nutritional value of canola meal: A review. Can. J. Anim. Sci. 1993, 73, 689–697. [Google Scholar] [CrossRef] [Green Version]
- Bulman, P.; Mather, D.E.; Smith, D.L. Genetic improvement of spring barley cultivars grown in eastern Canada from 1910 to 1988. Euphytica 1993, 71, 35–48. [Google Scholar] [CrossRef]
- Gauer, L.E.; Grant, C.A.; Bailey, L.D.; Gehl, D.T. Effects of nitrogen fertilization on grain protein content, nitrogen uptake, and nitrogen use efficiency of six spring wheat (Triticum aestivum L.) cultivars, in relation to estimated moisture supply. Can. J. Plant Sci. 1992, 72, 235–241. [Google Scholar] [CrossRef]
- Grami, B.; Stefansson, B.R. Gene action for protein and oil content in summer rape. Can. J. Plant Sci. 1977, 57, 625–631. [Google Scholar] [CrossRef]
- Wang, N. Effect of variety and crude protein content on dehulling quality and on the resulting chemical composition of red lentil (Lens culinaris). J. Sci. Food Agric. 2008, 88, 885–890. [Google Scholar] [CrossRef]
- Wang, N.; Daun, J.K. Effect of variety and crude protein content on nutrients and certain antinutrients in field peas (Pisum sativum). J. Sci. Food Agric. 2004, 84, 1021–1029. [Google Scholar] [CrossRef]
- Campbell, C.A.; Tessier, J.S.J.; Selles, F. Challenges and limitations to adoption of conservation tillage soil organic matter, fertility, moisture and soil environment. In Proceedings of the 34th Annual CSSS/AIC Meeting, Calgary, AB, Canada, 21–24 August 1988; pp. 140–185. [Google Scholar]
- Xiao, D.; Tao, F.; Liu, Y.; Shi, W.; Wang, M.; Liu, F.; Zhang, S.; Zhu, Z. Observed changes in winter wheat phenology in the North China Plain for 1981–2009. Int. J. Biometeorol. 2013, 57, 275–285. [Google Scholar] [CrossRef] [PubMed]
- Christensen, N.B.; Jones, T.L.; Kauta, G.J. Infiltration characteristics under no-till and clean-till furrow irrigation. Soil Sci. Soc. Am. J. 1994, 58, 1495–1500. [Google Scholar] [CrossRef]
- Ding, D.; Feng, H.; Zhao, Y.; Liu, W.; Chen, H.; He, J. Impact assessment of climate change and later-maturing cultivars on winter wheat growth and soil water deficit on the Loess Plateau of China. Clim. Chang. 2016, 138, 157–171. [Google Scholar] [CrossRef]
- Smith, W.N.; Grant, B.B.; Desjardins, R.L.; Kroebel, R.; Li, C.; Qian, B.; Worth, D.E.; McConkey, B.G.; Drury, C.F. Assessing the effects of climate change on crop production and GHG emissions in Canada. Agric. Ecosyst. Environ. 2013, 179, 139–150. [Google Scholar] [CrossRef]
- Zentner, R.P.; Campbell, C.A.; Selles, F.; McConkey, B.G.; Jefferson, P.G.; Lemke, R. Cropping frequency, wheat classes and flexible rotations: Effects on production, nitrogen economy, and water use in a Brown Chernozem. Can. J. Plant Sci. 2003, 83, 667–680. [Google Scholar] [CrossRef] [Green Version]
- Wang, H.; McCaig, T.N.; DePauw, R.M.; Clarke, J.M.; Lemke, R. Water use of some recent bread and durum wheat cultivars in western Canada. Can. J. Plant Sci. 2007, 87, 289–292. [Google Scholar] [CrossRef] [Green Version]
- Coote, D.R.; Gregorich, L.J. The Health of Our Water: Toward Sustainable Agriculture in Canada; Agriculture and Agri-Food Canada: Ottawa, CA, Canada, 2000; p. 19. [Google Scholar]
- Angadi, S.; McConkey, B.; Ulrich, D.; Cutforth, H.; Miller, P.; Entz, M.; Brandt, S.; Volkmar, K. Developing Viable Cropping Options for the Semiarid Prairies; Final Report; Western Grains Research Foundation: Saskatoon, SK, Canada, 1999. [Google Scholar]
Figure 1.
Agricultural crop districts in Saskatchewan from NO.4710 to NO.4791 on the Canadian prairies with shaded area showing cropland extracted from the map Land Cover for Agricultural Regions of Canada, circa 2000 (Agriculture and Agri-Food Canada 2013). Numbers are the codes of the Census Agricultural Regions.

Figure 2.
Temporal variations of effective precipitation, crop water requirement, and irrigation requirement for six crops in Saskatchewan from 1965 to 2014. (a) spring wheat; (b) barley; (c) canola; (d) sunflower; (e) lentil; (f) chickpea.
Figure 2.
Temporal variations of effective precipitation, crop water requirement, and irrigation requirement for six crops in Saskatchewan from 1965 to 2014. (a) spring wheat; (b) barley; (c) canola; (d) sunflower; (e) lentil; (f) chickpea.

Figure 3.
Inter-annual variability of total grain production, protein production, and seeded area of different crops in Saskatchewan from 1976 to 2016. (a) crop grain production; (b) crop protein production; (c) crop seeded areas.
Figure 3.
Inter-annual variability of total grain production, protein production, and seeded area of different crops in Saskatchewan from 1976 to 2016. (a) crop grain production; (b) crop protein production; (c) crop seeded areas.

Figure 4.
Variations of grain yields for six crops in Saskatchewan. The solid circles show the annual grain yields and the bars show the decadal average grain yields from 1965 to 2014. (a) spring wheat; (b) barley; (c) canola; (d) sunflower; (e) lentil; (f) chickpea. Note. * Significant difference at the 0.05 level; ** significant difference at the 0.01 level.

Figure 5.
Variations of protein yield for six crops in Saskatchewan. The solid circles show the annual protein yields and the bars show the decadal average protein yields from 1965 to 2014. (a) spring wheat; (b) barley; (c) canola; (d) sunflower; (e) lentil; (f) chickpea. Note: * Significant difference at the 0.05 level; ** significant difference at the 0.01 level.

Figure 6.
Variations of soil water storage and actual evapotranspiration for six crops in Saskatchewan from 1965 to 2014. (a) spring wheat; (b) barley; (c) canola; (d) sunflower; (e) lentil; (f) chickpea. Note: * Significant difference at the 0.05 level.
Figure 6.
Variations of soil water storage and actual evapotranspiration for six crops in Saskatchewan from 1965 to 2014. (a) spring wheat; (b) barley; (c) canola; (d) sunflower; (e) lentil; (f) chickpea. Note: * Significant difference at the 0.05 level.

Figure 7.
Variations of grain yield-based water footprints (WFs) for six crops in Saskatchewan. Filled dots showed the annual grain yield-based WFs and the bars show the decadal average grain yield-based WFs from 1965 to 2014. (a) spring wheat; (b) barley; (c) canola; (d) sunflower; (e) lentil; (f) chickpea. Note: * Significant difference at the 0.05 level.

Figure 8.
Variations of protein yield-based water footprints (WFs) for six crops in Saskatchewan. The filled dots show the annual protein yield-based WFs and the bars show the decadal average protein yield-based WFs from 1965 to 2014. (a) spring wheat; (b) barley; (c) canola; (d) sunflower; (e) lentil; (f) chickpea. Note: ** Significant difference at 0.01 level.

Figure 9.
Relationship between crop grain yield-based water footprints (WFs) and grain yields in Saskatchewan.
Figure 9.
Relationship between crop grain yield-based water footprints (WFs) and grain yields in Saskatchewan.

Figure 10.
Relationship between crop protein yield-based water footprints (WFs) and protein yields in Saskatchewan.
Figure 10.
Relationship between crop protein yield-based water footprints (WFs) and protein yields in Saskatchewan.


Table 1.
Crop parameters used as input data to CROPWAT model.
| Crop | Planting Date | Relative Crop Growing Stages | HI0 | Max Rooting Depth (m) | ||
|---|---|---|---|---|---|---|
| Lini | Lmid | Llate | ||||
| Spring wheat | 9 May | 0.3 | 1.15 | 0.3 | 39% | 1.2 |
| Barley | 10 May | 0.3 | 1.15 | 0.25 | 39% | 1.1 |
| Canola | 1 May | 0.7 | 1.05 | 0.95 | 27% | 0.5 |
| Sunflower | 1 May | 0.35 | 1.15 | 0.35 | 32% | 1.3 |
| Lentil | 20 April | 0.5 | 1.05 | 0.9 | 44% | 0.7 |
| Chick peas | 20 May | 0.4 | 1.15 | 0.35 | 50% | 1 |
Table 2.
Variations of the scientific and technological progress index for a decade divided by the average yield in 1965–2014.
Table 2.
Variations of the scientific and technological progress index for a decade divided by the average yield in 1965–2014.
| Years | Progress Index | |||||
|---|---|---|---|---|---|---|
| Spring Wheat | Barley | Canola | Sunflower | Lentils | Chick Peas | |
| 1965–1974 | 1.000 | 1.000 | 1.000 | \ | \ | \ |
| 1975–1984 | 1.116 | 1.084 | 1.147 | \ | \ | \ |
| 1985–1994 | 1.143 | 1.165 | 1.220 | 1.000 | 1 | \ |
| 1995–2004 | 1.233 | 1.245 | 1.236 | 1.173 | 1.013 | 1.000 |
| 2005–2014 | 1.364 | 1.295 | 1.524 | 1.515 | 1.166 | 1.547 |
Table 3.
Path coefficient analysis between grain yield-based water footprints (WFs) and their influencing factors.
Table 3.
Path coefficient analysis between grain yield-based water footprints (WFs) and their influencing factors.
| Influence Factors | Spring Wheat | Barley | Canola | Sunflower | Lentil | Chickpea |
|---|---|---|---|---|---|---|
| Scientific and technological progress | −1.299 | −1.142 | −0.721 | −1.310 | −1.036 | −2.102 |
| Agricultural product price * | −1.087 | −1.134 | −0.180 | −1.299 | −0.956 | −1.998 |
| Agricultural inputs | −1.355 | −1.262 | −0.718 | −1.282 | −1.099 | −2.359 |
| Population | −1.247 | −1.130 | 0.584 | −1.274 | −1.018 | −2.369 |
| Annual precipitation | −1.521 | −1.442 | −0.640 | −1.559 | −1.319 | −2.445 |
| Seasonal precipitation | −1.345 | −1.300 | −0.502 | −1.437 | −1.005 | −2.004 |
| Average daily temperature | 0.075 | 0.028 | 0.320 | 0.088 | 0.659 | 1.083 |
Note: * The agricultural product prices of spring wheat and sunflower are represented by wheat and oilseed food price indexes, respectively.
Table 4.
Path coefficient analysis between protein yield-based water footprints (WFs) and their influencing factors.
Table 4.
Path coefficient analysis between protein yield-based water footprints (WFs) and their influencing factors.
| Influence Factors | Spring Wheat | Barley | Canola | Sunflower | Lentil | Chickpea |
|---|---|---|---|---|---|---|
| Scientific and technological progress | −0.394 | −0.807 | −0.127 | −2.257 | −1.099 | −0.413 |
| Agricultural product price * | −0.311 | −1.127 | 0.150 | −2.314 | −0.998 | −0.238 |
| Agricultural inputs | −0.443 | −1.073 | −0.147 | −2.312 | −1.151 | −0.202 |
| Population | −0.448 | −1.088 | 0.270 | −2.169 | −1.103 | −0.399 |
| Annual precipitation | −0.785 | −1.197 | −0.302 | −2.306 | −1.436 | −0.982 |
| Seasonal precipitation | −0.773 | −0.984 | −0.293 | −2.023 | −1.135 | −1.138 |
| Average daily temperature | 0.127 | 0.383 | 0.245 | 0.203 | 0.648 | 0.641 |
Note: * The agricultural product prices of spring wheat and sunflower are represented by wheat and oilseed food price indexes, respectively.
© 2018 by the authors. Licensee MDPI, Basel, Switzerland. This article is an open access article distributed under the terms and conditions of the Creative Commons Attribution (CC BY) license (http://creativecommons.org/licenses/by/4.0/).
Share and Cite
MDPI and ACS Style
Ding, D.; Zhao, Y.; Guo, H.; Li, X.; Schoenau, J.; Si, B. Water Footprint for Pulse, Cereal, and Oilseed Crops in Saskatchewan, Canada. Water 2018, 10, 1609. https://doi.org/10.3390/w10111609
AMA Style
Ding D, Zhao Y, Guo H, Li X, Schoenau J, Si B. Water Footprint for Pulse, Cereal, and Oilseed Crops in Saskatchewan, Canada. Water. 2018; 10(11):1609. https://doi.org/10.3390/w10111609
Chicago/Turabian StyleDing, Dianyuan, Ying Zhao, Hui Guo, Xueyan Li, Jeff Schoenau, and Bingcheng Si. 2018. "Water Footprint for Pulse, Cereal, and Oilseed Crops in Saskatchewan, Canada" Water 10, no. 11: 1609. https://doi.org/10.3390/w10111609
Note that from the first issue of 2016, this journal uses article numbers instead of page numbers. See further details here.