Analysis of the Dynamic Changes of the Baiyangdian Lake Surface Based on a Complex Water Extraction Method
by
 , ,
, ,
Xiaoya Wang
1,2, 
Wenjie Wang
3,*,
Weiguo Jiang
1,2,4,*,
Kai Jia
1,2,
Pinzeng Rao
1,2 and
Jinxia Lv
1,2 1
State Key Laboratory of Remote Sensing Science, Jointly Sponsored by Beijing Normal University and Institute of Remote Sensing and Digital Earth of Chinese Academy of Sciences, Beijing 100875, China
2
Beijing Key Laboratory for Remote Sensing of Environment and Digital Cities, Faculty of Geographical Science, Beijing Normal University, Beijing 100875, China
3
Chinese Research Academy of Environmental Science, Beijing 100012, China
4
State Key Laboratory of Earth Surface Processes and Resource Ecology, Faculty of Geographical Science, Beijing Normal University, Beijing 100875, China
*
Authors to whom correspondence should be addressed.
Water 2018, 10(11), 1616; https://doi.org/10.3390/w10111616
Submission received: 6 October 2018
/
Revised: 5 November 2018
/
Accepted: 7 November 2018
/
Published: 9 November 2018
(This article belongs to the Special Issue Institutions and Economics of Water Scarcity and Droughts)
Abstract
:Lakes have an important role in human life and the ecological environment, but they are easily affected by human activity and climate change, especially around urban areas. Hence, it is critical to extract water with a high precision method and monitor long-term sequence dynamic changes in lakes. As the greatest natural lake of the Beijing-Tianjin-Hebei region, Baiyangdian Lake has a significant function in human life, socio-economic development, and regional ecological balance. This lake area has shown large changes due to human activity and climate change. The change monitoring process of the water surface is of great significance in providing support for the management and protection of the lake. The Spectrum Matching based on Discrete Particle Swarm Optimization (SMDPSO) method is a new, robust, and low-cost method for water extraction, that has obvious advantages in extracting complex water surfaces. In this paper, the SMDPSO method was used to extract the water surface of Baiyangdian Lake by Landsat images from 1984 to 2018. This method has a good effect on complex water surface extraction with vegetation, shadows, and so forth, and the Landsat images have higher resolution and longer time series. The main contents and results of this paper are as follows: (1) We verified the applicability of the SMDPSO method in the Baiyangdian Lake using visual interpretation and correlation analysis. The relative errors between observed and extracted results were all less than 5% in spring, summer, and fall, and the correlation coefficient between the water area and water level was 0.96. (2) According to seasonal verification and comparison of the extraction results, the SMDPSO method was used to extract the water surface area of Baiyangdian Lake during spring of the years 1984–2018. Water area changes of Baiyangdian Lake can be divided into four periods: Dry period (1984–1988), degraded period (1989–2000), stable period (2000–2008), and recovery period (2008–2018). The water area reached a maximum of 280 km2 in 1989 and a minimum of 44 km2 in 2002. (3) The possible causes of the changes in the water area of Baiyangdian Lake were also analyzed. The changes were caused by climate and human activities during the first and second periods, but mainly human activities during the third and fourth periods. In fact, effective policies combined with water conservancy projects were directly conducive to improving or even recovering the water and ecological environment of Baiyangdian Lake. Considering its importance for the benign development of the Beijing-Tianjin-Hebei Region and the construction of the Xiong’an New Area, a policy is necessary to ensure that the lake’s ecological environment will not be destroyed under the premise of economic development.
1. Introduction
Lakes are important parts of the hydrosphere, which not only supply water resources needed by humans and the ecological environment, but also maintain the climate system and water cycle [1,2,3,4]. Lakes are very sensitive to climate change or human activities [5]. In recent decades, many lakes have shrunk significantly due to intensive human activities and climate change [6,7]. Moreover, shrinking and drying of lakes has aggravated the deterioration of the regional environment and directly threatened the livelihoods of local people [8].
Data from remote sensing satellites, such as Landsat, MODIS, Sentinel-1, CBERS-1, and so on [9,10,11,12], has been widely used for mapping surface water. Landsat datasets are likely the most common data employed to identify the water surface because of their high spatial resolution, free availability, and their long sequence feature [10,13]. Han et al. [11] used Landsat data to study changes in the winter wetlands of Poyang Lake from 1973 to 2013. Almost simultaneously, Donchyts et al. [12] and Pekel et al. [14] both detected changes in global surface water over three decades using most of the Landsat images that had been produced before 2017. Yang et al. [15] used Landsat and Huanjing (HJ) satellite data to monitor the dynamics of lakes in the Changtang Plateau. Landsat data is very suitable for studying long-term changes in terrestrial water, especially for lakes.
An efficient water extraction method is critical to obtaining accurate water surface area. Three main methods can be summarized for water body extraction based on the current, common methods: (1) Threshold methods based on a related water body index; (2) supervised and unsupervised classification, including machine learning algorithms; and (3) water-specific classification methods, such as HSV (Hue, Saturation, and Value) [14] and Spectrum Matching based on Discrete Particle Swarm Optimization (SMDPSO) [16]. The water index based on the spectral curve of the water body is the simplest method for water body extraction, with examples being Normalized Difference Water Index (NDWI) and Modified Normalized Difference Water Index (MNDWI). The appropriate band is selected to construct the model, and then the appropriate threshold is selected to extract the water body [16,17]. There are many types of water indices, and NDWI and MNDWI are the two most commonly used indices. These water indices are easy to calculate and less time consuming, so researchers often use them to extract water information. However, difficulties in threshold determination and the great instability in the classification results are the main limitations of this method. Machine learning for supervised classification is an effective way to save time and labor as well as maintaining high accuracy, with examples being support vector machine (SVM) and random forest (RF) [18]. Mueller et al. [19] used a regression tree model for sample training to detect water information in Australia. Rao et al. [20] used the RF classifier for sample training to extract surface water in the Yangtze River Basin. The accuracy of machine learning for supervised classification seems to be better than the water body index. However, machine learning algorithms are subject to the selection of sample points, and have high requirements for sample points and bands during the classification process, which would face great difficulty in long-term sequence water extraction, and may cause large errors in classification results. Water-specific classification methods are experience-based optimization algorithms with simple operations, good effects, and strong applicability. These methods are based on prior knowledge, require fewer parameters, and are more highly automated than supervised or unsupervised classification. Pekel et al. [21] proposed a near real-time water surface detection method based on HSV (Hue, Saturation, and Value) transformation of MODIS multi-spectral time series data, and also used this method for mapping global water surface bodies by Landsat datasets [14]. Jia et al. [16] proposed a SMDPSO method for complex water extraction, and tested the efficiency of the method through the eight typical global regions. The results showed that the water extraction accuracy and robustness of the SMDPSO method are better than those of the water body index and supervised classification methods.
Currently, correlation analysis is one of the ways to explore possible causes. Tao et al. [8] explored the causes of lake water losses by analyzing the correlation between lake area on the Mongolian Plateau and rainfall, coal production, and agricultural irrigation area. Zhang et al. [22] analyzed the relationship between rainfall and wetland areas and the area of pure water in Baiyangdian Lake to explore the impact of rainfall on wetland area changes. Therefore, the possible causes for changes in the Baiyangdian Lake water area are qualitatively analyzed based on correlation analysis.
Baiyangdian Lake is an important part of the Xiong’an New Area, which is being developed into a national-level new area, like the Shenzhen and Pudong New Areas, to solve the “big city problem” in Beijing, and promote the coordinated development of the Beijing-Tianjin-Hebei Urban Agglomeration. Approximately one-fifth of the area in the Xiong’an New Area is a part of Baiyangdian Lake. Baiyangdian Lake has a key role in creating a green and ecologically livable Xiong’an New Area. Since the 1970s, under the combined effect of climate change and human activity, Baiyangdian Lake has experienced many periods with little water [23,24,25,26]. According to the hydrological record between 1919 and 1965, there was almost no water in the spring of 1922. More importantly, in the years from 1965 to 2005, the frequency of no water in Baiyangdian Lake increased [27]. The emergence of these problems has a great impact on Baiyangdian Lake and its surrounding environment. Therefore, it is significant to recognize the past changes in the water surface area of Baiyangdian Lake and the current situation to protect the ecological environment of Baiyangdian Lake and promote the efficient construction of the Xiong’an New Area.
Based on the above, the purpose of this paper is: (1) To accurately extract the water surface area of Baiyangdian Lake and verify the accuracy of SMDPSO, (2) to acknowledge the historical changes and current status of the water surface area of Baiyangdian Lake, and (3) to analyze the causes of changes in the lake water surface area based on climate change and human activities.
2. Materials and Methods
2.1. Study Area
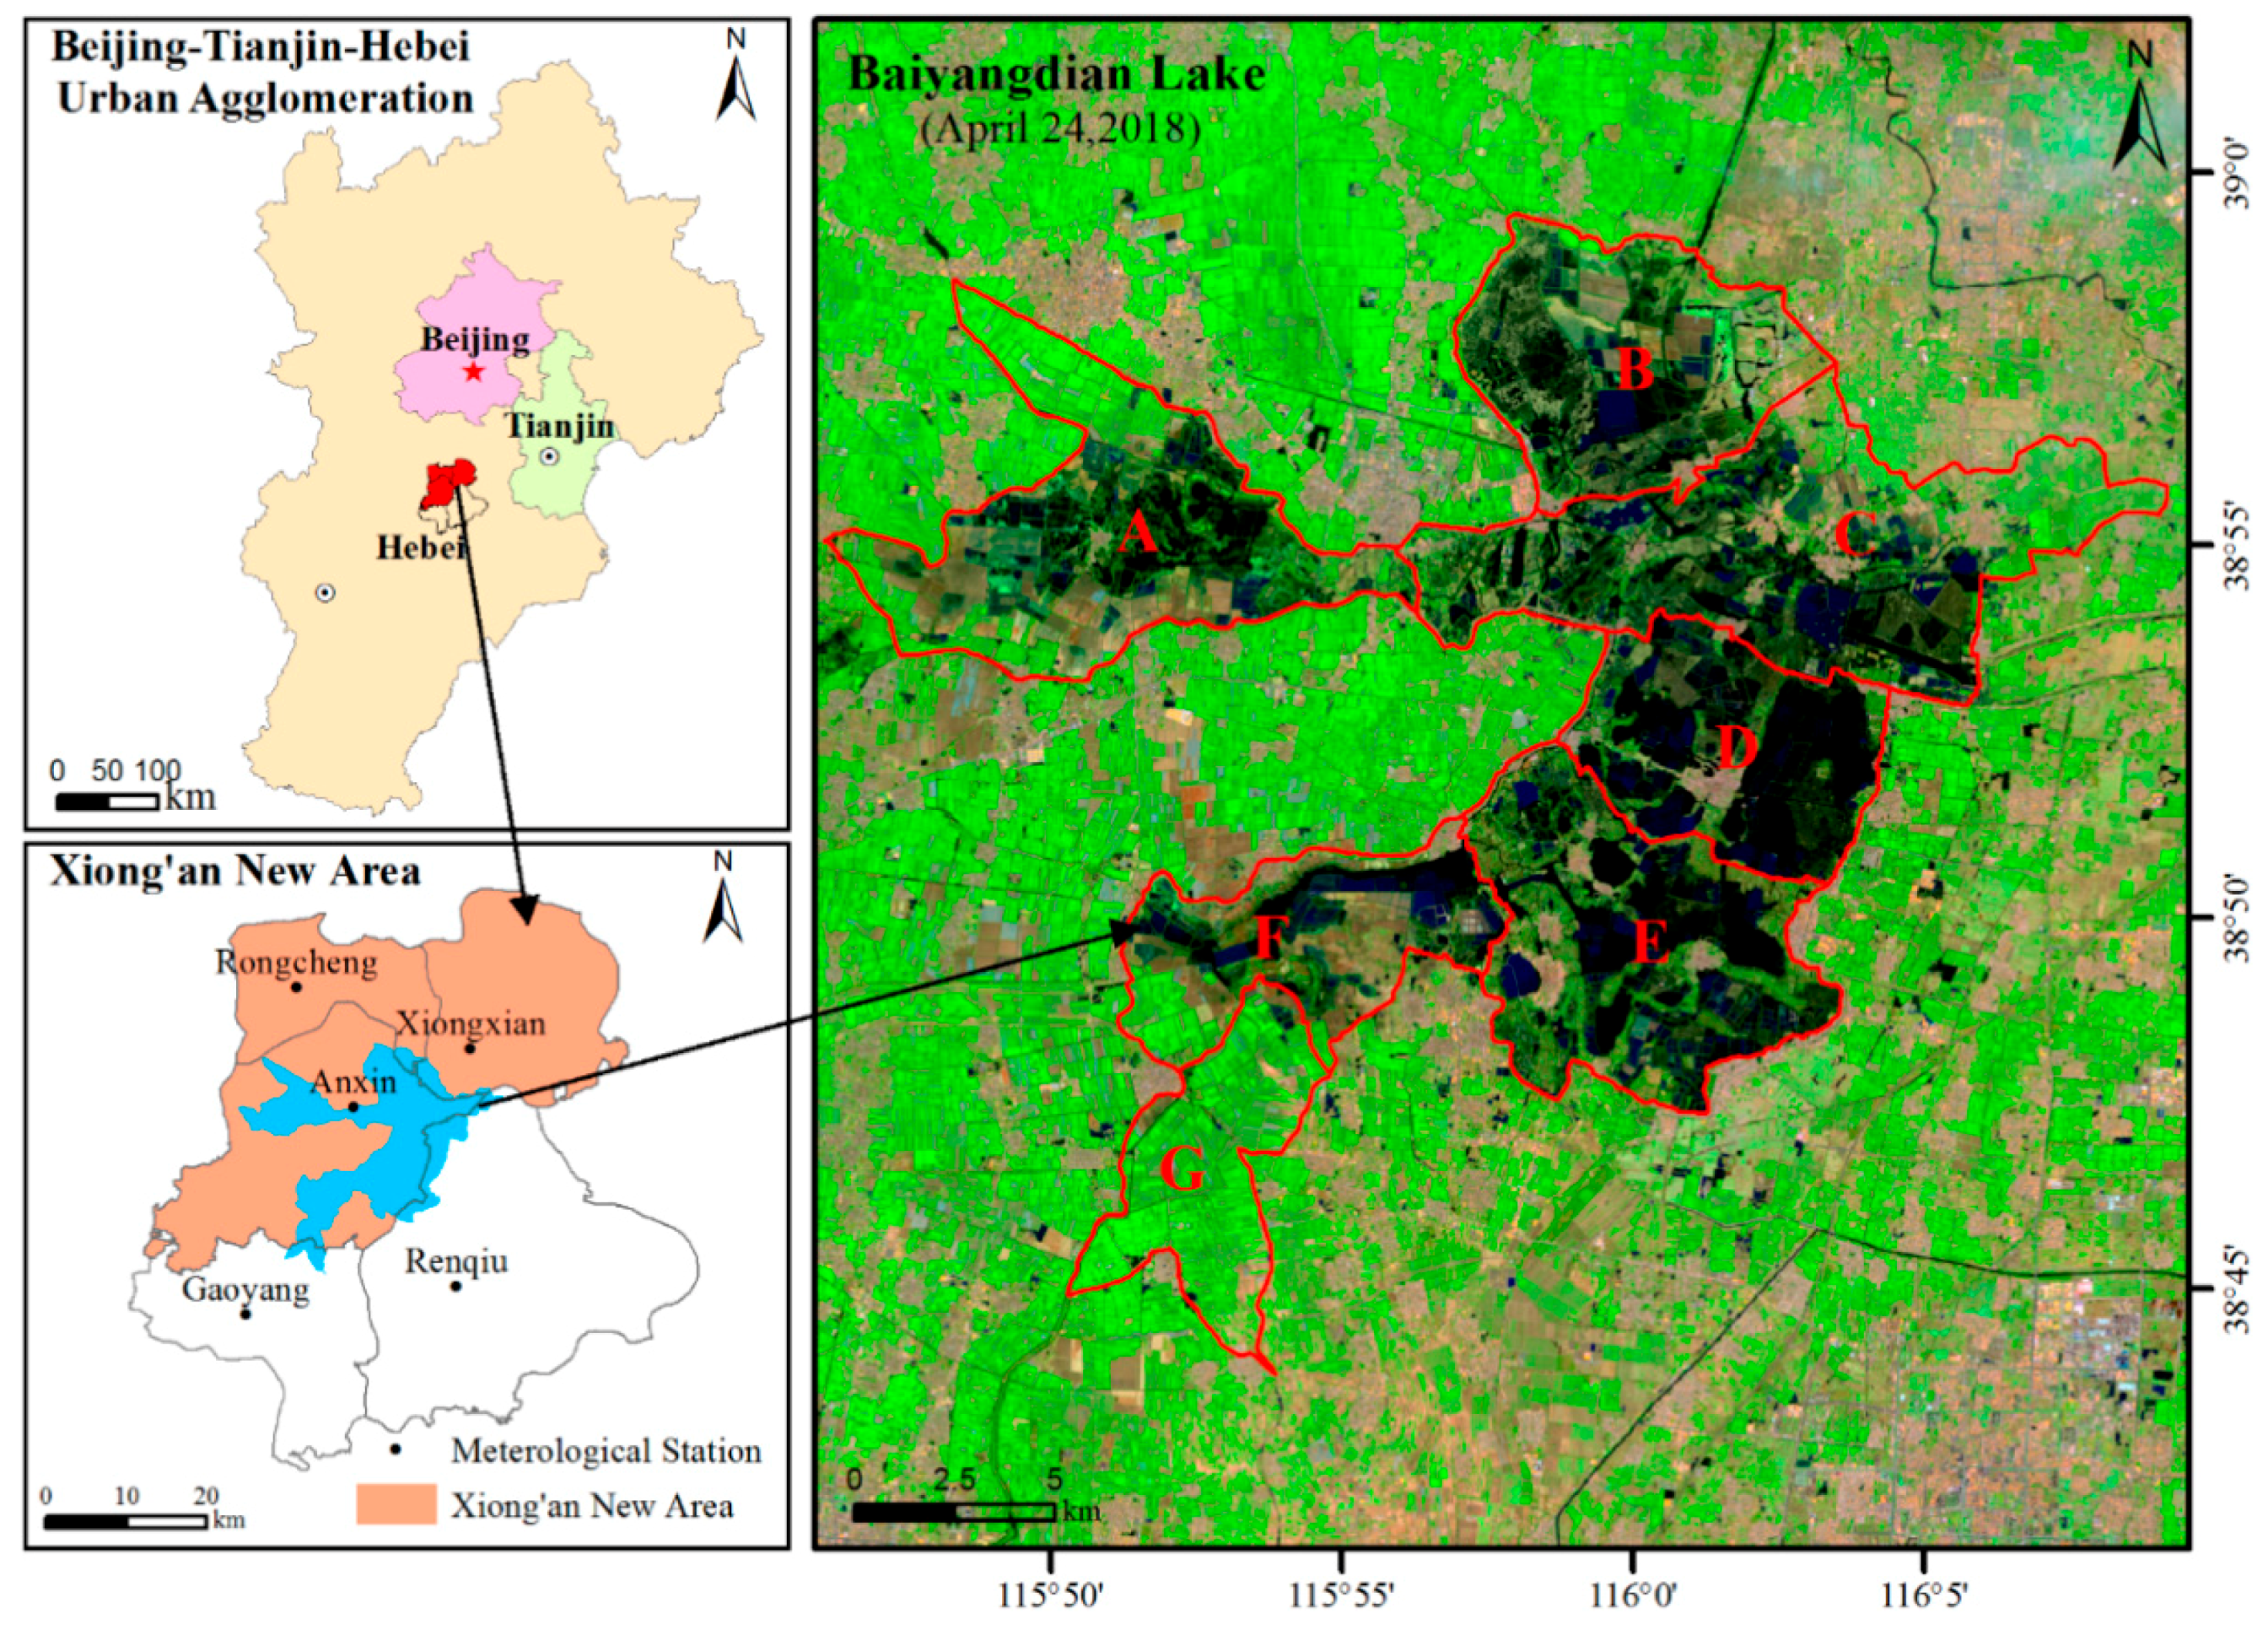
Baiyangdian Lake, with a total area of 366 km2 [28] (38°43′–39°02′ N and 115°38′–116°07′ E), is located in the central area of the Hebei Province, China (Figure 1). It mainly belongs to Anxin County and is surrounded by the counties of Rongcheng, Xiongxian, and Gaoyang, and the city of Renqiu [29]. The warm semi-arid climate characteristic is typical in this area, where the annual average temperature is 7.3–12.7 °C, and the annual average precipitation, mainly concentrated between June and September, is about 563.9 mm [22]. However, the annual average evaporation is approximately 1369 mm, which is much greater than the amount of precipitation [30]. If there is no manual intervention, the lake will become dry more and more. Therefore, a series of water conservancy projects have provided water to the Lake, including the Yellow River Diversion Project and the Central Line Project of the South-to-North Water Diversion.
Baiyangdian Lake is the largest freshwater lake in the Beijing-Tianjin-Hebei urban agglomeration [31]. It has an import function to maintain the ecological balance in the region, and plays a key role in the protection of biodiversity and rare species resources [24]. More than 3700 ditches and reed areas divide the whole Baiyangdian Lake into several lakes of different sizes, and numerous lakes connected by gullies create many small islands on which there are villages and gardens [32].
Considering the complex water of Baiyangdian Lake, we divided the Baiyangdian Lake into seven subregions based on the functional area division of Baiyangdian Lake [33], combined with the distribution and integrity of lakes.
2.2. Materials
2.2.1. Landsat Time Series
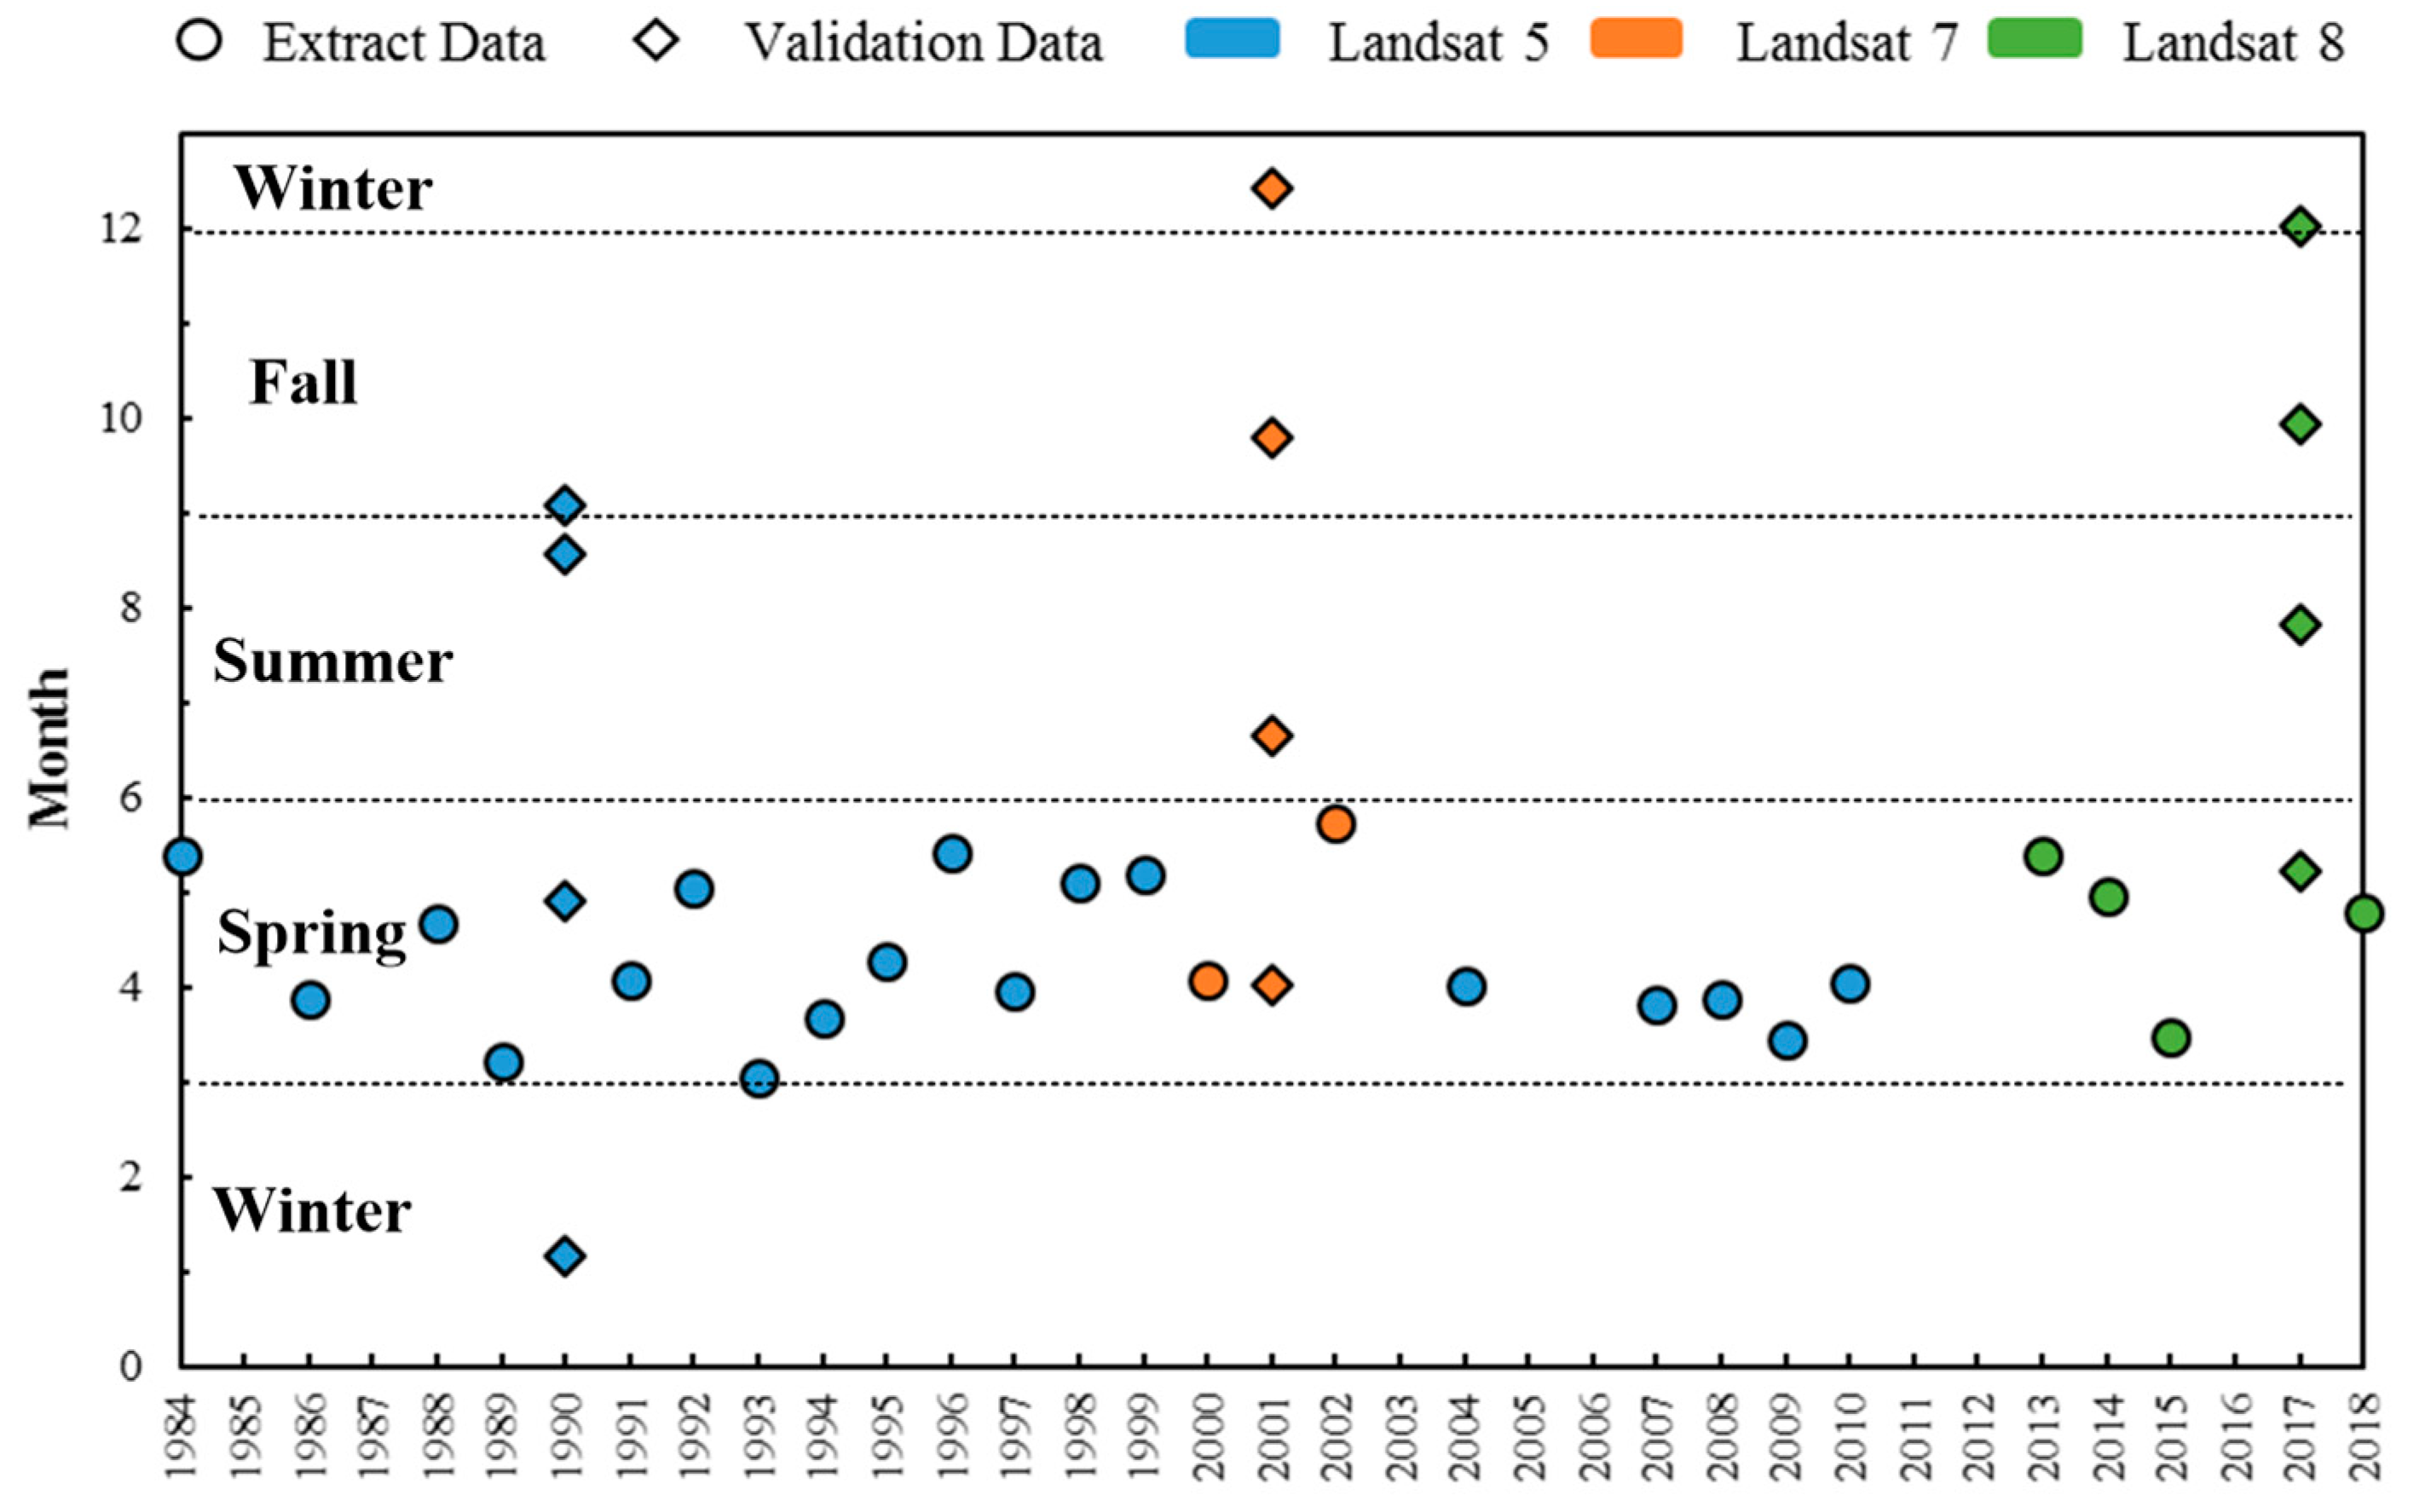
In this study, Landsat images were used to extract the water surface area of Baiyangdian Lake. Remote sensing images with less than 20% cloud cover from 1984–2018 were downloaded, and were mainly derived from Landsat 5 Thematic Mapper (TM), 7 Enhanced Thematic Mapper (ETM), and 8 Operational Land Imager (OLI). We chose the images from spring (March, April, May), summer (June, July, August), fall (September, October, November), and winter (December, January, February) of 1990, 2001 and 2017 to determine which season presents the best water extraction effect. Comparing the four seasons, the water body extraction was less affected by vegetation, and the water surface area generally did not change greatly, in the spring (March, April and May), which is a non-rainy season in the study area. Therefore, cloudless images during the spring of the years 1984–2018 were selected in this study. Detailed information on the Landsat images used in this study is shown in Figure 2. There are 37 Landsat images used in this study, and the images were downloaded from USGS/EROS (http://landsat.usgs.gov/).
2.2.2. Hydrological and Climate Data
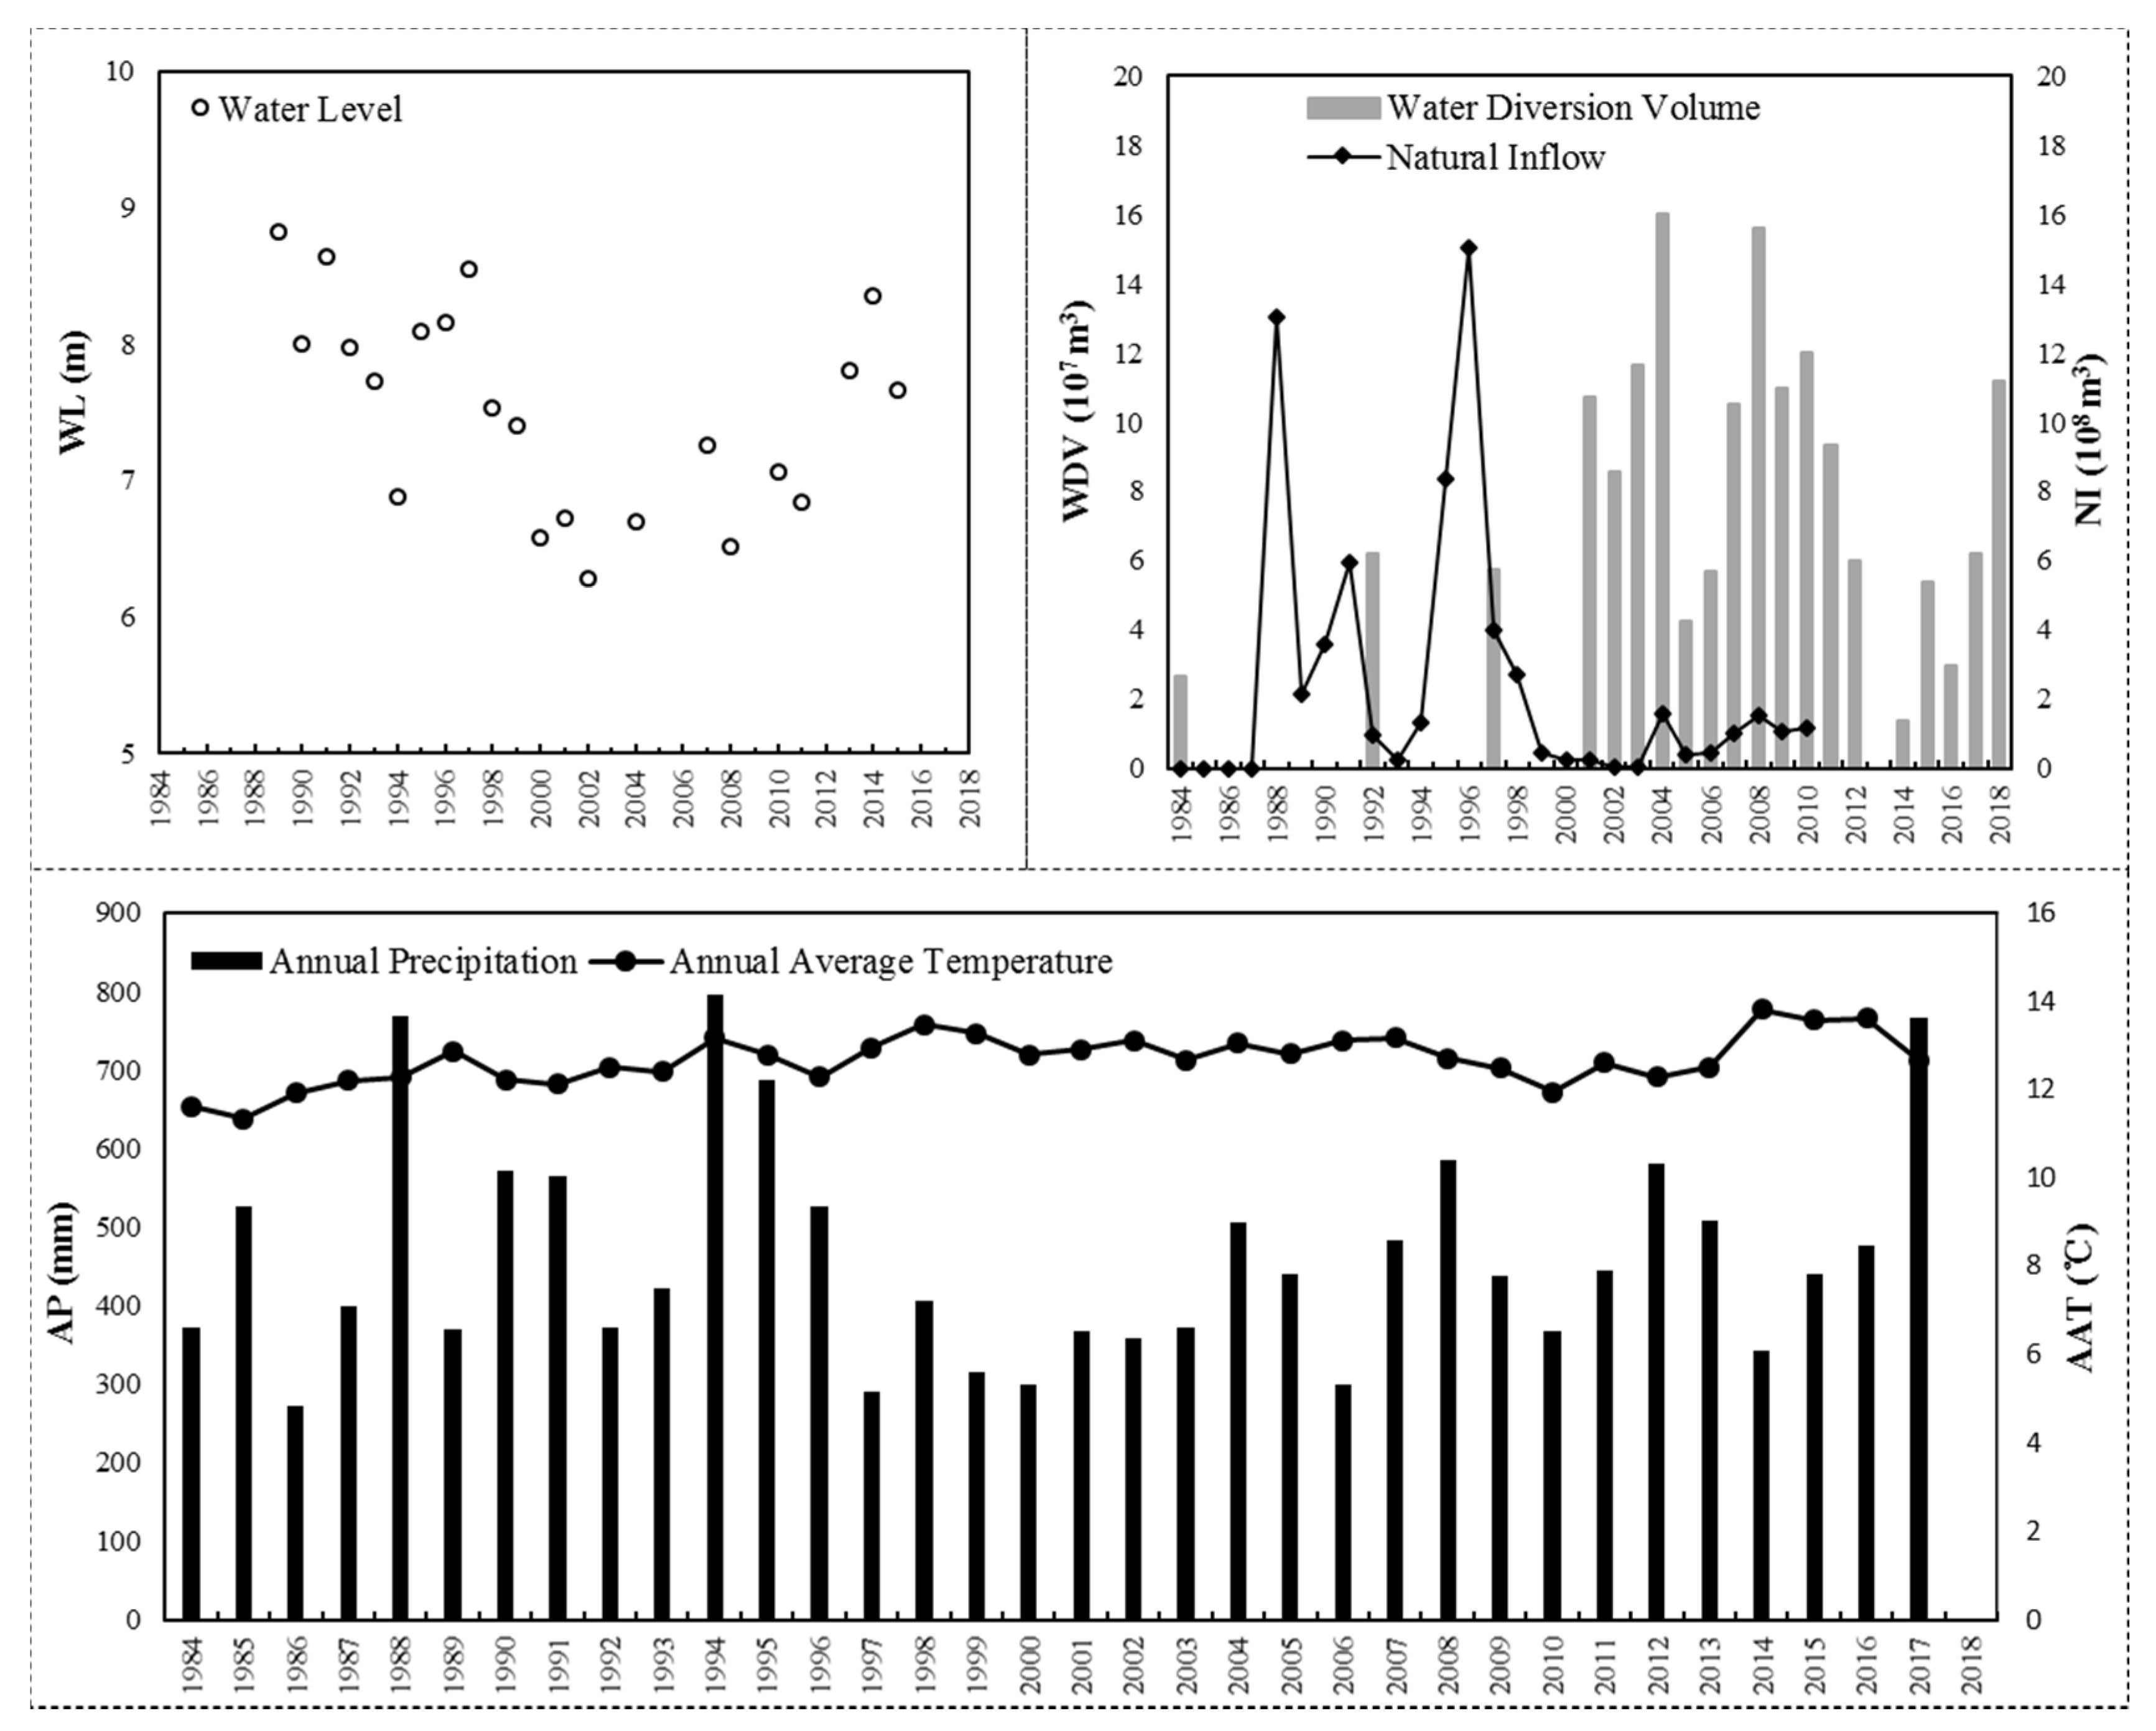
In this study, water level (WL), annual precipitation (AP), annual average temperature (AAT), natural inflow (NI), and water diversion volume (WDV) data was used to analyze the possible effects on water surface area changes.
The WL data was used for correlation analysis with the extracted water area data to determine the water surface area extraction accuracy, and this data was derived from the county annals of Anxin from 1984 to 2008. The average WL per month was obtained from the data of three hydrological stations in South Liuzhuang, Duancun, and Wangjiazhai, near Baiyangdian Lake. WL data from 2010 to 2015 was derived from the hydrological data yearbook of the Daqing River Basin each year, and this data was obtained from the three hydrological stations of Anxin, Duancun, and Wangjiazhai.
NI refers to the surface runoff, underground runoff, rainfall, and so on, entering Baiyangdian Lake, and does not include artificially supplemented water. WDV is the amount of water that transfers from reservoirs, rivers, and so on, into Baiyangdian Lake by artificial means. NI and WDV were also used to analyze causes for water area changes. The data of NI (1984–2010) and WDV (1984–2010) (Figure 3) was acquired from Cui et al. [28]. The rest of the WDV data was from the Water Conservancy Briefing of the Baoding Water-Control Bureau.
Precipitation and temperature data (1984–2017) from five stations (stations of Anxin, Gaoyang, Rongcheng, Xiongxian, and Renqiu) around Baiyangdian Lake was acquired from the China Meteorological Administration (Figure 1), and was used to analyze the effects of rainfall and temperature on the water area of Baiyangdian Lake (Figure 3). In this paper, AP and AAT used the average of five stations.
2.3. Methods
2.3.1. SMDPSO Method
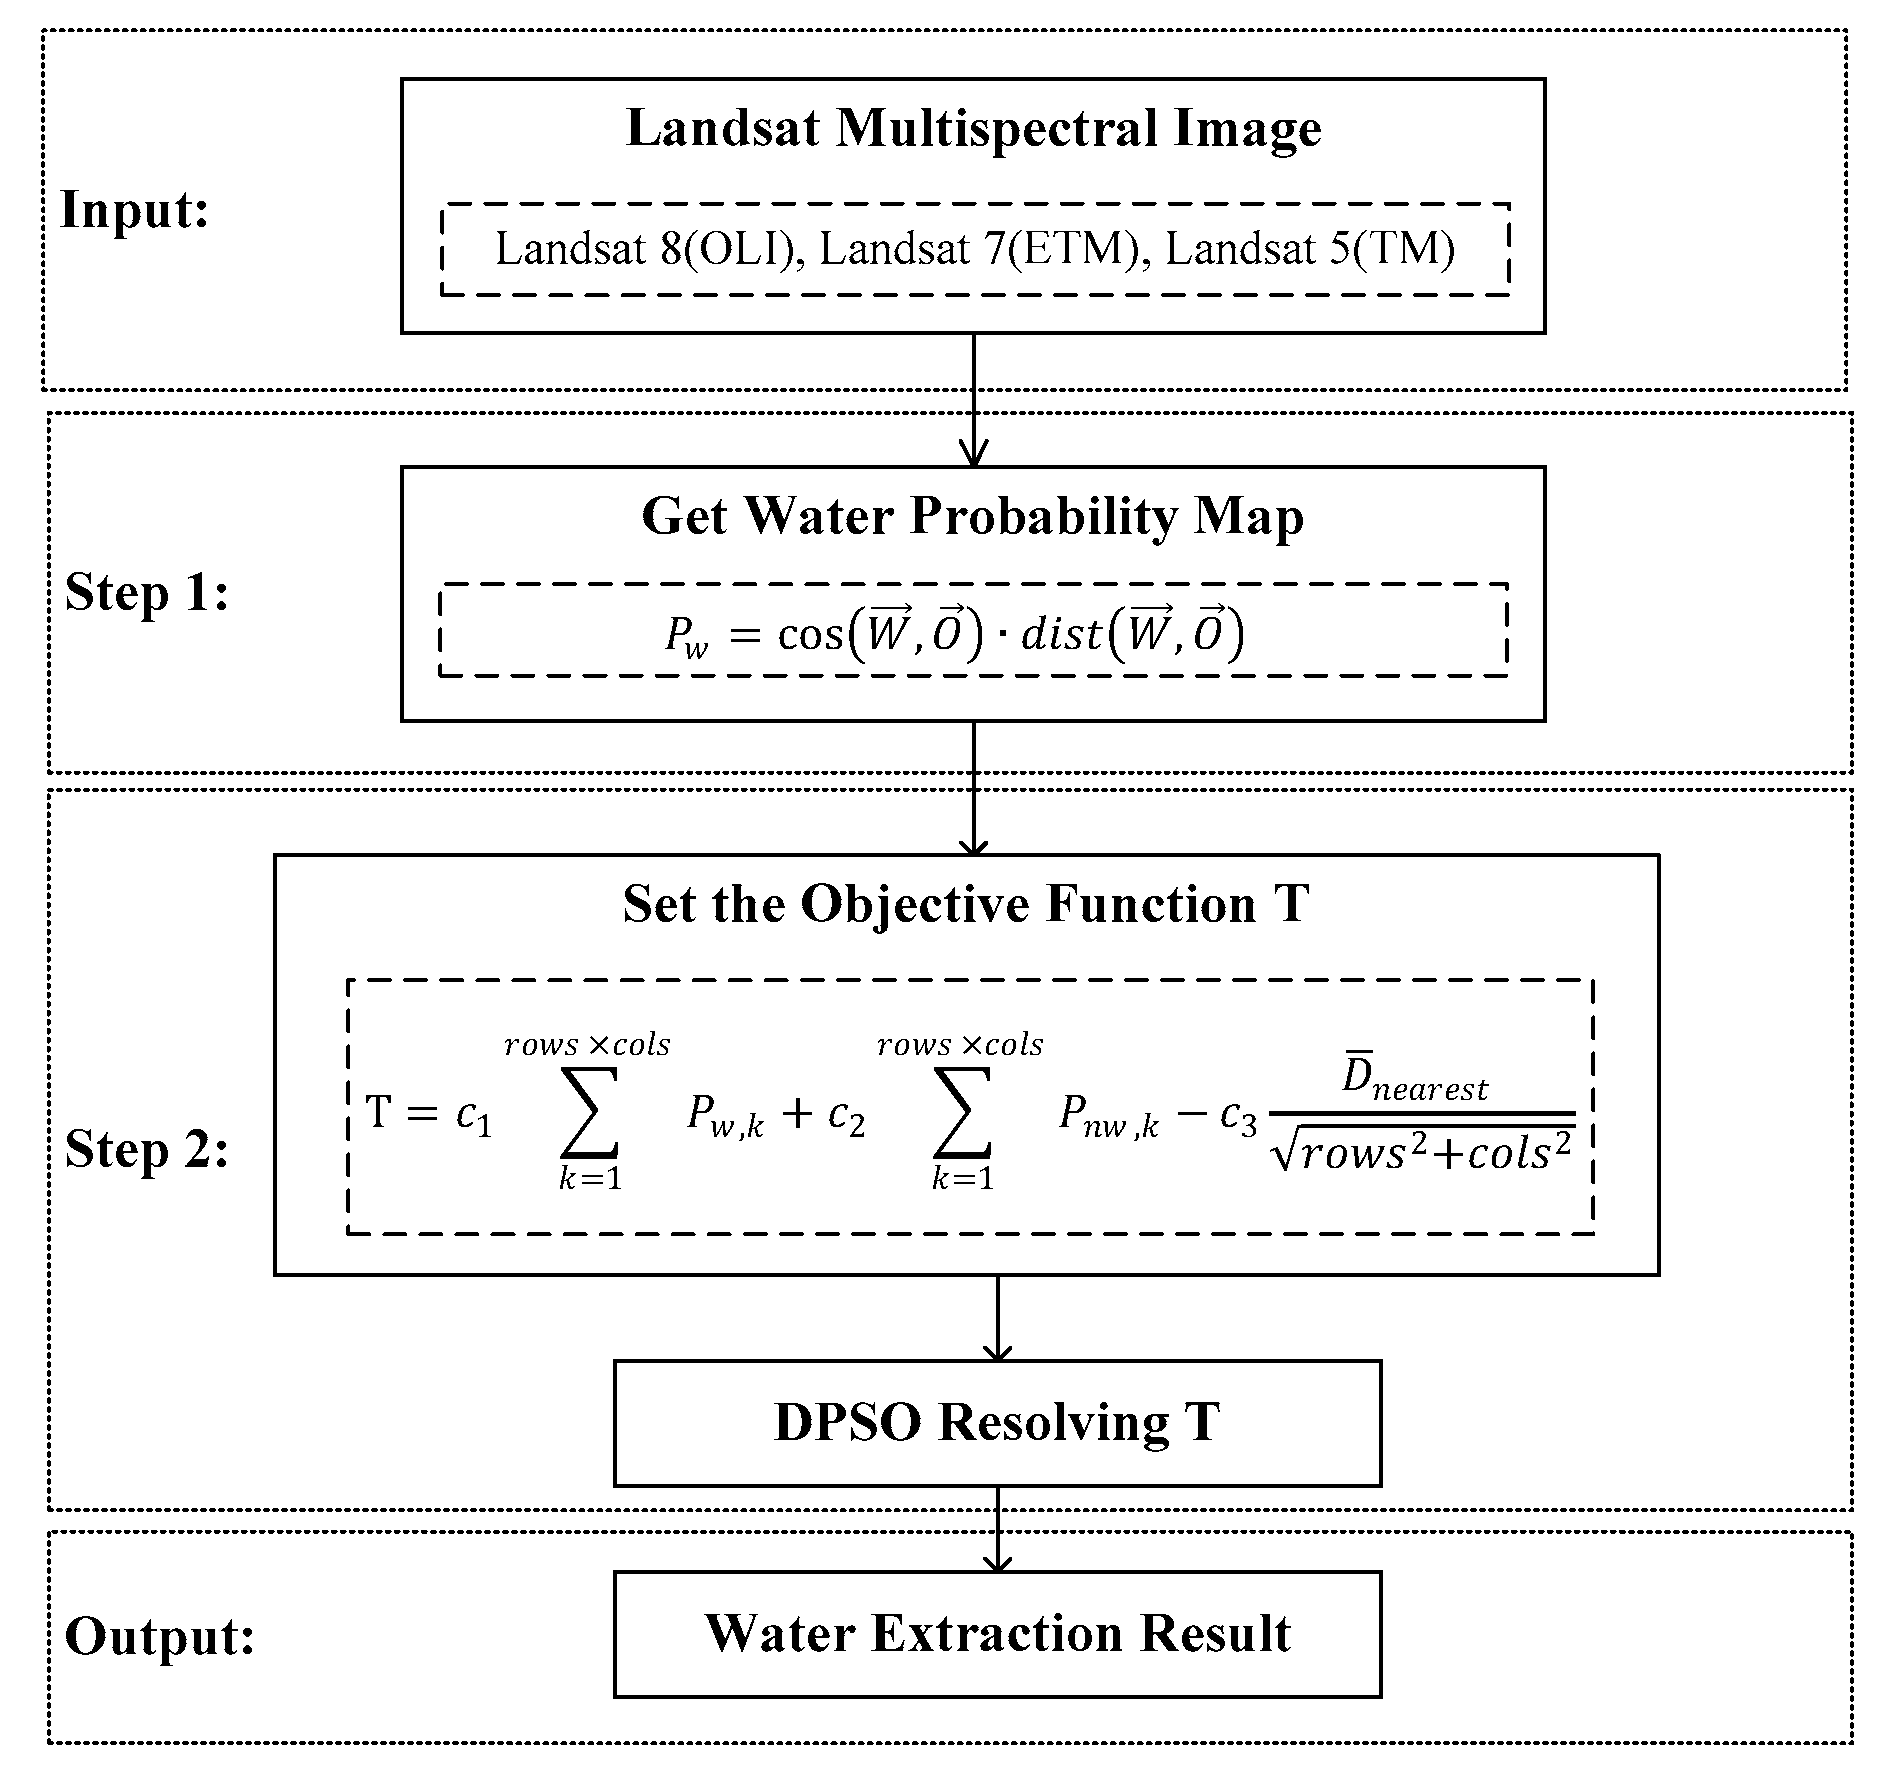
SMDPSO is a new, simple, and high-precision water extraction algorithm. It has fewer input parameters, lower cost, and higher stability and accuracy than supervised and non-supervised classification, especially presenting clear advantages in complex water extraction [16]. The algorithm consists of two main steps (Figure 4): (1) Obtaining water probability maps from multispectral remote sensing data through appropriate spectral matching methods, and (2) identifying water pixels from the water probability image by using the discrete particle swarm optimization (DPSO) analytical objective function.
Water probability can be calculated using Equation (1). In this study, we use the standard water spectrum for Landsat 8 images, which come from Jia et al. [16], to calculate water probability and apply it to Landsat 5 and 7 images.
where = () and = () represent the spectral vector (i.e., the spectral curve) of typical water and ground objects, respectively, and b is the number of bands. The cosine similarity (Equation (2)) and distance similarity (Equation (3)) are values between 0 and 1. Thus, the water probability is in the range of [0,1]. A higher value of indicates a greater probability of water.
The next step is to construct the objective function of the water classification. The objective function is as follows (Equation (4)):
where , , and are constants, are calculated according to Jia et al. [16], and represent the weight of the water portion, no water portion, and neighborhood; is the water probability when the pixel is water; is the nonwater probability when the pixel is nonwater; and is the nearest distance from one water pixel to another water pixel at the same tile (Equation (5)). Images are divided into tiles with rows × columns (cols).
The pixel is classified as water or nonwater by maximizing the objective function. The key of SMDPSO is using DPSO to solve the objective function and obtain the classification result. DPSO is an optimization algorithm that resolves problems in discrete space [34].
2.3.2. Seasonal Verification of SMDPSO
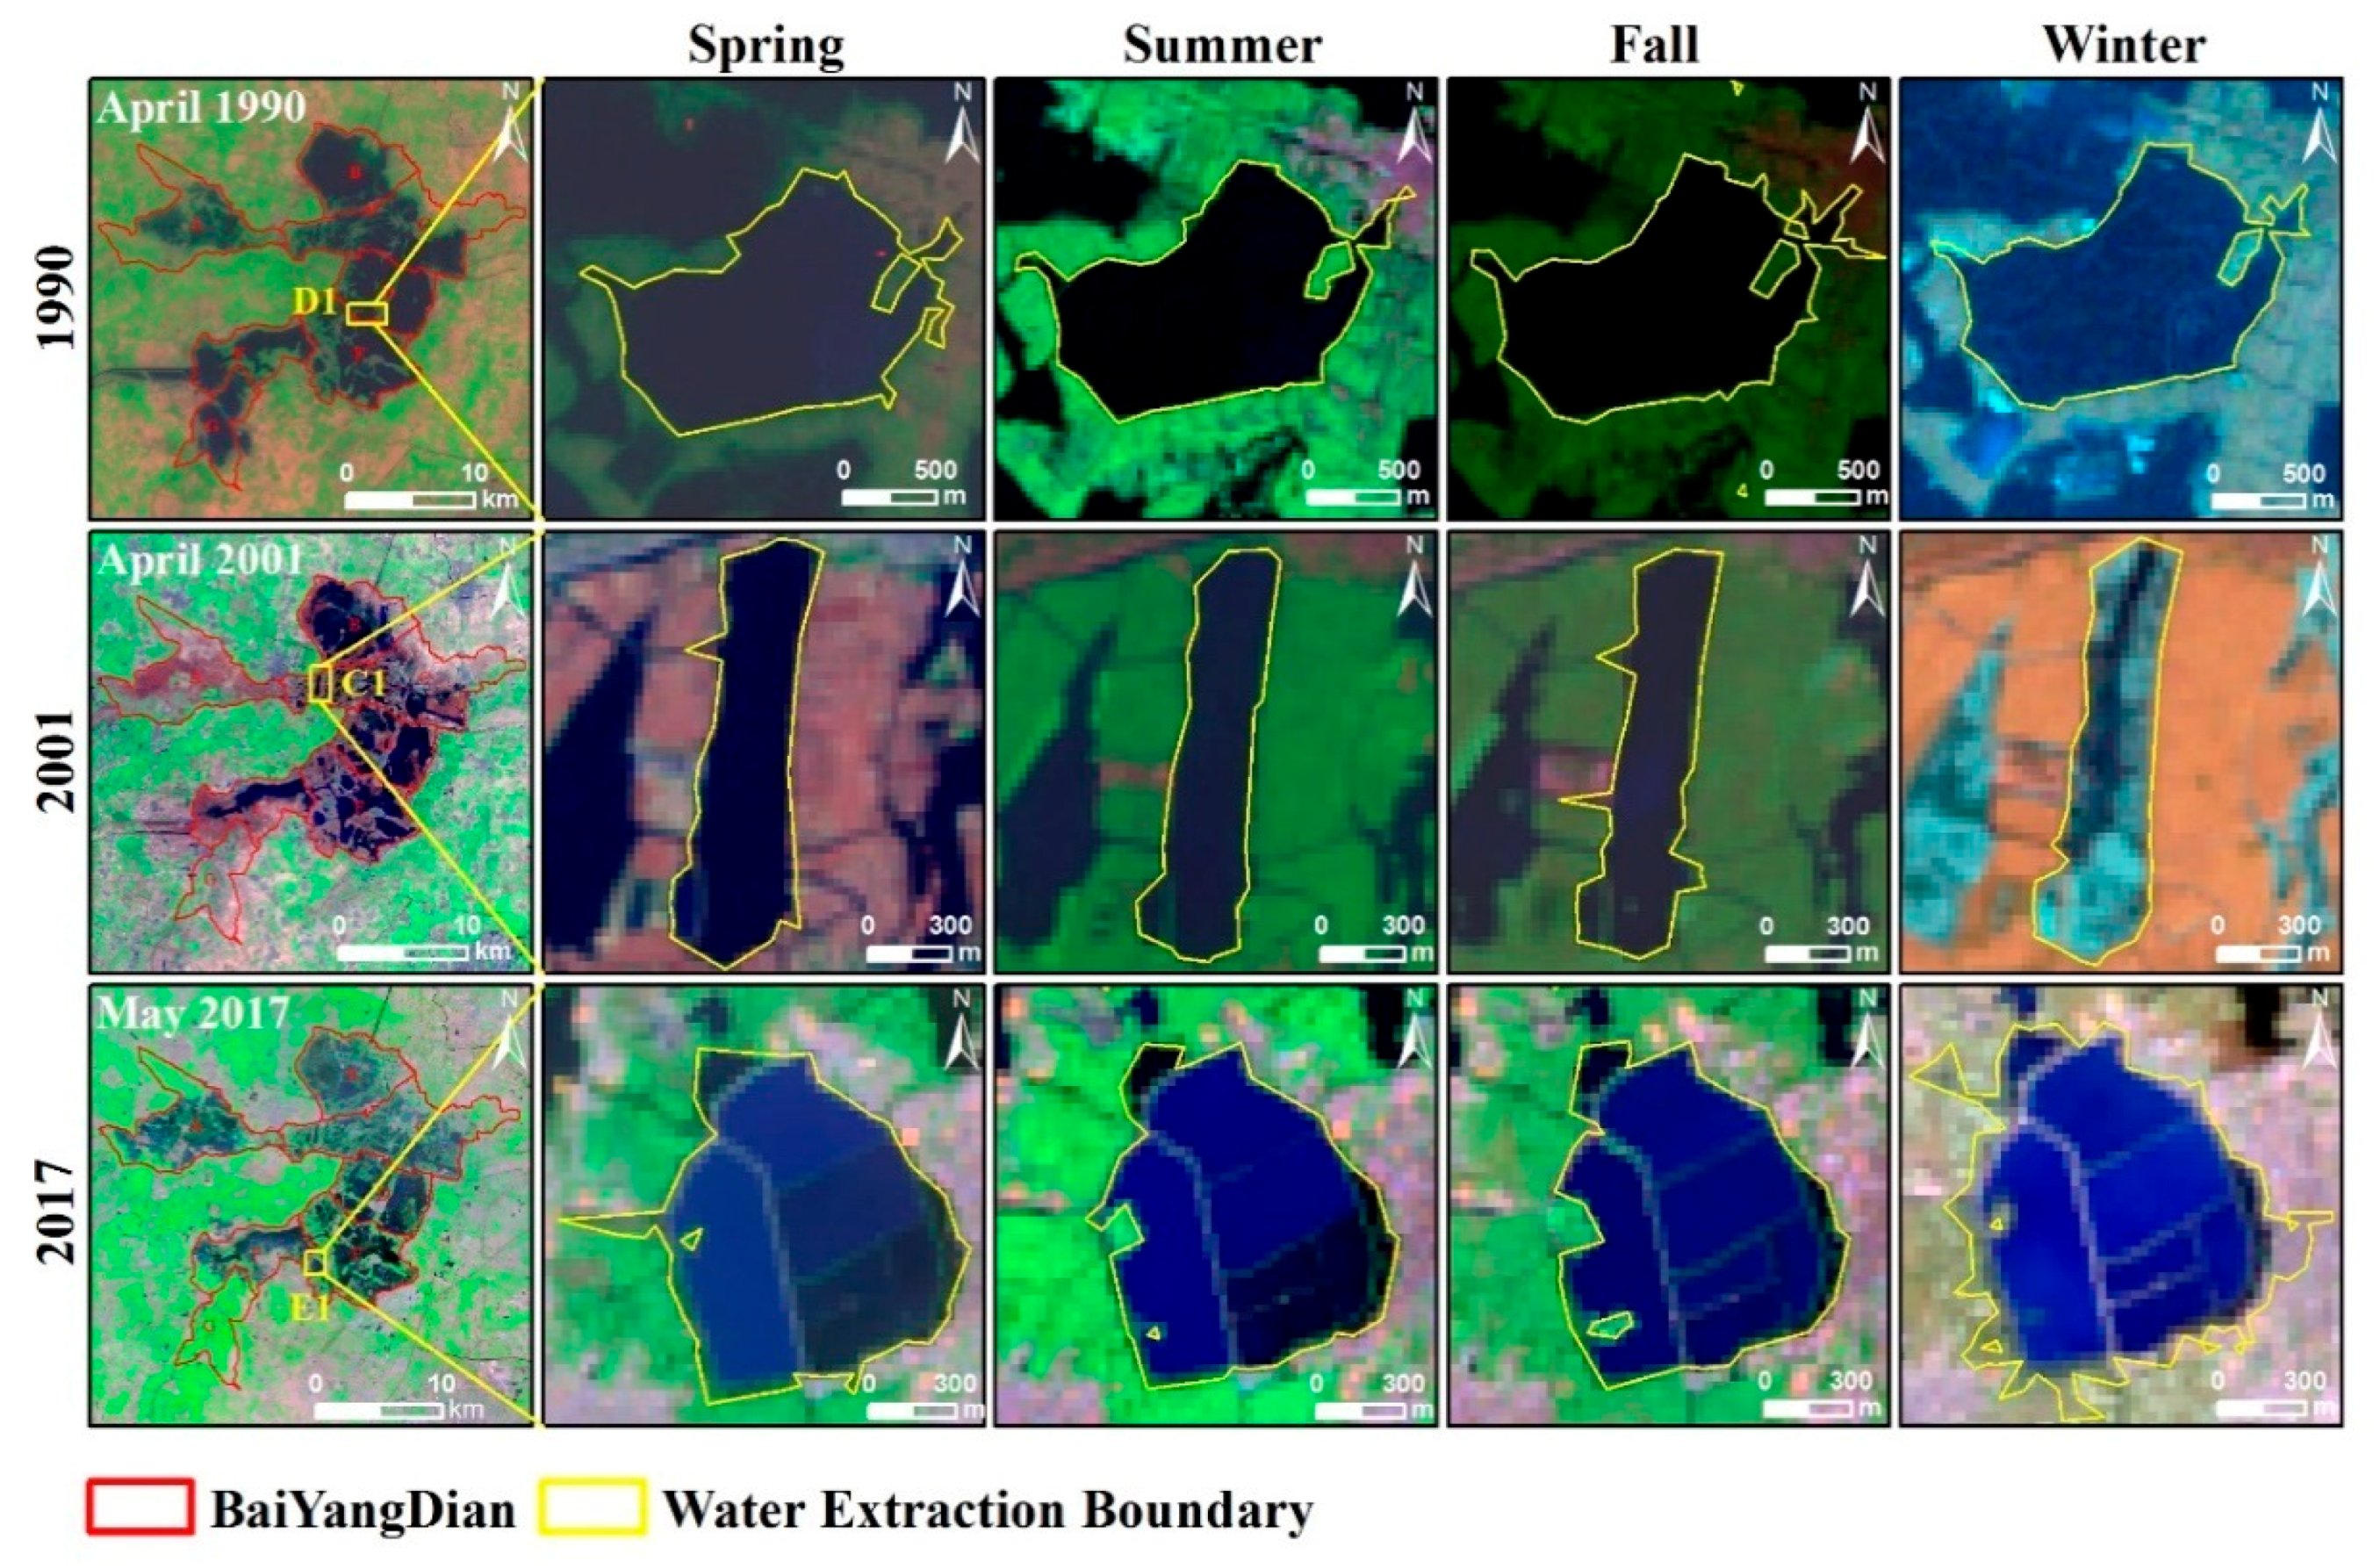
In this study, we aim to verify the accuracy of water extraction in each season and select the best season for long-term sequence analysis. Considering the complex water characteristics of Baiyangdian Lake, the overall accuracy was impossible to calculate accurately, because of too many water plaques. Therefore, we selected three typical small water plaques, which were used to test the results. April, August, September, and January of 1990 were selected to represent the four seasons, and D1 (Figure 5) was used as the sample area to analyze the error between the extracted and the observed water areas. Similarly, April, June, September, and December of 2001 represent the four seasons, and C1 (Figure 5) was taken as the sample area. The images of May, July, September, and December of 2017 represent the four seasons of spring, summer, fall, and winter, and E1 (Figure 5) was selected as the sample area. We manually interpreted the water surface area of D1, C1, and E1 during the four seasons as the actual water areas, and used the following formula (Equation (6)) to calculate the error between the extracted water area and the observed water area.
where R is the relative error between the water area of the extracted and the observed, Se is the area of the extracted water area, and Sa is the area of the observed water area.
2.3.3. Pearson Correlation Coefficient and Water Inundation Frequency
Pearson correlation coefficient () (Equation (7)) is an effective tool for measuring the closeness of two random variables X and Y. The range of r is −1 to 1, greater than 0 indicates a positive correlation, and less than 0 indicates a negative correlation. The correlation is greater when its absolute value is close to 1 [35]. The general situation will be expressed as 5 intervals of 0~0.2, 0.2~0.4, 0.4~0.6, 0.6~0.8, and 0.8~1.0, which represent without correlation, weak correlation, medium correlation, strong correlation, and extremely strong correlation, respectively [36].
where is the correlation coefficient of variables X and Y, is the water area of Baiyangdian Lake every year, and is other data (WL, AP, AAT, and NI) related to water area each year. and are the means of X and Y. n is the sample size.
Water inundation frequency (WIF) can reflect the spatial characteristics of Baiyangdian Lake. In this study, WIF was calculated by the number of times a pixel is flagged as a water body divided by the number of all observations per pixel. In this paper, a total of 37 images were used, so the number of all observations per pixel is 37. According to Rao et al. [20], it was named as permanent water when the WIF is greater than 60%, otherwise it was named as temporary water.
3. Results
3.1. Verification of Water Extraction Results
3.1.1. Comparison and Verification for Different Seasonal Results
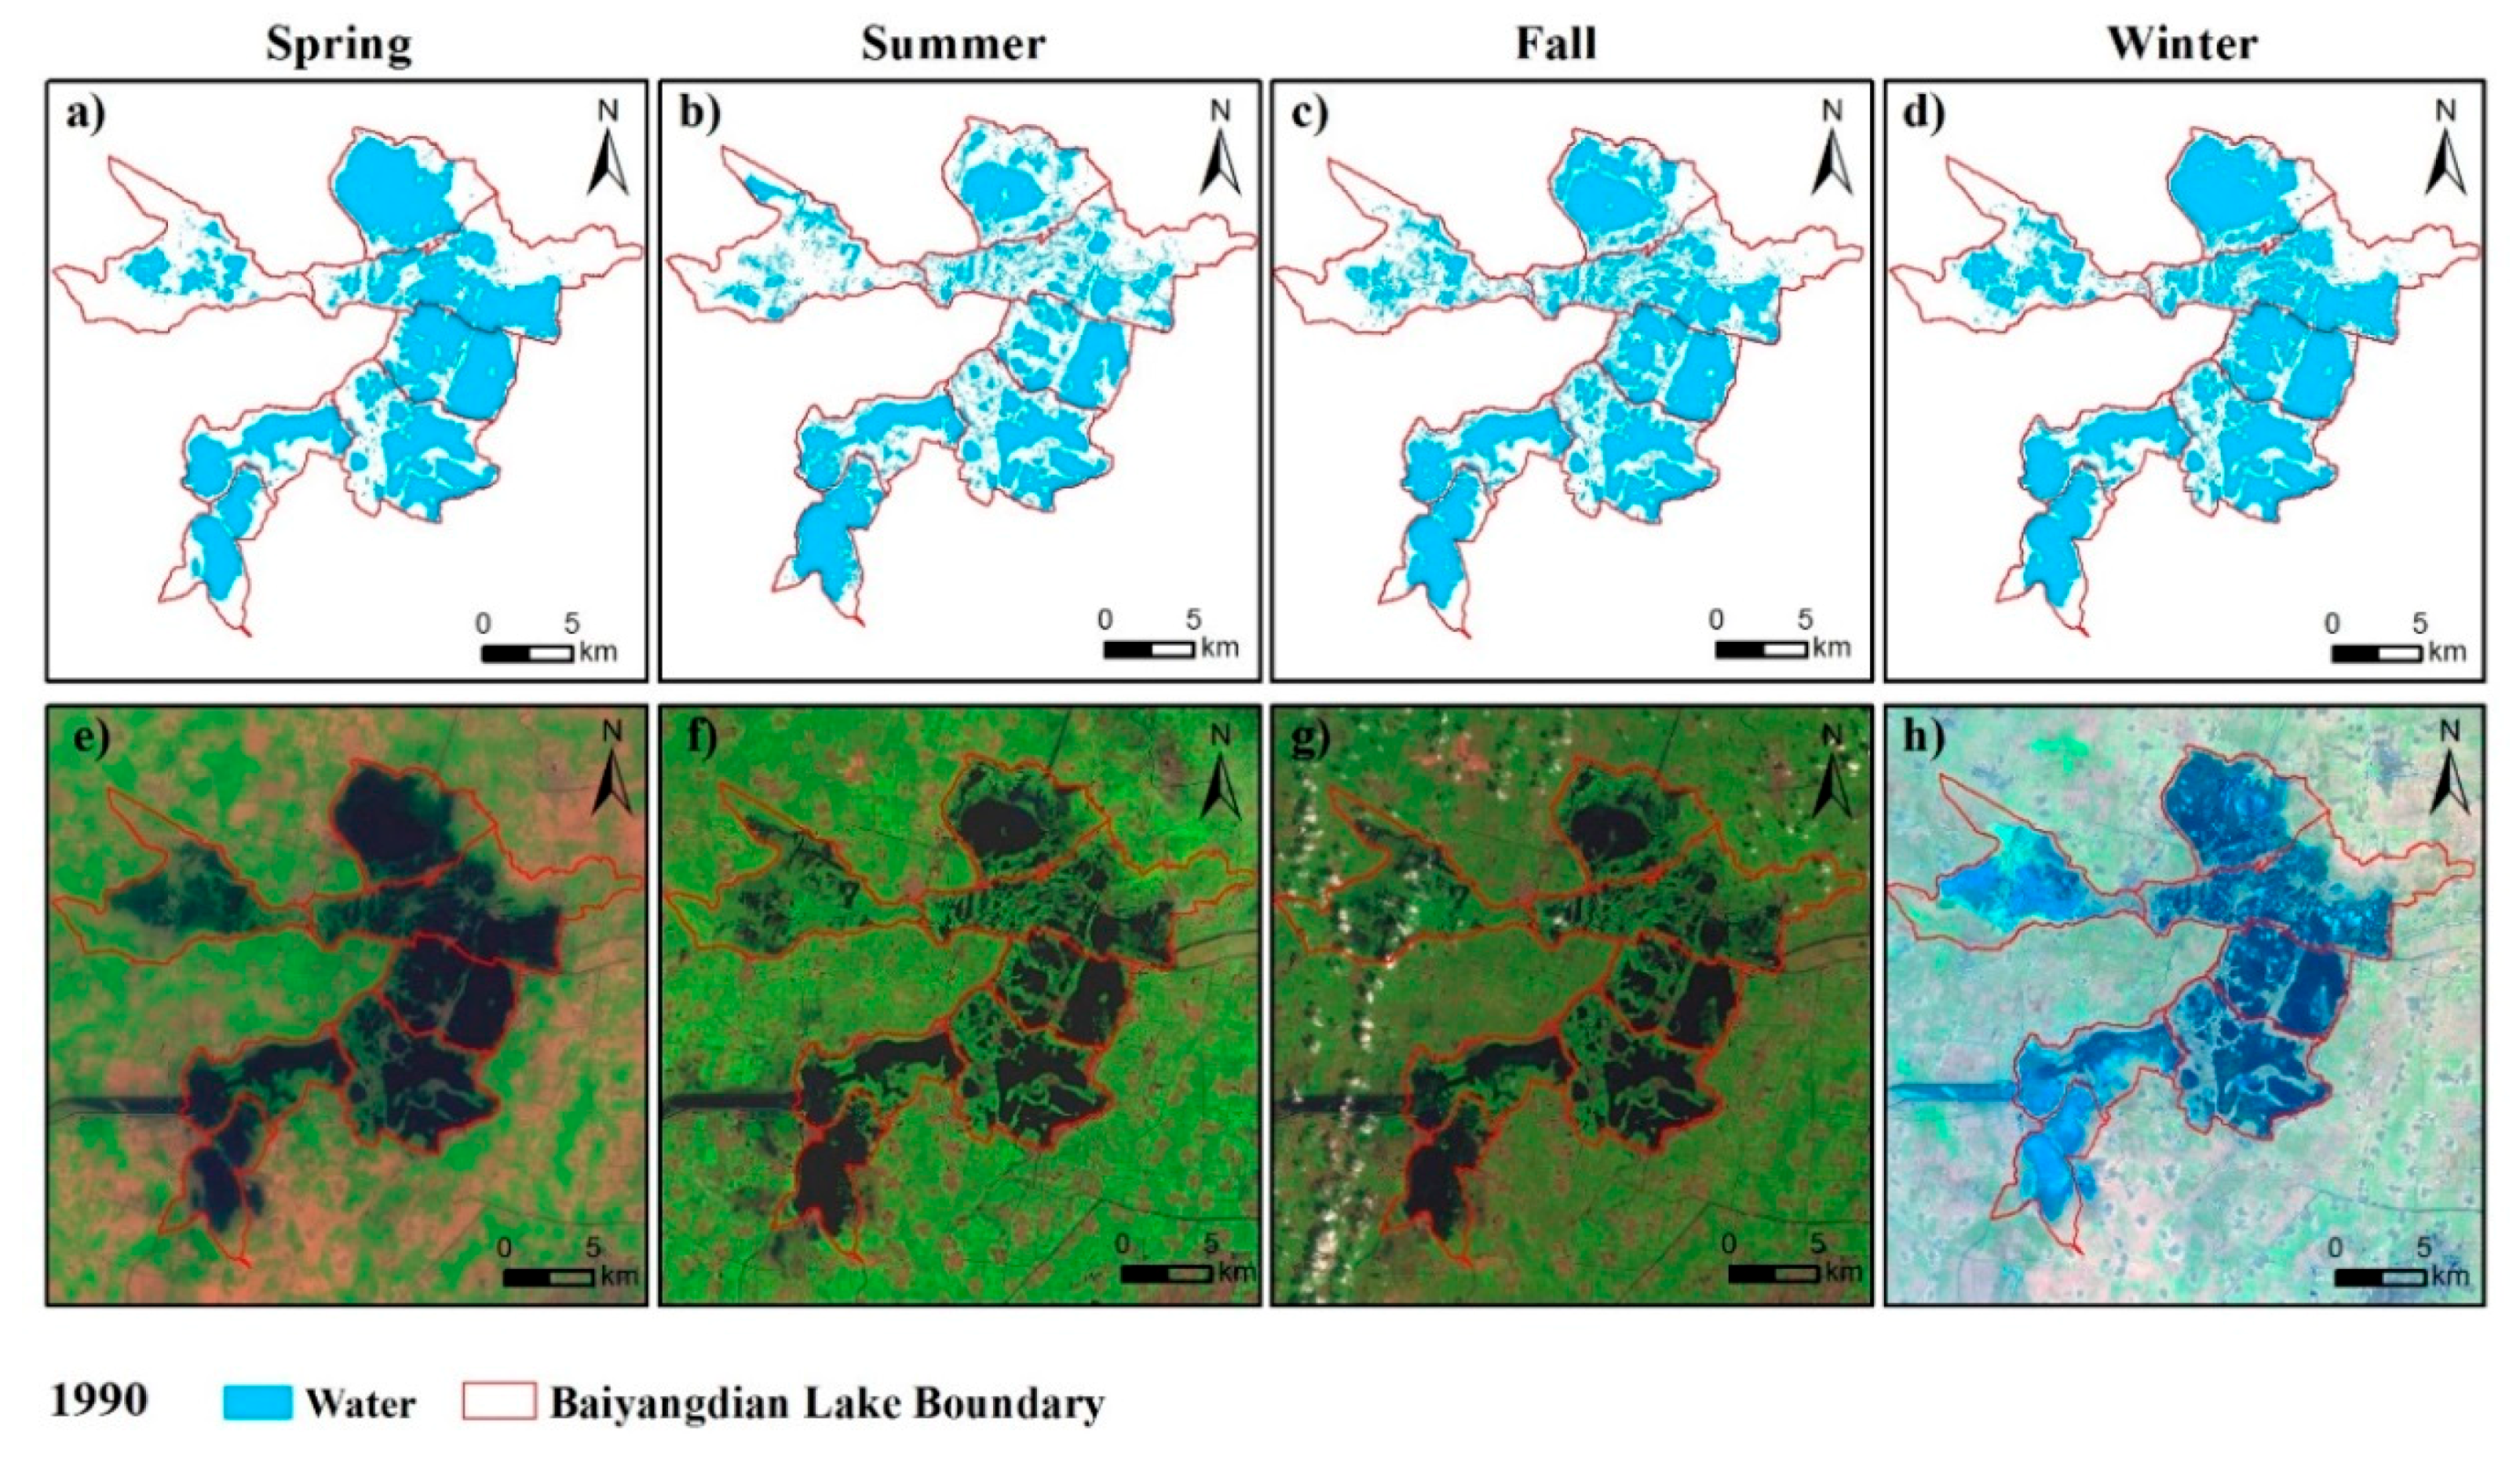
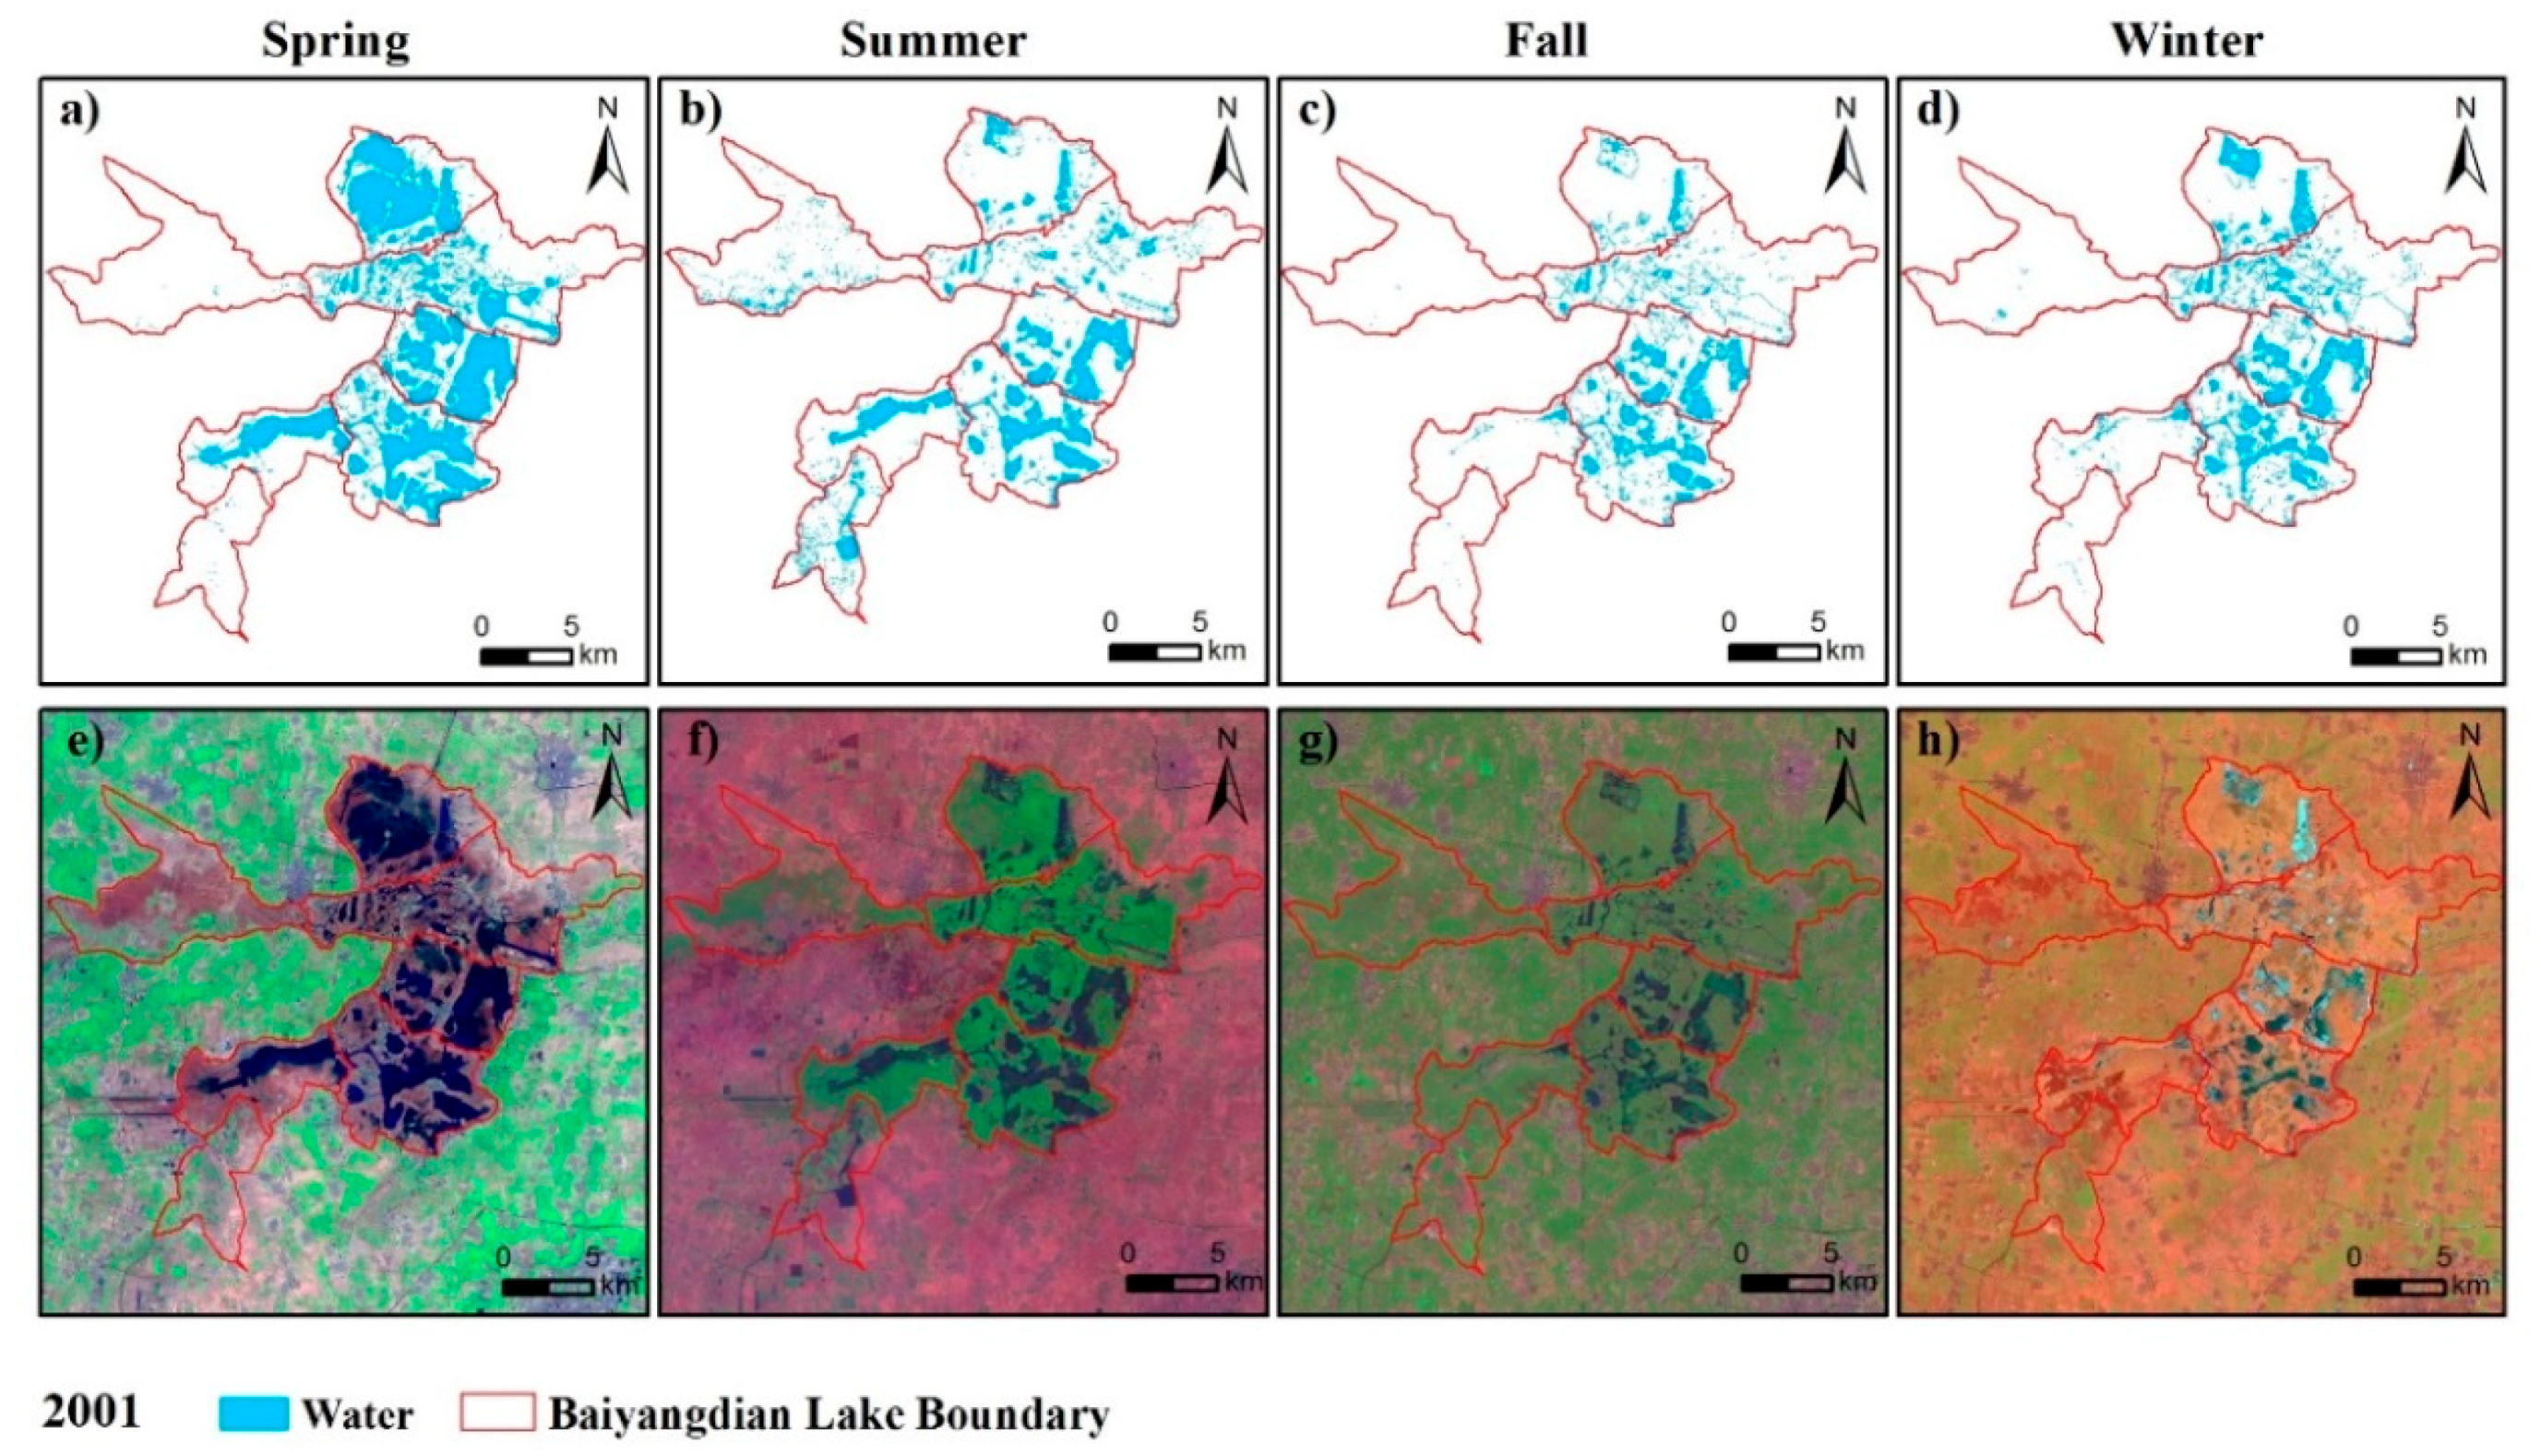
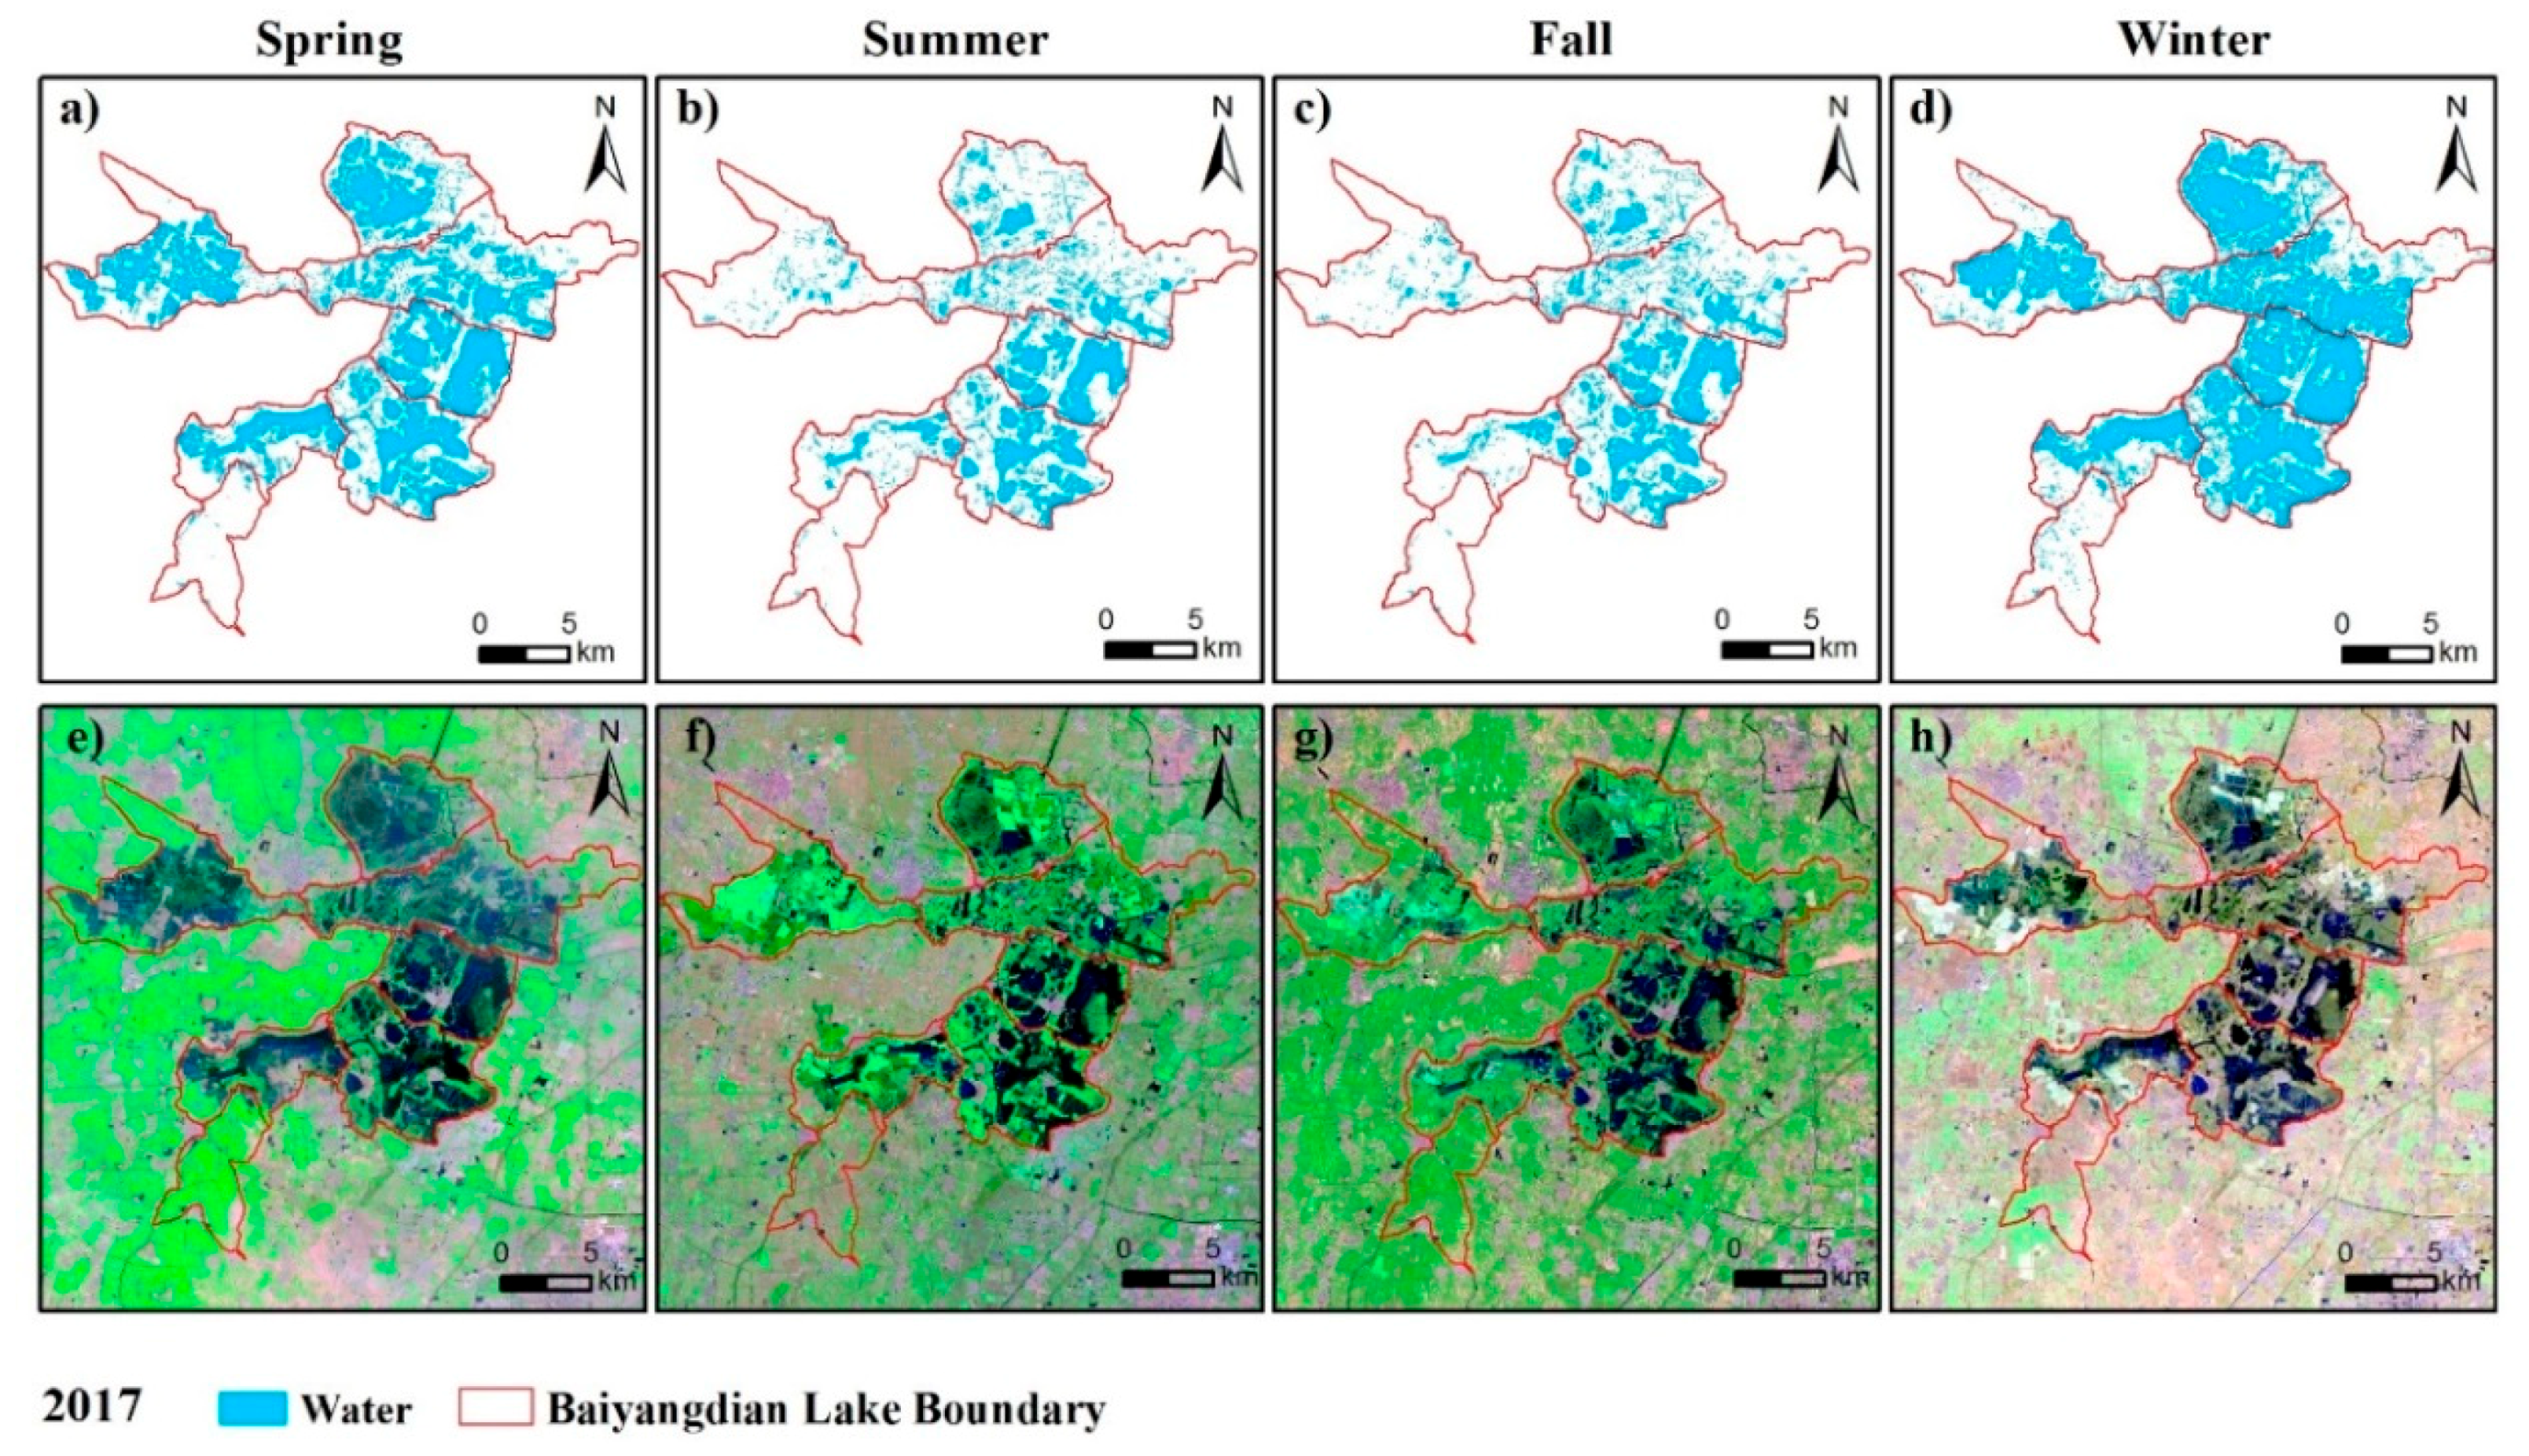
By visually comparing the extracted water surface area with the original remote sensing image, the overall effect of the SMDPSO is adequate (Figure 6, Figure 7 and Figure 8). In the spring, summer, and fall seasons, the degree of matching of the extracted water surface area with the original image is very high, but the water surface extracted in the winter has an overlarge phenomenon (Figure 6d, Figure 7d, Figure 8d). The reason for the excess in winter may be due to ice, snow, and wet soil near the water. SMDPSO is also applicable to Landsat 5 and 7 through verification.
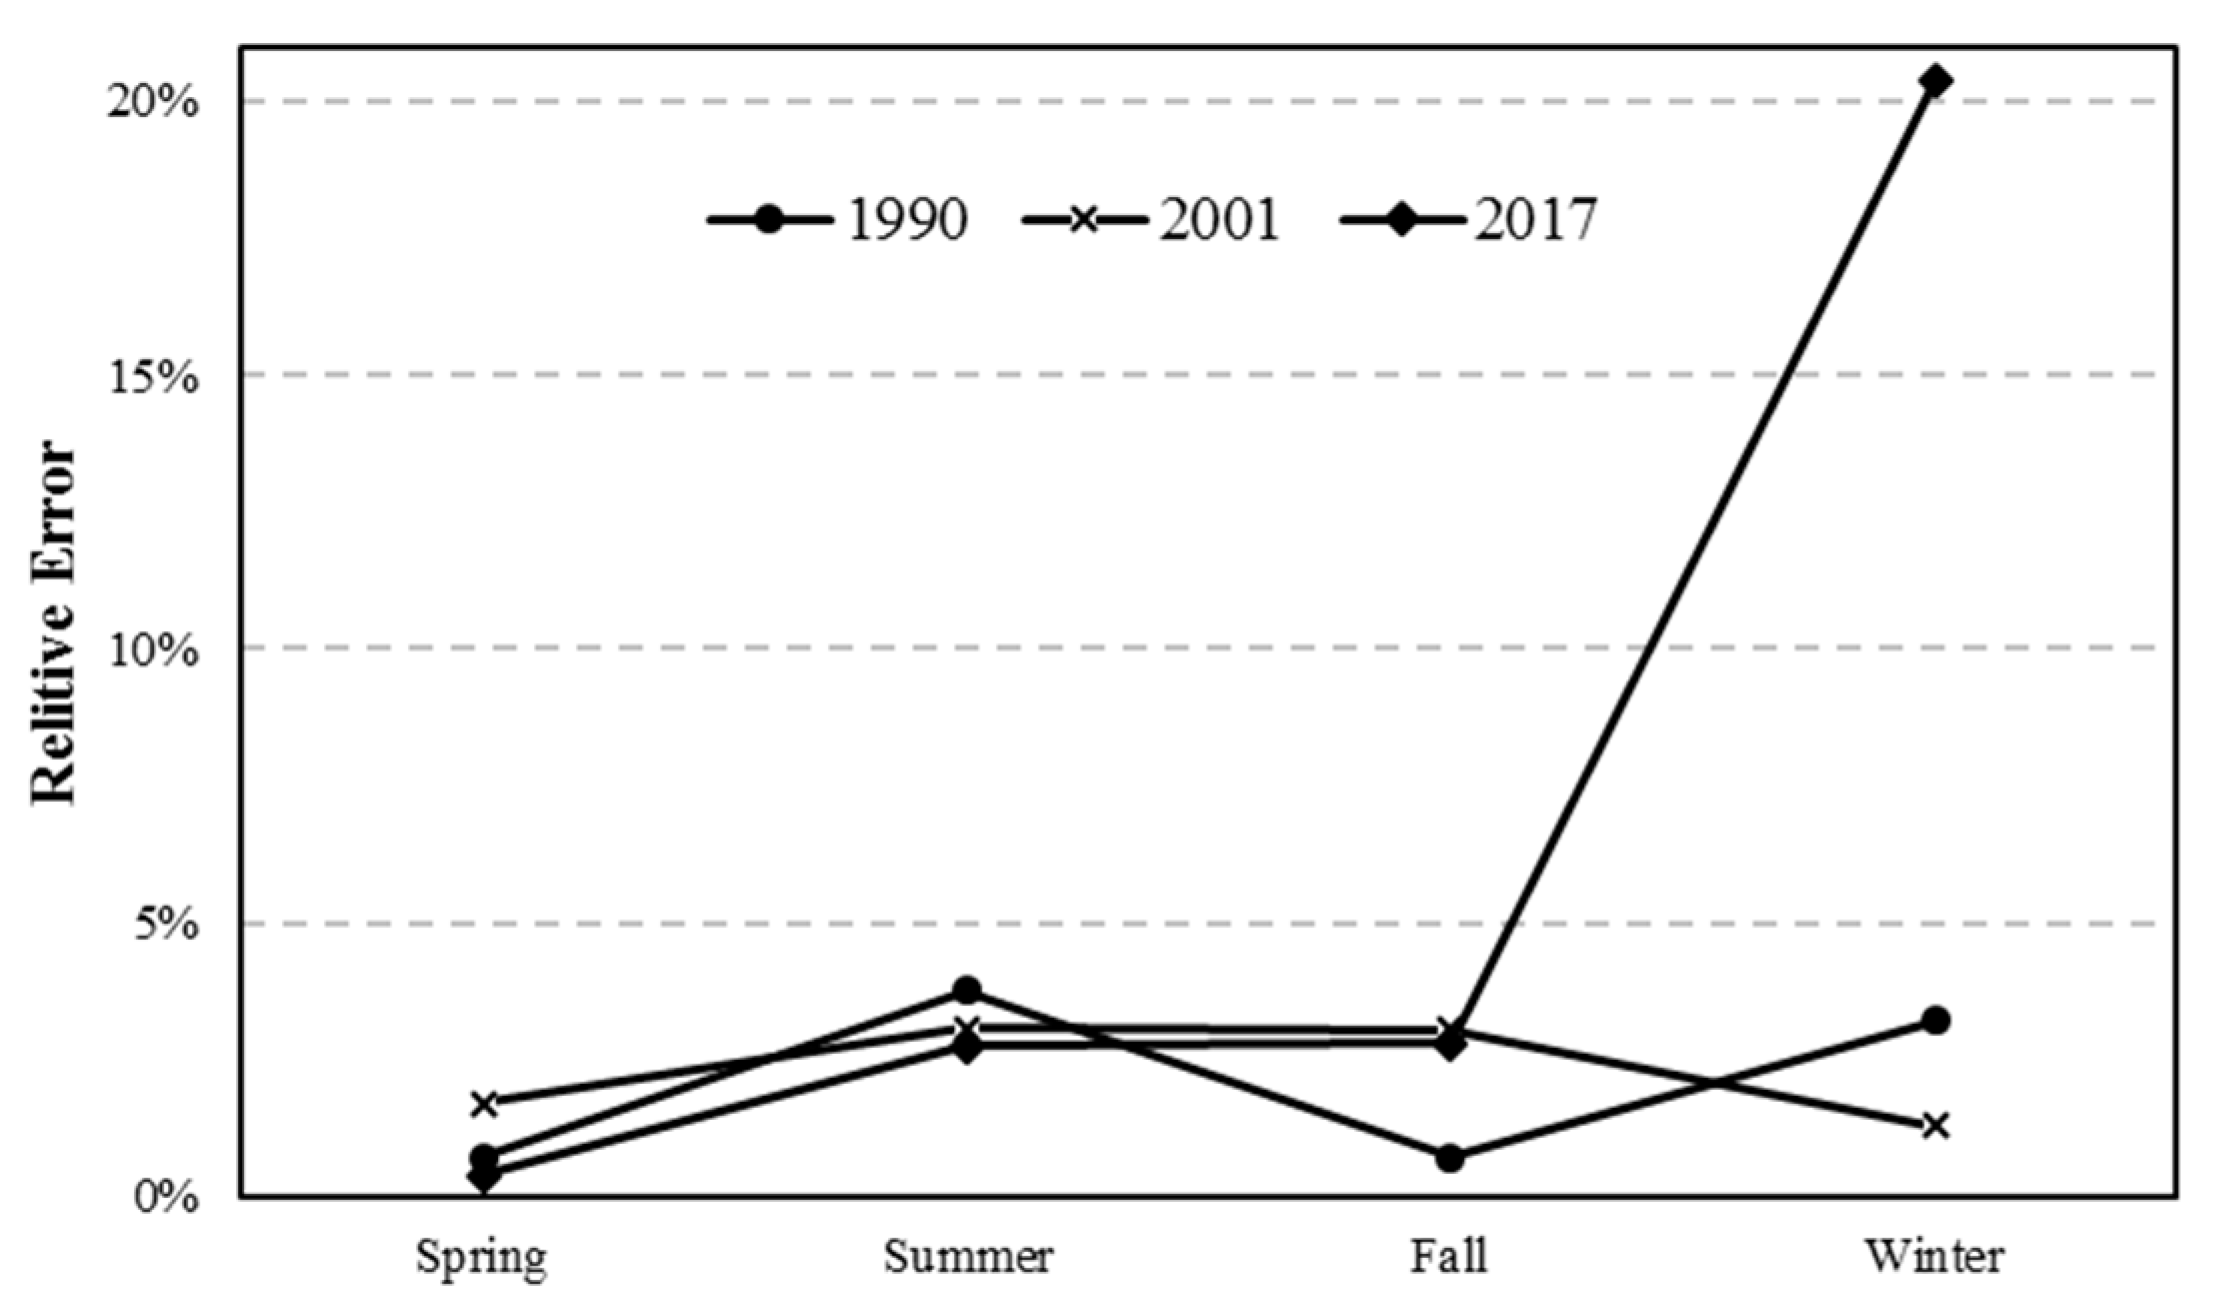
We calculated the R between the water area of the extracted and the observed in the three sample areas of D1, C1, and E1 (Figure 5). Based on the details of Figure 5, the boundary lines of the water extraction results in the three sample areas agree well with the original images, but several water extraction results look larger than the actual values in the winter. The R values of these results are conducted in Figure 9, showing that the water extraction accuracy of most images is satisfying where R is less than 5%, with only the images in the winter of 2017 having a relatively large error. The mean and maximum value of is 0.9% and 1.7% in spring, 3% and 3.8% in summer, 2.2% and 3.1% in fall, and 8.3% and 20.4% in winter, respectively, indicating the water extraction results are more accurate and reliable in spring than other seasons. Therefore, in this paper, the water extraction results from the remote sensing images in the spring are used to analyze the changes in Baiyangdian Lake from 1984 to 2018.
3.1.2. Comparison with Water Level Data
In this study, WL data was used to test the water extraction accuracy of Baiyangdian Lake, and the month of the WL data corresponds to the month of the remote sensing images. The data was used to calculate the between WL and water area.
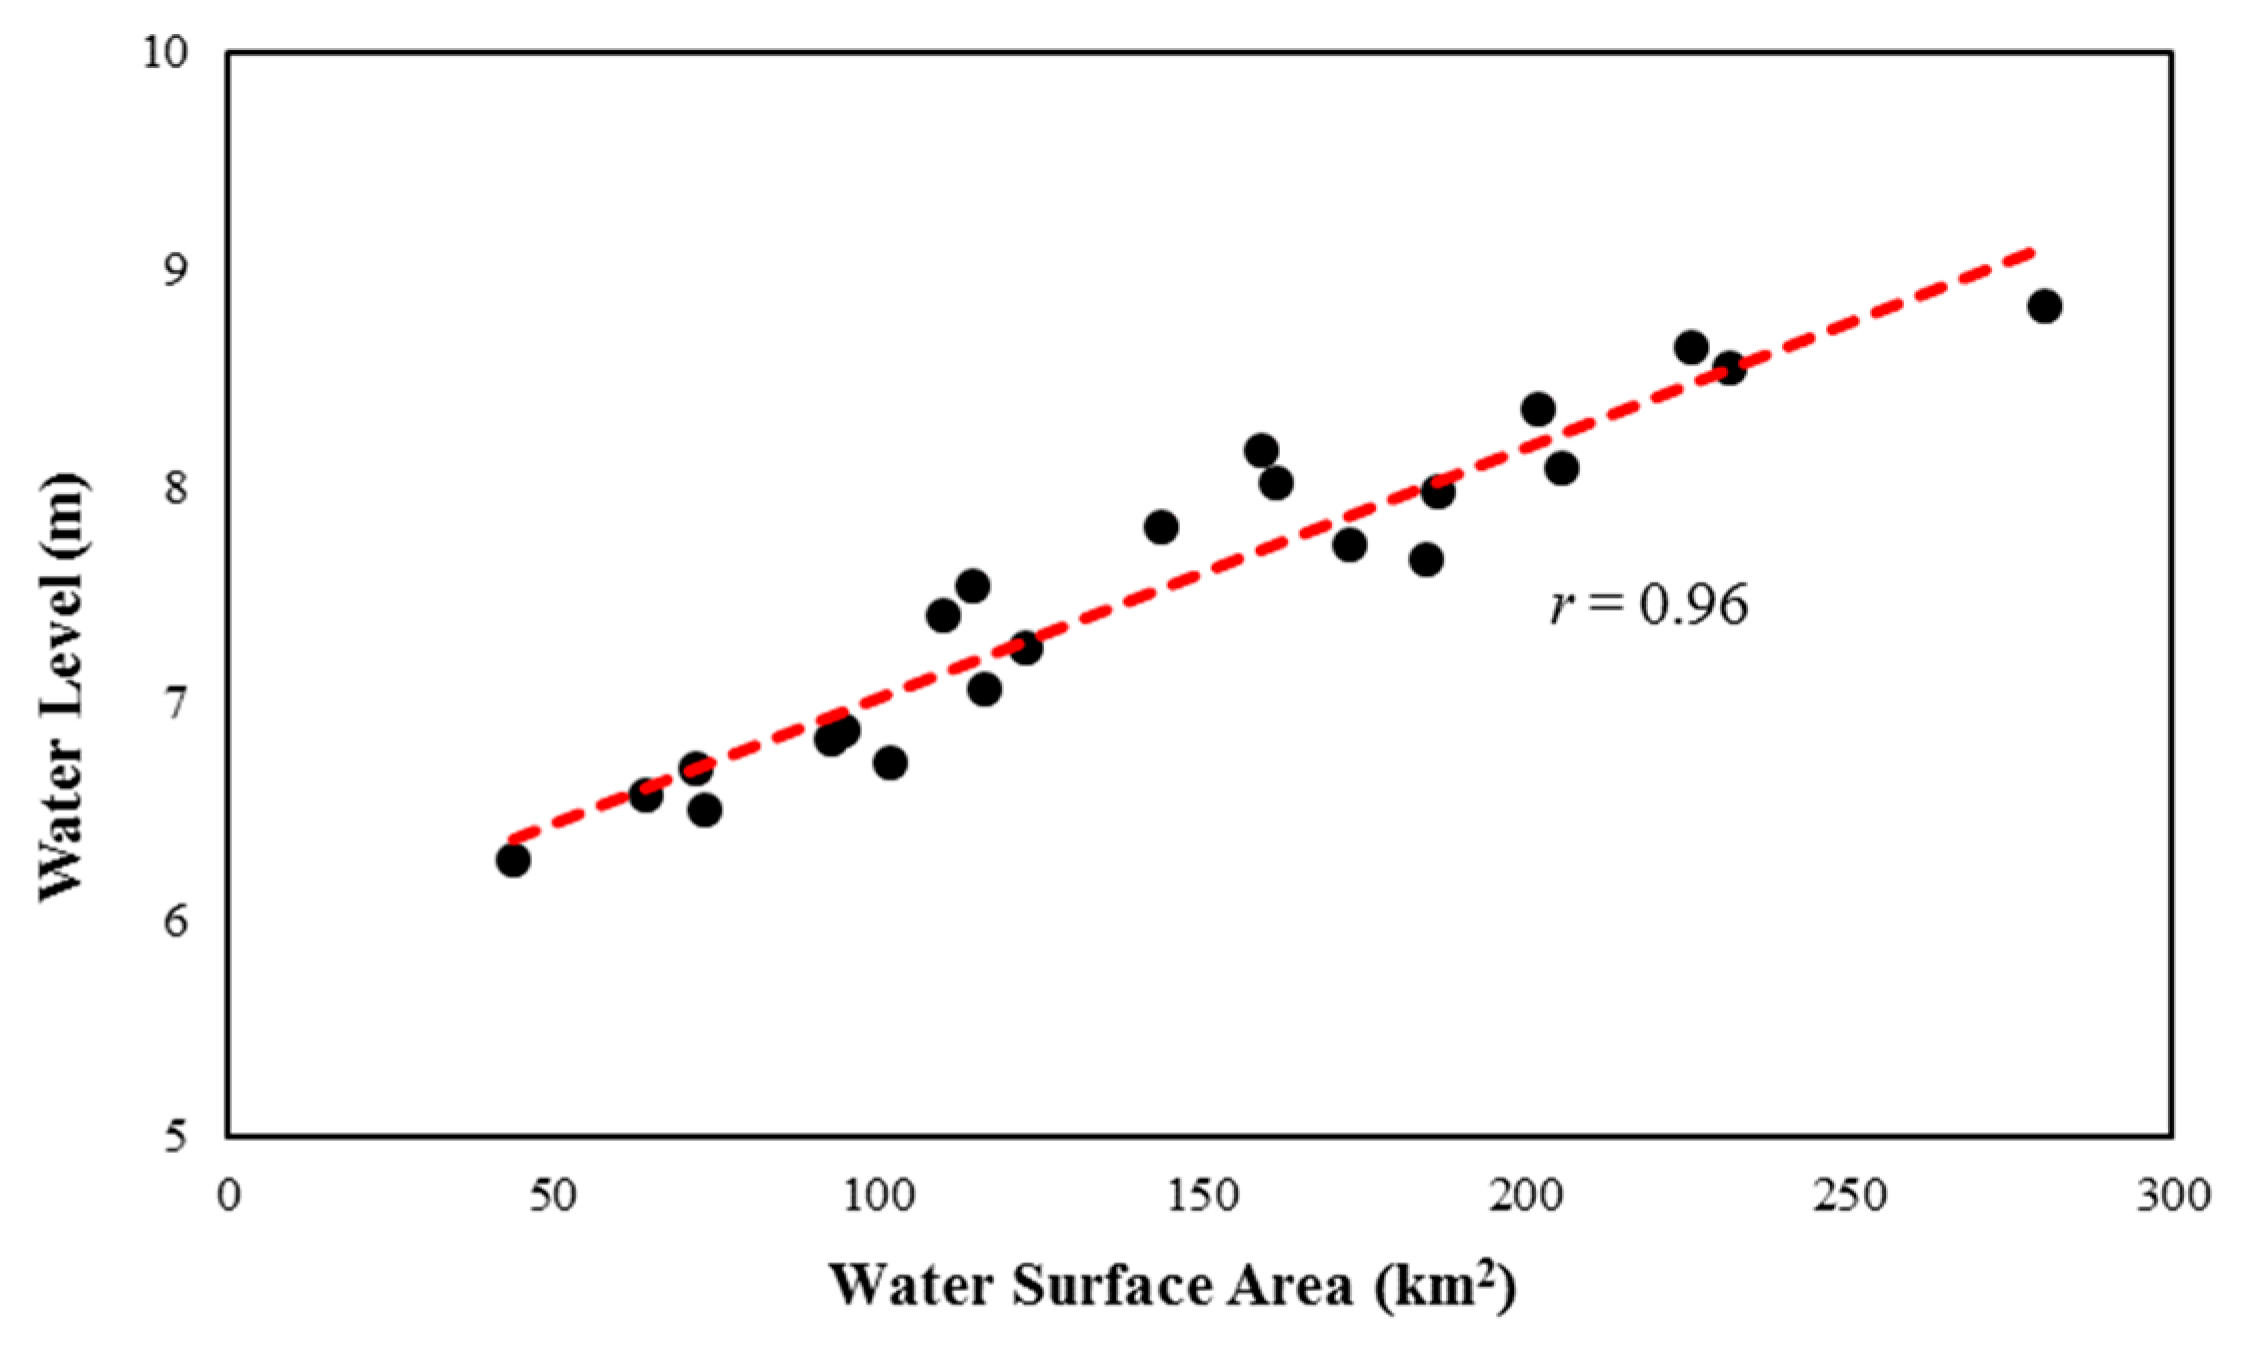
Baiyangdian Lake is a low-lying land located in the alluvial plain, and the change of water surface area will obviously cause the water level to change. Figure 10 shows that there is a significant positive correlation between the WL and water area ( = 0.96, p < 0.01). It also suggests that the results of the water surface extraction are very accurate, and the SMDPSO method has good applicability to Baiyangdian Lake.
3.2. Variation Characteristics of the Water Area in Baiyangdian Lake
3.2.1. Interannual Change Analysis of Baiyangdian Lake
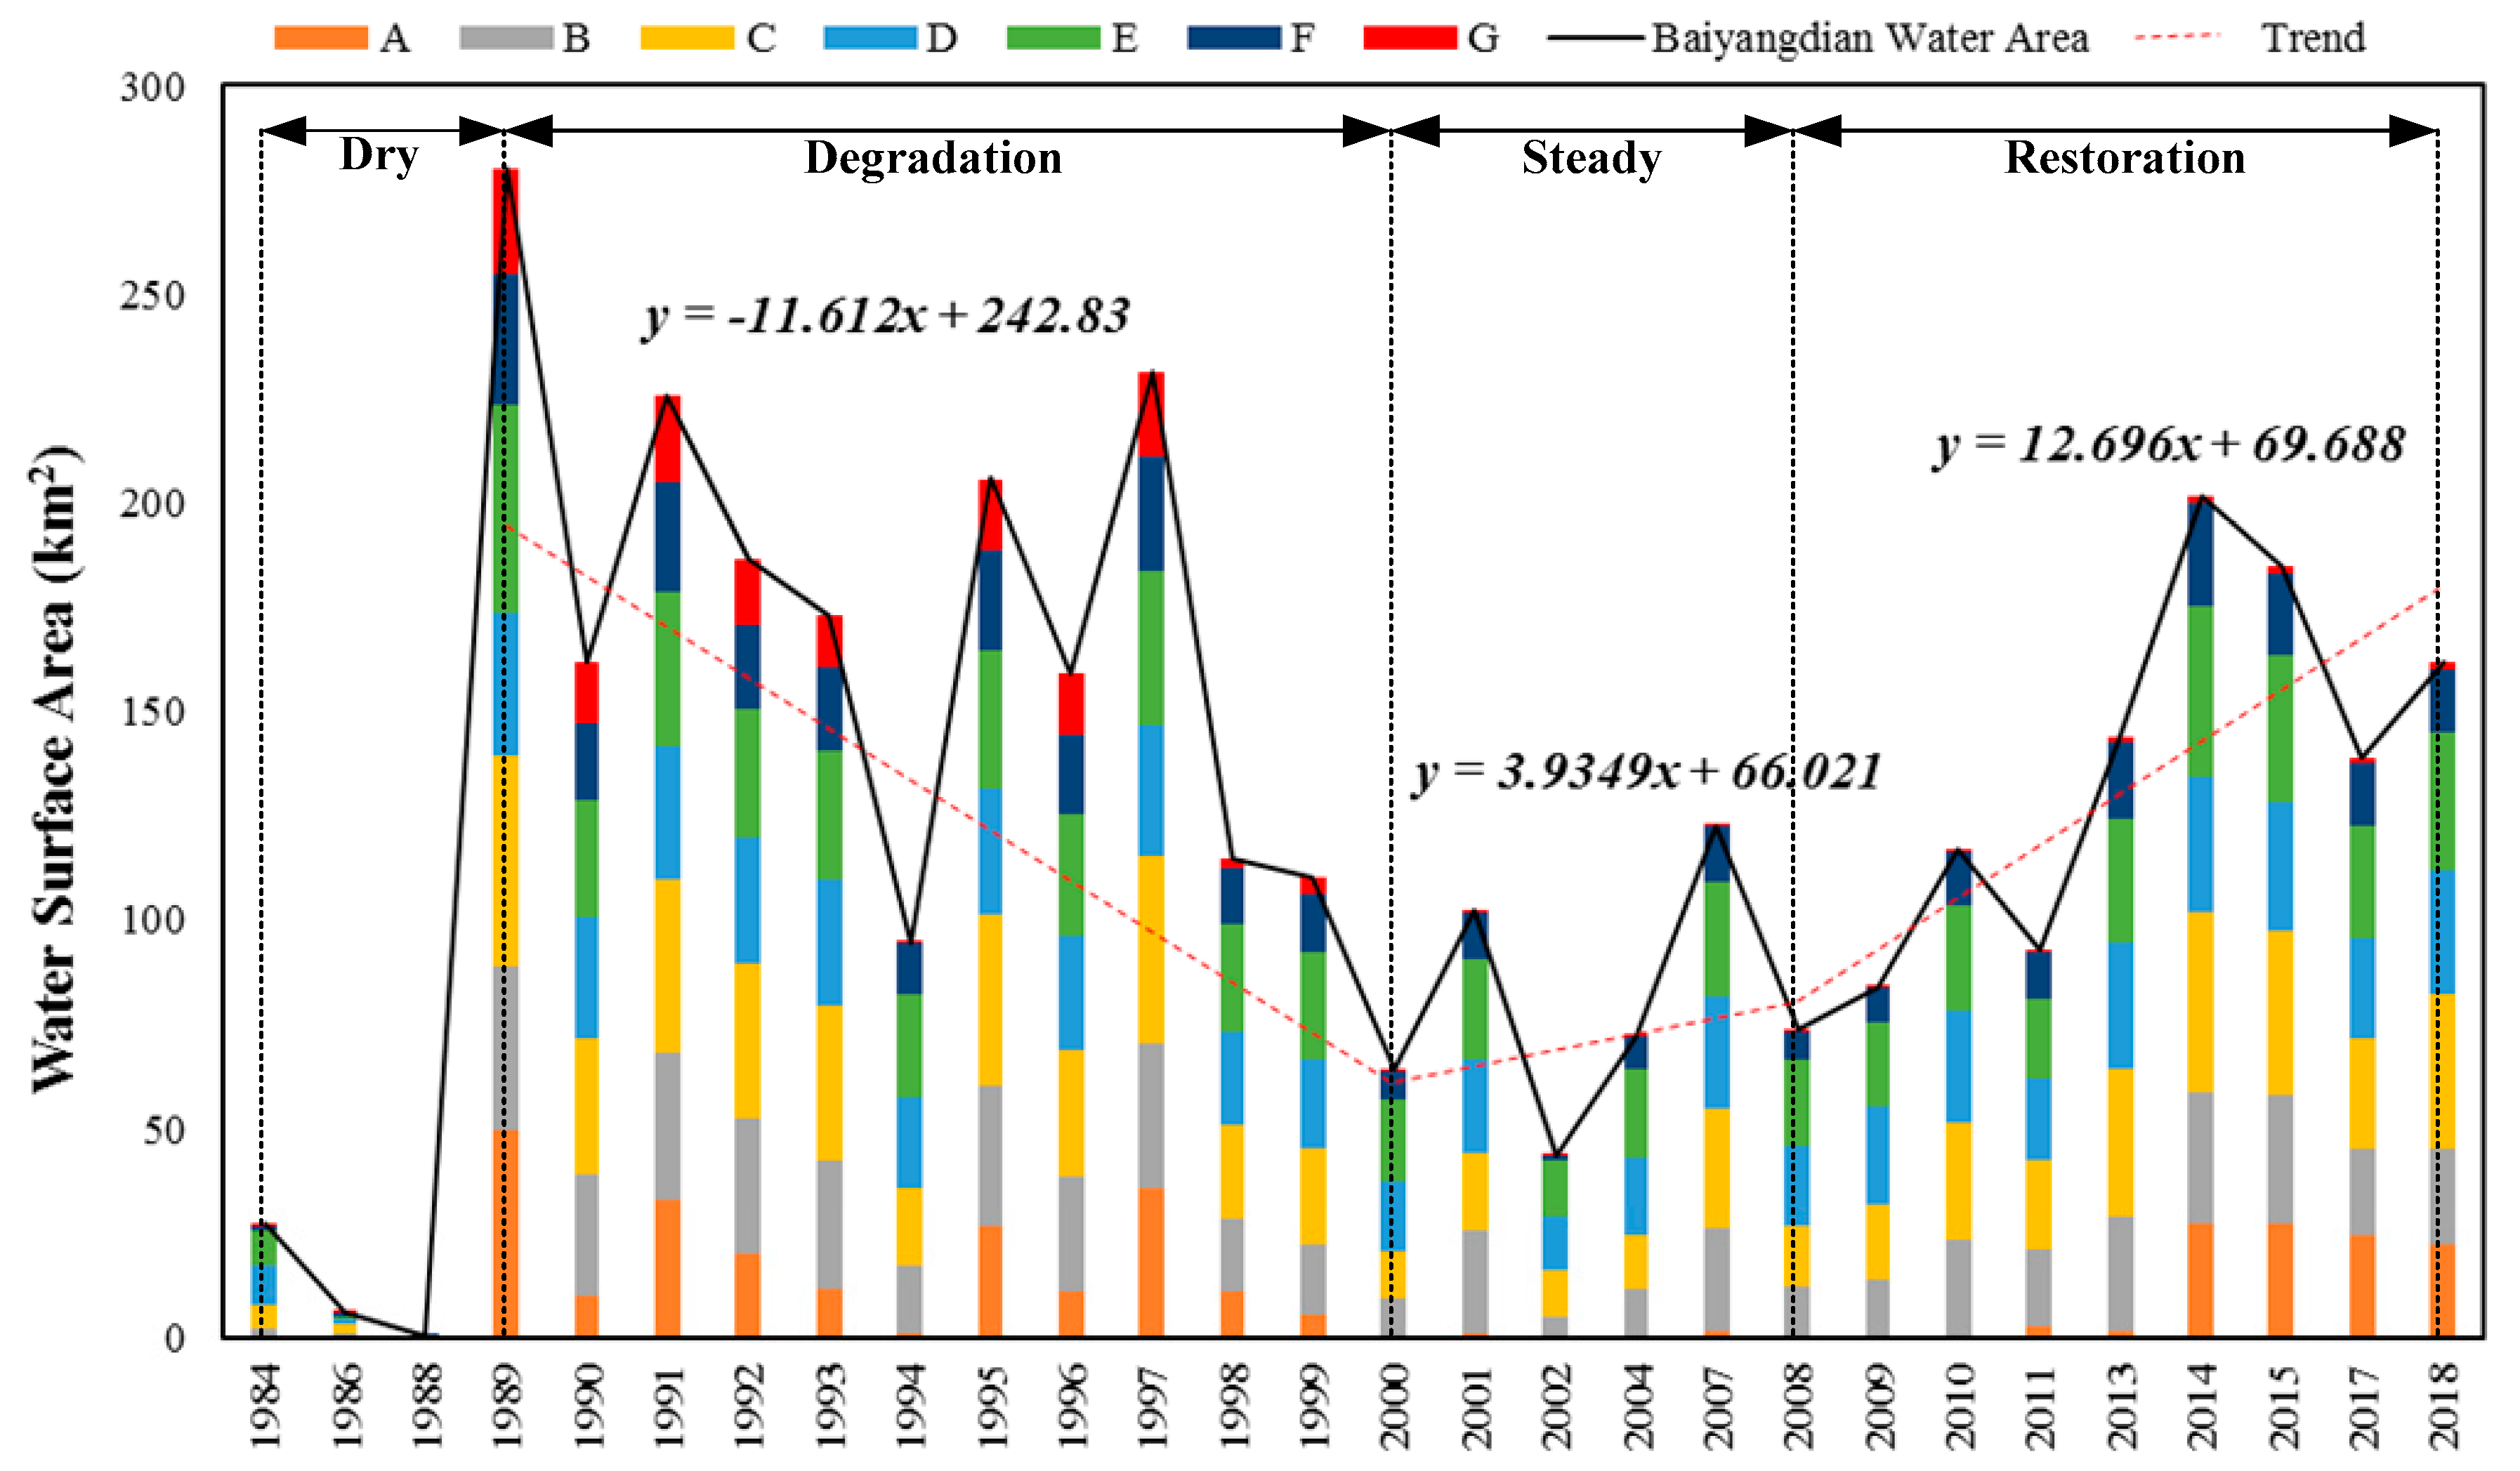
From 1984 to 2018, the water area in Baiyangdian Lake was divided into four periods (Figure 11). First, Baiyangdian Lake was very water-deficient from 1984–1988 and the average water area was 11 km2. Due to extremely heavy rain, the dry state of Baiyangdian Lake ended, and the water area reached its largest area in 1989, with an area of 280 km2. The second phase was a degradation period, and the water area of Baiyangdian Lake gradually decreased from 1989 to 2000. In 2000, the water area dropped to 64.15 km2, with an average annual reduction of approximately 11 km2. The third phase (2000–2008) was a relatively stable period, and there was no significant increase or decrease in the water area. Finally, the fourth phase was a restoration period (2008–2018), and the water area of the lake increased approximately 12 km2 per year during this period.
The area changes in several subregions were like the whole lake, except for A and G. The water area of G reached the largest value with a total of 25 km2 in 1989, but the water in G was almost non-existent after 1999. Similarly, the water area of A also reached a high level (approximately 49.93 km2) in 1989. After 2000, the surface water almost disappeared. However, in 2014 the water area was restored to 27.37 km2. The water area of A after the recovery period was only approximately half of the result during the maximum period.
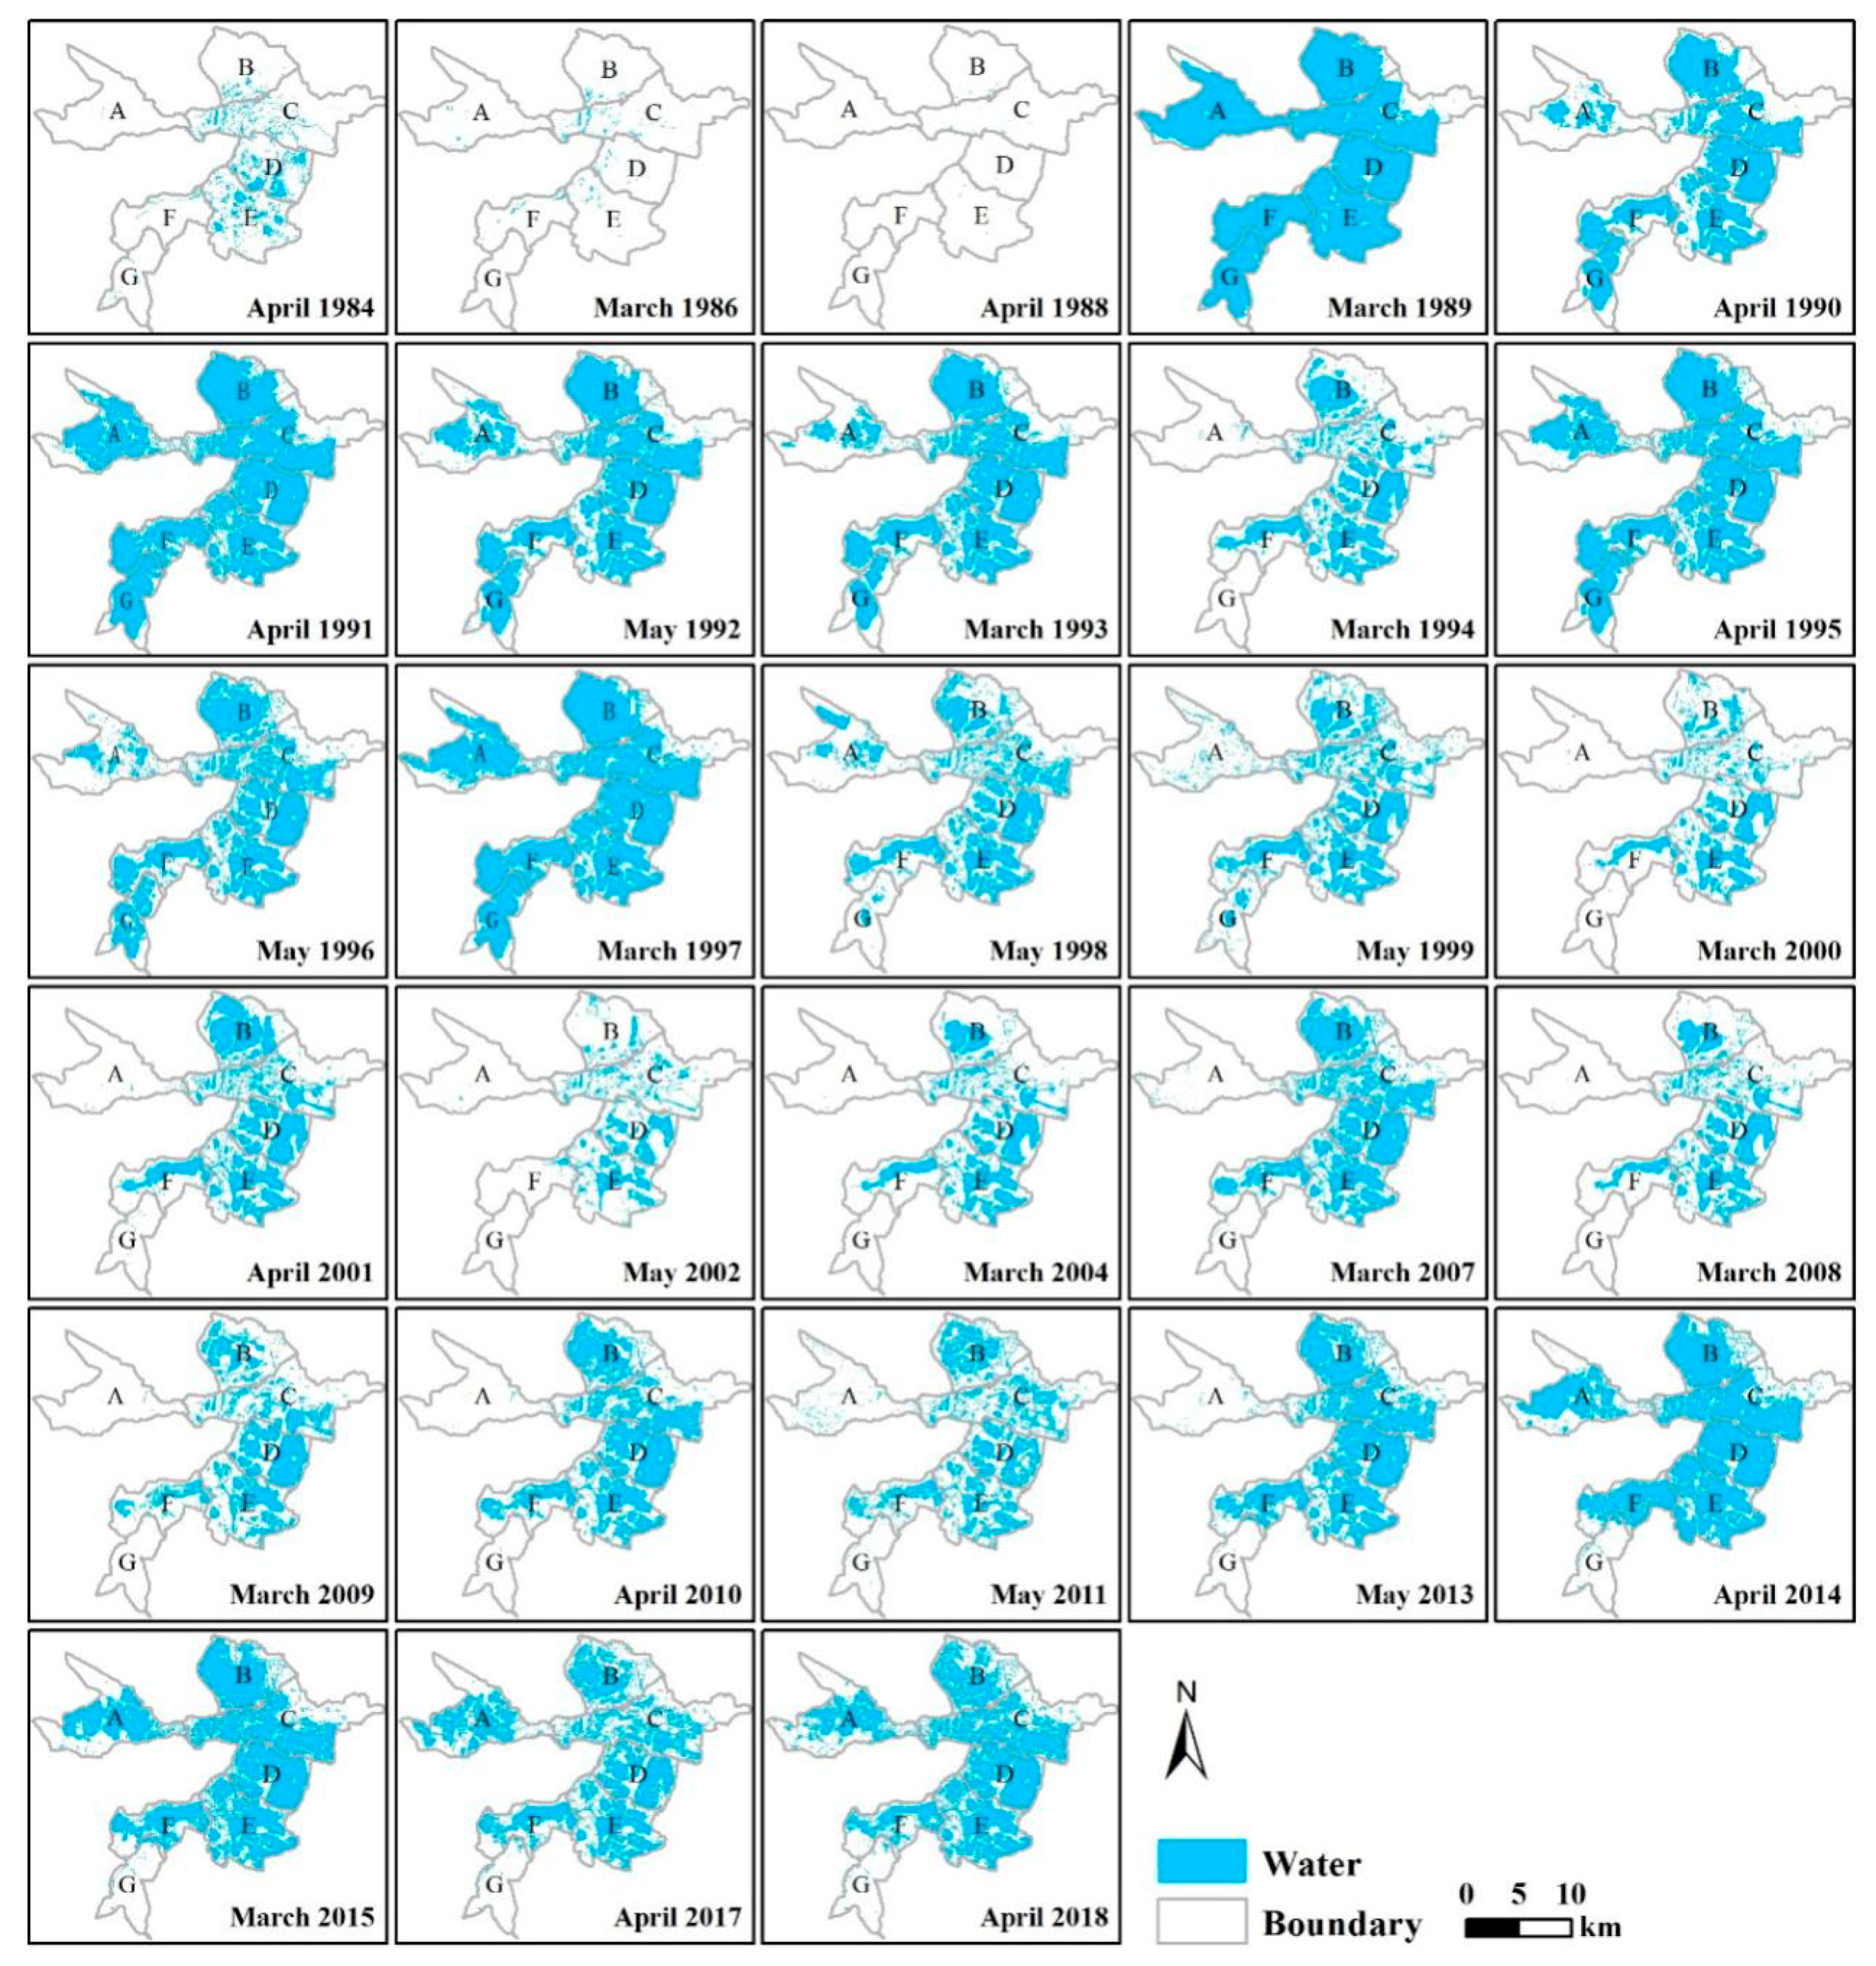
Four periods can be clearly divided into water surface area variations in Baiyangdian Lake, as shown in Figure 12. The water surface area in 1989, 1995, 2014, and 2018 was clearly large and covers a wide area. The water in A had gradually degraded since 1997 and began to recover in 2014, but the range of this water has been significantly reduced compared to the largest water area period in 1989. There is still no water in G and the western part of F, because this water area was completely converted into farmland, although most the water of each subregion recovered in 2018. Due to the water surface area changes in Baiyangdian Lake from 1984 to 2018, the degree of water fragmentation has become increasingly serious. The water surface area was complete and smooth in 1989, while fragmented and messy in 2018.
3.2.2. Spatial Change Analysis of Baiyangdian Lake
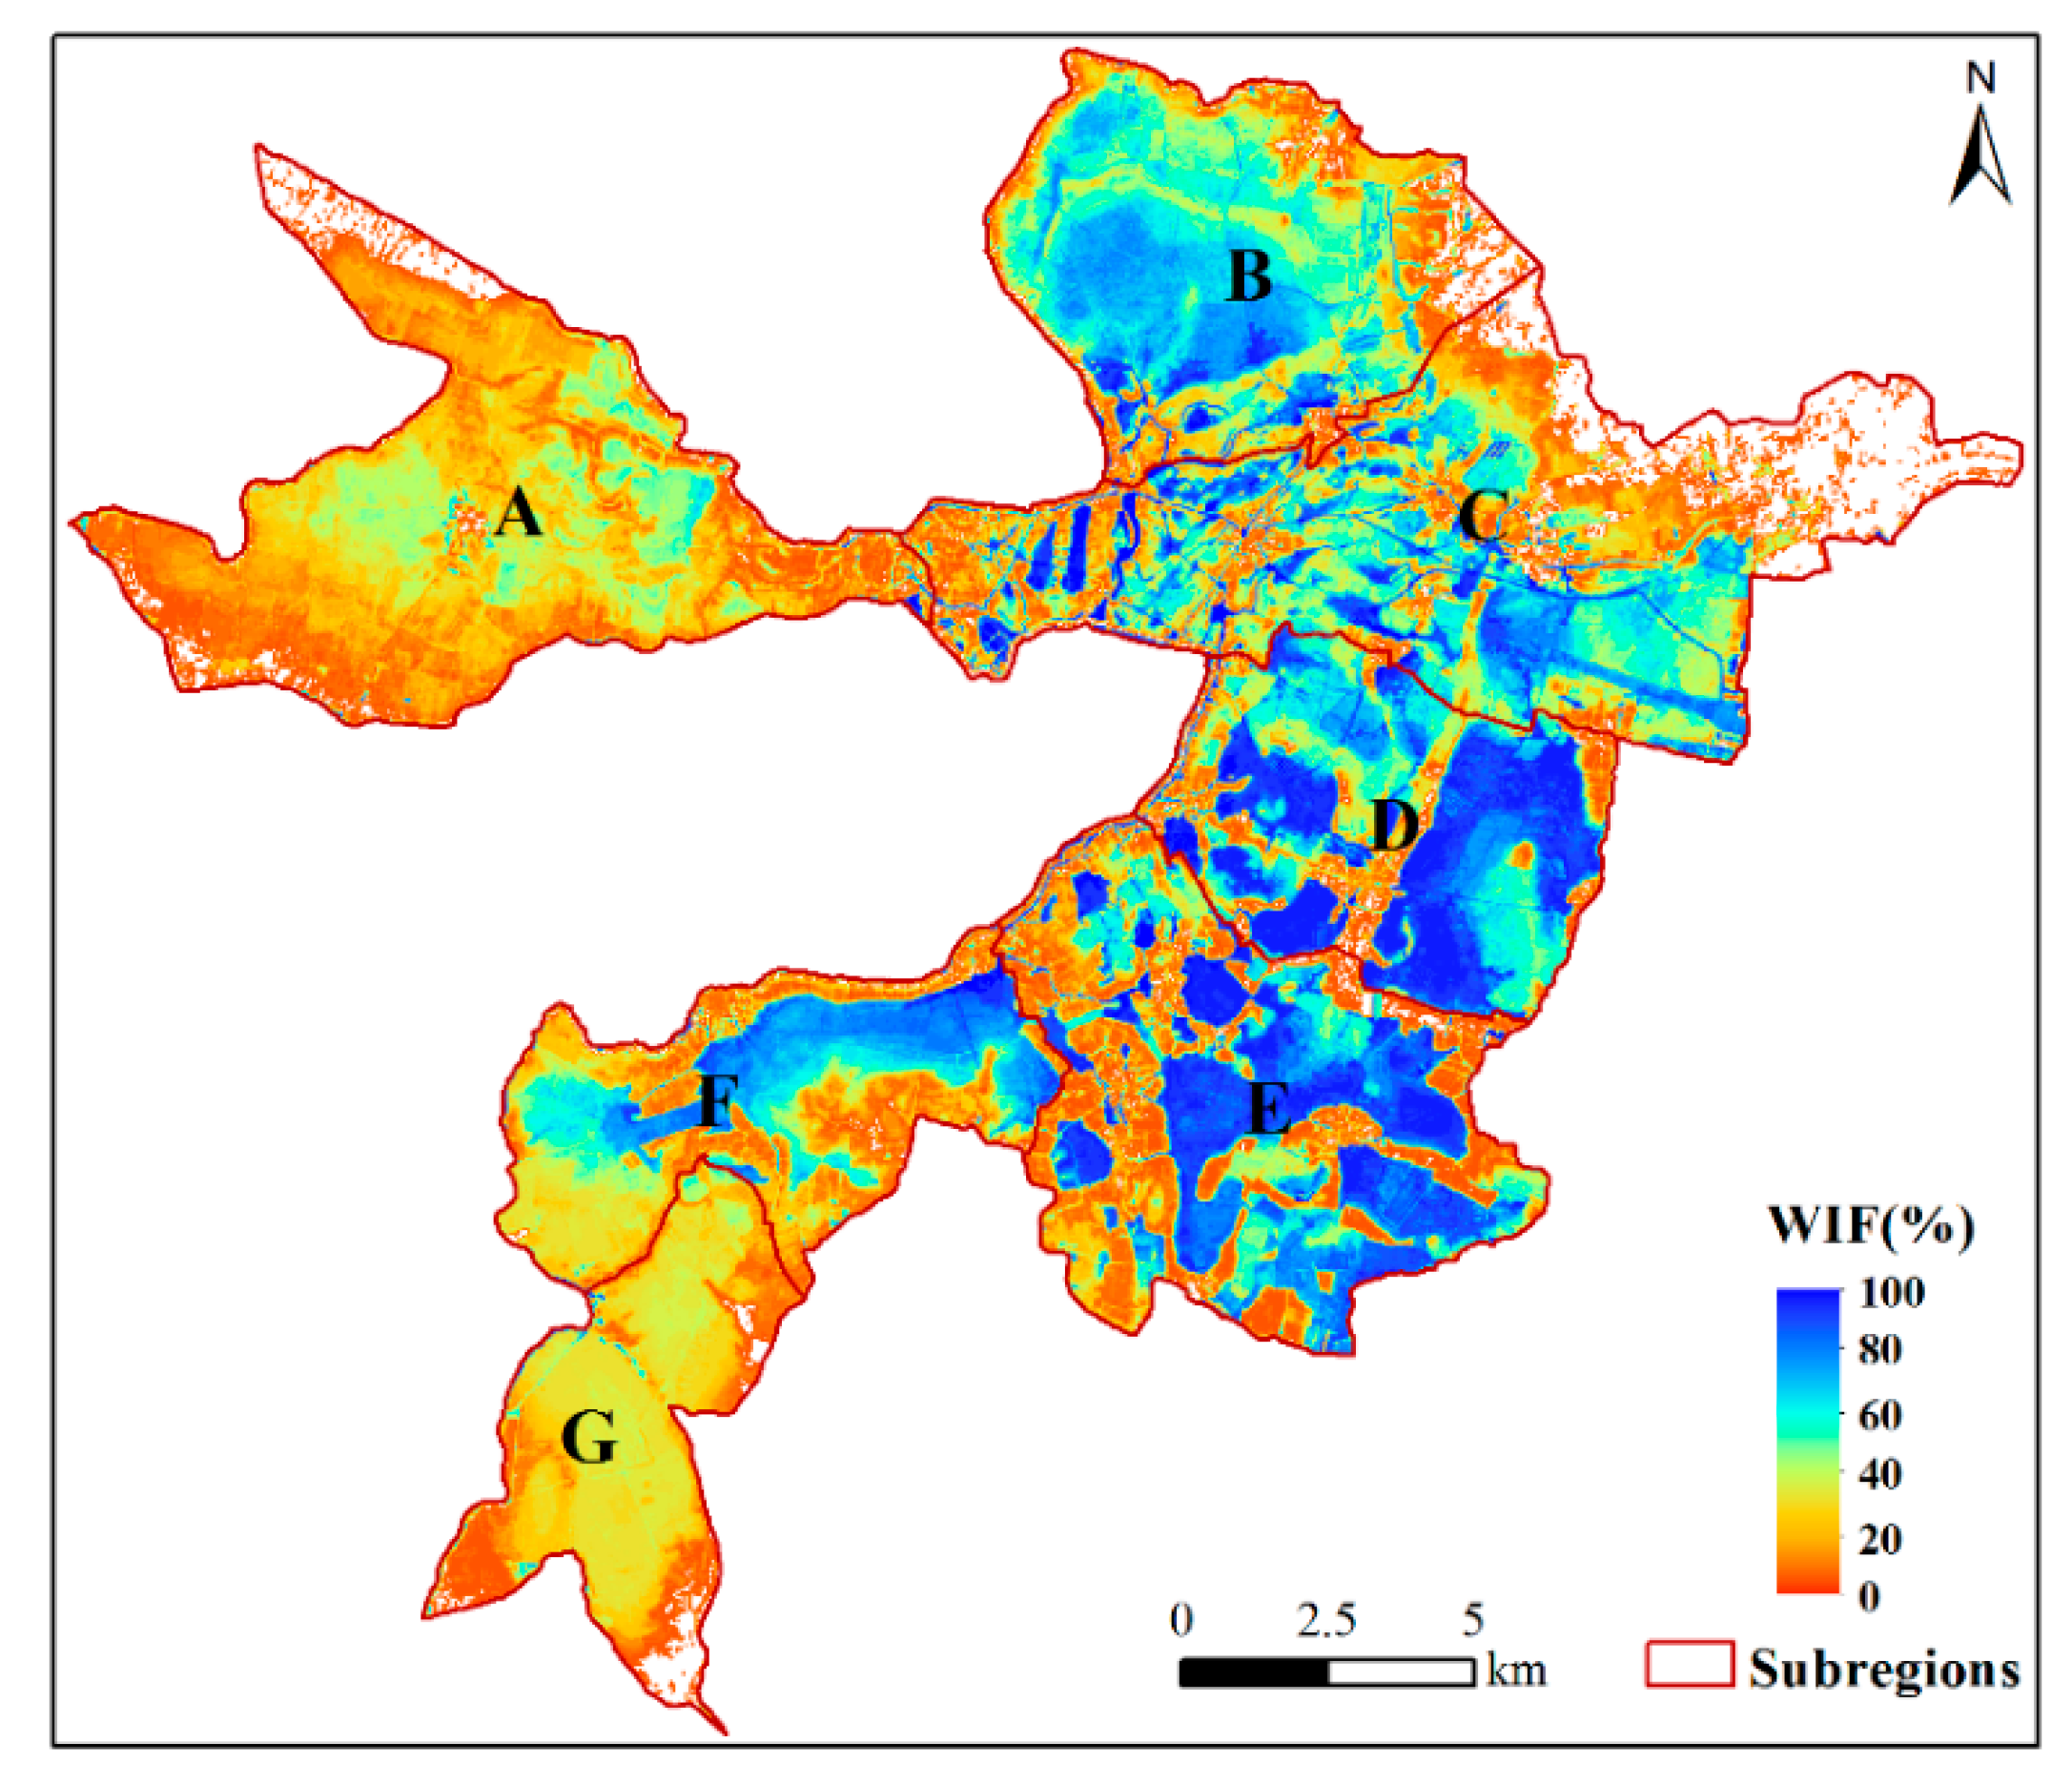
To study the spatial changes of lake surface, we calculated the WIF and divided it into five grades: 0–20%, 20–40%, 40–60%, 60–80%, and 80–100% (Figure 13). The permanent water mainly concentrated in the five subregions of B, C, D, E, and F. In B and F, a complete small lake shape can be seen, and D and E are composed of several small lakes, but C is different from B, D, E, and F, as it has no complete lake shape. The temporary water is concentrated in A and G, especially the parts where the WIF is less than 40%. It can be regarded as no water if the WIF is less than 20%, because the distribution of non-water is consistent with farmland, villages, and so on.
We calculated the water area percentage for each subregion out of the total water area beginning in 1989, because the lake had almost no water in 1984–1988 (Figure 14). The water areas of C, D and E occupied approximately 60% of the total water area, and reached approximately 80% during 2000–2008 when the water area was small. The differences in water area between different subregions of Baiyangdian Lake were small in 1989, 1990, 1995, 1997, and 2014, which were the periods that the water area was large. In the year when the water area was small, the areas with water were mainly concentrated in B, C, D, E and F, while the other subregions had little or no water. This also shows that the water in Baiyangdian Lake was mainly located in the five subregions of B, C, D, E and F.
3.3. Possible Causes for Changes in Water Area in Baiyangdian Lake
3.3.1. Temporal Changes
From 1984 to 1988, Baiyangdian Lake was in a dry state. This dry state of Baiyangdian Lake was caused by the combined effects of climate and human activities [37]. The area of cultivated land increased continuously after the land reform in 1980, so agricultural water consumption increased significantly [27]. Moreover, a large number of reservoirs and dams were built upstream of Baiyangdian Lake [38]. Simultaneously, the AP was less, and the NI was zero during this period. There were large consumption and no water supply, so Baiyangdian Lake was in a dry state.
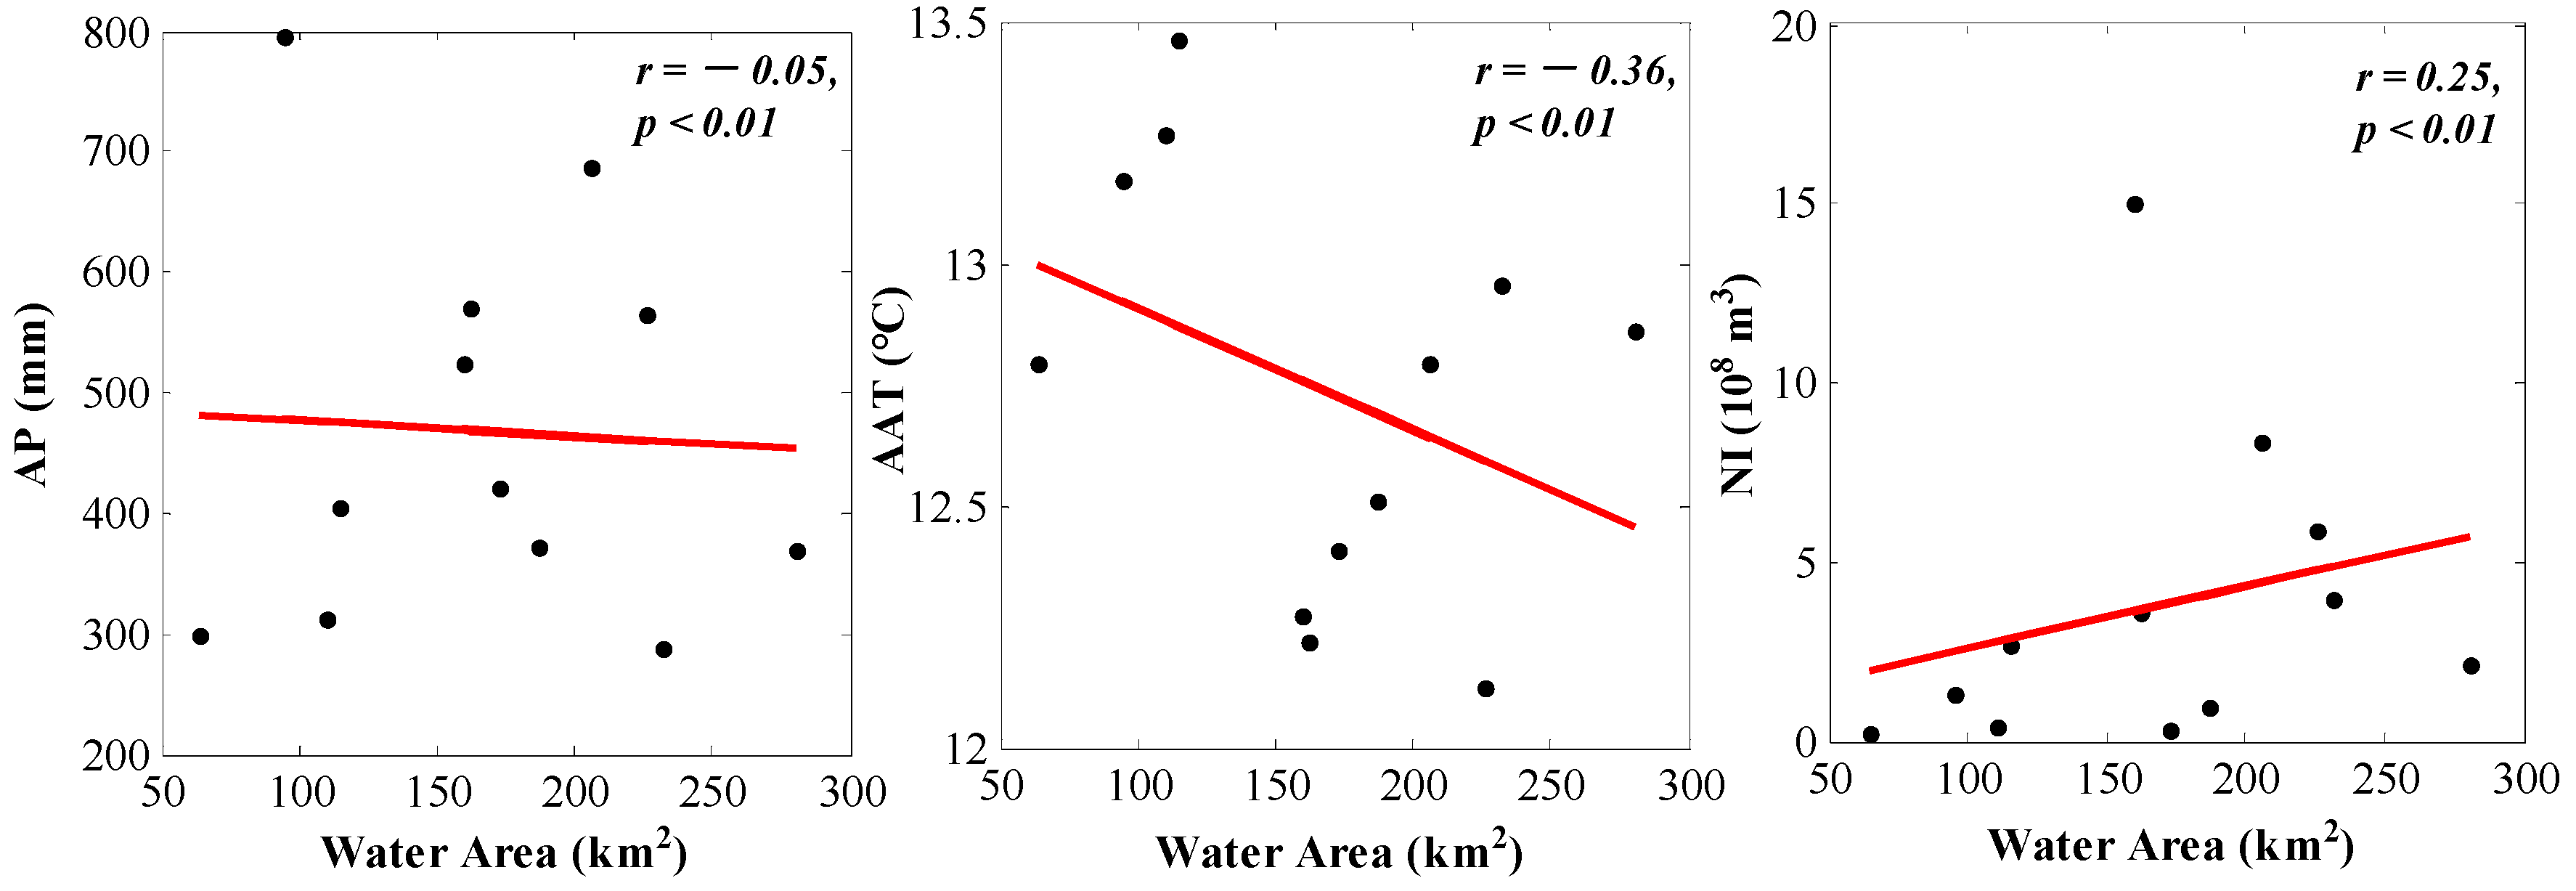
The water area of Baiyangdian Lake showed a decreasing trend from 1989 to 2000. We separately calculated the Pearson correlation coefficients between the water area and AP, AAT, and NI during this period. There is no positive correlation between AP and the water area, and it is positively correlated with NI, and negatively correlated with AAT (Figure 15). The reduction of NI and the increase of AAT have certain impacts on the reduction of water surface area, but climate change was not the only cause. The impact of human activities can be inferred to be the most important cause for the reduction in the water area of Baiyangdian Lake. The possible reason was agricultural irrigation. Baiyangdian Lake is part of the plain, and the surrounding agriculture is relatively developed. In studying the driving force of Baiyangdian landscape change, Zhuang et al. [39] pointed out that the grain output of the Baiyangdian basin increased from 2.6 × 10⁹ kg in 1970 to 6.6 × 10⁹ kg in 2007, and the agricultural water consumption in this basin accounted for 78.8% of the total water consumption in 2006.
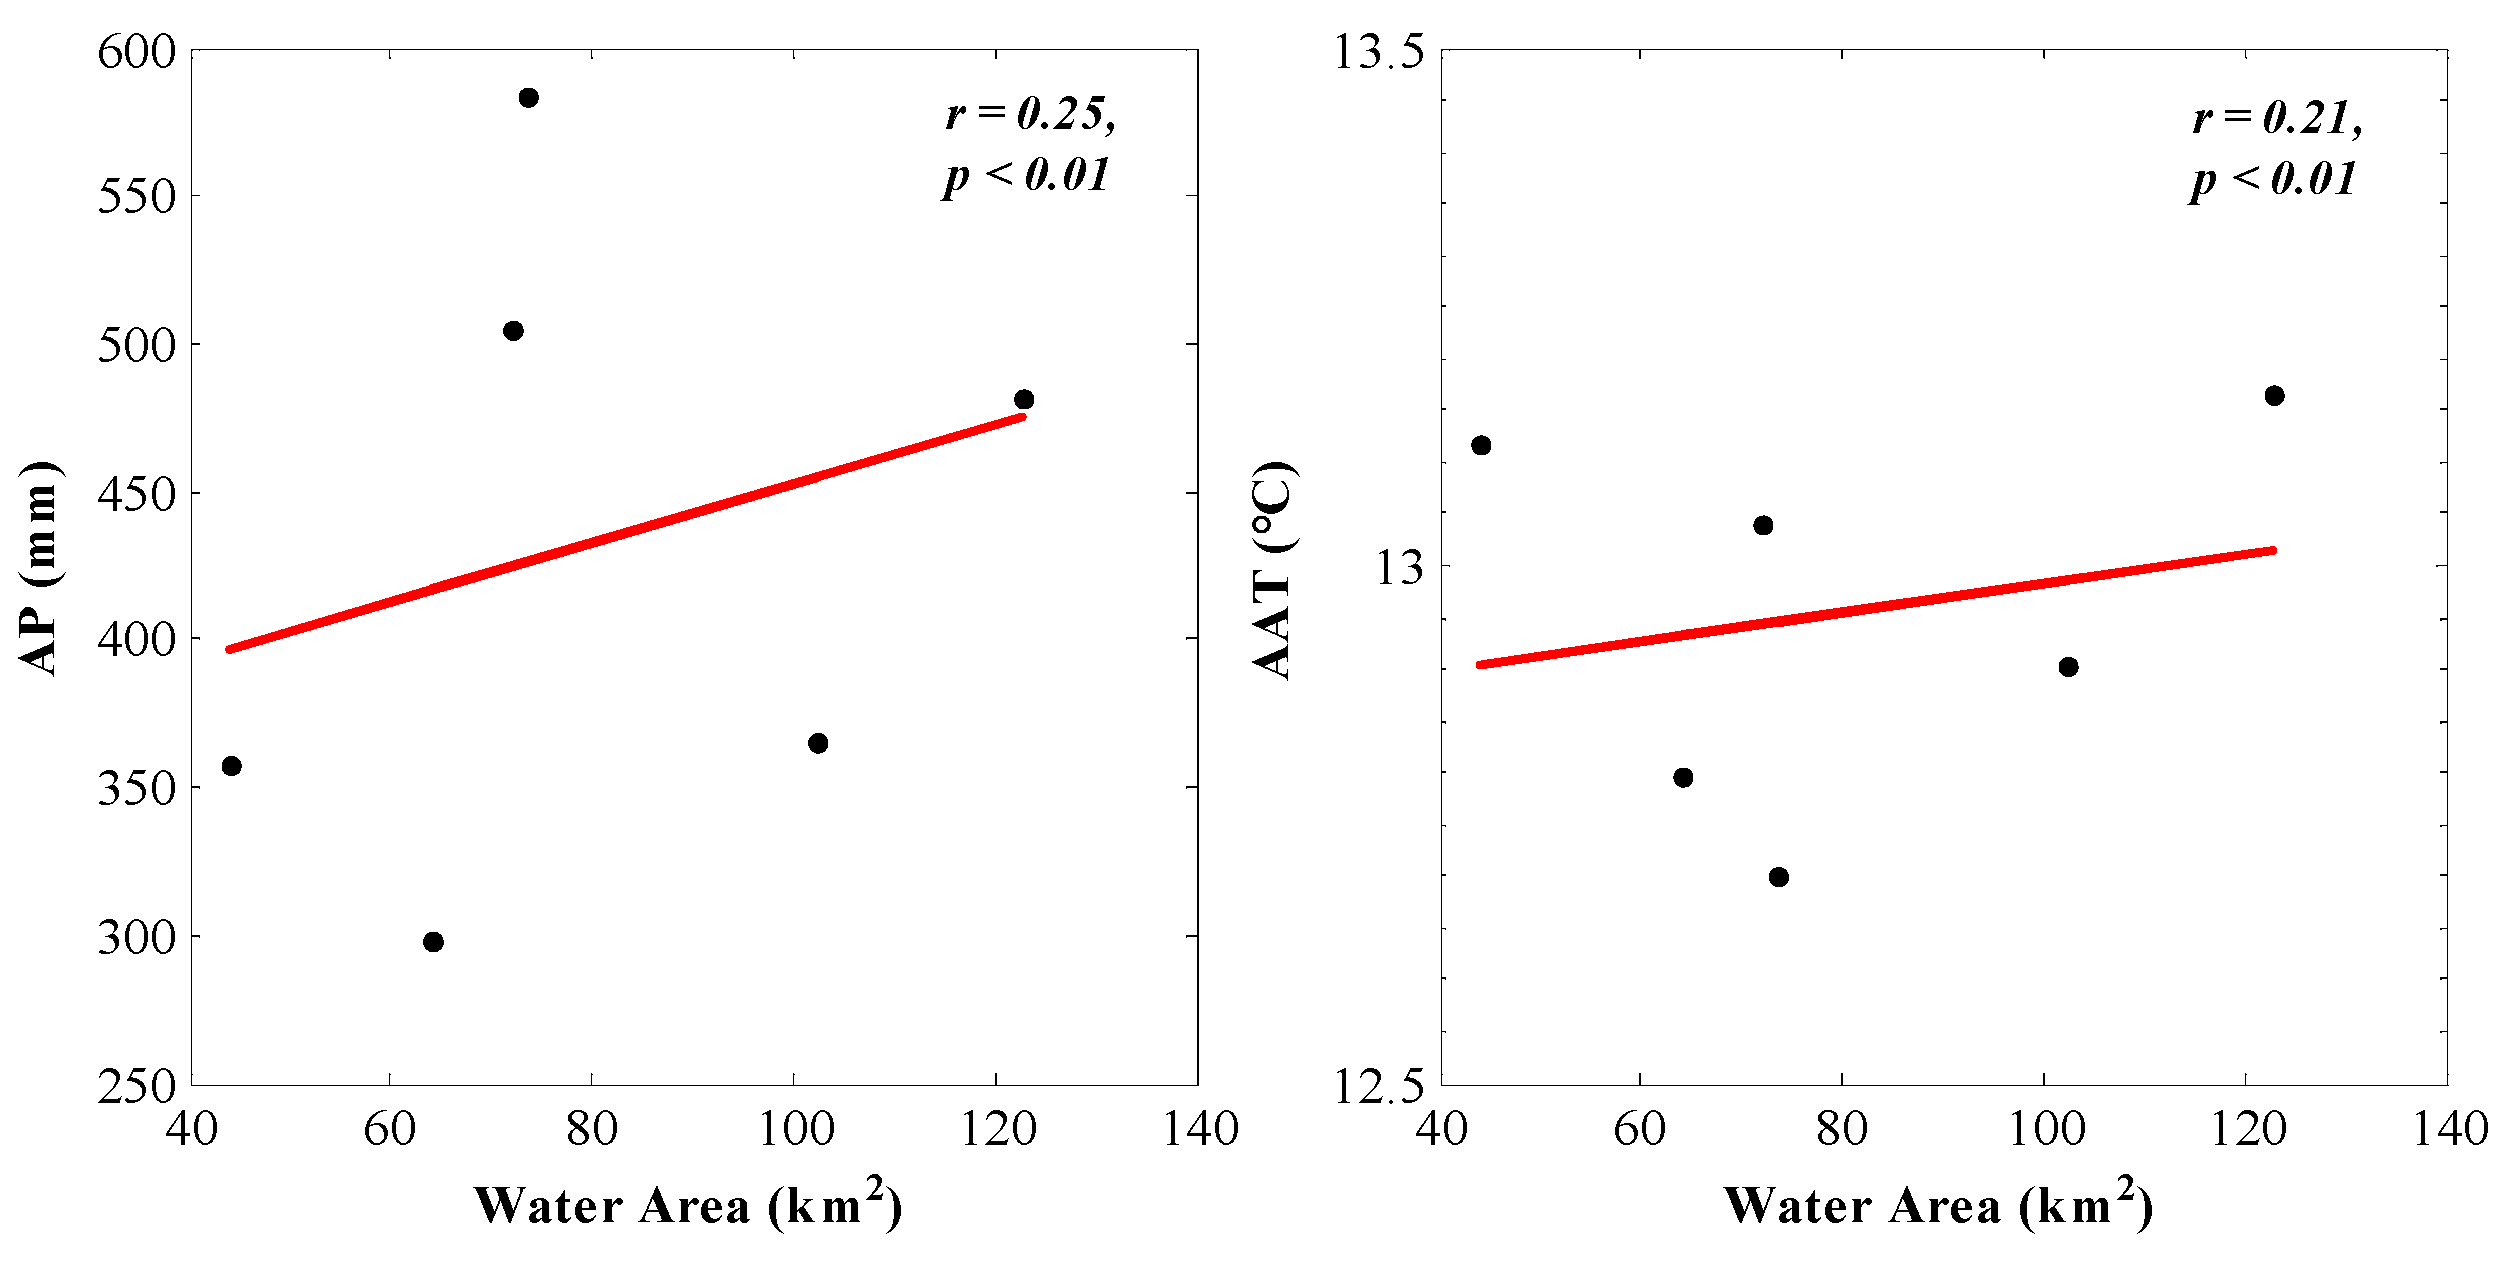
The water area of Baiyangdian Lake did not appear to obviously increase or decrease from 2000 to 2008. We calculated the Pearson correlation coefficients between the water area and AP and AAT. The calculation results show that precipitation has a certain influence on the stability of the water surface area, but temperature does not (Figure 16). To ensure that the water level of Baiyangdian Lake is not lower than the warning value, the government maintains the stability of the water surface area by water diversion. From 2000 to 2008, approximately 0.83 billion m3 of water entered Baiyangdian Lake. After completion of the Conducting Yellow River Water to Baiyangdian Lake Project in 2006, the water diversion to Baiyangdian Lake was mainly from the Yellow River, while previously water came from the surrounding reservoirs.
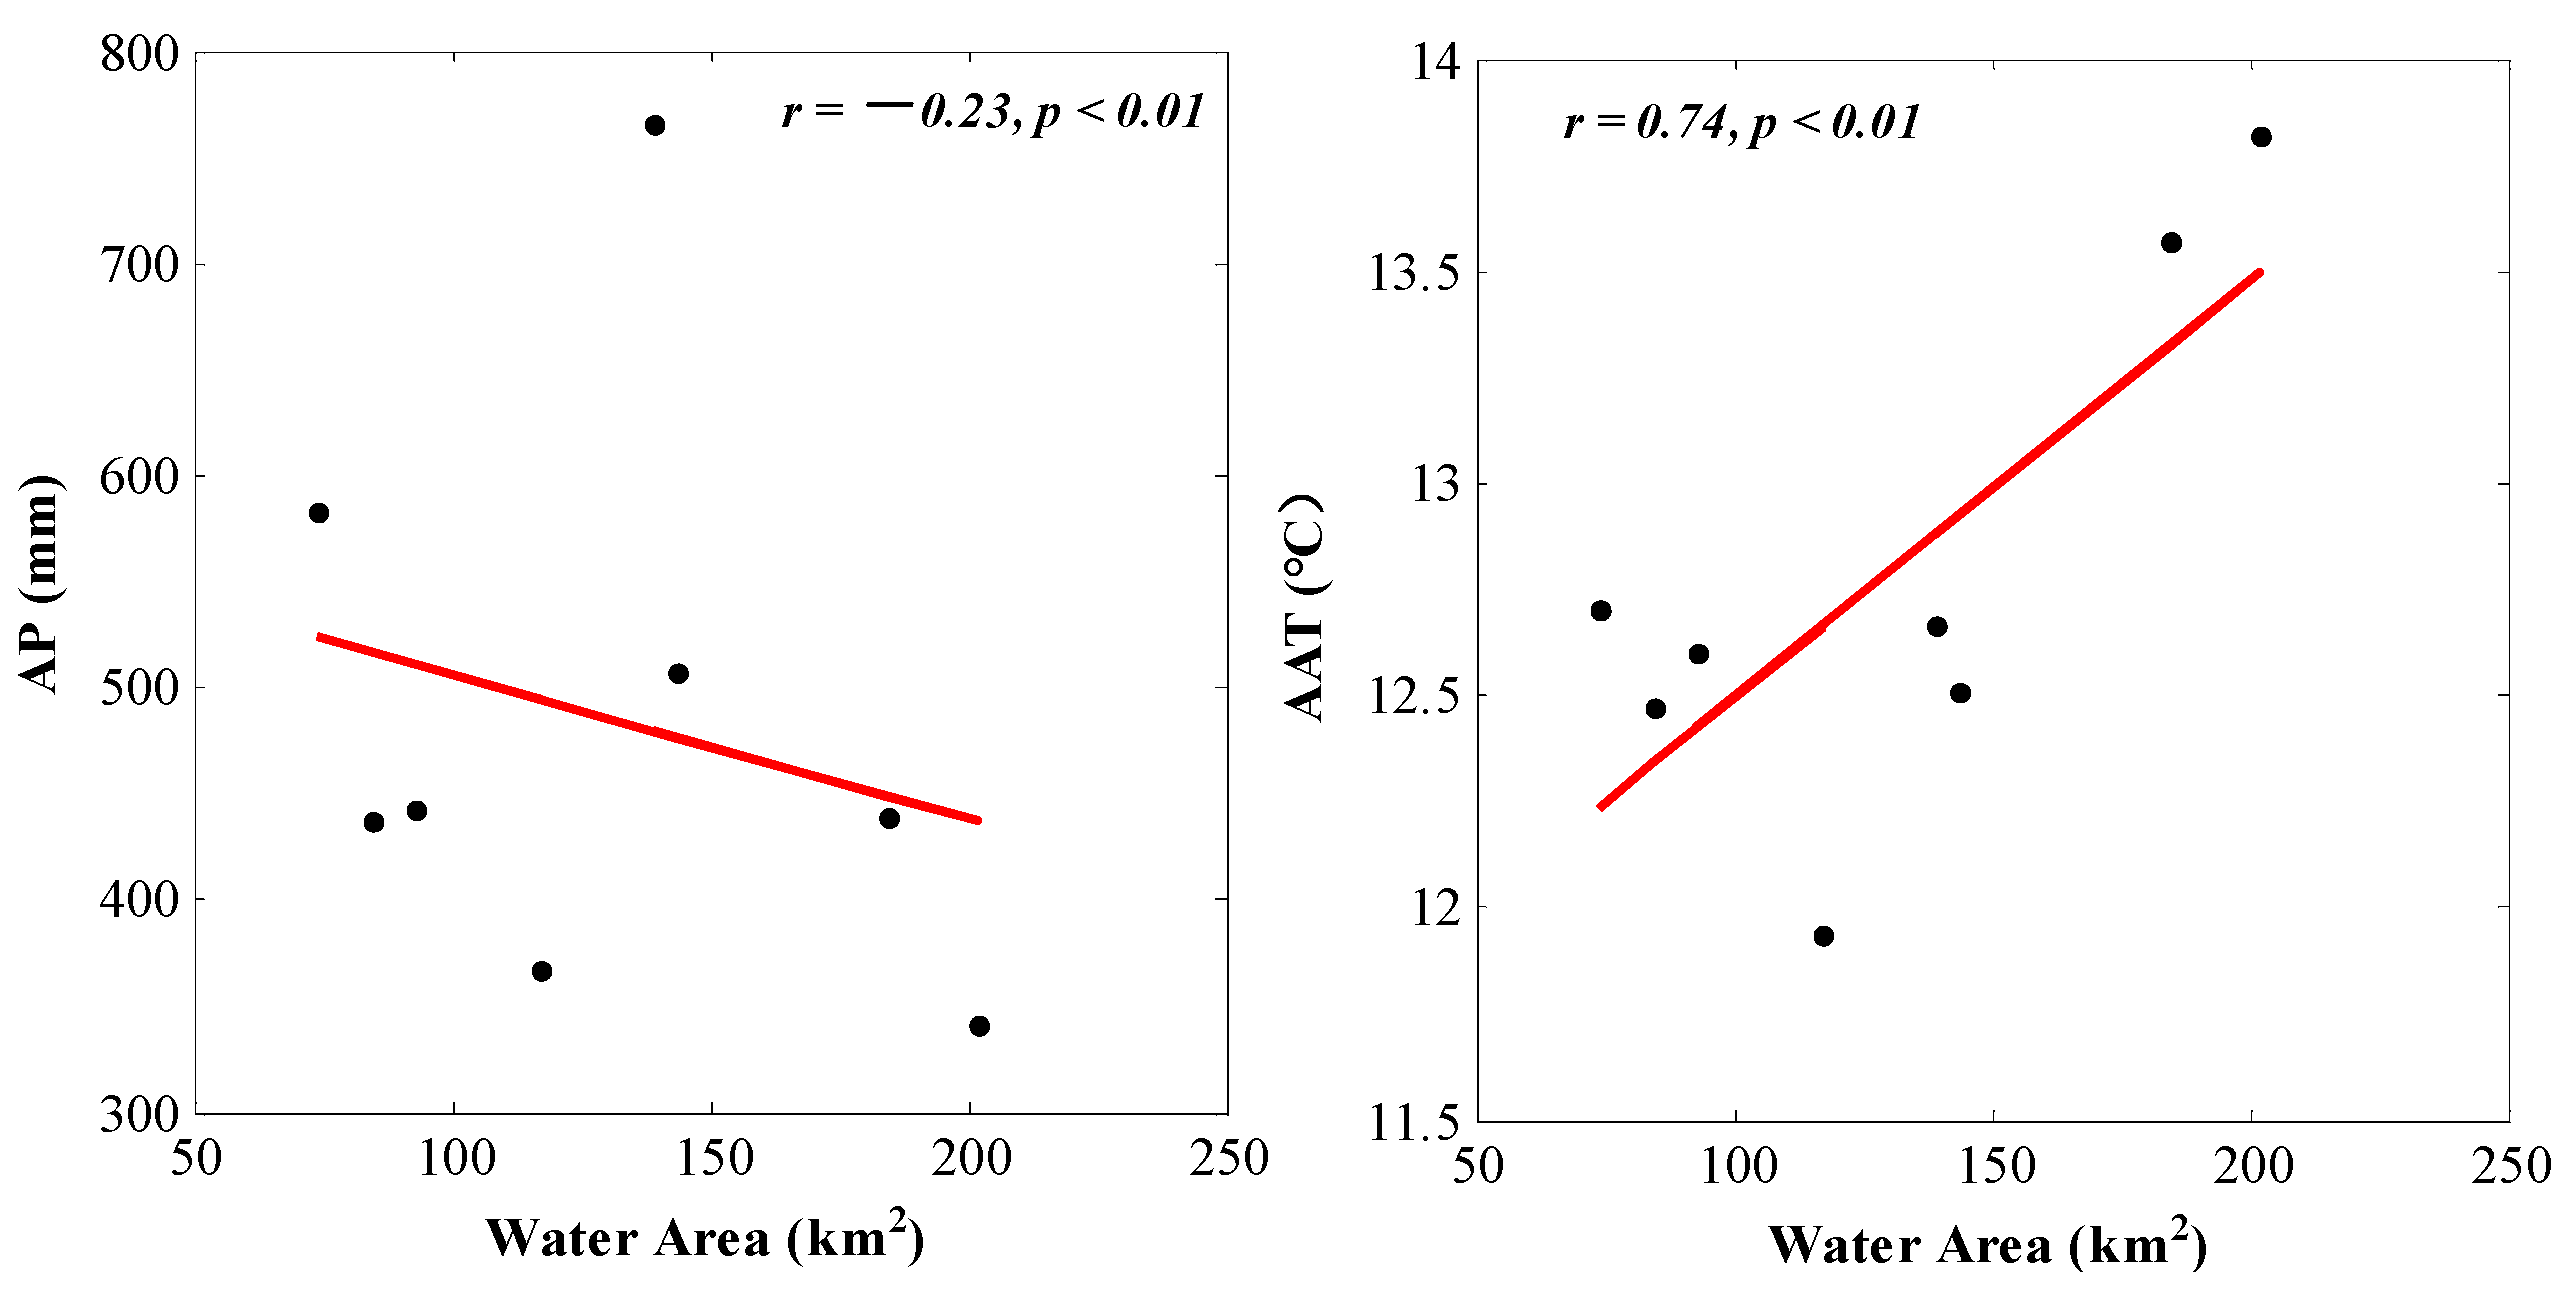
From 2008 to 2018, the water area of Baiyangdian Lake showed an upward trend. We also calculated the Pearson correlation coefficient between the water area and AP and AAT during this period. We were surprised to find that the change in water area is negatively correlated with precipitation and positively correlated with temperature (Figure 17). The increase in the water area has little to do with precipitation and temperature. Therefore, the development of artificial water diversion projects may be the main cause for the increase in water area. The Conducting Yellow River Water to Baiyangdian Lake Project is the main means of supplementing water to Baiyangdian Lake. In addition, the Central Line Project of South-to-North Water Diversion officially passed supplemental water in 2014, and brought much of the ecological water to Baiyangdian Lake. In recent years, a series of policies on ecological protection have been introduced that played a leading role in the restoration of the ecological environment of Baiyangdian Lake. In particular, the government stressed that we must vigorously promote the construction of ecological civilization and reverse the deterioration of the ecological environment in 2012. There was 0.83 billion m3 of water that entered Baiyangdian Lake from 2000–2008, and 0.66 billion m3 of water entered after 2008. However, the mean value of water area from 2000–2008 was 80 km2, and 141 km2 from 2009–2018. This shows that effective policies can greatly contribute to the restoration of the water surface area of Baiyangdian Lake.
3.3.2. Implications of Policies on the Water Surface Area
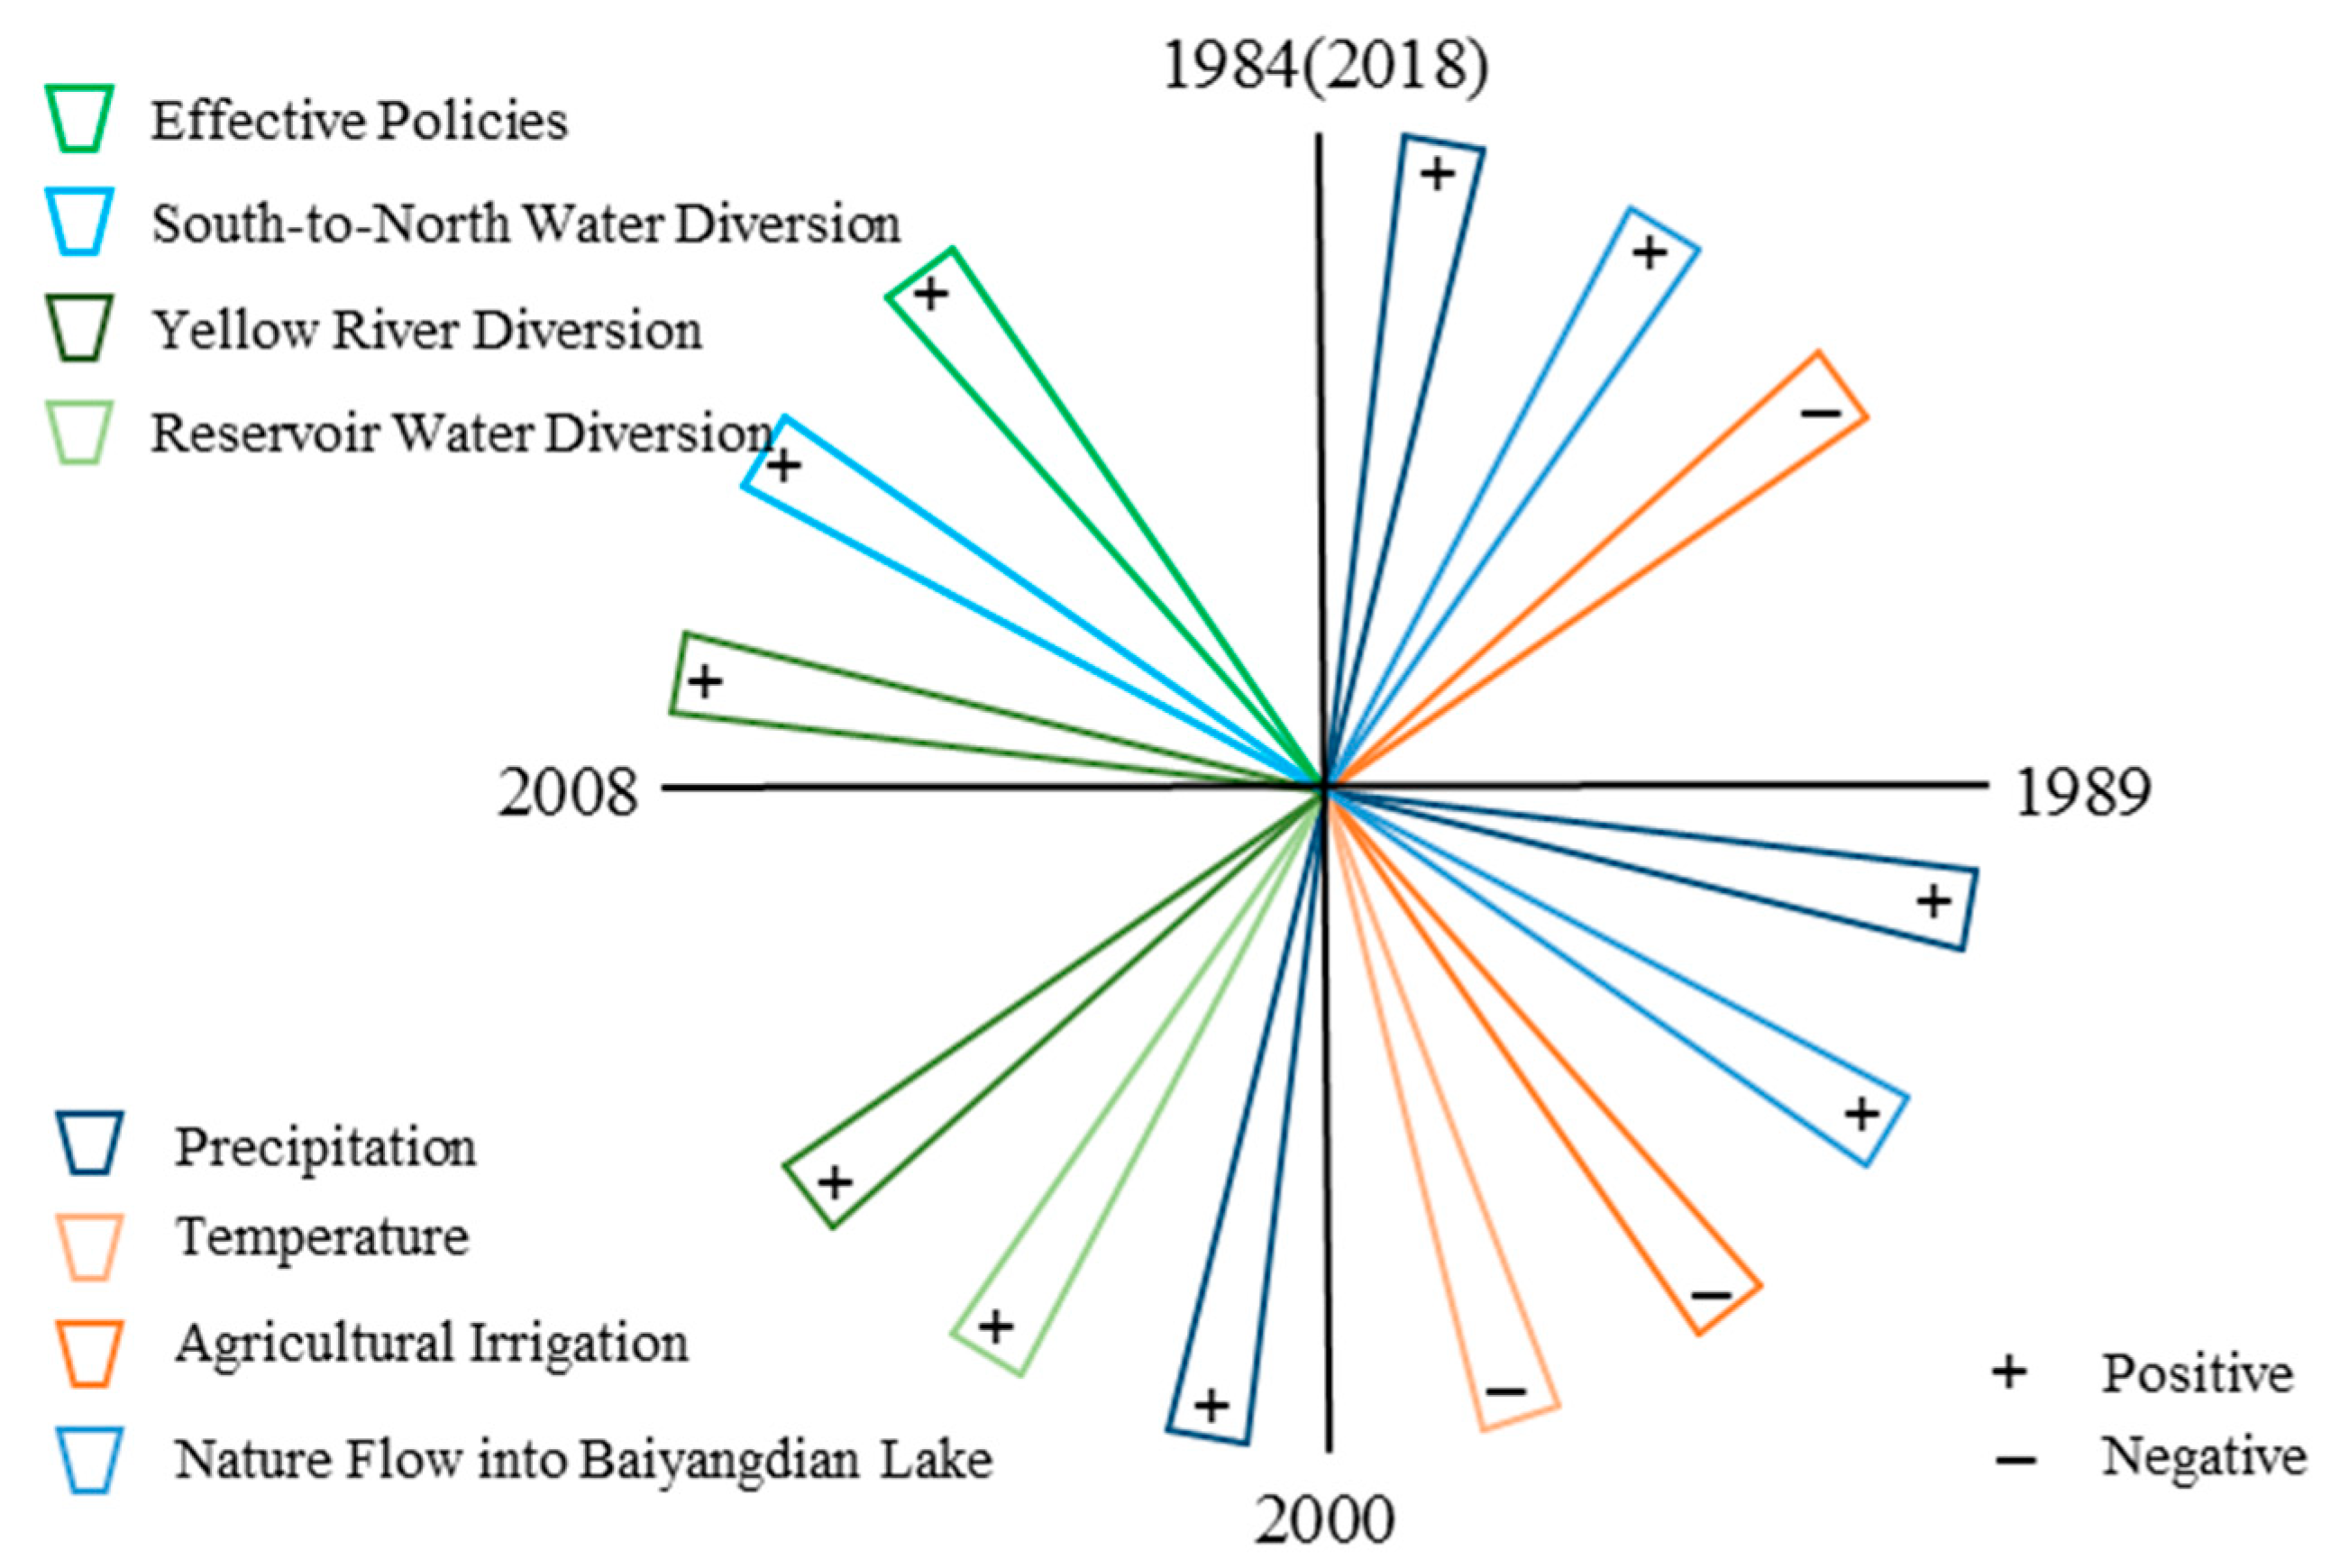
The possible causes for water surface area changes were quite different in four periods (Figure 18). From 1984 to 1988, the reduction of precipitation and natural inflow, and the increase in agricultural irrigation, led to the absence of water in Baiyangdian Lake. Heavy rain in 1988 caused the largest natural inflow and restored the lake to its largest water area during years 1984–1988 (Figure 3). From 1989 to 2000, precipitation, natural inflow, annual average temperature, and agricultural irrigation were possible reasons for the decline in water area during this period. In addition, people’s environmental awareness was relatively weak during this time, and the government did not carry out large-scale projects for water diversion to rescue Baiyangdian Lake. From 2000 to 2008, precipitation, reservoir water diversion, and Yellow River diversion were possible causes ensuring the water surface area remained unchanged, and water diversion was the main cause. However, this maintenance consumes large amounts of manpower and material resources, and is not a long-term solution. From 2008 to 2018, Yellow River diversion, South-to-North Water diversion, and effective policies were the main reasons for the increased water surface area. The future water surface area of Baiyangdian Lake will increase under policy protection, and Gu et al. [26] proposed paying attention to flood prevention in the Baiyangdian area.
4. Discussion
4.1. Comparison with Other Studies in Baiyangdian Lake
Comparing the variation in the water area obtained in this paper with the results of other scholars, we found that the law of change is consistent. The studies by Song et al. [40] and Zhang et al. [22] showed that the water area of Baiyangdian Lake reached its maximum in 1989, and the water area from 1989 to 2000 showed a downward trend. From 2000 to 2008, the water area remained unchanged. After 2008, the water area began to rise. This can further indicate that the results of this study are accurate.
Additionally, a more detailed study of the water surface area changes of Baiyangdian Lake is presented in this paper, and the research content is more substantial. The research of Song et al. [40] on the water surface area change in the Xiong’an New Area divides the water surface area change into four stages according to the size of the water area: The lowest level from 1984–1988, the highest level from 1988–1999, the water area from 1999–2006 was less than 40 km2, and an upward trend from 2007–2016. The research in this paper is divided into four periods according to the water area trend. These periods include the dry lake period of 1984–1988, the declining period of 1989–2000, the constant period of 2000–2008, and the rising period of 2008–2018. In contrast, the phased approach of this paper is more reasonable, and it is easier to explore the reasons for water surface area changes through different period trends. The most important thing is that we divided the water area of Baiyangdian Lake into seven subregions in this paper, and analyzed the variation in each subregion in detail, and the contribution of each subregion to the water area of Baiyangdian Lake.
To date, most researchers [8,40,41] have used the index threshold methods, such as NDWI, for water surface area extractions. In this paper, the SMDPSO method was used to automatically determine the appropriate threshold. This method can avoid the inaccurate extraction result caused by manually selecting the threshold. Moreover, the correlation coefficient between water level and water surface area is 0.96, and most the relative errors of the sample areas are less than 5%.
There are many studies that have highlighted climate change and human activity change as possible causes for the changes of Baiyangdian Lake. Precipitation, temperature, evaporation, and natural inflow were the main analysis factors of climate change. Human activity change also used population and socioeconomic data to be reflected, or only qualitative analysis, due to the lack of direct data [22,38,42]. Moreover, we analyzed the possible causes with four periods separately.
Based on the above analysis, in this study the water surface area extraction accuracy is better, and the water surface area change analysis is more reasonable and detailed.
4.2. Limitations and Prospects
The research in this paper also has certain limitations. The first limitation is that this study does not analyze the seasonal changes in Baiyangdian Lake. The main reason is that the summer water surface cannot be extracted due to vegetation, and the winter water surface extraction is affected by ice and snow. The extraction will not reflect the true seasonality of the water surface. The second limitation is that the analysis of the causes for the change in the water surface of Baiyangdian Lake is not sufficiently deep. There are obvious human activities occurring around and inside Baiyangdian Lake. Moreover, the government has carried out many water diversion projects and human factors have had a great impact on these projects. The complexity of the surrounding environment of Baiyangdian Lake, combined with the common influence of climate and human activities, makes the causal analysis of the water area changes in Baiyangdian Lake very difficult. Our research can only briefly explain the cause of changes in water area through correlation analysis and qualitative analysis.
In future research, determining the cause of the water surface area changes in Baiyangdian Lake is a difficult point. It is important to determine the cause of the decrease in the water surface area. These reasons have an important role in ensuring the ecological environment of Baiyangdian Lake. In addition, remote sensing images from March and April can be used to extract water surface area and avoid the influence of vegetation. In this period, there is no rainy season in northern China, the amount of clouds is small, and the quality of remote sensing images is better.
5. Conclusions
In this paper, the Landsat images from 1984 to 2018 were used to extract the water surface area of Baiyangdian Lake based on the SMDPSO method. The effect of the SMDPSO method on water extraction was verified by visual interpretation and data comparison. The variation law and possible causes of the water surface were also analyzed and discussed. Overall, this study provides the following conclusions:
(1) The SMDPSO method is suitable for the complex water extraction of Baiyangdian Lake. The water extraction results are more accurate in the spring than the other three seasons by accuracy verification, where the relative errors between the observation and the extracted surface area are all less than 5%. The correlation coefficient between water area and water level is 0.96.
(2) The water area of Baiyangdian Lake reached a maximum of 280 km2 in 1989, and reached a minimum of 44 km2 in 2002. The change in the water area of Baiyangdian Lake can be divided into four periods: (1) The dry period in 1984–1988, (2) the degraded period in 1989–2000, (3) the stable period in 2000–2008 and (4) the recovery period in 2008–2018. The water surface area of Baiyangdian Lake is mainly concentrated in the five subregions of B, C, D, E, and F. A and G are the main degraded regions. A recovered after 2014, and G had completely degraded into cultivated land after 1999.
(3) The possible causes for the four periods of changes in Baiyangdian Lake are different. The first period of drought and the second period of degradation was caused by climate and human activities. Due to the strengthening of government management and water supply projects, the maintenance of the third period and the recovery of the fourth period were mainly caused by human activities.
Author Contributions
Conceptualization, W.J. and W.W.; Methodology, X.W. and K.J.; Software, K.J.; Validation, X.W., W.J. and W.W.; Formal Analysis, X.W.; Investigation, X.W.; Resources, W.J.; Data Curation, X.W. and J.L.; Writing-Original Draft Preparation, X.W.; Writing-Review & Editing, W.J. and P.R.; Visualization, X.W.; Supervision, W.J.; Project Administration, W.W.; Funding Acquisition, W.W.
Funding
This work was supported by the National Key Research and Development Program of China (2016YFC0503002), the National Natural Science Foundation of China (41571077), and the State Key Laboratory of Earth Surface Process and Resource Ecology (2017KF08).
Acknowledgments
Appreciation goes to the editors and reviewers for their valuable comments that have helped to improve this paper.
Conflicts of Interest
The authors declare no conflict of interest.
Abbreviations
| SMDPSO | Spectrum Matching based on Discrete Particle Swarm Optimization |
| WL | Water level |
| AP | Annual precipitation |
| AAT | Annual average temperature |
| NI | Natural inflow |
| WDV | Water diversion volume |
| WIF | Water inundation frequency |
References
- Hou, X.; Feng, L.; Duan, H.; Chen, X.; Sun, D.; Shi, K. Fifteen-year monitoring of the turbidity dynamics in large lakes and reservoirs in the middle and lower basin of the Yangtze River, China. Remote Sens. Environ. 2017, 190, 107–121. [Google Scholar] [CrossRef]
- Wang, J.; Sheng, Y.; Tong, T.S.D. Monitoring decadal lake dynamics across the Yangtze Basin downstream of Three Gorges Dam. Remote Sens. Environ. 2014, 152, 251–269. [Google Scholar] [CrossRef]
- Tian, H.; Li, W.; Wu, M.; Huang, N.; Li, G.; Li, X.; Niu, Z. Dynamic monitoring of the largest freshwater lake in China using a new water index derived from high spatiotemporal resolution Sentinel-1A data. Remote Sens. 2017, 9, 521. [Google Scholar] [CrossRef]
- Zhang, Y.; Jeppesen, E.; Liu, X.; Qin, B.; Shi, K.; Zhou, Y.; Thomaz, S.M.; Deng, J. Global loss of aquatic vegetation in lakes. Earth Sci. Rev. 2017, 173, 259–265. [Google Scholar] [CrossRef]
- Feng, L.; Hu, C.; Chen, X.; Cai, X.; Tian, L.; Gan, W. Assessment of inundation changes of Poyang Lake using MODIS observations between 2000 and 2010. Remote Sens. Environ. 2012, 121, 80–92. [Google Scholar] [CrossRef]
- Tan, C.; Ma, M.; Kuang, H. Spatial-temporal characteristics and climatic responses of water level fluctuations of global major lakes from 2002 to 2010. Remote Sens. 2017, 9, 150. [Google Scholar] [CrossRef]
- Satgé, F.; Espinoza, R.; Zolá, R.; Roig, H.; Timouk, F.; Molina, J.; Garnier, J.; Calmant, S.; Seyler, F.; Bonnet, M.-P. Role of climate variability and human activity on Poopó lake droughts between 1990 and 2015 assessed using remote sensing data. Remote Sens. 2017, 9, 218. [Google Scholar] [CrossRef]
- Tao, S.; Fang, J.; Zhao, X.; Zhao, S.; Shen, H.; Hu, H.; Tang, Z.; Wang, Z.; Guo, Q. Rapid loss of lakes on the Mongolian Plateau. Proc. Natl. Acad. Sci. USA 2015, 112, 2281–2286. [Google Scholar] [CrossRef] [PubMed] [Green Version]
- Schaffer-Smith, D.; Swenson, J.J.; Barbaree, B.; Reiter, M.E. Three decades of Landsat-derived spring surface water dynamics in an agricultural wetland mosaic; Implications for migratory shorebirds. Remote Sens. Environ. 2017, 193, 180–192. [Google Scholar] [CrossRef] [PubMed] [Green Version]
- Tulbure, M.G.; Broich, M.; Stehman, S.V.; Kommareddy, A. Surface water extent dynamics from three decades of seasonally continuous Landsat time series at subcontinental scale in a semi-arid region. Remote Sens. Environ. 2016, 178, 142–157. [Google Scholar] [CrossRef]
- Han, X.; Chen, X.; Feng, L. Four decades of winter wetland changes in Poyang Lake based on Landsat observations between 1973 and 2013. Remote Sens. Environ. 2015, 156, 426–437. [Google Scholar] [CrossRef]
- Donchyts, G.; Baart, F.; Winsemius, H.; Gorelick, N.; Kwadijk, J.; van de Giesen, N. Earth’s surface water change over the past 30 years. Nat. Clim. Chang. 2016, 6, 810–813. [Google Scholar] [CrossRef]
- Li, H.; Gao, Y.; Li, Y.; Yan, S.; Xu, Y. Dynamic of Dalinor lakes in the inner Mongolian Plateau and its driving factors during 1976–2015. Water 2017, 9, 749. [Google Scholar] [CrossRef]
- Pekel, J.-F.; Cottam, A.; Gorelick, N.; Belward, A.S. High-resolution mapping of global surface water and its long-term changes. Nature 2016, 540, 418–422. [Google Scholar] [CrossRef] [PubMed]
- Yang, K.; Yao, F.; Wang, J.; Luo, J.; Shen, Z.; Wang, C.; Song, C. Recent dynamics of alpine lakes on the endorheic Changtang Plateau from multi-mission satellite data. J. Hydrol. 2017, 552, 633–645. [Google Scholar] [CrossRef]
- Jia, K.; Jiang, W.; Li, J.; Tang, Z. Spectral matching based on discrete particle swarm optimization: A new method for terrestrial water body extraction using multi-temporal Landsat 8 images. Remote Sens. Environ. 2018, 209, 1–18. [Google Scholar] [CrossRef]
- Wang, H.; Qin, F. Summary of the research on water body extraction and application from remote sensing image. Sci. Surv. Mapp. 2018, 43, 23–32. [Google Scholar]
- Deng, Y.; Jiang, W.; Tang, Z.; Li, J.; Lv, J.; Chen, Z.; Jia, K. Spatio-temporal change of lake water extent in Wuhan urban agglomeration based on landsat images from 1987 to 2015. Remote Sens. 2017, 9, 270. [Google Scholar] [CrossRef]
- Mueller, N.; Lewis, A.; Roberts, D.; Ring, S.; Melrose, R.; Sixsmith, J.; Lymburner, L.; McIntyre, A.; Tan, P.; Curnow, S.; et al. Water observations from space: Mapping surface water from 25 years of landsat imagery across Australia. Remote Sens. Environ. 2016, 174, 341–352. [Google Scholar] [CrossRef]
- Rao, P.; Jiang, W.; Hou, Y.; Chen, Z.; Jia, K. Dynamic change analysis of surface water in the Yangtze River Basin based on MODIS products. Remote Sens. 2018, 10, 1025. [Google Scholar] [CrossRef]
- Pekel, J.-F.; Vancutsem, C.; Bastin, L.; Clerici, M.; Vanbogaert, E.; Bartholomé, E.; Defourny, P. A near real-time water surface detection method based on HSV transformation of MODIS multi-spectral time series data. Remote Sens. Environ. 2014, 140, 704–716. [Google Scholar] [CrossRef] [Green Version]
- Zhang, M.; Gong, Z.; Zhao, W.; Duo, A. Lanscape pattern change and the driving in Baiyangdian Wetland from 1984–2014. Acta Ecol. Sin. 2016, 36, 4780–4791. [Google Scholar]
- Gao, Y.; Wang, H.; Long, D. Changes in hydrological conditions and the eco-environmental problems in Baiyangdian Watershed. Resour. Sci. 2009, 31, 1506–1513. [Google Scholar]
- Li, Y.; Cui, B.; Yang, Z. Influence of hydrological characteristic change of Baiyangdian on the ecological environment in wetland. J. Nat. Resour. 2004, 19, 62–68. [Google Scholar]
- Liu, K.; Zhang, L.; Zhang, G.; Liu, J.; Yan, M. The impact of human activities on runoff in Baiyangdian Basin in North China. J. China Hydrol. 2007, 27, 6–10. [Google Scholar]
- Gong, R. Water change in Baiyangdian Lake and affecting factors. Geogr. Territ. Res. 1993, 9, 36–40. [Google Scholar]
- Bai, D.; Ning, Z. An elementary analysis to Baiyangdian dried-up. China Flood Drought Manag. 2007, 2, 46–48. [Google Scholar]
- Cui, B.; Han, Z.; Li, X.; Lan, Y.; Bai, J.; Cai, Y. Driving Mechanisms and Regulating Measures for Lake Terrestrialization: A Case of Lake Baiyangdian; Science Press: Beijing, China, 2017. [Google Scholar]
- Wang, B.; Liu, J.; Zhang, T.; Chen, Q. Spatial and temporal changes of landscape patches in Baiyangdian Wetlands, China. J. Agro-Environ. Sci. 2010, 29, 1857–1867. [Google Scholar]
- Wang, T.; Cui, B.; Liu, P.; Lan, Y.; Han, Z.; Zhang, Y. Effect of floating plants on distributions of emergent and submerged plants in Baiyangdian Lake. Wetl. Sci. 2013, 11, 266–270. [Google Scholar]
- Li, C.; Zheng, X.; Zhao, F.; Wang, X.; Cai, Y.; Zhang, N. Effects of urban non-point source pollution from Baoding City on Baiyangdian Lake, China. Water 2017, 9, 249. [Google Scholar] [CrossRef]
- Su, L.; Liu, J.; Christensen, P. Spatial distribution and ecological risk assessment of metals in sediments of Baiyangdian wetland ecosystem. Ecotoxicology 2011, 20, 1107–1116. [Google Scholar] [CrossRef] [PubMed]
- Zhao, Y.; Zhang, X.; Ma, D. Baiyangdian functional area division principle. Environ. Sci. 1995, S1, 40–41. [Google Scholar]
- Li, L.; Xu, T.; Chen, Y. Improved urban flooding mapping from remote sensing images using generalized regression neural network-based super-resolution algorithm. Remote Sens. 2016, 8, 625. [Google Scholar] [CrossRef]
- Chen, Z.; Jiang, W.; Wang, W.; Deng, Y.; He, B.; Jia, K. The impact of precipitation deficit and urbanization on variations in water storage in the Beijing-Tianjin-Hebei Urban Agglomeration. Remote Sens. 2017, 10, 4. [Google Scholar] [CrossRef]
- Wu, M.; Peng, H.; Fan, S.; Wu, D. Distribution characteristics of regional air quality in the Pearl River Delta. Environ. Sci. Technol. 2015, 38, 77–82. [Google Scholar]
- Qiu, L. Analysis of the causes and countermeasures of drying up of Baiyangdian wetland. Water Sci. Eng. Technol. 2017, 4, 38–41. [Google Scholar]
- Liu, C.; Xie, G.; Huang, H. Shrinking and drying up of Baiyangdian Lake wetland: A natural or human cause? Chin. Geogr. Sci. 2006, 16, 314–319. [Google Scholar] [CrossRef]
- Zhuang, C.; Ouyang, Z.; Xu, W.; Bai, Y. Landscape dynamics of Baiyangdian Lake from 1974 to 2007. Acta Ecol. Sin. 2011, 31, 839–848. [Google Scholar]
- Song, C.; Ke, L.; Pan, H.; Zhan, S.; Liu, K.; Ma, R. Long-term surface water changes and driving cause in Xiong’an, China: From dense Landsat time series images and synthetic analysis. Sci. Bull. 2018, 63, 708–716. [Google Scholar] [CrossRef]
- Zhu, J.; Zhang, Q.; Tong, Z. Impact analysis of lakefront land use changes on lake area in Wuhan, China. Water 2015, 7, 4869–4886. [Google Scholar] [CrossRef]
- Hu, S.; Liu, C.; Zheng, H.; Wang, Z.; Yu, J. Assessing the impacts of climate variability and human activities on streamflow in the water source area of Baiyangdian Lake. J. Geogr. Sci. 2012, 22, 895–905. [Google Scholar] [CrossRef]
Figure 1.
Location of the study area (the remote sensing image of Baiyangdian Lake is displaced by false color images and using bands 7, 5 and 3).
Figure 1.
Location of the study area (the remote sensing image of Baiyangdian Lake is displaced by false color images and using bands 7, 5 and 3).

Figure 2.
Temporal distribution of Landsat images used in this study.

Figure 3.
Hydrological and climate data used in this study.

Figure 4.
Steps of extracting the water surface area using the SMDPSO method.

Figure 5.
Seasonal verification of SMDPSO with selected data and sample areas. D1, C1, and E1 were the sample areas of 1990, 2001, and 2017, respectively. All images were displaced by false color images (bands 6, 4, and 2 for 1990 and 2001; and bands 7, 5, and 3 for 2017).
Figure 5.
Seasonal verification of SMDPSO with selected data and sample areas. D1, C1, and E1 were the sample areas of 1990, 2001, and 2017, respectively. All images were displaced by false color images (bands 6, 4, and 2 for 1990 and 2001; and bands 7, 5, and 3 for 2017).

Figure 6.
Comparison of water extraction results and original images for all four seasons in 1990. Extracted water surface in the (a) spring, (b) summer, (c) fall, and (d) winter of 1990. False color images (bands: 6, 4, and 2) of (e) spring, (f) summer, (g) fall, and (h) winter in 1990.
Figure 6.
Comparison of water extraction results and original images for all four seasons in 1990. Extracted water surface in the (a) spring, (b) summer, (c) fall, and (d) winter of 1990. False color images (bands: 6, 4, and 2) of (e) spring, (f) summer, (g) fall, and (h) winter in 1990.

Figure 7.
Comparison of water extraction results and original images for all four seasons in 2001. Extracted water surface in the (a) spring, (b) summer, (c) fall, and (d) winter of 2001. False color images (bands: 6, 4, and 2) of (e) spring, (f) summer, (g) fall, and (h) winter in 2001.
Figure 7.
Comparison of water extraction results and original images for all four seasons in 2001. Extracted water surface in the (a) spring, (b) summer, (c) fall, and (d) winter of 2001. False color images (bands: 6, 4, and 2) of (e) spring, (f) summer, (g) fall, and (h) winter in 2001.

Figure 8.
Comparison of water extraction results and original images for all four seasons in 2017. Extracted water surface in the (a) spring, (b) summer, (c) fall, and (d) winter of 2017. False color images (bands: 7, 5 and 3) of (e) spring, (f) summer, (g) fall, and (h) winter in 2017.
Figure 8.
Comparison of water extraction results and original images for all four seasons in 2017. Extracted water surface in the (a) spring, (b) summer, (c) fall, and (d) winter of 2017. False color images (bands: 7, 5 and 3) of (e) spring, (f) summer, (g) fall, and (h) winter in 2017.

Figure 9.
The relative error between the extracted water area and the actual water area.

Figure 10.
The relationship between the Baiyangdian Lake water area and water level.

Figure 11.
Water area changes in Baiyangdian Lake and 7 subregions from 1984 to 2018.

Figure 12.
Spatial variations in water area from 1984 to 2018 in Baiyangdian Lake.

Figure 13.
Water Inundation Frequency (WIF) map of Baiyangdian Lake.

Figure 14.
Each subregion as a percentage of the total area. For reference, the percentage of A refers to the water area of a divided by the water area of the entire Baiyangdian Lake in 1989.
Figure 14.
Each subregion as a percentage of the total area. For reference, the percentage of A refers to the water area of a divided by the water area of the entire Baiyangdian Lake in 1989.

Figure 15.
The Pearson correlation coefficient between water area and annual average temperature (AAT), annual precipitation (AP), and natural inflow (NI) from 1989–2000.
Figure 15.
The Pearson correlation coefficient between water area and annual average temperature (AAT), annual precipitation (AP), and natural inflow (NI) from 1989–2000.

Figure 16.
The Pearson correlation coefficient between water area and AAT and AP from 2000–2008.

Figure 17.
The Pearson correlation coefficient between water area and AAT and AP from 2008–2018.

Figure 18.
The possible causes for the change in water area in Baiyangdian Lake during the four periods. + indicates that this factor is positively correlated with the change in water area, and − indicates that the factor is negatively correlated with the change in water area.
Figure 18.
The possible causes for the change in water area in Baiyangdian Lake during the four periods. + indicates that this factor is positively correlated with the change in water area, and − indicates that the factor is negatively correlated with the change in water area.

© 2018 by the authors. Licensee MDPI, Basel, Switzerland. This article is an open access article distributed under the terms and conditions of the Creative Commons Attribution (CC BY) license (http://creativecommons.org/licenses/by/4.0/).
Share and Cite
MDPI and ACS Style
Wang, X.; Wang, W.; Jiang, W.; Jia, K.; Rao, P.; Lv, J. Analysis of the Dynamic Changes of the Baiyangdian Lake Surface Based on a Complex Water Extraction Method. Water 2018, 10, 1616. https://doi.org/10.3390/w10111616
AMA Style
Wang X, Wang W, Jiang W, Jia K, Rao P, Lv J. Analysis of the Dynamic Changes of the Baiyangdian Lake Surface Based on a Complex Water Extraction Method. Water. 2018; 10(11):1616. https://doi.org/10.3390/w10111616
Chicago/Turabian StyleWang, Xiaoya, Wenjie Wang, Weiguo Jiang, Kai Jia, Pinzeng Rao, and Jinxia Lv. 2018. "Analysis of the Dynamic Changes of the Baiyangdian Lake Surface Based on a Complex Water Extraction Method" Water 10, no. 11: 1616. https://doi.org/10.3390/w10111616
Note that from the first issue of 2016, this journal uses article numbers instead of page numbers. See further details here.