Article

Application of Multiple Approaches to Investigate the Hydrochemistry Evolution of Groundwater in an Arid Region: Nomhon, Northwestern China

1
State Key Laboratory of Biogeology and Environmental Geology & MOE Key Laboratory of Groundwater Circulation and Environment Evolution, China University of Geosciences (Beijing), Beijing 100083, China
2
School of Water Resources & Environment, China University of Geosciences (Beijing), Beijing 100083, China
*
Author to whom correspondence should be addressed.
Water 2018, 10(11), 1667; https://doi.org/10.3390/w10111667
Submission received: 20 August 2018 / Revised: 23 October 2018 / Accepted: 3 November 2018 / Published: 16 November 2018
(This article belongs to the Special Issue Groundwater Resources Assessment: Quantity and Quality)

Abstract

:
Groundwater is a critical water resource for human survival and economic development in arid and semi-arid areas. It is crucial to understand the groundwater circulation and hydrochemical evolution for sustainable management and utilization of groundwater resources in those areas. To this end, an investigation of the hydrochemical characteristics of surface water and groundwater was conducted in Nomhon, an arid area located in the Qaidam Basin, northwest China, by using hydrochemical (major and trace elements) and stable isotopes (δD and δ18O) approaches. Stable isotopes and ion ratios were analyzed to determine the recharge sources, hydrochemistry characteristics, and major hydrogeochemical processes. Meanwhile, inverse geochemistry modeling was applied to quantitatively determine the mass transfer of hydrogeochemical processes. The results showed that groundwater in the study area is mainly recharged by atmospheric precipitation in mountainous areas, and the groundwater in the center of basin might originate from ancient water in cold and humid environments. Along the groundwater flow path, the TDS of groundwater increased gradually from fresh to salty (ranging from 462.50 to 19,604.40 mg/L), and the hydrochemical type changed from Cl·HCO3–Na·Mg·Ca to Cl–Na. Groundwater chemical composition and mass balance modeling results indicated that from alluvial fan to lacustrine plain, the main hydrogeochemical processes changed from the dissolution of halite and albite and the precipitation of dolomite and kaolinite to the dissolution of halite and gypsum, precipitation of calcite, redox (SO42− reduction), and cation exchange. This study would be helpful for water resources management in this area and other similar areas.

1. Introduction

Groundwater is an important water resource to agricultural irrigation, industry, and domestic water supplies in arid and semi-arid areas. Understanding the origin, conversion, and evolution of groundwater is critical to ensure sustainable use of this valuable water resource. It is of great significance to investigate the geochemistry evolution of groundwater in order to help understand the hydrogeology conditions and support groundwater sustainability. Hydrogeochemical processes (mineral dissolution or precipitation, ion exchange, and redox) have important effects on the spatiotemporal distribution of groundwater chemistry [1,2,3], and different hydrogeochemical processes may occur in different hydrogeologic locations in natural systems [4]. Diversification of groundwater chemical compositions is mainly induced by the interactions between groundwater and aquifer minerals [5]. Groundwater chemistry compositions can be applied to infer the main water–rock interactions in hydrogeochemical evolution [6], which reveal the hydrogeochemical evolution, potential recharge source, and groundwater cycle [7], in addition to providing better cognition of groundwater quality and a foundation for the rational development and utilization of water resources [8,9,10,11,12].
Graphic methods and inverse geochemistry modeling are often used to determine geochemical evolution and hydrogeochemical processes which control groundwater chemistry compositions; combining the two methods could promote cognition of groundwater chemical evolution and dynamic changes in hydrogeological systems [13,14,15]. Inverse geochemical modeling is frequently applied to establish a hydrogeochemical evolution model for determining chemical reactions controlling groundwater chemistry and to quantitatively calculate mineral mass transfer from one site to another site on the same flow path [5,16]. Many studies have constructed inverse geochemical models to study groundwater chemical characteristics and determine dominant hydrogeochemical reactions that control groundwater chemical evolution [17,18,19,20,21].
As a closed and arid inland basin with abundant natural resources, Qaidam Basin has the characteristics of scarce rainfall and strong evaporation, and groundwater is a critical resource for human survival and economic development. In recent years, due to increased human activities, water shortage has been becoming an increasing concern for sustainable development in the Qaidam Basin. Many studies have identified groundwater hydrochemical characteristics, evolution, and groundwater circulation in the Qaidam area via different technical methods [22,23,24,25,26]. The present study area, the Nomhon area, is an important agricultural area of the Qaidam Basin. With the coverage of farmland and woodland being up to 15% of the total area, the region’s groundwater has become the lifeblood of nature, society, and the economy. In recent years, groundwater chemistry and isotopes (D, 18O, 3H, 14C) data were used to conduct preliminary research on groundwater recharge sources, hydrochemistry evolution, and groundwater circulation in the Nomhon area [25,26,27,28,29]. Previous studies emphasized the basic characteristics of groundwater qualitatively, lacking quantitative descriptions on chemistry variation and hydrogeochemical reactions along the flow path.
This study combines ion ratio diagrams (major elements, trace elements), hydrogeochemical diagrams (such as the Piper diagram), mineral mass equilibrium calculations, stable isotopes (D and 18O), and an inverse geochemical simulation (NETPATH) to achieve the following objectives: (1) determine the hydrochemical characteristics of the study area; (2) describe the groundwater chemical evolution along the flow path; and (3) give a quantitative explanation of hydrogeochemical processes controlling the groundwater chemical evolution.

2. Materials and Methods

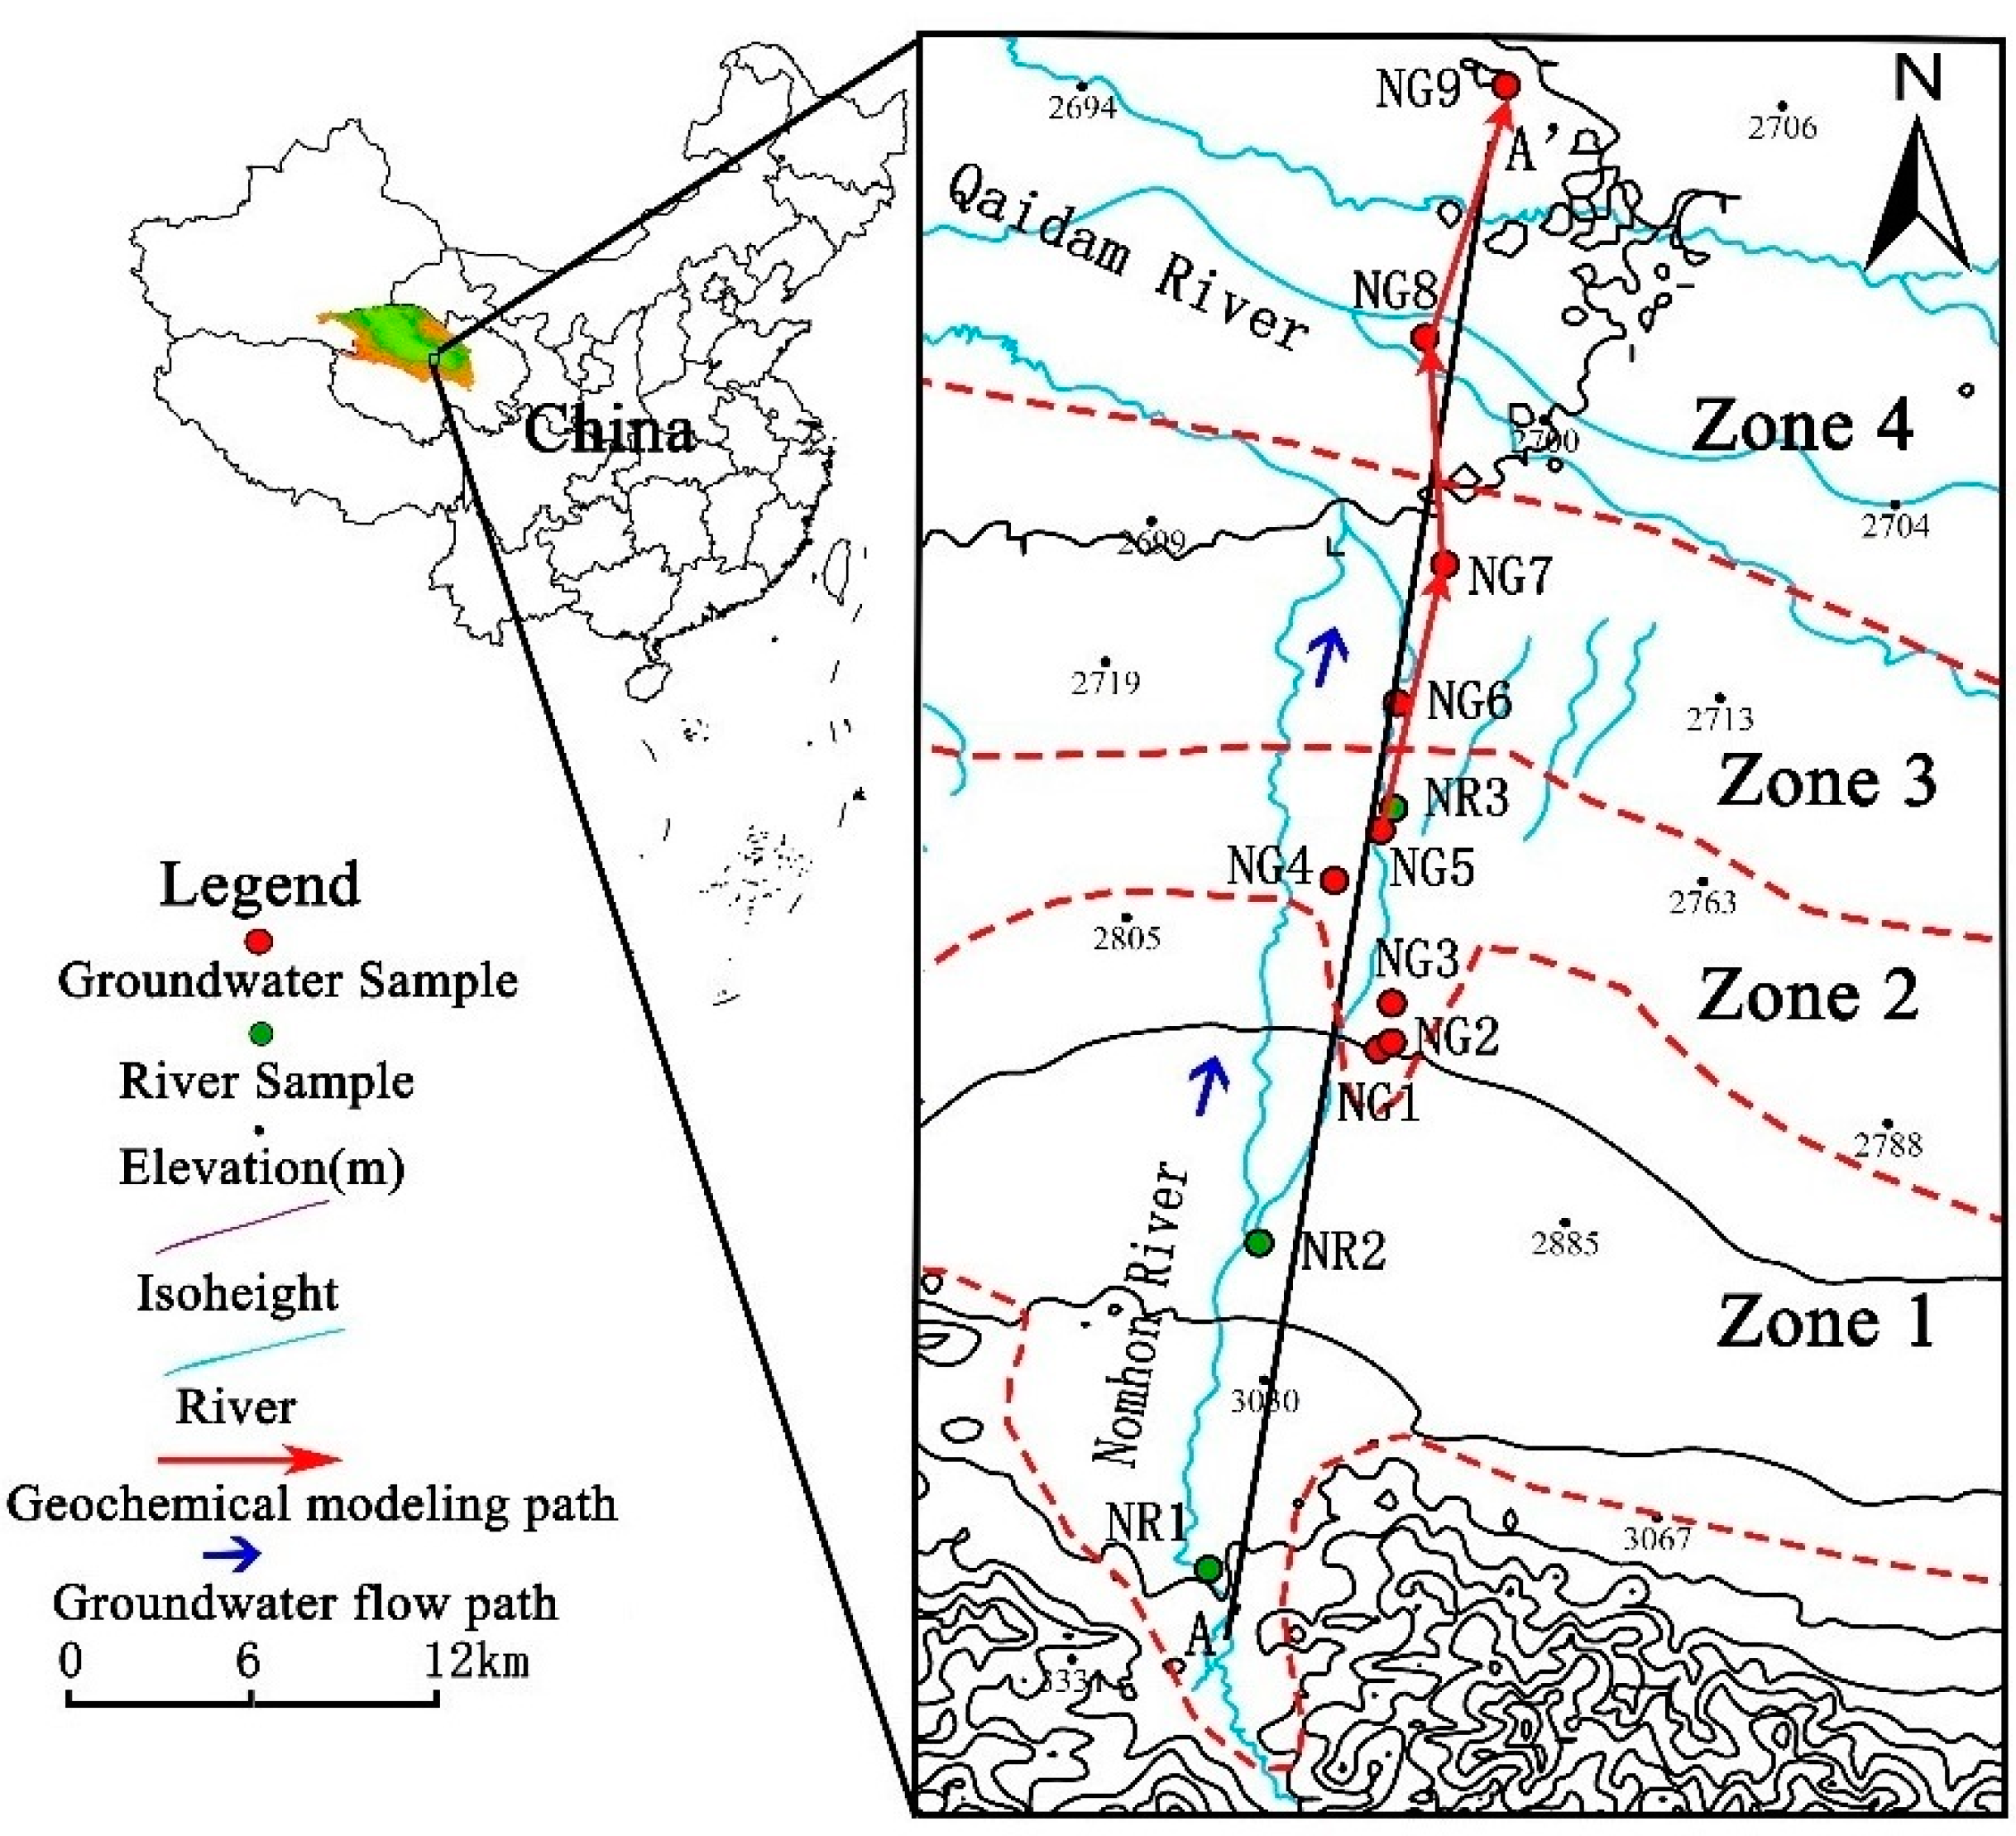
2.1. Outline of Study Area

The study area (Nomhon area) is situated in southeastern Qaidam Basin and north of the Kunlun Mountains (36.04–36.90° N, 96.26–96.75° E) (Figure 1). The main river in this area is Nomhon River, the sixth largest river in Qaidam Basin, which is a principal source for domestic water and agricultural irrigation. It originates from the southern Burhanbukda Mountain and flows from south to north, then turns to west at the north of Nomhon Farm, and finally discharges into Huobuxun Terminal Lake. In the basin center are Qaidam River and Suringol River. Numerous streams intersect each other and form a petal-like watershed (Figure 1).
The study area belongs to an extremely arid climate in the middle temperate zone of the plateau, and the annual average air temperature is 4.8 °C with a gradual increase from the southern mountains to the northern basin center. Precipitation is scarce, and there is strong evaporation. The annual average evaporation is 1468.04 mm·y−1, and the annual average precipitation is only about 40.0 mm·y−1. However, the average annual precipitation in Burhanbuda Mountain reaches more than 300 mm.

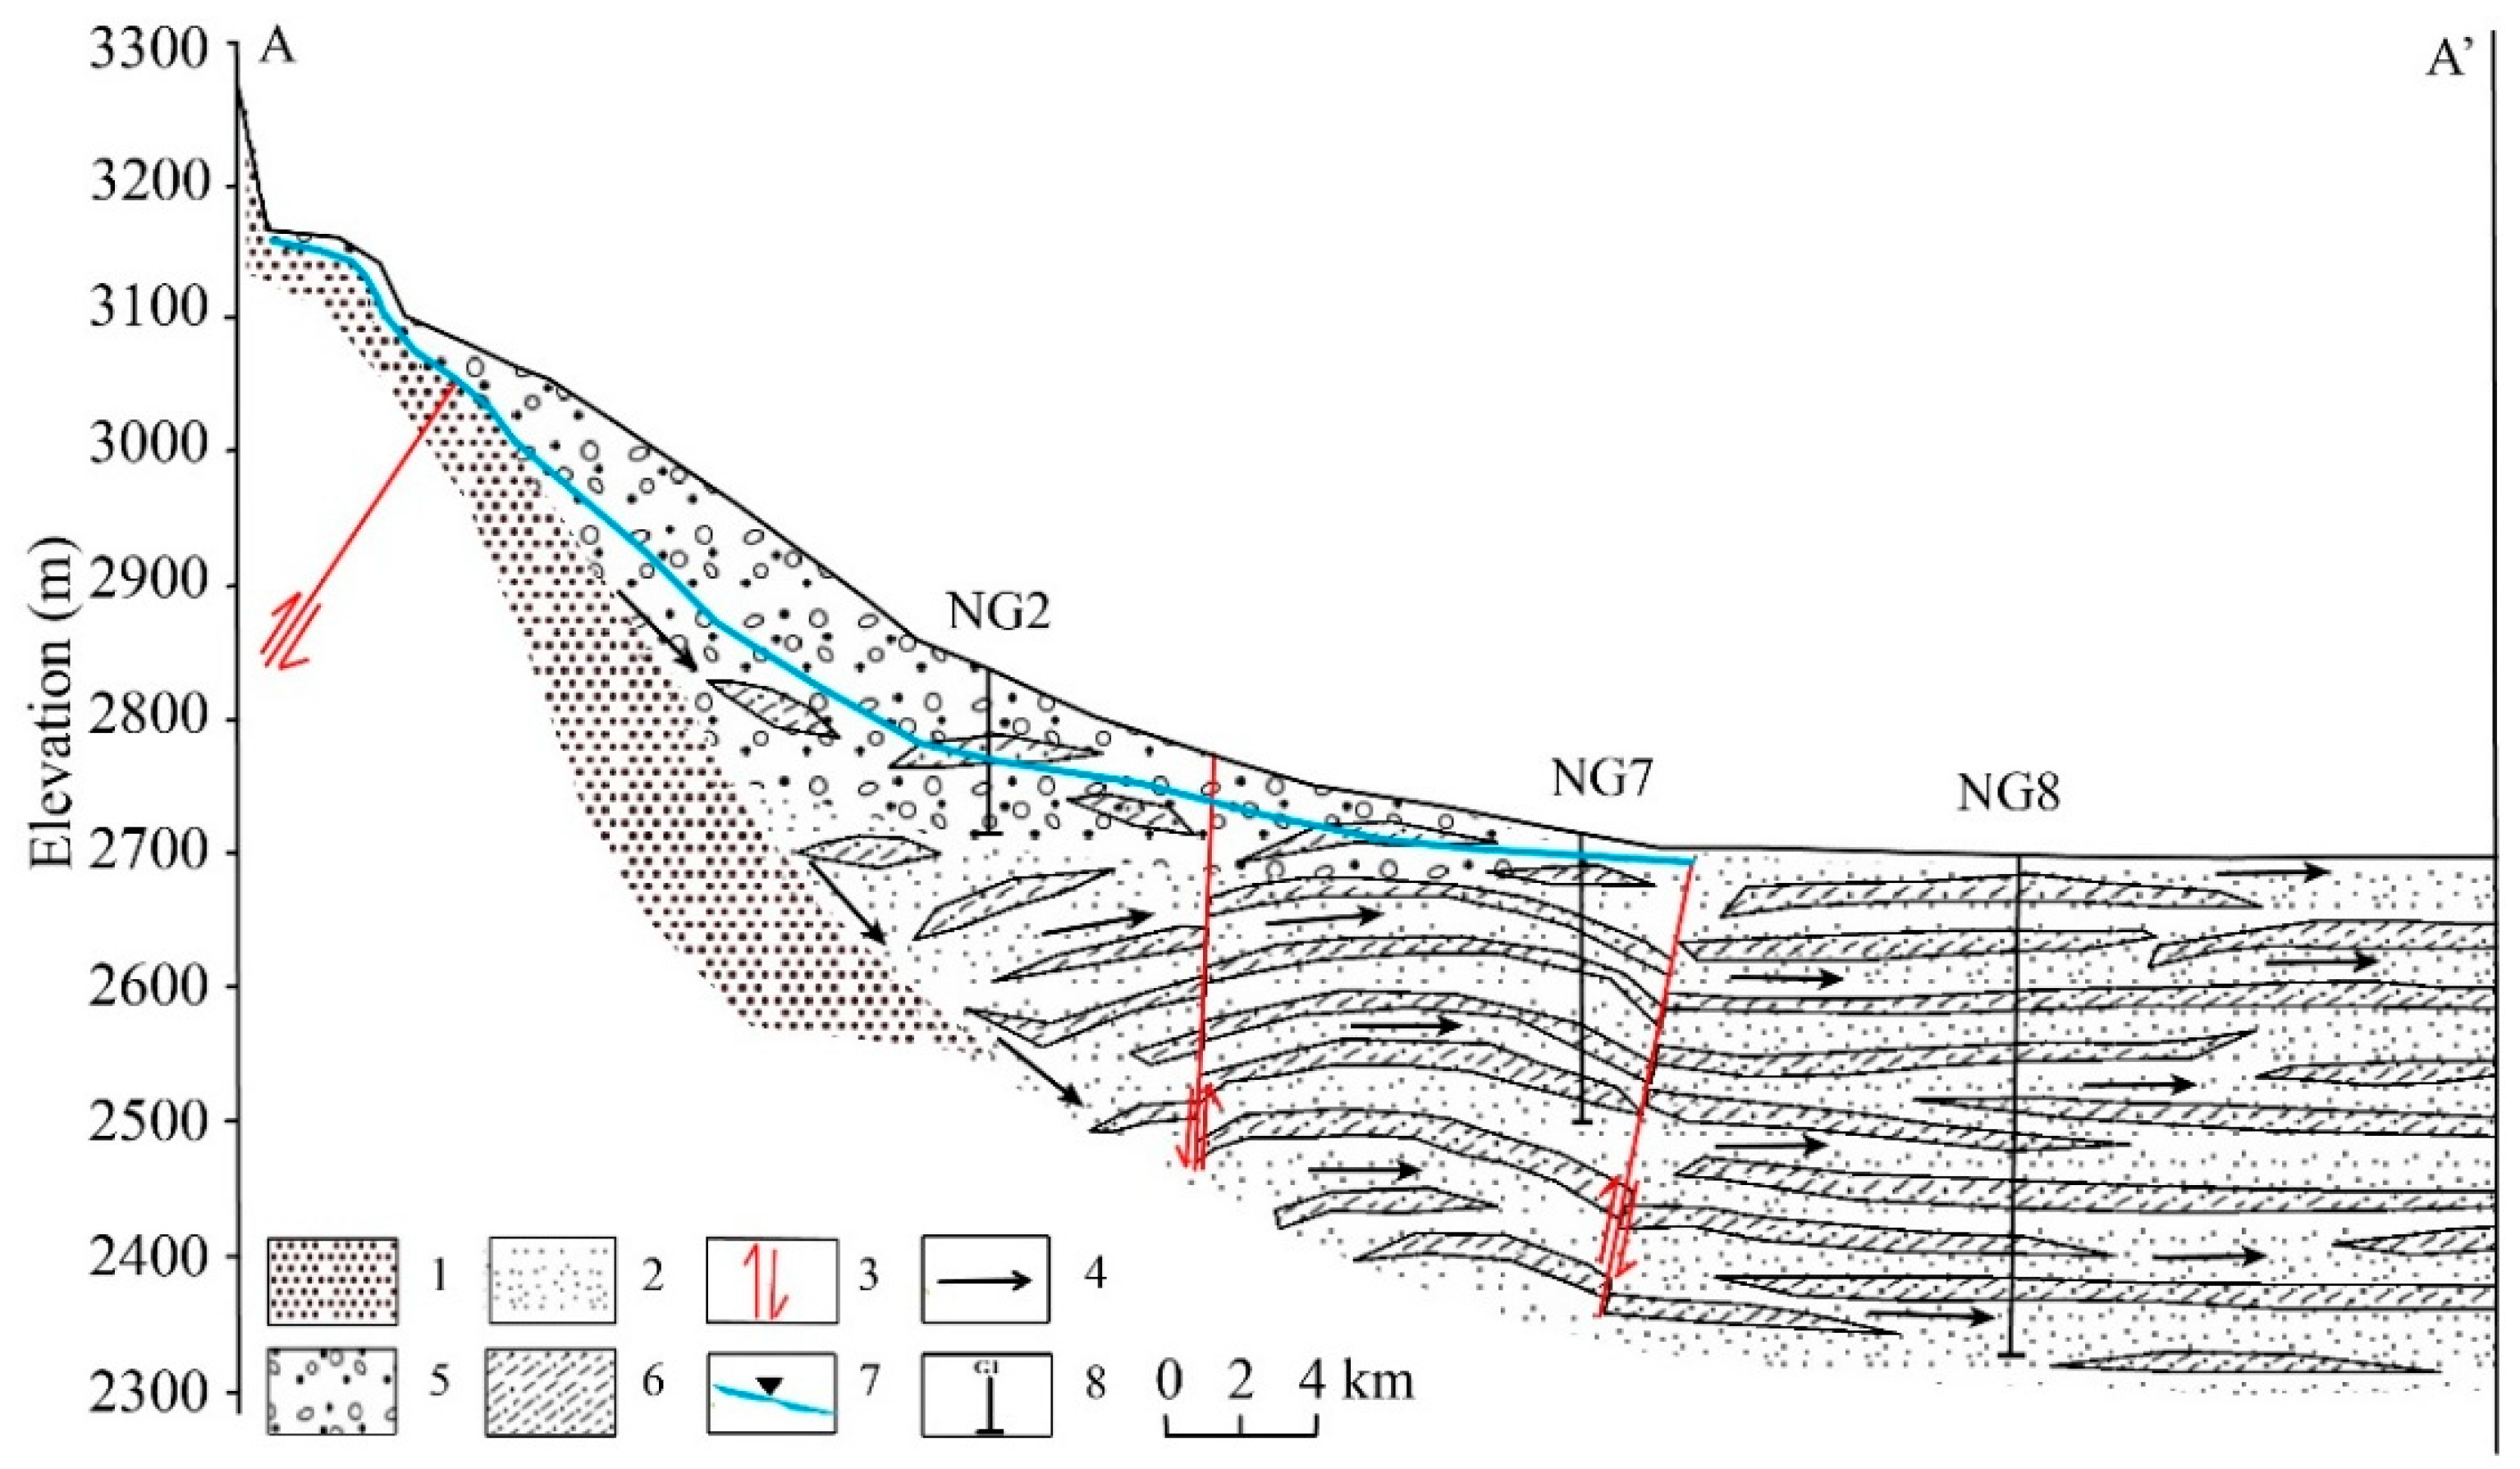
2.2. Geological and Hydrogeological Settings

In the study area, the Quaternary strata are continuous and characterized by wide distribution area, large thickness, and complex genesis. From bottom to top, the strata are in the following order: Early Pleistocene (Qp1), Middle Pleistocene (Qp2), Late Pleistocene (Qp3), and Holocene (Qh). All of these are exposed in the research region. The topography of the research area is from piedmont alluvial fan through alluvial–lacustrine plain to lacustrine plain. In the study area, there are two faults and an arc-shaped uplift structure (Figure 2). The upper part of the southern arc-shaped uplift structure is alluvial–pluvial sediment of the upper Pleistocene with coarse grains, large thickness, loose structure, and rich water yield property; the lower part is the mid-Pleistocene ice-water stratum with high mud content and low water yield property. The stratum of the northern arc-shaped uplift structure is the alluvial–lacustrine sediment of Holocene to Middle Pleistocene, and the lithology is dominated by slit with a clay interlayer; the water yield property is poor. The arc-shaped uplift structure is a water-blocking structure composed of alluvial–lacustrine strata of the Lower Pleistocene, and the lithology primarily comprises cohesive soil, fine sand, and medium coarse sand.
In the piedmont alluvial–pluvial plain, a single large-thickness phreatic aquifer formed with a thickness of more than 100 m with rich groundwater, and the groundwater flow velocity is relatively high. The hydraulic gradient is about 5–10‰. The type of aquifer in the alluvial–lacustrine plain was changed from a single thick-layer aquifer to a multilayer aquifer with a 1–2‰ hydraulic gradient, and the water yield property and permeability became poor. The groundwater flow velocity is low and the water level rises relatively as shallow groundwater flows out of ground surface in the form of groups of springs. In the salt marsh area, the aquifers are multilayer confined ones and contain high-salinity groundwater. The thickness of a single layer varies from 2–3 m to tens of meters. In the study area, the groundwater is mainly recharged by precipitation and melted water from the southern mountain area and discharged by human pumping, evaporation, springs, and recharging rivers and lakes. The groundwater flows north at first, then turns to west in the basin center, and is finally discharged into Huobuxun Terminal Lake.
On the basis of terrain, sediment characteristics, and groundwater flow, the study region can be divided into four zones (Figure 1). Zone 1 is the Gobi Belt, where a single phreatic aquifer was distributed with relatively high permeability and deep water–level. Zone 2 is the fine soil plain area, which is the transitional area from a single aquifer to a multilayer aquifer, and the depth of the groundwater level becomes small; Zone 3 is a slightly inclined fine soil plain, and shallow groundwater overflows onto the surface; Zone 4 is a salt marsh area where multilayer aquifers are confined with saline groundwater.

2.3. Sampling and Analytical Method

For this research, 12 samples (3 river samples and 9 groundwater samples) were collected in August and September 2017 (Figure 1). The river samples mainly came from the Nomhon River, and the groundwater samples were taken in wells from the piedmont alluvial fan to the lacustrine plain. All water samples were collected after the field parameters were stable to eliminate the influence of stagnant water, and were filtered with a 0.45 μm polyethylene membrane filter after rinsing the sample bottles 3–4 times. Water samples for cations were acidified with concentrated nitric acid to make the pH < 2 and reserved in 500 mL polyethylene bottles. The samples were reserved in 500 mL bottles for anion analysis and in 50 mL bottles for stable isotope (δ18O and δD) analysis. All water samples were marked, sealed, and stored, and then sent to the laboratory for analysis as soon as possible after collection.
The hydrochemical data are listed in Table 1. The relative hydrochemical and isotopic compositions of all samples were measured (Na+, K+, Ca2+, Mg2+, Cl, HCO3, SO42−, Br, Sr2+, Si, Al3+, δ18O, and δD) using standard methods at the Water Environment Monitoring Experiment Center of Hebei Province. Some parameters (pH, temperature, EC, TDS) were tested in situ using a portable multiparameter instrument (Manta 2) adjusted with a standard solution. Major elements (Na+, K+, Ca2+, Mg2+, Sr2+, Si, and Al3+) were measured by ICP–OES, major anions (Cl, SO42−, and Br) were tested for using ion chromatography (ICS-1100), and CO32− and HCO3 were tested for using acid–base titration. The test accuracy for cations and anions (except HCO3) was 0.01 mg/L, and the accuracy of HCO3 was 0.60 mg/L. The charge balance errors of all samples were less than 5%.
The stable isotopes (δ18O and δD) were tested using LGR-LWIA-24d (liquid-water isotope analyzer). The test data are expressed with respect to standard VSMOW (Vienna Standard Mean Ocean Water) in permil (‰) [30]. The analytical precisions of δD and δ18O were 0.28‰ and 0.03‰, respectively, and tests were repeated to ensure the accuracy of the data.

2.4. Inverse Geochemistry Modeling

Inverse geochemical modeling is one of the most popular simulation methods and has been widely put into use in various groundwater studies, such as establishing hydrogeochemical evolution models to determine chemical reactions that control groundwater chemistry, and quantitatively calculating mineral mass transfer from one point to another point on the same flow path [5,16,20]. NETPATH is a useful inverse geochemistry modeling software product coupling a speciation calculation model with a geochemical mass balance model to determine possible reactions based on constraints (dissolved elements) and phases (dissolved/precipitated minerals). The technology builds a geochemical reaction model to determine the net geochemical mass balance reactions that occur between two points along the flow direction [31,32]. NETPATH is often used to quantitatively determine hydrogeochemical evolution [15,33,34,35].
The mass balance conceptual model can be represented as follows [36]:
j = 1 n a i j x j = b j .
Here, aij is the atomic figure of element i in mineral j, xj is the molar figure of minerals or gases that dissolve or precipitate (degas) in solution, and bj expresses the augment of element i from one site to another site. If the values are greater than 1, this indicates that minerals or gas dissolve; otherwise, precipitation or outgassing occurs.

3. Results and Discussion

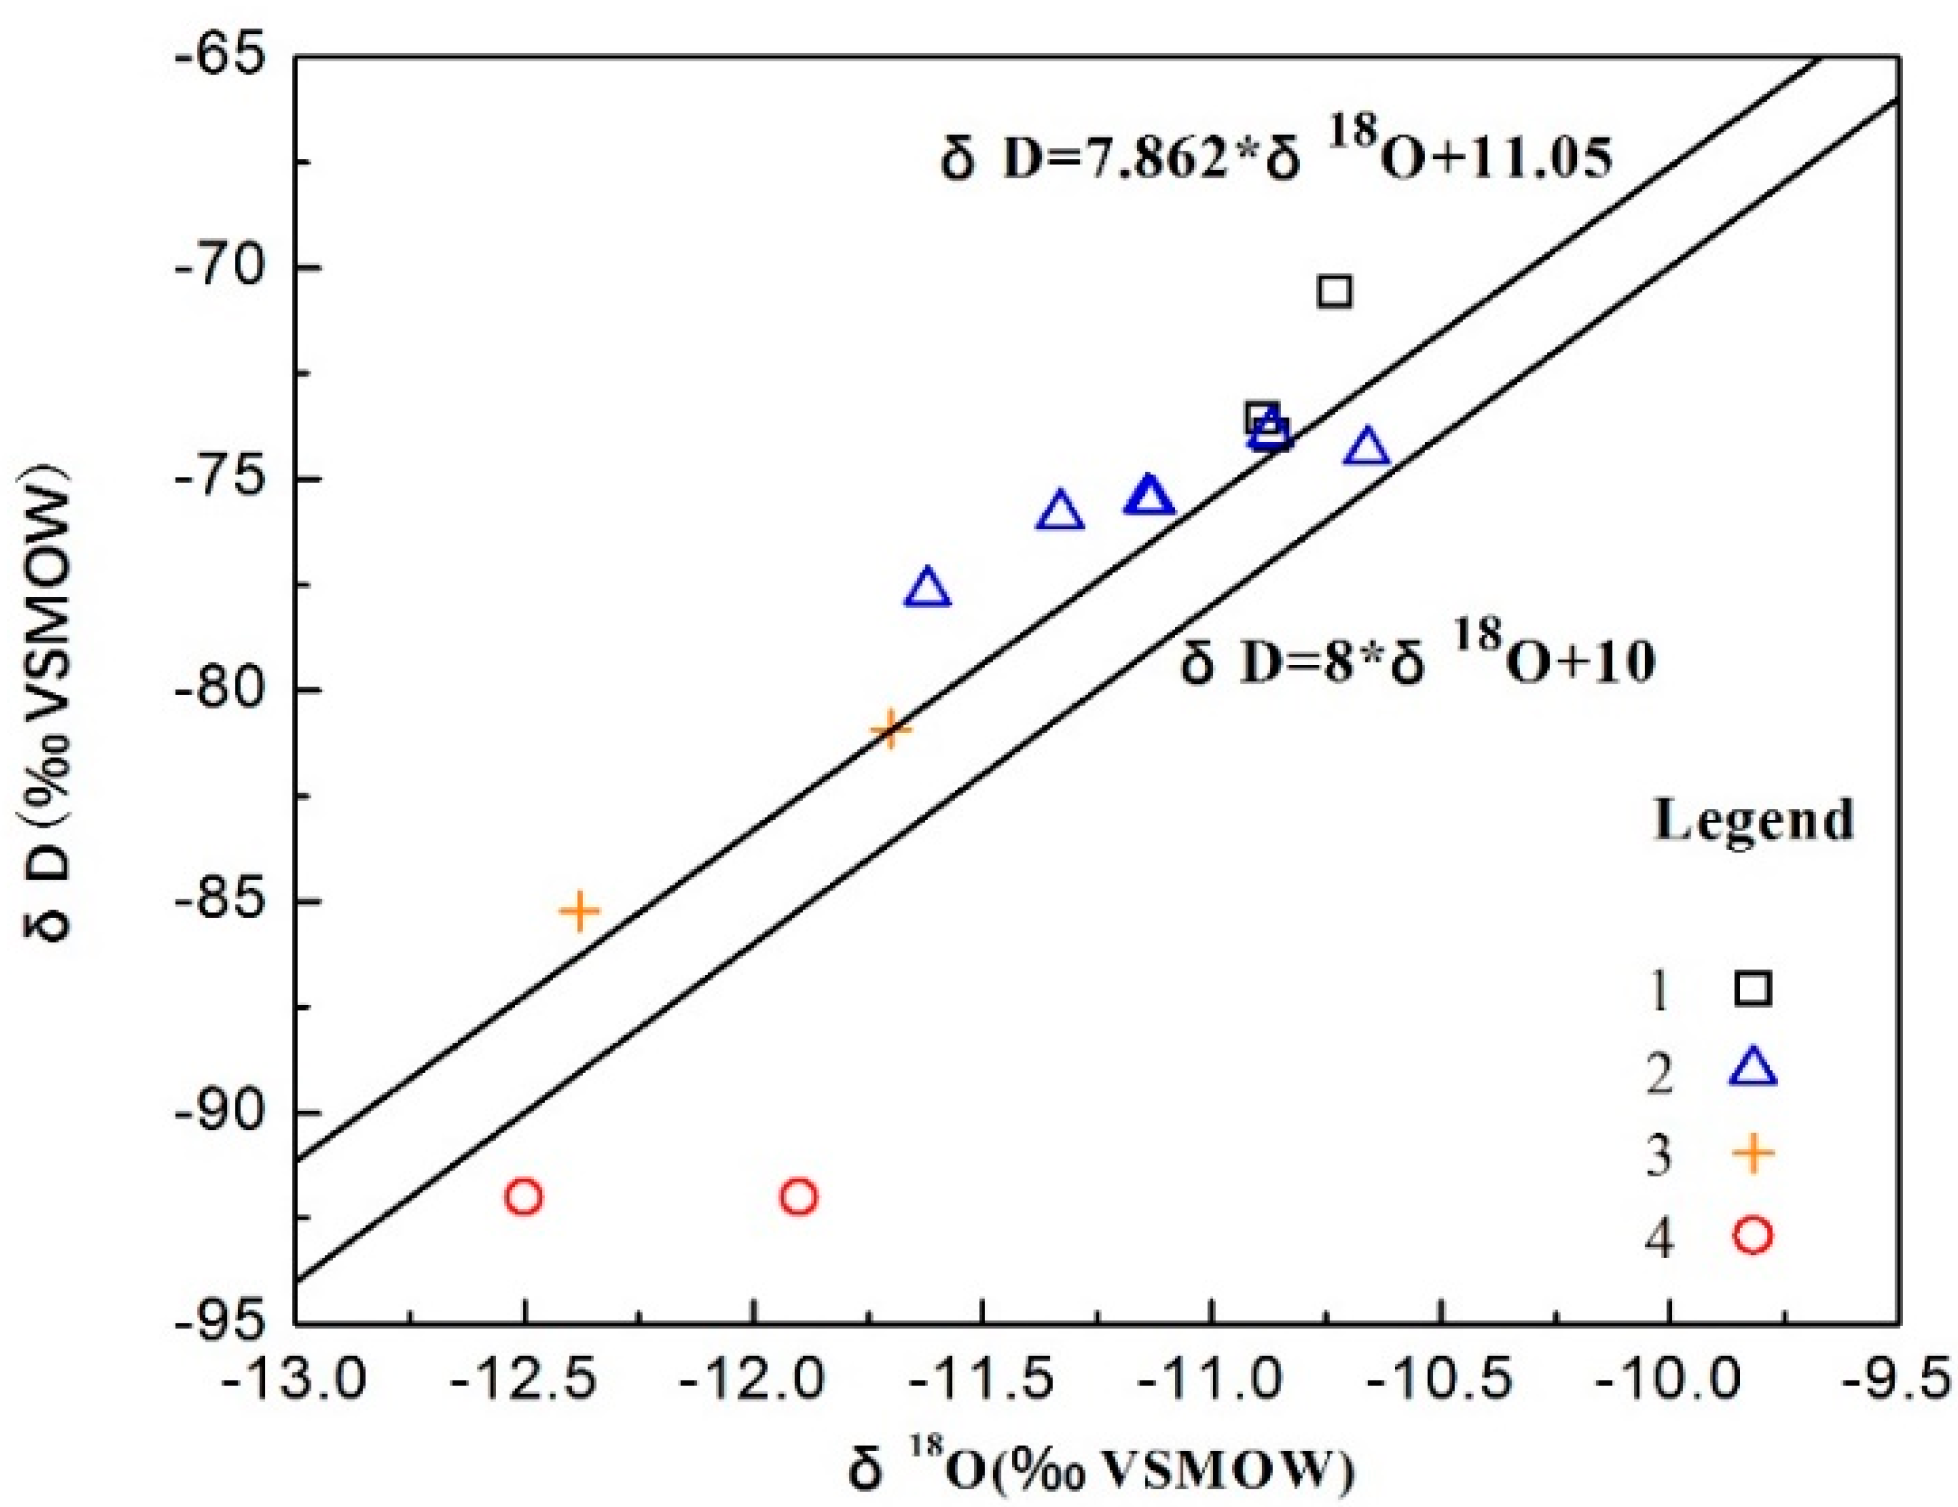
3.1. Hydrogen and Oxygen Isotopes

For determining groundwater origin, stable isotopes (D, 18O) are very appropriate tracers and are extensively used to study the circulation of natural water bodies [37]. The d-excess and the relationship of δD and δ18O are used to obtain the climate and geographical information when the groundwater was recharged. The d-excess has a negative correlation with humidity, and it can be greater than 10 at low humidity and less than 10 at high humidity [38,39]. Most water samples were concentrated near the local meteoric water line (LMWL: δD = 7.862 δ18O + 11.05 [27]) (Figure 3), indicating that most water in the study area was derived from atmospheric precipitation, which is recharged in southern mountainous areas (average annual rainfall over 300 mm), rather than by local rainfall (average annual rainfall <50 mm).
The δ18O of the river is from −10.89 to −10.73‰ with a mean of −10.83‰, and the δD is from −73.95 to −70.55‰ with an average of −72.69‰. Along the flow direction, the δD and δ18O of the groundwater show a decreasing trend. The δ18O of groundwater in Zone 2 is from −11.66 to −10.62‰ with an average value of −11.13‰, and the δD is from −77.67 to −73.91‰ with an average of −75.46‰; the d-excess is from 10.94 to 15.29‰. The δ18O and δD of the groundwater in middle Zone 2 are close to that of the surface water in Zone 1 and located at the lower left of the surface water samples, indicating that the groundwater was likely recharged by lateral runoff and the Nomhon River. The groundwater samples in Zone 3 are from springs and artesian wells, and they have a δ18O of −12.38 to −11.7‰ with an average of −12.04‰ and a δD of −85.22 to −80.91‰ with an average of −83.06‰. Compared to Zone 2, the δD and δ18O here are more depleted, and the d-excess is from 12.69 to 13.82‰, and the age of the groundwater is about 5–10 ka [40]. This indicates that the groundwater might originate from high-altitude areas far from the vapor source in a dry and cold climate. The δ18O and δD of the deep groundwater samples in Zone 4 are the most negative, δ18O is from −12.50 to −11.90‰ with an average of −12.20‰, and δD is −92.00‰. These are located at the lower right of the global meteoric water line (GMWL). The d-excess is from 3 to 8‰ and the age of groundwater is 17−28 ka [40], indicating that the groundwater might be recharged by ancient water in cold and moist paleoclimatic conditions [39], and 18O enrichment occurred due to long-term water–rock interaction in a closed environment.

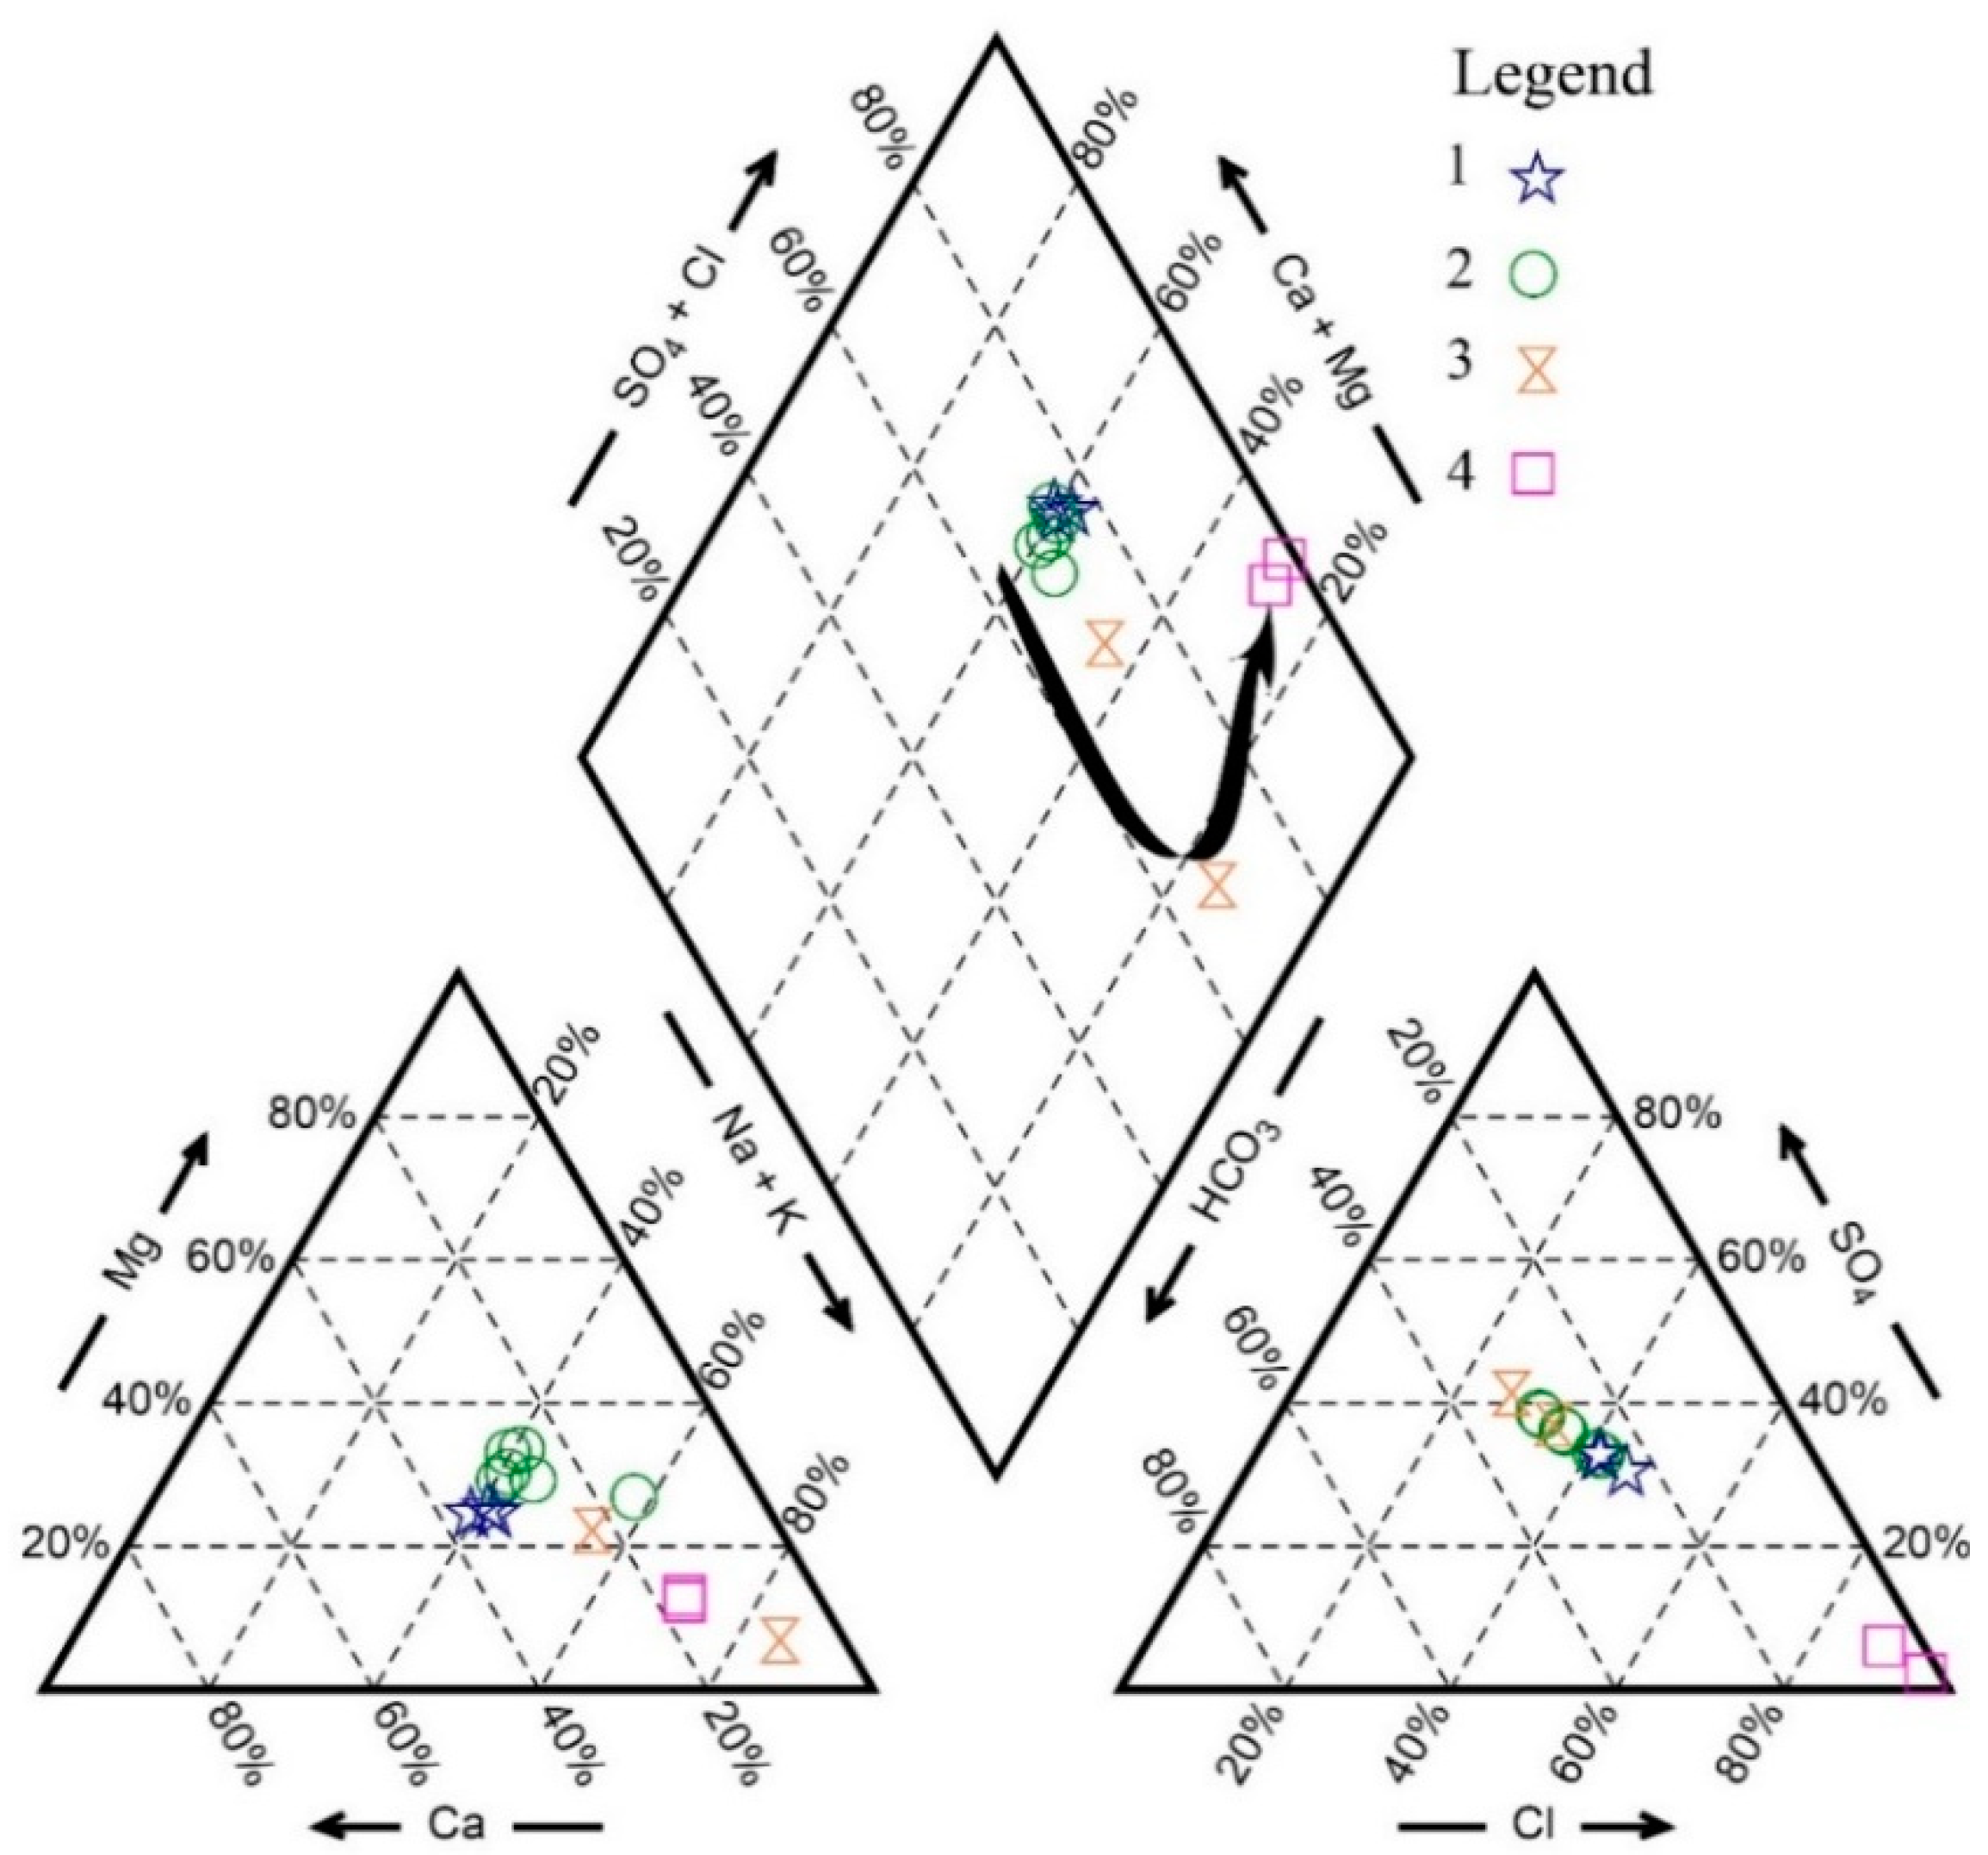
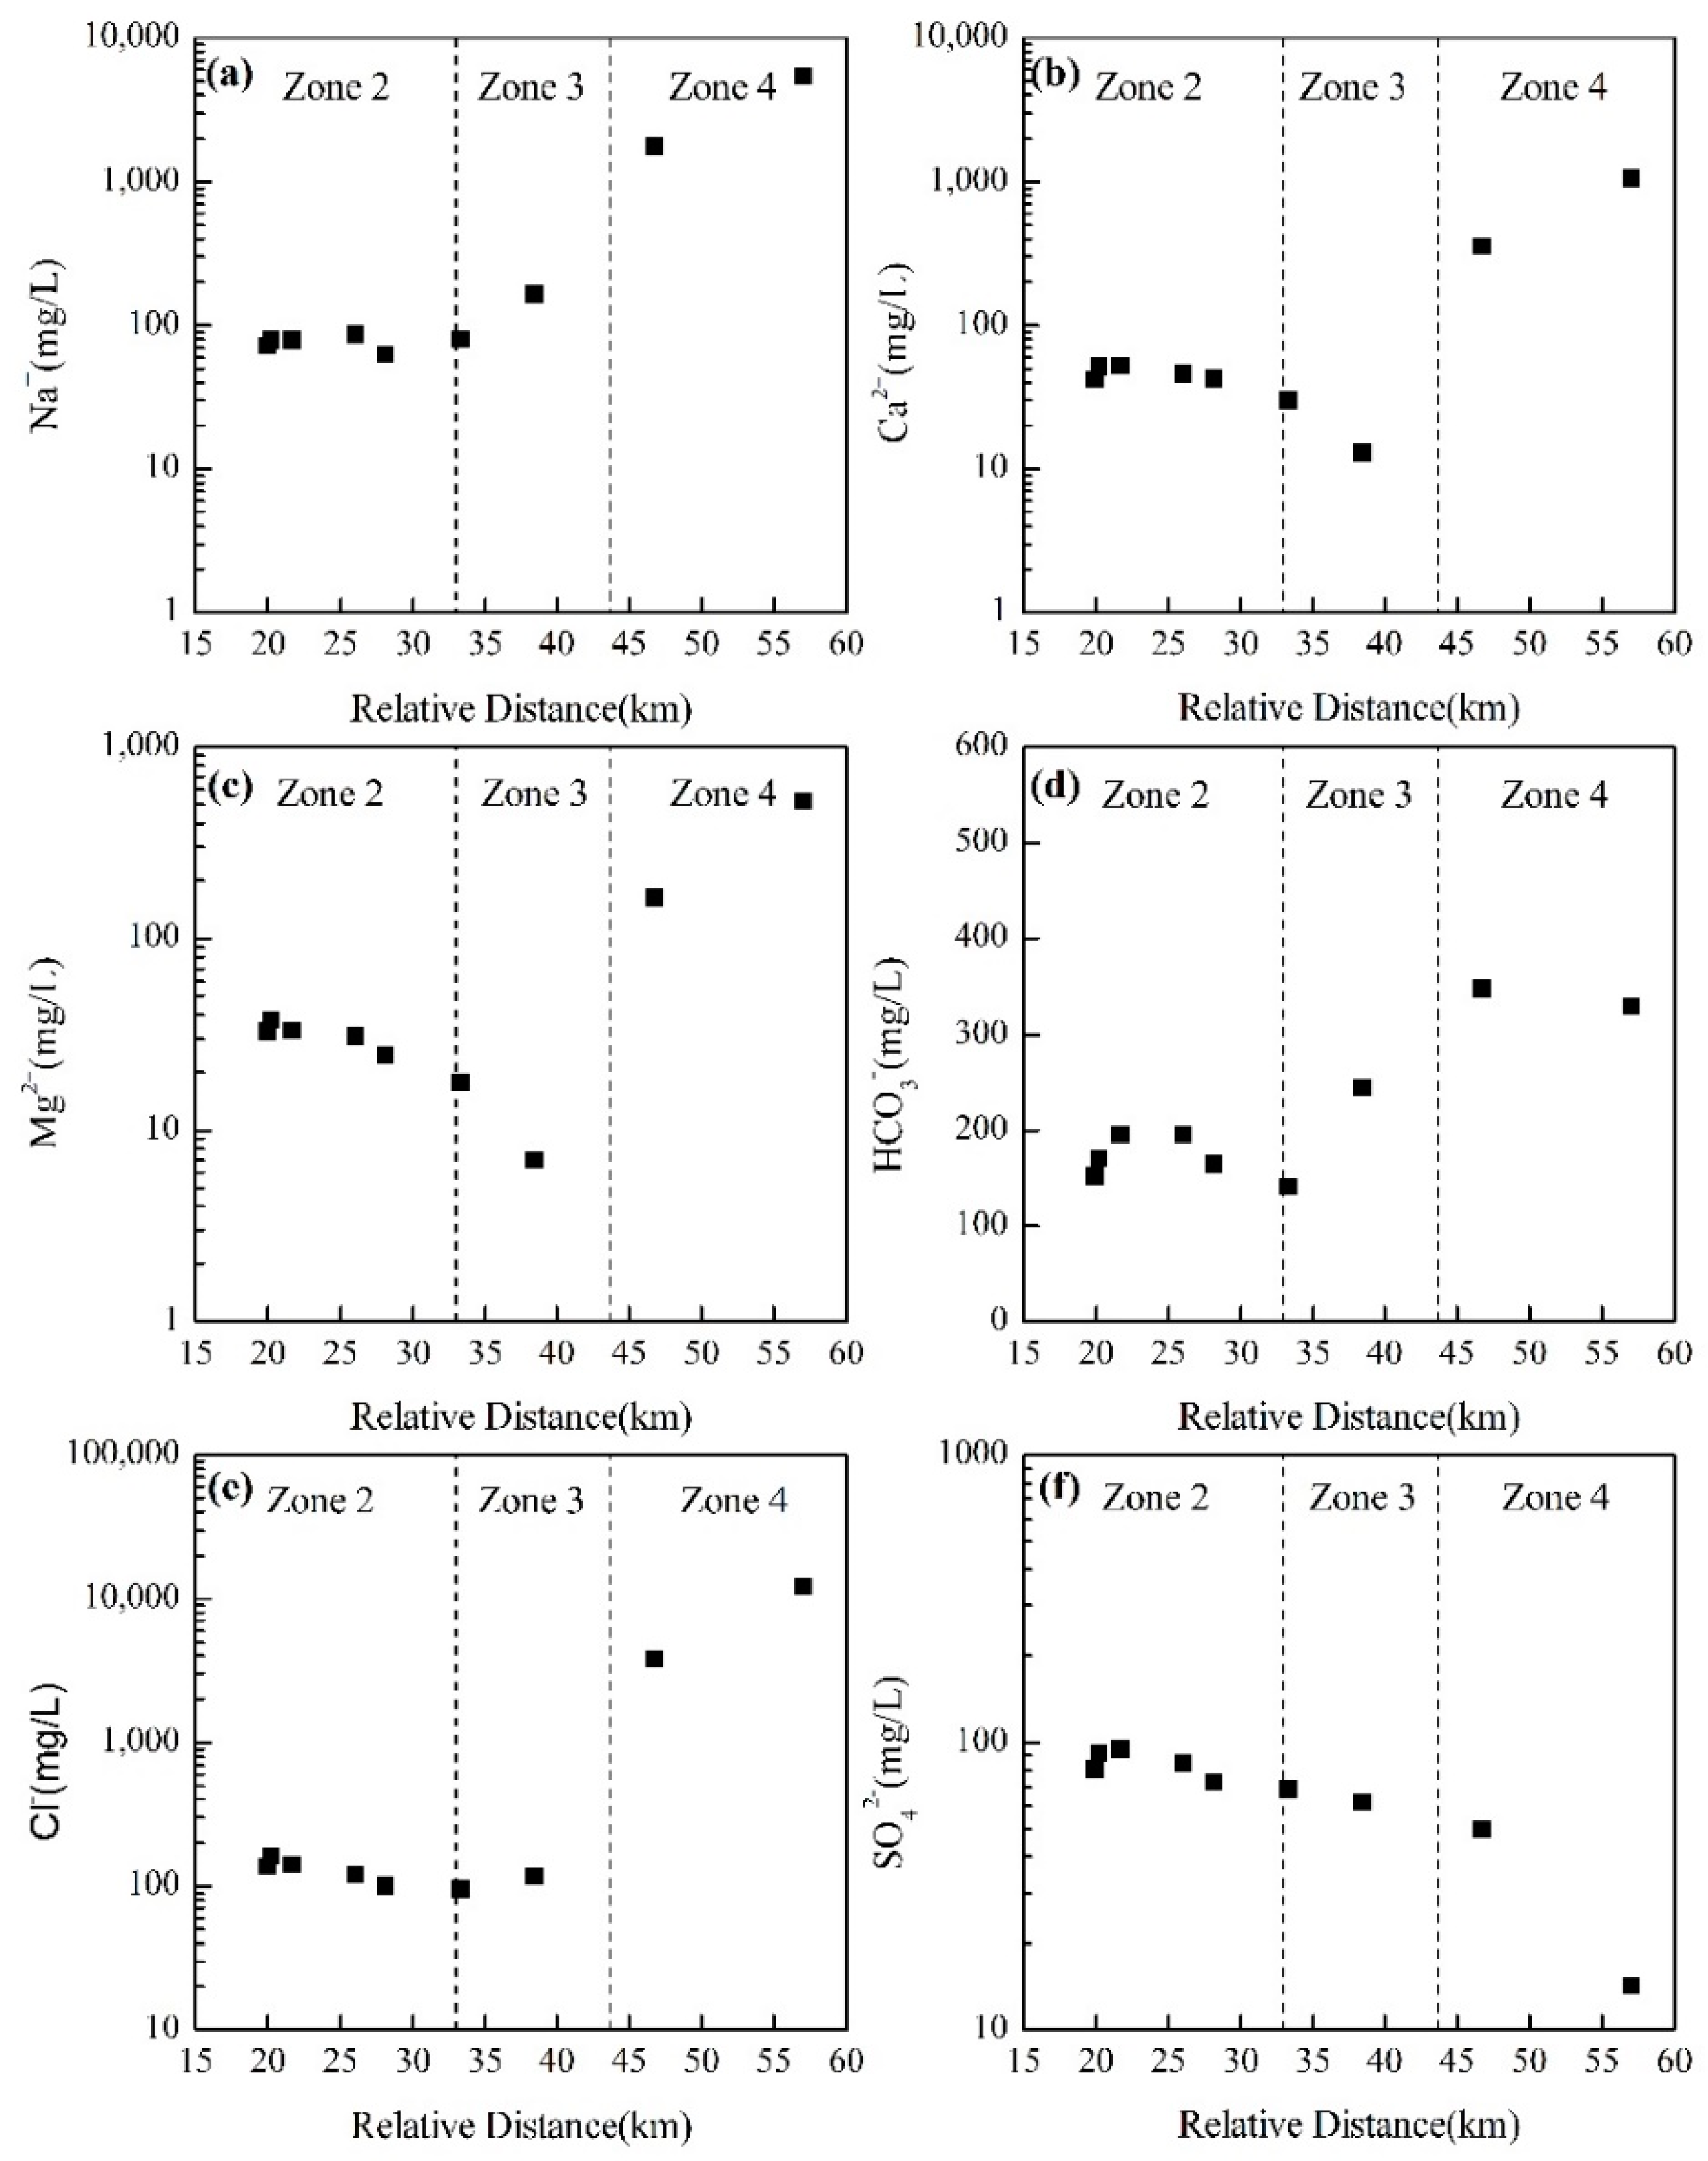
3.2. Hydrochemistry Characteristics

In the study area, the pH of groundwater samples is between 7.21 and 8.31 with an average of 8.00, suggesting that the groundwater is neutral to weakly alkaline. TDS varied from 462.50 to 19,604.40 mg/L with a mean of 3344.03 mg/L, EC varied from 700.60 to 31,620.00 μs/cm with a mean of 5427.36 μs/cm (Table 1), and the TDS of the groundwater in the arc-shaped uplift structure was relatively low, probably due to the influence of deep low-salinity groundwater.
Along the groundwater flow path, a suite of water–rock interactions could take place in the aquifers. Groundwater hydrochemical trends provide important clues for the understanding of hydrogeochemical processes, and groundwater chemistry types can be indicative of groundwater hydrochemical evolution [41]. The Piper diagram [42] is often used to determine the main compositions and hydrochemical types of groundwater (Figure 4).
For groundwater in Zone 2, the percentages of Na+, Ca2+, Mg2+, Cl and HCO3 are greater than 25%, and the major ions are in the follow order: Na+ > Ca2+ > Mg2+ and Cl > HCO3. In Zone 3, only Na+, Cl, and HCO3 are the dominant ions, with average proportions of 63.52%, 37.96%, and 43.56%, respectively. In Zone 4, Na+ and Cl are the main ions—about 70.00% and 96.00%, respectively. From Zone 2 to Zone 4, the hydrochemical type of the groundwater changed from Cl·HCO3–Na·Mg·Ca through Cl·HCO3–Na and HCO3·Cl–Na to Cl–Na, which is mainly related to the water–rock interactions, geological structure, and basin sedimentary characteristics.
It is crucial to investigate variations in major components (Figure 5) along the flow direction to better understand the effect of water–rock interactions. As can be seen from Figure 5, different trends in ions were observed in different zones along the flow path. In Zone 2, the concentrations of Na+ and Cl were relatively stable, Ca2+ and Mg2+ showed a slight decreasing tendency, and HCO3 increased at first and then decreased, suggesting that ionic exchange and the dissolution of Na silicates like albite could occur in the zone. Variation trends changed after entering into Zone 3: Na+, Cl, and HCO3 concentrations show increasing trends, and the increasing rate of Na+ is greater than that of Cl; however, both Ca2+ and Mg2+ decline. The possible reasons leading to those variations may be ionic exchange and the dissolution of halite and Na silicate. From Zone 3 to Zone 4, except for SO42−, major ions increase rapidly. Increasing trends in Na+, Cl, Ca2+, and Mg2+ are observed when HCO3 and SO42− decrease in Zone 4 along the flow path. Moreover, the order of ionic rising rates is Cl > Na+ > Ca2+ > Mg2+; therefore, it can be inferred that the halite dissolution, cation exchange, the precipitation of carbonate, and redox are primary water–rock interactions resulting in the variation of ions.

3.3. Hydrogeochemical Processes

3.3.1. Thermodynamic Stability

The stability diagrams of silicate minerals contribute to thermodynamic studies and are often used to determine the equilibrium extent of water–rock interaction [43,44]. The relationships between Ca2+/H+, Mg2+/H+, Na+/H+, K+/H+, and H4SiO4 (Figure 6) were employed to determine the equilibrium of groundwater with aluminosilicate minerals in the study area.
As shown in Figure 6, all the water points in Zone 2 and Zone 3 fall in the kaolinite (Figure 6a,c,d) and Na montmorillonite stable fields (Figure 6b), which suggest that primary silicate minerals like albite, anorthite, and chlorite should tend to dissolve and convert to secondary minerals in groundwater flow systems. However, the points (NG8, NG9) in Zone 4 are located in the montmorillonite (Figure 6c,d) and albite (Figure 6b) areas, indicating that albite should be in equilibrium with groundwater. The silicate minerals have changed along the flow path of the groundwater, indicating the degrees of water–rock interactions and residence time. All samples are on the right of the quartz line, suggesting that the quartz is saturated and in a relatively equilibrium state with the groundwater, and the SiO2 may be derived from amorphous silica [45]. The results showed that the degree of water–rock interaction and residence time increased gradually from the Gobi Belt to the basin center.

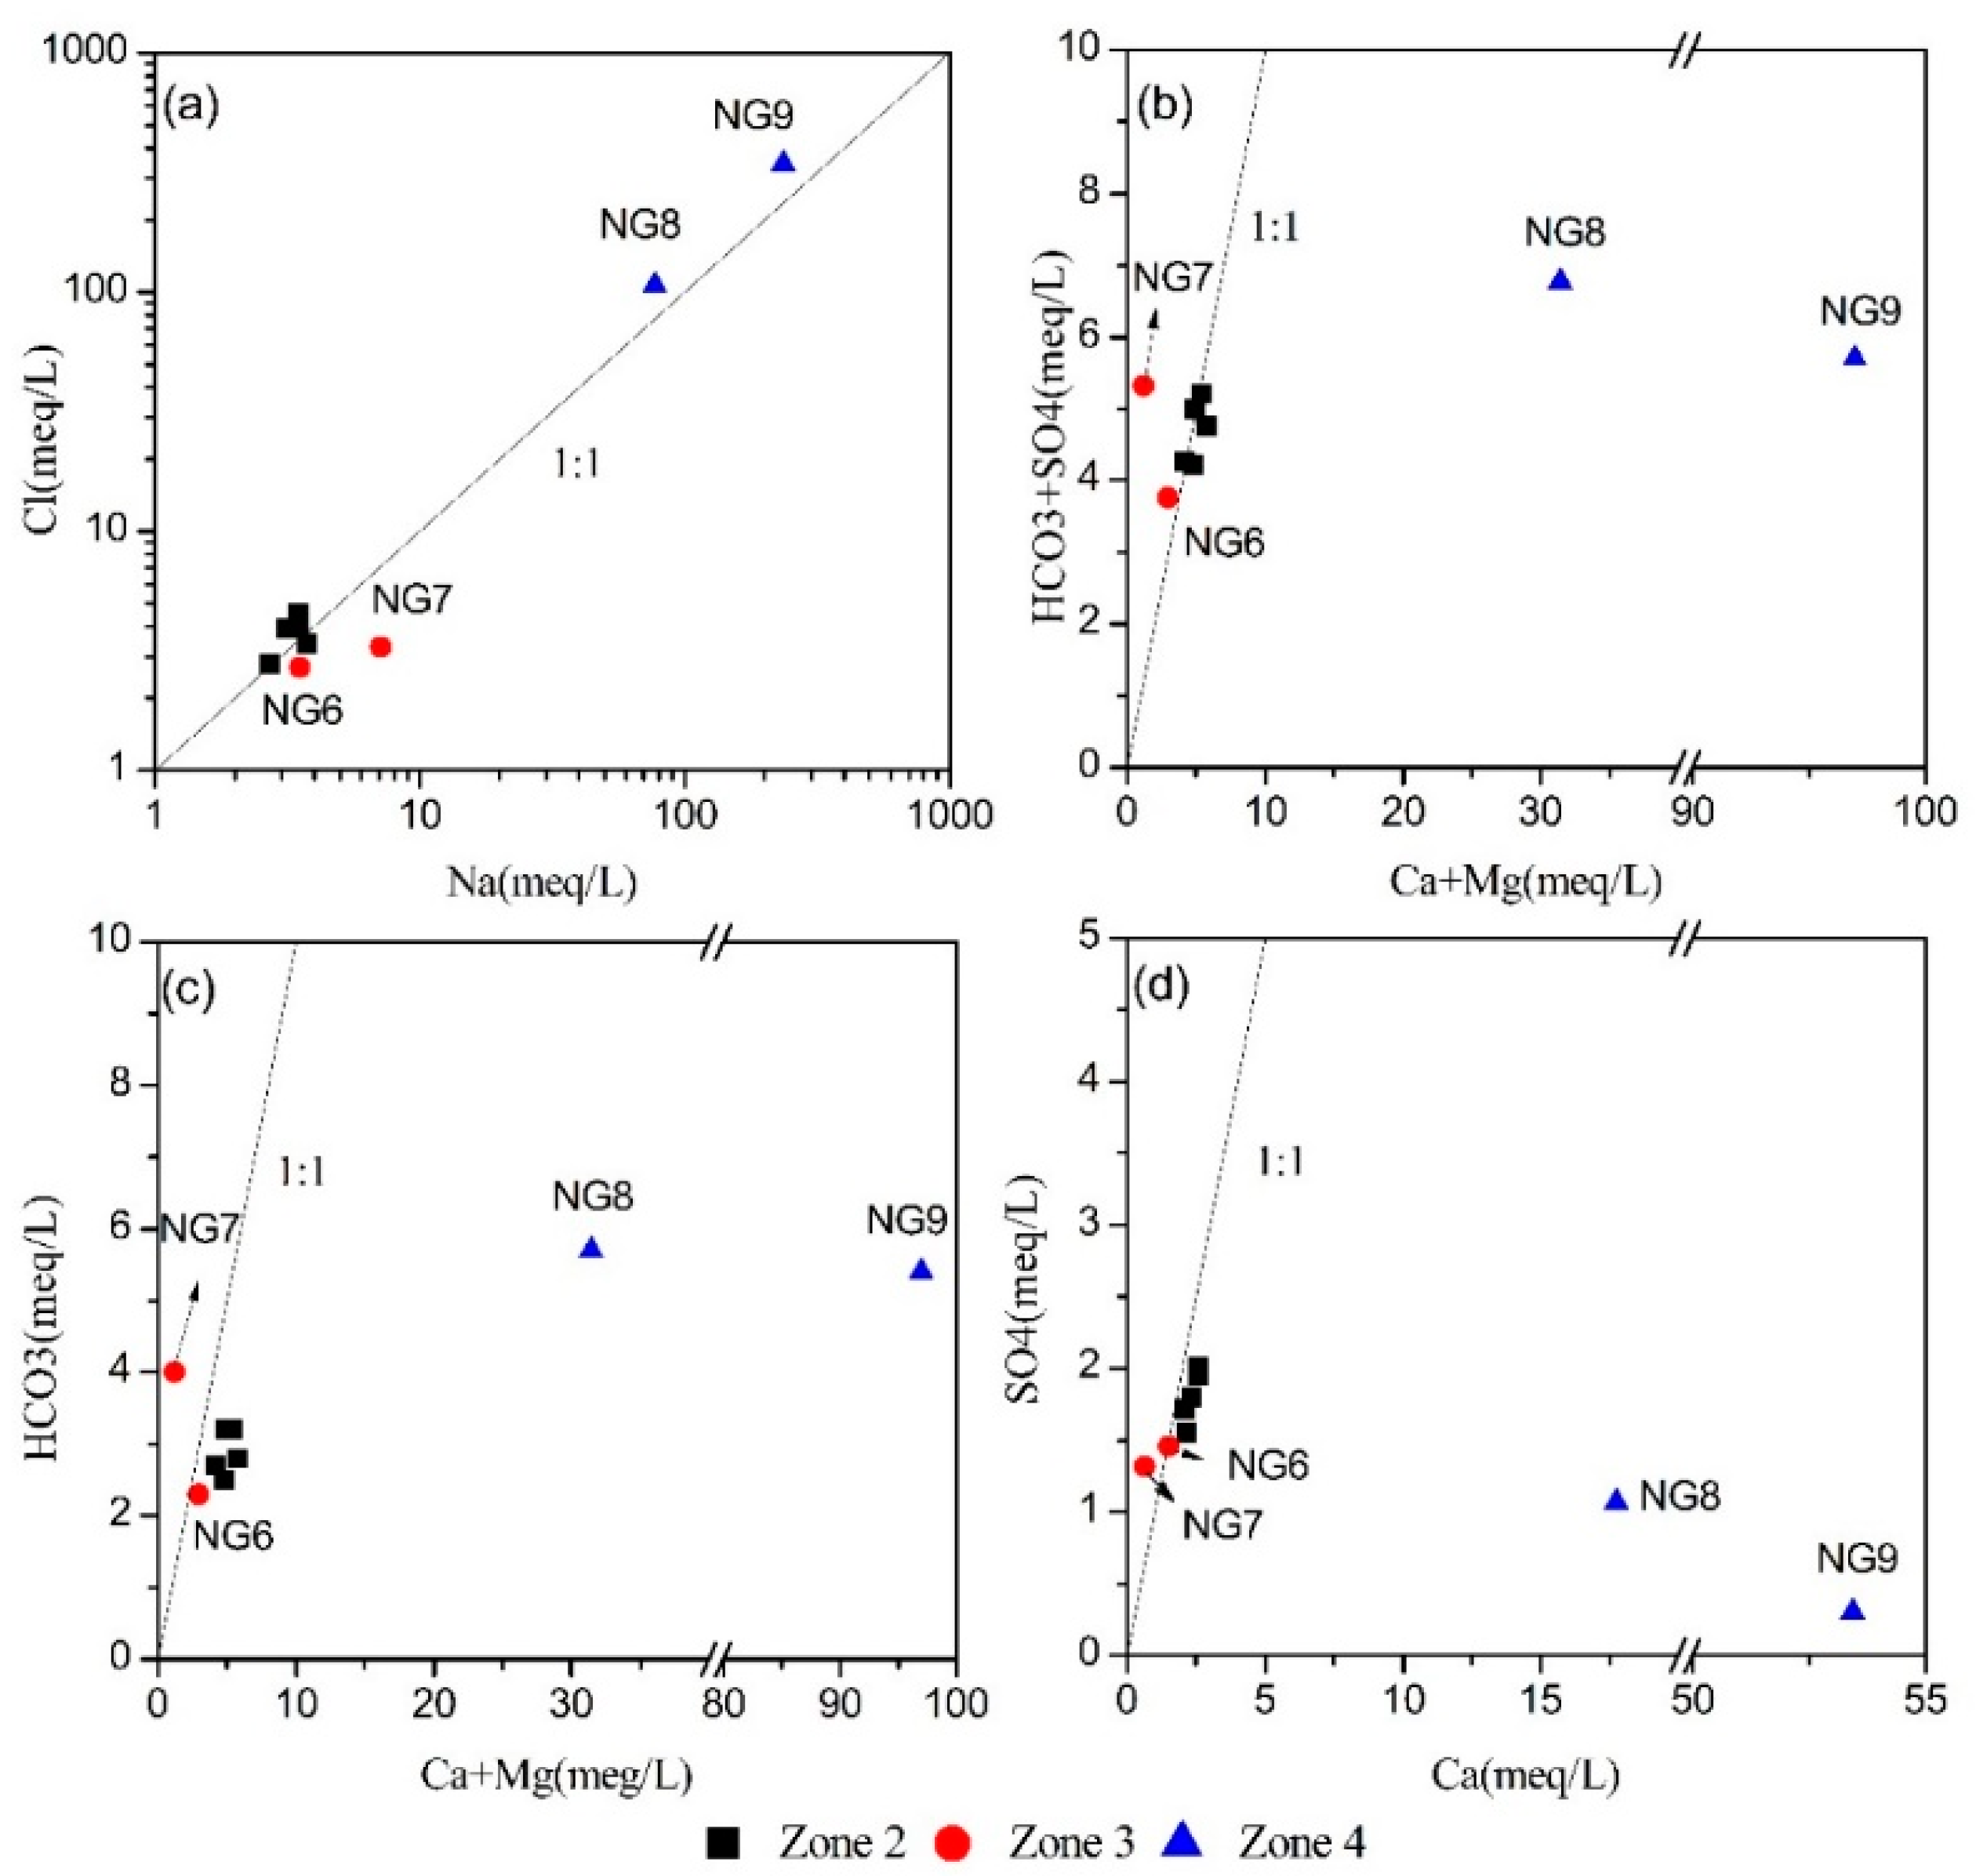
3.3.2. Dissolution and Precipitation

The dissolved components in groundwater do not exist independently, their interrelationships can explain the sources of solutes and the processes controlling groundwater chemical composition [46]. For the purpose of understanding and illustrating the hydrogeochemical processes, different major ions’ interrelationships were studied (Figure 7).
Cl is characterized by high solubility and mobility and was often applied as an indicative element in water–rock interaction research. The relationship between Na+ and Cl has been commonly applied to discern the source of salinity in arid and semi-arid areas. The points will be located on the line 1:1 due to halite dissolution, whereas if the points are above or below the line 1:1, the most common explanation is that the Na+ is derived from Na silicate or ionic exchange [47]. As can be seen from Figure 7a, most points are close to the line 1:1, showing that the Na+ and Cl in the groundwater are mainly derived from halite dissolution as expressed by Equation (2). The saturation indices of halite are much less than 0 (SI = −6.94~−2.95), and it is unsaturated with strong dissolution potential and easily enters groundwater. The data points in Zone 3 are mainly located below the equivalence line, especially NG7, so it is considered that the Na+ is released from a Na-silicate dissolution (Equation (3)) and positive cation exchange reactions (Equation (4)). Moreover, in the southern mountain of the study area, granite is extensively spread, so the Na+ is in all probability produced by aluminosilicate dissolution. Nevertheless, the sectional water samples in Zone 2 and Zone 4 lie above the line 1:1, which is possibly due to reverse cation exchange process (Equation (5)).
The ions with the second highest concentrations are Ca2+ and Mg2+, which are second only to Na+. The relationships between (Ca2+ + Mg2+) vs. (SO42− + HCO3) and (Ca2+ + Mg2+) vs. HCO3 can reflect the contribution of dissolution or precipitation of carbonate (calcite, dolomite, etc.) and sulfate (gypsum, etc.) to groundwater chemical compositions [20,48]. Figure 7b,c show that the carbonate is the factor controlling Ca2+ and Mg2+ for most points in Zone 2 and Zone 3. Calcite and dolomite are saturated and tend to precipitate since SIcalcite and SIdolomite are greater than 0. Furthermore, most data points were distributed along the 1:1 line in Figure 7d, suggesting that gypsum dissolution (Equation (6)) has a significant influence on groundwater chemicals in this area [41]. However, the points NG7, NG8, and NG9 are plotted far away from the equivalence line. NG7 falls above the line, indicating strong positive cation exchange and/or Na silicate dissolution, and NG8 and NG9 fall below the 1:1 line. SO42− + HCO3 show a stable trend, which may result from strong reverse cation exchange and reduction of SO42−. The SO42− + HCO3 of NG8 and NG9 in Zone 4 did not significantly change with increasing Ca2+ + Mg2+, and the SO42− concentrations of the groundwater are relatively low (0.53 and 0.15 mmol/L for NG8, NG9, respectively), which may be due to SO42− reduction (Equation (7)). There are generally two causes of sulfate decrease: gypsum precipitation and sulfate reduction. The saturation index of gypsum is approximately equal to −2, reflecting a dissolved state. Therefore, the precipitation of gypsum is unlikely to be the reason for the SO42− decrease. The water samples in the basin center (NG8 and NG9) are from deep groundwater, and the ORP (oxidation reduction potential) values of the groundwater for these samples are −188 and −106, respectively, indicating that the groundwater is in a reducing environment. The strata contain a peat layer and humus, and there are continuous bubbles emerging at the sampling site. Therefore, the reduction of SO42− was deduced as the reason for the decrease of SO42− in the groundwater. From what has been discussed above, the dissolution/precipitation of halite, calcite, dolomite, gypsum, and albite and redox are vital for the formation of groundwater chemical compositions.
NaCl → Na+ + Cl
2NaAlSi3O8 + 2CO2 + 11H2O → Al2Si2O5(OH)4 + 4H4SiO4 + 2Na+ + 2HCO3
2NaX + Ca2+ (Mg2+) → CaX2 (MgX2) + 2Na+
2Na+ + CaX2(MgX2) → 2NaX + Ca2+ (Mg2+)
CaSO4 → Ca2+ + SO42−
SO42− + 2C + H2O → H2S + 2HCO3

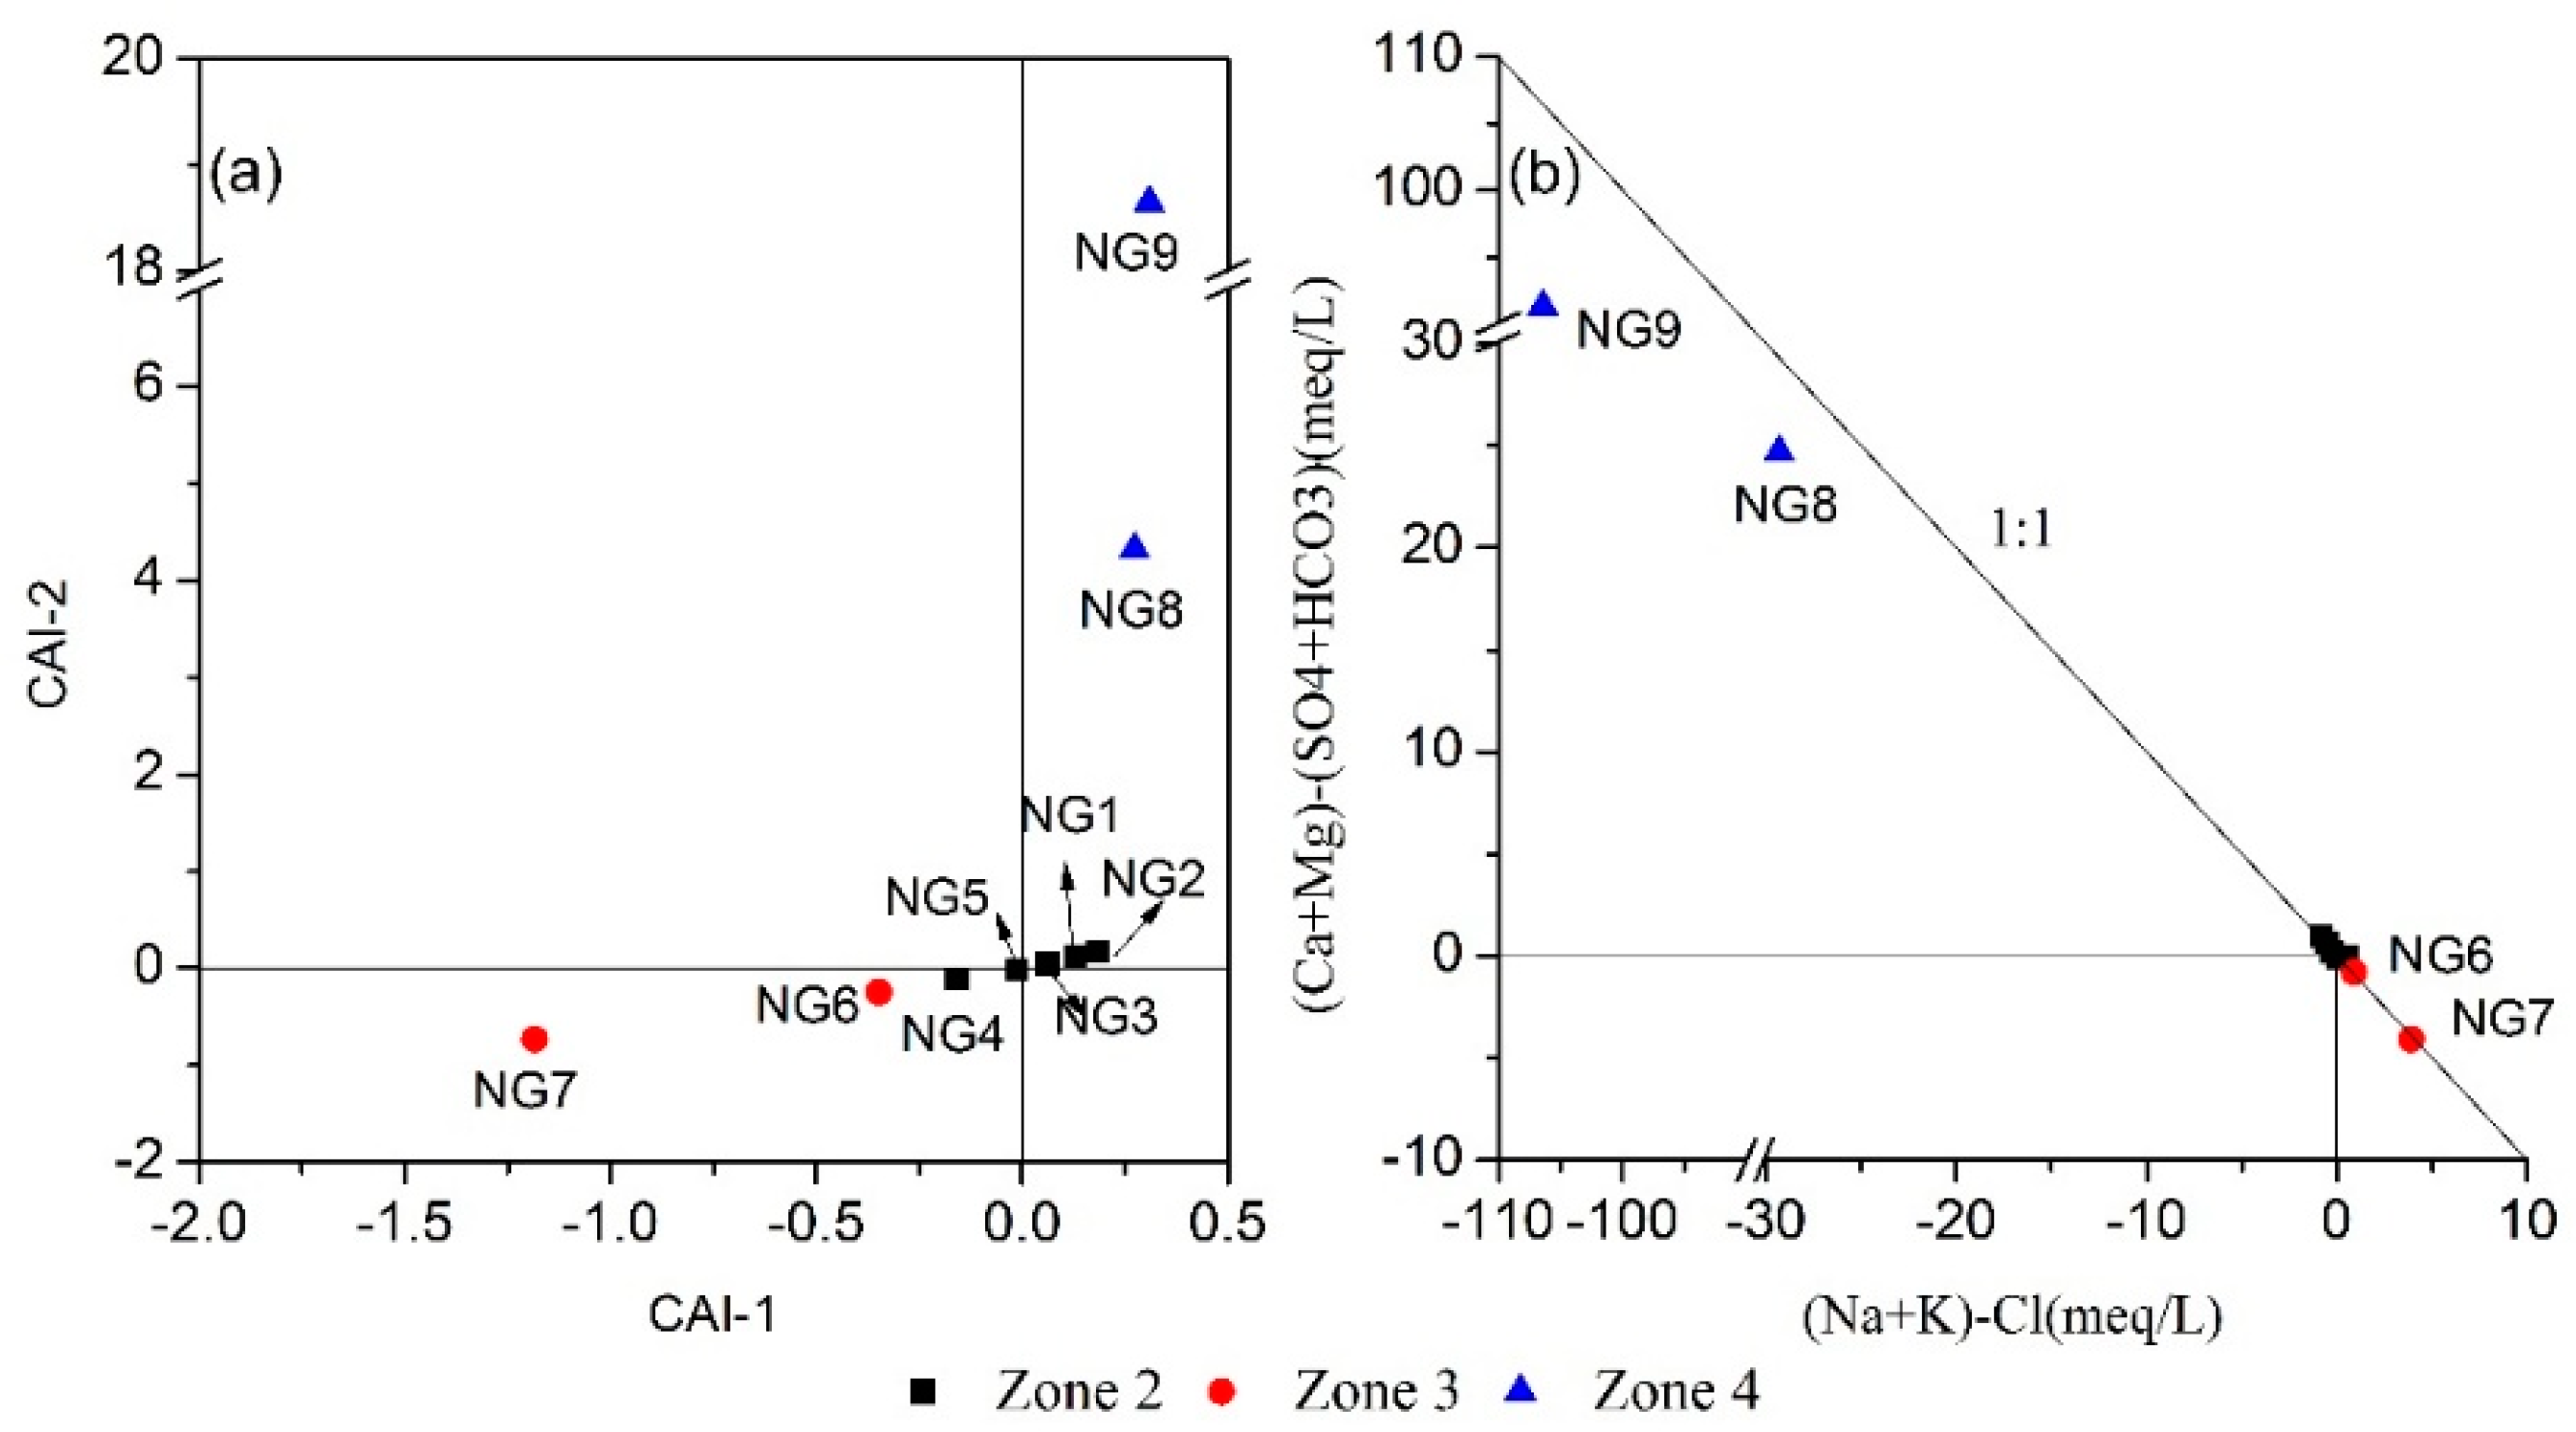
3.3.3. Cation Exchange
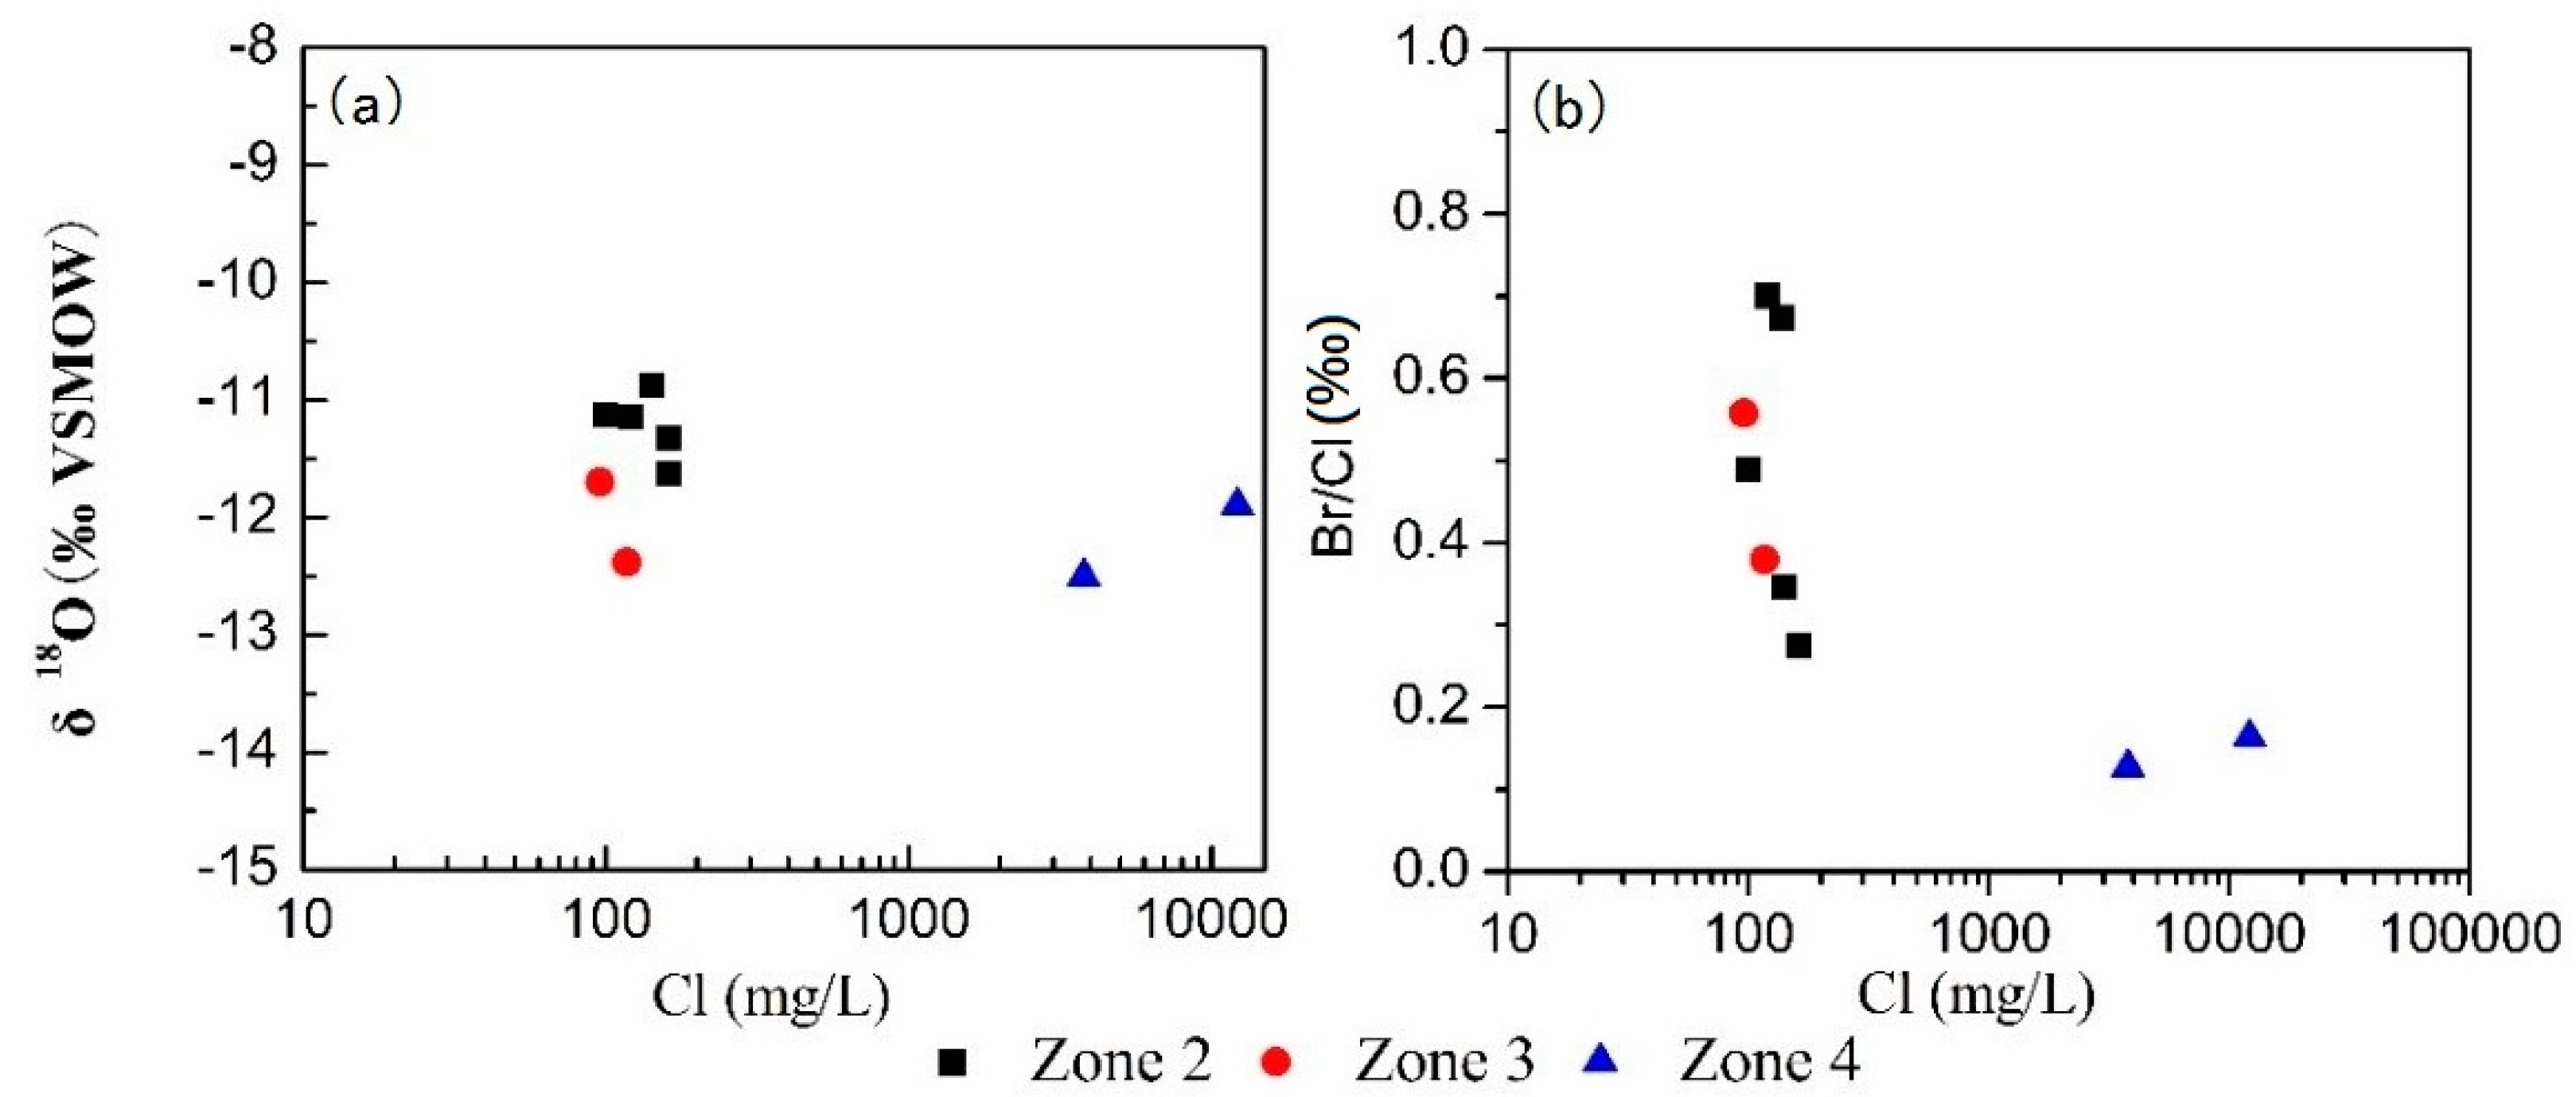
Cation exchange is a vital natural reaction in groundwater hydrochemical evolution [49]. For the sake of determining the effect of ion exchange in groundwater evolution, two exchange indices named chloro-alkaline indices were proposed, and the expressions are as follows [50]:
CAI 1 = Cl ( Na + + K + ) Cl
CAI 2 = Cl ( Na + + K + ) HCO 3 + SO 4 2 + CO 3 2 + NO 3 .
The unit of ion concentrations is meq/L. When both indices are less than 0, positive cation exchange occurs; if both indices are positive, reverse cation exchange occurs. In addition, the diagram of (Na+ + K+ − Cl) vs. [(Ca2+ + Mg2+) − (HCO3 + SO42−)] has also often been used to study cation exchange [51,52]. If the slope of Na+ + K+ − Cl vs. (Ca2+ + Mg2+) − (HCO3 + SO42−) is −1, cation exchange happens [53]. In this study, all water samples were located near the line with a slope of −1, suggesting that cation exchange extensively occurs in this study area (Figure 8b). The two chlor-alkali indices (Figure 8a) indicate that there are both positive and reverse cation exchange in the study area. The aquifer sediments are medium sand, mid-fine sand, and fine sand with an increase of clay mineral contents along the flow path. The chlor-alkali indices of the groundwater in Zone 4 are far greater than 0, indicating that there is strong reverse cation exchange in this area. The dissolution of halite leads to an increase in Na+ which could replace Ca2+ and Mg2+ on the surface of aquifer materials. This can lead to an increase of Ca2+ and Mg2+. This result is consistent with that of Xiao et al. (2017) [26].

3.3.4. Evaporation

The study area belongs to an arid area, and evaporation has a certain influence on the formation and evolution of groundwater chemistry. Previous studies concluded that evaporation played an important role in groundwater chemical compositions in the study area [25,28]. To investigate the high Cl concentrations of the groundwater, the diagram of δ18O vs. Cl was used in the present study (Figure 9a). Halite dissolution can result in horizontal lines in the diagram and merely increase the TDS without variation in 18O. It can be inferred from the plot that evaporation may not exist in the flow path from Zone 3 to Zone 4. Br/Cl is an important tracer for determining geochemical processes and is commonly used to discern the difference between evaporative crystallization and other effects, such as dissolution of halite, which results in the increase of salinity. Br/Cl is of great significance for identifying the source of salt and will decrease with the increase of Cl due to the dissolution of halite [54,55,56]. The Br/Cl of halite is generally between 0.10 and 1.00‰ [57,58,59]. The Br/Cl value of groundwater in our study area is 0.11–0.70‰ (Figure 9b), indicating that the source of Cl in the entire study area is primarily halite dissolution without obvious evaporation; this is not completely consistent with previous results.

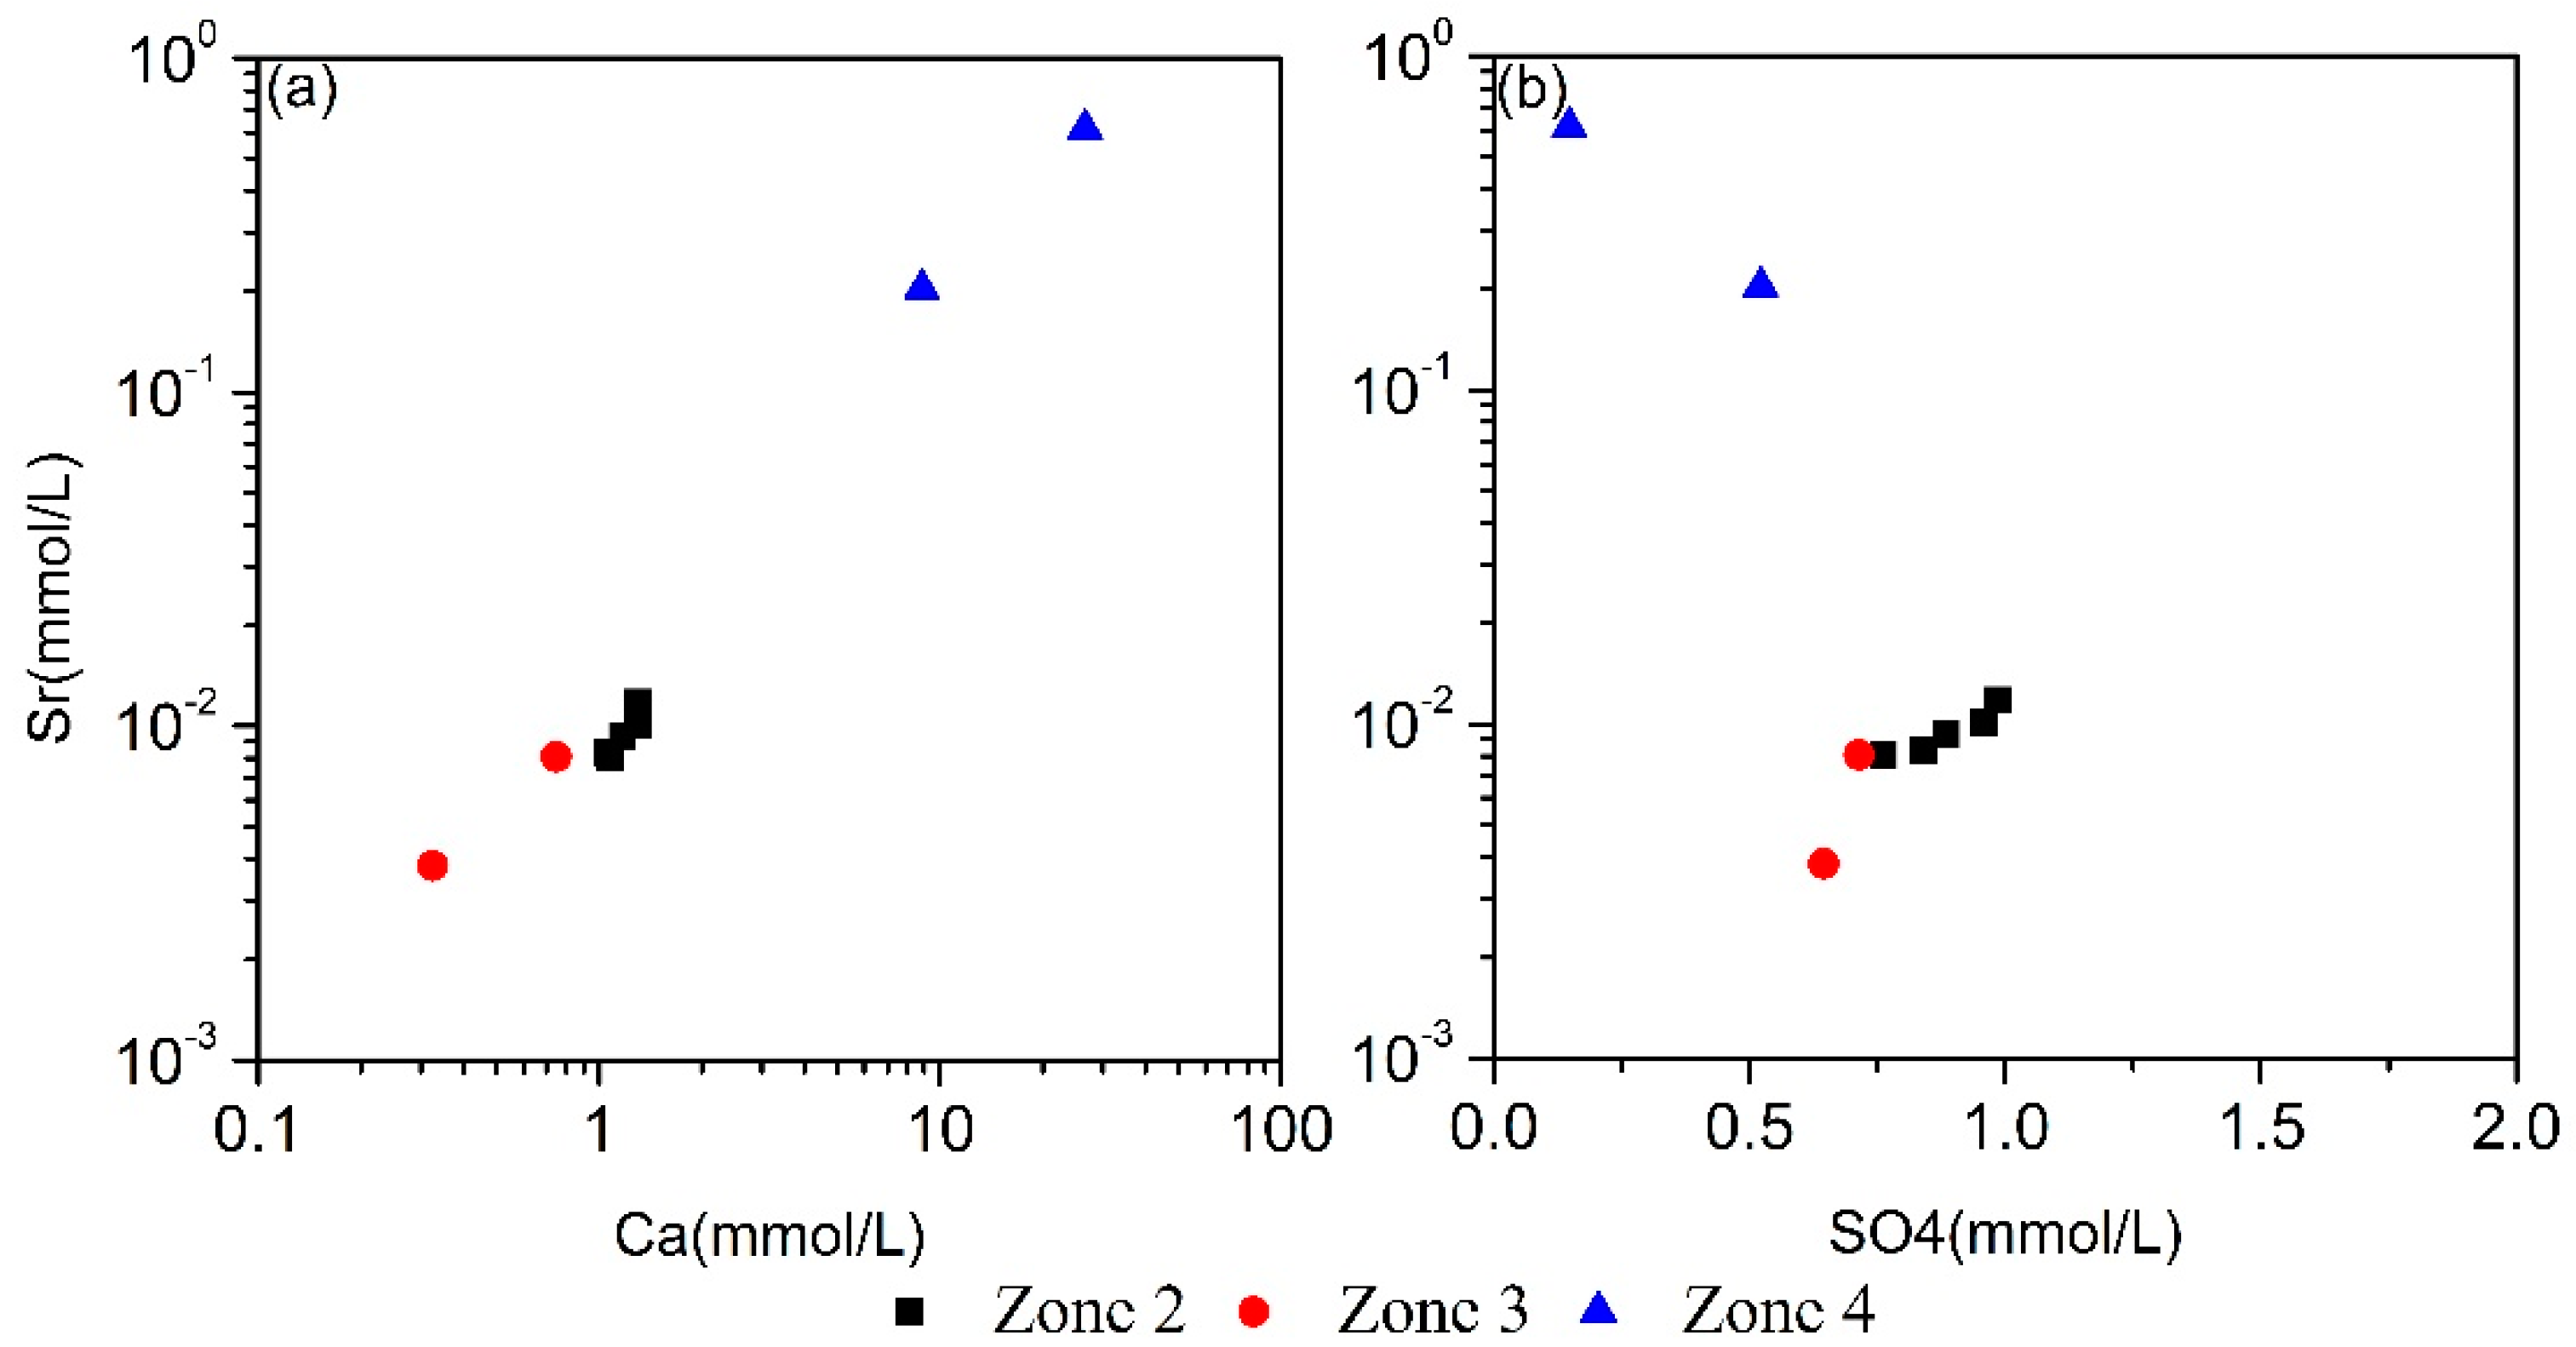
3.3.5. Strontium Signature in Groundwater

Sr2+ is an alkaline element associated with Ca2+ [60], and it can be applied to determine sulfate sources in groundwater [61]. In order to ascertain the source of SO42−, the relationships of Sr2+ vs. Ca2+ and Sr2+ vs. SO42− were used in the study (Figure 10). They show that the correlation between Sr2+ and Ca2+ was very good in three zones; however, the correlation between Sr2+ and SO42− was more complex. It seemed to be a good correlation in Zone 2, but a poor correlation in Zone 3 and Zone 4 (Figure 10b), where the concentration of Sr2+ increased with either increase or decrease of SO42−, indicating that gypsum dissolution and redox of SO42− might be the main factors controlling the SO42− concentration. The different hydrochemical characteristics of the groundwater may reflect the complicated water–rock interactions in the zones of the study region.

3.4. Hydrogeochemical Modeling

Inverse geochemical modeling can determine the main water–rock interactions in the hydrogeochemical evolution processes based on variations in groundwater chemical composition; these, in turn, can explain the hydrogeochemical evolution and reveal potential sources and the cycle of groundwater [6,7]. NETPATH [31,62] was used to quantitatively simulate the reactions that might occur during the groundwater chemical evolution in the study area. The simulation route selected was NG5 → NG7 → NG8 → NG9.

3.4.1. Possible Mineral Phases and Constraints

The selection of possible minerals is a key factor in the accuracy of inverse geochemical simulations and is mainly based on hydrogeochemical analysis, lithology and mineral constituents, and features of aquifers [63,64].
Based on the results discussed above, possible mineral phases in the simulation processes were determined. Possible minerals are halite, gypsum, dolomite, calcite, albite, chlorite, anorthite, kaolinite, and SiO2. During the hydrochemical evolution process, cation exchange is essential and should be included in modeling [4]. However, the groundwater system in Zone 2 is an open system, so CO2 was selected (log pCO2 from −2.54 to −3.14). In Zone 4, the groundwater is deep water and shows a reducing environment, so CH2O and H2S were also selected as possible phases in the simulation. According to the saturation indices (Table 2), the halite and gypsum are only dissolved, and calcite and dolomite tend to precipitate. The constraints confine the maximum number and species of phases contained in mass balance modeling [15]. According to the relevant data of this study, the constraints were set as Ca, Mg, Na, S, Cl, Si, C, and Al in the simulation.

3.4.2. Results of Inverse Modeling

The results of the mass balance simulation are listed in Table 3.
From the alluvial fan to the alluvial–lacustrine plain, the dominant reactions causing variation in groundwater chemical compositions are the dissolution of halite, albite, and CO2; the precipitation of dolomite and kaolinite; SO42− reduction (H2S); and positive cation exchange. Shallow groundwater is in an open system, so CO2 can be continuously input into the groundwater to result in the dissolution of albite, which is the major factor controlling Na+. Dissolution of halite also produces Na+ and Cl which enter the groundwater continuously. Ca2+ and Mg2+ are dominated by the precipitation of dolomite. Due to increasing Na+ and Cl and decreasing Ca2+ and Mg2+, the water type varies from Cl·HCO3–Na·Ca·Mg to Cl·HCO3–Na.
From the alluvial–lacustrine plain to the lacustrine plain, the groundwater is affected by the dissolution of halite, gypsum, and chlorite; precipitation of calcite and SiO2; redox (SO42− reduction); and inverse cation exchange. Halite dissolution and inverse cation exchange control Na+, while Ca2+ and Mg2+ are dominated by inverse cation exchange, gypsum dissolution, and calcite precipitation. Halite dissolution produces Na+ and Cl which enter the groundwater continuously, and with increasing Na+, clay minerals adsorb Na+ and release Ca2+ and Mg2+. Therefore, the concentration of Na+ is lower than that of Cl, and those of Ca2+ and Mg2+ keep increasing. In addition, as deep groundwater is in a reduced state, redox occurs and SO42− is reduced to H2S. Due to the hydrogeochemical reactions, the water type changes into Cl–Na. Finally, when the groundwater migrates to the basin center, the hydrochemistry compositions are controlled by the dissolution of halite and gypsum, precipitation of calcite and dolomite, redox (SO42− reduction), and inverse cation exchange. The dissolution of halite and inverse cation exchange reactions are enhanced, and others become weak. The reactions along the flow path can be represented by the following equations (unit: mmol/L):
NG5 + 0.485 NaCl + 3.894 albite + 2.677 CO2 + 0.024 exchange − 5.853 kaolinite − 0.728 dolomite − 0.117 H2S = NG7
NG7 + 104.886 NaCl + 9.540 gypsum + 1.156 chlorite + 19.552 CH2O − 16.543 calcite − 9.776 H2S − 3.407 SiO2 − 14.851 exchange = NG8
NG8 + 243.195 NaCl + 1.32917 chlorite + 6.378 gypsum + 12.014 CH2O − 6.745 calcite − 2.575 dolomite − 6.007 H2S − 0.004 SiO2 − 39.662 exchange = NG9.
In summary, different zones have different hydrogeological conditions and different hydrogeochemical processes which likely dominate the groundwater chemical compositions. Though the calculations of mineral mass transfer vary with the choice of possible minerals [65], hydrogeochemical simulations have quantified the degree of influence of each hydrogeochemical process on the groundwater chemical evolution.

4. Conclusions

This study combined hydrogeochemical methods with geochemical modeling in an attempt to investigate the hydrogeochemical processes in the Nomhon area, northwest China. The following main conclusions can be drawn:
Stable isotopes (D and 18O) suggested that the groundwater in the study area originates primarily from atmospheric precipitation in the south mountainous areas, while the groundwater in the basin center was likely supplied by ancient water in cold and humid environments. Along the groundwater flow path, the TDS of the groundwater gradually increased from fresh to salty (462.50−19,604.40 mg/L), and the groundwater was from neutral to weakly alkaline. The concentrations of most major ions showed an increasing tendency and reached the maximum amount in the lacustrine plain, whereas SO42− exhibited a decreasing trend because of reduction reactions. On the basis of 18O, Cl, and Br, groundwater chemical variations were due to mineral dissolution/precipitation rather than evaporation. The hydrochemical type changed from Cl·HCO3–Na·Mg·Ca in the alluvial fan, to HCO3·Cl–Na and Cl·HCO3–Na in the alluvial–lacustrine plain, and finally to Cl–Na in the lacustrine plain. Ion relationship analysis suggested that mineral dissolution or precipitation, cation exchange, and redox are the major factors controlling the hydrochemistry. The mass balance modeling quantitatively revealed the predominant hydrogeochemical processes. This study enhanced understanding of the hydrochemical processes in the arid region and could be of use in the sustainable development and utilization of groundwater resources and could provide a reference for water resource research in other arid regions.

Author Contributions

G.W. devised the research; Z.S. contributed to the methods; D.Z., N.Y., W.J., L.G. and F.L. carried out the field work and data collection; N.Y. analyzed the data and prepared the manuscript draft; G.W., P.Z. and D.Z. modified this paper. All authors read and approved the final manuscript.

Funding

This research was funded by the National Natural Science Foundation of China (grant number: 41672243, U1602233, 41602266, 41272269) and the China Geological Survey Program (grant number: 1212011121277, DD20189270).

Conflicts of Interest

The authors declare no conflict of interest.

References

  1. Appelo, C.A.J.; Postma, D. Geochemistry, Groundwater and Pollution, 2nd ed.; August Aimé Balkema: Leiden, The Netherlands, 2004. [Google Scholar]
  2. Rattan, R.K.; Datta, S.P.; Chhonkar, P.K.; Suribabu, K.; Singh, A.K. Long-term impact of irrigation with sewage effluents on heavy metal content in soils, crops and groundwater—A case study. Agric. Ecosyst. Environ. 2005, 109, 310–322. [Google Scholar] [CrossRef]
  3. Suma, C.S.; Srinivasamoorthy, K.; Saravanan, K.; Faizalkhan, A.; Prakash, R.; Gopinath, S. Geochemical Modeling of Groundwater in Chinnar River Basin: A Source Identification Perspective. Aquat. Procedia 2015, 4, 986–992. [Google Scholar] [CrossRef]
  4. Shen, Z.L.; Zhu, W.H.; Zhong, Z.S. Basis of Hydrogeochemistry; Geology Press: Beijing, China, 1993. [Google Scholar]
  5. Sharif, M.U.; Davis, R.K.; Steele, K.F.; Kim, B.; Kresse, T.M.; Fazio, J.A. Inverse geochemical modeling of groundwater evolution with emphasis on arsenic in the Mississippi River Valley alluvial aquifer, Arkansas (USA). J. Hydrol. 2008, 350, 41–55. [Google Scholar] [CrossRef]
  6. Gastmans, D.; Chang, H.K.; Hutcheon, I. Groundwater geochemical evolution in the northern portion of the Guarani Aquifer System (Brazil) and its relationship to diagenetic features. Appl. Geochem. 2010, 25, 16–33. [Google Scholar] [CrossRef]
  7. Wang, G.C.; Duan, Q.; Chang, Y.S. Hydrogeochemical exploration methods for mine water hazard prevention and control. Chin. J. Geol. Hazard Control 2000, 11, 33–37. [Google Scholar]
  8. Simpson, H.J.; Herczeg, A.L. Stable Isotopes as an Indicator of Evaporation in the River Murray, Australia. Water Resour. Res. 1991, 27, 1925–1935. [Google Scholar] [CrossRef]
  9. Herczeg, A.L.; Simpson, H.J.; Mazor, E. Transport of soluble salts in a large semiarid basin: River Murray, Australia. J. Hydrol. 1993, 144, 59–84. [Google Scholar] [CrossRef]
  10. Adams, S.; Titus, R.; Pietersen, K.; Tredoux, G.; Harris, C. Hydrochemical characteristics of aquifers near Sutherland in the Western Karoo, South Africa. J. Hydrol. 2001, 241, 91–103. [Google Scholar] [CrossRef] [Green Version]
  11. Dessert, C.; Dupré, B.; François, L.M.; Schott, J.; Gaillardet, J.; Chakrapani, G.; Bajpai, S. Erosion of Deccan Traps determined by river geochemistry: Impact on the global climate and the 87Sr/86Sr ratio of seawater. Earth Planet. Sci. Lett. 2001, 188, 459–474. [Google Scholar] [CrossRef]
  12. Tizro, A.T.; Voudouris, K.S. Groundwater quality in the semi-arid region of the Chahardouly basin, West Iran. Hydrol. Process. 2008, 22, 3066–3078. [Google Scholar] [CrossRef]
  13. Beaucaire, C.; Gassama, N.; Tresonne, N.; Louvat, D. Geochemical evolution of saline waters in crystalline rocks: Chardon mine (France)—Part I: Behavior of main ions. In Water–Rock Interaction, Proceedings of the 8th International Symposium on Water–Rock Interaction, Vladivostok, Russia, 15–19 August 1995; Kharaka, Y.K., Chudaev, O.V., Eds.; A.A. Balkema: Rotterdam, The Netherlands, 1995; pp. 433–436. [Google Scholar]
  14. Subramani, T.; Rajmohan, N.; Elango, L. Groundwater geochemistry and identification of hydrogeochemical processes in a hard rock region, Southern India. Environ. Monit. Assess. 2010, 162, 123–137. [Google Scholar] [CrossRef] [PubMed]
  15. Gastmans, D.; Hutcheon, I.; Menegário, A.A.; Chang, H.K. Geochemical evolution of groundwater in a basaltic aquifer based on chemical and stable isotopic data: Case study from the Northeastern portion of Serra Geral Aquifer, São Paulo state (Brazil). J. Hydrol. 2016, 535, 598–611. [Google Scholar] [CrossRef]
  16. Bretzler, A.; Osenbrück, K.; Gloaguen, R.; Ruprecht, J.S.; Kebede, S.; Stadler, S. Groundwater origin and flow dynamics in active rift systems—A multi-isotope approach in the Main Ethiopian Rift. J. Hydrol. 2011, 402, 274–289. [Google Scholar] [CrossRef]
  17. Plummer, L.N.; Busby, J.F.; Lee, R.W.; Hanshaw, B.B. Geochemical modeling of the Madison Aquifer in parts of Montana, Wyoming and South Dakota. Water Resour. Res. 1990, 26, 1981–2014. [Google Scholar] [CrossRef]
  18. Dhiman, S.D.; Keshari, A.K. GIS assisted inverse geochemical modeling for plausible phase transfers in aquifers. Environ. Geol. 2006, 50, 1211–1219. [Google Scholar] [CrossRef]
  19. Bozau, E.; Häußler, S.; Berk, W.V. Hydrogeochemical modelling of corrosion effects and barite scaling in deep geothermal wells of the North German Basin using PHREEQC and PHAST. Geothermics 2015, 53, 540–547. [Google Scholar] [CrossRef]
  20. Li, P.; Wu, J.; Qian, H.; Zhang, Y.; Yang, N.; Jing, L.; Yu, P. Hydrogeochemical Characterization of Groundwater in and around a Wastewater Irrigated Forest in the Southeastern Edge of the Tengger Desert, Northwest China. Expo. Health 2016, 8, 331–348. [Google Scholar] [CrossRef]
  21. Walraevens, K.; Bakundukize, C.; Mtoni, Y.E.; Camp, M.V. Understanding the hydrogeochemical evolution of groundwater in Precambrian basement aquifers: A case study of Bugesera region in Burundi. J. Geochem. Explor. 2018, 188, 24–42. [Google Scholar] [CrossRef]
  22. Wang, D.S.; Ren, F.H. Groundwater Hydrochemical anomalies and genesis in Golmud Alluvial Fan. J. Changchun Univ. Geol. 1996, 26, 191–195. [Google Scholar]
  23. Tan, H.B.; Yu, S.S.; Liu, X.Q. Characteristics of trace element geochemistry in the middle and lower reaches of the Golmud River. J. Jilin Univ. (Earth) 2001, 31, 273–278. [Google Scholar]
  24. Zhu, P.C.; Xiao, S.S.; Zhang, S.G.; Huang, Y.; Yang, F.T.; Wei, X.U. Study on interaction relationship between surface water and groundwater in Nalenggele River. Yellow River 2014, 13, 239–240. [Google Scholar]
  25. Xu, W.D.; Wu, Y.J.; Liang, J.; Zheng, Y.F.; Liu, G.H.; Zhang, B.S. Hydrochemical characteristics and distribution of Nomhon area in southern margin of Qaidam Basin. J. Hebei Acad. Sci. 2009, 26, 63–66. [Google Scholar]
  26. Xiao, Y.; Shao, J.; Cui, Y.; Zhang, G.; Zhang, Q. Groundwater circulation and hydrogeochemical evolution in Nomhon of Qaidam Basin, northwest China. J. Earth Syst. Sci. 2017, 126, 26. [Google Scholar] [CrossRef]
  27. Sun, C.Y. Isotope Hydrogeology of Nomhon Area. Qinghai Land Resour. 1991, 1, 26–31. [Google Scholar]
  28. Yang, B.C.; Li, X.D.; Zhang, G.; Li, C.Z. Groundwater hydrochemical characteristics and evolution of the Nomhon River Basin. J. Northwest A F Univ. (Nat. Sci. Ed.) 2016, 44, 214–220. [Google Scholar]
  29. Cui, Y.; Liu, F.; Hao, Q.; Zhang, G. Study on hydrogen and oxygen isotope characteristics and renewal capacity of groundwater in Nomhon alluvial fan. Hydrogeol. Eng. Geol. 2015, 42, 1–7. [Google Scholar]
  30. Gonfiantini, R. Standards for stable isotope measurements in natural compounds. Nature 1978, 271, 534–536. [Google Scholar] [CrossRef]
  31. Plummer, L.N.; Prestemon, E.C.; Parkhurst, D.L. An Interactive Code (NETPATH) for Modeling NET Geochemical Reactions along a Flow PATH; Water-Resources Investigations Report 94-4169; U.S. Geological Survey: Reston, VA, USA, 1994; 130p.
  32. Parkhurst, D.L.; Charlton, S.R. NetpathXL—An Excel Interface to the Program NETPATH; Techniques and Methods 6-A26; U.S. Geological Survey: Reston, VA, USA, 2008; 11p.
  33. Park, S.C.; Yun, S.T.; Chae, G.T.; Yoo, I.S.; Shin, K.S. Regional hydrochemical study on salinization of coastal aquifers, western coastal area of South Korea. J. Hydrol. 2005, 313, 182–194. [Google Scholar] [CrossRef]
  34. Bertolo, R.; Hirata, R.; Sracek, O. Geochemistry and geochemical modeling of unsaturated zone in a tropical region in Urânia, São Paulo state, Brazil. J. Hydrol. 2006, 329, 49–62. [Google Scholar] [CrossRef]
  35. Feng, B.; Xiao, C.L.; Liang, X.J.; Fang, Z.; Li, Y.Q. Inverse geochemical simulation of water-rock reaction in western Jilin Province. Water Resour. Prot. 2009, 25, 1–37. [Google Scholar]
  36. Li, P.; Qian, H.; Wu, J.; Ding, J. Geochemical modeling of groundwater in southern plain area of Pengyang County, Ningxia, China. Water Sci. Eng. 2010, 3, 282–291. [Google Scholar]
  37. Herczeg, A.L.; Leaney, F.W. Review: Environmental tracers in arid-zone hydrology. Hydrogeol. J. 2011, 19, 17–29. [Google Scholar] [CrossRef]
  38. Gat, J.R.; Carmi, I. Evolution of the isotopic composition of atmospheric waters in the Mediterrane sea area. J. Geophys. Res. 1970, 75, 3039–3048. [Google Scholar] [CrossRef]
  39. Clark, I.D.; Fritz, P. Environmental Isotopes in Hydrogeology; Lewis Publishers: New York, NY, USA, 1997. [Google Scholar]
  40. Liu, F.; Cui, Y.; Zhang, G.; Geng, F.; Liu, J. Determination of groundwater age in the Nomhon area of Qaidam basin by using 3H and 14C methods. Geoscience 2014, 28, 1322–1328. [Google Scholar]
  41. Li, P.; Wu, J.; Qian, H. Hydrogeochemistry and quality assessment of shallow groundwater in the southern part of the Yellow River Alluvial Plain (Zhongwei Section), China. Earth Sci. Res. J. 2014, 18, 27–38. [Google Scholar] [CrossRef]
  42. Piper, A.M. A graphic procedure in the geochemical interpretation of water-analyses. Neurochem. Int. 1944, 25, 27. [Google Scholar] [CrossRef]
  43. Stumm, W.; Morgan, J.J. Aquatic Chemistry: Chemical Equilibria and Rates in Natural Waters, 2nd ed.; Wiley-Interscience: New York, NY, USA, 1996; p. 179. [Google Scholar]
  44. Xing, L.; Guo, H.; Zhan, Y. Groundwater hydrochemical characteristics and processes along flow paths in the North China Plain. J. Asian Earth Sci. 2013, 70–71, 250–264. [Google Scholar] [CrossRef]
  45. Raju, N.J.; Patel, P.; Reddy, B.; Suresh, U.; Reddy, T. Identifying source and evaluation of hydrogeochemical processes in the hard rock aquifer system: Geostatistical analysis and geochemical modeling techniques. Environ. Earth Sci. 2016, 75, 1157. [Google Scholar] [CrossRef]
  46. Hussein, M.T. Hydrochemical evaluation of groundwater in the Blue Nile Basin, eastern Sudan, using conventional and multivariate techniques. Hydrogeol. J. 2004, 12, 144–158. [Google Scholar] [CrossRef]
  47. Jankowski, J.; Acworth, R.I. Impact of depris-flow deposits on hydrogeochemical processes and the development of dryland salinity in the Yass River catchment, New South Wales. Aust. Hydrogeol. J. 1997, 5, 71–88. [Google Scholar] [CrossRef]
  48. Dogramaci, S.; Skrzypek, G.; Dodson, W.; Grierson, P.F. Stable isotope and hydrochemical evolution of groundwater in the semi-arid Hamersley Basin of sub-tropical northwest Australia. J. Hydrol. 2012, 475, 281–293. [Google Scholar] [CrossRef]
  49. Wu, J.; Sun, Z. Evaluation of Shallow Groundwater Contamination and Associated Human Health Risk in an Alluvial Plain Impacted by Agricultural and Industrial Activities, Mid-west China. Expo. Health 2015, 8, 1–19. [Google Scholar] [CrossRef]
  50. Schoeller, H. Qualitative evaluation of groundwater resources. In Methods and Techniques of Groundwater Investigation and Development; Water Research Series-33; UNESCO: Delft, The Netherlands, 1965; pp. 54–83. [Google Scholar]
  51. García, G.M.; Hidalgo, M.D.V.; Blesa, M.A. Geochemistry of groundwater in the alluvial plain of Tucumán province, Argentina. Hydrogeol. J. 2001, 9, 597–610. [Google Scholar] [CrossRef]
  52. Ahmed, M.A.; Samie, S.G.; Badawy, H.A. Factors controlling mechanisms of groundwater salinization and hydrogeochemical processes in the Quaternary aquifer of the Eastern Nile Delta, Egypt. Environ. Earth Sci. 2013, 68, 369–394. [Google Scholar] [CrossRef]
  53. Fisher, R.S.; Mullican, W.F., III. Hydrochemical evolution of sodium-sulfate and sodium-chloride groundwater beneath the Northern Chihuahuan Desert, Trans-Pecos, Texas, USA. Hydrogeol. J. 1997, 5, 4–16. [Google Scholar] [CrossRef]
  54. Fontes, J.C.; Yousfi, M.; Allison, G.B. Estimation of long-term, diffuse groundwater discharge in the northern Sahara using stable isotope profiles in soil water. J. Hydrol. 1986, 86, 315–327. [Google Scholar] [CrossRef]
  55. Park, J.; Bethke, C.M.; Torgersen, T.; Johnson, T.M. Transport modeling applied to the interpretation of ground-water 36C1 age. Water Resour. Res. 2002, 38, 1-1–1-15. [Google Scholar] [CrossRef]
  56. Cartwright, I.; Weaver, T.R.; Fifield, L.K. Cl/Br ratios and environmental isotopes as indicators of recharge variability and groundwater flow: An example from the southeast Murray Basin, Australia. Chem. Geol. 2006, 231, 38–56. [Google Scholar] [CrossRef]
  57. Kloppmann, W.; Négrel, P.; Casanova, J.; Klinge, H.; Schelkes, K.; Guerrot, C. Halite dissolution derived brines in the vicinity of a Permian salt dome (N German Basin). Evidence from boron, strontium, oxygen, and hydrogen isotopes. Geochim. Cosmochim. Acta 2001, 65, 4087–4101. [Google Scholar] [CrossRef]
  58. Cartwright, I.; Weaver, T.R.; Fulton, S.; Nichol, C.; Reid, M.; Cheng, X. Hydrogeochemical and isotopic constraints on the origins of dryland salinity, Murray Basin, Victoria, Australia. Appl. Geochem. 2004, 19, 1233–1254. [Google Scholar] [CrossRef]
  59. Boukhari, K.; Fakir, Y.; Stigter, T.Y.; Hajhouji, Y.; Boulet, G. Origin of recharge and salinity and their role on management issues of a large alluvial aquifer system in the semi-arid Haouz plain, Morocco. Environ. Earth Sci. 2015, 73, 6195–6212. [Google Scholar] [CrossRef]
  60. Sahib, L.Y.; Marandi, A.; Schüth, C. Strontium isotopes as an indicator for groundwater salinity sources in the Kirkuk region, Iraq. Sci. Total Environ. 2016, 562, 935–945. [Google Scholar] [CrossRef] [PubMed]
  61. Carre, J. Geochemistry of Strontium in Groundwater and Surface Water of Paris Region. Ph.D. Thesis, University of Paris VI, Paris, France, 1975. [Google Scholar]
  62. Parkhurst, D.L.; Appelo, C. User’s Guide to PHREEQC—A Computer program for Speciation, Batch-Reaction, One-Dimensional Transport, and Inverse Geochemical Calculations; Water Resources Investigations Report 99-4259; U.S. Geological Survey: Reston, VA, USA, 1999.
  63. Zang, H.; Zheng, X.; Jia, Z.; Chen, J.; Qin, Z. The impact of hydrogeochemical processes on karst groundwater quality in arid and semiarid area: A case study in the Liulin spring area, north China. Arab. J. Geosci. 2015, 8, 1–13. [Google Scholar] [CrossRef]
  64. Güler, C.; Thyne, G.D. Hydrologic and geologic factors controlling surface and groundwater chemistry in Indian Wells-Owens Valley area, southeastern California, USA. J. Hydrol. 2004, 285, 177–198. [Google Scholar] [CrossRef]
  65. Lee, H.; Koo, M.H.; Kim, K.; Kim, Y. Spatio-Temporal Variations in Stream-Aquifer Interactions Following Construction of Weirs in Korea. Ground Water 2016, 54, 448. [Google Scholar] [CrossRef] [PubMed]
Figure 1. Map of study area and sampling locations.
Water 10 01667 g001
Figure 2. Geological cross section (A–A’ in Figure 1).
Water 10 01667 g002
Figure 3. The relationship between δD and δ18O in the study area. 1. River, 2. Groundwater in Zone 2, 3. Groundwater in Zone 3, 4. Groundwater in Zone 4.
Water 10 01667 g003
Figure 4. Piper diagram of water samples. 1. River, 2. Groundwater in Zone 2, 3. Groundwater in Zone 3, 4. Groundwater in Zone 4.
Water 10 01667 g004
Figure 5. Variation of major ion components in the groundwater along flow path A–A’ in the Figure 1 ((ae) and frepresent relative distance vs. Na+, Ca2+, Mg2+, HCO3, Cl and SO42−, respectively).
Water 10 01667 g005
Figure 6. Stability field diagrams of aluminosilicate mineral (a) in K2O-Al2O3-SiO2-H2O system (b) in Na2O-Al2O3-SiO2-H2O system (c) in CaO-Al2O3-SiO2-H2O system (d) in MgO-Al2O3-SiO2-H2O system.
Water 10 01667 g006
Figure 7. Relationships between different ions in groundwater (a) Na+ vs. Cl (b) (Ca2+ + Mg2+) vs. (SO42− + HCO3) (c) (Ca2+ + Mg2+) vs. HCO3 (d) Ca2+ vs. SO42−.
Water 10 01667 g007
Figure 8. Plot of cation exchange (a) CAI-1 vs. CAI-2 (b) (Na+ + K+ − Cl) vs. [(Ca2+ + Mg2+) − (HCO3 + SO42−)].
Water 10 01667 g008
Figure 9. Plot of δ18O vs. TDS (a) and Br/Cl vs. Cl (b) in groundwater.
Water 10 01667 g009
Figure 10. Plot of Sr concentration with Ca2+ (a) and SO42− (b) in groundwater.
Water 10 01667 g010
Table 1. Hydrochemical data from the study area.
Site No.NR1NR2NR3NG1NG2NG3
Type 1RRRGWGWGW
Temperature (°C)14.2113.3022.5319.589.009.60
pH8.018.428.167.927.657.90
EC (us/cm)2921.50n.a. 31028.00833.80995.50958.60
TDS (mg/L)579.84596.34637.51552.65620.96628.44
K+ (mg/L)3.503.503.8010.5010.0011.00
Na+ (mg/L)80.0081.8094.4071.8079.6079.40
Ca2+ (mg/L)65.0960.1266.6942.0051.7851.94
Mg2+ (mg/L)26.7427.2229.5633.1537.5333.64
HCO3 (mg/L)146.44152.54140.34152.54170.85195.25
Cl (mg/L)140.11142.66159.11138.41161.38141.25
SO42− (mg/L)100.20108.50123.4080.8091.9094.50
Al (mg/L)0.0480.0430.0450.0240.0290.028
Si (mg/L)7.947.188.2010.1311.3711.45
Br (mg/L)0.20<0.100.150.210.100.11
Sr2+ (mg/L)0.650.640.690.730.881.04
δD (‰)−73.95−73.57−70.55−75.85−77.67−73.91
δ18O (‰)−10.87−10.89−10.73−11.33−11.62−10.87
Site No.NG4NG5NG6NG7NG8NG9
Type 1GWGWGWGWGWGW
Temperature (°C)11.039.4111.71n.a. 312.9413.67
pH8.317.908.038.357.827.21
EC (us/cm)883.90748.80700.60795.0011,310.0031,620.00
TDS (mg/L)598.41491.65462.50622.106515.2019,604.40
K+ (mg/L)6.005.004.102.407.808.60
Na+ (mg/L)86.9062.5081.10164.201779.305449.10
Ca2+ (mg/L)46.6542.9729.8212.87355.271068.69
Mg2+ (mg/L)31.1124.6917.697.00164.21522.56
HCO3 (mg/L)195.25164.75140.34244.07347.80329.492
Cl (mg/L)120.5499.8495.58117.003793.4712,195.83
SO42− (mg/L)84.8073.1068.6061.9050.1014.20
Al (mg/L)0.0260.0270.0200.0180.1700.370
Si (mg/L)11.8111.4112.239.07115.0062.50
Br (mg/L)0.190.110.120.101.094.48
Sr2+ (mg/L)0.830.710.710.3417.9454.19
δD (‰)−75.47−75.5−80.91−85.22−92.00−92.00
δ18O (‰)−11.14−11.13−11.70−12.38−12.50−11.90
1 R: river; GW: groundwater. 2 EC: electrical conductivity. 3 n.a.: not analyzed.
Table 2. Mineral saturation index in groundwater.
Site No.NG1NG2NG3NG4NG5NG6NG7NG8NG9
SIcalcite0.22−0.090.200.620.110.060.210.980.64
SIdolomite0.61−0.240.321.200.090.040.301.811.20
SIgypsum−2.31−2.28−2.26−1.87−2.4−2.54−2.97−2.24−2.68
SIhalite−6.57−6.46−6.52−6.54−6.76−6.66−6.28−3.87−2.95
SIalbite−1.63−0.56−0.68−0.74−0.78−0.86−0.964.164.18
SIanorthite−3.07−2.38−2.45−2.58−2.52−2.95−3.671.542.00
SISiO20.290.520.500.480.500.490.370.111.23
SIkaolinite2.975.304.653.514.573.82.897.758.98
Table 3. Mineral transfer amount (unit: mmol/L).
PathNG5–NG7NG7–NG8NG8–NG9
NaCl0.485104.886243.195
Calcite−16.541−6.745
Dolomite−0.728−2.575
Gypsum9.5405.633
Albite3.894
Anorthite0.004
Chlorite1.156
Kaolinite−5.853
SiO2−3.407−0.004
CH2O19.55212.014
H2S−0.117−9.776−6.007
CO22.677
Exchange0.024−14.851−39.662
–: data not available.

