Hydraulic Jump and Resultant Flow Choking in a Circular Sewer Pipe of Steep Slope


Department of Building, Civil and Environmental Engineering, Concordia University, 1455 de Maisonneuve Boulevard West, Montreal, QC H3G 1M8, Canada
*
Author to whom correspondence should be addressed.
Water 2018, 10(11), 1674; https://doi.org/10.3390/w10111674
Submission received: 23 October 2018
/
Revised: 11 November 2018
/
Accepted: 13 November 2018
/
Published: 16 November 2018
(This article belongs to the Section Hydraulics and Hydrodynamics)
Abstract
:Urban flood caused by storm-water runoff has been problematic for many regions. There is a need to improve the design and hydraulic performance of storm sewer-pipes, which will help reduce the impact of urban flood. Such a need has motivated the current study. This paper investigates the flow behaviour in a circular pipe of steep slope, in which supercritical flow descends the steep terrain and forms a hydraulic jump under control acting downstream. So far, the jump behaviour and resultant flow choking in a circular pipe are poorly understood. This paper formulates the problem of the hydraulic jump in a circular pipe of slope on the basis of the momentum principle and solves it by using iterative methods. The solutions include the filling ratio and flow field downstream of an undular jump and a direct jump. For the first time, the Froude number’s dependence on the pipe slope has been quantified. For a given slope, it is possible to have two different filling ratios (or equivalently discharges) that associate with the same Froude number value. This paper reports detailed results of the initial versus sequent depth of the hydraulic jumps and quantitatively delineates the slope-filling ratio space between flow-choking and choking-free zones. For the design of storm sewers in a hilly area, it is necessary to correct the current design guidelines, which rely mostly on the uniform flow theory and suggest filling ratios as high as 85%. The corrections are either decreasing the filling ratio or increasing the pipe diameter to achieve choking-free flow in a circular pipe.
1. Introduction
Storm-water flood has been a recurring problem for many urban regions around the world [1,2,3,4]. The impact of a large flood can be the loss of life, and severe damage of properties, infrastructures, and the built environment. Even a small flood in urban regions can have serious repercussions, including an immediate interruption of urban transportation systems and human activities. Consequences can also include pollution due to organic compounds and heavy metals in the sediments from storm-water sewer pipes [5]. Among causes of urban floods are the inefficiency and poor performance of storm-water sewer pipe networks [1,6]. Thus, improving the design and hydraulic performance of the pipe networks will help reduce the impact of urban flood. This entails a good understanding of the behaviour of free surface flow in the pipe (Figure 1).
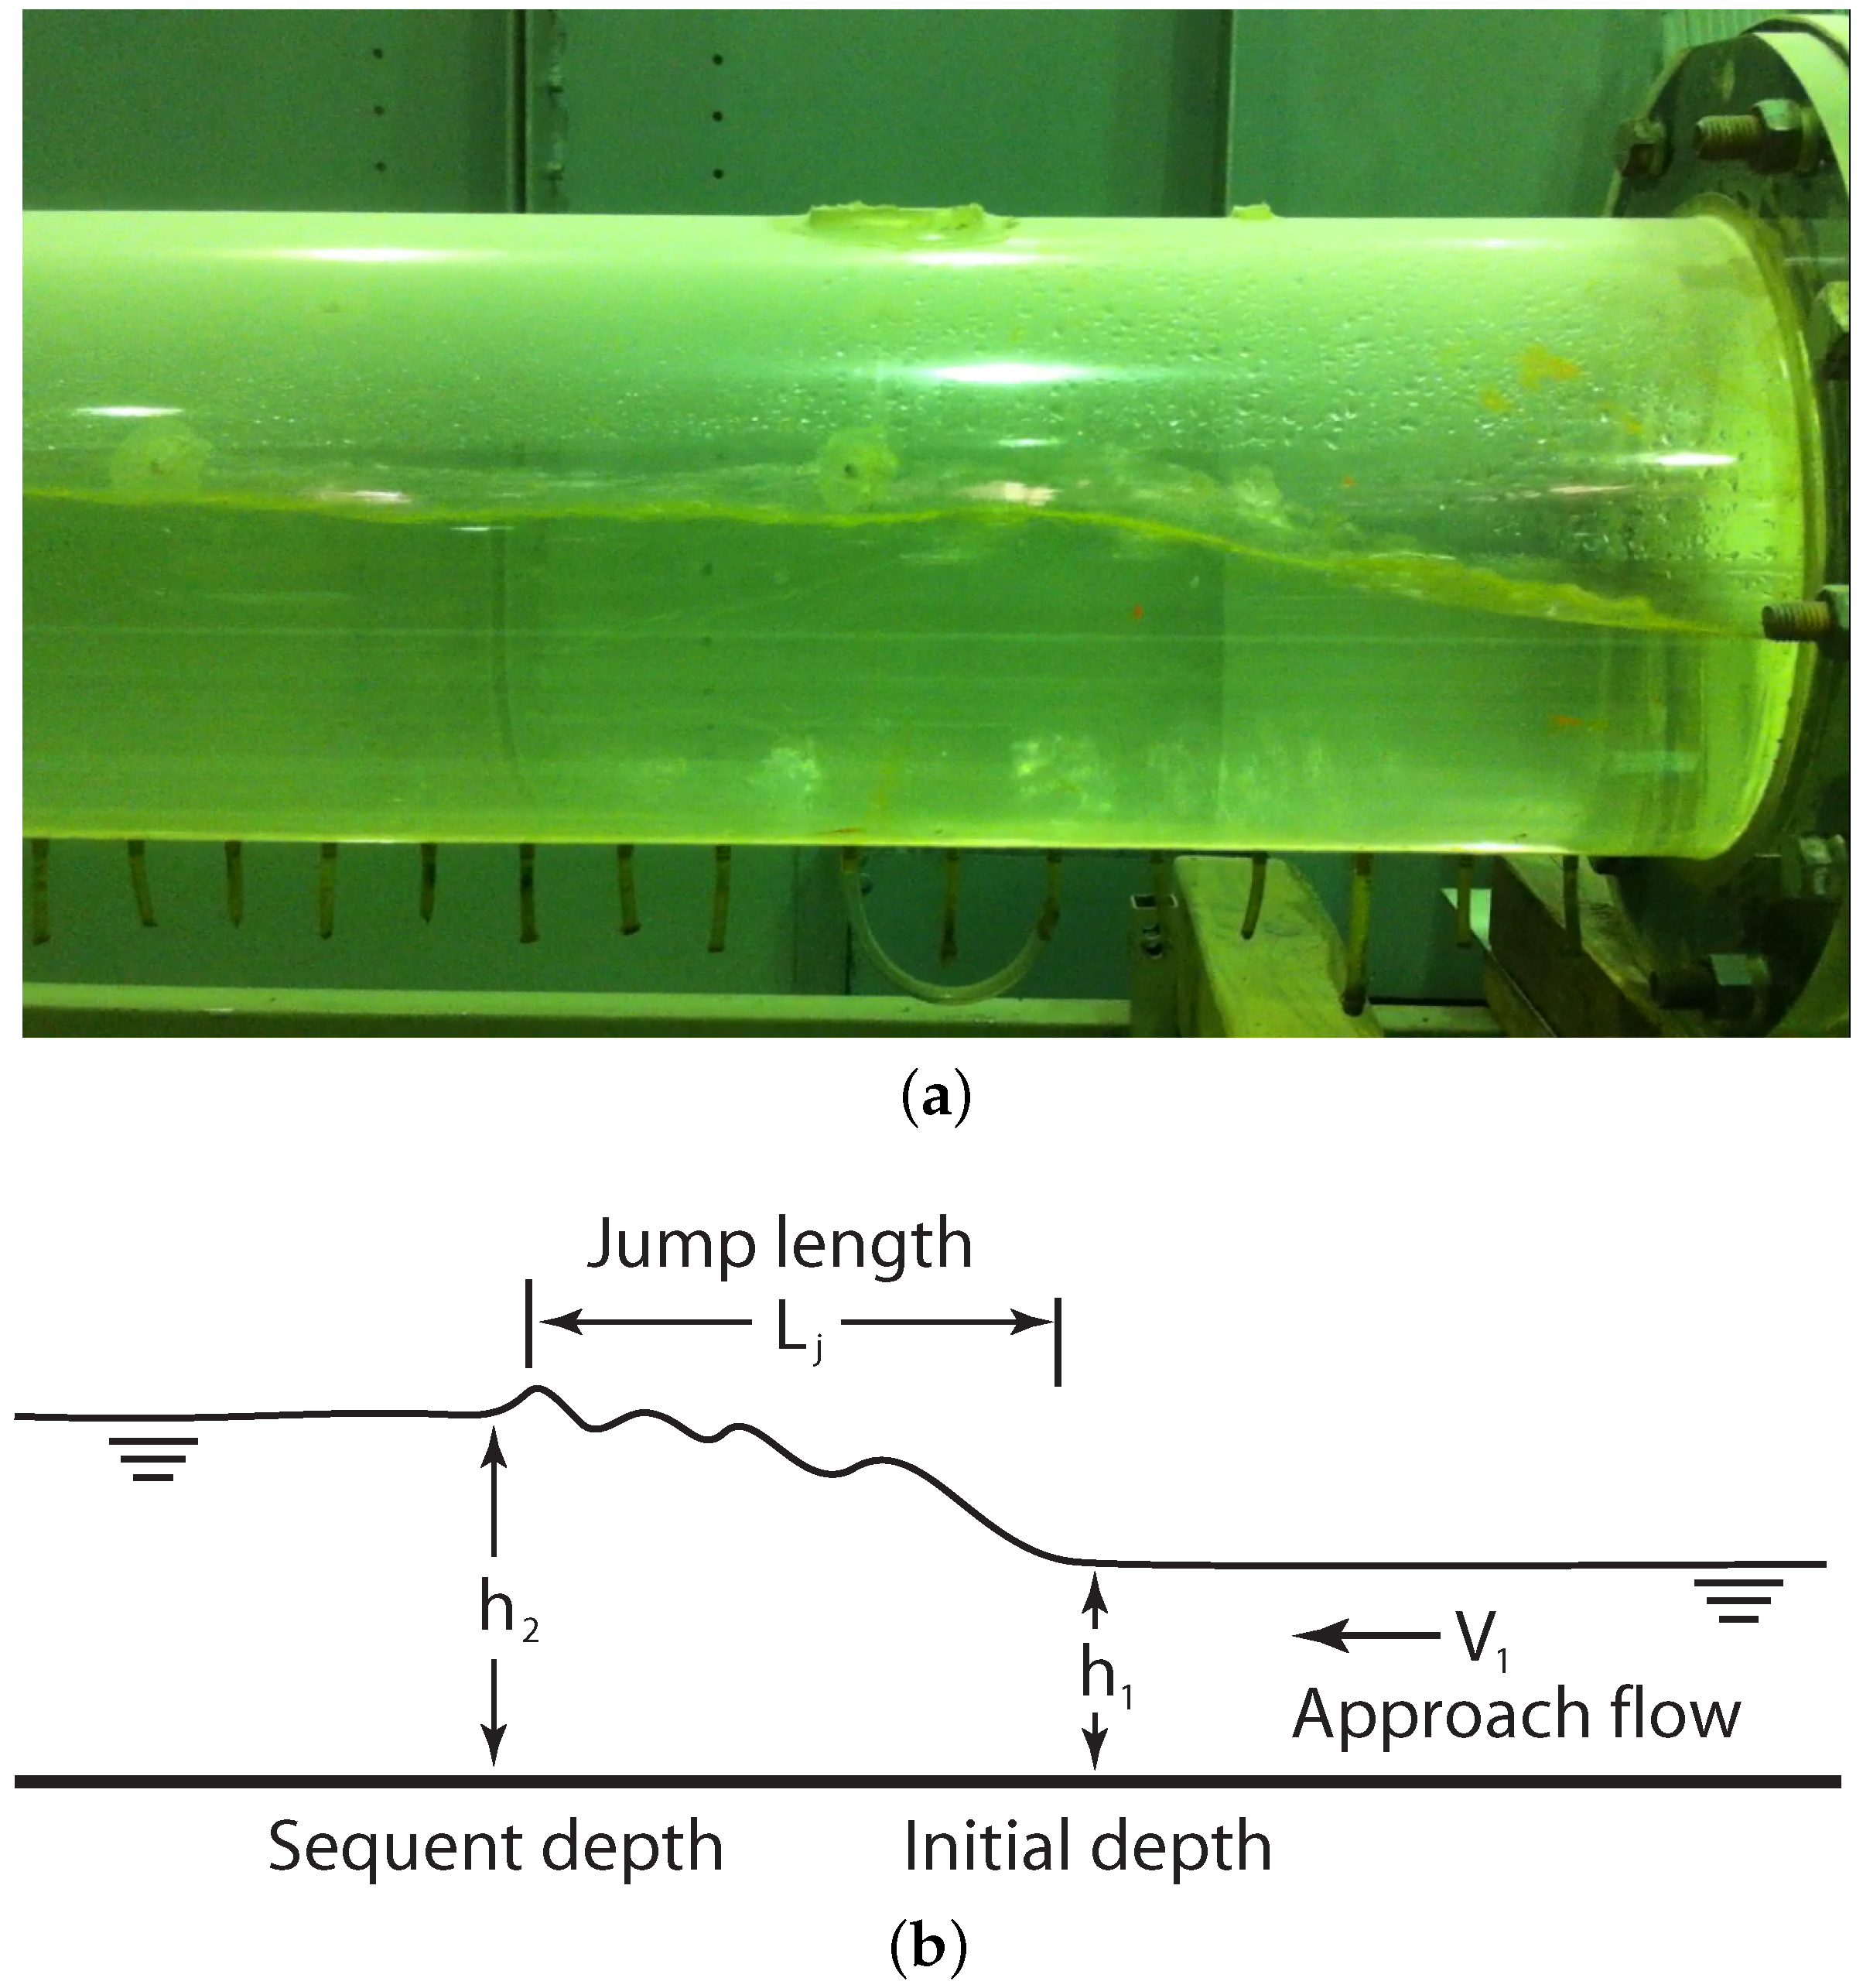
The focus of this paper is on the behaviour of flow in a circular pipe of steep slope. The context is that the pipe flow is supercritical while descending the steep terrain; under a certain control at downstream the flow regime changes from a supercritical to subcritical stage. Such change is sudden, involving the phenomenon of hydraulic jump (Figure 2a). This phenomenon is known to create turbulence, dissipate flow energy [7], and entrain air [8]. All the associated phenomena mentioned above affect the sewer’s hydraulic performance. The need for the current study is two-fold: (1) to explore the dependence of undular and direct hydraulic jumps in a circular pipe on pipe slope; (2) to quantify the effects of the hydraulic jumps on the filling ratio of sewer pipe flow. The current knowledge of hydraulic jumps in a circular pipe is far from being complete. The current practice in storm-water sewer design has been limited to the accommodation of uniform flow, ignoring possible occurrences of hydraulic jumps.
It is of practical relevance to consider steep pipe slopes. In reality, numerous cities have storm-water sewer pipes laid over a steep slope [9]. They rely on sewer networks to collect and remove storm-water runoff from the ground surfaces rapidly. The discharge capacity of sewer pipes is an important design parameter, and must meet the requirement of discharge of a given return period, in order to avoid surcharging or flooding. On the basis of the Manning formula, the discharge carried by a circular pipe depends on its diameter, pipe slope, and friction resistance [10]. In the most current design practice, calculations of required pipe diameter are based on assumed uniform flow with a filling ratio of about 85% [10,11,12]. This design concept is only applicable to subcritical flow.
Supercritical flow is susceptible to perturbations, which can result from such conditions as changes in pipe direction and slope, sewer junctions, or sewer sedimentation [13,14,15,16], and can trigger a hydraulic jump (Figure 2). If the sequent depth of the hydraulic jump is larger than the pipe diameter or the flowing water comes in contact with the sewer soffit, flow choking will occur. The result is a sudden and abrupt transition from free surface flow to pressurised flow, which should be avoided in the design of sewer pipes. For given constant values of discharge and pipe diameter, the steeper the pipe slope, the higher the risk of flow choking. The current design practice is to set the filling ratio threshold at . Should this threshold be lowered for pipes of steep slope in order to reduce the risk? To what extent should it be lowered for a given pipe slope? So little has been explored regarding the hydraulic jump in a circular pipe [12,17]. Let alone the hydraulic jump in a circular pipe of steep slope. This is despite extensive studies of hydraulic jumps reported in the literature.
In fact, the vast majority of the existing studies have dealt with the hydraulic jump in a horizontal rectangular channel. The basic characteristics of the hydraulic jump, such as the sequent depth, the type of jumps, the jump length and energy loss, were theoretically and experimentally investigated by Safranez [18], Bakhmeteff and Matzke [19], and Forster and Skrinde [20]. Chow [7] and Hager [21] summarised these studies. Classic studies apply the fundamental laws of momentum and mass conservations in the computation of the sequent depth. The friction force is assumed to be negligible, given that the jump length is short. In the absence of other external forces acting on the flow than the pressure forces, applying the fundamental laws leads to the well-known equation of the hydraulic jump in a horizontal rectangular channel
where is the initial depth; is the sequent depth; is the upstream Froude number, evaluated at the initial depth section (Figure 2b). Please note that Equation (1) is invalid in cases of water flowing down a slope. It needs corrections for the weight of the block (between and sections) of water resolved down the slope.
Previously, many researchers focused on flow properties of the hydraulic jump in a horizontal rectangular channel. The flow conditions of undular jumps were classified, and the main flow characteristics were investigated by Chanson and Montes [22], Montes and Chanson [23], and Ohtsu et al. [24]. Chanson [25] provided a review of relatively recent advances in studying turbulent hydraulic jumps by means of laboratory experiments. Chanson and Brattberg [26] studied the air-water flow properties in the developing shear layer. Valiani [27] applied the integral balance of linear momentum and angular momentum in a stationary hydraulic jump. Gharangik and Chaudhry [28] demonstrated that the Boussinesq terms have no effect on the result of jump location using a fourth-order model. Molls and Molls [29] solved the and Saint-Venant equations of hydraulic jump by using an explicit two-step numerical scheme.
Earlier studies of hydraulic jumps in sloping rectangular channels were inspired by the application of spillways and stilling basins. These structures involve a sloping surface upstream and a horizontal surface downstream. The first theoretical approach was presented by Ellms [30]. The first systematic study was conducted by Bakhmeteff and Matzke [31]. Kindsvater [32] classified the jumps into four categories based on the toe position and jump location. Type D-jump, formed entirely on the sloping surface, is of particular interest to the current study. Further studies of type D-jump were conducted by Rajaratnam [33], Ohtsu and Yasuda [34], and Gunal and Narayanan [35]. Gotoh et al. [36] demonstrated that the first wave height for an undular hydraulic jump is independent of channel slope. Beirami and Chamani [37] suggested that scale effects could be neglected for jumps of small initial depths.
All the studies mentioned above were related to a rectangular channel, little attention has been paid to the hydraulic jump in a circular conduit. Stahl and Hager [17], Reinauer and Hager [38], and Gargano and Hager [12] explored the formation of hydraulic jump in a horizontal circular pipe. They proposed empirical equations for the height and length of the jump. There are two main differences between hydraulic jumps in a circular conduit and in a rectangular channel: (1) the upstream filling ratio plays a more important role in the former than in the latter, and (2) the circular conduit flow can be choked in the presence of hydraulic jumps. To the best of our knowledge, no prior study has explored the flow properties of the hydraulic jump in a sloping circular pipe.
The Froude number is a key parameter in the problem of hydraulic jump. Depending on its values, jumps exhibit distinct characteristics. They are classified into two different types: (1) undular hydraulic jumps; (2) direct hydraulic jumps. Undular hydraulic jumps appear as two-dimensional undulations without cross waves at low Froude numbers (, as the non-breaking waves with three-dimensional structures when , and as breaking undulations when reaches a certain limiting value . When reaches a certain higher limiting value , undular hydraulic jumps no longer exist and direct hydraulic jumps form. There has been no general consensus on what the two limiting values are precisely. Montes and Chanson [23] suggested that undular jumps in open channel are highly sensitive to the channel-bottom slope and boundary roughness. Stahl and Hager [17] reported and for a circular pipe laid horizontally. For a steep pipe, Gotoh et al. [36]’s experimental results indicated that the value of decreases as the bottom slope increases. According to Montes and Chanson [23], the limiting values decrease with an increase in the aspect ratio of a rectangular channel. This paper treats the two different types of jumps with different formulations.
The remaining part of this paper describes the methods for calculating undular, direct and incomplete hydraulic jumps in Section 2. The methods use the momentum principle and incorporate the effect of pipe slope. The results of filling ratio and flow choking from the calculations are presented and discussed in Section 3. This section includes validations of the results using data from other independent sources as well as suggestions for an improved sewer design. This is followed by conclusions drawn in Section 4.
2. Methods
2.1. Geometric Elements of Sewer Pipe Flow
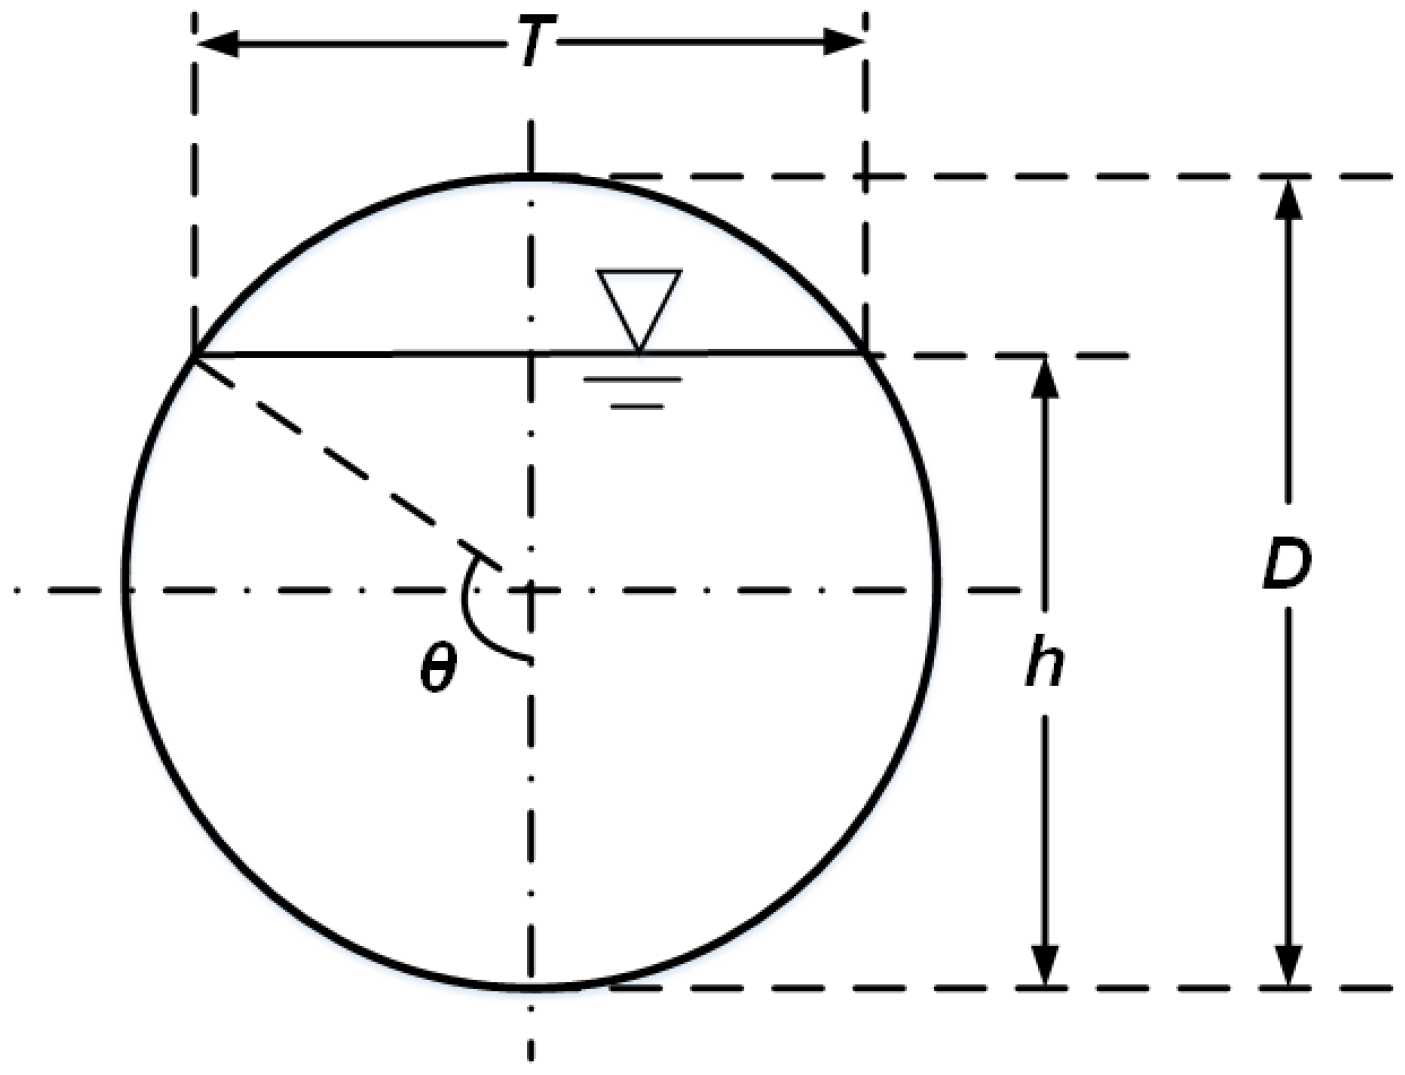
Consider the flow of water in a circular sewer pipe. A definition diagram of a pipe section flowing partially full is given in Figure 1. Let h denote the depth of flow and D denote the pipe diameter. The filling ratio is evaluated as
The corresponding angle is . The value of or means that the pipe flows full. In other words, the flowing water comes in contact with the soffit of the pipe. This condition is undesirable. The filling ratio or equivalently the corresponding angle is an important parameter in the design of diameters and slopes of sewer pipes.
For given values of and D, one finds the flow area, A, hydraulic depth, d, hydraulic radius, R, and wetted perimeter, P, to be
2.2. Conditions of the Approach Flow
Assume that the approach flow (Figure 1, Figure 2b) in a pipe section can be treated as uniform flow. It follows that the discharge, Q, is given by the Manning formula , where n is Manning’s roughness coefficient, and S is the longitudinal slope of the pipe. Using the results given in Equations (3) and (6), the Manning formula gives
The Froude number, defined as , is an important dimensionless parameter, where V is the cross-sectionally averaged flow velocity, given by ; g is the gravitational acceleration. This parameter classifies the condition of approach flow as supercritical if , critical if , or subcritical if . Substituting Equations (4) and (5) into the definition gives
The current study deals with situations where , where the subscript 1 refers to the approach flow. Possibilities exist for a hydraulic jump to take place in the sewer pipe in question (Figure 2a). The approach flow is dominated by inertial forces and behaves as a rapid or unstable flow. The flow condition can change from a supercritical to subcritical state, abruptly and discontinuously through a hydraulic jump. This will have adverse influences on the hydraulic performance of the sewer network. Equation (8) should give reliable estimates of the Froude number. The challenge is that it involves a list of input parameters. These include Manning’s roughness coefficient, which changes with changing flow conditions [7]. For this reason, it is complicated to use the equation, and it might cause uncertainties. Hager [13] proposed a simplified equation for estimates of the Froude number
Since accurate estimates of the Froude number of the approach flow (Figure 2b) are important, the current study will provide a comparison of results between Equations (8) and (9). Previous studies [7,23,36] concluded that hydraulic jumps of different characteristics are possible to occur in a sloping sewer pipe, depending on the approach flow Froude number. The current study covers three types of jumps: (1) undular hydraulic jump; (2) direct hydraulic jump; and (3) incomplete hydraulic jump, as discussed below.
2.3. Undular Hydraulic Jump
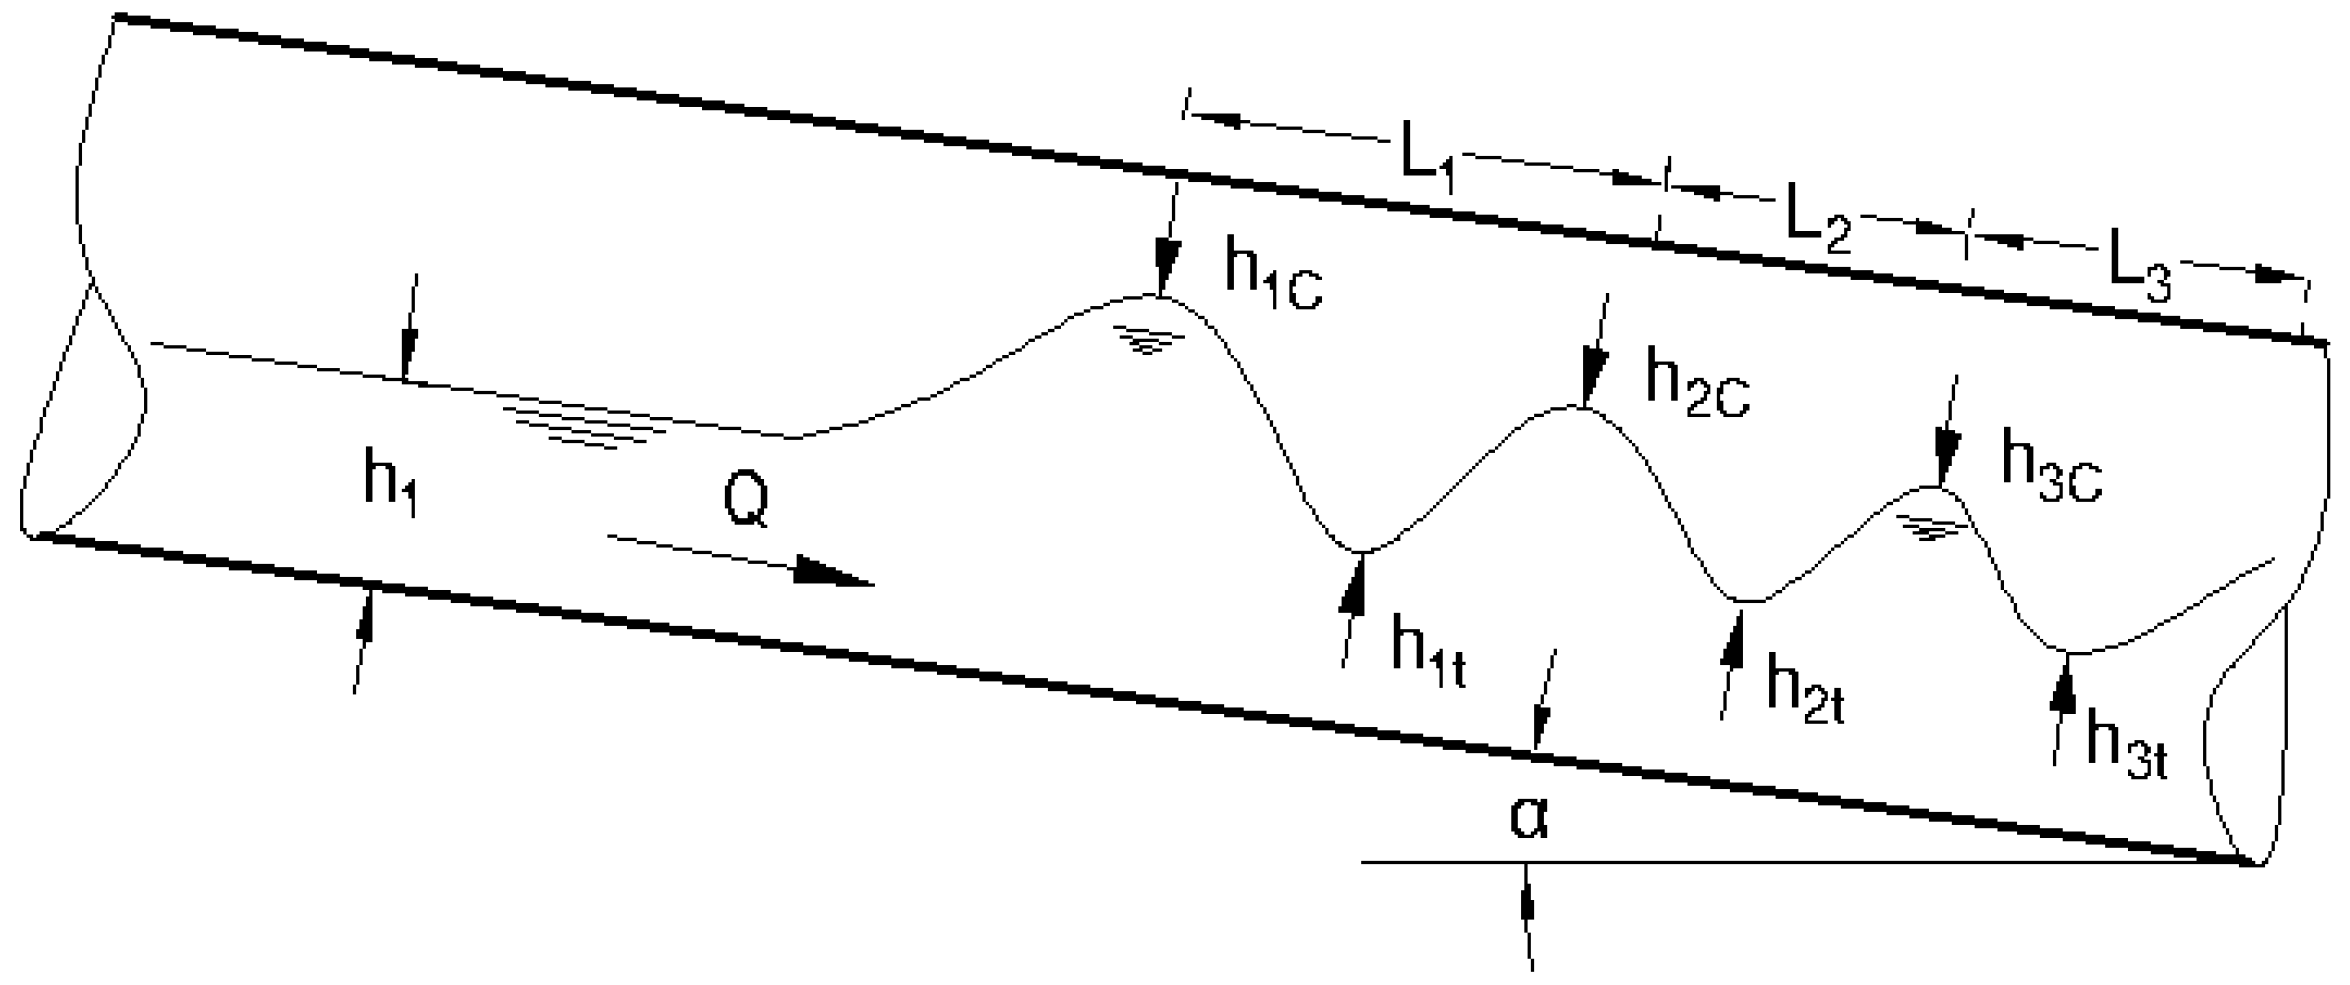
Undular hydraulic jumps (Figure 3) are undulations of the water surface without surface rollers [7]. For this type of jumps, streamline curvature as well as friction have important dynamic influences [39]. Channel sidewalls also produce important effects, resulting in rapidly growing wall boundary layers, and shock waves [23].
Undular hydraulic jumps associate with low Froude numbers of supercritical approach flow. At , the jumps are a weakly undular jump, with two-dimensional undulations without cross waves. At , where is a certain limiting value, non-breaking cross waves develop, giving rise to three-dimensional surface structures. At , where is an upper limit, the undulations break at the centre line on the upstream side. On the basis of previous studies [17,23,36], the current study adopts a value of for for calculations of undular hydraulic jumps.
Our calculations focus on obtaining the depth of flow at the first wave crest, , and determining whether the crest reaches the soffit of the sewer pipe (Figure 3). The elevation of the first wave crest is the highest among the wave crests after the jump and has the potential to cause flow choking [13]. It is extremely difficult, if not impossible, to obtain analytical solutions to the wave crests of a undular hydraulic jump in a sloping circular pipe. Gargano and Hager [12] proposed an empirical formula for
where the subscript 1 in the Froude number and filling ratio refers to evaluations of the parameters at the approach flow section or the section in Figure 3. Please note that the derivation of Equation (10) is based on data from a circular pipe laid horizontally. However, the depth of flow at the first wave crest is independent of pipe slope [36]. This justifies the application of Equation (10), in the current study, to an inclined circular pipe, with an inclination angle > 0.
2.4. Direct Hydraulic Jump
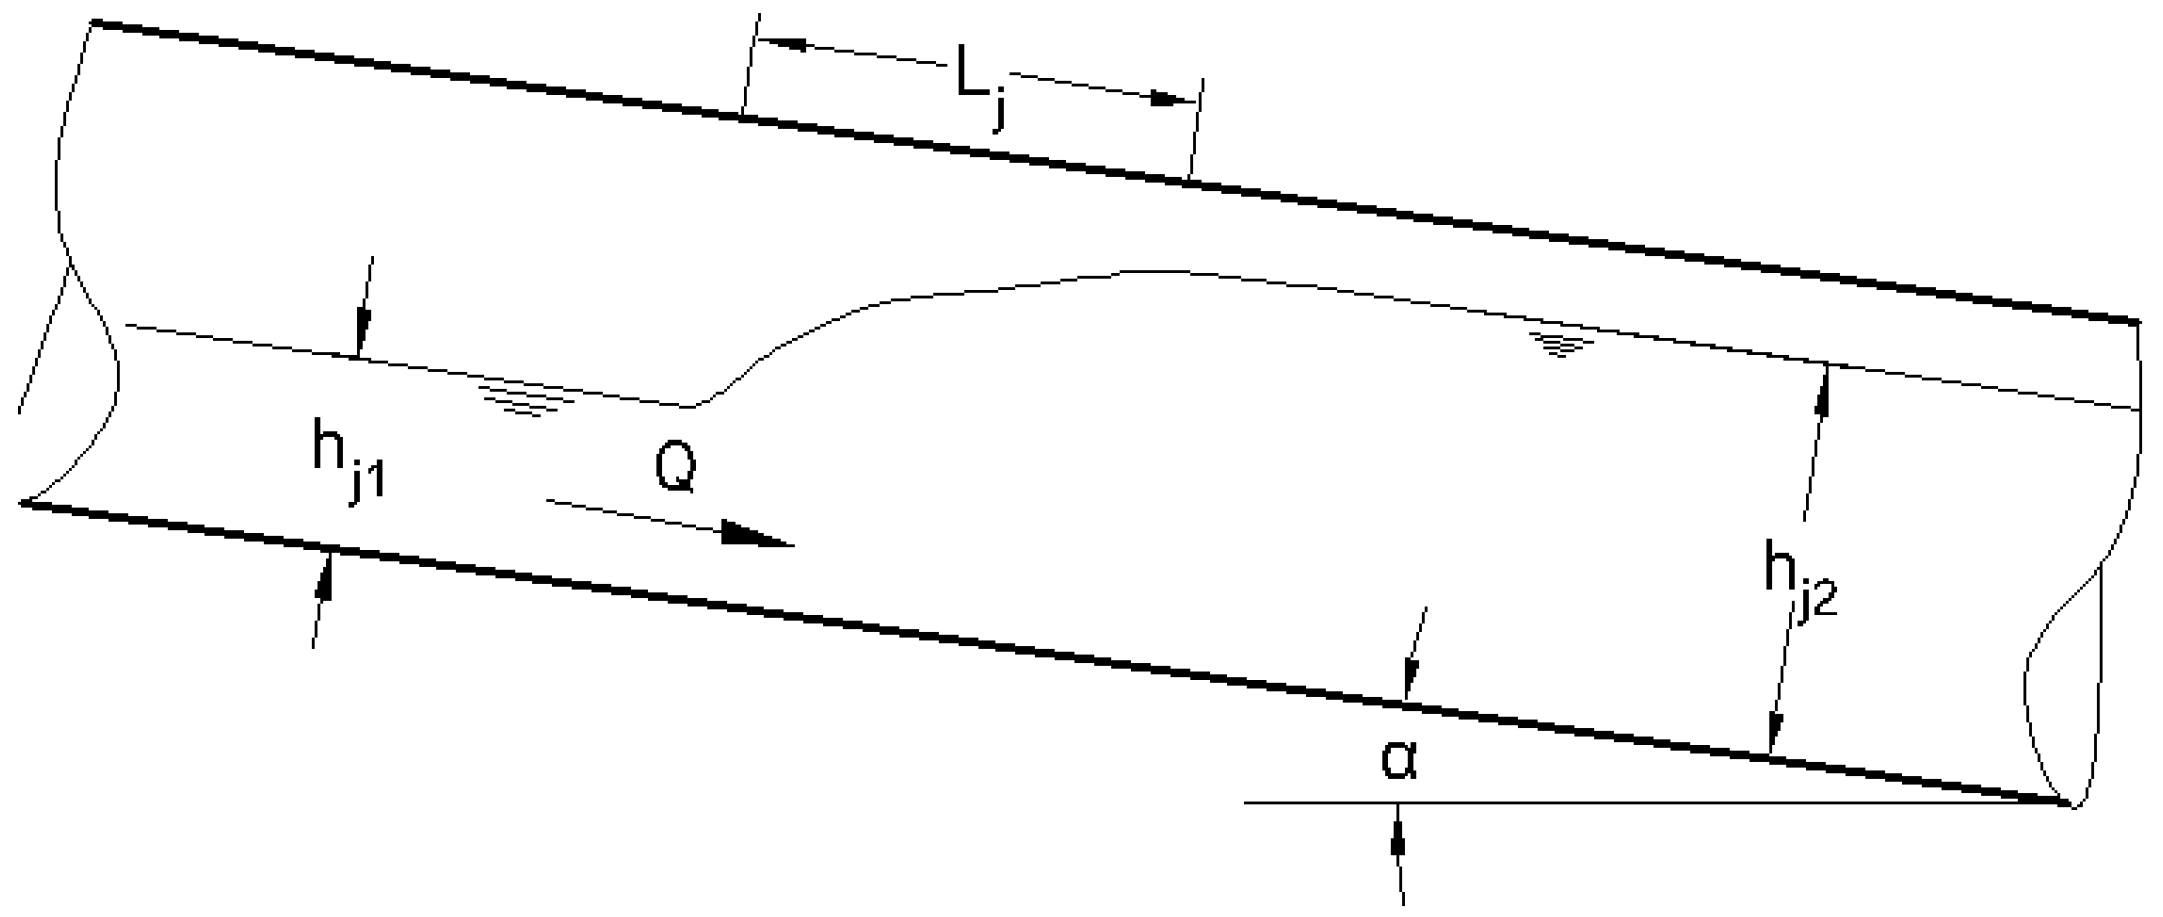
A direct hydraulic jump is illustrated in Figure 4. The depth of flow is before the jump, and after the jump. The length of the jump is . In the current study, the concern is the condition of flow choking, which occurs when is greater than the pipe diameter D.
The formulation of the hydraulic jump problem starts from the momentum principle in order to derive equations for direct jump calculations. Between the and flow sections (Figure 4), the momentum principle is expressed as
where the subscripts 1 and 2 refer to the flow cross sections before and after the jump, respectively; is the density of water; is the distance from the water surface to the centroid of the cross section in question. Please note that . Friction forces have been ignored as they are small in comparison to the momentum fluxes (the first term on the left and right sides of the equation) and pressure forces (the second term on the left and right sides of the equation). Equation (11) is the same as
It is more convenient to express the terms of the above equation in terms of . The flow area is given in Equation (3). In Equation (12), the pressure force term is . The length of jump is obtained empirically from
which was suggested by Hager [13]. Using these results, one can rewrite Equation (12) as
For given values of discharge, Manning’s roughness coefficient, pipe diameter and slope, solving Equation (7) yields the angle at the flow section before the jump (Figure 1 and Figure 4). , and are a function of only. They, along with , can be evaluated for the flow section. In other words, the angle at the flow section after the jump (Figure 1 and Figure 4) is the only unknow variable in Equation (14). The current study casts this equation into the Newton-Raphson equation
where the superscript n denotes the approximation, and the superscript denotes the preceding approximation; f is a function of . This function is a collection of all the terms on the left hand side of Equation (14). The current study solves Equation (14) by using the iterative methods [40] to yield , and further obtains solutions of (Figure 4) from the relationship between and h (Figure 1).
The solution methods discussed above can be simplified by introducing some approximations to Equation (12). In this regard, the current study extends the approximated formulation of Hager [13] to include the effect of pipe slope (or ) on direct hydraulic jumps. It can be shown that the resulting equation for the depth ratio, , is of the form
2.5. Incomplete Hydraulic Jump
An incomplete hydraulic jump is shown in Figure 5. The main feature is that the flow is pressurised downstream of the jump. There is the hydrostatic pressure head, H, against the soffit of the conduit [41]. At the downstream cross section, the flow area is . The equivalent centroid of the section is . Substituting into Equation (12) yields
This equation is solved for H as the only unknown variable. The equivalent depth of flow after the jump is then calculated from
3. Results and Discussion
3.1. The Effect of Pipe Slope on the Froude Number
It is the Froude number at the initial depth section that is of interest, for the purpose of investigating flow choking due to possible hydraulic jumps in a storm-water sewer pipe. The Froude number, , is calculated using Equation (8). Without losing generality, we choose to use a pipe diameter mm and a constant Manning’s roughness coefficient (the same thereafter, unless stated otherwise) in our calculations. In fact, the chosen diameter of 600 mm is within the range of the most common sizes (400–1350 mm) of storm-water sewers [10,11]. The chosen n value of reflects conditions of new concrete surfaces [7].
The calculated values of (Equation (8)) versus discharge Q (Equation (7)) are plotted in Figure 6a. Several observations are made from this figure. First, for a given slope, the curve of shows a non-linear increase in the value of as the discharge increases, and a maximum at a certain value of discharge. As the discharge further increases from this discharge value, decreases. Second, for the same discharge, the Froude number is larger at a larger slope. Third, the space can be divided into three regions: The lower region shows values below unity, meaning that no hydraulic jumps are possible to occur. The middle region shows values below . Accordingly, undular hydraulic jumps (Figure 3) are possible. The upper region shows values greater than . Thus, direct hydraulic jumps (Figure 4) or even incomplete hydraulic jumps (Figure 5) are possible. The corresponding slopes of these three regions are: , , and .
For these values of the pipe slope, S, some flow characteristics are summarised in Table 1. It is worth noting that for mild pipe slopes (), the flow regime can switch between subcritical and supercritical states, as the filling ratio y changes. For example, at , the flow is in subcritical state for ; it switches to supercritical state for , and back to subcritical state again for . In such a case, occurrences of hydraulic jumps are limited to some values of the filling ratio . It is understood that the discharge changes too as the filling ratio changes.
3.2. Variations of the Froude Number with Filling Ratio
For given values of pipe slope, S, and Manning’s n, the Froude number (Equation (8)) varies with the filling ratio (Equation (2)) at the initial depth section. The trends of variations are similar to those of the vs. Q curves plotted in Figure 6a. The reason is that there is an approximately linear relationship between flow depth and discharge for a good range () of filling ratios [7]. Thus, the discussions of possible types of hydraulic jumps in the space are applicable to the space.
It is understood that reliable estimates of the Froude number at the initial depth section are important for studies of the hydraulic jump. The values determined using Equation (8) from this study are consistent with those based on Equation (9) of Hager [13]. This is demonstrated in a comparison of values in Figure 7. In the design of storm-water sewers, the usual range of filling ratios used is . For this range, the relative differences of values between the current study and Hager [13] are less than ±4%.
3.3. Downstream Filling Ratio after Undular Hydraulic Jump
After a hydraulic jump, the increase in flow depth gives a larger filling ratio at the sequent depth section than the filling ratio at the initial depth section. For undular hydraulic jumps, values of for the six mild pipe slopes () are plotted in Figure 8. The values are pertinent to the first wave crest (Figure 3). Please note that calculations of use Equation (10), with input of the Froude number from Equation (8) at the initial depth section. The mild pipe slopes can possibly cause undular jumps (Figure 3) in the pipe.
In Figure 8, the dashed straight line represents the condition of zero change in the filling ratio between cross sections. This scenario is possible when two conditions are satisfied: (1) The given filling ratio at upstream matches exactly the normal depth for the given pipe slope and Manning’s n; and (2) the flow is not subject to any controls at further downstream. The supercritical flow maintains a constant depth along the pipe, and there is no hydraulic jump.
If the given depth of flow at upstream renders supercritical flow, any point below the dashed straight line (Figure 8) will conceptually mean gradually varied flow with an flow profile [7]. As water flows from upstream to downstream, the velocity increases whereas the depth of flow decreases. This condition is possible if the normal depth from Manning’s formula is smaller than the given depth of supercritical flow at the upstream cross section. In the absence of controls acting downstream, the water surface will drop toward the normal flow surface.
The forthcoming interpretation of Figure 8 assumes that the hydraulic jump has been triggered in the pipe flow by control acting downstream. Points in the curves above the dashed straight line represent undular hydraulic jumps. These hydraulic jumps are relatively low. The increases in flow depth are moderate from the initial to sequent depth section (Figure 2b). For example, at an initial filling ratio , a pipe slope of causes a sequent filling ratio , and a pipe slope of 1% causes a sequent filling ratio of . For the range of parameter values considered in the current study, the pipe flow is not subject to choking by undular hydraulic jumps. This is because the filling ratios at the sequent depth section are all below unity (Figure 8). In this figure, it is shown that when exceeds a certain level, the slope (mathematically expressed as ) of the individual curve drops, meaning that the jump is less strong. The reason is that the Froude number, , at the initial depth section (Figure 2b) decreases with increasing above the level (Figure 6b). For example, for a pipe slope , this level is . From Figure 6b, it is clear that has different values for different pipe slopes at the same value of .
3.4. Downstream Filling Ratio after Direct Hydraulic Jump
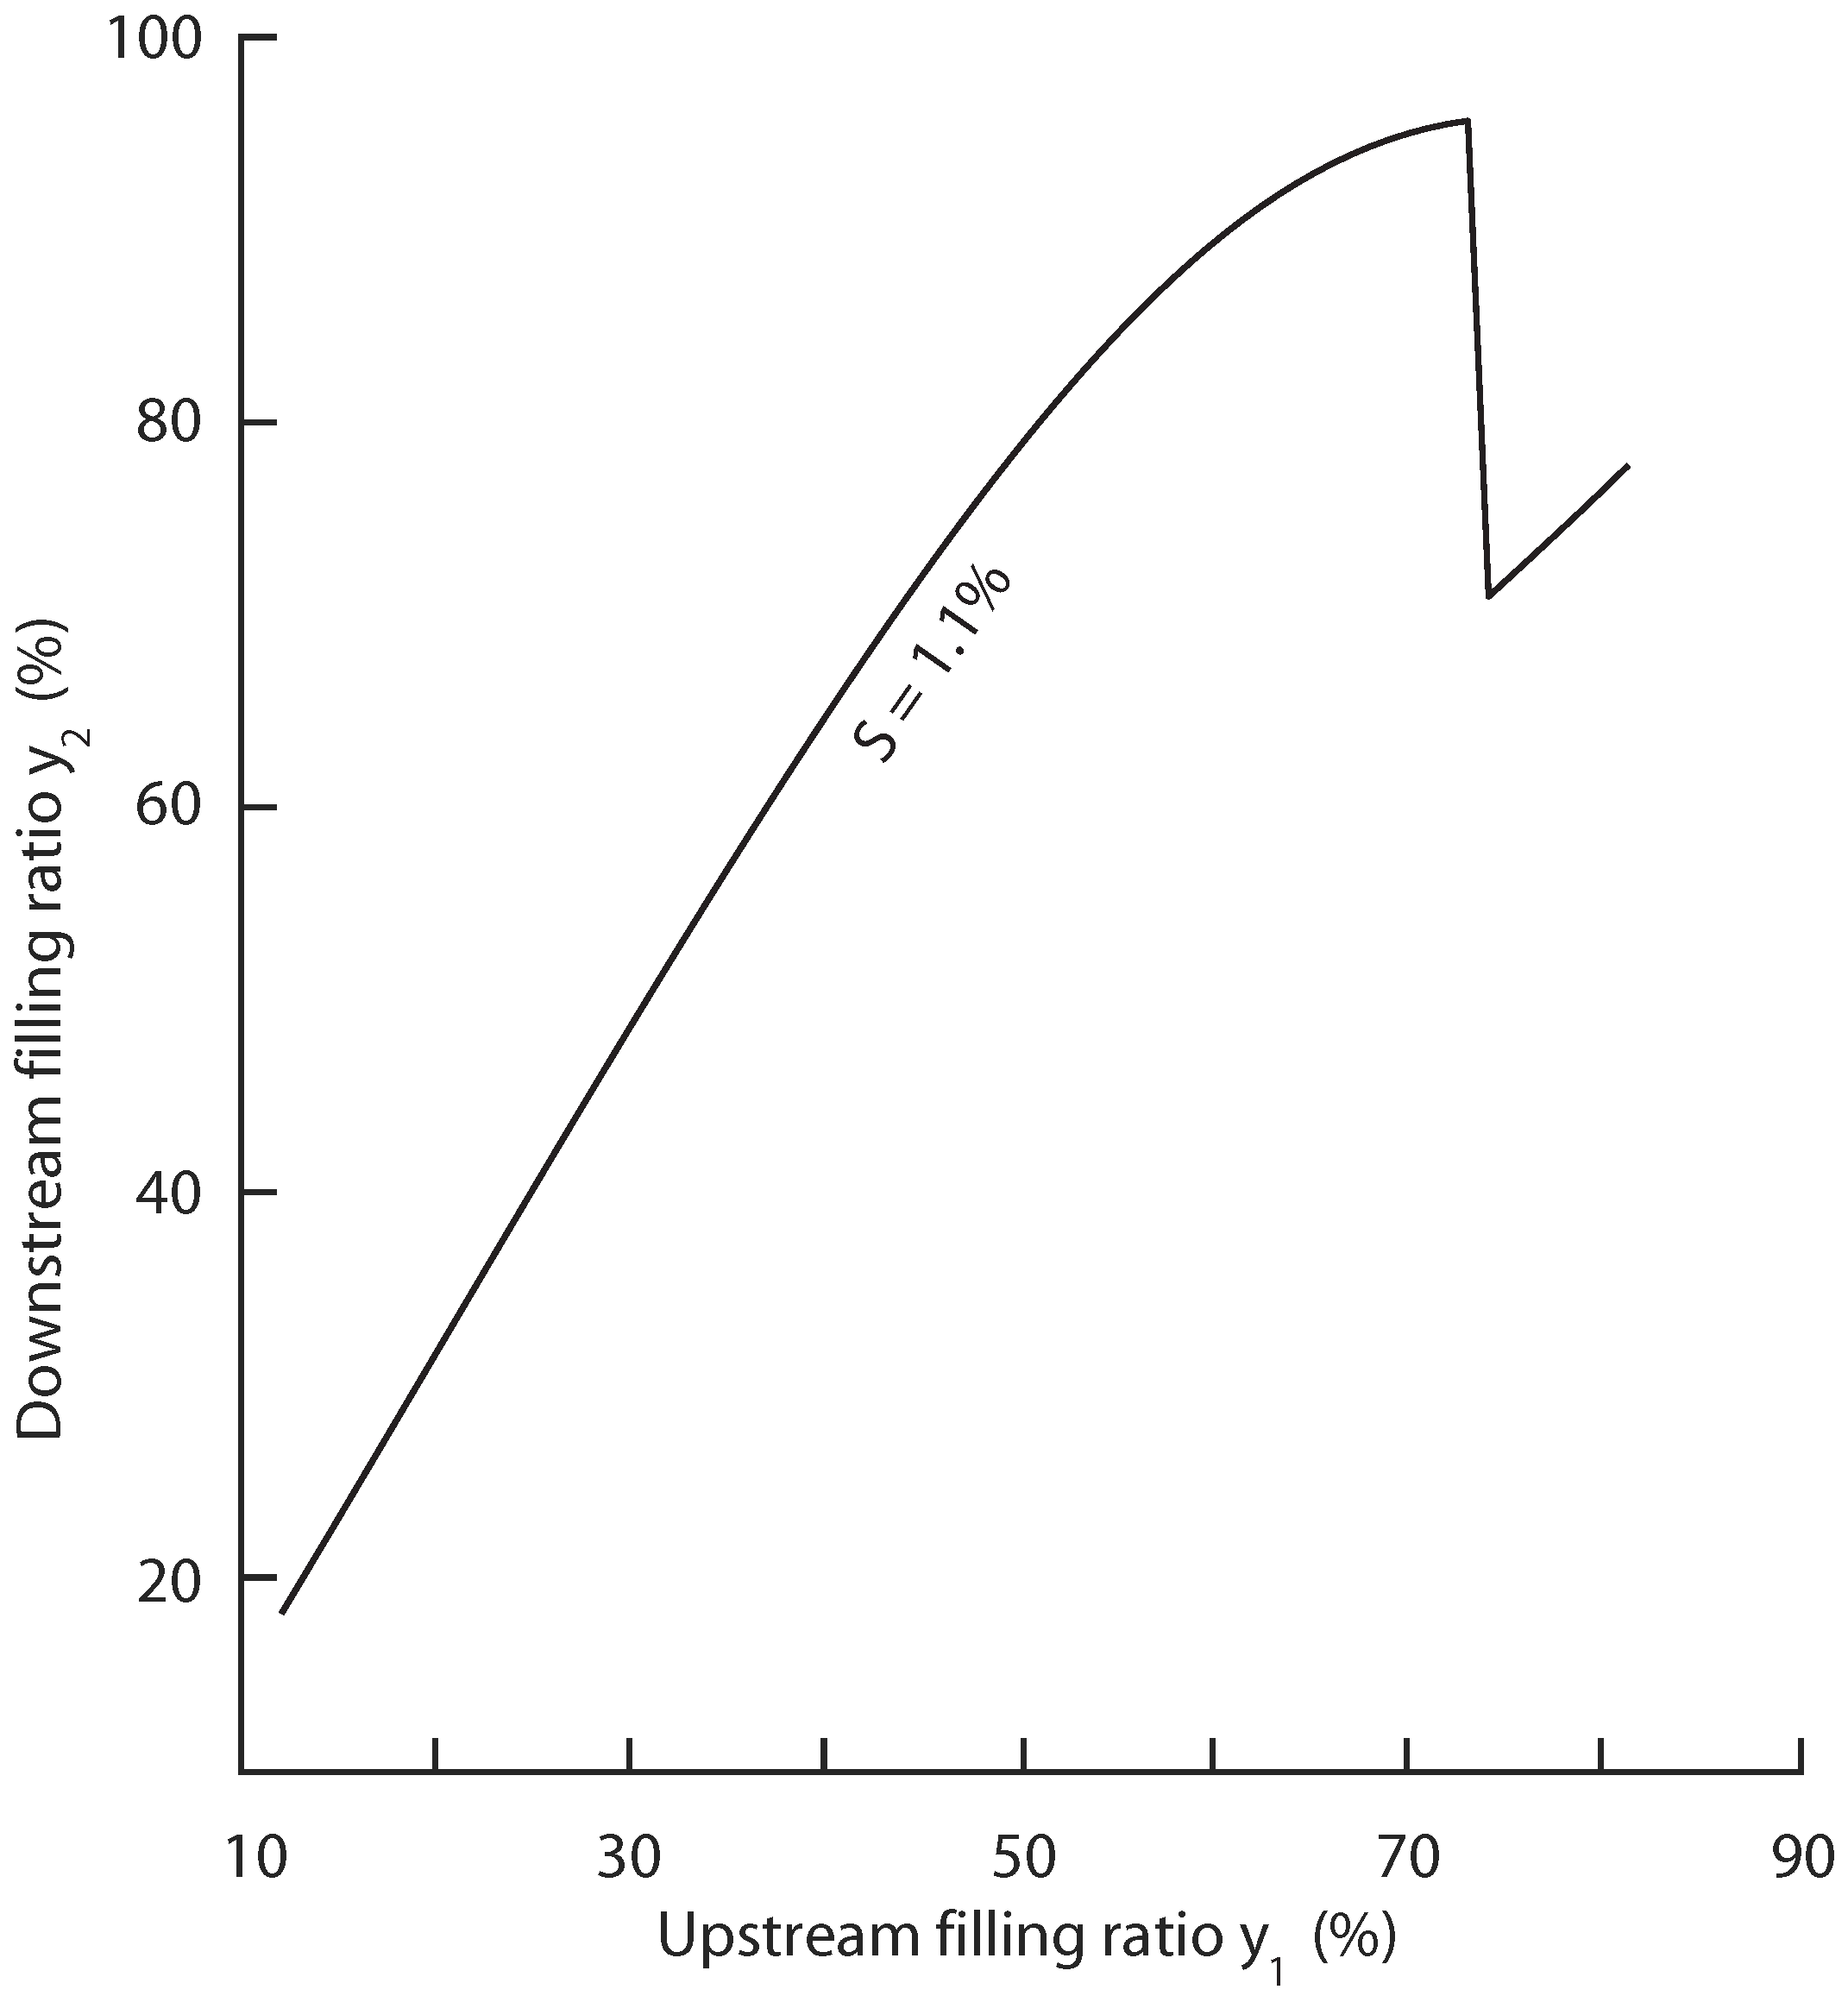
Values of the angle at the sequent depth section after a direct hydraulic jump were calculated using Equation (14) and converted to values of . In Figure 9, the results are shown as curves below the horizontal line . The flow after the direct hydraulic jump is open-channel flow, as opposed to pressurised flow. The jumps represented by points in the curves are high. Take, as an example, the curve for the pipe slope equals to . The jump causes an increase in filling ratio from before the jump to after the jump. Such an increase is very significant. Such situations could have serious implications for the design of storm-water sewer pipes. At a very steep slope (say ), there is a risk to fail to maintain the threshold filling ratio of even if the upstream flow has a filling ratio as low as , as marked by the plus symbol in the curve for .
The pipe slope is shown to have profound effects on the height of direct jumps. The larger the pipe slope, the stronger the jump. At a pipe slope of 4%, the filling ratio increases from before the jump to almost after the jump (Figure 9). When the filling ratio before the jump reaches , any slope equals to or larger than will increase the filling ratio to larger than after the jump. Such high ratios ought to be avoided in the design. Design engineers would find Figure 8 and Figure 9 as convenient and useful graphic solutions of reference. The current practice in the design of storm-water sewer networks has not accommodated occurrences of hydraulic jumps. For a relatively mild pipe slope (), the curve in Figure 10 shows essentially a linear variation of with (or the derivative being constant) until the initial depth reaches a certain level. The linear variation of in Figure 10 can be explained by the Froude number, , being more or less constant in the plateau of the curve in Figure 6b. The variation of with becomes non-linear (Figure 10) as drops from the constant value, which occurs as the filling ratio increases further.
For a direct hydraulic jump to exist, there are necessary conditions: (1) the pipe slope must be larger than (for the pipe diameter mm and Manning’s as considered in this paper); (2) for a given pipe slope the upstream filling ratio, , must be such that the upstream Froude number, , is above the limit of 1.5 (Figure 6b). As illustrated in Figure 10, a continuous increase of will cause the Froude number, , to drop below the limit of the direct hydraulic jump, giving rise to a transition from the direct hydraulic jump to the undular hydraulic jump.
3.5. Flow Choking in Sewer Pipes
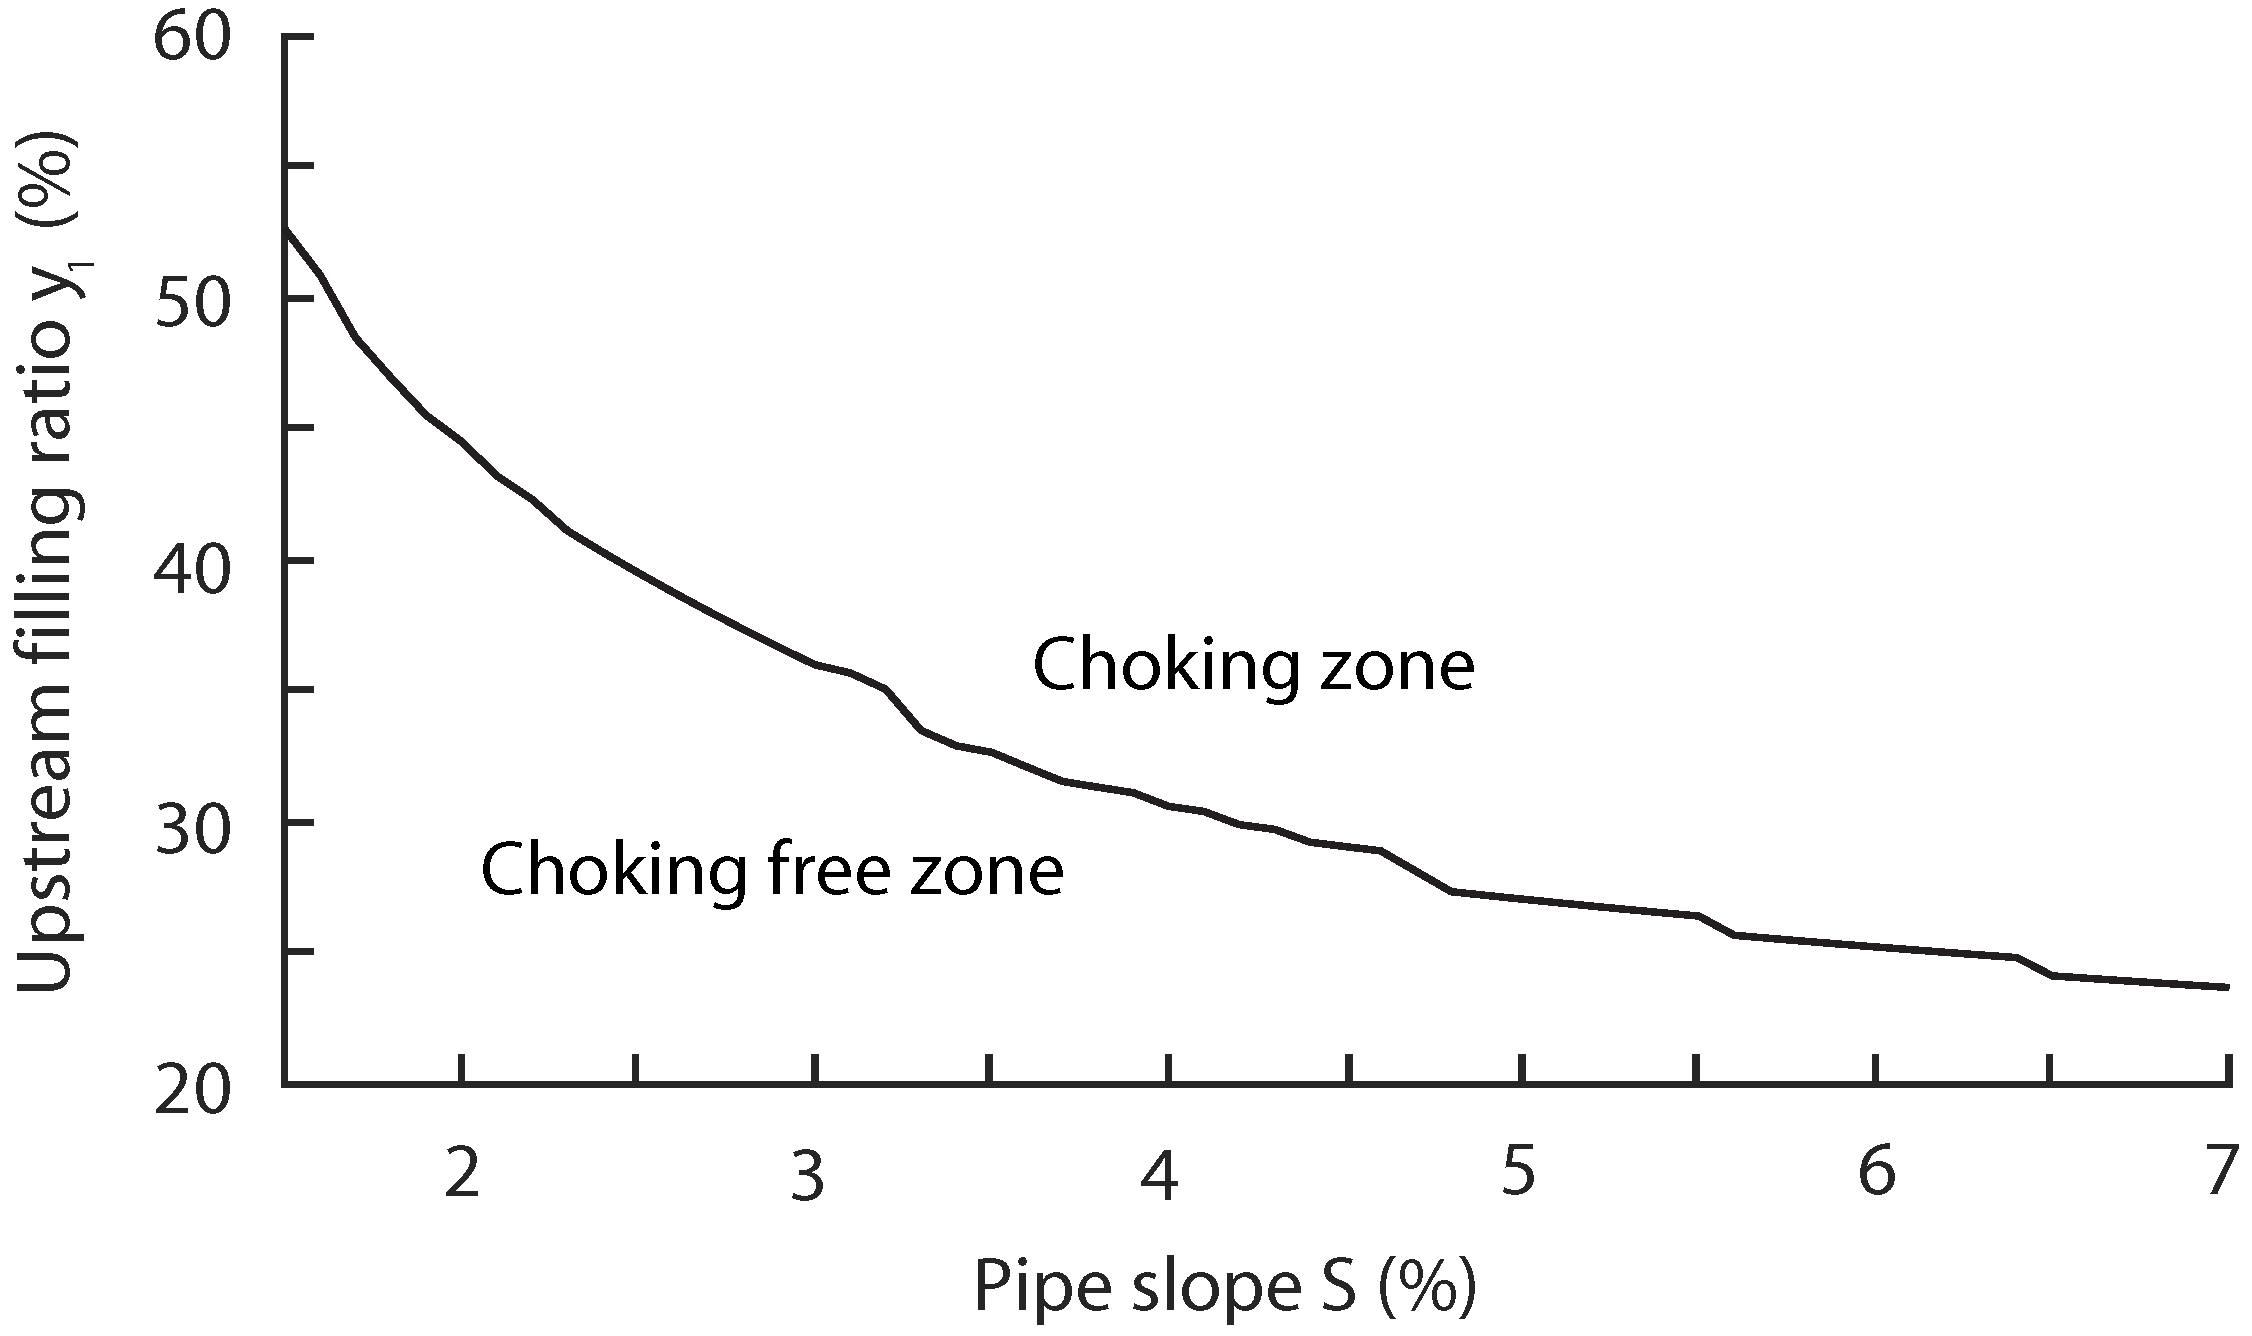
In Figure 9, the results plotted above the horizontal line represent conditions of flow choking in the sewer pipe. Nominally, the conditions are such that the filling ratio exceeds as a result of hydraulic jumps (Figure 5). In other words, is larger than D (Equation (18)). In reality, these hydraulic jumps are an incomplete hydraulic jump, governed by Equation (17). The points of intersection of the curves and the horizontal line in Figure 9 are plotted in Figure 11 as a graph of pipe slope vs. upstream filling ratio. This graph shows that to avoid flow choking after a hydraulic jump in the pipe, there is a limit to how large the design filling ratio one can have for a given pipe slope. Clearly, the design filling ratio needs to decrease significantly with increasing pipe slope S. This means that the steeper the sewer pipe, the higher the risk of flow choking. This point seems to be counterintuitive, but it can be explained by using the concept of momentum flux, which is larger at steeper pipe slope.
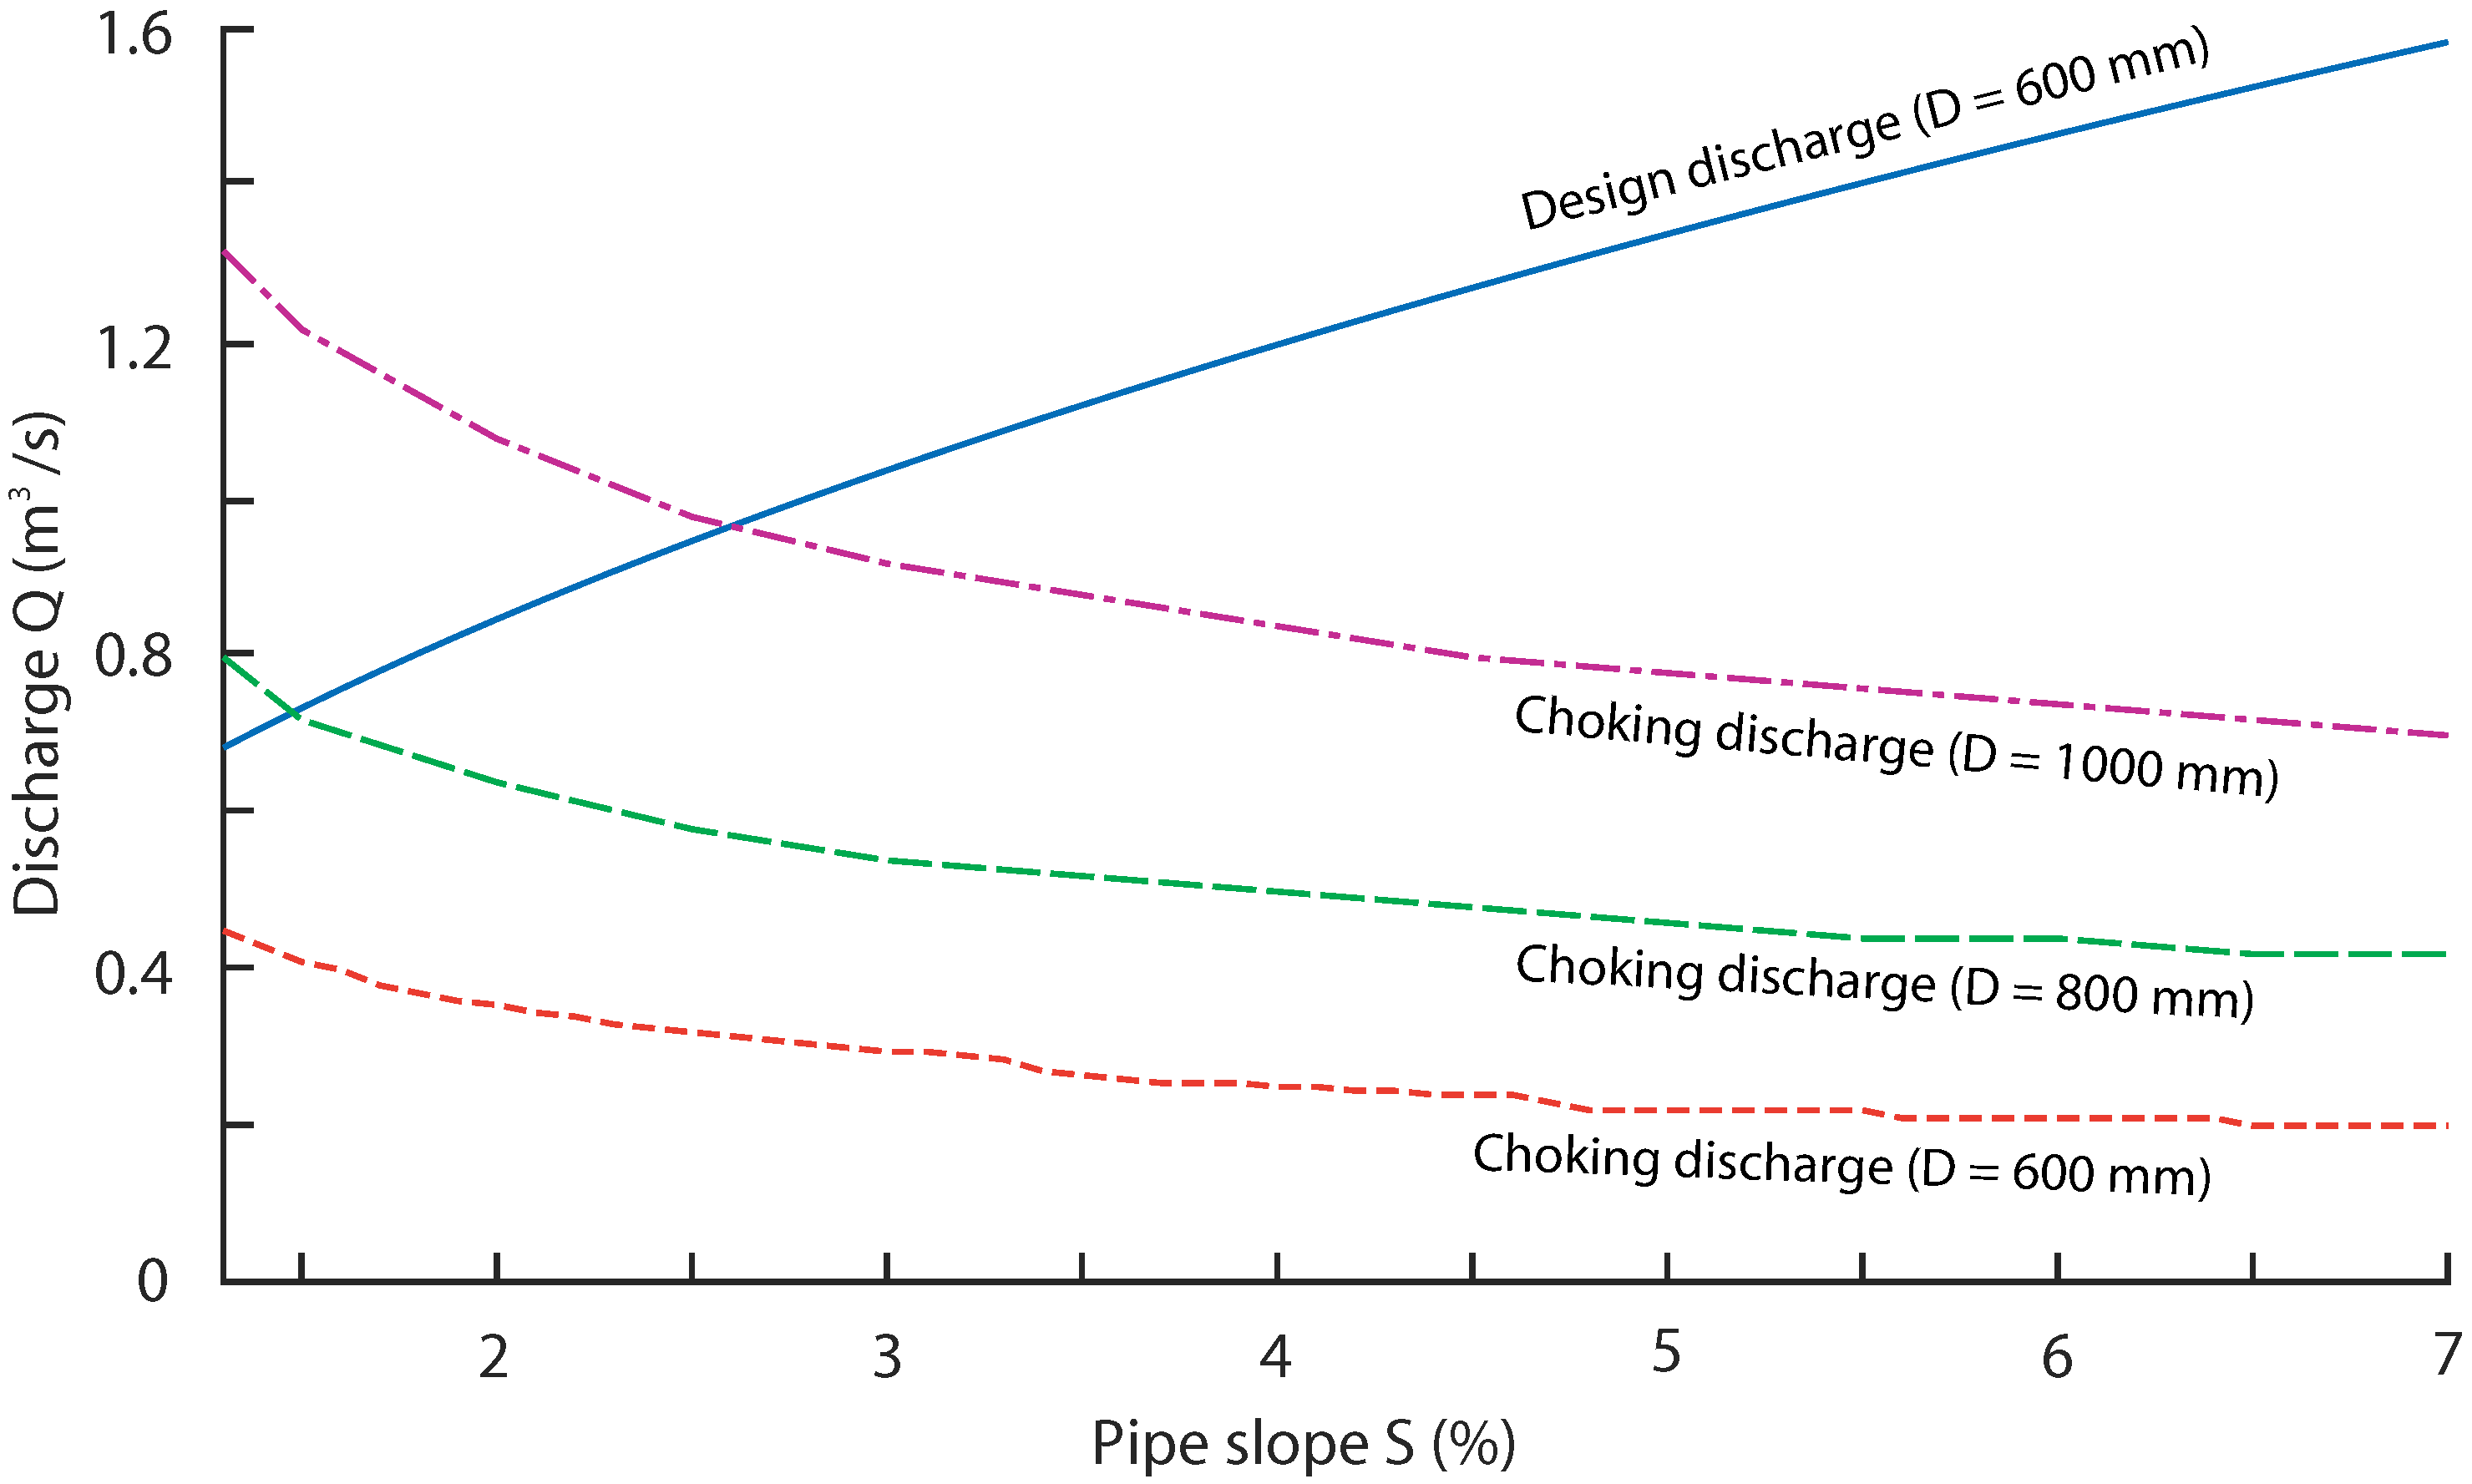
All the results discussed so far are pertinent to pipe diameter mm. For practical applications, calculations were made for more cases of pipe diameter; the results of the limit to discharge for choking-free flow are shown in Figure 12. In a way similar to Figure 11 about the design filling ratio, there is a limit to how large the design discharge Q (Figure 12) one can have if the pipe slope dictates the design. Qualitatively speaking, one idea to avoid flow choking is to increase the diameter of sewer pipes. The graphs in Figure 12 provide useful quantitative information. The discharge from uniform flow calculations is shown as a function of the pipe slope (the solid blue curve) for mm. This curve is plotted above the limit curve (the dashed red curve) of discharge, which would be problematic with respect to flow choking. An increase of D to 800 mm (the dashed green curve) leads to a small portion of the solid blue curve appearing below the limit curve (the dashed green curve), which corresponds to choking free condition. A further increase of D to 1000 mm (the dash-dotted purple curve) makes a larger portion of the solid blue curve below the limit curve.
Importantly, the steeper the pipe slope, the larger the difference between the design discharge and choking discharge. This is a problematic issue that has received little attention in the current practice of designing storm-water sewers. Traditionally, sewer pipes are designed for 75∼85% filling ratio, regardless of whether the pipe slope is mild or steep. The flow in steep sewers may become pressurised caused by hydraulic jumps before reaching the design filling ratio. Should the storm-water discharges from the ground surfaces increase, the location of hydraulic jumps in storm-water sewers will migrate upstream. Such situations can trigger a decrease of discharge capacity. The migration of jumps toward upstream can result in a breakdown of drainage systems or waterlogging in urban areas. Thus, the design of steep sewers needs close attention, appropriately reducing the upper bound of design filling ratio for steep sewers or increasing the design diameter.
3.6. Data Comparison
Stahl and Hager [17] obtained data of initial and sequent depths of hydraulic jumps from laboratory experiments of flow in a horizontal circular pipe. Through data fitting, they produced the following empirical relationship
where (Figure 4, with = 0). This is essentially a linear relationship between Y and the upstream Froude number . For selected values, Equation (19) permits the determination of Y values (Table 2).
In the current study, Equations (14) and (16) incorporate the effects of pipe slope (or ) on Y. However, it would be constructive to examine whether or not solutions to these equations produce Y values approaching those determined from Equation (19), as S is gradually reduced toward zero. The Y values from the solutions of Equation (14) are listed in Table 2. The relative differences of these Y values from those from Equation (19) are due to the effects of the pipe slope. As expected, the relative differences are large at large pipe slope (S = 7%). They diminish as S approaches zero. This confirms the quality of the results based on Equation (14) from the current study. The Y values from the solutions of Equation (16) are also listed in Table 2, which are less accurate than those based on Equation (14). This is because extra approximations have been introduced in Equation (16).
In summary, the Froude number is a key parameter. In a circular sewer pipe, it is possible to have two different flow depths (or equivalently filling ratios or discharges) that associate with the same value of the Froude number, for a given constant pipe slope (Figure 6b). In this paper, the formulation of Equation (14) has properly incorporated the effect of the weight of the block of water on the hydraulic jump in a sloping sewer pipe. This represents a significant contribution.
4. Conclusions
This paper deals with hydraulic jumps and resultant flow choking in a circular pipe. Based on the results from this study, the following conclusions have been reached:
- For flow in a circular pipe, the Froude number increases as the discharge Q or the filling ratio increases, for a given pipe slope; reaches a maximum when increases to , and then decreases as further increases. So there are two possible flow conditions ( and ) for the same value of . For a given Q value, the value of increases with an increasing pipe slope S.
- In the current study (with pipe diameter mm, and Manning’s ), no hydraulic jump occurs for ; undular hydraulic jumps are possible to occur for , whereas direct hydraulic jumps are possible for .
- For , a transition from the direct hydraulic jump to the undular hydraulic jump will occur when the drops below the limit for occurrences of direct hydraulic jumps.
- For both the undular and direct hydraulic jumps, the sequent depth ratio increases with increasing pipe slope S at the same initial depth ratio . For a given pipe slope, increases initially and then decreases as Q or increases.
- In the current study, the sequent depth after an undular hydraulic jump (for ) is always below unity, which means no risk of flow choking. For , the storm-water sewer flow will be choked before reaching the design filling ratio (based on the uniform flow theory). The steeper the sewer pipe, the higher the risk of flow choking.
- The steeper the sewer pipe, the larger the deference between the design discharge (based on the uniform flow theory) and choking discharge.
- This paper has produced useful curves of the maximum filling ratio and discharge capacity for free-surface flow downstream of a possible hydraulic jump. These curves delineate the region where the downstream flows would become a pressurised flow, which should be avoided in the design of storm sewers.
- There is a reasonable agreement between the filling ratio results from Equation (14) of the current study and available experimental data, with diminishing differences as the pipe slope approaches zero.
Author Contributions
S.S.L. contributed to conceptualising the work; C.W. developed the calculation methods; C.W. and S.L. contributed to data analysis; C.W. prepared the original draft of the paper; S.S.L. revised and edited the paper; S.S.L. supervised the work; S.S.L. acquired funding.
Funding
This research was funded by the Natural Sciences and Engineering Research Council of Canada through Discovery Grants held by S.S.L.
Acknowledgments
Costs to publish in open access were covered by Concordia University through the Concordia Open Access Author Fund.
Conflicts of Interest
The authors declare no conflict of interest. The funder had no role in the design of this study; in the collection, analysis, or interpretation of data; in the writing of the manuscript, or in the decision to publish the results.
References
- Da Silva, C.; Schardong, A.; Garcia, J.; Oliveira, C. Climate Change Impacts and Flood Control Measures for Highly Developed Urban Watersheds. Water 2018, 10, 829. [Google Scholar] [CrossRef]
- Rashid, H.; Hunt, L.M.; Haider, W. Urban flood problems in Dhaka, Bangladesh: Slum residents’ choices for relocation to flood-free areas. Environ. Manag. 2007, 40, 95–104. [Google Scholar] [CrossRef] [PubMed]
- Sandink, D. Urban flooding and ground-related homes in Canada: An overview. J. Flood Risk Manag. 2016, 9, 208–223. [Google Scholar] [CrossRef]
- Singh, P.; Sinha, V.S.P.; Vijhani, A.; Pahuja, N. Vulnerability assessment of urban road network from urban flood. Int. J. Disaster Risk Reduct. 2018, 28, 237–250. [Google Scholar] [CrossRef]
- Salata, A.; Bkak, L.; Dkabek, L.; Ozimina, E. Assessment of the degree of pollution of sediments from the rainstorm sewer system in the urbanised catchment. Desalin. Water Treat. 2016, 57, 1478–1489. [Google Scholar] [CrossRef]
- Batista, J.A.D.N.; Boldrin, A.J. Evaluation of the hydraulic performance of an urban stormwater drainage system. Eng. Sanit. Ambient. 2018, 23, 263–273. [Google Scholar] [CrossRef]
- Chow, V.T. Open-Channel Hydraulics; McGraw-Hill: New York, NY, USA, 1959. [Google Scholar]
- Wang, H.; Chanson, H. Air entrainment and turbulent fluctuations in hydraulic jumps. Urban Water J. 2015, 12, 502–518. [Google Scholar] [CrossRef]
- Cheng, J.; Gu, X.; Gong, Y. Code for Design of Outdoor Drainage Pipeline in Mountainous City, 1st ed.; Chongqing Municipal Design and Research Institute: Chongqing, China, 2018. (In Chinese) [Google Scholar]
- Brown, S.; Schall, J.; Morris, J.; Doherty, C.; Stein, S. Urban Drainage Design Manual: Hydraulic Engineering Circular No. 22, 3rd ed.; U.S. Department of Transportation: Washington, DC, USA, 2009.
- Normann, J.M.; Houghtalen, R.J.; Johnston, W.J. Hydraulic Design of Highway Culverts, 2nd ed.; U.S. Department of Transportation: Washington, DC, USA, 2001.
- Gargano, R.; Hager, W.H. Undular hydraulic jumps in circular conduits. J. Hydraul. Eng. 2002, 128, 1008–1013. [Google Scholar] [CrossRef]
- Hager, W.H. Wastewater Hydraulics: Theory and Practice; Springer: Berlin, Germany, 2010. [Google Scholar]
- Hager, W.H.; Gisonni, C. Supercritical flow in sewer manholes. J. Hydraul. Res. 2005, 43, 660–667. [Google Scholar] [CrossRef]
- De Martino, F.; Gisonni, C.; Hager, W.H. Drop in combined sewer manhole for supercritical flow. J. Irrig. Drain. Eng. 2002, 128, 397–400. [Google Scholar] [CrossRef]
- Gargano, R.; Hager, W.H. Supercritical flow across sewer manholes. J. Hydraul. Res. 2002, 128, 1014–1017. [Google Scholar] [CrossRef]
- Stahl, H.; Hager, W.H. Hydraulic jump in circular pipes. Can. J. Civ. Eng. 1999, 26, 368–373. [Google Scholar] [CrossRef]
- Safranez, K. Researches Relating to the Hydraulic Jump (English Translation by Barnes, D.P.); Bureau of Reclamation: Denver, CO, USA, 1929.
- Bakhmeteff, B.A.; Matzke, A.E. The hydraulic jump in terms of dynamic similarity. Trans. Am. Soc. Civ. Eng. 1936, 101, 630–647. [Google Scholar]
- Forster, J.W.; Skrinde, R.A. Control of the hydraulic jump by sills. Trans. Am. Soc. Civ. Eng. 1950, 115, 973–987. [Google Scholar]
- Hager, W.H. Energy Dissipators and Hydraulic Jump; Springer Science & Business Media: Dordrecht, The Netherlands, 1992; Volume 8. [Google Scholar]
- Chanson, H.; Montes, J.S. Characteristics of undular hydraulic jumps: Experimental apparatus and flow patterns. J. Hydraul. Eng. 1995, 121, 129–144. [Google Scholar] [CrossRef]
- Montes, J.; Chanson, H. Characteristics of undular hydraulic jumps: Experiments and analysis. J. Hydraul. Eng. 1998, 124, 192–205. [Google Scholar] [CrossRef]
- Ohtsu, I.; Yasuda, Y.; Gotoh, H. Flow conditions of undular hydraulic jumps in horizontal rectangular channels. J. Hydraul. Eng. 2003, 129, 948–955. [Google Scholar] [CrossRef]
- Chanson, H. Current knowledge in hydraulic jumps and related phenomena. A survey of experimental results. Eur. J. Mech. B/Fluids 2009, 28, 191–210. [Google Scholar] [CrossRef] [Green Version]
- Chanson, H.; Brattberg, T. Experimental study of the air–water shear flow in a hydraulic jump. Int. J. Multiph. Flow 2000, 26, 583–607. [Google Scholar] [CrossRef] [Green Version]
- Valiani, A. Linear and angular momentum conservation in hydraulic jump. J. Hydraul. Res. 1997, 35, 323–354. [Google Scholar] [CrossRef]
- Gharangik, A.M.; Chaudhry, M.H. Numerical simulation of hydraulic jump. J. Hydraul. Eng. 1991, 117, 1195–1211. [Google Scholar] [CrossRef]
- Molls, T.; Molls, F. Space-time conservation method applied to Saint Venant equations. J. Hydraul. Eng. 1998, 124, 501–508. [Google Scholar] [CrossRef]
- Ellms, R. Hydraulic jump in sloping and horizontal flumes. Trans. Am. Soc. Mech. Eng. 1932, 54, 113–121. [Google Scholar]
- Bakhmeteff, B.; Matzke, A. The hydraulic jump in sloped channels. Trans. Am. Soc. Mech. Eng. 1938, 60, 111–118. [Google Scholar]
- Kindsvater, C.E. The hydraulic jump in sloping channels. Trans. Am. Soc. Civ. Eng. 1944, 109, 1107–1154. [Google Scholar]
- Rajaratnam, N. The hydraulic jump in sloping channels. Water Energy Int. 1966, 23, 137–149. [Google Scholar]
- Ohtsu, I.; Yasuda, Y. Hydraulic jump in sloping channels. J. Hydraul. Eng. 1991, 117, 905–921. [Google Scholar] [CrossRef]
- Gunal, M.; Narayanan, R. Hydraulic jump in sloping channels. J. Hydraul. Eng. 1996, 122, 436–442. [Google Scholar] [CrossRef]
- Gotoh, H.; Yasuda, Y.; Ohtsu, I. Effect of channel slope on flow characteristics of undular hydraulic jumps. J. Appl. Mech. 2004, 7, 953–960. [Google Scholar] [CrossRef] [Green Version]
- Beirami, M.; Chamani, M.R. Hydraulic jumps in sloping channels: sequent depth ratio. J. Hydraul. Eng. 2006, 132, 1061–1068. [Google Scholar] [CrossRef]
- Reinauer, R.; Hager, W.H. Non-breaking undular hydraulic jump. J. Hydraul. Res. 1995, 33, 683–698. [Google Scholar] [CrossRef]
- Castro-Orgaz, O. Weakly undular hydraulic jump: Effects of friction. J. Hydraul. Res. 2010, 48, 453–465. [Google Scholar] [CrossRef]
- Mitchell, S. Hydraulic jumps in trapezoidal and circular channels. Proc. Inst. Civ. Eng. Water Manag. 2008, 161, 161–167. [Google Scholar] [CrossRef]
- Montes, S. Hydraulics of Open Channel Flow; ASCE: Reston, VA, USA, 1998. [Google Scholar]
Figure 1.
Geometric elements of a circular flow section. The standard design of storm-water sewer pipes allows for partially-full uniform flow (as open-channel flow), with a top width at the free surface, and a filling ratio .
Figure 1.
Geometric elements of a circular flow section. The standard design of storm-water sewer pipes allows for partially-full uniform flow (as open-channel flow), with a top width at the free surface, and a filling ratio .

Figure 2.
The hydraulic jump: (a) Photo of a hydraulic jump in a horizontal circular pipe from flow experiments conducted in the Hydraulics Laboratory at Concordia University. The flow was driven by head water at upstream, the effect being equivalent to that of gravity on flow in a sloping pipe. The jump was produced by a control acting further downstream. (b) Definition diagram of the hydraulic jump.

Figure 3.
Undular hydraulic jump in a sloping sewer pipe, showing the elevations of the first to third wave crests , , and ; wave troughs , , and above the invert of the sewer pipe; and distances , , and between adjacent wave crests. Here, is the depth of approach flow; is the inclination angle of the sewer pipe from the horizontal.

Figure 4.
Direct hydraulic jump in a circular sewer pipe flowing partially full.

Figure 5.
Definition diagram of an incomplete hydraulic jump in a sloping sewer pipe.

Figure 6.
Froude numbers in a circular pipe at a range of pipe slopes, in relation to: (a) discharge; (b) filling ratio. The pipe diameter D is 600 mm. Manning’s n equals to .
Figure 6.
Froude numbers in a circular pipe at a range of pipe slopes, in relation to: (a) discharge; (b) filling ratio. The pipe diameter D is 600 mm. Manning’s n equals to .

Figure 7.
A comparison of values between Equation (8) (the current study) and Equation (9) (Hager [13]).

Figure 8.
Filling ratio () at the sequent depth section of undular hydraulic jumps in a circular pipe with a slope . The pipe diameter is mm.
Figure 8.
Filling ratio () at the sequent depth section of undular hydraulic jumps in a circular pipe with a slope . The pipe diameter is mm.

Figure 9.
Filling ratio at the sequent depth section of direct hydraulic jumps in a circular pipe with a slope to .
Figure 9.
Filling ratio at the sequent depth section of direct hydraulic jumps in a circular pipe with a slope to .

Figure 10.
Change of the filling ratio, , after a hydraulic jump with increasing upstream filling ratio, , before the jump. The sudden drops in indicate a transition from the direct hydraulic jump to the undular hydraulic jump.
Figure 10.
Change of the filling ratio, , after a hydraulic jump with increasing upstream filling ratio, , before the jump. The sudden drops in indicate a transition from the direct hydraulic jump to the undular hydraulic jump.

Figure 11.
Limit to the initial filling ratio for choking-free flow after direct hydraulic jumps. The pipe diameter is mm. Manning’s roughness coefficient is .
Figure 11.
Limit to the initial filling ratio for choking-free flow after direct hydraulic jumps. The pipe diameter is mm. Manning’s roughness coefficient is .

Figure 12.
Solutions of uniform flow discharge as a function of pipe slope, and limits to the design discharge Q for choking-free flow. Manning’s roughness coefficient is .
Figure 12.
Solutions of uniform flow discharge as a function of pipe slope, and limits to the design discharge Q for choking-free flow. Manning’s roughness coefficient is .


Table 1.
Flow characteristics in a circular pipe section with open-channel flow (Figure 2). The pipe diameter is mm, and Manning’s n is .
Table 1.
Flow characteristics in a circular pipe section with open-channel flow (Figure 2). The pipe diameter is mm, and Manning’s n is .
| Pipe Slope | Max. Discharge a | Froude Number | Max. Velocity b | Froude Number |
|---|---|---|---|---|
| S | Q | at max. Discharge | V | at max. Velocity |
| (%) | (m3/s) | Fr | (m/s) | Fr |
| 0.5 | 0.467 | 0.56 | 1.751 | 0.77 |
| 1.0 | 0.660 | 0.79 | 2.476 | 1.10 |
| 1.5 | 0.809 | 0.96 | 3.032 | 1.34 |
| 2.0 | 0.934 | 1.11 | 3.501 | 1.55 |
| 2.5 | 1.044 | 1.24 | 3.914 | 1.73 |
| 3.0 | 1.144 | 1.36 | 4.288 | 1.90 |
| 3.5 | 1.236 | 1.47 | 4.632 | 2.05 |
| 4.0 | 1.321 | 1.57 | 4.951 | 2.19 |
| 4.5 | 1.401 | 1.67 | 5.252 | 2.32 |
| 5.0 | 1.477 | 1.76 | 5.536 | 2.45 |
| 5.5 | 1.549 | 1.84 | 5.806 | 2.57 |
| 6.0 | 1.618 | 1.93 | 6.064 | 2.68 |
| 6.5 | 1.684 | 2.00 | 6.312 | 2.79 |
| 7.0 | 1.748 | 2.08 | 6.550 | 2.90 |
a The maximum discharge occurs at the filling ratio of about ; b The maximum flow velocity occurs at the filling ratio of [7].
Table 2.
Values of Y from different data sources.
| Froude Number | Equation (19) | Equation (14) | Relative Difference | Equation (16) | Relative Difference | Pipe Slope |
|---|---|---|---|---|---|---|
| 1.53 | 1.58 | 3.5% | 1.69 | 10.7% | 1.1% | |
| 1.61 | 1.68 | 4.2% | 1.78 | 10.4% | 1.3% | |
| 1.95 | 2.10 | 7.7% | 2.2 | 12.8% | 2.0% | |
| 2.20 | 2.39 | 8.7% | 2.51 | 14.1% | 2.8% | |
| 2.28 | 2.51 | 10.0% | 2.61 | 14.4% | 3.0% | |
| 2.69 | 3.0 | 11.6% | 3.11 | 15.7% | 4.5% | |
| 2.77 | 3.18 | 14.9% | 3.24 | 17.0% | 4.5% | |
| 2.85 | 3.26 | 14.4% | 3.33 | 16.9% | 4.9% | |
| 3.17 | 3.69 | 16.5% | 3.76 | 18.7% | 6.5% | |
| 3.25 | 3.85 | 18.6% | 3.89 | 19.8% | 6.7% | |
| 3.33 | 3.98 | 19.7% | 4.0 | 20.3% | 7.0% |
© 2018 by the authors. Licensee MDPI, Basel, Switzerland. This article is an open access article distributed under the terms and conditions of the Creative Commons Attribution (CC BY) license (http://creativecommons.org/licenses/by/4.0/).
Share and Cite
MDPI and ACS Style
Wang, C.; Li, S.S. Hydraulic Jump and Resultant Flow Choking in a Circular Sewer Pipe of Steep Slope. Water 2018, 10, 1674. https://doi.org/10.3390/w10111674
AMA Style
Wang C, Li SS. Hydraulic Jump and Resultant Flow Choking in a Circular Sewer Pipe of Steep Slope. Water. 2018; 10(11):1674. https://doi.org/10.3390/w10111674
Chicago/Turabian StyleWang, Chunli, and S. Samuel Li. 2018. "Hydraulic Jump and Resultant Flow Choking in a Circular Sewer Pipe of Steep Slope" Water 10, no. 11: 1674. https://doi.org/10.3390/w10111674
Note that from the first issue of 2016, this journal uses article numbers instead of page numbers. See further details here.