Analysis of Precipitation Extremes in the Source Region of the Yangtze River during 1960–2016


1
College of Water Resource & Hydropower, Sichuan University, Chengdu 610065, China
2
Water Resources Bureau of Yongchuan District Chongqing, Yongchuan 402160, China
3
College of Forestry, Sichuan Agricultural University, Chengdu 610065, China
4
Chongqing Water Resource and Electric Engineering College, Yongchuan 402160, China
*
Author to whom correspondence should be addressed.
Water 2018, 10(11), 1691; https://doi.org/10.3390/w10111691
Submission received: 25 September 2018
/
Revised: 15 November 2018
/
Accepted: 16 November 2018
/
Published: 20 November 2018
(This article belongs to the Section Hydrology)
Abstract
:The source region of the Yangtze River (SRYR) on the central Tibetan Plateau has seen one of the most significant increases in temperature in the world. Climate warming has altered the temporal and spatial characteristics of precipitation in the SRYR. In this study, we analyzed the temporal trends and spatial distributions of extreme precipitation in the SRYR during 1960–2016 using 11 extreme precipitation indices (EPIs) derived from daily precipitation data collected at five meteorological stations in the region. The trends in the EPIs were estimated using the linear least squares method, and their statistical significance was assessed using the Mann–Kendall test. The results show the following. Temporally, the majority of SRYR EPIs (including the simple daily intensity index, annual maximum 1-day precipitation (RX1day), annual maximum 5-day precipitation (RX5day), very wet day precipitation, extremely wet day precipitation, number of heavy precipitation days, number of very heavy precipitation days, and number of consecutive wet days) exhibited statistically nonsignificant increasing trends during the study period, while annual total wet-day precipitation (PRCPTOT) and the number of wet days exhibited statistically significant increasing trends. In addition, the number of consecutive dry days (CDD) exhibited a statistically significant decreasing trend. For the seasonal EPIs, the PRCPTOT, RX1day, and RX5day all exhibited nonsignificant increasing trends during the wet season, and significant increasing trends during the dry season. Spatially, changes in the annual and wet season EPIs in the study area both exhibited significant differences in their spatial distribution. By contrast, changes in dry season PRCPTOT, RX1day, and RX5day exhibited notable spatial consistency. These three indices exhibited increasing trends at each station. Moreover, there was a statistically significant positive correlation between the annual PRCPTOT and each of the other EPIs (except CDD). However, the contribution of extreme precipitation to annual PRCPTOT exhibited a nonsignificant decreasing trend.
1. Introduction
Amid climate warming, global and regional water cycles have accelerated and the temporal and spatial characteristics of extreme precipitation events have undergone dramatic changes [1,2]. Disasters (e.g., floods, droughts and snowstorms) caused by extreme precipitation have adversely impacted social and economic development, people’s normal lives, and natural ecological environments [3,4]. Thus, extreme precipitation events have garnered attention from governments and researchers around the world. Previous researchers have extensively studied changes in extreme precipitation on various scales (e.g., global [5,6], continental or regional [7,8,9,10], national [11,12,13], and district or river basin [14,15,16]). The results have shown that the frequency and intensity of extreme precipitation event occurrences over land regions have increased to some extent in recent decades, particularly in mid/high-latitude regions in the Northern Hemisphere. However, extreme precipitation events in central and western Africa [17], southwestern Australia [18], southern Chile [19], and south-eastern Tibet in China [20] have shown a decreasing trend. These patterns indicate that there is no spatial consistency in changes in extreme precipitation on a global scale. Therefore, it is necessary to study changes in extreme precipitation on various scales.
As the region with the highest elevation in the world, the Tibetan Plateau is considered to be a driver and amplifier of global climate change [21]; the region both “initiates” and is sensitive to climate change [22]. The rate of increase in the annual average temperature in the Tibetan Plateau reached 0.30 °C/decade during 1960–2010 [23], which is greater than that for China (0.25 °C/decade during 1961–2013 [24]), and much greater than the global average (0.12 °C/decade during 1951–2012 [25]). This study examines the source region of the Yangtze River (SRYR). With an annual average temperature increasing at a rate of 0.34 °C/decade (1957–2013) [26], the SRYR is the region within the Tibetan Plateau that has seen the most significant increase in temperature [27,28]. Climate warming has accelerated glacial melting and caused continuous permafrost degradation in the SRYR, as well as exacerbating a number of environmental problems, including wetland shrinkage, grassland desertification, and increases in erosion. The increasing number of extreme climate events, such as heavy rainfall and snowstorms, also pose a threat to the vulnerable ecosystems in the SRYR, and may further affect sustainable development in it and the downstream region [29].
While previous researchers have studied changes in precipitation in the SRYR, they mostly focused on changes in average precipitation. Overall, the annual average precipitation in the SRYR increased at a rate of 11.4 mm/decade between 1957–2013 [26], which was greater than the rates at which the annual average precipitation increased on the Tibetan Plateau (3.8 mm/decade in 1961–2015 [30]) and in China (1.10 mm/decade in the period 1960–2013 [31]) increased. In addition, changes in precipitation in the SRYR also exhibit different characteristics on different temporal and spatial scales [32,33]. Compared to work on average precipitation, there is very limited research on extreme precipitation in the SRYR. While previous research on extreme precipitation in the regions of the Tibetan Plateau [34], the Yangtze River Basin [35], and the “Three-River Headwaters” [36] already covers the SRYR, there is still a lack of in-depth analysis of changes in extreme precipitation in the SRYR, due to its temporal complexity and spatial variation.
Hence, this study aims to (1) examine temporal and spatial changes in extreme precipitation in the SRYR and (2) analyze the relationships between extreme precipitation indices (EPIs). The results of this study will help to further the understanding of changes in extreme precipitation in the SRYR under the background of climate warming. It is also our hope that this study can provide a scientific basis for water resource management and ecological restoration in the SRYR.
2. Data and Methods
2.1. Study Area
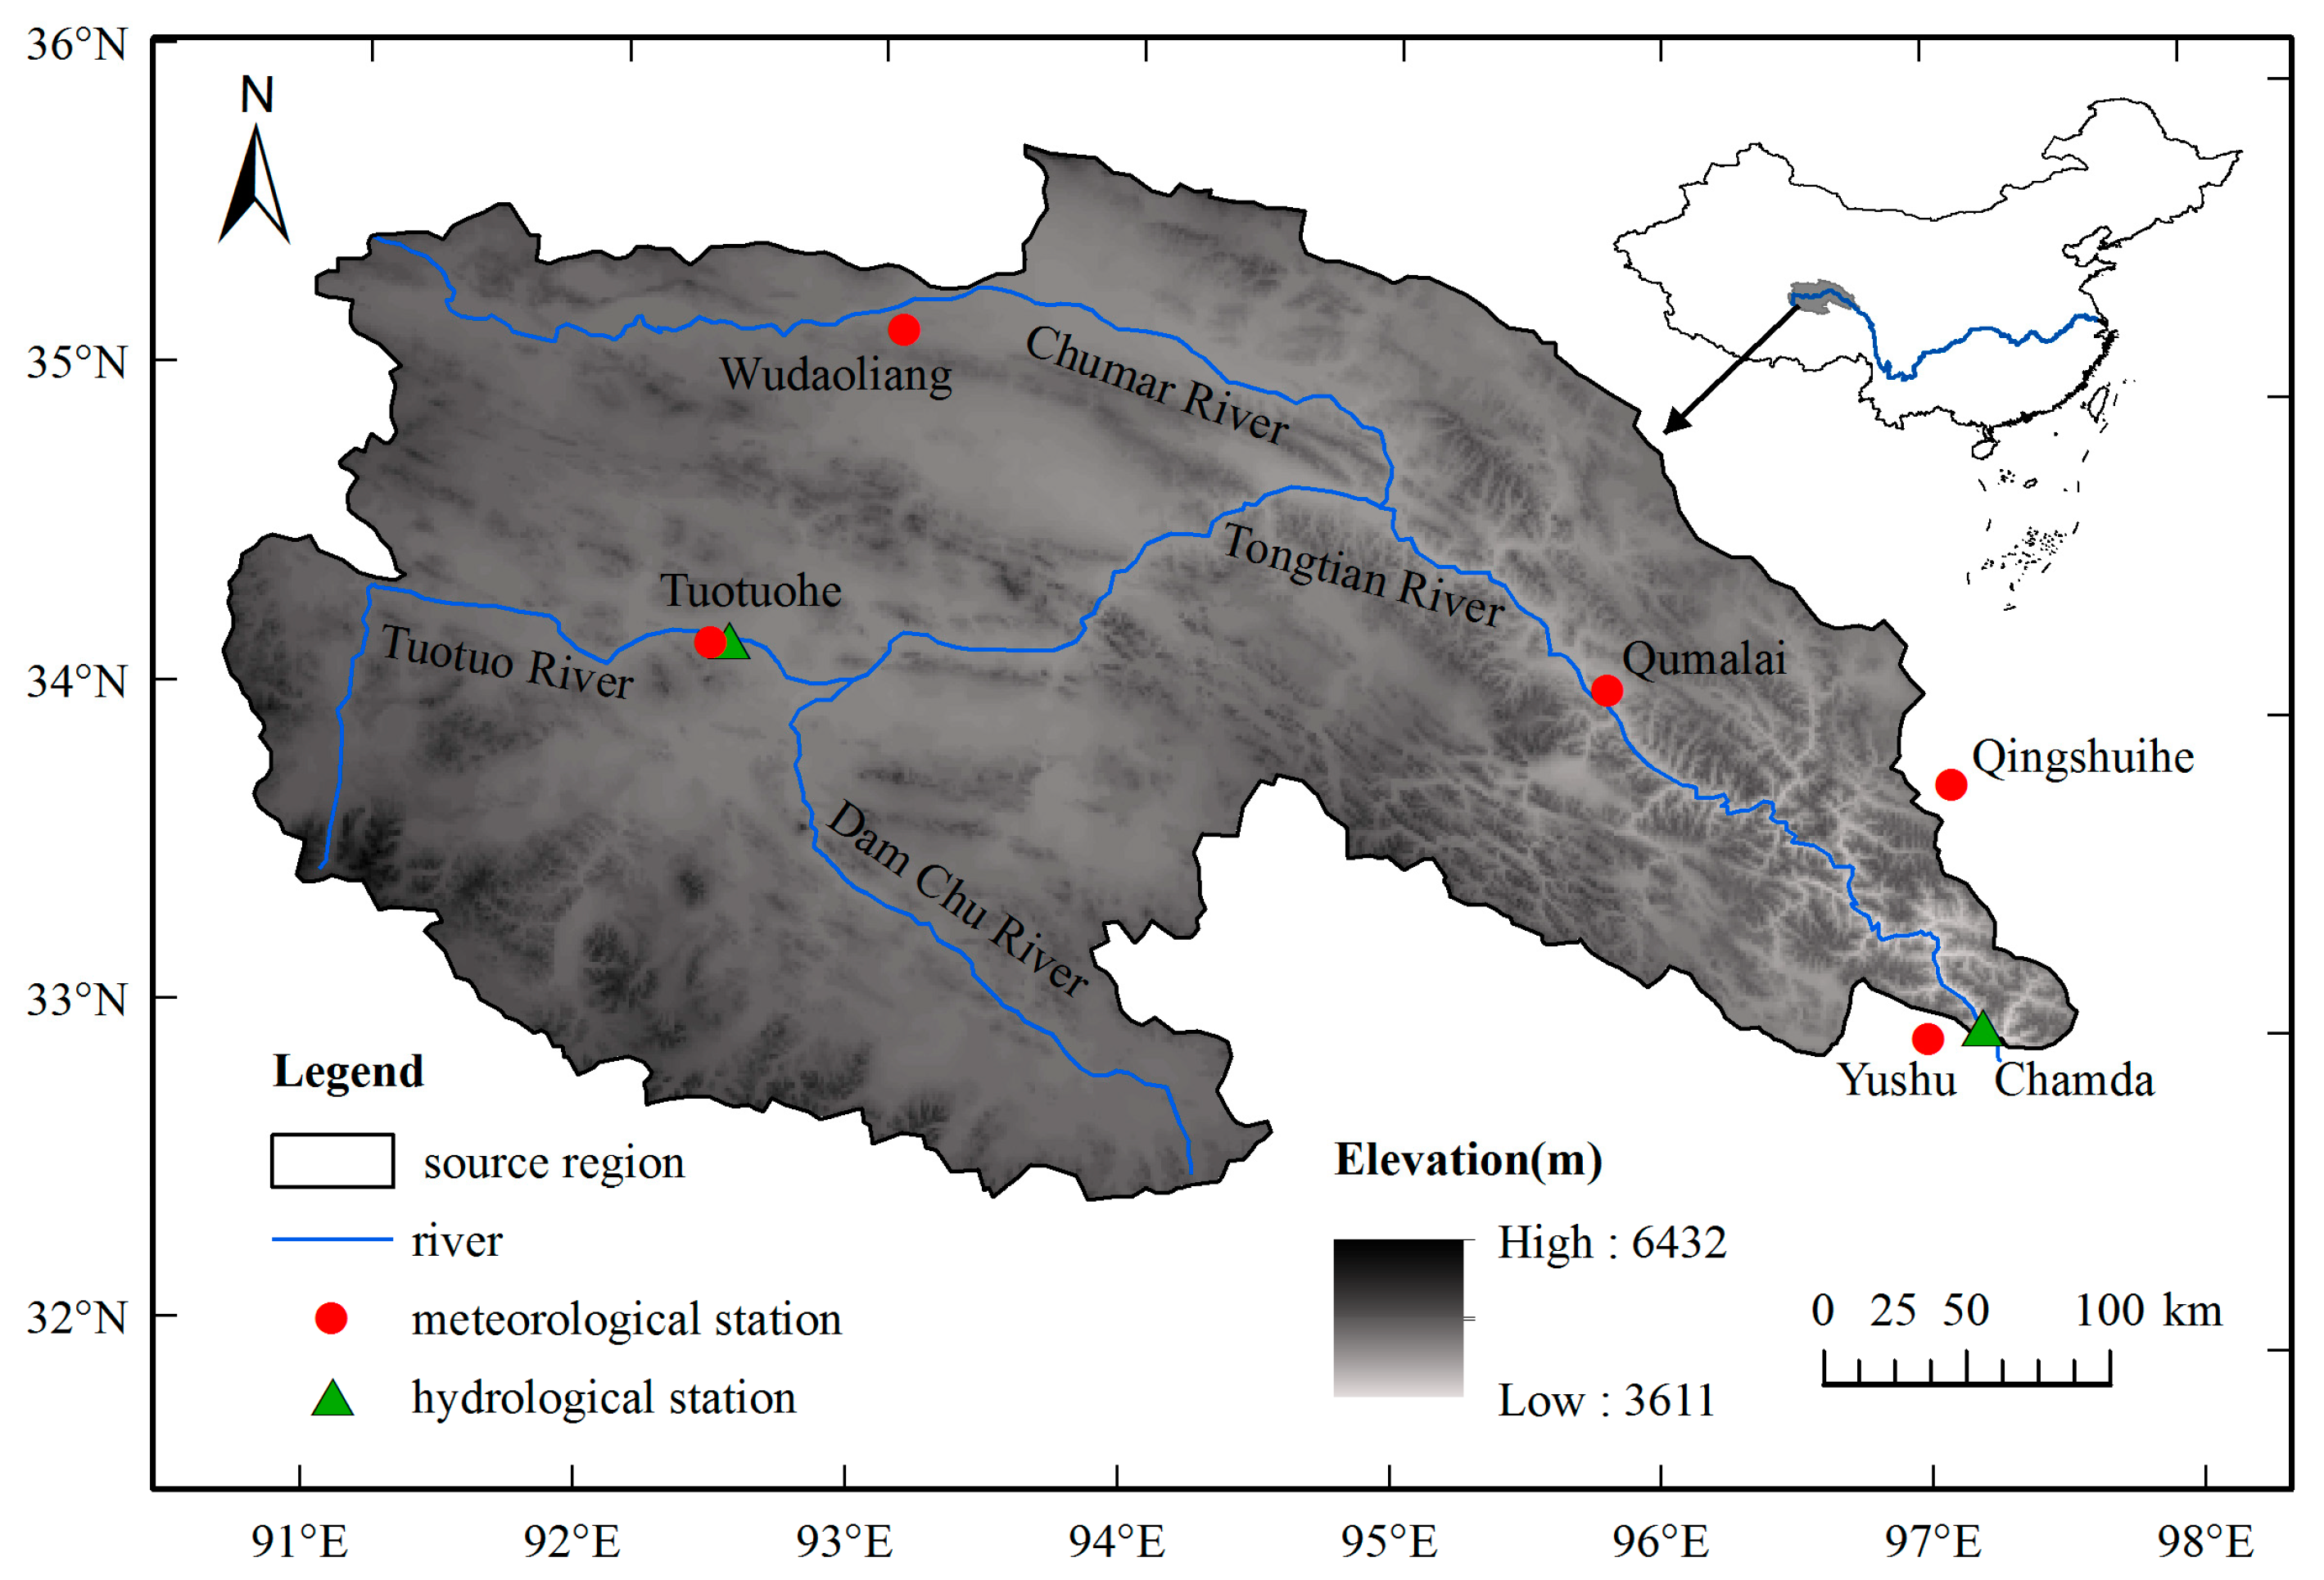
The SRYR generally refers to the catchment area (32°30′–35°45′ N, 90°33′–97°35′ E) upstream of the Chamda hydrological station, as shown in Figure 1. The main water systems in the SRYR include the Tuotuo River at the source of the Yangtze River; the Dam Chu River, which drains the southern headwaters of the Yangtze River; the Chumar River, which drains the northern headwaters of the Yangtze River; and the Tongtian River (main stream of the Yangtze River). The SRYR encompasses an area of 13.77 × 10⁴ km2, accounting for approximately 7.6% of the total area of the Yangtze River Basin, and it is also an important water conservation area and an area of unique ecological functions within the Yangtze River Basin [29]. Sitting at an average elevation of 4759 m, the SRYR has a typical continental plateau climate with only two seasons (dry (cold) and wet (warm)) throughout the year, an annual average precipitation of approximately 354 mm, and an annual average temperature of approximately −4.2 °C [29]. Due to its adverse living conditions, the SRYR is sparsely populated, with a population density of only 0.09 person/km2 [37]. Therefore, climate change in the SRYR is not significantly affected by local human activity.
2.2. Data and Quality Control
There are very few meteorological stations in the SRYR, of which only five are national meteorological stations that have collected long-term observation data (Figure 1 and Table 1). Daily precipitation data collected at the five stations from 1 November 1959 to 31 December 2016, were obtained from the National Meteorological Information Centre of China [38]. Over the years, the five meteorological stations have undergone systematic changes (e.g. changes in location, observation instrument upgrades, and changes in methods for calculating climate variables). These non-climate factors may have resulted in inhomogeneity in climate data series. Because of this, the analysis results may not truly reflect actual climate changes [39]. Therefore, to ensure a more reliable analysis of the extreme precipitation in the SRYR, it is necessary to perform quality control and a homogeneity test on these daily precipitation data before use. In this study, the daily precipitation data collected at the five stations were subjected to quality control and a homogeneity test using the RclimDex and RHtests_dlyPrcp software, respectively, a recommended by the Expert Team on Climate Change Detection and Indices (ETCCDI) [40]. RClimDex, developed and maintained by Xuebin Zhang and Feng Yang at the Climate Research Branch of Meteorological Service of Canada [41], is a R-based software package that provides a user-friendly program for the calculation of climate extreme indices. The quality control process was as follows: (1) replacing all missing values with −99.9, (2) detecting erroneous data, such as daily precipitation values less than 0 mm, and (3) identifying outliers in daily precipitation. In this paper, outliers were defined as daily values exceeding five times the standard deviation, and all unreasonable values were treated as NA (not available). The RHtests_dlyprcp software is specifically designed for the homogenization of daily precipitation data time series. It is based on the transPMFred algorithm [42], which integrates a data-adaptive Box-Cox transformation procedure into the PMFred algorithm [43]. By calling the detecting function in RHtests_dlyprcp software, all detected change points could be significant at the nominal level [44]. The default parameters in the software package were used in the analysis of whole data series from each station. These parameters are as follows: (1) p.lev = 95% (the nominal level of confidence at which to conduct the test), (2) pthr = 0 (the lower precipitation threshold), (3) Iadj = 10000 (the base segment, with Iadj = 10000 corresponding to adjusting the series to the last segment), (4) Mq = 100 (the number of points for which the empirical probability distribution function (PDF) is to be estimated), and (5) Ny4a = 10 (the maximum number of years of data immediately before or after a change point to be used to estimate the PDF) [44]. The homogeneity test results show that the quality-controlled data for each station contained no notable points of change (at a 5% significance level); in other words, the quality-controlled daily precipitation data for all stations were defined as being homogeneous.
2.3. Extreme Precipitation Indices (EPIs)
Ten EPIs recommended by the ETCCDI and one index defined in this study were used to investigate changes in extreme precipitation in the SRYR. The 11 indices can be categorized into three types [45], namely, intensity indices (total wet-day precipitation (PRCPTOT), simple daily intensity index (SDII), maximum 1-day precipitation (RX1day), maximum 5-day precipitation (RX5day), very wet-day precipitation (R95p) and extremely wet-day precipitation (R99p)), frequency indices (number of wet days (R1mm), number of heavy precipitation days (R10mm), and number of very heavy precipitation days (R20mm)), and duration indices (number of consecutive dry days (CDD) and number of consecutive wet days (CWD)). Table 2 summarizes the definitions of these indices [46].
The EPIs at each station were calculated using RclimDex. Annual values were calculated for all 11 EPIs, and monthly values were also calculated for the RX1day and RX5day. The dry season lasts from November of the previous year to April of the current year, and the wet season lasts from May to October [26]. In addition, the contributions of very wet-day precipitation (R95pT) and extremely wet-day precipitation (R99pT) were also calculated (R95pT = (R95p/PRCPTOT) × 100; R99pT = (R99p/PRCPTOT) × 100). The regionally averaged value of each EPI was calculated using the Thiessen polygon method for the five stations (Table 1). This method has been applied in research in Yunnan Province, China [14], which is adjacent to the SRYR. We selected the period 1961–1990 as the reference period, which is currently recommended by the WMO for evaluating long-term climate change [47]. Due to the lack of data for the period from August to December 1962, some indices at the Qumalai station could not be calculated. For these indices, the average values for the period 1961–1990 were used.
2.4. Statistical Analysis
The trends in the EPIs were assessed using the linear least squares method recommended by RclimDex [41]. The statistical significance of the trends was examined using the Mann–Kendall (MK) test [48,49]. The MK test is a nonparametric statistical method with the following advantages: the samples are not required to follow a certain distribution, and the test is not significantly affected by outliers. Consequently, the MK test is often used to evaluate the significance of trends in a time series of hydrological and meteorological variables. A positive (negative) standardized MK test statistic (Z) indicates an increasing (decreasing) trend. When |Z| > 1.96, the trend passes the significance test at the 5% significance level. When |Z| ≤ 1.96, the trend is statistically nonsignificant. The linear least squares method and the MK test have been extensively used to study EPIs [50,51]. Autocorrelation in a meteorological observation time series will affect its trend [52] and its significance level [53]. Hence, autocorrelation errors in extreme precipitation series were analyzed using the Durbin–Watson (DW) statistical test [54,55]. For a series with a length of 57 years, a DW statistic in the range of 1.61–2.39 indicates a no first-order autocorrelation (at the 5% significance level). The values of the DW statistics identified for the 11 EPIs selected in this study ranged from 1.84 to 2.31, suggesting no significant autocorrelation error. Thus, the effects of autocorrelation in the series were not taken into consideration in the trend analysis. In addition, a curve depicting changes in each EPI over time was also plotted using the locally weighted regression (LOESS) smoothing method, which is a robust nonparametric curve fitting method [56]. With the LOESS model, each smoothed value is determined by neighboring data points within the user-defined proportion of the data. The proportion of the data used for local fitting is known as the span of the smoother. A larger span leads to a smoother curve. Previous studies on extreme precipitation have usually chosen spans in the range of 0.25–0.45 [14,57,58]. In this study, spans of 0.25, 0.35, and 0.45 were tested on the 11 indices of the regionally averaged series. Visual analysis suggested a span of 0.35 could best characterize the interannual changes. Within the selected span (0.35), a second-order polynomial regression was fitted using a tricube weight function. Potential correlation analysis methods for two climatic variables includes mutual information [59,60], contingency tables [61], Spearman’s rank, and Pearson correlation [62]. We chose the Spearman’s rank correlation coefficient and the two-tailed t-test, a method commonly used to analyze correlations between EPIs [63]. To facilitate comparison with other studies, the trend rate of each EPI was multiplied by 10, i.e., the unit of the trend rate of each EPI was changed from annual to decadal [14,20,34,35,45,64,65,66,67].
3. Results
3.1. Changes in Annual Precipitation Extremes
3.1.1. Intensity Indices
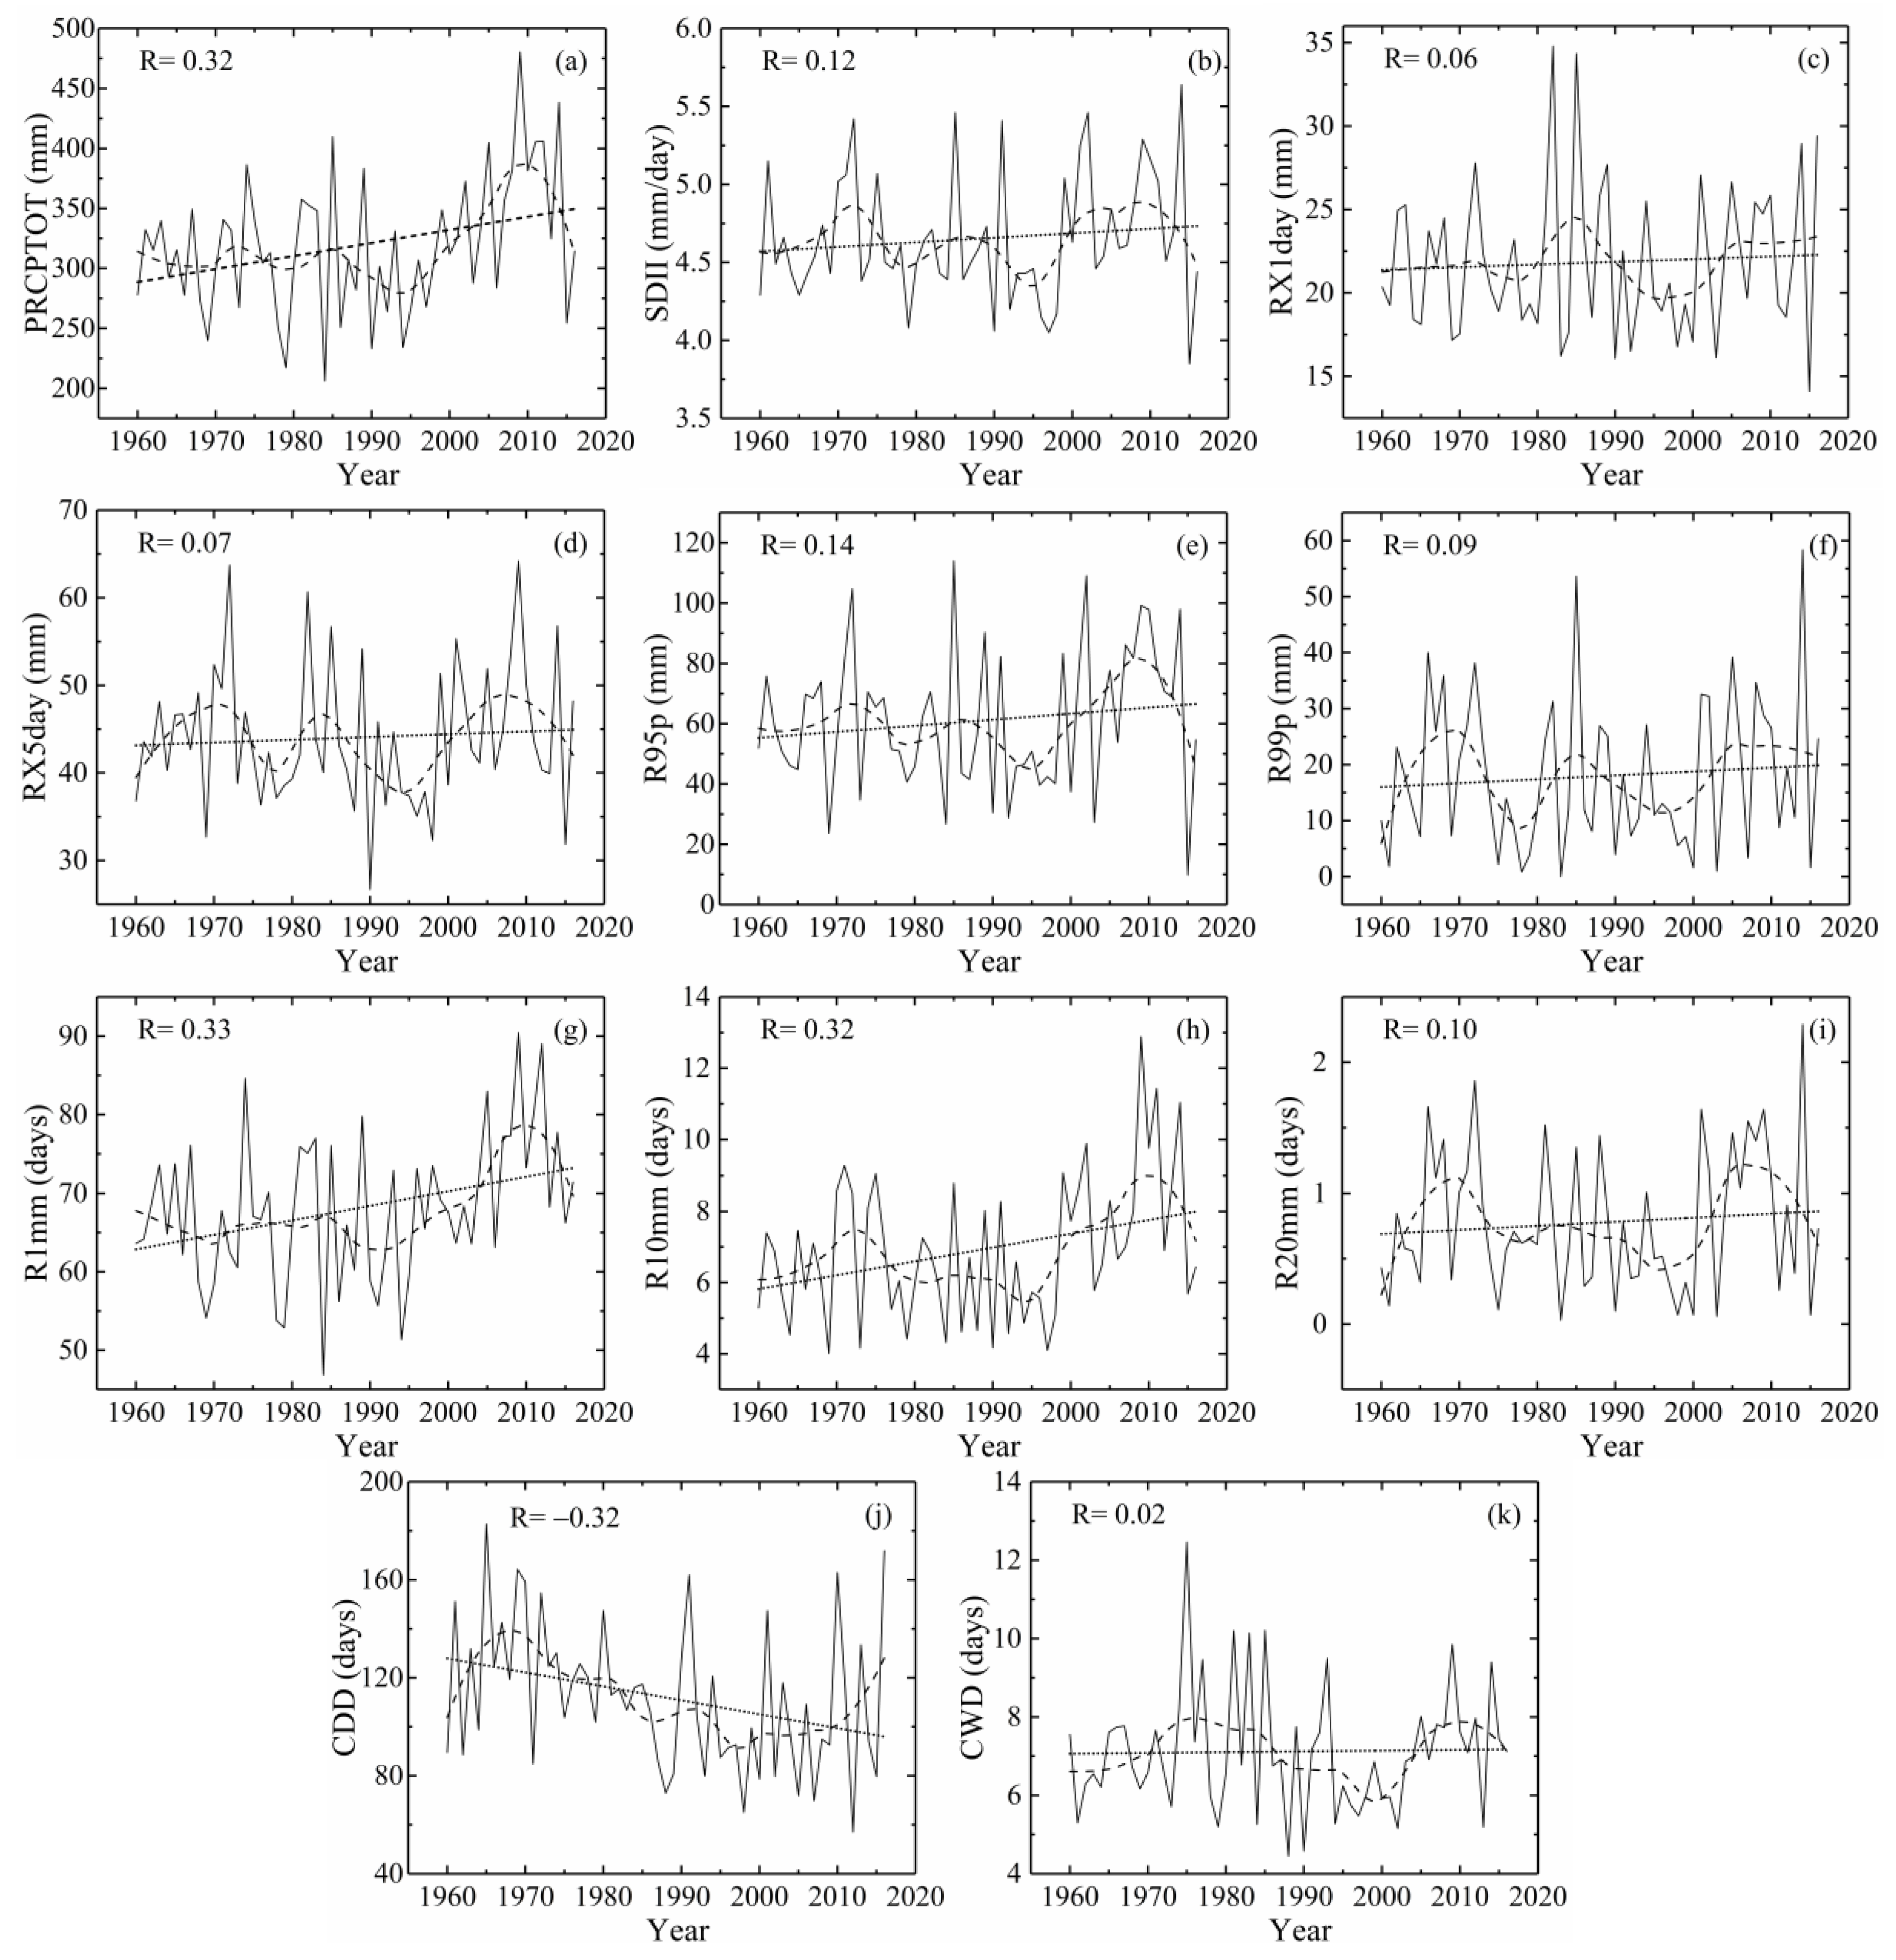
For the entire SRYR, the six precipitation intensity indices each displayed an increasing trend during 1960–2016; however, only the trend for PRCPTOT passed the significance test at the 5% significance level (Table 3). PRCPTOT had a regionally averaged trend rate of 10.90 mm/decade during the study period. PRCPTOT decreased in a fluctuating manner in the late 1960–1990s period, increased significantly in the 2000s (at a rate of 114.34 mm/decade), and then decreased again (Figure 2a). The interannual trends of SDII, RX1day, and R95p were similar to that of PRCPTOT (Figure 2b–e). The interannual changes in RX5day and R99p both fluctuated significantly, with maximums occurring in the late 2000s (Figure 2d–f).
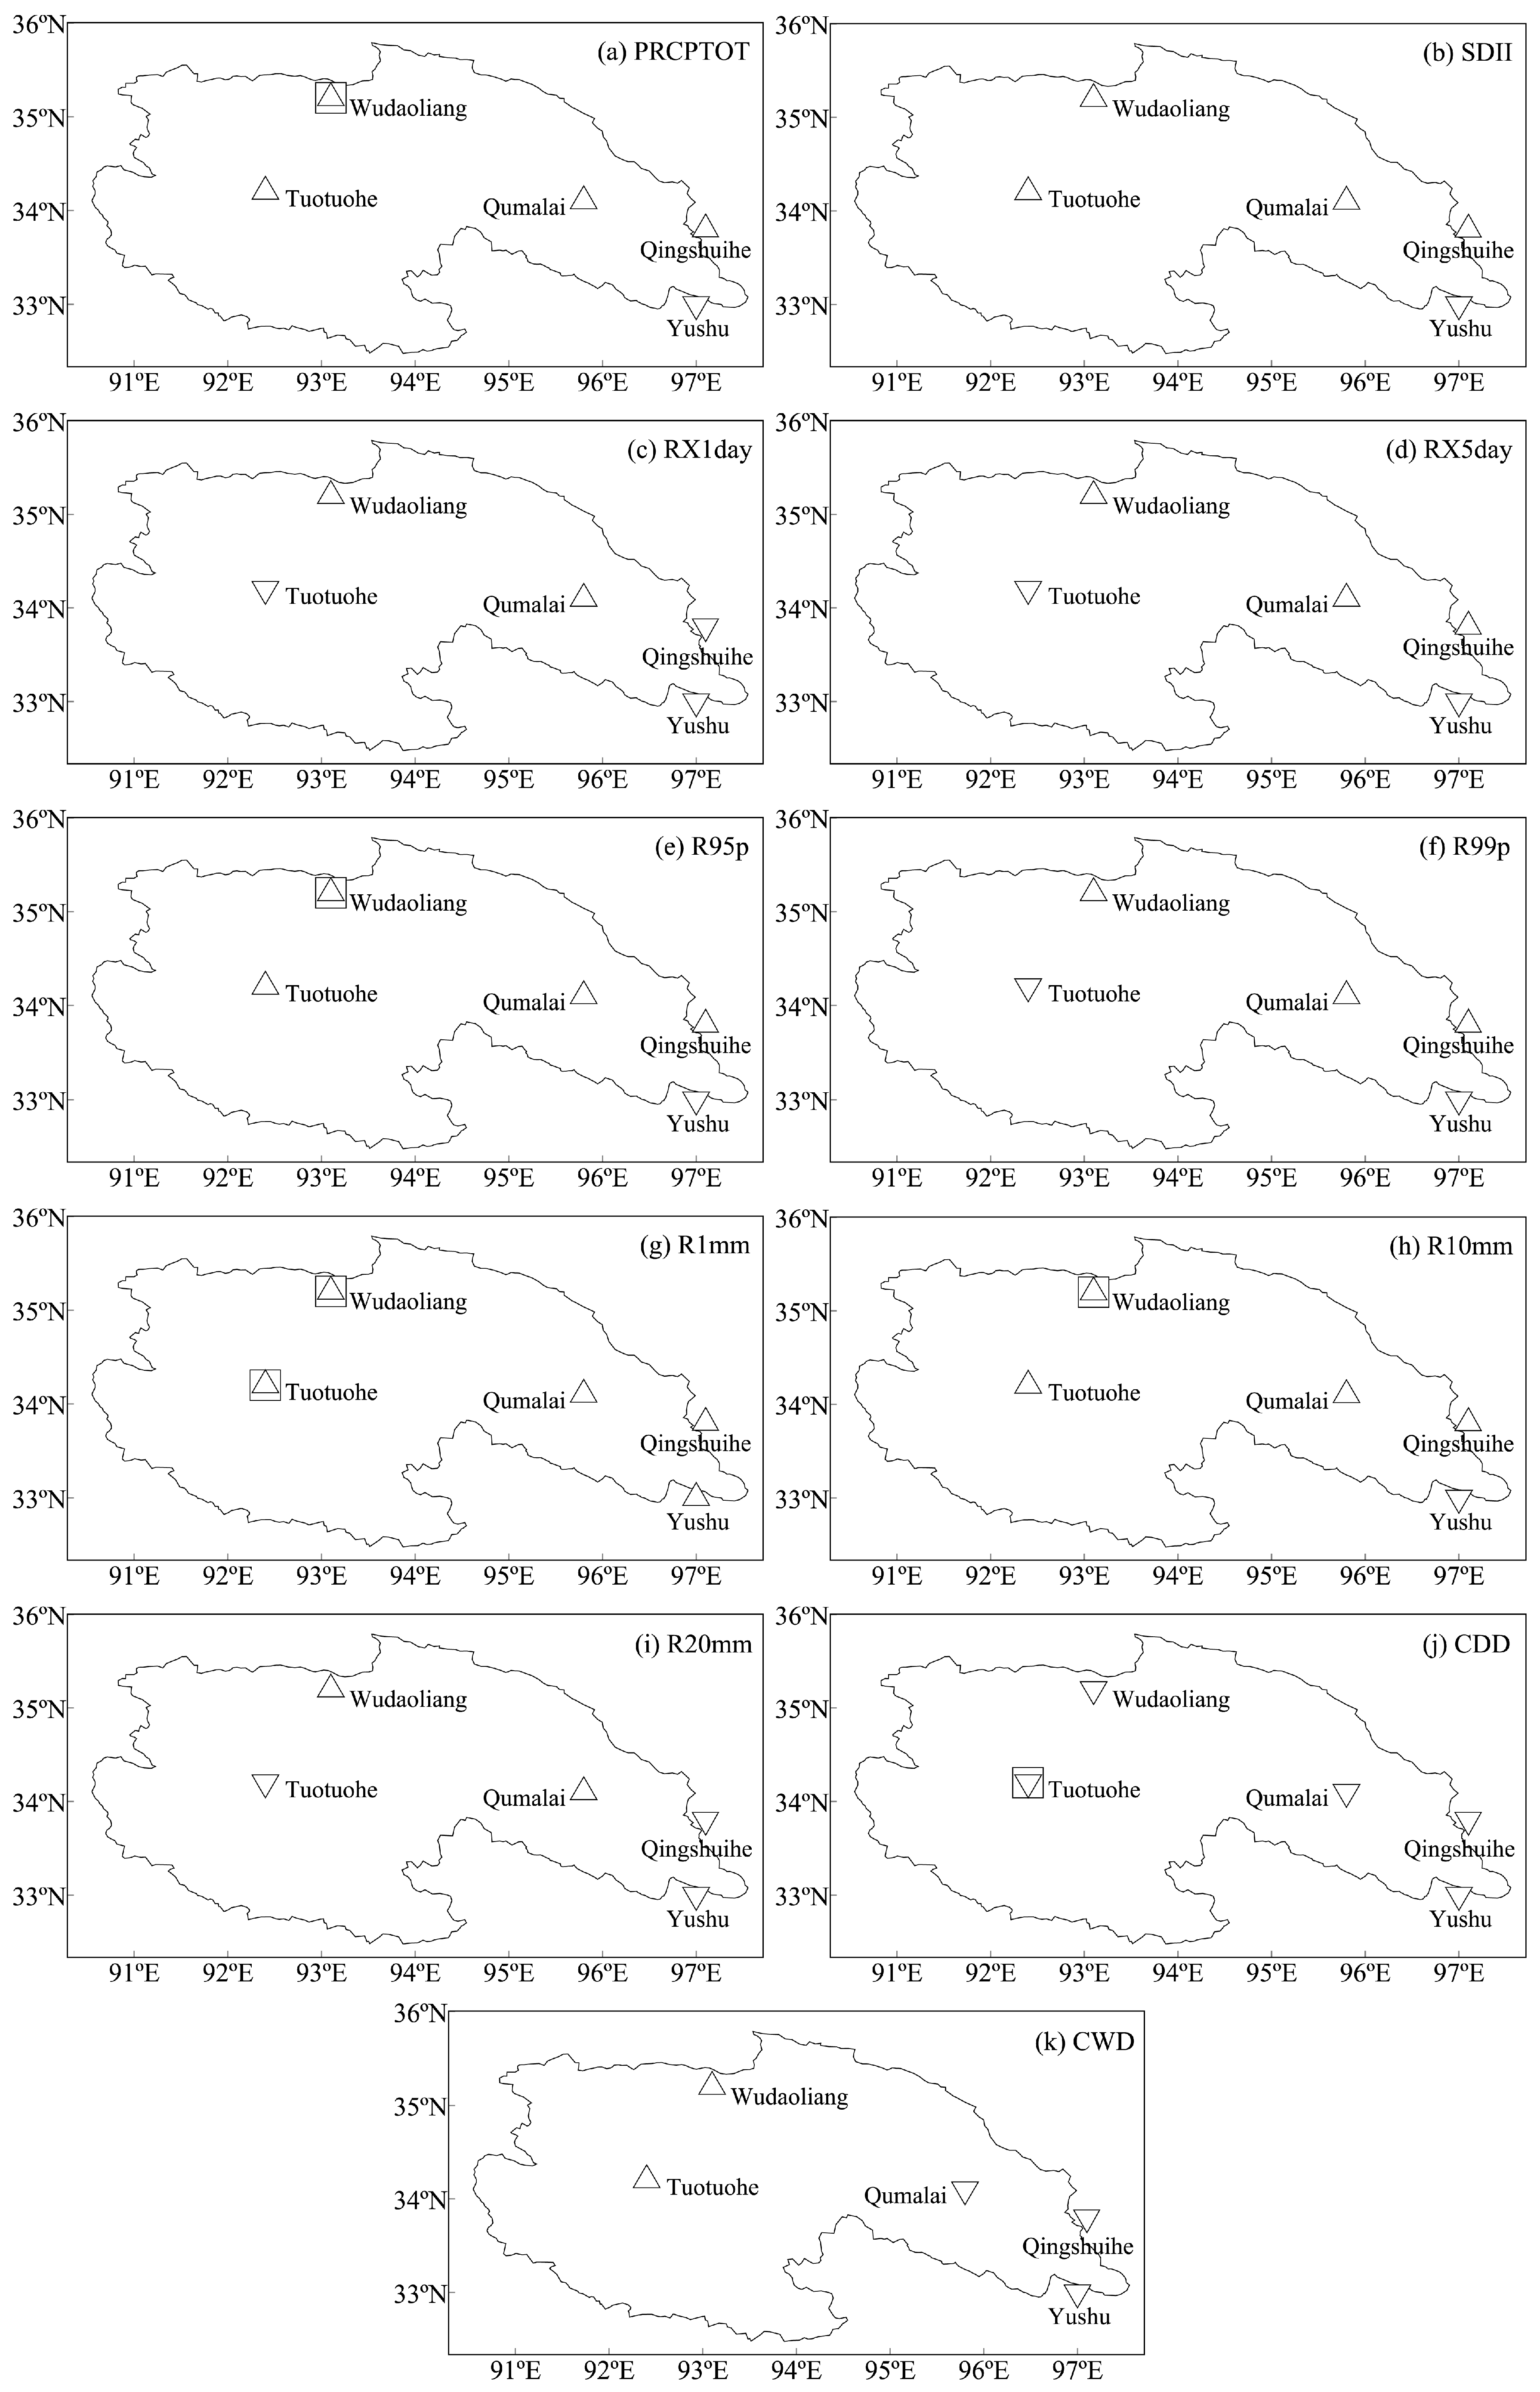
In terms of spatial distribution, PRCPTOT and R95p each exhibited an increasing trend at 80% of the stations. However, each of these two indices only exhibited a significant trend at the Wudaoliang station in the northern SRYR (with rates of 18.85 and 7.71 mm/decade, respectively) (Table 4). In addition, PRCPTOT and R95p each exhibited a decreasing trend only at the Yushu station in the southeastern SRYR (with rates of −0.97 and −2.8 mm/decade, respectively), but these trends were statistically nonsignificant (Figure 3a–e). SDII also exhibited an increasing trend at 80% of the stations, and exhibited a decreasing trend only at the Yushu station (with a rate of −0.10 mm/day/decade). RX1day displayed an increasing trend at the Wudaoliang station in the northern SRYR and the Qumalai station in the central SRYR (with rates of 0.44 and 0.86 mm/decade, respectively), and a decreasing trend at the other three stations (with rates ranging from −0.2 to −0.27 mm/decade). RX5day and R99p each exhibited increasing trends at 60% of the stations and decreasing trends at the Tuotuohe and Yushu stations. The trends in SDII, RX1day, RX5day, and R99p at the five stations did not pass the significance test at the 5% significance level (Figure 3b–f).
3.1.2. Frequency and Duration Indices
In 1960–2016, the precipitation frequency indices (R1mm, R10mm, and R20mm) and CWD for the SRYR exhibited increasing trends, whereas the CDD exhibited a decreasing trend. However, only the trends for R1mm and CDD were statistically significant (Table 3). As shown in Figure 2g–h, the interannual changes in R1mm and R10mm were similar to those in PRCPTOT. In addition, R20mm represented a regionally averaged value of only 0.8 days/year; the interannual changes in R20mm were similar to those for R99p. CDD and CWD had a regionally averaged value of 112 and 7.1 days/year, respectively. Overall, these two indices each exhibited a decreasing trend in the 1970–1990s period and a significant increasing trend later (Figure 2j–k).
In terms of spatial distribution, R1mm exhibited an increasing trend at each of the five stations in the SRYR, but its trend passed the significance test at the 5% significance level at only two stations (Wudaoliang and Tuotuohe stations) (Figure 3g). R10mm exhibited an increasing trend at four stations, but only the trend at the Wudaoliang station (increasing at a rate of 0.78 days/decade) was significant. R10mm exhibited a decreasing trend only at the Yushu station (at a rate of −0.28 days/decade); however, this trend was nonsignificant (Figure 3h). R20mm exhibited an increasing trend at two stations and a decreasing trend at three stations. There were no significant changes in R20mm at any of the stations (Figure 3i). CDD displayed a decreasing trend at the five stations (at a rate ranging from −0.54 to −10.58 days/decade), but only the changes at the Tuotuohe station were significant (at a rate of −10.58 days/decade) (Figure 3j). The maximum and average CDD at the Tuotuohe station in the period 1960–2016 were 212 days and 131 days/year, respectively. CWD exhibited a nonsignificant increasing trend at the Wudaoliang station in the northern SRYR and the Tuotuohe station in the western SRYR, and a nonsignificant decreasing trend at the other three stations.
3.2. Changes in Seasonal Precipitation Extremes
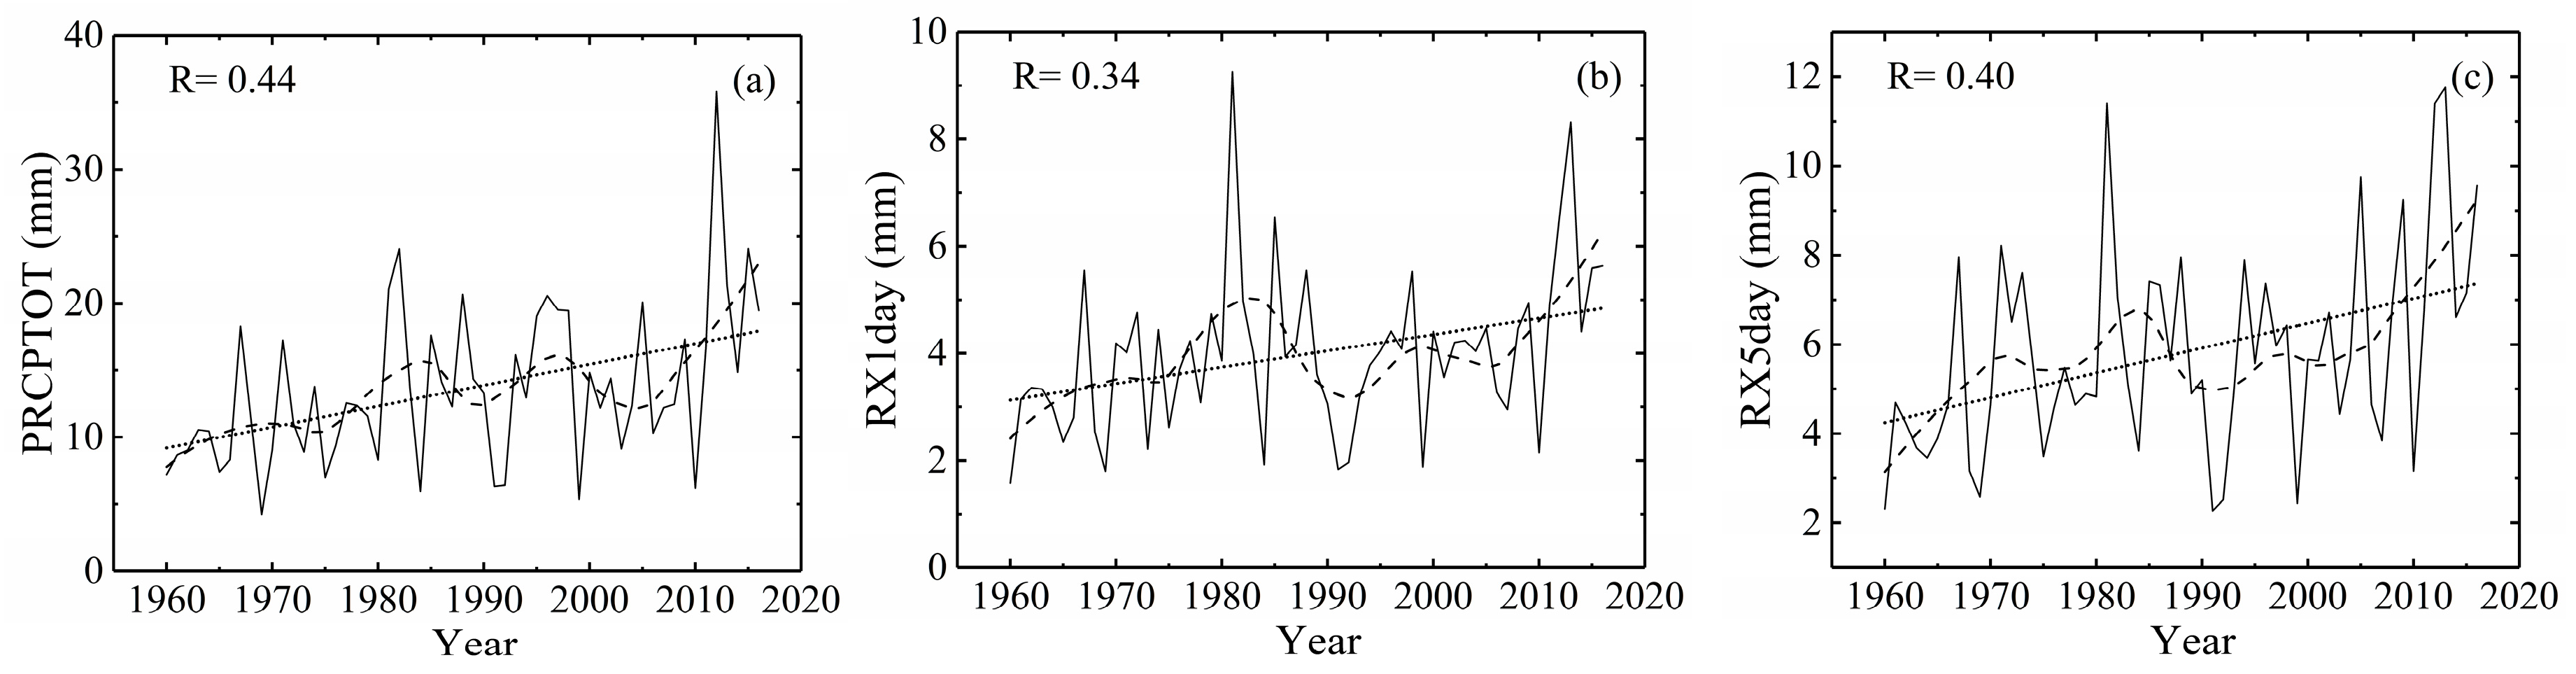
Precipitation in the SRYR exhibits notable seasonal characteristics. Wet-season (May–October) PRCPTOT accounted for approximately 94% of the annual PRCPTOT. To further understand the changes in extreme precipitation in the SRYR, three indices, namely, PRCPTOT, RX1day, and RX5day, were selected to analyze the seasonal (wet- and dry-season) changes in extreme precipitation in the region. The trends in the regionally averaged PRCPTOT, RX1day, and RX5day values for the SRYR were nonsignificant in the wet season during 1960–2016 (Table 5). The interannual trends in these three indices were similar to those of their respective annual values (figure not shown for the sake of brevity). It is worth noting that the PRCPTOT, RX1day, and RX5day for the SRYR displayed significant increasing trends in the dry season with rates of 1.56, 0.31, and 0.56 mm/decade, respectively (Table 5 and Figure 4). Particularly at the Yushu station, these three indices exhibited decreasing trends in the wet season but notable increasing trends in the dry season (Table 6). In terms of spatial distribution, PRCPTOT, RX1day and RX5day exhibited increasing trends in the dry season at all stations, and their trends passed the significance test at the 5% significance level at 100%, 20%, and 80% of the stations, respectively (Table 5 and Figure 5).
3.3. Analysis of Correlations of Precipitation Indices
As shown in Table 7, there was a positive correlation between annual PRCPTOT and each of the other EPIs (except CDD), which passed the significance test at a 1% significance level. This indicates that EPIs can relatively satisfactorily reflect changes in PRCPTOT.
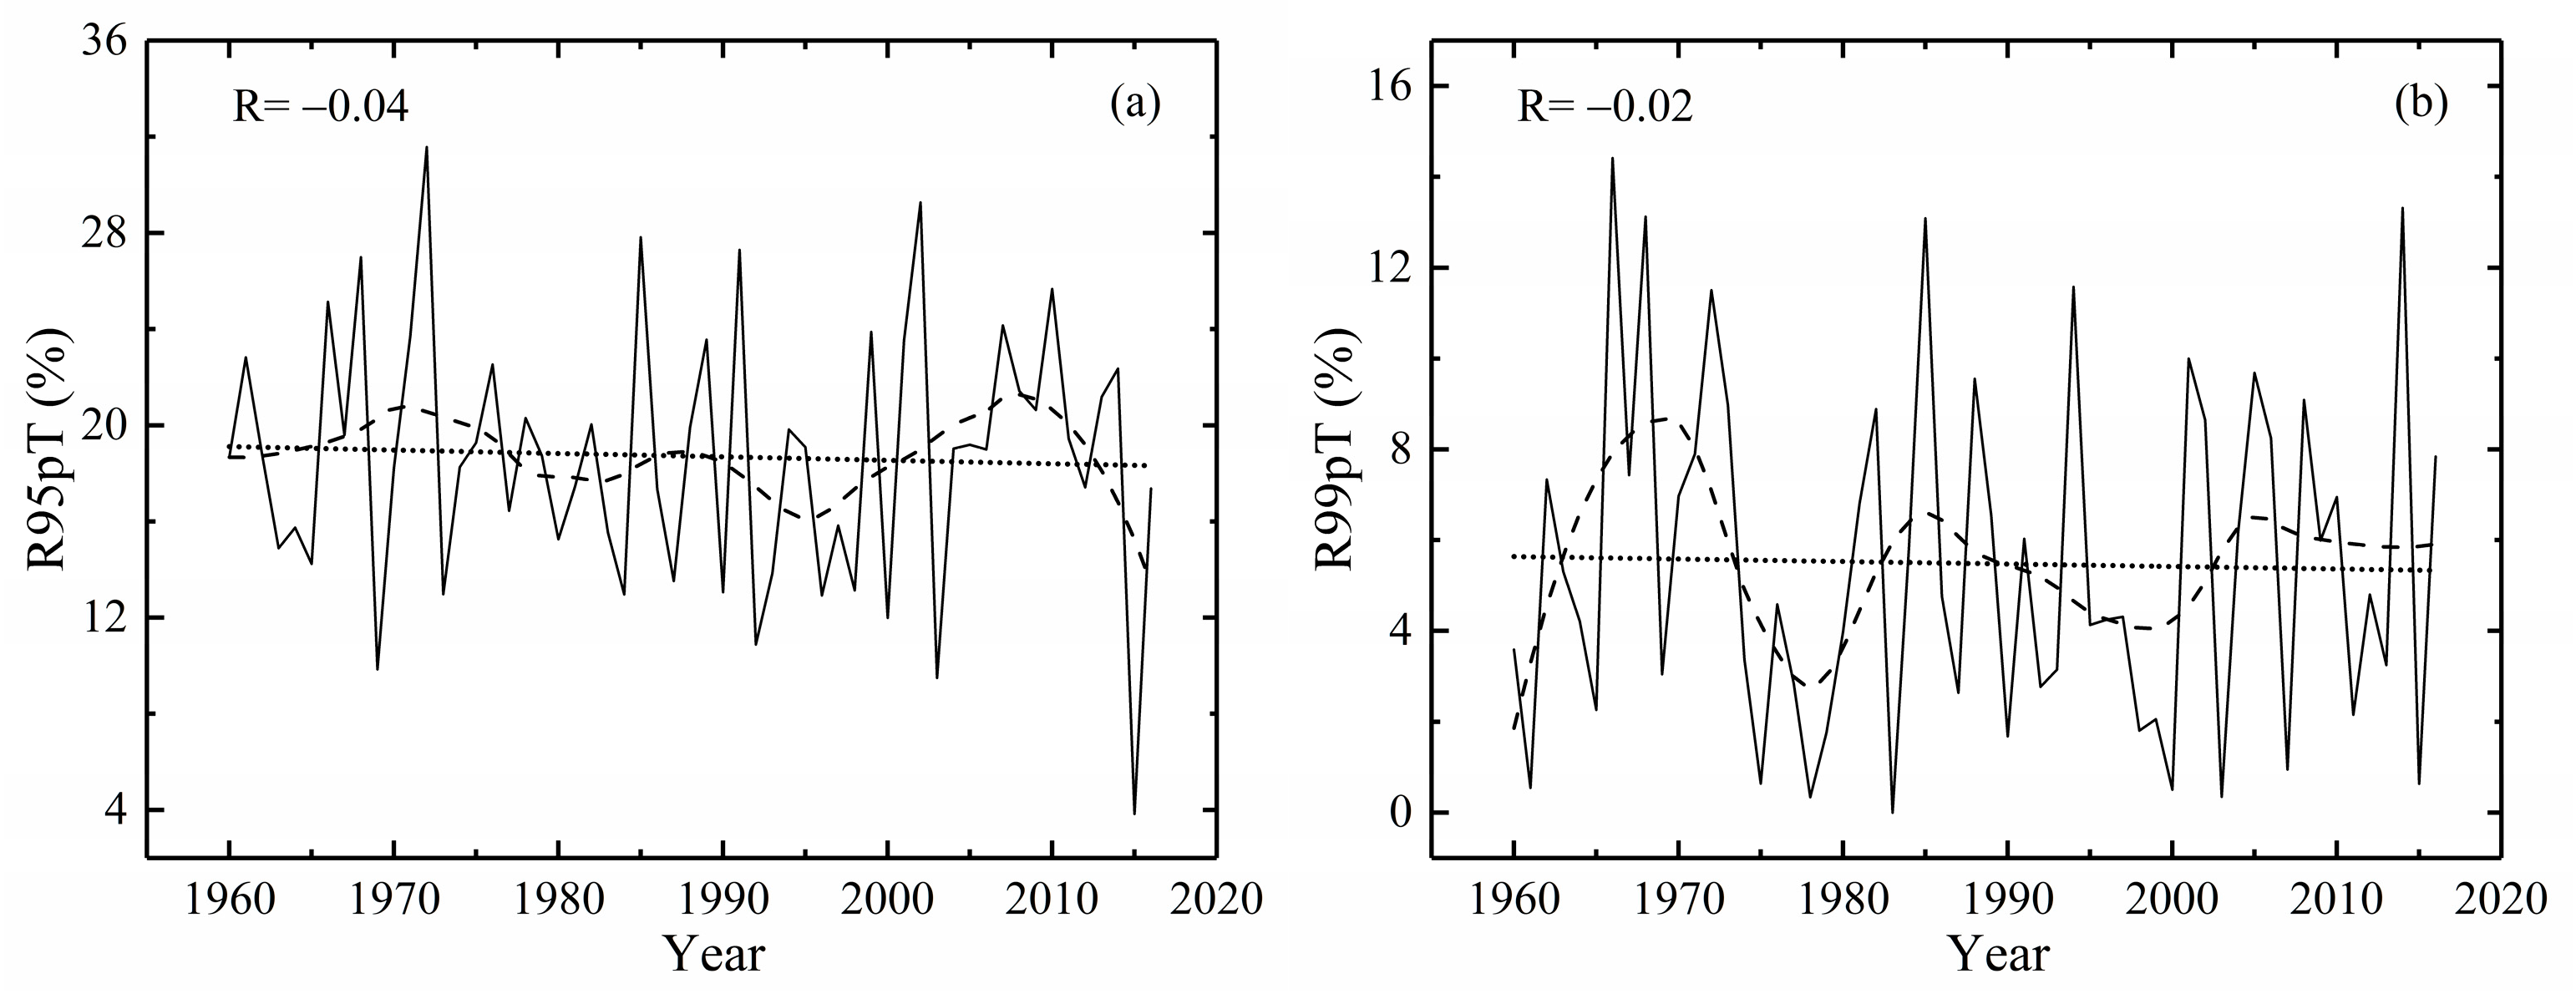
The percentage of extreme precipitation (including R95p and R99p) to annual PRCPTOT was used to reflect the contribution of extreme precipitation to PRCPTOT. In 1960–2016, the R95pT and R99pT for the SRYR exhibited decreasing trends (with rates of −0.14 and −0.06%/decade, respectively). The R95pT for the region varied from 3.84% to 31.57% (Figure 6a). Among the five stations, R95pT exhibited an increasing trend only at the Wudaoliang station (with a rate of 1.12%/decade). The R99pT for the region varied from 0.00% to 14.51% (Figure 6b). R99pT exhibited a decreasing trend at 40% of the stations (Tuotuohe and Yushu stations). The R95pT and R99pT trends did not pass the significance test at the 5% significance level for any station.
Moreover, as shown in Table 7, PRCPTOT was most strongly correlated with R1mm (r = 0.89). Furthermore, the correlation coefficients between R95p and SDII, R99p and RX1day, R10mm and SDII, R10mm and R95p, R20mm and R99p exceeded 0.8, and their correlations were significant at the 1% significance level.
4. Discussion
In 1960–2016, the intensity and frequency of extreme precipitation, as well as CWD, in the SRYR generally increased, while the CDD generally decreased. The trends for most of the EPIs in the SRYR were generally consistent with those for the entire world [45], China [64], the Tibetan Plateau [34], and some adjacent regions [65,67]. However, there were some differences. For example, the trends for R95p, R99p, RX1day, RX5day, R1mm, R20mm, and CDD in the SRYR were opposite to those found for southeastern Tibet [20]. In addition, the trends in some of the SRYR indices differed from those for the Loess Plateau [66] and Yunnan Province [14] (Table 8). Nevertheless, the climate became increasingly wet, which was consistent with trends across the Tibetan Plateau [34]. Spatially, no consistent trends were identified between stations, except for the R1mm and CDD indices, both of which exhibited consistent regional trends. For example, the values of all indices (except CDD) generally increased at the Wudaoliang station in the northern SRYR. In particular, the trends of PRCPTOT, R95p, R1mm, and R10mm all passed the significance test at the 5% significance level. In contrast, at the Yushu station in southeastern SRYR, all of the indices (except R1mm) exhibited decreasing trends, indicating that the local climate experienced a drying trend. These data show that the response of extreme precipitation to climate change may vary between regions, and further demonstrates the importance of studying extreme precipitation at various scales.
In regard to changes in seasonal indices, dry-season PRCPTOT, RX1day, and RX5day displayed relatively consistent temporal and spatial distribution patterns. The regional averages for these three indices significantly increased, and all stations exhibited a consistent increase in values. The regional trends in wet-season PRCPTOT, RX1day, and RX5day were consistent with those of their respective annual values, exhibiting nonsignificant increasing trends and decreasing trends at 20%, 60%, and 40% of the stations, respectively. These results suggest that the response of extreme precipitation to climate change is more sensitive in the dry season than the wet season in the SRYR. Snow is the primary form of precipitation in the dry season in the SRYR. The significant increase in dry-season PRCPTOT at each station suggests a general increase in snowfall in the region. Increases in snowfall can facilitate glacier ice accumulation, produce runoff changes in the SRYR [68], and also increase the chances of snow disasters [69]. RX5day is often used as an indicator of potential flood risk. For example, Chen et al. [70] used L-moments [71] to perform a regional frequency analysis of RX5day and other EPIs in the Yangtze River Basin to assess the risk of floods. Furthermore, RX5day can also be used as a potential risk index for snow disasters in the dry season. The RX5day index increased significantly during the dry season in the SRYR, with the most notable increases at the Yushu and Qingshuihe stations (Table 6). To some extent, this suggests an increase in the risk and frequency of snow disaster occurrences in the region. This finding is similar to conclusions derived from previous studies suggesting that the central Tibetan Plateau is a region with a high risk of snow disasters [72] and that Yushu Prefecture in Qinghai Province is a region prone to frequent snow disasters [73].
Some studies [14,20,67] have demonstrated strong correlations between most EPIs and annual PRCPTOT. These correlations were also observed in this study. However, both the decreasing trends in R95pT and R99pT for the SRYR were nonsignificant at the 5% significance level. This suggests a nonsignificant contribution of extreme precipitation to PRCPTOT. This conclusion differs from previous observations; for example, increasing trends were observed for R95pT and R99pT in Yunnan Province [14], the Tibetan Plateau [34], and China [64].
Precipitation on the Tibetan Plateau is primarily affected by monsoons and westerlies. Under the combined action of different atmospheric circulation systems, and due to the region’s unique topographic conditions, extreme precipitation on the Tibetan Plateau exhibits notable local characteristics [34]. Tang et al. [74] concluded that South Asian monsoons are the primary atmospheric circulation factor affecting precipitation in the SRYR. Li et al. [75] found that plateau monsoons, El Niño events, and plateau snow cover are the primary factors governing interannual changes in extreme climate events in the SRYR. In addition, topography also significantly affects spatial changes in extreme precipitation. Due to the extremely complex mechanism by which extreme precipitation responds to global warming, as well as the unique geographical environment and complex topographical conditions in the SRYR, the feedback mechanism between extreme precipitation and climate change remains unclear and requires further investigation.
5. Conclusions
In this study, the temporal trends and spatial distribution patterns of 11 EPIs were analyzed across the SRYR using the linear least squares method and the MK test. Daily precipitation data collected at five meteorological stations during 1960–2016 were used in this study. In addition, the correlations between the EPIs were also analyzed. The primary conclusions derived from this study are summarized as follows:
(1) Temporally, regionally averaged EPI values (except CDD) generally increased during the study period. However, of the 11 indices, only the trends identified for PRCPTOT, CDD and R1mm were significant and exhibited rates of 10.90 mm/decade, 1.87 days/decade, and −5.70 days/decade, respectively. The changes in wet-season PRCPTOT, RX1day, and RX5day across the SRYR were similar to changes in their respective annual values; these three indices exhibited nonsignificant increasing trends. However, regionally averaged PRCPTOT, RX1day, and RX5day for dry-season exhibited significant increasing trends with rates of 1.56, 0.31, and 0.56 mm/decade, respectively.
(2) Spatially, the trends for all 11 EPIs varied notably among the stations, except for CDD and R1mm, which exhibited consistent trends across all stations. The spatial changes in wet-season PRCPTOT, RX1day, and RX5day were similar to changes in their respective annual values. However, dry-season PRCPTOT, RX1day, and RX5day exhibited increasing trends across all stations in the study area, and these trends were significant at 100%, 20% and 80% of the stations, respectively.
(3) Strong correlations were found between annual PRCPTOT and most of the other EPIs for the SRYR. The contribution rates of R95p and R99p to annual PRCPTOT exhibited nonsignificant decreasing trends.
This study provides a theoretical basis for further investigations into the mechanism by which extreme precipitation responds to climate change, and the effects of extreme precipitation on water resources and ecological environments in the SRYR.
Author Contributions
Conceptualization, B.Z.; Data Curation, B.Z. and Q.D.; Formal Analysis, B.Z.; Methodology, C.L.; Software, C.L.; Validation, P.Z. and Q.D.; Writing–Original Draft, B.Z.; Writing–Review & Editing, C.L. and P.Z.
Funding
This study was supported by the National Natural Science Foundation of China (Grant No. 41271045).
Acknowledgments
We would like to thank the National Climatic Centre of the China Meteorological Administration for providing the climate database used in this study. We also thank the editors and the anonymous reviewers for their significant assistance with this manuscript.
Conflicts of Interest
The authors declare no conflict of interest.
References
- Huntington, T.G. Evidence for intensification of the global water cycle: Review and synthesis. J. Hydrol. 2006, 319, 83–95. [Google Scholar] [CrossRef]
- Allan, R.P.; Soden, B.J. Atmospheric warming and the amplification of precipitation extremes. Science 2008, 321, 1481–1484. [Google Scholar] [CrossRef] [PubMed]
- Easterling, D.R.; Meehl, G.A.; Parmesan, C.; Changnon, S.A.; Karl, T.R.; Mearns, L.O. Climate extremes: Observations, modeling, and impacts. Science 2000, 289, 2068–2074. [Google Scholar] [CrossRef] [PubMed]
- Field, C.B.; Barros, V.; Stocker, T.F.; Dahe, Q.; Dokken, D.J.; Ebi, K.L.; Mastrandrea, M.D.; Mach, K.J.; Plattner, G.-K.; Allen, S.K.; et al. IPCC, 2012: Managing the Risks of Extreme Events and Disasters to Advance Climate Change Adaptation. A Special Report of the Intergovernmental Panel on Climate Change; Cambridge University Press: Cambridge, UK, 2012; ISBN 978-1-107-02506-6. [Google Scholar]
- Alexander, L.V.; Zhang, X.; Peterson, T.C.; Caesar, J.; Gleason, B.; Klein Tank, A.M.G.; Haylock, M.; Collins, D.; Trewin, B.; Rahimzadeh, F.; et al. Global observed changes in daily climate extremes of temperature and precipitation. J. Geophys. Res. Atmos. 2006, 111, D05109. [Google Scholar] [CrossRef]
- Alexander, L.V. Global observed long-term changes in temperature and precipitation extremes: A review of progress and limitations in IPCC assessments and beyond. Weather Clim. Extrem. 2016, 11, 4–16. [Google Scholar] [CrossRef]
- Klein Tank, A.M.G.; Können, G.P. Trends in Indices of Daily Temperature and Precipitation Extremes in Europe, 1946–99. J. Clim. 2003, 16, 3665–3680. [Google Scholar] [CrossRef] [Green Version]
- Peterson, T.C.; Zhang, X.; Brunet-India, M.; Vázquez-Aguirre, J.L. Changes in North American extremes derived from daily weather data. J. Geophys. Res. 2008, 113, D07113. [Google Scholar] [CrossRef]
- Zhang, M.; Chen, Y.; Shen, Y.; Li, Y. Changes of precipitation extremes in arid Central Asia. Quat. Int. 2017, 436, 16–27. [Google Scholar] [CrossRef]
- Donat, M.G.; Peterson, T.C.; Brunet, M.; King, A.D.; Almazroui, M.; Kolli, R.K.; Boucherf, D.; Al-Mulla, A.Y.; Nour, A.Y.; Aly, A.A.; et al. Changes in extreme temperature and precipitation in the Arab region: Long-term trends and variability related to ENSO and NAO. Int. J. Climatol. 2014, 34, 581–592. [Google Scholar] [CrossRef]
- You, Q.; Kang, S.; Aguilar, E.; Pepin, N.; Flügel, W.-A.; Yan, Y.; Xu, Y.; Zhang, Y.; Huang, J. Changes in daily climate extremes in China and their connection to the large scale atmospheric circulation during 1961–2003. Clim. Dyn. 2011, 36, 2399–2417. [Google Scholar] [CrossRef]
- Soltani, M.; Laux, P.; Kunstmann, H.; Stan, K.; Sohrabi, M.M.; Molanejad, M.; Sabziparvar, A.A.; SaadatAbadi, A.R.; Ranjbar, F.; Rousta, I.; et al. Assessment of climate variations in temperature and precipitation extreme events over Iran. Theor. Appl. Climatol. 2016, 126, 775–795. [Google Scholar] [CrossRef]
- Pińskwar, I.; Choryński, A.; Graczyk, D.; Kundzewicz, Z.W. Observed changes in extreme precipitation in Poland: 1991–2015 versus 1961–1990. Theor. Appl. Climatol. 2018, 1–15. [Google Scholar] [CrossRef] [Green Version]
- Li, Y.; He, D.; Hu, J.; Cao, J. Variability of extreme precipitation over Yunnan Province, China 1960–2012. Int. J. Climatol. 2015, 35, 245–258. [Google Scholar] [CrossRef]
- André Attogouinon, A.; Lawin, A.E.; M’Po, Y.N.; Houngue, R. Extreme precipitation indices trend assessment over the Upper Oueme River Valley-(Benin). Hydrology 2017, 4, 36. [Google Scholar] [CrossRef]
- Bezerra, B.G.; Silva, L.L.; e Silva, C.M.; de Carvalho, G.G. Changes of precipitation extremes indices in São Francisco River Basin, Brazil from 1947 to 2012. Theor. Appl. Climatol. 2018, 1–12. [Google Scholar] [CrossRef]
- Aguilar, E.; Aziz Barry, A.; Brunet, M.; Ekang, L.; Fernandes, A.; Massoukina, M.; Mbah, J.; Mhanda, A.; do Nascimento, D.J.; Peterson, T.C.; et al. Changes in temperature and precipitation extremes in western central Africa, Guinea Conakry, and Zimbabwe, 1955–2006. J. Geophys. Res. 2009, 114, D02115. [Google Scholar] [CrossRef]
- Gallant, A.J.E.; Hennessy, K.J.; Risbey, J. Trends in rainfall indices for six Australian regions: 1910–2005. Aust. Meteorol. Mag. 2007, 56, 18. [Google Scholar]
- Haylock, M.R.; Peterson, T.C.; Alves, L.M.; Ambrizzi, T.; Anunciação, Y.M.T.; Baez, J.; Barros, V.R.; Berlato, M.A.; Bidegain, M.; Coronel, G.; et al. Trends in total and extreme South American rainfall in 1960–2000 and links with sea surface temperature. J. Clim. 2006, 19, 1490–1512. [Google Scholar] [CrossRef]
- Zhang, J.; Shen, X.; Wang, B. Changes in precipitation extremes in Southeastern Tibet, China. Quat. Int. 2015, 380–381, 49–59. [Google Scholar] [CrossRef]
- Pan, B.; Li, J.; Chen, F. Qinghai-Tibetan Plateau: a driver and amplifier of the global climate change III. The effects of the uplift of Qinghai-Tibetan Plateau on climate changes. J Lanzhou Univ Nat Sci 1996, 32, 108–115. (In Chinese) [Google Scholar]
- Feng, S.; Tang, M.; Wang, D. New evidence for the Qinghai-Xizang (Tibet) Plateau as a pilot region of climatic fluctuation in China. Chin. Sci. Bull. 1998, 43, 1745–1749. (In Chinese) [Google Scholar] [CrossRef]
- Liang, X.; Yang, M.; Wan, G.; Wang, X.; Li, Q. Research on the homogeneity of air temperature series over Tibetan Plateau. J. Glaciol. Geocryol. 2015, 37, 275–285. [Google Scholar] [CrossRef]
- Qin, D.; Zhang, J.; Shan, C.; Song, L. China National Assessment Report on Risk Management and Adaptation of Climate Extremes and Disasters (Refined Edition); Science Press: Beijing, China, 2015; ISBN 978-7-03-043485-2. (In Chinese) [Google Scholar]
- Stocker, T.F.; Qin, D.; Plattner, G.-K.; Tignor, M.M.B.; Allen, S.K.; Boschung, J.; Nauels, A.; Xia, Y.; Bex, V.; Midgley, P.M. IPCC, 2013: Summary for Policymakers. In Climate Change 2013: The Physical Science Basis. Contribution of Working Group I to the Fifth Assessment Report of the Intergovernmental Panel on Climate Change; Cambridge University Press: Cambridge, UK, 2013; ISBN 978-1-107-05799-1. [Google Scholar]
- Du, Y.; Berndtsson, R.; An, D.; Zhang, L.; Hao, Z.; Yuan, F. Hydrologic response of climate change in the Source Region of the Yangtze River, based on water balance analysis. Water 2017, 9, 115. [Google Scholar] [CrossRef]
- Zhang, Q.; Kang, S.; Yan, Y. Characteristics of spatial and temporal variations of monthly mean surface air temperature over Qinghai-Tibet Plateau. Chin. Geogr. Sci. 2006, 16, 351–358. [Google Scholar] [CrossRef]
- Deng, C.; Zhang, W. Spatiotemporal distribution and the characteristics of the air temperature of a river source region of the Qinghai-Tibet Plateau. Environ. Monit. Assess. 2018, 190, 368. [Google Scholar] [CrossRef] [PubMed]
- Farrington, J.D. Impacts of Climate Change on the Yangtze Source Region and Adjacent Areas: Qinghai-Tibet Plateau, China; China Meteorological Press: Beijing, China, 2010; ISBN 978-7-5029-4602-9. [Google Scholar]
- Wan, G.; Yang, M.; Liu, Z.; Wang, X.; Liang, X. The precipitation variations in the Qinghai-Xizang (Tibetan) Plateau during 1961–2015. Atmosphere 2017, 8, 80. [Google Scholar] [CrossRef]
- Qu, B.; Lv, A.; Jia, S.; Zhu, W. Daily precipitation changes over large river basins in China, 1960–2013. Water 2016, 8, 185. [Google Scholar] [CrossRef]
- Liang, C.; Hou, X.; Pan, N. Spatial and temporal variations of precipitation and runoff in the source region of the Yangtze River. South-to-North Water Divers. Water Sci. Technol. 2011, 9, 53–59. (In Chinese) [Google Scholar] [CrossRef]
- Qi, D.; Zhang, S.; Li, Y. Research progress on variations of the climate and water resources in the source region of the Yangtze River. Plateau Mt. Meteorol. Res. 2013, 33, 8996. (In Chinese) [Google Scholar] [CrossRef]
- Ge, G.; Shi, Z.; Yang, X.; Hao, Y.; Guo, H.; Kossi, F.; Xin, Z.; Wei, W.; Zhang, Z.; Zhang, X.; et al. Analysis of precipitation extremes in the Qinghai-Tibetan Plateau, China: spatio-temporal characteristics and topography effects. Atmosphere 2017, 8, 127. [Google Scholar] [CrossRef]
- Guan, Y.; Zheng, F.; Zhang, X.; Wang, B. Trends and variability of daily precipitation and extremes during 1960–2012 in the Yangtze River Basin, China. Int. J. Climatol. 2017, 37, 1282–1298. [Google Scholar] [CrossRef]
- Cao, L.; Pan, S. Changes in precipitation extremes over the “Three-River Headwaters” region, hinterland of the Tibetan Plateau, during 1960–2012. Quat. Int. 2014, 321, 105–115. [Google Scholar] [CrossRef]
- Qian, K.; Wang, X.-S.; Lv, J.; Wan, L. The wavelet correlative analysis of climatic impacts on runoff in the source region of Yangtze River, in China. Int. J. Climatol. 2014, 34, 2019–2032. [Google Scholar] [CrossRef]
- Dataset of Daily Climate Data from Chinese Surface Stations (V3.0). Available online: http://data.cma.cn/data/cdcdetail/dataCode/SURF_CLI_CHN_MUL_DAY_V3.0.html (accessed on 22 May 2017). (In Chinese).
- Yan, Z.; Li, Z.; Xia, J. Homogenization of climate series: The basis for assessing climate changes. Sci. China Earth Sci. 2014, 57, 2891–2900. [Google Scholar] [CrossRef]
- ETCCDI/CRD Climate Change Indices: Software. Available online: http://etccdi.pacificclimate.org/software.shtml (accessed on 12 May 2017).
- Zhang, X.; Yang, F. RClimDex (1.0) User Manual. 2004. Available online: http://etccdi.pacificclimate.org/RClimDex/RClimDexUserManual.doc (accessed on 12 May 2017).
- Wang, X.; Chen, H.; Wu, Y.; Feng, Y.; Pu, Q. New techniques for the detection and adjustment of shifts in daily precipitation data series. J. Appl. Meteorol. Climatol. 2010, 49, 2416–2436. [Google Scholar] [CrossRef]
- Wang, X. Accounting for autocorrelation in detecting mean shifts in climate data series using the penalized maximal t or F test. J. Appl. Meteorol. Climatol. 2008, 47, 2423–2444. [Google Scholar] [CrossRef]
- Wang, X.; Yang, F. RHtests_dlyPrcp User Manual. Available online: http://etccdi.pacificclimate.org/RHtest/RHtests_dlyPrcp_UserManual_10Dec2014.pdf (accessed on 12 May 2017).
- Donat, M.G.; Alexander, L.V.; Yang, H.; Durre, I.; Vose, R.; Caesar, J. Global land-based datasets for monitoring climatic extremes. Bull. Am. Meteorol. Soc. 2013, 94, 997–1006. [Google Scholar] [CrossRef]
- ETCCDI/CRD Climate Change Indices: Definitions of the 27 Core Indices. Available online: http://etccdi.pacificclimate.org/list_27_indices.shtml (accessed on 12 May 2017).
- New Two-Tier Approach on “Climate Normals”. Available online: https://public.wmo.int/en/media/news/new-two-tier-approach-%E2%80%9Cclimate-normals%E2%80%9D (accessed on 13 August 2017).
- Mann, H.B. Nonparametric tests against trend. Econometrica 1945, 13, 245–259. [Google Scholar] [CrossRef]
- Kendall, M.G. Rank Correlation Methods, 4th ed.; Charles Griffin & Company Limited: London, UK, 1970; ISBN 0-85264-199-0. [Google Scholar]
- Wang, W.; Shao, Q.; Yang, T.; Peng, S.; Yu, Z.; Taylor, J.; Xing, W.; Zhao, C.; Sun, F. Changes in daily temperature and precipitation extremes in the Yellow River Basin, China. Stoch. Environ. Res. Risk Assess. 2013, 27, 401–421. [Google Scholar] [CrossRef]
- Kivinen, S.; Rasmus, S.; Jylhä, K.; Laapas, M. Long-term climate trends and extreme events in Northern Fennoscandia (1914–2013). Climate 2017, 5, 16. [Google Scholar] [CrossRef]
- Tao, J.; Zhang, X.; Tao, J.; Shen, Q. The checking and removing of the autocorrelation in climatic time series. J. Appl. Meteorol. Sci. 2008, 19, 47–52. (In Chinese) [Google Scholar]
- Yue, S.; Wang, C.Y. Applicability of prewhitening to eliminate the influence of serial correlation on the Mann-Kendall test. Water Resour. Res. 2002, 38, 4-1–4-7. [Google Scholar] [CrossRef]
- Durbin, J.; Watson, G.S. Testing for serial correlation in least squares regression. II. Biometrika 1951, 38, 159–177. [Google Scholar] [CrossRef] [PubMed]
- Wilby, R.L.; Wedgbrow, C.S.; Fox, H.R. Seasonal predictability of the summer hydrometeorology of the River Thames, UK. J. Hydrol. 2004, 295, 1–16. [Google Scholar] [CrossRef]
- Cleveland, W.S.; Devlin, S.J. Locally weighted regression: An approach to regression analysis by local fitting. J. Am. Stat. Assoc. 1988, 83, 596–610. [Google Scholar] [CrossRef]
- Tan, M.L.; Ibrahim, A.L.; Cracknell, A.P.; Yusop, Z. Changes in precipitation extremes over the Kelantan River Basin, Malaysia. Int. J. Climatol. 2017, 37, 3780–3797. [Google Scholar] [CrossRef]
- Buishand, T.A.; Martino, G.D.; Spreeuw, J.N.; Brandsma, T. Homogeneity of precipitation series in the Netherlands and their trends in the past century. Int. J. Climatol. 2013, 33, 815–833. [Google Scholar] [CrossRef]
- Cover, T.M.; Thomas, J.A. Elements of Information Theory (Wiley Series in Telecommunications; 6. Print); Wiley: New York, NY, USA, 1991; pp. 12–39. ISBN 978-0-471-06259-2. [Google Scholar]
- Paninski, L. Estimation of entropy and mutual information. Neural Comput. 2003, 15, 1191–1253. [Google Scholar] [CrossRef]
- Everitt, B.S. The Analysis of Contingency Tables; Chapman and Hall/CRC; CRC Press: Florida, FL, USA, 1992; pp. 37–59. ISBN 978-1-4822-2125-1. [Google Scholar]
- Huang, J.; Li, Q. Statistical Analysis Methods of the Meteorological Data; Meteorological Press: Beijing, China, 2015; pp. 28–37. ISBN 978-7-5029-5792-6. (In Chinese) [Google Scholar]
- Chen, Y.; Deng, H.; Li, B.; Li, Z.; Xu, C. Abrupt change of temperature and precipitation extremes in the arid region of Northwest China. Quat. Int. 2014, 336, 35–43. [Google Scholar] [CrossRef]
- Wu, X.; Wang, Z.; Zhou, X.; Lai, C.; Lin, W.; Chen, X. Observed changes in precipitation extremes across 11 basins in China during 1961–2013. Int. J. Climatol. 2016, 36, 2866–2885. [Google Scholar] [CrossRef]
- Wang, S.; Zhang, M.; Wang, B.; Sun, M.; Li, X. Recent changes in daily extremes of temperature and precipitation over the western Tibetan Plateau, 1973–2011. Quat. Int. 2013, 313–314, 110–117. [Google Scholar] [CrossRef]
- Yan, G.; Qi, F.; Wei, L.; Aigang, L.; Yu, W.; Jing, Y.; Aifang, C.; Yamin, W.; Yubo, S.; Li, L.; Qianqian, M. Changes of daily climate extremes in Loess Plateau during 1960–2013. Quat. Int. 2015, 371, 5–21. [Google Scholar] [CrossRef]
- Wang, B.; Zhang, M.; Wei, J.; Wang, S.; Li, S.; Ma, Q.; Li, X.; Pan, S. Changes in extreme events of temperature and precipitation over Xinjiang, northwest China, during 1960–2009. Quat. Int. 2013, 298, 141–151. [Google Scholar] [CrossRef]
- Yao, Z.; Liu, Z.; Huang, H.; Liu, G.; Wu, S. Statistical estimation of the impacts of glaciers and climate change on river runoff in the headwaters of the Yangtze River. Quat. Int. 2014, 336, 89–97. [Google Scholar] [CrossRef]
- Zhao, Y.; Shi, X.; Qin, N.; Wang, Q.; Feng, S.; Zhaxi, C.; Wang, X. Characteristics of climate change in the South of Qinghai in past more than 40 years. J. Desert Res. 2005, 25, 529–534. (In Chinese) [Google Scholar]
- Chen, Y.; Zhang, Q.; Xiao, M.; Singh, V.; Leung, Y.; Jiang, L. Precipitation extremes in the Yangtze River Basin, China: regional frequency and spatial–temporal patterns. Theor. Appl. Climatol. 2014, 116, 447–461. [Google Scholar] [CrossRef]
- Hosking, J.R.M.; Wallis, J.R. Regional frequency analysis: An approach based on L-Moments; Cambridge University Press: Cambridge, UK, 1997; pp. 1–98. ISBN 978-0-521-01940-8. [Google Scholar]
- Liu, F.; Mao, X.; Zhang, Y.; Chen, Q.; Liu, P.; Zhao, Z. Risk analysis of snow disaster in the pastoral areas of the Qinghai-Tibet Plateau. J. Geogr. Sci. 2014, 24, 411–426. [Google Scholar] [CrossRef]
- Guo, X.; Li, L.; Liu, C.; Wang, F.; Li, B. Spatio-temporal distribution of snow disaster in Qinghai Plateau during 1961–2008. Adv. Clim. Change Res. 2010, 6, 332–337. (In Chinese) [Google Scholar]
- Tang, J.; Cao, H.; Chen, J. Changes of hydro-meteorological factors and the relationships with large-scale circulation factors in the Source Region of the Yangtze River. J. Nat. Resour. 2018, 33, 840–852. (In Chinese) [Google Scholar] [CrossRef]
- Li, L.; Li, F.; Zhu, X.; Zhang, H. Study on the evolution law of the extreme climatic events over the source region of the three rivers. J. Nat. Resour. 2007, 22, 656–663. (In Chinese) [Google Scholar]
Figure 1.
Location of the source region of the Yangtze River (SRYR) and stations.

Figure 2.
Regionally averaged series for the extreme precipitation indices over the SRYR during 1960–2016 for (a) PRCPTOT, (b) SDII, (c) RX1day, (d) RX5day, (e) R95p, (f) R99p, (g) R1mm, (h) R10mm, (i) R20mm, (j) CDD, and (k) CWD. The dotted line represents the linear trend and R is its correlation coefficient. The dashed line results from locally weighted regression (LOESS) smoothing.

Figure 3.
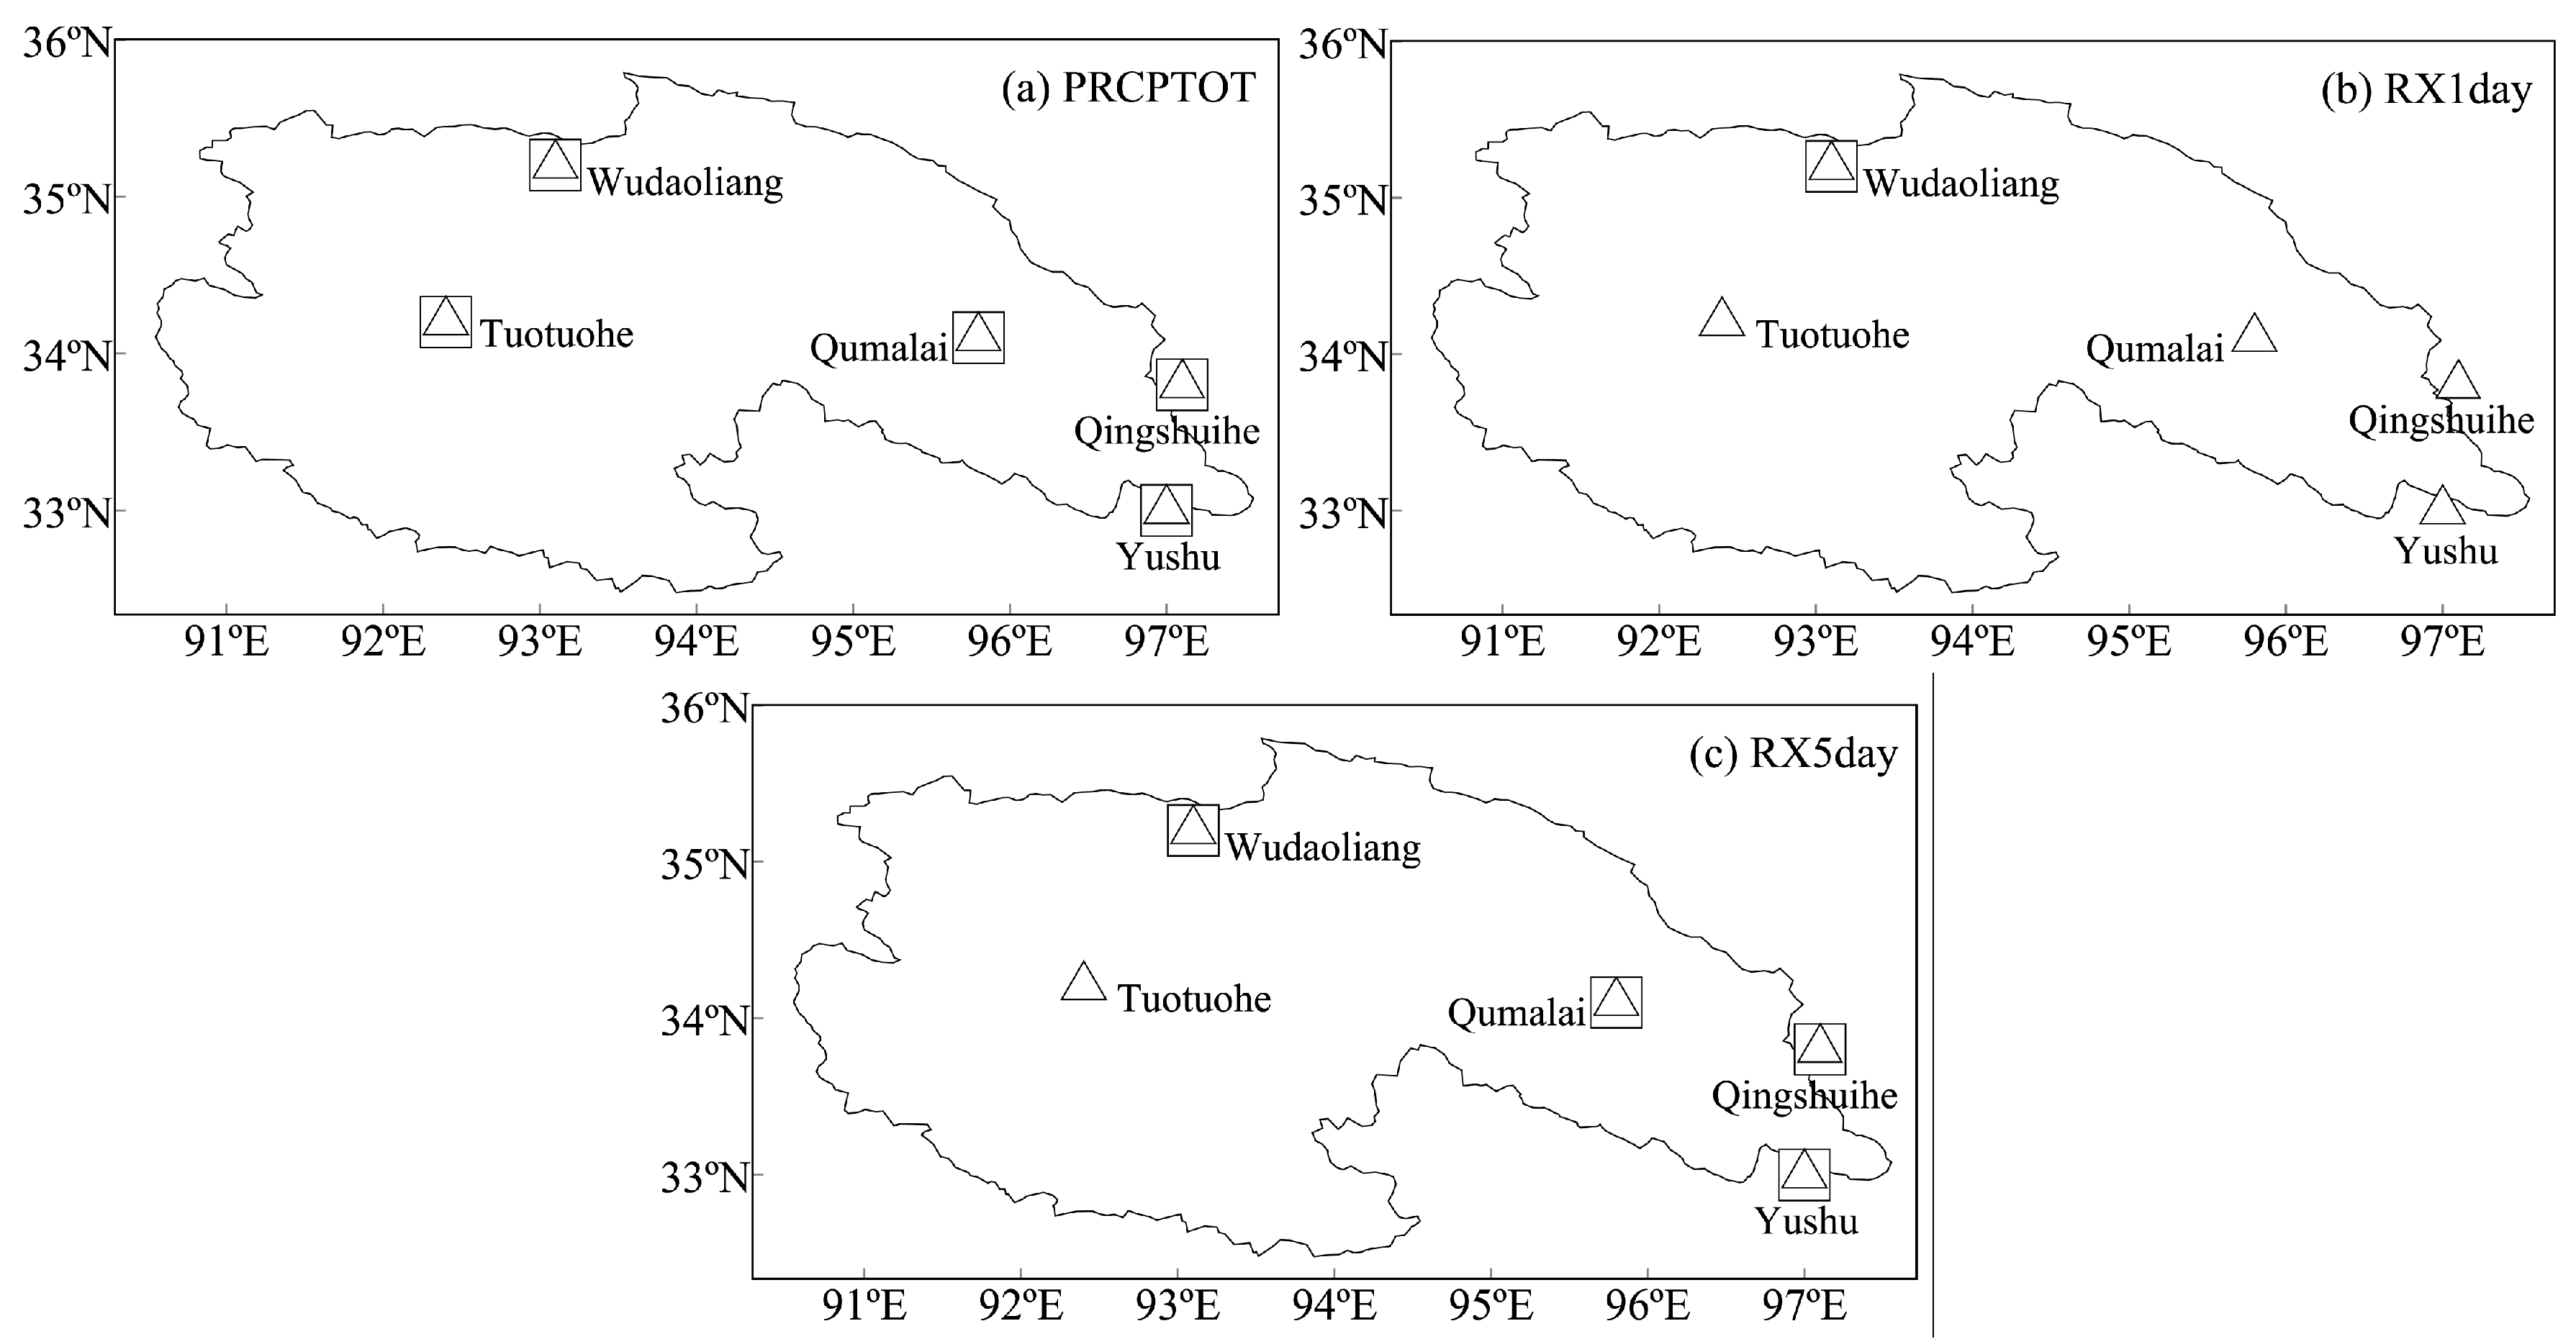
Spatial patterns of trends in the extreme precipitation indices over the SRYR during 1960–2016 for (a) PRCPTOT, (b) SDII, (c) RX1day, (d) RX5day, (e) R95p, (f) R99p, (g) R1mm, (h) R10mm, (i) R20mm, (j) CDD, and (k) CWD. Increasing (decreasing) trends are marked by upright triangles (inverted triangles), while statistically significant trends (at a 5% significant level) are marked by square symbols.
Figure 3.
Spatial patterns of trends in the extreme precipitation indices over the SRYR during 1960–2016 for (a) PRCPTOT, (b) SDII, (c) RX1day, (d) RX5day, (e) R95p, (f) R99p, (g) R1mm, (h) R10mm, (i) R20mm, (j) CDD, and (k) CWD. Increasing (decreasing) trends are marked by upright triangles (inverted triangles), while statistically significant trends (at a 5% significant level) are marked by square symbols.

Figure 4.
Regionally averaged series for the dry season for the indices of (a) PRCPTOT, (b) RX1day, and (c) RX5day over the SRYR during 1960–2016. The dotted line represents the linear trend and R is its correlation coefficient. The dashed line results from LOESS smoothing.
Figure 4.
Regionally averaged series for the dry season for the indices of (a) PRCPTOT, (b) RX1day, and (c) RX5day over the SRYR during 1960–2016. The dotted line represents the linear trend and R is its correlation coefficient. The dashed line results from LOESS smoothing.

Figure 5.
Spatial patterns of trends for the dry season for the indices of (a) PRCPTOT, (b) RX1day, and (c) RX5day over the SRYR during 1960–2016. Increasing (decreasing) trends are marked by upright triangles (inverted triangles), while statistically significant trends (at a 5% significant level) are marked by square symbols.

Figure 6.
Regionally averaged series for (a) the ratio of the index of precipitation on very wet days to annual total precipitation (R95pT) and (b) the ratio of the index of precipitation on extremely wet days to annual total precipitation (R99pT) over the SRYR during 1960–2016. The dotted line represents the linear trend and R is its correlation coefficient. The dashed line results from LOESS smoothing.


Table 1.
List of the selected stations, including WMO (World Meteorological Organization) code, latitude, longitude, altitude, Thiessen weight, and data missing period during the study period.
Table 1.
List of the selected stations, including WMO (World Meteorological Organization) code, latitude, longitude, altitude, Thiessen weight, and data missing period during the study period.
| Station Name | WMO Code | Latitude (N) | Longitude (E) | Altitude (m) | Thiessen Weight (-) | Data Missing Period |
|---|---|---|---|---|---|---|
| Wudaoliang | 52,908 | 35°13′ | 93°05′ | 4612.2 | 0.199 | |
| Tuotuohe | 56,004 | 34°13′ | 92°26′ | 4533.1 | 0.478 | |
| Qumalai | 56,021 | 34°07′ | 95°48′ | 4175.0 | 0.254 | Aug–Dec 1962 |
| Yushu | 56,029 | 33°00′ | 96°58′ | 3716.9 | 0.032 | |
| Qingshuihe | 56,034 | 33°48′ | 97°08′ | 4415.4 | 0.037 |
Table 2.
Extreme precipitation indices used in this study.
| Category | Index | Descriptive name | Definition | Units |
|---|---|---|---|---|
| Intensity indices | PRCPTOT | Total wet-day precipitation | Annual total PRCP in wet days (RR ≥ 1 mm) | mm |
| SDII | Simple daily intensity index | Annual total precipitation divided by the number of wet days | mm/day | |
| RX1day | Max 1-day precipitation | Monthly or annual maximum 1-day precipitation | mm | |
| RX5day | Max 5-day precipitation | Monthly or annual maximum 5-day precipitation | mm | |
| R95p | Very wet-day precipitation | Annual total PRCP when RR > 95th percentile of 1961–1990 daily precipitation | mm | |
| R99p | Extremely wet-day precipitation | Annual total PRCP when RR > 99th percentile of 1961–1990 daily precipitation | mm | |
| Frequency indices | R1mm* | Number of wet days | Number of days per year when PRCP ≥ 1 mm | days |
| R10mm | Number of heavy precipitation days | Number of days per year when PRCP ≥ 10 mm | days | |
| R20mm | Number of very heavy precipitation days | Number of days per year when PRCP ≥ 20 mm | days | |
| Duration indices | CDD | Consecutive dry days | Maximum number of consecutive days with RR < 1 mm | days |
| CWD | Consecutive wet days | Maximum number of consecutive days with RR ≥ 1 mm | days |
Notes: RR, daily precipitation; R1mm marked with * is defined by ETCCDI for a user-specified threshold.
Table 3.
Regional trends per decade, the results of the Mann–Kendall (MK) test and percentages of stations with positive and negative trends for the extreme precipitation indices over the SRYR during 1960–2016.
Table 3.
Regional trends per decade, the results of the Mann–Kendall (MK) test and percentages of stations with positive and negative trends for the extreme precipitation indices over the SRYR during 1960–2016.
| Index | Regional Trends | MK Test | Percentage of Stations with Positive Trend | Percentage of Stations with Significant Positive Trend | Percentage of Stations with Negative Trend | Percentage of Stations with Significant Negative Trend | |||
|---|---|---|---|---|---|---|---|---|---|
| Units | L | Z | p-Value | ||||||
| Intensity indices | PRCPTOT | mm/decade | 10.90 ± 4.35 | 2.11 | 0.035 | 80% | 20% | 20% | 0% |
| SDII | mm/day/decade | 0.03 ± 0.03 | 1.07 | 0.285 | 80% | 0% | 20% | 0% | |
| RX1day | mm/decade | 0.16 ± 0.36 | 0.43 | 0.667 | 40% | 0% | 60% | 0% | |
| RX5day | mm/decade | 0.32 ± 0.64 | 0.67 | 0.503 | 60% | 0% | 40% | 0% | |
| R95p | mm/decade | 2.01 ± 1.86 | 0.92 | 0.358 | 80% | 20% | 20% | 0% | |
| R99p | mm/decade | 0.69 ± 1.09 | 0.28 | 0.779 | 60% | 0% | 40% | 0% | |
| Frequency indices | R1mm | days/decade | 1.87 ± 0.71 | 2.39 | 0.017 | 100% | 40% | 0% | 0% |
| R10mm | days/decade | 0.39 ± 0.15 | 1.91 | 0.056 | 80% | 20% | 20% | 0% | |
| R20mm | days/decade | 0.03 ± 0.04 | 0.25 | 0.803 | 40% | 0% | 60% | 0% | |
| Duration indices | CDD | days/decade | −5.70 ± 2.27 | −2.88 | 0.004 | 0% | 0% | 100% | 20% |
| CWD | days/decade | 0.02 ± 0.13 | 0.74 | 0.459 | 40% | 0% | 60% | 0% | |
Notes: L denotes linear trends (decade−1), Z is the standardized MK test statistic. Values for statistically significant trends at a 5% significant level are in bold.
Table 4.
Linear trends and results of the Mann–Kendall (MK) test for extreme precipitation indices for each station in the SRYR during 1960–2016.
Table 4.
Linear trends and results of the Mann–Kendall (MK) test for extreme precipitation indices for each station in the SRYR during 1960–2016.
| Index | Wudaoliang | Tuotuohe | Qumalai | Yushu | Qingshuihe | ||||||||||
|---|---|---|---|---|---|---|---|---|---|---|---|---|---|---|---|
| L | Z | p-Value | L | Z | p-Value | L | Z | p-Value | L | Z | p-Value | L | Z | p-Value | |
| PRCPTOT | 18.85 ± 4.20 | 3.76 | 0.0002 | 10.58 ± 5.66 | 1.56 | 0.119 | 7.92 ± 5.39 | 1.33 | 0.184 | −0.97 ± 6.00 | −0.20 | 0.841 | 6.51 ± 5.41 | 1.04 | 0.298 |
| SDII | 0.1 ± 0.05 | 1.78 | 0.075 | 0.02 ± 0.05 | 0.30 | 0.764 | 0.01 ± 0.04 | 0.74 | 0.459 | −0.10 ± 0.05 | −1.87 | 0.061 | 0.02 ± 0.05 | 0.60 | 0.549 |
| RX1day | 0.44 ± 0.55 | 0.92 | 0.358 | −0.27 ± 0.63 | −0.62 | 0.535 | 0.84 ± 0.49 | 1.35 | 0.177 | −0.25 ± 0.42 | −1.10 | 0.271 | −0.20 ± 0.68 | −0.07 | 0.944 |
| RX5day | 1.76 ± 1.17 | 1.78 | 0.075 | −0.41 ± 1.03 | −0.22 | 0.826 | 0.67 ± 0.89 | 0.73 | 0.337 | −1.38 ± 0.93 | −1.84 | 0.066 | 1.25 ± 1.13 | 0.94 | 0.347 |
| R95p | 7.71 ± 3.08 | 2.23 | 0.026 | 0.54 ± 2.85 | 0.08 | 0.936 | 0.98 ± 2.74 | 0.48 | 0.631 | −2.80 ± 3.36 | −0.86 | 0.39 | 1.70 ± 3.75 | 0.03 | 0.976 |
| R99p | 2.92 ± 2.07 | 1.23 | 0.219 | −1.42 ± 1.67 | −0.74 | 0.459 | 3.08 ± 1.90 | 1.36 | 0.174 | −1.51 ± 1.79 | −1.02 | 0.303 | 1.99 ± 2.13 | 0.84 | 0.401 |
| R1mm | 2.70 ± 0.76 | 3.12 | 0.002 | 1.94 ± 0.87 | 2.23 | 0.026 | 1.31 ± 0.82 | 1.41 | 0.159 | 1.41 ± 0.79 | 1.74 | 0.082 | 0.76 ± 0.87 | 0.66 | 0.509 |
| R10mm | 0.78 ± 0.19 | 3.54 | 0.0004 | 0.42 ± 0.23 | 1.06 | 0.289 | 0.16 ± 0.23 | 0.71 | 0.478 | −0.28 ± 0.32 | −1.13 | 0.258 | 0.01 ± 0.29 | 0.02 | 0.984 |
| R20mm | 0.10 ± 0.08 | 1.09 | 0.276 | −0.03 ± 0.07 | −0.72 | 0.472 | 0.10 ± 0.07 | 1.09 | 0.276 | −0.01 ± 0.08 | −0.10 | 0.92 | −0.01 ± 0.09 | −0.23 | 0.818 |
| CDD | −1.88 ± 3.75 | −0.30 | 0.764 | −10.58 ± 3.64 | −3.12 | 0.002 | −0.54 ± 2.63 | −0.19 | 0.849 | −2.64 ± 2.22 | −1.12 | 0.308 | −1.41 ± 1.76 | −1.18 | 0.238 |
| CWD | 0.23 ± 0.16 | 1.46 | 0.144 | 0.02 ± 0.02 | 0.48 | 0.631 | −0.11 ± 0.21 | −0.24 | 0.81 | −0.10 ± 0.23 | −1.16 | 0.246 | −0.14 ± 0.24 | −0.15 | 0.881 |
Notes: L denotes linear trends (decade−1), Z is the standardized MK test statistic. Values for statistically significant trends at a 5% significant level are in bold.
Table 5.
Regional trends per decade, results of the Mann–Kendall (MK) test and percentages of stations with positive and negative trends for the seasonal indices (PRCPTOT, RX1day, and RX5day) over the SRYR during 1960–2016.
Table 5.
Regional trends per decade, results of the Mann–Kendall (MK) test and percentages of stations with positive and negative trends for the seasonal indices (PRCPTOT, RX1day, and RX5day) over the SRYR during 1960–2016.
| Index | Season | Regional Trends | MK Test | Percentage of Stations with Positive Trend | Percentage of Stations with Significant Positive Trend | Percentage of Stations with Negative Trend | Percentage of Stations with Significant Negative Trend | ||
|---|---|---|---|---|---|---|---|---|---|
| Units | L | Z | p-Value | ||||||
| PRCPTOT | Wet | mm/decade | 9.35 ± 4.26 | 1.95 | 0.051 | 80% | 20% | 20% | 0% |
| Dry | mm/decade | 1.56 ± 0.43 | 3.42 | 0.0003 | 100% | 100% | 0% | 0% | |
| RX1day | Wet | mm/decade | 0.16 ± 0.36 | 0.42 | 0.674 | 40% | 0% | 60% | 0% |
| Dry | mm/decade | 0.31 ± 0.12 | 3.06 | 0.0022 | 100% | 20% | 0% | 0% | |
| RX5day | Wet | mm/decade | 0.32 ± 0.64 | 0.52 | 0.603 | 60% | 0% | 40% | 0% |
| Dry | mm/decade | 0.56 ± 0.17 | 3.10 | 0.002 | 100% | 80% | 0% | 0% | |
Notes: L denotes linear trends (decade−1), Z is the standardized MK test statistic. Values for statistically significant trends at a 5% significant level are in bold.
Table 6.
Linear trends and results of the Mann–Kendall (MK) test for the seasonal indices (PRCPTOT, RX1day, and RX5day) over the SRYR during 1960–2016.
Table 6.
Linear trends and results of the Mann–Kendall (MK) test for the seasonal indices (PRCPTOT, RX1day, and RX5day) over the SRYR during 1960–2016.
| Index | Season | Wudaoliang | Tuotuohe | Qumalai | Yushu | Qingshuihe | ||||||||||
|---|---|---|---|---|---|---|---|---|---|---|---|---|---|---|---|---|
| L | Z | p-Value | L | Z | p-Value | L | Z | p-Value | L | Z | p-Value | L | Z | p-Value | ||
| PRCPTOT | Wet | 17.51 ± 4.09 | 3.56 | 0.0004 | 9.28 ± 5.52 | 1.37 | 0.171 | 5.73 ± 5.28 | 1.14 | 0.254 | −4.12 ± 6.02 | −0.72 | 0.472 | 2.8 ± 5.31 | 0.43 | 0.667 |
| Dry | 1.29 ± 0.43 | 2.71 | 0.007 | 1.35 ± 0.45 | 3.11 | 0.002 | 1.64 ± 0.64 | 2.20 | 0.028 | 3.28 ± 1.16 | 2.44 | 0.015 | 3.70 ± 1.04 | 3.13 | 0.002 | |
| RX1day | Wet | 0.44 ± 0.55 | 0.92 | 0.358 | −0.27 ± 0.63 | −0.62 | 0.535 | 0.84 ± 0.49 | 1.35 | 0.177 | −0.25 ± 0.42 | −1.10 | 0.271 | −0.20 ± 0.68 | −0.07 | 0.944 |
| Dry | 0.32 ± 0.15 | 2.13 | 0.034 | 0.20 ± 0.16 | 1.90 | 0.057 | 0.44 ± 0.19 | 1.80 | 0.072 | 0.71 ± 0.32 | 1.53 | 0.126 | 0.35 ± 0.22 | 1.55 | 0.121 | |
| RX5day | Wet | 1.76 ± 1.17 | 1.78 | 0.075 | −0.41 ± 1.03 | −0.22 | 0.826 | 0.67 ± 0.89 | 0.73 | 0.337 | −1.38 ± 0.93 | −1.84 | 0.066 | 1.25 ± 1.13 | 0.94 | 0.347 |
| Dry | 0.61 ± 0.19 | 2.93 | 0.003 | 0.37 ± 0.23 | 1.72 | 0.085 | 0.71 ± 0.25 | 2.59 | 0.010 | 1.36 ± 0.39 | −2.84 | 0.005 | 0.98 ± 0.33 | 2.95 | 0.030 | |
Notes: L denotes linear trends (decade−1), Z is the standardized MK test statistic. Values for statistically significant trends at a 5% significant level are in bold.
Table 7.
Correlation coefficients of extreme precipitation indices.
| Indices | PRCPTOT | SDII | RX1day | RX5day | R95p | R99p | R1mm | R10mm | R20mm | CWD | CDD |
|---|---|---|---|---|---|---|---|---|---|---|---|
| PRCPTOT | 1 | ||||||||||
| SDII | 0.68 ** | 1 | |||||||||
| RX1day | 0.41 ** | 0.51 ** | 1 | ||||||||
| RX5day | 0.69 ** | 0.73 ** | 0.60 ** | 1 | |||||||
| R95p | 0.76 ** | 0.84 ** | 0.64 ** | 0.76 ** | 1 | ||||||
| R99p | 0.36 ** | 0.47 ** | 0.83 ** | 0.57 ** | 0.59 ** | 1 | |||||
| R1mm | 0.89 ** | 0.31 * | 0.23 | 0.45 ** | 0.48 ** | 0.18 | 1 | ||||
| R10mm | 0.79 ** | 0.85 ** | 0.35 ** | 0.71 ** | 0.81 ** | 0.34 * | 0.53 ** | 1 | |||
| R20mm | 0.34 ** | 0.51 ** | 0.73 ** | 0.52 ** | 0.63 ** | 0.85 ** | 0.14 | 0.35 ** | 1 | ||
| CWD | 0.60 ** | 0.25 | 0.19 | 0.46 ** | 0.41 ** | 0.15 | 0.63 ** | 0.43 ** | 0.21 | 1 | |
| CDD | −0.16 | 0.10 | 0.08 | 0.17 | −0.01 | 0.06 | −0.29 * | 0.02 | −0.01 | −0.11 | 1 |
Notes: ** Significant at the 1% significance level, * significant at the 5% significance level.
Table 8.
Extreme precipitation indices from this study and other works around the SRYR.
| Index | This Study | Global | China | Qinghai-Tibetan Plateau | Western Tibetan Plateau | South-Eastern Tibet | Loess Plateau | Yangtze River Basin | Yunnan Province, China | Xinjiang, NW China |
|---|---|---|---|---|---|---|---|---|---|---|
| PRCPTOT | 10.90 | 0.23 | 1.13 | 6.98 | 0.47 | 4.95 | 1.87 | −9.31 | ||
| SDII | 0.03 | −0.07 | 0.07 | 0.08 | −0.01 | 0.06 | −0.12 | 0.11 | 0.08 | 0.04 |
| RX1day | 0.16 | 0.04 | 0.50 | 0.45 | 0.37 | −0.49 | −0.22 | 1.43 | 0.40 | 0.79 |
| RX5day | 0.32 | −0.31 | 0.36 | 0.50 | 1.25 | −0.28 | −0.84 | 1.50 | −0.12 | 0.85 |
| R95p | 2.01 | 1.98 | 3.39 | 3.24 | 0.48 | −3.31 | −0.59 | 7.78 | 3.78 | 6.28 |
| R99p | 0.69 | 1.42 | 1.77 | 1.96 | 0.41 | −2.84 | −0.25 | 6.59 | 2.30 | 3.26 |
| R1mm | 1.87 | −0.31 | −0.48 | 1.12 | ||||||
| R10mm | 0.39 | −0.07 | 0.004 | 0.27 | −0.06 | 0.46 | −0.03 | −0.27 | −0.38 | 0.20 |
| R20mm | 0.03 | −0.03 | 0.07 | −0.11 | 0.004 | −0.11 | 0.05 | |||
| CDD | −5.70 | −1.66 | −2.73 | −0.87 | −0.52 | 4.55 | −18.65 | 0.22 | 1.07 | −0.02 |
| CWD | 0.02 | 0.02 | −0.14 | −0.02 | 0.17 | −0.35 | −0.009 | −0.16 | −0.37 | 0.05 |
Notes: Data source and time period: Global [45], 1951–2011; China [64], 1961–2013; Qinghai-Tibetan Plateau [34] 1975–2014; Western Tibetan Plateau [65], 1973–2011; Southeastern Tibet [20], 1978–2013; Loess Plateau [66], 1960–2013; Yangtze River Basin [35], 1960–2012; Yunnan Province, China [14], 1960–2012; Xinjiang Province, China [67], 1960–2009. Values for statistically significant trends (at a 5% significance level) are shown in bold.
© 2018 by the authors. Licensee MDPI, Basel, Switzerland. This article is an open access article distributed under the terms and conditions of the Creative Commons Attribution (CC BY) license (http://creativecommons.org/licenses/by/4.0/).
Share and Cite
MDPI and ACS Style
Zhou, B.; Liang, C.; Zhao, P.; Dai, Q. Analysis of Precipitation Extremes in the Source Region of the Yangtze River during 1960–2016. Water 2018, 10, 1691. https://doi.org/10.3390/w10111691
AMA Style
Zhou B, Liang C, Zhao P, Dai Q. Analysis of Precipitation Extremes in the Source Region of the Yangtze River during 1960–2016. Water. 2018; 10(11):1691. https://doi.org/10.3390/w10111691
Chicago/Turabian StyleZhou, Baojia, Chuan Liang, Peng Zhao, and Qiong Dai. 2018. "Analysis of Precipitation Extremes in the Source Region of the Yangtze River during 1960–2016" Water 10, no. 11: 1691. https://doi.org/10.3390/w10111691
Note that from the first issue of 2016, this journal uses article numbers instead of page numbers. See further details here.