Infiltration and Inflow (I/I) to Wastewater Systems in Norway, Sweden, Denmark, and Finland
by
Kristin Jenssen Sola
1,2,*, 
Jarle Tommy Bjerkholt
1,3,
Oddvar Georg Lindholm
1 and
Harsha Ratnaweera
1 1
Faculty of Mathematical Sciences and Technology, Norwegian University of Life sciences, 1430 Ås, Norway
2
The Municipality of Asker, 1372 Asker, Norway
3
Faculty of Technology, Natural Sciences and Maritime Sciences, University of South-Eastern Norway, 3603 Kongsberg, Norway
*
Author to whom correspondence should be addressed.
Water 2018, 10(11), 1696; https://doi.org/10.3390/w10111696
Submission received: 29 October 2018
/
Revised: 15 November 2018
/
Accepted: 17 November 2018
/
Published: 21 November 2018
(This article belongs to the Section Urban Water Management)
Abstract
:Infiltration and inflow of non-sewer water to the wastewater network (I/I-water) may have a number of both financial and environmental consequences. In Norway, there are two commonly used methods for calculating the volume of I/I-water, The Dilution method (DM) and the Water Balance Method (WBM). When comparing the methods, the WBM gives a lower value of I/I-water than the DM. Analysis shows that the volume of I/I-water for some large Norwegian wastewater plants is decreasing. From 2009 to 2016, the average value has decreased from 70% to 66% of the total annual flow. For investigated Danish districts the average amount of I/I-water is stable, on about 30%. Calculations performed by the Finnish Water Utilities Association shows a stable percentage of I/I-water on about 40% in Finland from 2010 to 2016. Calculations on Swedish wastewater plants show a reduction in I/I-water from 58% to 46% from 2010 to 2016. For the districts Asker, Bærum, and Drammen in Norway, the amount of I/I-water is increasing with increasing percentage of combined sewer systems. This is also the case for investigated plants in Norway, Sweden, and Finland. The exception is Denmark, with a high percentage of combined systems, but a low percentage of I/I-water. Investigations done for Asker, Bærum, Drammen, and the two Danish districts Randers and Esbjerg vest, show a correlation between rainfall and I/I-water only for Asker and Esbjerg vest.
1. Introduction
Infiltration and inflow of non-sewer water to the wastewater network (I/I-water) is, in the following study, defined as all water entering the sewerage network except sewerage. The level of I/I-water is an indication on how well the wastewater system works in comparison to the intentions. Sources of I/I-water are rainfall, groundwater, and leakages from the water supply system. I/I-water finds its way into the wastewater network through damaged pipes, damaged manholes and fault connections, but can also enter intentionally, which is the case for rainwater in a combined sewer system. In a study by Helen Karstensen [1], the economic consequences of I/I-water for the Bekkelaget drainage area in Oslo were analyzed. Based on the lowest estimates, the study concluded that I/I-water has an annual cost of about NOK 35 million for the city of Oslo. The highest estimates in her calculations gave an annual cost of I/I-water for Oslo of NOK 313.2 million [1]. (Oslo have 674,000 inhabitants in 2018). I/I-water increases the operating costs for a wastewater system, for example pumping costs and treatment costs. In addition, I/I-water contributes to pollution transport through weirs and increased emissions from wastewater treatment plants [2,3].
In Table 1 the consequences of I/I-water are listed.
The proportion of I/I-water in wastewater pipes normally in Norway is calculated by using two different methods:
The Dilution method (DM) uses input data of total phosphorus concentration to wastewater treatment plants to calculate the amount of I/I-water. In order to use this method, one must make assumptions on total phosphorus production per person per day (TOT-P/person day) and on the total water consumption per person per day (liter/person day) [4].
The Water Balance Method (WBM) uses measured amounts of water led to a given measuring point to calculate the quantity of I/I-water. In order to use this method, one must make assumptions of the total number of persons and industry connected to the pipes upstream the measuring point and on the water consumption per person and day (liter/person day) [5].
A study by Lindholm and Bjerkholt [4], using data for 2008, concluded that the amount of I/I-water to some large wastewater treatment plants in Norway on average was between 60% and 70% of the total inflow during the whole year. In this study, the DM was used to calculate the percentage of I/I-water. Figures on inlet concentrations of total phosphorus where supplied from the Norwegian Environmental Agency. The water consumption was on an average set to be 160 L/person per day and the phosphorus production was assumed to be 1.8 g/person per day [4].
The study from 2011 was followed up by an investigation of the situation on I/I-water in the Nordic countries [5]. In this study, I/I-water in Norway, Denmark, Finland, and Sweden was investigated. Based on the 2009 data, the DM was used to calculate the amount of I/I-water for some large wastewater treatment plants in Norway (68%), Finland (29%), and Sweden (58%) [5]. Due to lack of information on phosphorus production per person and day for Denmark, it was not possible to use the DM to calculate the amount of I/I-water. The WBM was used instead. For Denmark, the amount of I/I-water was 33%.
To know exactly how high the consumption of water is, it is a necessity to have full coverage of water meters. If a district is not fully covered or have no meters at all, the consumption of water will be based wholly or partly on estimates. Vråle [3] concluded that estimated quantities of water consumed in many Norwegian municipalities often were set to be too high. This is supported by studies conducted in the Drammen region, where residential areas with 100% water meter coverage showed consumption between 109 and 135 L/pe [6]. In order to make calculations of the fraction of I/I-water, it is necessary to have a proper knowledge of water consumption [3]. Norsk Vann (The Norwegian Water) recommends that the specific water consumption, when dimensioning plants, should be about 140 L/s [7].
In 2014, a project was conducted on behalf of the municipality of Oslo (the department of water and wastewater works, VAV). The purpose of the project was to look into how the consumption of water could be reduced most efficiently. As a consequence of this project, information on water consumption was collected from Norway, Finland, Denmark, and Sweden. For Norway, the consumption varied between 240 L/p day (for those with less than 80% water meter coverage) and 137 L/p day (for Drammen municipality with approximately 82% water meter coverage) [8]. For Sweden, it was reported that household consumption for the Stockholm area was about 200 L/p day, and for the Gothenburg area 156 L/p day. Household consumption in Denmark was reported to be 107 L/p in 2013, as an average for the whole country. For Finland, it was stated that the net consumption was assumed to be at about 140 L/p [8].
In Norway, it is common to use 1.8 g TOT-P per person per day when calculating Phosphorus production and dimensioning wastewater treatment plants (WWTP) [4,9]. The WWTP receives wastewater with various concentrations of phosphorus depending on connected industry. Vråle [10] points out that there are big variations in use/production of phosphorus and that it are difficult to make a general recommendation on what values to use in calculations. It is also possible that the infiltration of water to the wastewater system may be of importance, and may lead to an increased content of phosphorus [11].
Due to climate change, an increase in precipitation for the Nordic countries is expected. The annual average precipitation for mainland Norway has increased by almost 20% since 1900 [12]. In Denmark, the annual average precipitation has increased about 15% from 1874 to 2013 [13]. The correlation between increased precipitation and increased amounts of water in drainage pipes can be investigated, for instance, by using hydraulic and hydrologic models. This was done in a study from Oslo, where various factors that could affect the I/I-% were examined [14]. The factors considered were the fraction of combined to separate systems, the average age of the sewer pipes, the area of sealed surfaces compared to permeable surface, precipitation, number of crossings between sewer pipes and piped streams/open water courses. As a tool, a simplified and calibrated hydrological model, similar to Mouse RDII developed by DHI, was used [14]. The study concluded that I/I-water is a highly variable component which is difficult to predict from characteristics within different drainage fields [14].
I/I-water has been paid some attention in recent studies, most of which have emphasized identifying sources of I/I-water, quantifying shares in the I/I-water and to give an understanding on what the situation regarding I/I-water is of today [15,16,17,18]. The main goal of the study presented in this article was investigating the status of I/I-water in the Nordic countries as of today and to look into the development over the past 8–10 years. The level of I/I-water of 2015/2016/2017 was calculated and compared to the 2008/2009 figures which will give an indication whether or not the measures that have been taken to reduce I/I-water since 2008/2009 have had any effect. Some of the same treatment plants that was analysed by Lindholm et al. [4,5] have been re-examined, with data from 2015/2016/2017. This study also includes some simple investigations on how the I/I-water, calculated in the first part, is correlated to rainfall. When trying to reduce I/I-water, it is assumed that large economical investments have to be made. Looking at the development of I/I-water over the past ten years may give some indications on whether or not the investments with the aim to reduce the amounts have had any effect.
Despite the uncertainty related to calculating the amount of I/I-water in both the dilution method and the water balance method, both these methods are used in this study.
2. Materials and Methods
2.1. Study Area
This study makes a follow up of the wastewater treatment plants that were studied by Lindholm and Bjerkholt and Lindholm et al. [4,5]. Wastewater treatment plants in Norway, Sweden, Denmark and Finland have been investigated. In addition, three municipalities in Norway have been more closely examined, Asker (ca 60,000 inhabitants), Bærum (ca 126,000 inhabitants), and Drammen (ca 69,000 inhabitants) [19]. Asker, Bærum, and Drammen are three of the most populated municipalities in Norway.
For Finland, the calculations have been done by the Finnish Water Utilities Association (FIWA) for Finnish districts from 2010 until 2016. These results are an average of 68 plants that report to FIWA.
2.2. Calculation Methods and the Amount of I/I-Water
The dilution method is based on the assumption that every person produces a certain amount of TOT-P per day and a certain amount of wastewater per day [4]. The higher the average concentration of TOT-P into the treatment plant, the smaller the amount of I/I-water into the same plant.
With the dilution method, the amount of I/I-water for each treatment plant is calculated according to the formula (1).
where:
- I/I
- = I/I-water in the plant, %
- Ppd
- = produced phosphorus (TOT-P) per person and day, mg/pe day
- ci
- = concentration of Tot-P into the plant, mg/L
- Qap
- = amount of wastewater produced per person per day, L/pe day
The water balance method is based on the assumption that every person produces a certain amount of wastewater per day.
With the water balance method, the amount of I/I-water is calculated according to the formula (2).
where:
- I/I
- = I/I-water in the wastewater system (%)
- Qtot
- = total amount of water being transported to the measuring point, L/day
- pe
- = the number of persons situated within the catchment area
- Qap
- = the amount of wastewater each person produces a day, L/pe day
2.3. Norwegian Wastewater Districts
The contents of I/I-water in the Norwegian plants have been calculated based on the concentrations of registered TOT-P. The dilution method has been used in these calculations. The numbers on TOT-P have been provided by the Environmental Agency in Norway [20].
For Norway in general, 18% of the sewers are combined systems. For the systems included in this work, 26% were combined systems [21].
2.3.1. Asker and Bærum Municipalities
In both Asker and Bærum municipalities, almost all houses are connected to the public wastewater system. The wastewater is transported to the wastewater treatment plant VEAS (Vestfjorden Avløpsselskap AS) via a large tunnel. The wastewater system is divided into different zones, and each zone has a measuring point that registers the volume of wastewater transported into the plant. To calculate the amount of I/I–water, figures of measured discharge and number of inhabitants [22,23] were used when applying the water balance method. No corrections have been carried out when it comes to households not connected to the public sewer system. No corrections have been done regarding industry or commuting of people in and out of the districts, as they are both regarded as negligible. The wastewater system in Asker is 100% a separate system, and in Bærum the percentage of combined system/separate system is 35/65 [24].
2.3.2. Drammen Municipality
The wastewater system in Drammen is divided into two districts with separate treatment plants, which of only one, the Solumstrand district, is included in this study. The municipality of Drammen annually produces a report to meet the demands of the County Governor [25]. The annual report presents, among other things, the volume of wastewater delivered to the treatment plant, treated amounts of water in the plant, overflow emissions, and figures on person equivalents (pe) [26,27]. In the calculations done in this study, reported figures for Solumstrand treatment plants have been used. For Solumstrand, commuting is not considered, but industries are included. In the reports to the County Governor, the same figures on pe for all of the considered years are given. Because of this, there are some uncertainties related to these figures. The Solumstrand wastewater district has 56% combined sewers. For the Solumstrand district, I/I-water was calculated using both the dilution method and the water balance method.
2.4. Danish Wastewater Districts
For Danish plants/districts, figures of discharge have been collected from DANVA’s (Dansk Vand-og Spildevandsforening; the Danish water and wastewater association) annual reports [28]. In these reports, figures on total organic load, given as pe, are specified. The amount of I/I-water for 2010 and 2016 was calculated using the water balance method.
DANVA specifies that the water consumption in 2016 on an average was approximately 62.67 m3/pe per year or 172 L/pe per day. One hundred and four liters (104 L) were used by the households. In 2016, the water loss through leakages was about 5 m3/day. This gives an actual consumption on 158 L/pe per day, or 58 m3/pe per year. The total water consumption in 2010 was approximately 68.16 m3/pe per year, including household consumption, industry and institutional consumption and loss of water from the drinking water supply (all water not accounted for are regarded as loss). Without the water loss, the consumption was about 63 m3/pe per year.
Lindholm et al. [5] calculated the I/I-water using the average volume delivered to a selection of the biggest wastewater plants (277 L/pe per day) minus an average of the produced water in the waterworks. This gave an amount of I/I-water of 91 L/pe per day, or an average of 33%. In this work, the given number of pe was used, together with figures on water consumption.
2.5. Finnish Wastewater Districts
Calculations of I/I-water in Finland are based on figures from the PI system VENLA. The share of I/I-water is calculated using figures of water consumption and water transported into the wastewater plants. The PI-system VENLA is administrated by FIWA. The resulting numbers are a result of an average of 68 waterworks [29].
2.6. Swedish Wastewater Districts
The figures used in the calculations of I/I-water for Swedish plants are obtained from Svenskt Vatten (the Swedish Water and Wastewater Association) [30]. For 2009, the I/I-water for Swedish plants was calculated using the dilution method [5]. In 2017, I/I-water has been calculated using the water balance method on reported values of delivered sewage into the wastewater plants and figures on produced waste water per person. Svenskt Vatten reports that produced wastewater per person corresponds to water consumption and that there are little uncertainty with these figures as all homes are fitted with a water meter [31]. Svenskt Vatten reports that the household consumption in 2015 was 128 L/pe and day. When including industry, the consumption was 183 L/pe and day [32].
In Table 3, a summary of all figures and sources of information, and calculation methods, are given.
2.7. Data of Precipitation
The Norwegian Meteorological Institute (MET) runs a large number of weather stations, and monitors the weather and climate continuously. These stations measure rainfall among many other parameters. MET also operates stations in Asker, Bærum and Drammen. The total amounts of rainfall have been downloaded from the MET’s web site [33]. Likewise, data for Denmark and Sweden have been collected from the Danish (DMI) and Swedish (SMHI) Meteorological institutions, respectively [34,35].
Precipitation is varying a lot both spatially and temporally. On 6 August 2016, a heavy thunderstorm came in over large parts of eastern Norway. Western parts of Oslo, Bærum, and Asker were especially badly hit. In addition to MET’s weather stations in Asker, Asker municipality is running four rain gauges on their own. These four gauges recorded a total amount of rain between 48.2 and 55.5 mm over a period of 120 min [36]. Even though the rain may vary a lot over short distances, one gauge is normally representing larger areas due to the costs of instalment and maintenance. When analysing rainfall and amounts of I/I-water for the chosen districts, one should take uncertainty into consideration. Table 4 gives the location of the rain gauges that have been used in the calculations.
3. Results and Discussions
3.1. Development of I/I-Water in Norway
Inlet concentration of TOT-P is varying a lot in the WWTP in Norway, leading to a large variation in the calculated volumes of I/I-water. Table 5 sums up the measured concentrations of TOT-P and the calculated percentages of I/I-water in the same plants.
In many of the districts, there has been a positive development. Arendal, Lillehammer, Kambo, Nordre Follo, Knappen, Ytre Sandviken, Alvim, and Knarrdalstrand all have more than a 5% reduction in I/I-water. In a few districts, the development is going in the wrong direction; this goes for VEAS, Solumstrand, and Tønsberg. The average percentage of I/I-water in some big WWTP in Norway suggests that the amounts of I/I-water have been reduced from 70% to 66%.
3.1.1. Asker and Bærum
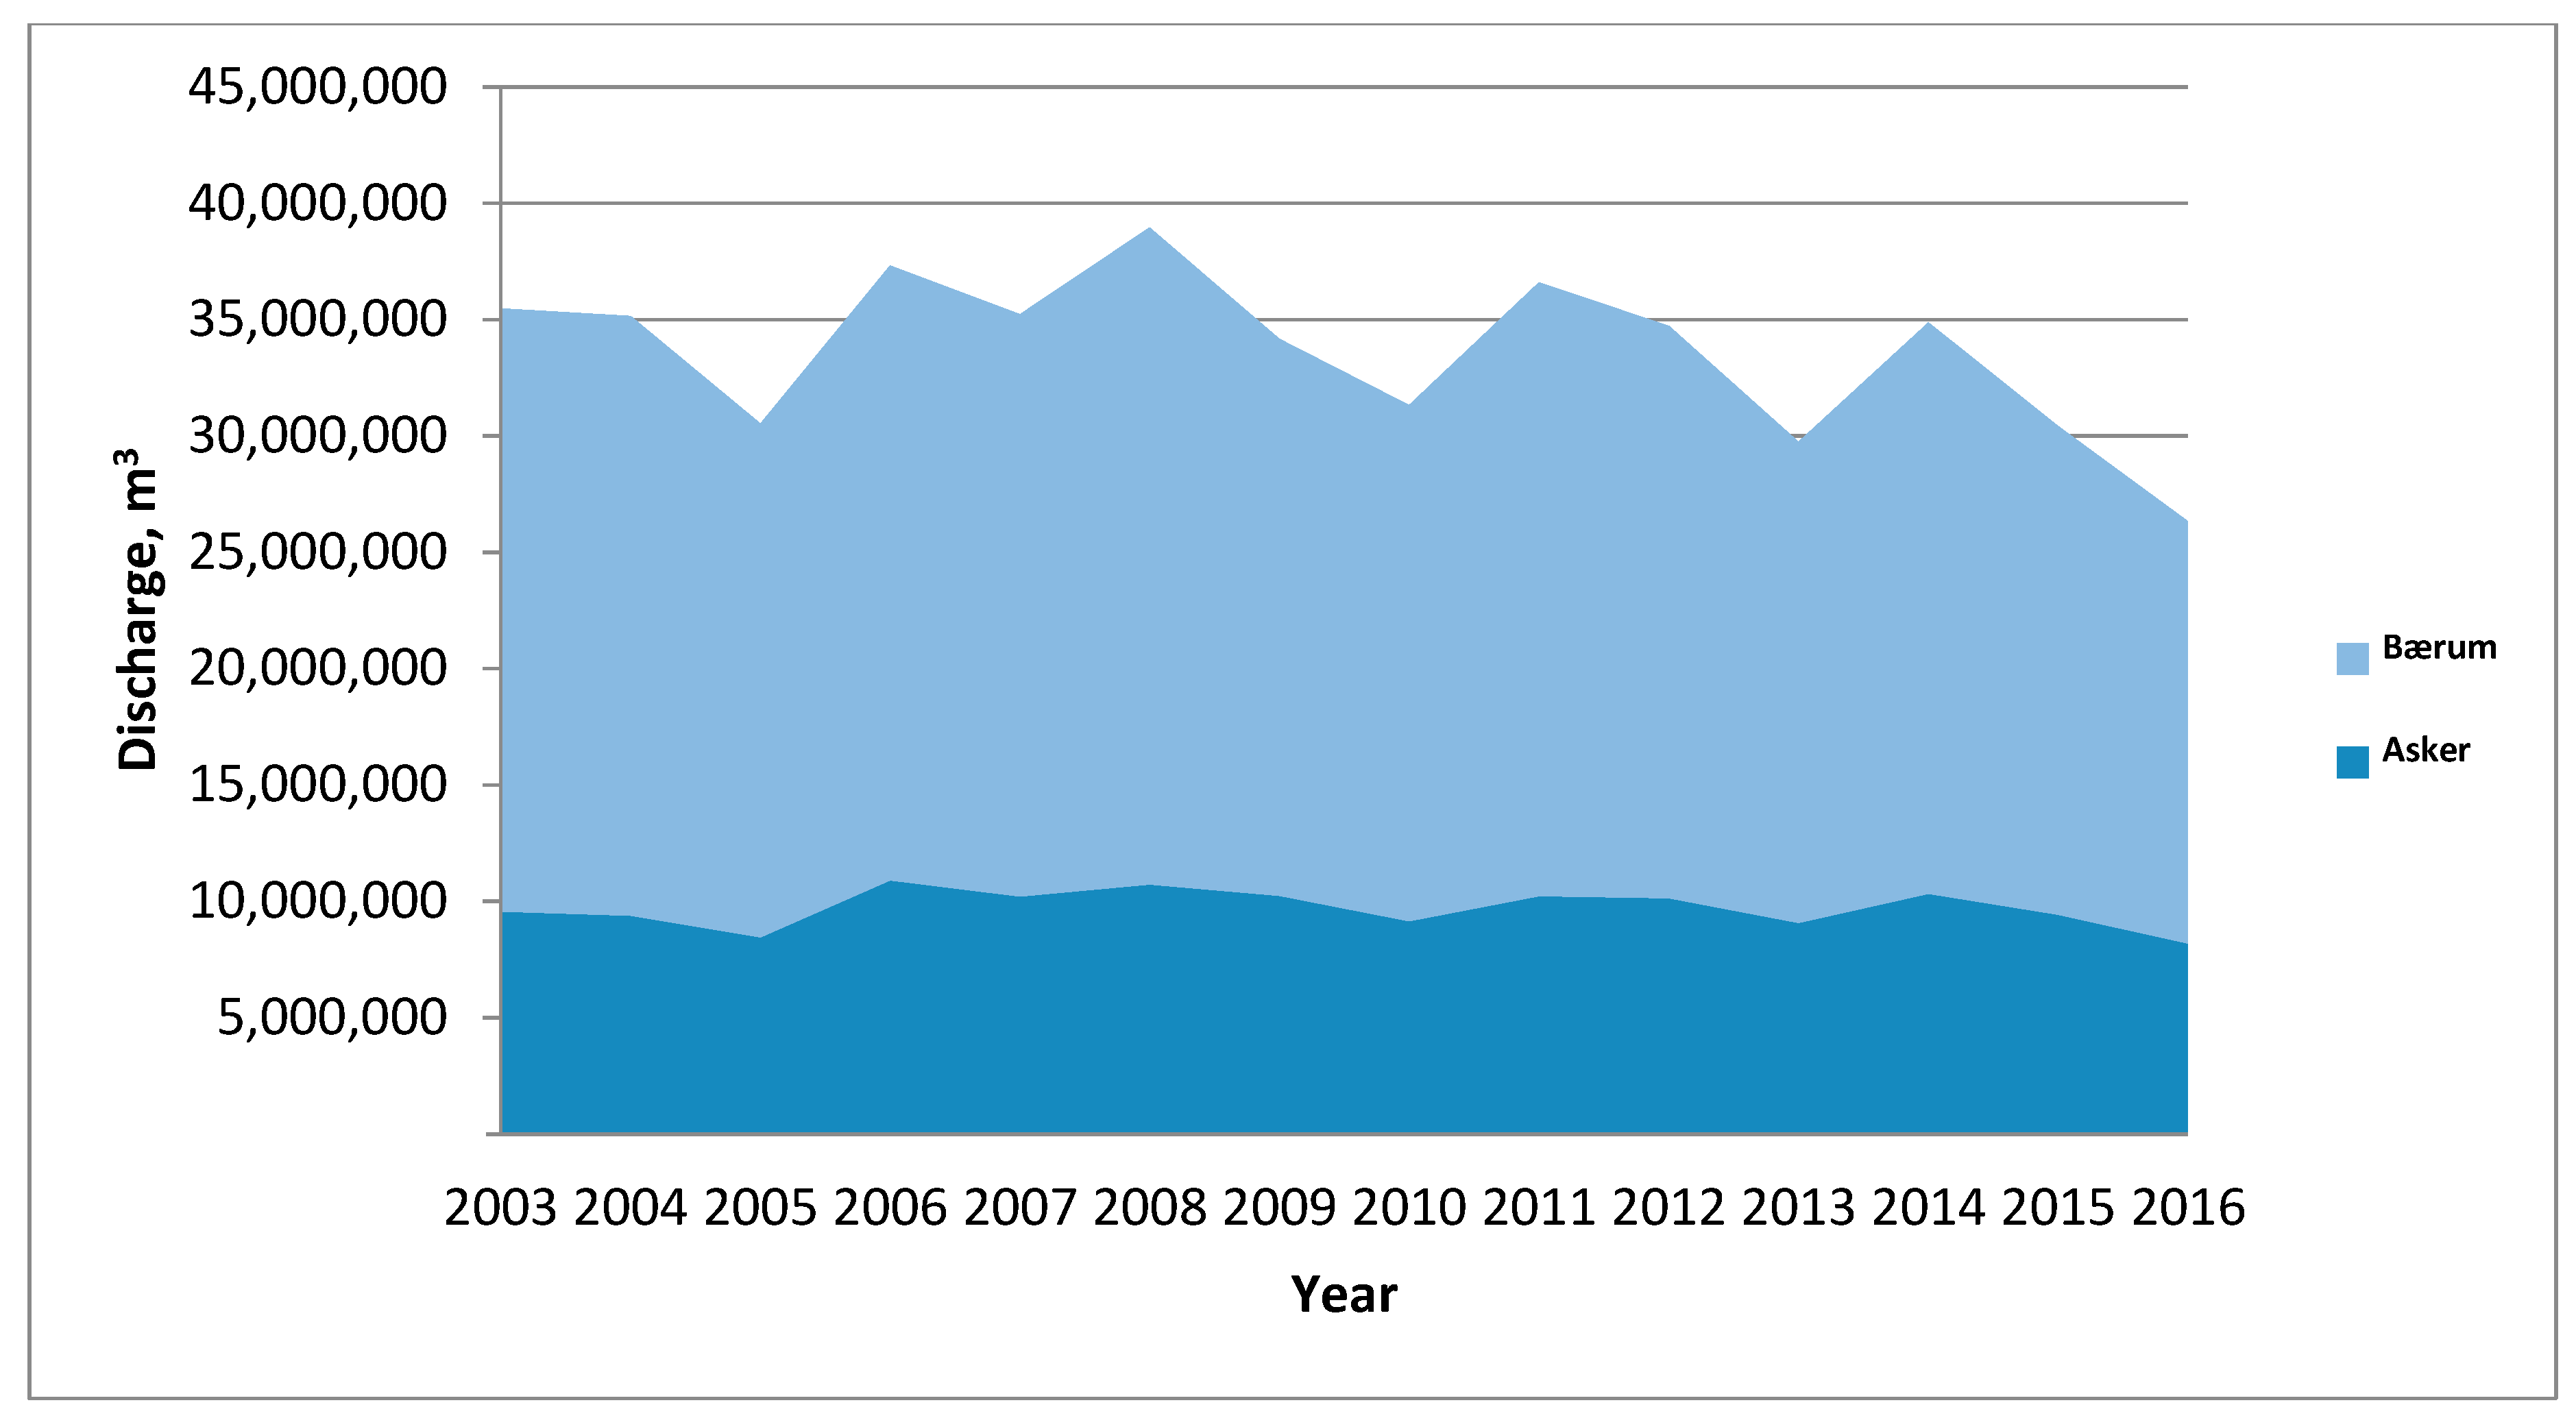
Volumes (m3 water/year) of wastewater reaching the treatment plant VEAS from Asker and Bærum varies between years. This variation is shown in Figure 2.
The water balance method has been used to calculate I/I-water in Asker and Bærum municipalities. The results of the calculations are shown in Table 6.
The trend lines for the two periods (2000–2008/2008–2016) are shown for both municipalities in Figure 3 and Figure 4.
The analysis shows that there is a reduction in I/I-water from 2008 to 2016. However, looking at the broader picture, including all years back to 2003, we see that 2005 and 2016 is almost at the same level. The general trend, though, seems to have changed around 2008 whereas before that, the trend was increasing I/I-water and after 2008 the trend is decreasing I/I-water.
3.1.2. Drammen (Solumstrand)
For Solumstrand, the volume of wastewater transported to the plant and the volume of wastewater overflow comprise the total volume of wastewater included in the calculations for all years from 2009 to 2016. The results of these calculations are shown in Figure 5 and Table 7.
Calculations of I/I-water using both methods indicate a slight difference in the results. Calculations using the WBM generally give lower values of I/I-water than calculations using the DM. This supports the conclusions of Vråle [2]. The reason why Vråle prefers the DM is that wastewater during heavy rainfall may be transported through weirs to the recipients instead of being transported to the measuringpoint [2]. If the WBM is being used to calculate the amount of I/I-water, water being transported through weirs will contribute to an underestimation of the amount of I/I-water.
However, regardless of what method being used, the development of Solumstrand is going in the wrong direction, showing an increase in I/I-water from 2009 to 2016.
3.2. Development of I/I-Water in Denmark
For calculations of I/I-water volumes for the selected wastewater districts in Denmark, the water balance method was used. The results are shown in Table 8 and Table 9.
Obvious wrong values have been removed when average values for Denmark of I/I-water have been calculated. This goes for Frederikshavn Spildevand AS, Horsens Vand AS, and Vestforsyning Spildvand AS.
The calculations show that the volumes of I/I-water for the selected Danish wastewater districts have been relatively stable from 2010 to 2016 on about 30%.
DANVA has made some calculation regarding I/I-water related to wastewater systems (combined versus separate) for those districts that are a part of DANVA’s benchmarking system [37]. DANVA has calculated the amounts of I/I-water based on measured volumes of wastewater into the wastewater plants and figures on delivered drinking water. Most plants receive approximately 2.5 to 3 m3 of wastewater to each m3 of drinking water produced. In these plants, there is about 70% separate systems [37]. A ratio of 2.5 of wastewater to drinking water represents a fraction of I/I-water of approximately 60%. Considering this and the calculations made in this work shown in Table 9, indicates that the variations of I/I-water between the districts in Denmark are relatively large. The analysis performed by DANVA shows a variation in I/I-water between 40% and 80%. The results from DANVA indicate that the calculation done in this study, and the study done by Lindholm et al. [5], gives an I/I-water ratio that is too low. This may be due to the selection of the average value used in the calculations. Another possibility is that methods of calculating the I/I-water are inadequate.
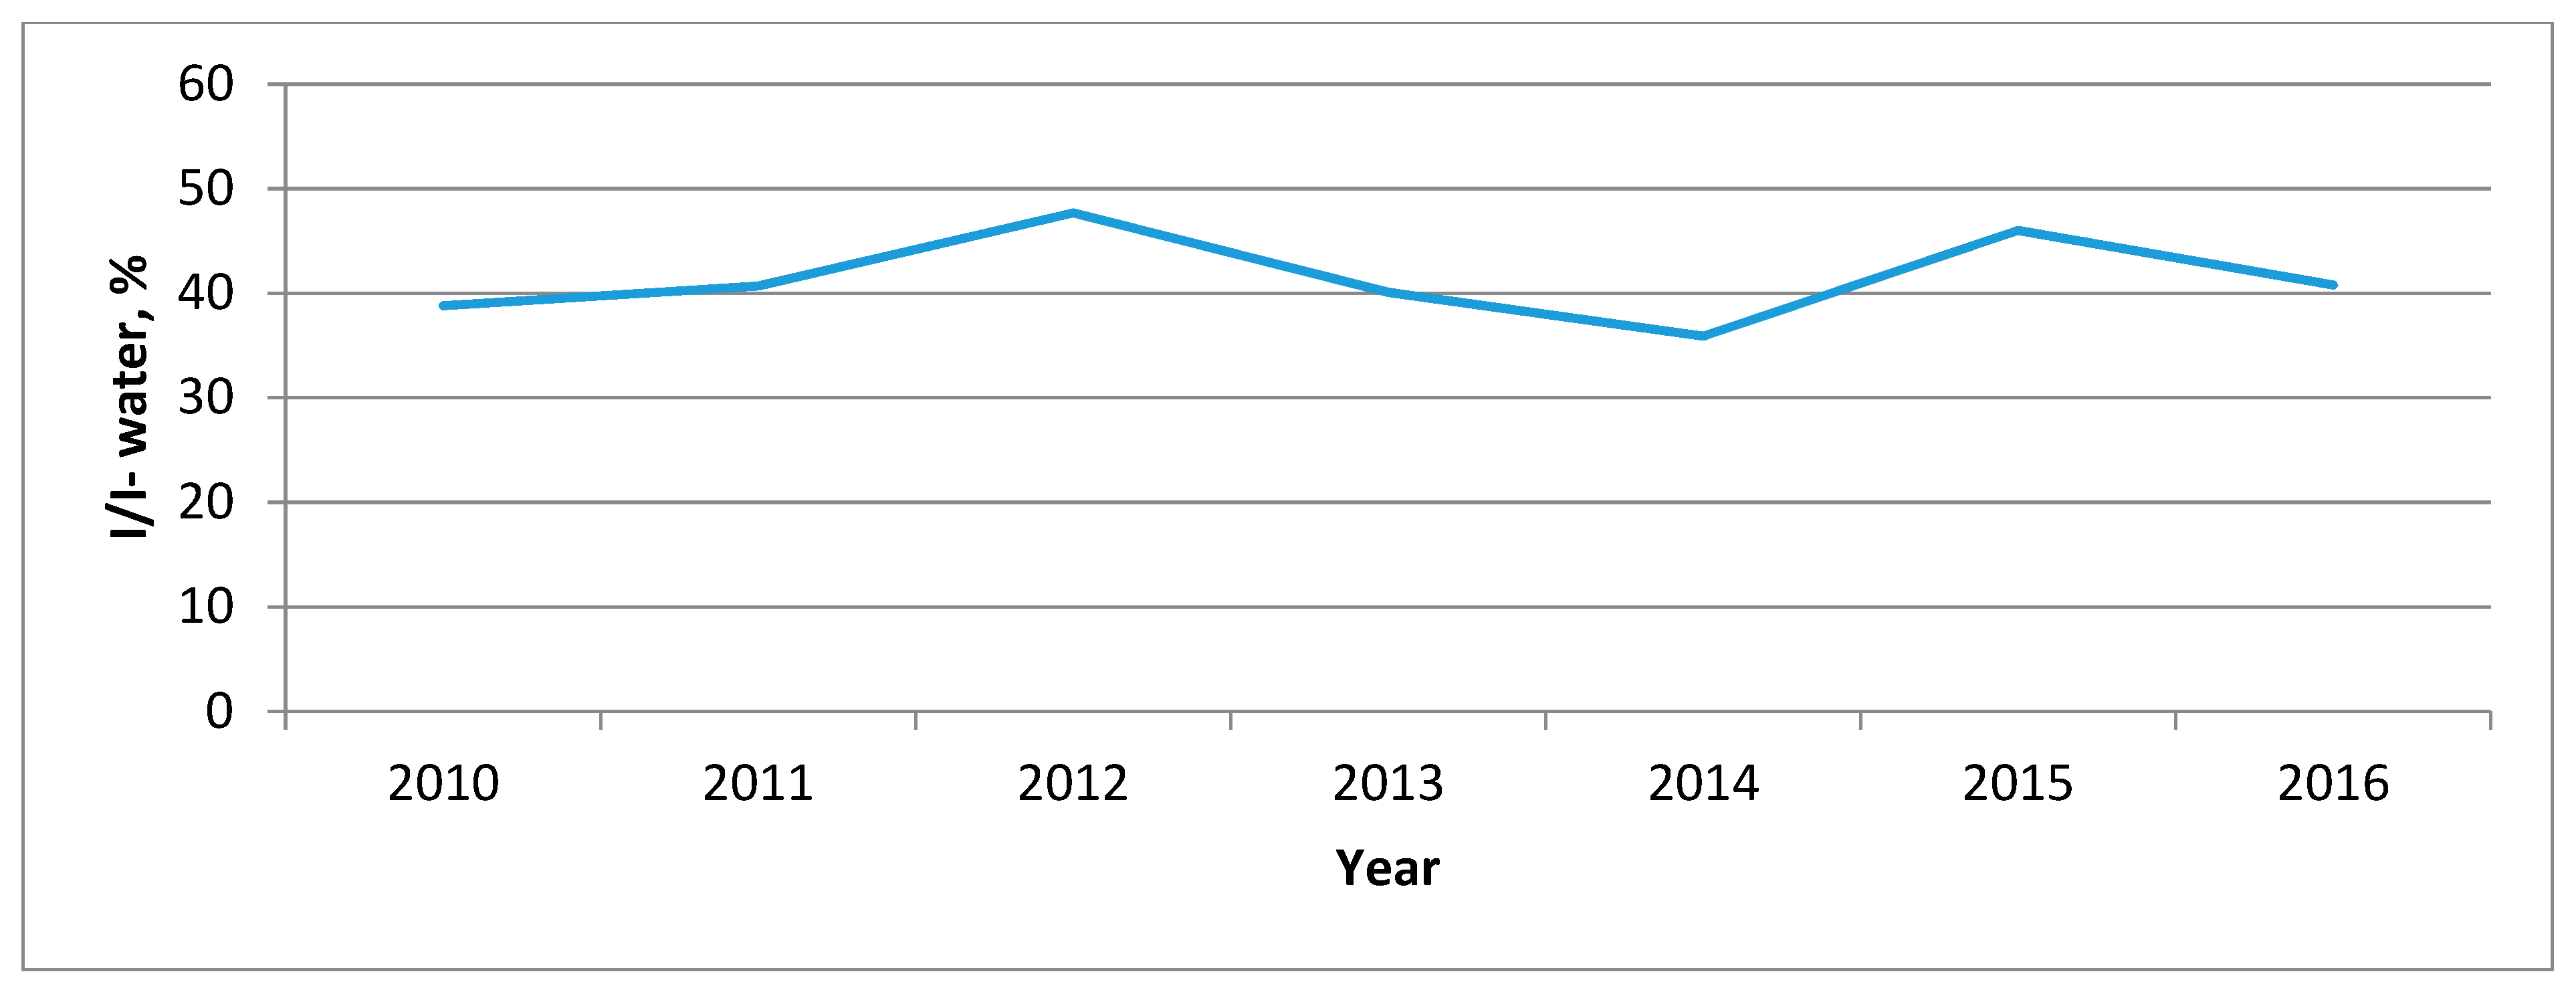
3.3. Development of I/I-Water in Finland
The Finnish organization FIWA (Finnish Water Utilities Association) has analysed the average amount of I/I-water for 68 waterworks in Finland for 2016. The fraction of I/I-water was 40.8%. About 95% of all wastewater systems in Finland are separate systems [29]. The Finnish calculations are shown in Figure 6.
3.4. Development of I/I-Water in Sweden
I/I-water volumes into some big wastewater plants in Sweden have been calculated by using the water balance method. The results of the calculations are shown in Table 10 and Table 11.
Obvious wrong numbers have been removed when the average value of I/I-water has been calculated for 2015. This goes for Nykvarnsverket (−260% I/I-water) and Duvbackens ARV (100% I/I-water).
For the Swedish plants included in this study, a reduction in I/I-water volumes from 2010 to 2015 are observed. The calculations show a reduction from 58% to 46%.
Annually, Svenskt Vatten produces the report “Resultatrapport för VASS Drift” (a report with results regarding wastewater and water services). This report sums up the results for the Swedish benchmarking regarding water and wastewater services [32]. For 2015, the report gives an average value of produced wastewater of 183 L/pe per day. Using this figure, the analysis gives an average of 58% of I/I-water when removing clearly incorrect input data.
3.5. I/I-Water and Gauged Rainfall
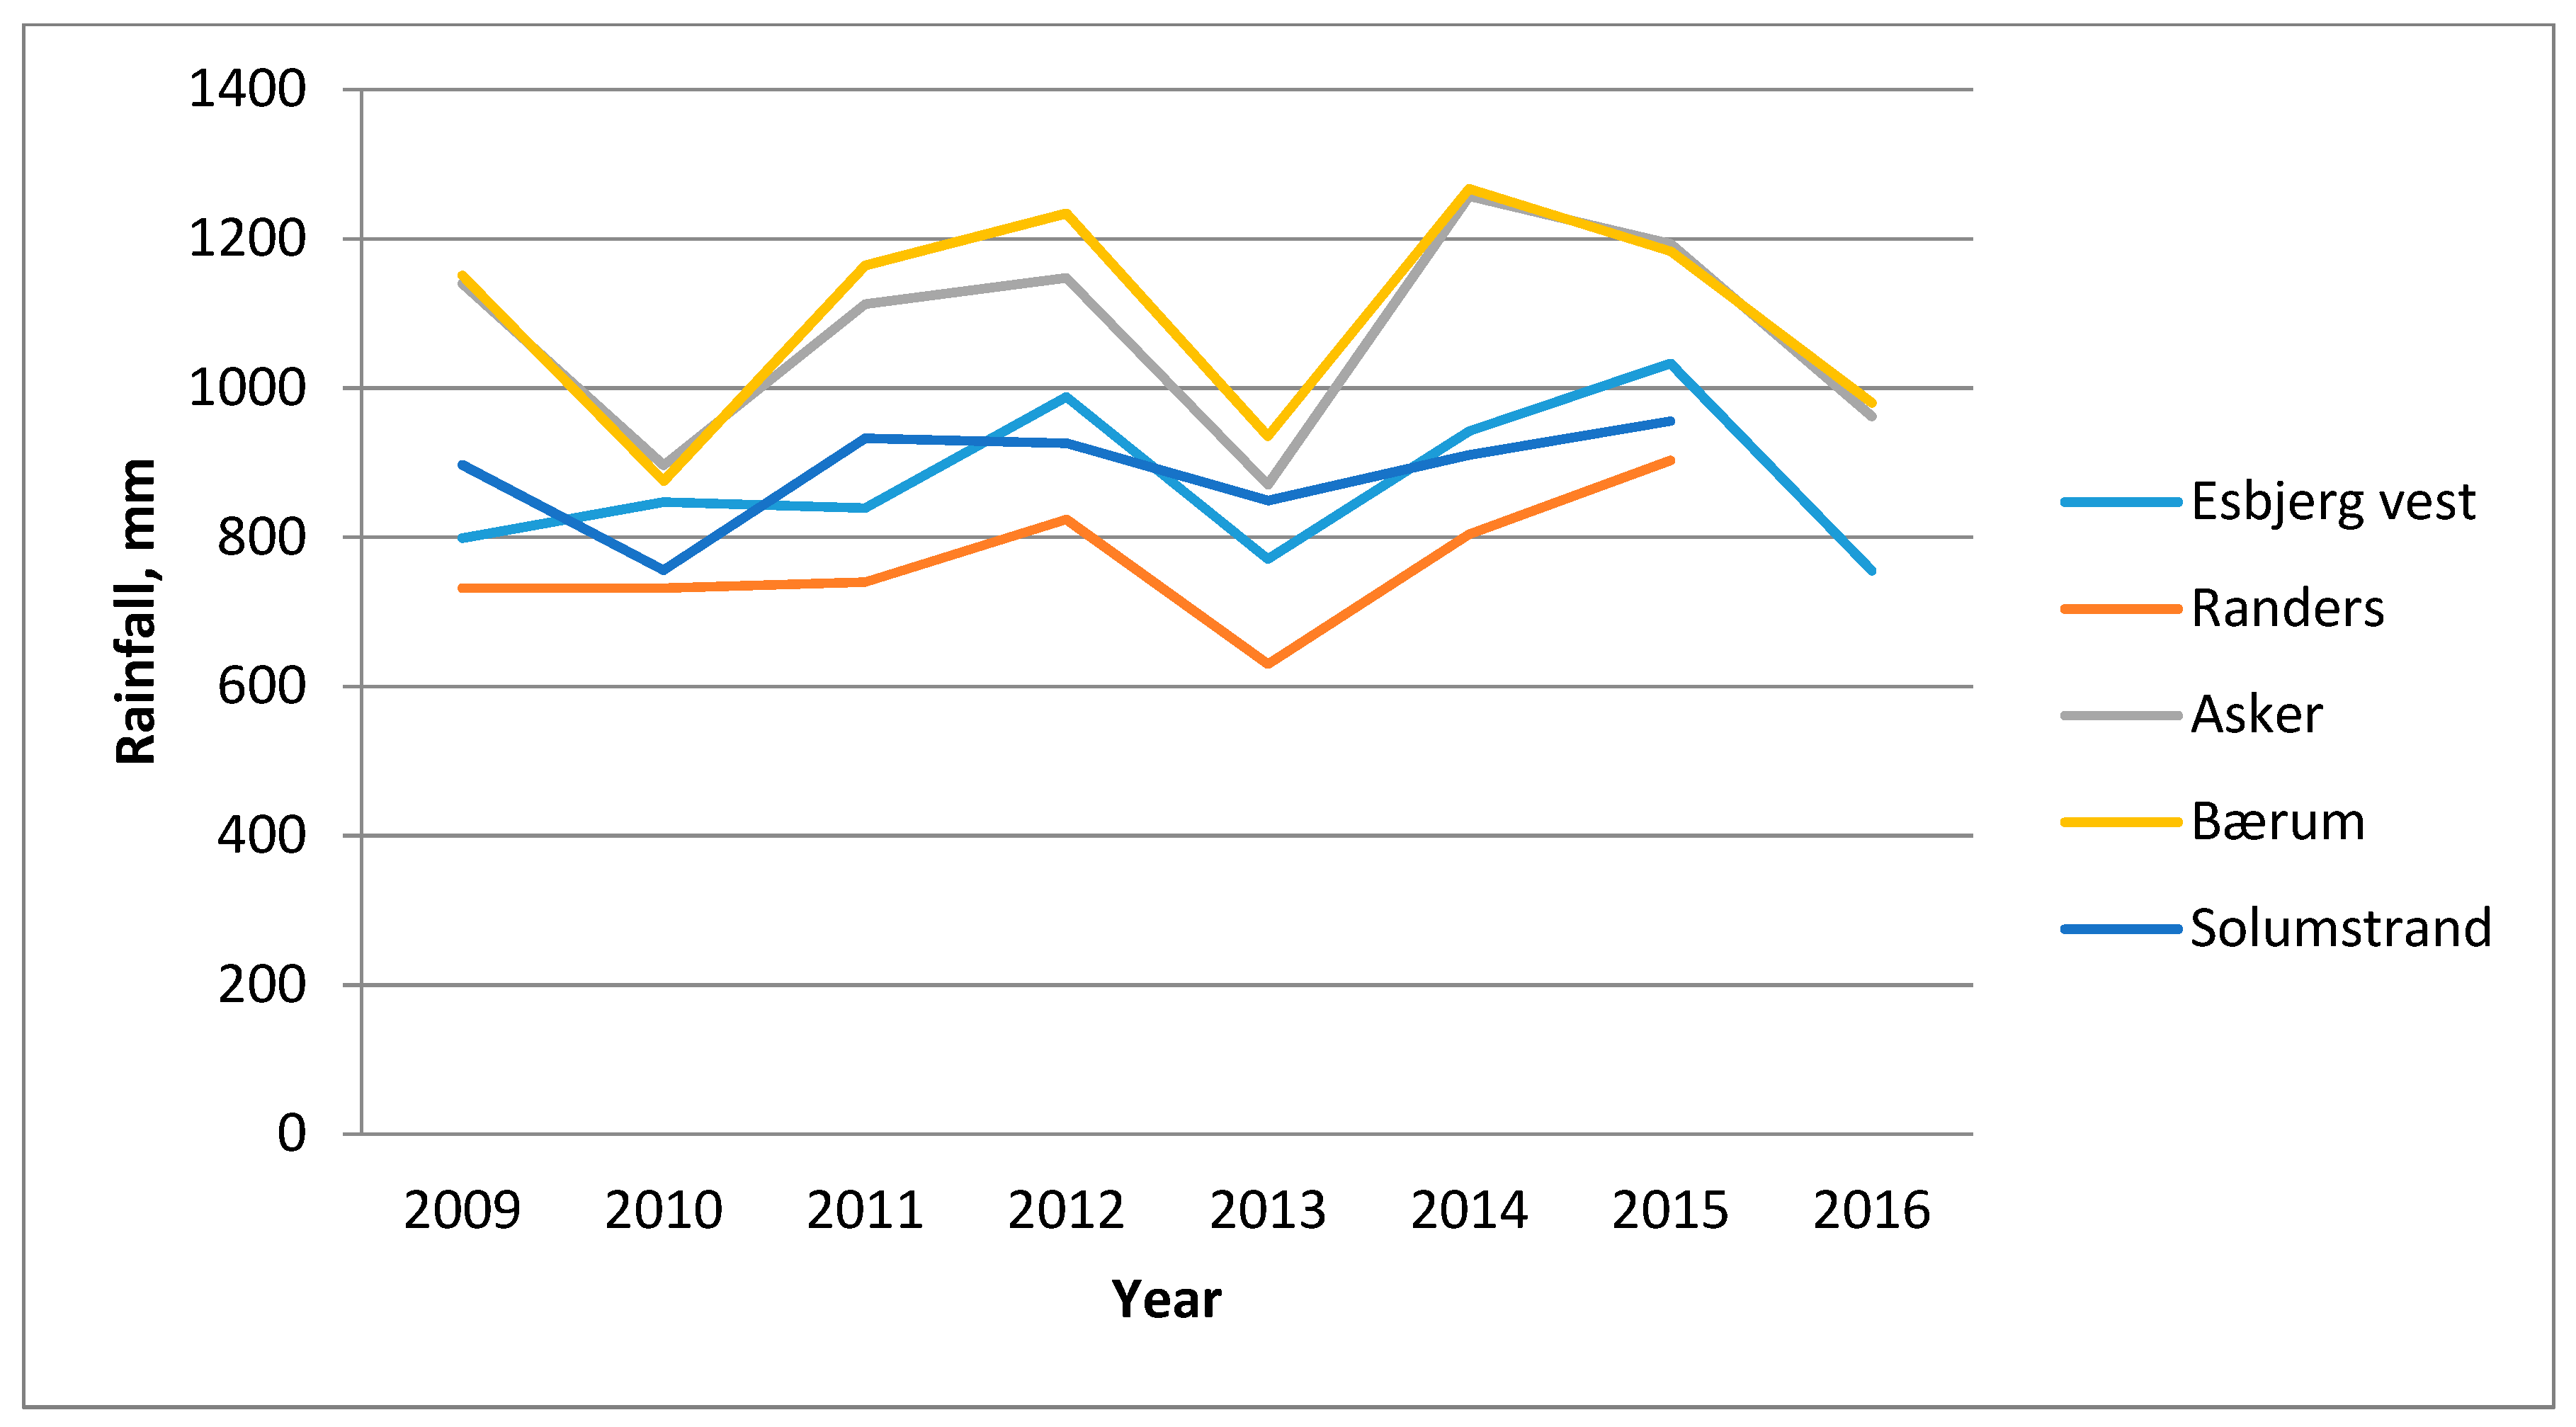
Comparisons of the volumes of wastewater delivered to the WWTP and gauged rainfall for Asker, Bærum, and Drammen in Norway, and the districts Esbjerg vest and Randers in Denmark, are shown in Figure 7 and Figure 8.
Clearly, it rains more in Asker and Bærum than in Drammen and the two locations in Denmark. Also, the volumes of wastewater delivered to the plants are much bigger in Asker and Bærum than for the other three locations. 2013 was a dry year for all the locations, and also all the locations, except for Drammen, were at a minimum regarding discharge in 2013.
Using linear regression, the discharge has been correlated to rainfall for the five locations. The result of the regression-analyses is shown in Table 12.
The results show a correlation between rainfall and discharge in Asker and Esbjerg vest. It needs to be pointed out that the number of observations may be a bit too low to draw complete conclusions.
Table 13 sums up the calculated values of I/I water for 2015/2016 together with the percentage of combined system and average amounts of rainfall for all investigated areas.
4. Conclusions
For wastewater treatment plants in Norway, there have been small but positive changes regarding volumes of I/I-water from 2008 to 2016. The average value for the studied plants in 2016 was 66%, while analysis using 2009 data shows an average of 70%. For most of the Norwegian plants, I/I-volumes are decreasing, but for a few districts, the opposite is the case.
Analysis of the data for Asker and Bærum municipalities in Norway is indicating a positive development regarding I/I-water when relating I/I-water to rainfall for all years from 2003 up until today. The volumes of I/I-water are decreasing despite an increase in rainfall.
For the Solumstrand district in Drammen, Norway, the development in I/I-water is going in the wrong direction, increasing from 2009 to 2016. Part of the explanation for Drammen developing negatively compared to Asker and Bærum may be the differences in the share of combined systems, which is higher in Drammen than the two other municipalities, 56% in relation to 0% and 35%.
Using both the dilution method and the water balance method on the Solumstrand data gives a difference in the results. Calculations using the dilution method give higher volumes of I/I-water compared to the water balance method. Looking at the inputs for these two methods, it is likely that the dilution method is giving a more correct picture of the situation than the water balance method. This is due to the fact that water leaves the system through overflows along the pipes in most wastewater systems, and this is difficult to take into account when using the water balance method.
DANVA’s analysis shows that the amount of I/I-water in Denmark varies between 40% and 80%. The analysis performed in this study using data from 2016 shows an average value of I/I-water on 30%. The calculated average values using data from 2009 and 2016 are probably underestimating the I/I-water fraction. There are some indications that the selected samples are not representative of all wastewater districts in Denmark.
FIWA reports that the amount of I/I-water in Finland in 2016 was 40.9%. This is an increase compared to the analysis done by Lindholm et al. using the 2009 data, where they found the I/I-water fraction to be 29%. The 2012 result was probably underestimating the situation. This may be a result of not using a representative selection of WWTP in 2012, or the fact that different calculation methods were used.
Svenskt Vatten has calculated the average fraction of I/I-water in Sweden to be about 49% in 2012. Calculations performed by Lindholm et al. show a fraction of I/I-water of 58% for 2009. The analysis performed in this study, for the same plants investigated by Lindholm et al., gives an average of 46% for 2015. For three examined districts in Sweden, the percentage of I/I-water varies between 34, 64, and 36 in 2015. In 2009, the figures of I/I-water in the same districts were 52, 68, and 59. The amounts of I/I-water have decreased in all three districts.
In this study, Denmark is the country with the lowest fraction of I/I-water. This may be a result of the uncertainties associated with the water balance method, which was used in the calculations regarding Denmark, but may also be a result of the locations in Denmark receiving less rain than the Norwegian and Swedish locations.
Calculated amounts of I/I-water will depend on estimated water consumption per capita in the districts. It will also be of importance to what extent the water consumption has been measured or only stipulated. Correct values on total volumes of wastewater in each district, and volumes of wastewater leaving the system through overflow weirs, are also crucial if the water balance method is to be used.
Rainfall will influence the amounts of I/I-water in some wastewater districts. To be able to look at long-term development in I/I-water, it is, therefore, of importance to compare the results with data of rainfall. It is also important to look into long series of data. Year-to-year comparisons are not recommended.
There are some uncertainties related to the results derived through this study. These uncertainties are associated to assumptions made on water consumption, wastewater being transported away from the system through weirs, production of Phosphorous, measured amounts of TOT-P, number of inhabitants, water use in industry, commuting, and exact amounts of rainfall. If this study had been conducted on a smaller area, it would be easier to control most of the variables listed above. If one in addition could control the level of I/I-water with other parameters than TOT-P it probably would be possible to know how dilute the wastewater is without making calculations and assumptions. Such sensors are still not commonly used in the wastewater piping system, but it is likely to believe that they will be in the near future. Sensors installed locally will improve the possibilities for finding locations where the I/I-water enters the wastewater system.
Through this study, some of the influencing factors regarding I/I-water in wastewater systems have been identified. In this study only rainfall and system solution (combined/separate) were included. Other factors of importance may be the age of the sewer pipes and leakages from the drinking water pipes. To efficiently reduce the volume of I/I-water, it is important to investigate what factors that affect the I/I-water the most. It is also important to relate different field parameters, such as the level of the groundwater table, urbanization and impervious surfaces to the amount of I/I-water. Further investigations should therefore include more variables in order to be able to conclude which parameters are the most important influencers regarding the level of I/I-water.
Author Contributions
Conceptualization, K.J.S.; Investigation, K.J.S.; Project administration, K.J.S.; Supervision, J.T.B. and O.G.L.; Writing—original draft, K.J.S.; Writing—review & editing, J.T.B., O.G.L., and H.R.
Funding
The authors want thank Asker municipality and the Research Council of Norway for financing this study.
Acknowledgments
The authors want to thank Asker, Bærum and Drammen municipalities, DAVA, Svenskt Vatten and FIWA for willingly sharing information and for giving access to data. In addition the authors want to thank the Norwegian Environment Agency for granting access to WWTP data.
Conflicts of Interest
The authors declare no conflict of interest.
References
- Karstensen, H. Økonomiske Konsekvsener av Fremmedvann i Avløpssystemet. En Casestudie av Bekkelaget Rensedistrikt (Finanicial Consequences of I/I- Water. A Casestudy of Bekkelaget Wastewater District); NMBU: Ås, Norway, 2015. [Google Scholar]
- Vråle, L. Konsekvenser av Inntak av Fremmedvann i Avløpsledninger (Consequences of I/I- Water in Sewer Systems); SFT-rapport nr. 93:09; Statens Forurensningstilsyn (SFT): Oslo, Norway, 1993.
- Vråle, L. Fremmedvann- et Stort Problem for Norske Ledningsnett og Renseanlegg (I/I- Water- A Major Problem for Norwegian Sewer Pipes and Wastewater Treatment Plants); VANN: Oslo, Norway, 2011. [Google Scholar]
- Lindholm, O.; Bjerkholt, J. Store Fremmedvannsmengder i Norske Avløpsanlegg (Large Quantites of I/I- Water in Norwegian Wastewater Systems); VANN: Oslo, Norway, 2011. [Google Scholar]
- Lindholm, O.; Bjerkholt, J.; Lien, O. Fremmedvann i Nordiske Avløpsledningsnett (I/I- Water in Nordic Wastewater System); VANN: Oslo, Norway, 2012. [Google Scholar]
- Ræstad, C.; Evjemo, J.I.; Dupont, R.A. Sørum Kommune har 0,7 % Lekkasjetap! (The Leakage Percent in Sørum Municipality Is 0,7!); VA- bulletin nr. 4; Norsk Vann: Hamar, Norway, 2010. [Google Scholar]
- Sivertsen, E.; Bomo, A.-M. Norske Tall for Vannforbruk Med Fokus på Husholdningsforbruk (Figures on Water Use in Norwegian Households); Rapport B20/2016; Norsk Vann: Hamar, Norway, 2016. [Google Scholar]
- Bomo, A.-M.; Schade, M. Vannforbruk i Husholdningene. En Erfaringsinnhenting. (Wateruse in housholds); VANN (WATER): Oslo, Norway, 2015. [Google Scholar]
- Ødegaard, H.; Lindholm, O.; Mosevoll, G.; Thorolfsson, S.; Sægrov, S.; Østerhus, S.; Heistad, A. Vann- og Avløpsteknikk (Water- and Wastewater Engineering); Norsk Vann: Hamar, Norway, 2012. [Google Scholar]
- Vråle, L. Riktige, Spesifikk Forurensningstall Nødvendig for Gjennomføring av Funksjonsanalyser for Avløpsnettet (Correct Numbers on Pollution Is Nescessery in Order to Do a Perform an Analysis of the Sewer System); VANN (WATER): Oslo, Norway, 2013. [Google Scholar]
- Vråle, L. Forurensnings-Inntak via Fremmedvann i Avløpsnett (Inflow of Polluted Water to the Wastewater System); VA- rapport 13/87; Norsk Institutt for Vannforskning (Norwegian Institute for Water Research): Oslo, Norway, 1987. [Google Scholar]
- Hanssen-Bauer, I.; Drange, H.; Førland, E.J.; Roald, L.A.; Børsheim, K.Y.; Hisdal, H.; Lawrence, D.; Nesje, A.; Sandven, S.; Sorteberg, A.; et al. Klima i Norge 2100. Bakgrunnsmateriale til NOU Klimatilpasning. (Backgroundmaterial for the NOU Adapting for Climate Changes); Norsk klimasenter: Oslo, Norway, 2009. [Google Scholar]
- Klimatilpasningsportalen/Miljøstyrelsen. Klimatilpasning (Adapting for Climate Change). Available online: http://www.klimatilpasning.dk/viden-om/klima/klimaaendringeridanmark/%C3%A6ndringer-i-nedboer/nedboeren-i-danmark-fra-1874-til-i-dag.aspx (accessed on 6 September 2018).
- Torres, M.F. Fremmedvann i Oslo Kommune. Evaluering av Fremmedvannets Volum, Kilder og Sammenheng Med Målbare Egenskaper til Avløpsnettet. (I/I- Water in Oslo Municipality. An Evaluation of the Quantities, Sources and Relations Regarding the Characteristics of the Wastewater System); NMBU: Ås, Norway, 2013. [Google Scholar]
- Beheshti, M.; Sægrov, S.; Ugarelli, R. Infiltration/Inflow Assesment and Detection in Urban Sewer System; VANN (WATER): Oslo, Norway, 2015. [Google Scholar]
- Weiss, G.; Brombach, H.; Haler, B. Infiltration and inflow in combined sewer systems: Ong-term analysis. Water Sci. Technol. 2002, 45, 11–19. [Google Scholar] [CrossRef] [PubMed]
- Karpf, C.; Krebs, P. Quantification of groundwater infiltration and surface water inflows in urban netwok based on a multiple model approach. Water Res. 2011, 45, 3129–3136. [Google Scholar] [CrossRef] [PubMed]
- Belhadj, N.; Joannis, C.; Raimbault, G. Modelling of rainfall induced infiltration into separate sewerage. Water Sci. Technol. 1995, 32, 161–168. [Google Scholar] [CrossRef]
- Statistisk Sentrabyrå (SSB). Kommunefakta (Facts about Norwegian Municipalities). Available online: https://www.ssb.no/kommunefakta/ (accessed on 5 June 2018).
- Finnesand, T. Opplysninger om Innløpskonsentrasjon TOT-P til Avløpsrenseanlegg i Norge. (Information Regarding Consetration of TOT-P into Norwegian WWTP); Norwegian Environment Agency: Oslo, Norway, 2017. [Google Scholar]
- Statistisk Sentrabyrå (SSB). Antall Meter Separatsystem/Fellessystem i Norge for 2017 (The Share of Separate/Combined System in Norway in 2017). Available online: https://www.ssb.no/statbank/table/05457?rxid=84a7888d-b035-40f1-8776-054b0aac741c (accessed on 15 March 2018).
- Asker kommune. Folketall pr 1. Januar 2008–2016. (Number of Inhabitants pr 1. January 2008–2016); Asker Municipality: Asker, Norway, 2017. [Google Scholar]
- Statistisk Sentrabyrå (SSB). Innbyggertall for Bærum (Number of Inhabitants in Bærum Municipality). Available online: https://www.ssb.no/statbank/table/01222/?rxid=721a17f3-2c0e-42bd-b980-1a4c47b2a0ff (accessed on 28 August 2018).
- Kveine, R. Ang Avløpssystemet i Bærum (About the Wastewater System in Bærum Municipality); Bærum Municipality: Bærum, Norway, 2018. [Google Scholar]
- Olsbu, V. Ang Avløpssystemet i Drammen (About the Wastewater System in Drammen); Drammen Municipality: Drammen, Norway, 2017. [Google Scholar]
- Rambøll, A.S. Årsrapport Renseanlegg 2014 (Annual Report 2014); Drammen Municipality: Drammen, Norway, 2014. [Google Scholar]
- Rambøll, A.S. Årsrapport Renseanlegg 2016 (Annual Report 2016); Drammen Municipality: Drammen, Norway, 2016. [Google Scholar]
- DANVA. Vand i tal 2008–2015. (About Water in Denmark 2008–2015). Available online: http://old.danva.dk/Medlemmer/Publikationer/Vand-i-tal.aspx (accessed on 24 April 2018).
- Rontu, M. Opplysninger om Fremmedvann i Finland (Regarding I/I- Water in Finland); Finnish Water Utillities Association: Helsinki, Finland, 2017. [Google Scholar]
- Finnson, A. Spesifik Tilrenning og Hydr. Belastning. (About Discharges and Loads); Svenskt Vatten (The Swedish Water and Wastewater Association): Bromma, Sweden, 2017. [Google Scholar]
- Balmer, P. Ang Avløpsvolum og Tilrenning til Renseanlegg (Regarding Wastewater Volumes and Discharge into WWTP); Telia, på uppdrag av Svenskt Vatten (on behalf of The Swedish Water and Wastewater Association): Bromma, Sweden, 2017. [Google Scholar]
- Svenskt Vatten AB. Resultatrapport fõr VASS Drift 2015 (Results for VASS Drift 2015). Available online: http://www.svensktvatten.se/globalassets/organisation-och-juridik/vass/drift/vass-drift-2015.pdf (accessed on 1 June 2018).
- Meteorologisk Institutt MET. Nedbørsdata for Asker, Bærum og Drammen Kommuner (Data of Precipitation for Asker, Bærum and Drammen). Available online: www.eKlima.no (accessed on 24 March 2018).
- Danmarks Meteorologiske Institut DNMI. Vejrarkiv (Data of Precipitation for Selected Raingaugs in Denmark). Available online: www.dmi.dk/vejr/arkiver/vejrarkiv/ (accessed on 24 March 2018).
- Sveriges Meteorologiska och Hydrologiska Institut. Nedbørsdata for Noen Nedbørsstasjoner i Sverige (Data of Precipitation for Selected Raingauges in Sweden). Available online: www.smhi.se (accessed on 24 March 2018).
- Rosim AS. Nedbørsdata i Asker (Data of Precipitation in Asker). Available online: www.regnbyge.no (accessed on 6 September 2018).
- Niels Vinderselv Bjerregaaard. Opplysninger om Fremmedvann i Danmark (Regarding I/I- Water in Denmark); DANVA: Skanderborg, Denmark, 2017. [Google Scholar]
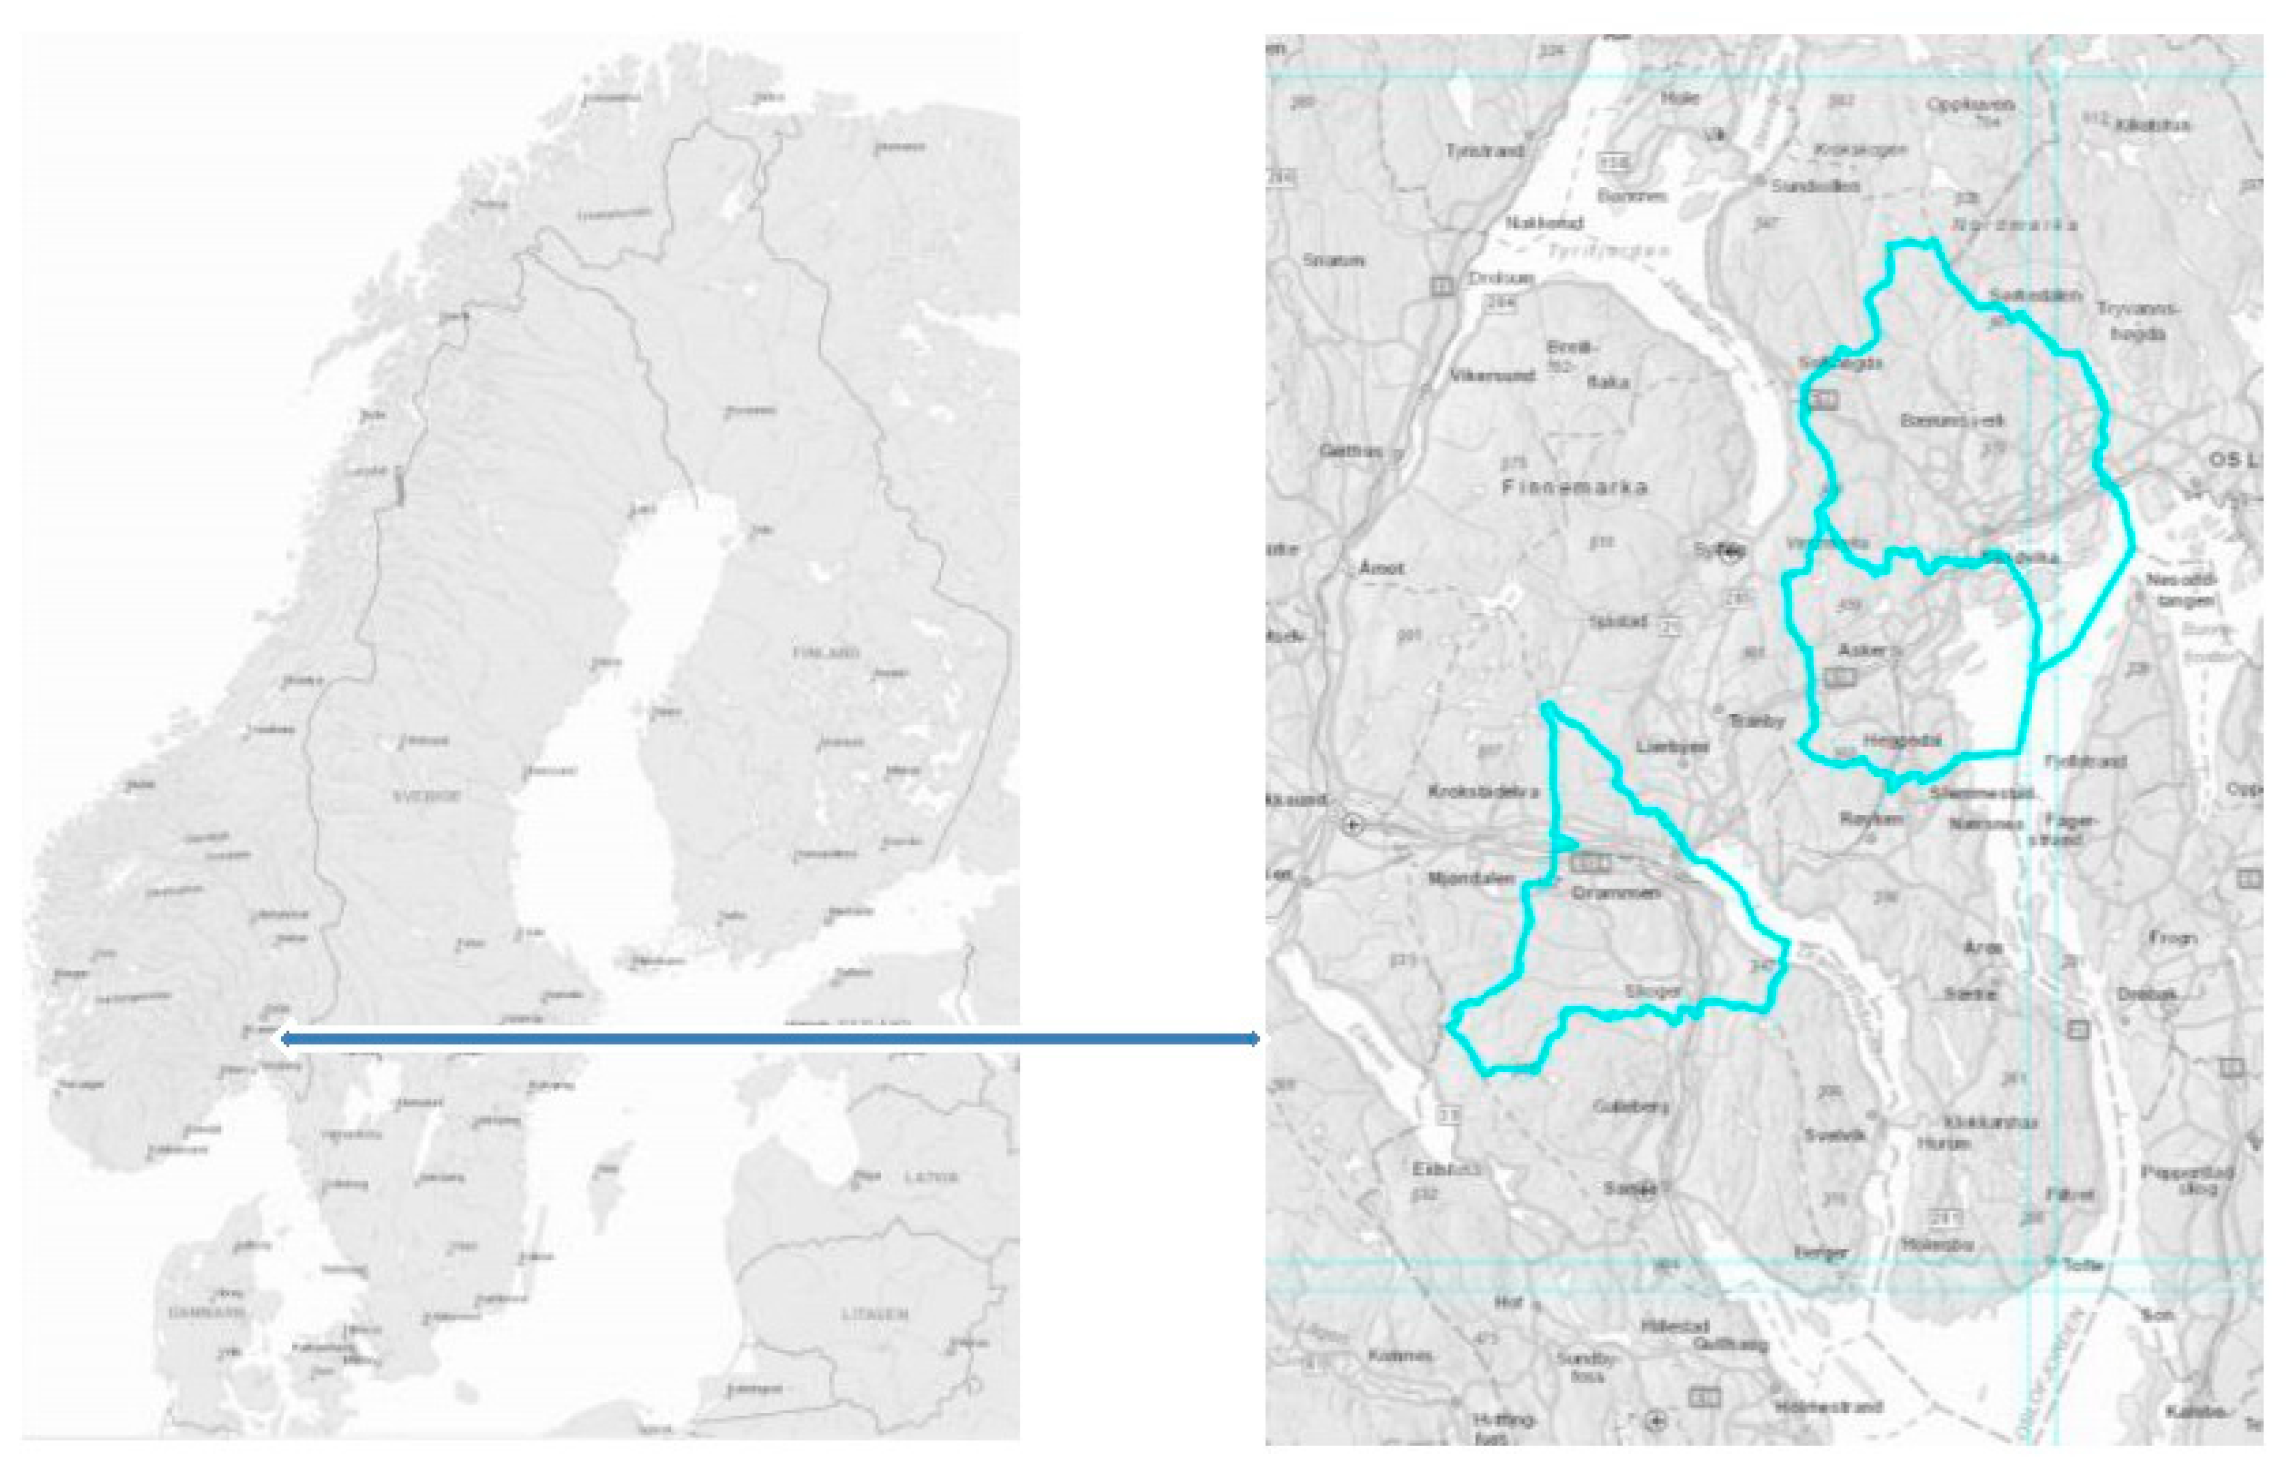
Figure 1.
Map of the Nordic countries and a zoom-in of Asker, Bærum, and Drammen municipalities [10].
Figure 1.
Map of the Nordic countries and a zoom-in of Asker, Bærum, and Drammen municipalities [10].

Figure 2.
Wastewater from Asker and Bærum delivered to VEAS for the years 2003–2016.

Figure 3.
Development of I/I-water in the Asker and Bærum municipalities for 2003–2008.

Figure 4.
Development of I/I-water in Asker and Bærum municipalities for 2008–2016.

Figure 5.
Discharge from the Solumstrand wastewater district for the years 2009–2016.

Figure 6.
The development of I/I-water in Finland from 2010 to 2016 [26].
Figure 6.
The development of I/I-water in Finland from 2010 to 2016 [26].

Figure 7.
Rainfall in Asker, Bærum, Drammen, Randers, and Esbjerg vest.

Figure 8.
Discharge in Asker, Bærum, Drammen, Randers, and Esbjerg vest.


Table 1.
Potential unwanted consequences of infiltration and inflow of non-sewer water to the wastewater network (I/I-water) in wastewater systems.
Table 1.
Potential unwanted consequences of infiltration and inflow of non-sewer water to the wastewater network (I/I-water) in wastewater systems.
| Component | Consequences |
|---|---|
| Pumping station | Increased expenses related to maintenance |
| Increased expenses related to energy use | |
| Sewer network included weirs | Payments related to basement floodings |
| Wastewater transported to the recipients | |
| Wastewater treatment plants included weirs | Increased expenses related to maintenance |
| Increased expenses related to energy use | |
| Wastewater transported to the recipients |
Table 2.
Norwegian, Danish, and Swedish plants included in the I/I-water analysis performed on the years 2009 and 2015/2016/2017.
Table 2.
Norwegian, Danish, and Swedish plants included in the I/I-water analysis performed on the years 2009 and 2015/2016/2017.
| Norwegian Plants 2009–2017 | Danish Plants 2009–2016 | Swedish Plants 2009–2015 |
|---|---|---|
| VEAS | Esbjerg Vest/Spildevand AS | Henriksdal, Stockholm |
| Bekkelaget Oslo | Frederikshavn Spildevand AS | Ryaverket, Göteborgsregionen |
| Solumstrand Drammen | Herning Band AS | Käppala, NO Stockholm |
| Saulekilen Areandal | Horsens and AS | Sjölundverket, Malmö |
| Lillehammer | Randers Spildevand AS | Bromma, Stockholm |
| Moss-Kambo | Ringsted Spildevand AS | Nykvarnsverket, Lindköping |
| Sandefjord | Vandcenter Syd AS | Slottshagen, Norrköping |
| Tønsberg | Vestforsyning Spildevand AS | Kungsängsverket, Uppsala |
| Nordre Follo | Aalborg Vest/Kloak AS | Kungsängens ARV, Västerås |
| Knappen Bergen | Aarhus Vand AS | Duvbackens ARV, Gävle |
| Ytre Sandviken Bergen | Källbyverket, Lund | |
| Sentralrenseanlegget NJ | Ekeby ARV, Eskilstuna | |
| HIAS | ||
| Alvim Sarpsborg | ||
| Knarrdalstrand Porsgrunn |
Table 3.
Summary of values used in the calculation of I/I-water for the year 2015/2016 concerning water consumption, phosphorus production, and the calculation method.
Table 3.
Summary of values used in the calculation of I/I-water for the year 2015/2016 concerning water consumption, phosphorus production, and the calculation method.
| Prerequisite for Calculations Done for the Years 2015 and 2016 | ||||
|---|---|---|---|---|
| County/Municipality | Water Consumption (L/pe Day) | Source of Information | Total Production of Phosphorus (mg TOT-P/pe Day) | Method of Calculation I/I-Water |
| Norway | 140 | Literature | 1.8 | DM |
| Asker | 140 | Literature | WBM | |
| Bærum | 140 | Literature | WBM | |
| Drammen (Solumstrand) | 140 | Literature | WBM | |
| Drammen (Solumstrand) | 140 | Literature | 1.8 | DM |
| Denmark | 158 | DANVA | WBM | |
| Finland | 140 | Norconsult (2014) | WBM | |
| Sweden | 183 | Svenskt Vatten | WBM | |
DM, dilution method; WBM, water balance method.
Table 4.
Districts where figures of rainfall for 2003/2010–2016 have been collected.
| Area | Country | Station Name | Source of Information | Data |
|---|---|---|---|---|
| Asker | Norway | Sem | MET | 2003–2016 |
| Bærum | Norway | Horni | MET | 2003–2016 |
| Solumstrand | Norway | Berskog | MET | 2009–2016 |
| Esbjerg vest | Denmark | Vestjylland | DMI | 2009–2016 |
| Randers | Denmark | Østjylland | DMI | 2003–2016 |
| Henriksdal | Sweden | Stockholm | SMHI | 2009–2016 |
| Ryaverket | Sweden | Göteborg | SMHI | 2009–2016 |
| Sjölundaverket | Sweden | Malmö | SMHI | 2009–2016 |
Table 5.
Measured amounts of TOT-P and calculated percentages of I/I-water for wastewater plants in Norway for 2008 and 2016.
Table 5.
Measured amounts of TOT-P and calculated percentages of I/I-water for wastewater plants in Norway for 2008 and 2016.
| Plant | TOT-P 2008 | % I/I 2008 | TOT-P 2016 | % I/I 20016 | Difference % I/I |
|---|---|---|---|---|---|
| VEAS | 3.66 | 68 | 3.53 | 73 | +5 |
| Bekkelaget Oslo | 3.62 | 68 | 3.81 | 70 | +2 |
| Solumstrand Drammen | 3.06 | 73 | 3.06 | 76 | +3 |
| Saulekilen Areandal | 2.50 | 78 | 3.80 | 70 | −8 |
| Lillehammer | 4.54 | 60 | 6.48 | 50 | −10 |
| Moss-Kambo | 4.2 | 63 | 5.72 | 56 | −7 |
| Sandefjord | 2.47 | 78 | 2.79 | 78 | 0 |
| Tønsberg | 4.11 | 64 | 4.10 | 68 | +4 |
| Nordre Follo | 4.22 | 63 | 5.26 | 59 | −4 |
| Knappen Bergen | 2.41 | 79 | 4.30 | 67 | −12 |
| Ytre Sandviken Bergen | 1.58 | 86 | 3.00 | 77 | −9 |
| Sentralrenseanlegg NJ | 3.17 | 72 | 3.81 | 70 | −2 |
| HIAS | 6.87 | 39 | 8.31 | 35 | −4 |
| Alvim | 3.04 | 73 | 4.10 | 68 | −5 |
| Knarrdalstrand | 1.63 | 86 | 2.71 | 79 | −7 |
Table 6.
Calculated volumes of I/I-water in Asker and Bærum for 2008 and 2016.
| Input | Asker | Bærum | ||
|---|---|---|---|---|
| 2008 | 2016 | 2008 | 2016 | |
| Discharge, m3/year | 10,719,307 | 8,191,559 | 28,239,000 | 18,134,684 |
| pe | 52,922 | 60,106 | 110,000 | 124,000 |
| I/I-water, m3/år | 7,628,662 | 5,120,142 | 21,669,000 | 11,564,684 |
| I/I-water % | 71 | 63 | 77 | 64 |
Table 7.
Calculated volumes of I/I water in Drammen with the water balance method and the dilution method for 2008 and 2016.
Table 7.
Calculated volumes of I/I water in Drammen with the water balance method and the dilution method for 2008 and 2016.
| Method of Calculation | The Water Balance Method | Method of Calculation | The Dilution Method | ||
|---|---|---|---|---|---|
| Year | 2009 | 2016 | Year | 2009 | 2016 |
| Amounts of water, m3/year | 8,947,000 | 10,219,100 | TOT-P, mg/L | 3.06 | 3.06 |
| pe | 66,857 | 66,857 | pe | 66,857 | 66,857 |
| I/I-water, m3/year | 5,042,551 | 6,802,707 | Water use, L/pe day | 160 | 140 |
| I/I-water, % | 56 | 67 | I/I-water, % | 73 | 76 |
Table 8.
Numbers of pe, discharge and percentage of I/I-water for some investigated Danish wastewater districts for 2010 and 2016.
Table 8.
Numbers of pe, discharge and percentage of I/I-water for some investigated Danish wastewater districts for 2010 and 2016.
| District | 2010 | 2016 | ||||
|---|---|---|---|---|---|---|
| pe | Discharge, m3/year | I/I, %, 2010 | pe | Discharge, m3/år | I/I, %, 2016 | |
| Esbjerg Forsyning AS/Esbjerg Spildevand AS | 247,000 | 17,200,000 | 10 | 198,459 | 16,382,527 | 30 |
| Frederikshavn Spildevand AS | 131,505 | 11,992,715 | 31 | 261,852 | 11,009,047 | −38 |
| Herning Vand AS | 126,731 | 11,181,496 | 29 | 217,364 | 13,260,265 | 5 |
| Horsens Vand AS | 278,981 | 12,392,123 | −42 | 352,256 | 12,556,405 | −63 |
| Randers Spildevand AS | 82,835 | 10,248,558 | 49 | 97,759 | 10,954,416 | 48 |
| Ringsted Spildevand AS | 88,000 | 6,082,831 | 9 | 92,457 | 6,006,000 | 11 |
| Vandcenter Syd AS | 383,856 | 32,828,718 | 26 | 328,624 | 33,703,981 | 43 |
| Vestforsyning Spildvand AS | 142,325 | 6,413,873 | −40 | 151,361 | 7,235,948 | −21 |
| Aalborg Forsyning AS | 195,983 | 25,130,328 | 65 | 344,626 | 27,166,631 | 26 |
| Aarhus Vand AS | 438,859 | 35,683,457 | 23 | 460,428 | 37,206,925 | 28 |
Table 9.
Calculated average values of I/I-water for some big Danish wastewater districts for 2010 and 2016.
Table 9.
Calculated average values of I/I-water for some big Danish wastewater districts for 2010 and 2016.
| Year | 2010 | 2016 |
|---|---|---|
| Discharge, m3/year | 139,450,478 | 144,680,745 |
| pe | 1,563,264 | 1,739,718 |
| I/I-water, m3/year | 40,964,846 | 43,777,101 |
| I/-water, % | 29 | 30 |
Table 10.
Calculation of I/I-water for some big Swedish wastewater plants for 2009 and 2015 based on values of discharge and specific values of produced wastewater.
Table 10.
Calculation of I/I-water for some big Swedish wastewater plants for 2009 and 2015 based on values of discharge and specific values of produced wastewater.
| Wastewater District | I/I, %, 2009, based on 160 L/pe Day, 1.92 g TOT-P/pe Day | Discharge, 2015, L/pe Day | Produced Wastewater, 2015, L/pe Day | I/I-water, L/pe Day 2015 | I/I-Water, %, 2015 |
|---|---|---|---|---|---|
| Henriksdal, Stockholm | 52 | 348 | 230 | 118 | 34 |
| Ryaverket, Göteborgsregionen | 68 | 500 | 178 | 322 | 64 |
| Käppala, NO Stockholm | 65 | 341 | 188 | 153 | 45 |
| Sjölundverket, Malmö | 59 | 355 | 226 | 129 | 36 |
| Bromma, Stockholm | 77 | 423 | 237 | 186 | 44 |
| Nykvarnsverket, Lindköping | 27 | 65 | 234 | −169 | −260 |
| Slottshagen, Norrköping | 49 | 320 | 169 | 151 | 47 |
| Kungsängsverket, Uppsala | 47 | 286 | 213 | 73 | 26 |
| Kungsängens ARV, Västerås | 58 | 377 | 211 | 166 | 44 |
| Duvbackens ARV, Gävle | 73 | 387 | 0 | 387 | 100 |
| Ekeby ARV, Eskilstuna | 73 | 548 | 220 | 328 | 60 |
Table 11.
Calculated values of I/I-water for some big Swedish plants for 2010 and 2015.
| Year | 2010 | 2015 |
|---|---|---|
| pe | 247,481 | 373,111 |
| I/I-water, % | 58 | 46 |
Table 12.
Results from a linear regression analysis between rainfall and discharge for Asker, Bærum, Drammen, Randers, and Esbjerg vest.
Table 12.
Results from a linear regression analysis between rainfall and discharge for Asker, Bærum, Drammen, Randers, and Esbjerg vest.
| Location | Nr of Observations | R2 | p-Value |
|---|---|---|---|
| Asker | 8 | 0.534 | 0.039 |
| Bærum | 8 | 0.389 | 0.098 |
| Drammen, Solumstrand | 8 | 0.302 | 0.158 |
| Randers | 8 | 0.316 | 0.147 |
| Esbjerg vest | 8 | 0.616 | 0.021 |
Table 13.
Summary of results of studies on the Nordic countries of I/I-water in the wastewater systems for the years 2015/2016.
Table 13.
Summary of results of studies on the Nordic countries of I/I-water in the wastewater systems for the years 2015/2016.
| County | Average Values of I/I-Water in 2015/2016 | |||
|---|---|---|---|---|
| I/I-Water, % | % with Combined System | Gaged Rainfall in 2016, mm | Comment | |
| Investigated plants in Norway | 66 | 26 (2017) | DM | |
| Asker | 63 | 0 (2017) | 963 | WBM |
| Bærum | 64 | 35 (2017) | 940 | WBM |
| Drammen (Solumstrand) | 67 | 56 (2017) | 778 | WBM |
| Drammen (Solumstrand) | 76 | 56 (2017) | 778 | DM |
| Denmark | 30 | Ca 50 (2012) | WBM | |
| Denmark | 40–80 | Ca 30 (2017) | Calculations done by DANVA | |
| Esbjerg vest | 30 | 755 | DM | |
| Randers | 48 | 764 | DM | |
| Finland | 41 | 5 (2017) | Calculations done by FIWA | |
| Sweden | 46 | 15–20 (2012) | WBM | |
| Sweden | 49 | 15–20 (2012) | Calculations done by Svenskt Vatten | |
| Henriksdal, Stockholm | 34 | 656 | WBM | |
| Ryaverket, Göteborgs-regionen | 64 | 1065 | WBM | |
| Sjölundverket, Malmö | 36 | 789 | WBM | |
© 2018 by the authors. Licensee MDPI, Basel, Switzerland. This article is an open access article distributed under the terms and conditions of the Creative Commons Attribution (CC BY) license (http://creativecommons.org/licenses/by/4.0/).
Share and Cite
MDPI and ACS Style
Jenssen Sola, K.; Bjerkholt, J.T.; Lindholm, O.G.; Ratnaweera, H. Infiltration and Inflow (I/I) to Wastewater Systems in Norway, Sweden, Denmark, and Finland. Water 2018, 10, 1696. https://doi.org/10.3390/w10111696
AMA Style
Jenssen Sola K, Bjerkholt JT, Lindholm OG, Ratnaweera H. Infiltration and Inflow (I/I) to Wastewater Systems in Norway, Sweden, Denmark, and Finland. Water. 2018; 10(11):1696. https://doi.org/10.3390/w10111696
Chicago/Turabian StyleJenssen Sola, Kristin, Jarle Tommy Bjerkholt, Oddvar Georg Lindholm, and Harsha Ratnaweera. 2018. "Infiltration and Inflow (I/I) to Wastewater Systems in Norway, Sweden, Denmark, and Finland" Water 10, no. 11: 1696. https://doi.org/10.3390/w10111696
Note that from the first issue of 2016, this journal uses article numbers instead of page numbers. See further details here.