Recent Changes in the Occurrences and Damages of Floods and Droughts in the United States


1
School of Civil and Transportation Engineering, Guangdong University of Technology, Waihuan Xi Road, Guangzhou 510006, China
2
Environmental Change Institute, University of Oxford, Oxford OX13QY, UK
3
School of Geography and the Environment, University of Oxford, Oxford OX13QY, UK
*
Author to whom correspondence should be addressed.
Water 2018, 10(9), 1109; https://doi.org/10.3390/w10091109
Submission received: 18 July 2018
/
Revised: 17 August 2018
/
Accepted: 18 August 2018
/
Published: 21 August 2018
(This article belongs to the Section Hydrology)
Abstract
:In this study, we compile and analyse 136,920 records of flood and 50,967 records of drought from a survey-based database to investigate recent changes in annual occurrence and economical cost in the United States. Results show that an average of 6520 floods has occurred per year during 1996–2016, with annual mean economic losses up to 3986 million US dollars, while 2427 drought events/year are recorded causing an average loss of 1684 million US dollars per year. Importantly, we found there is no evident changing tendency in annual economic damages of floods and droughts, despite an upward trend in their annual occurrences. This could be partly explained by changes in regional vulnerabilities, as indirectly reflected by the ratio of damaging events to total number of events experienced and the average damage per event. Spatially, vulnerability to droughts has decreased in most of the country, while increased vulnerability to floods is observed in a number of states. Despite limitations from the records and incomplete characterization of vulnerability, this study has great implications for targeted mitigation and adaptation, through identifying the regions that are most vulnerable to floods and droughts respectively and highlighting the contrasting patterns in regional vulnerability to floods and droughts.
1. Introduction
Hydrological extremes, such as floods and droughts, have destructive impacts on economic development and human health [1,2,3,4]. Floods and droughts have been listed as two of the most devastating natural hazards in terms of economic losses exceeding $1 billion [5,6]. Within the context of global warming, hydrological extremes are expected to increase in the frequency, duration and intensity at global and regional scales [7,8,9,10,11], thus posing larger risks to economic and human systems [1,12,13]. Understanding recent changes in regional vulnerability to floods and droughts is critical for developing foundational knowledge and strategies for reducing the risks and damages in the future [2,7,14].
The United States is one of the most affected countries by floods and droughts [15,16,17]. Many studies have investigated the changing characteristics and the impacts of floods in terms of economic losses [18,19,20,21] and human casualties [22,23]. The changing patterns and impacts of droughts have also received lots of attention during the past decades [9,12,16,24,25,26]. While previous studies have provided valuable insights on the changes in these hydrological extremes, the drivers behind the risk and cost of US floods and droughts remain unclear. Variation in the risk of floods and droughts is not only dependent on the hazard itself but also on the assets exposed in the hazard-prone areas, as well as the vulnerability to hazard [3,27,28,29,30]. To date, understandings on hazards have been greatly improved in terms of the changing patterns of hydrological hazards. However, our understandings on the economic costs and regional vulnerability to floods and droughts and their spatial-temporal changing patterns are limited, due to lack of proper indicators, limitations of data availability and complex response mechanisms [3,29,31,32].
Vulnerability is dynamic and variable across temporal and spatial scales and, is a function of several factors such as geographic conditions, disaster warning and preparedness systems, defensive capacities and governance [33,34,35]. To characterize regional vulnerability is challenging, especially given the limitations of data availability. Several studies have attempted to characterize regional vulnerability through normalizing the loss trends with gross domestic product (GDP) and population growth [28,29,36,37]. Recently, Peduzzi et al. [38] assumed that the share of people killed to the total number of people exposed to tropical cyclone would be higher in vulnerable regions than in less vulnerable areas. Similar definition of vulnerability was adopted by for example, Wu et al. [39], Yasari et al. [30], and Philip et al. [32], based on reported losses as a share of exposed GDP/assets or reported fatalities as a share of exposed population.
In this study, we investigate recent changes in occurrences and economic damages by floods and droughts in the United States. The mechanisms underlying economic costs by droughts and floods are explored and dwheiscussed with a focus on the role of regional vulnerability. This study is novel in that it is completely based on survey records, thus complementing to previous studies relying on hydrological models for reproducing the hazards and estimating economic damages assuming constant vulnerability. Especially, we compare the changing patterns in economic losses and regional vulnerabilities to floods and droughts at the national and state levels to help with targeted adaptation and mitigation strategies.
2. Materials and Methods
Records of floods and droughts are obtained from the Storm Events Database (SED) (https://www.ncdc.noaa.gov/stormevents/), maintained by the National Oceanic and Atmospheric Administration’s National Weather Service (NWS). It is one of the most comprehensive and primary sources of long-term records on hydrological hazards in the United States with detailed records on the induced economic cost and casualty [40,41,42] and have been used in many studies [41,43,44,45,46,47]. The records of hydrological hazards may be provided by or gathered from sources outside the NWS, such as the media, law enforcement and/or other government agencies, emergency managers, private companies and individuals. A recent study by Gall et al. [48] pointed out that the temporal bias and geographic bias of the dataset have been largely eliminated after the year 1995, due to improvements on reporting guidelines and loss estimation methods and procedures. Thus, the homogeneity issue of recording has been addressed to certain extent for the period after the year 1995, which is selected for use in this study. More details can be found in Gall, Borden and Cutter [48], which provides a comprehensive investigation on the data quality and bias of the datasets, including hazard bias, temporal bias, threshold bias, accounting bias, geography bias and systemic bias.
According to the description of the database [40], the hazards are recorded in the database when the hazards have sufficient intensity to cause loss of life, injuries, significant property damage, disruption to commerce, or generate media attention. Given the definition of hazards and the criteria for including them in the database, it would be inappropriate to compare the records against purely climate-based metrics. The event-based records of floods and droughts are available for the period 1996–2016. There is a total of 136,920 and 50,967 records for flood and drought, respectively. Each record is associated with an event, documenting the timing (beginning and ending time), location (e.g., state, county, latitude and longitude), direct and indirect fatality and injury (the number of people affected) and economic damages (property and/or crop losses) in US dollars. We extract the information for each flood and drought event and aggregate them into country and state level for analysis.
Besides commonly used yearly aggregated metrics, several indicators are defined in this study to make full use of the event-based records. Specifically, two groups of metrics are defined (Table 1): (1) Annual total occurrences (i.e., the number of records in the database) and the ratio of events with tangible impacts (i.e., with recorded damages greater than zero) to total number of events experienced in a specific region. This indicator can be used to reflect regional vulnerability to hydrological hazards, which is similar to that adopted in for example, Peduzzi et al. [38], Wu et al. [39] and Lamond et al. [3]. However, we acknowledge that the assets exposed to the hazards are not explicitly considered due to data limitations. (2) Total impacts and average impacts per event. Investigating the changing patterns in these indicators helps better understand the hydrological risks and regional vulnerabilities. For instance, increases in the ratio of damaging events to total events and average damage per event suggest that regional vulnerability to hydrological extremes may have increased. We aim to identify the regions that are most vulnerable to floods and droughts at the state level and examine whether regional vulnerability to floods and droughts has changed in recent decades. Monetary losses are adjusted to 2016 dollars based on the CPI (Consumer Price Index) provided by the U.S. Department of Labor Bureau of Labor Statistic (https://www.bls.gov/) in order to adjust for inflation. Linear regression is conducted to estimate the changing trends during the study period, with statistical significance tested using the two-tailed Student’s t-test. Only those states that have experienced statistically significant changes (p < 0.1) are included for analysis.
3. Results
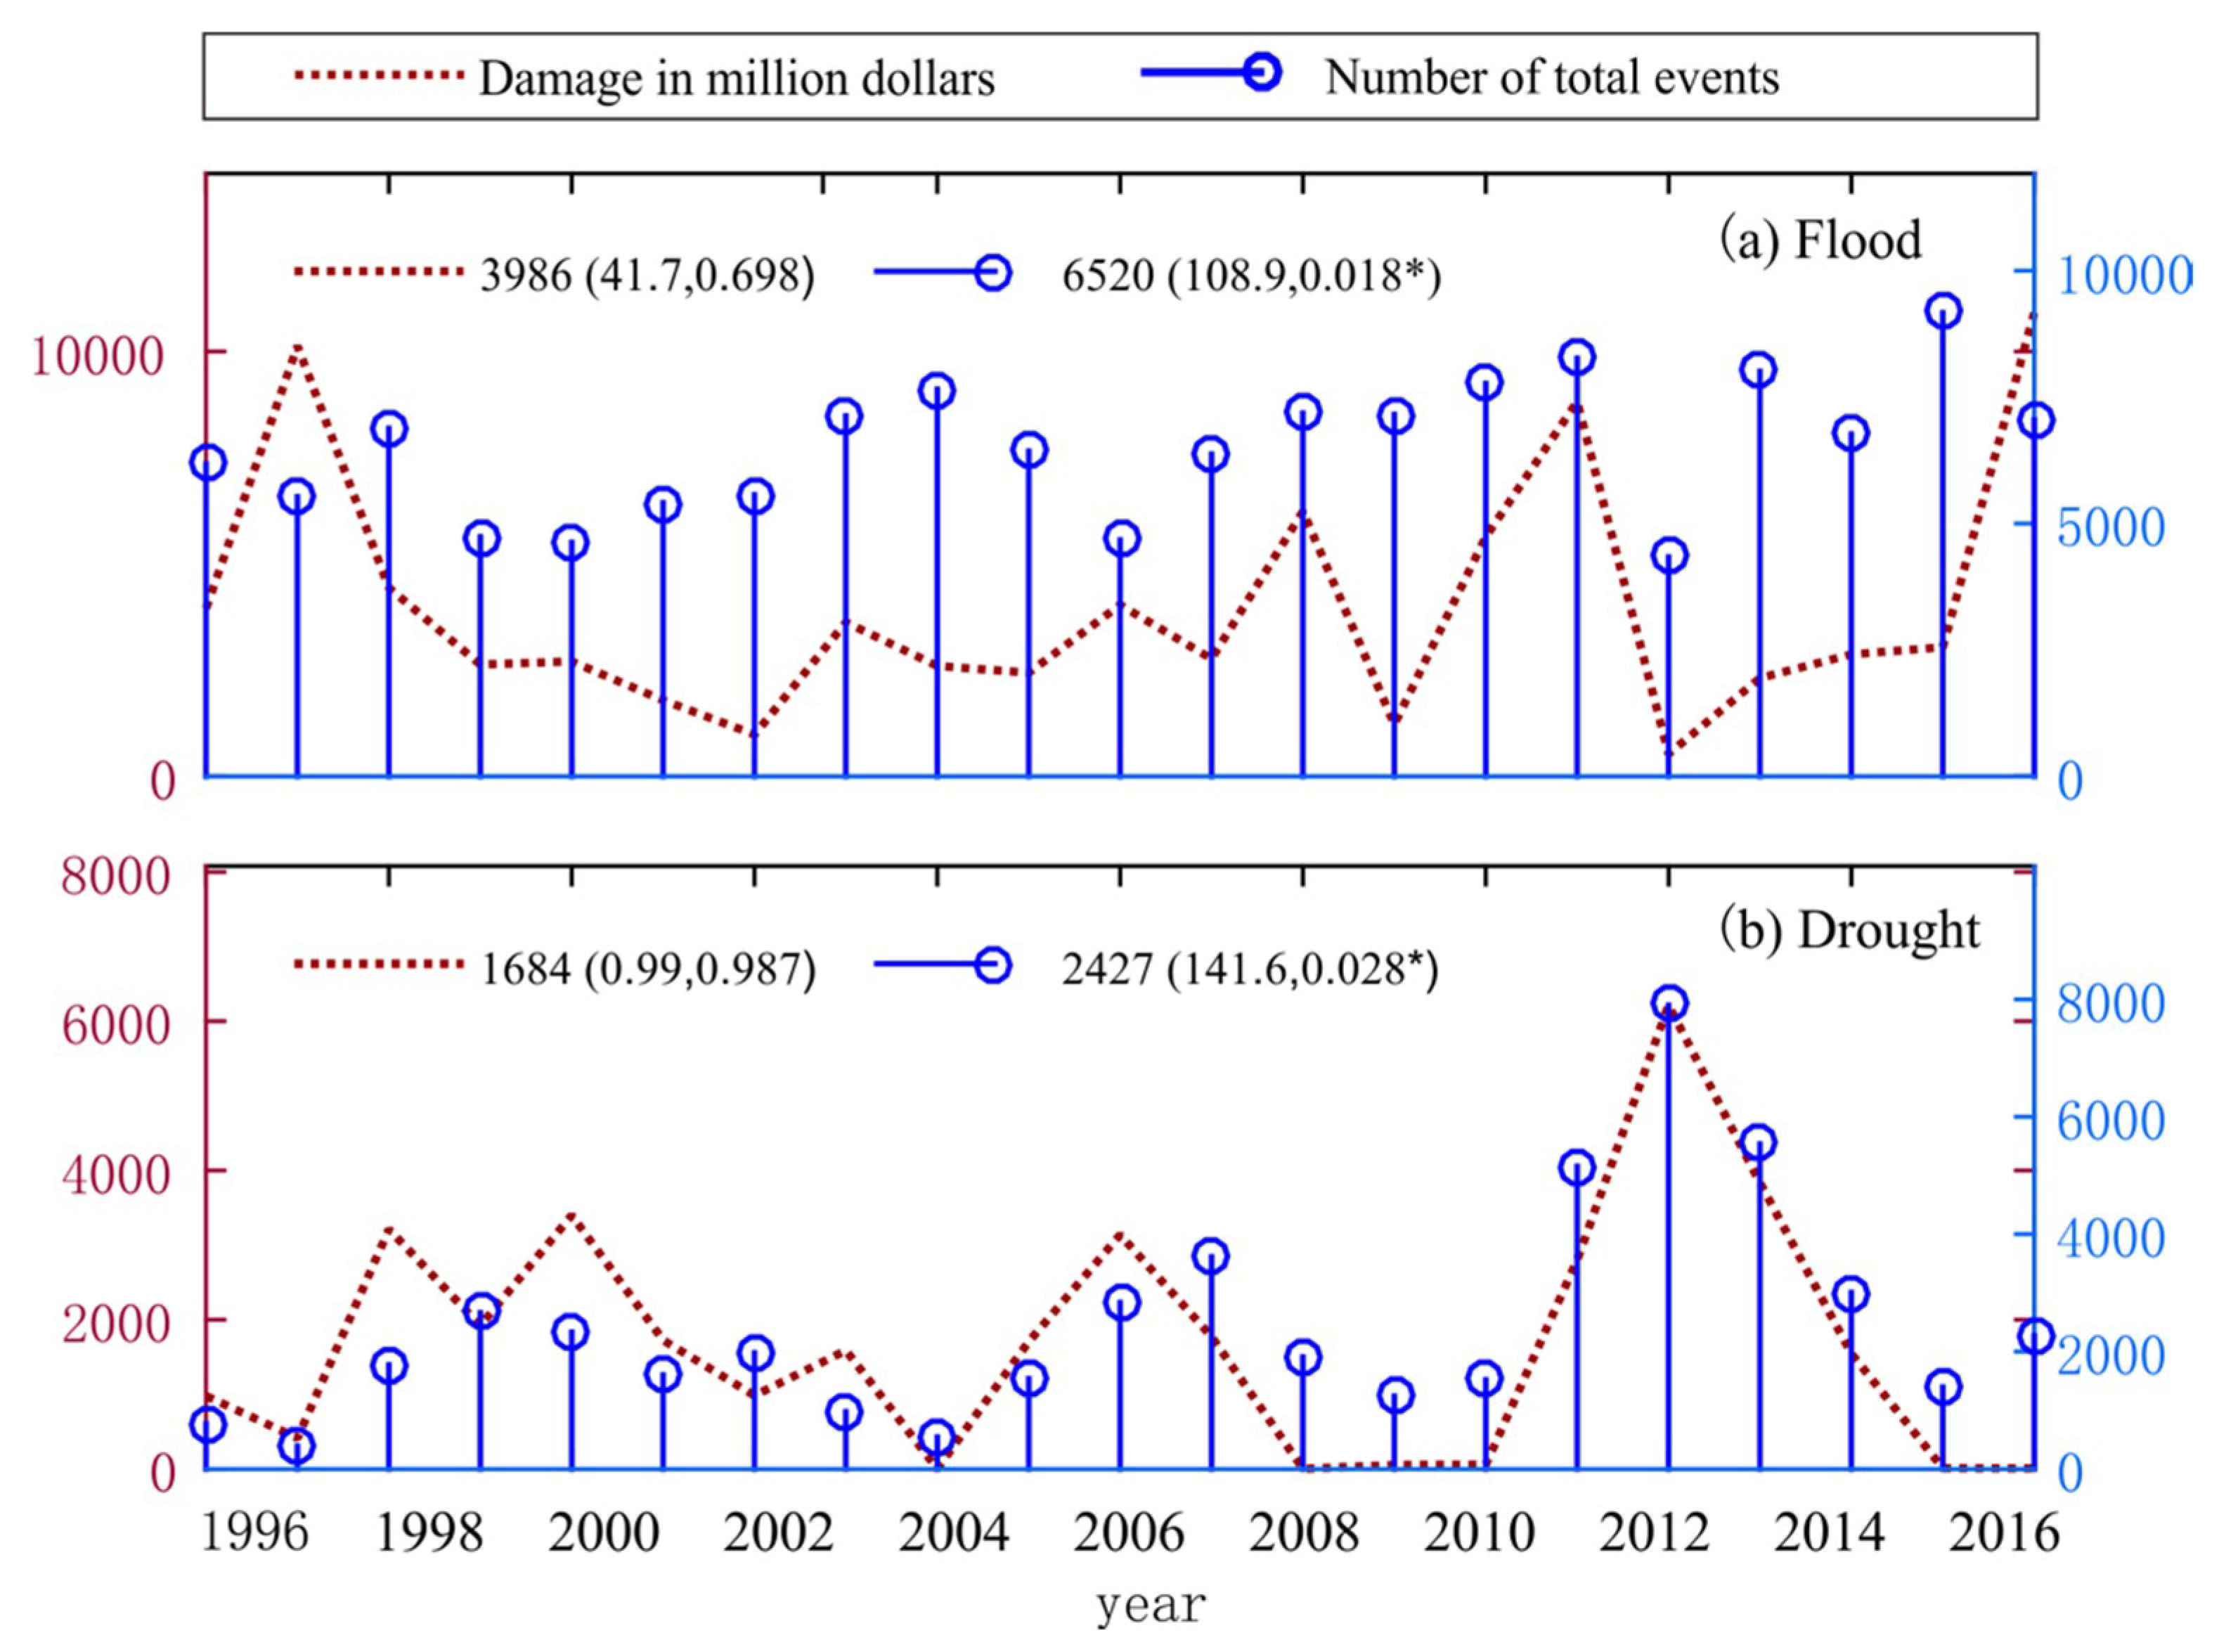
Figure 1 shows the temporal changes in annual occurrences and total economic damages of floods and droughts in the United States during 1996–2016. For the past two decades, an average of 6520 floods has occurred annually in the country, with economic costs up to 3986 million US dollars per year. Compared to floods, droughts are less frequent with 2427 events/year recorded, resulting in an average cost of 1684 million US dollars per year. Spatially, floods have caused larger economic damages and casualties across the United States compared to those by droughts, except for Texas, Georgia, Oklahoma, Delaware, Nebraska and Iowa. Among others, Texas, California, Iowa and Pennsylvania are particularly vulnerable to both types of hydrological hazards, implying more efforts are required to reduce the negative impacts in these regions.
The annual occurrences of floods peaked in the year 2015, while the year 2016 was the most devastating year in terms of economic damages (Figure 1). As for droughts, the largest number of occurrences and damages occurred both in the year 2012, consistent with previously reported extreme dry conditions [12,16]. It is possible that many of the 8000 drought records for 2012 would be part of one drought but such information is not available in the database. Importantly, no evident changing tendency is observed for annual economic damages by floods and droughts for the country as a whole, despite an upward trend in their total occurrences, which are statistically significant at the 90% confidence level. The mechanism behind this phenomenon is an open question as many factors could influence economic impacts of natural hazards. For example, it could be due to a decline in regional vulnerability to hazards, or a reduction in hazard intensity. Another possible explanation could be a shift in the spatial distributions of floods and droughts, with increasing hazards occurring in areas with fewer assets exposed to hazards. Nevertheless, one great obstacle for quantitative assessment has been lack of accurate field-level data on both hazard intensity and the assets exposed to hazard.
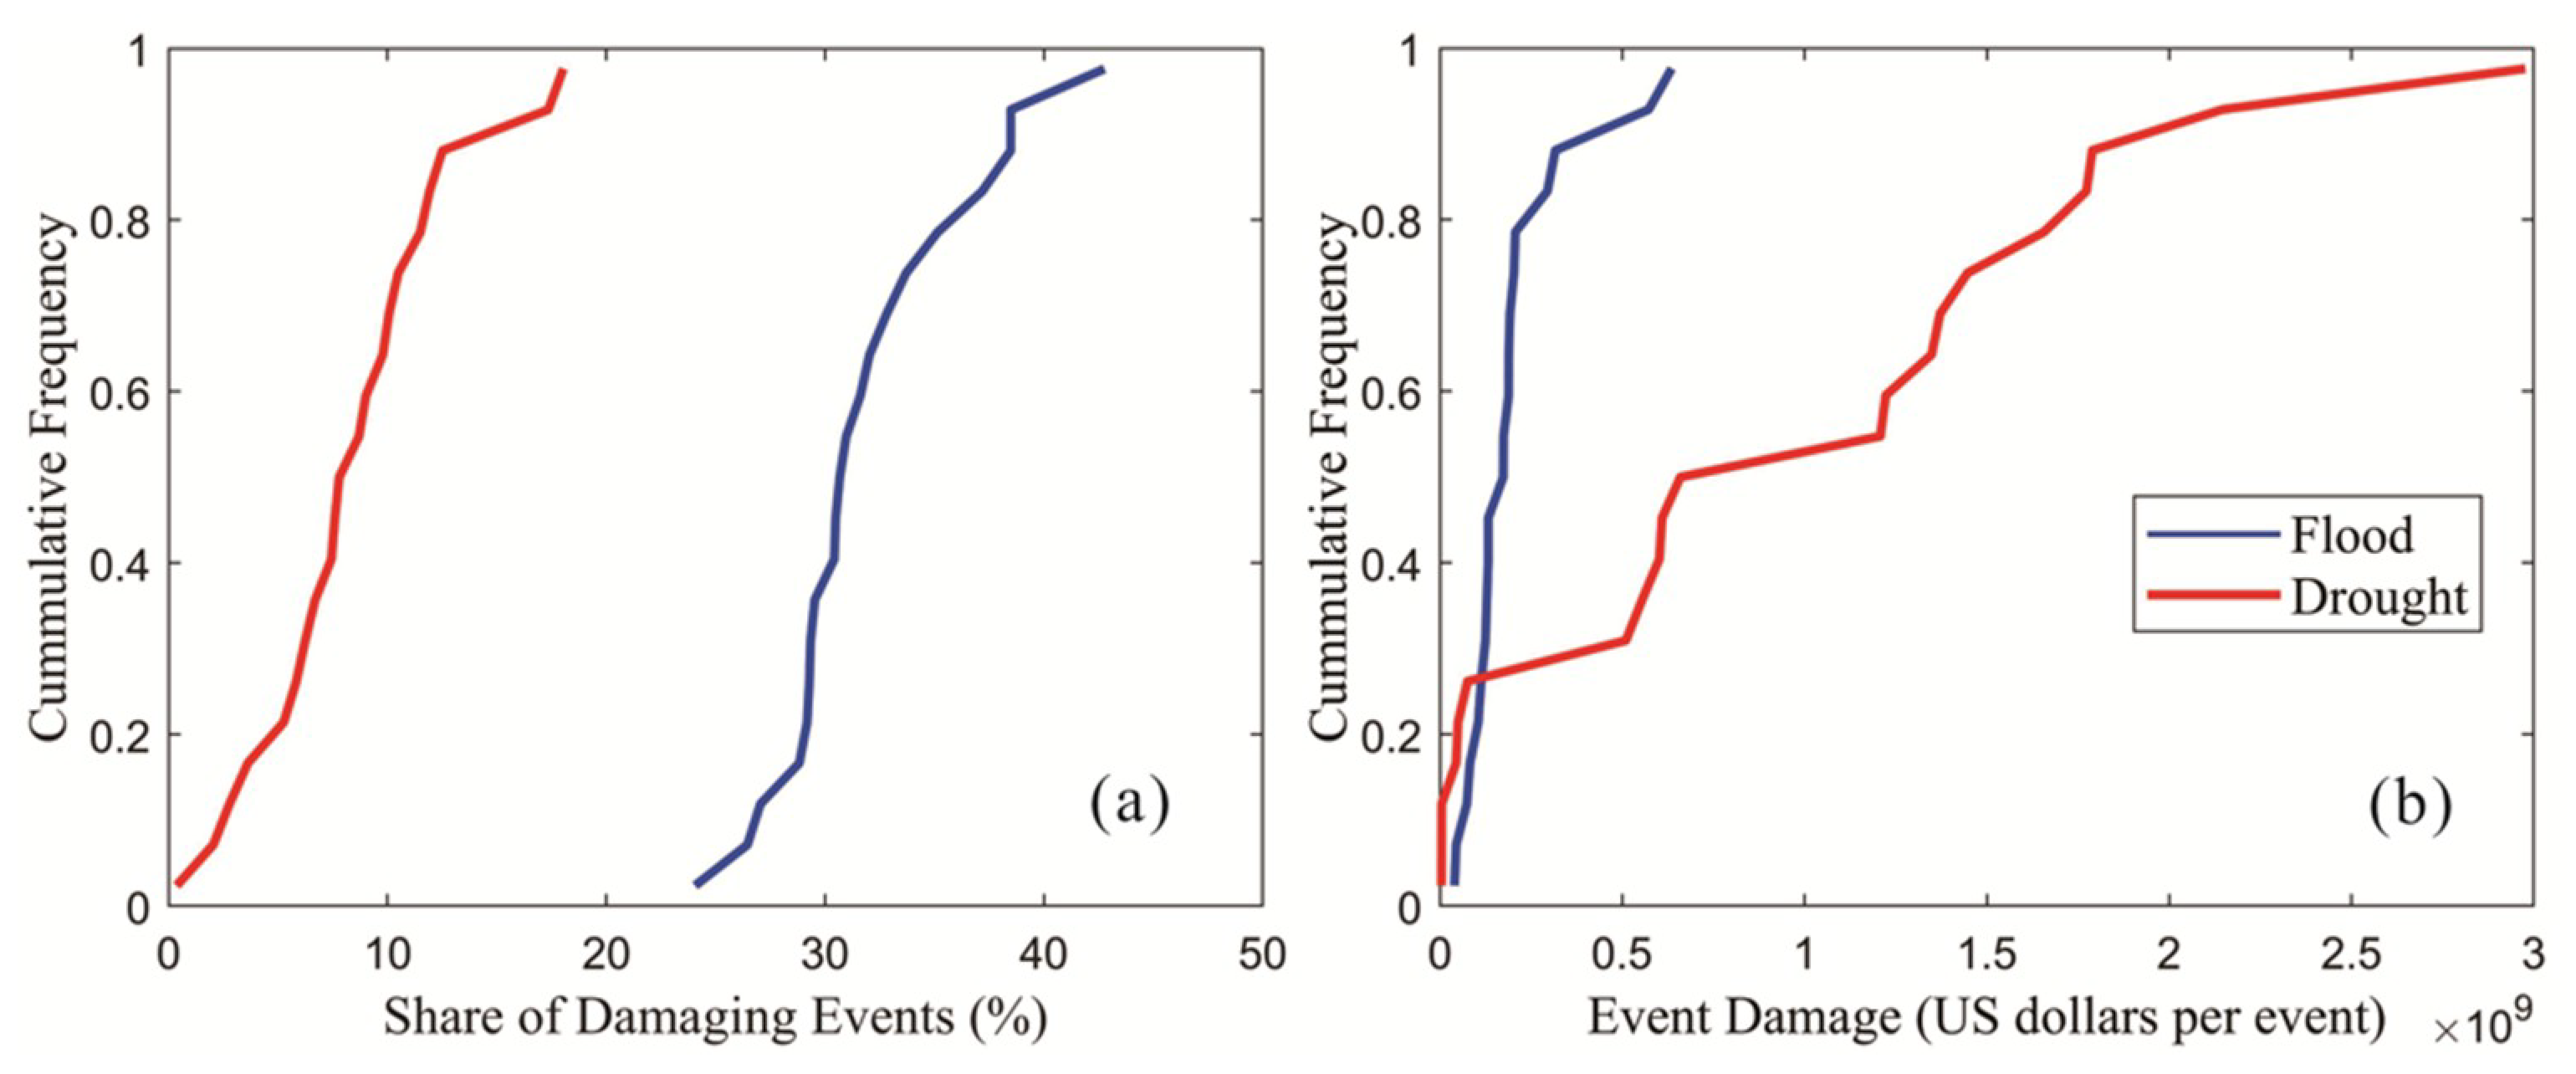
Here, we calculate the share of damaging events (SDE) to total events and average damage per event (DPE), as proxy for regional vulnerability. The SDE distribution for floods ranges from 25% to 43%, while the distribution of damaging droughts falls within the range of 1–18% (Figure 2a). This suggests that the likelihood of floods that causes economic cost is much larger than that of droughts. In contrast, the DPE distribution is much higher for droughts than floods. That is, the average economic costs caused by droughts are several times bigger than floods, demonstrating the catastrophic feature of droughts. In extreme case, the event damage of drought is up to 3 billion US dollars, which is almost 5 times the maximum DPE of floods (Figure 2b). The high event damage by droughts could be attributed to its larger spatial extent and longer durations compared to floods [12,49]. The differential characteristics between droughts and floods in causing economic costs call for the need of targeted adaptation and mitigation strategies.
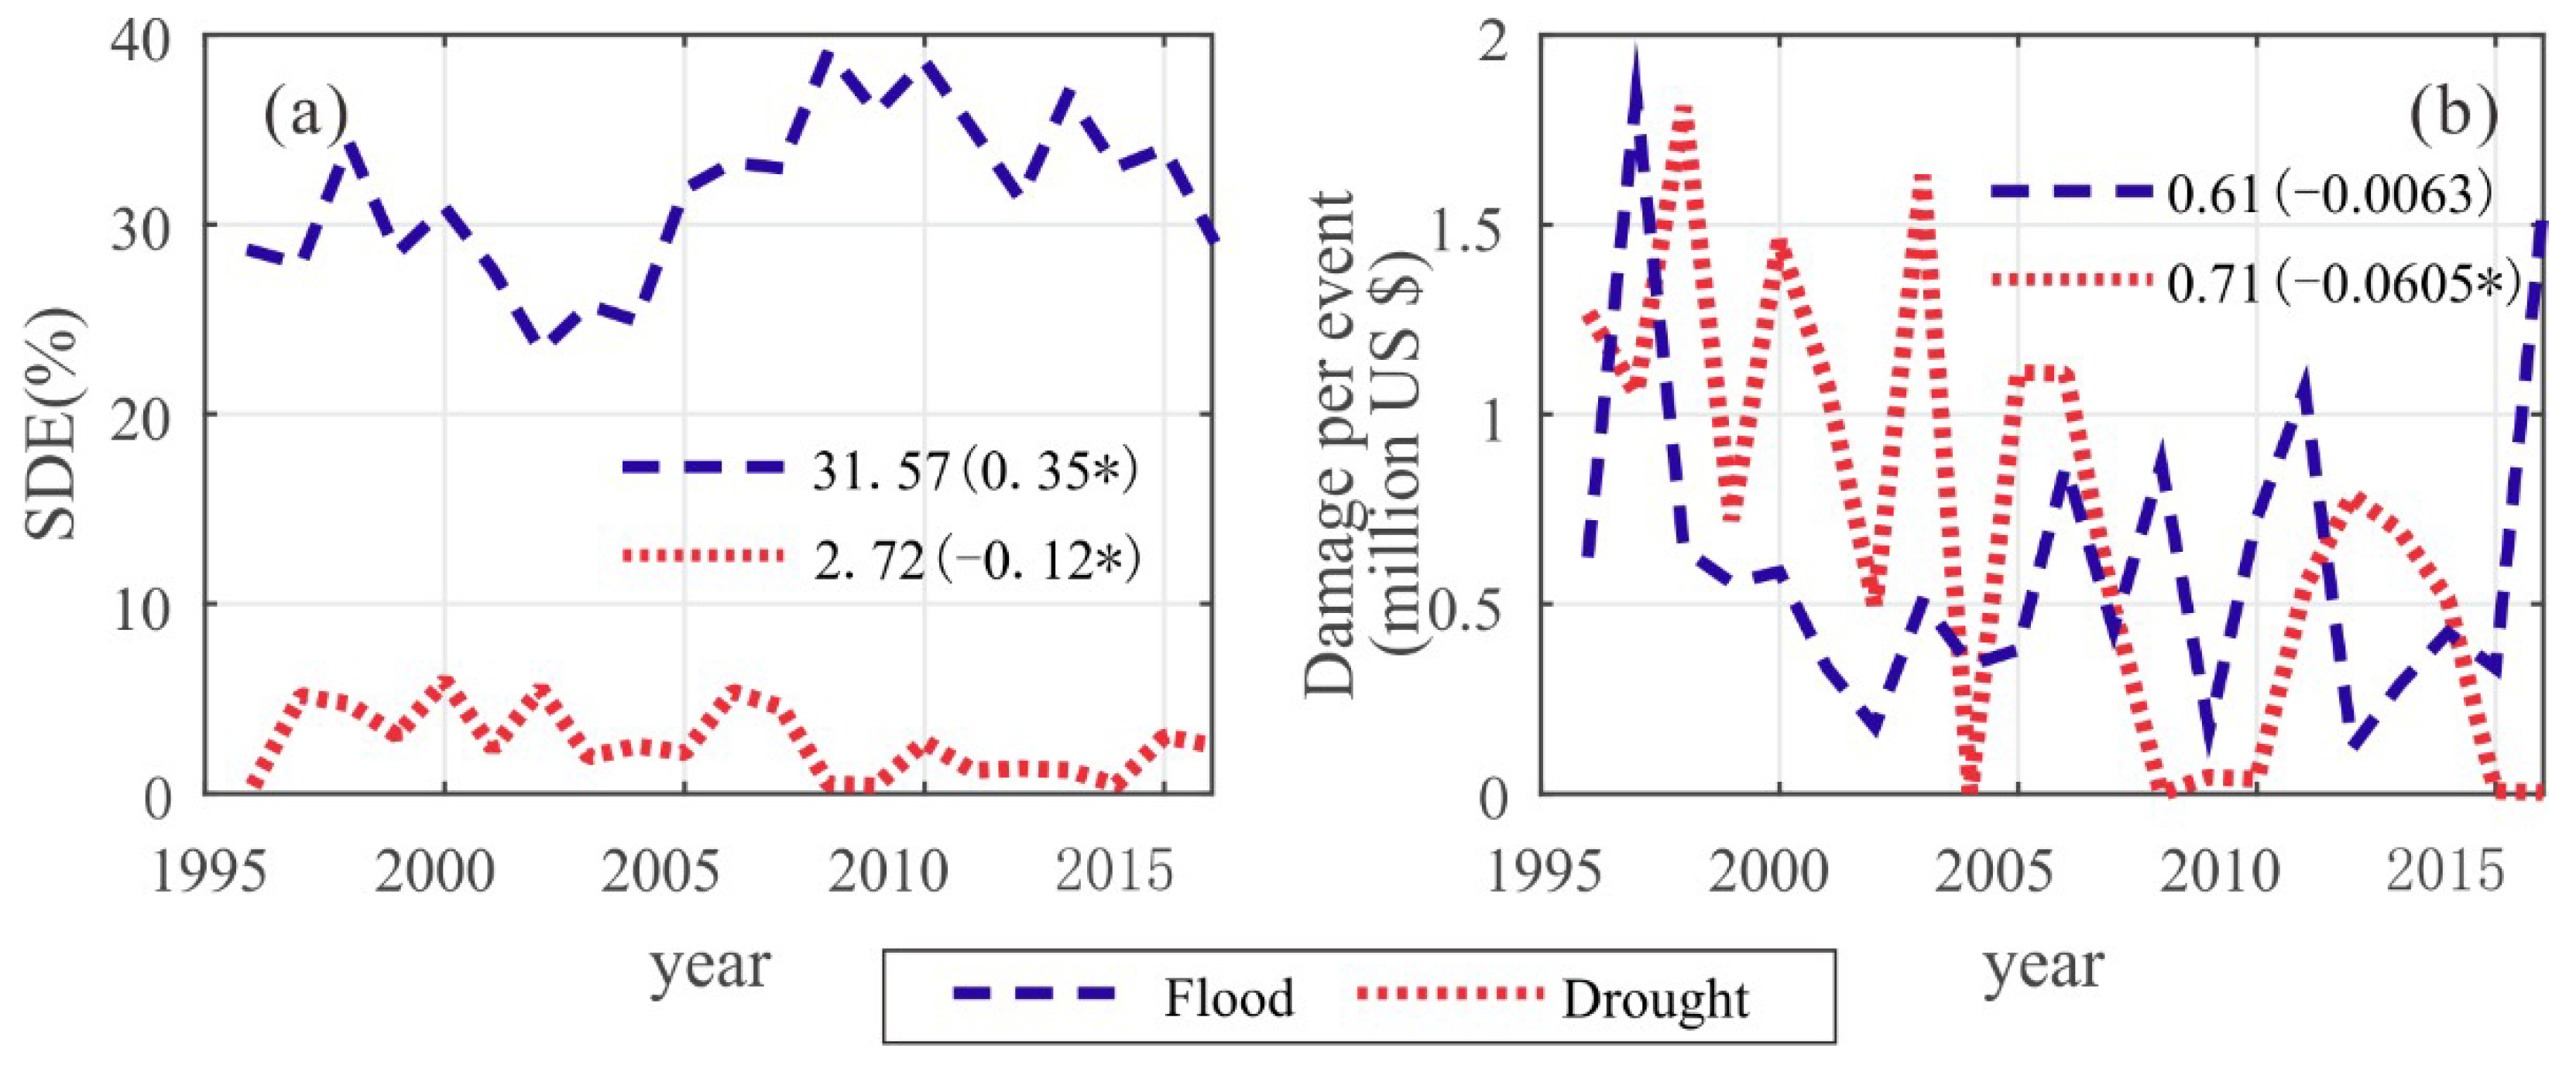
Temporally, both SDE and DPE have decreased significantly for droughts (Figure 3). Given the rise of exposed assets with growing economy and increasing intensity of droughts [26,50], it is reasonable to assume that decreases in annual damages by droughts may be largely due to a reduction of vulnerability. However, to what extent vulnerability reduction has contributed to the observed decrease in drought-induced economic damages is unclear, since fine-scale datasets on the drought intensity and the assets exposed are not readily available. As for floods, about one-third (i.e., 31.6%) of flood events have caused tangible damages, which is approximately 12 times larger than that of droughts. It might be due to the fact that floods often develop more quickly than droughts, thus leaving less time for adaptation and mitigation. Notably, annual SDE of floods has showed an increasing tendency in the past two decades, while no significant change is observed in the DPE. This is unlikely to be caused by the reduced hazards, as an upward trend is found in annual occurrences in the records and increasing intensity of precipitation extremes is reported in the literature [51]. Nevertheless, the complex mechanisms behind flood damages and lack of proper datasets make it uncertain to attribute the observed decrease in economic damages to changes in regional vulnerability.
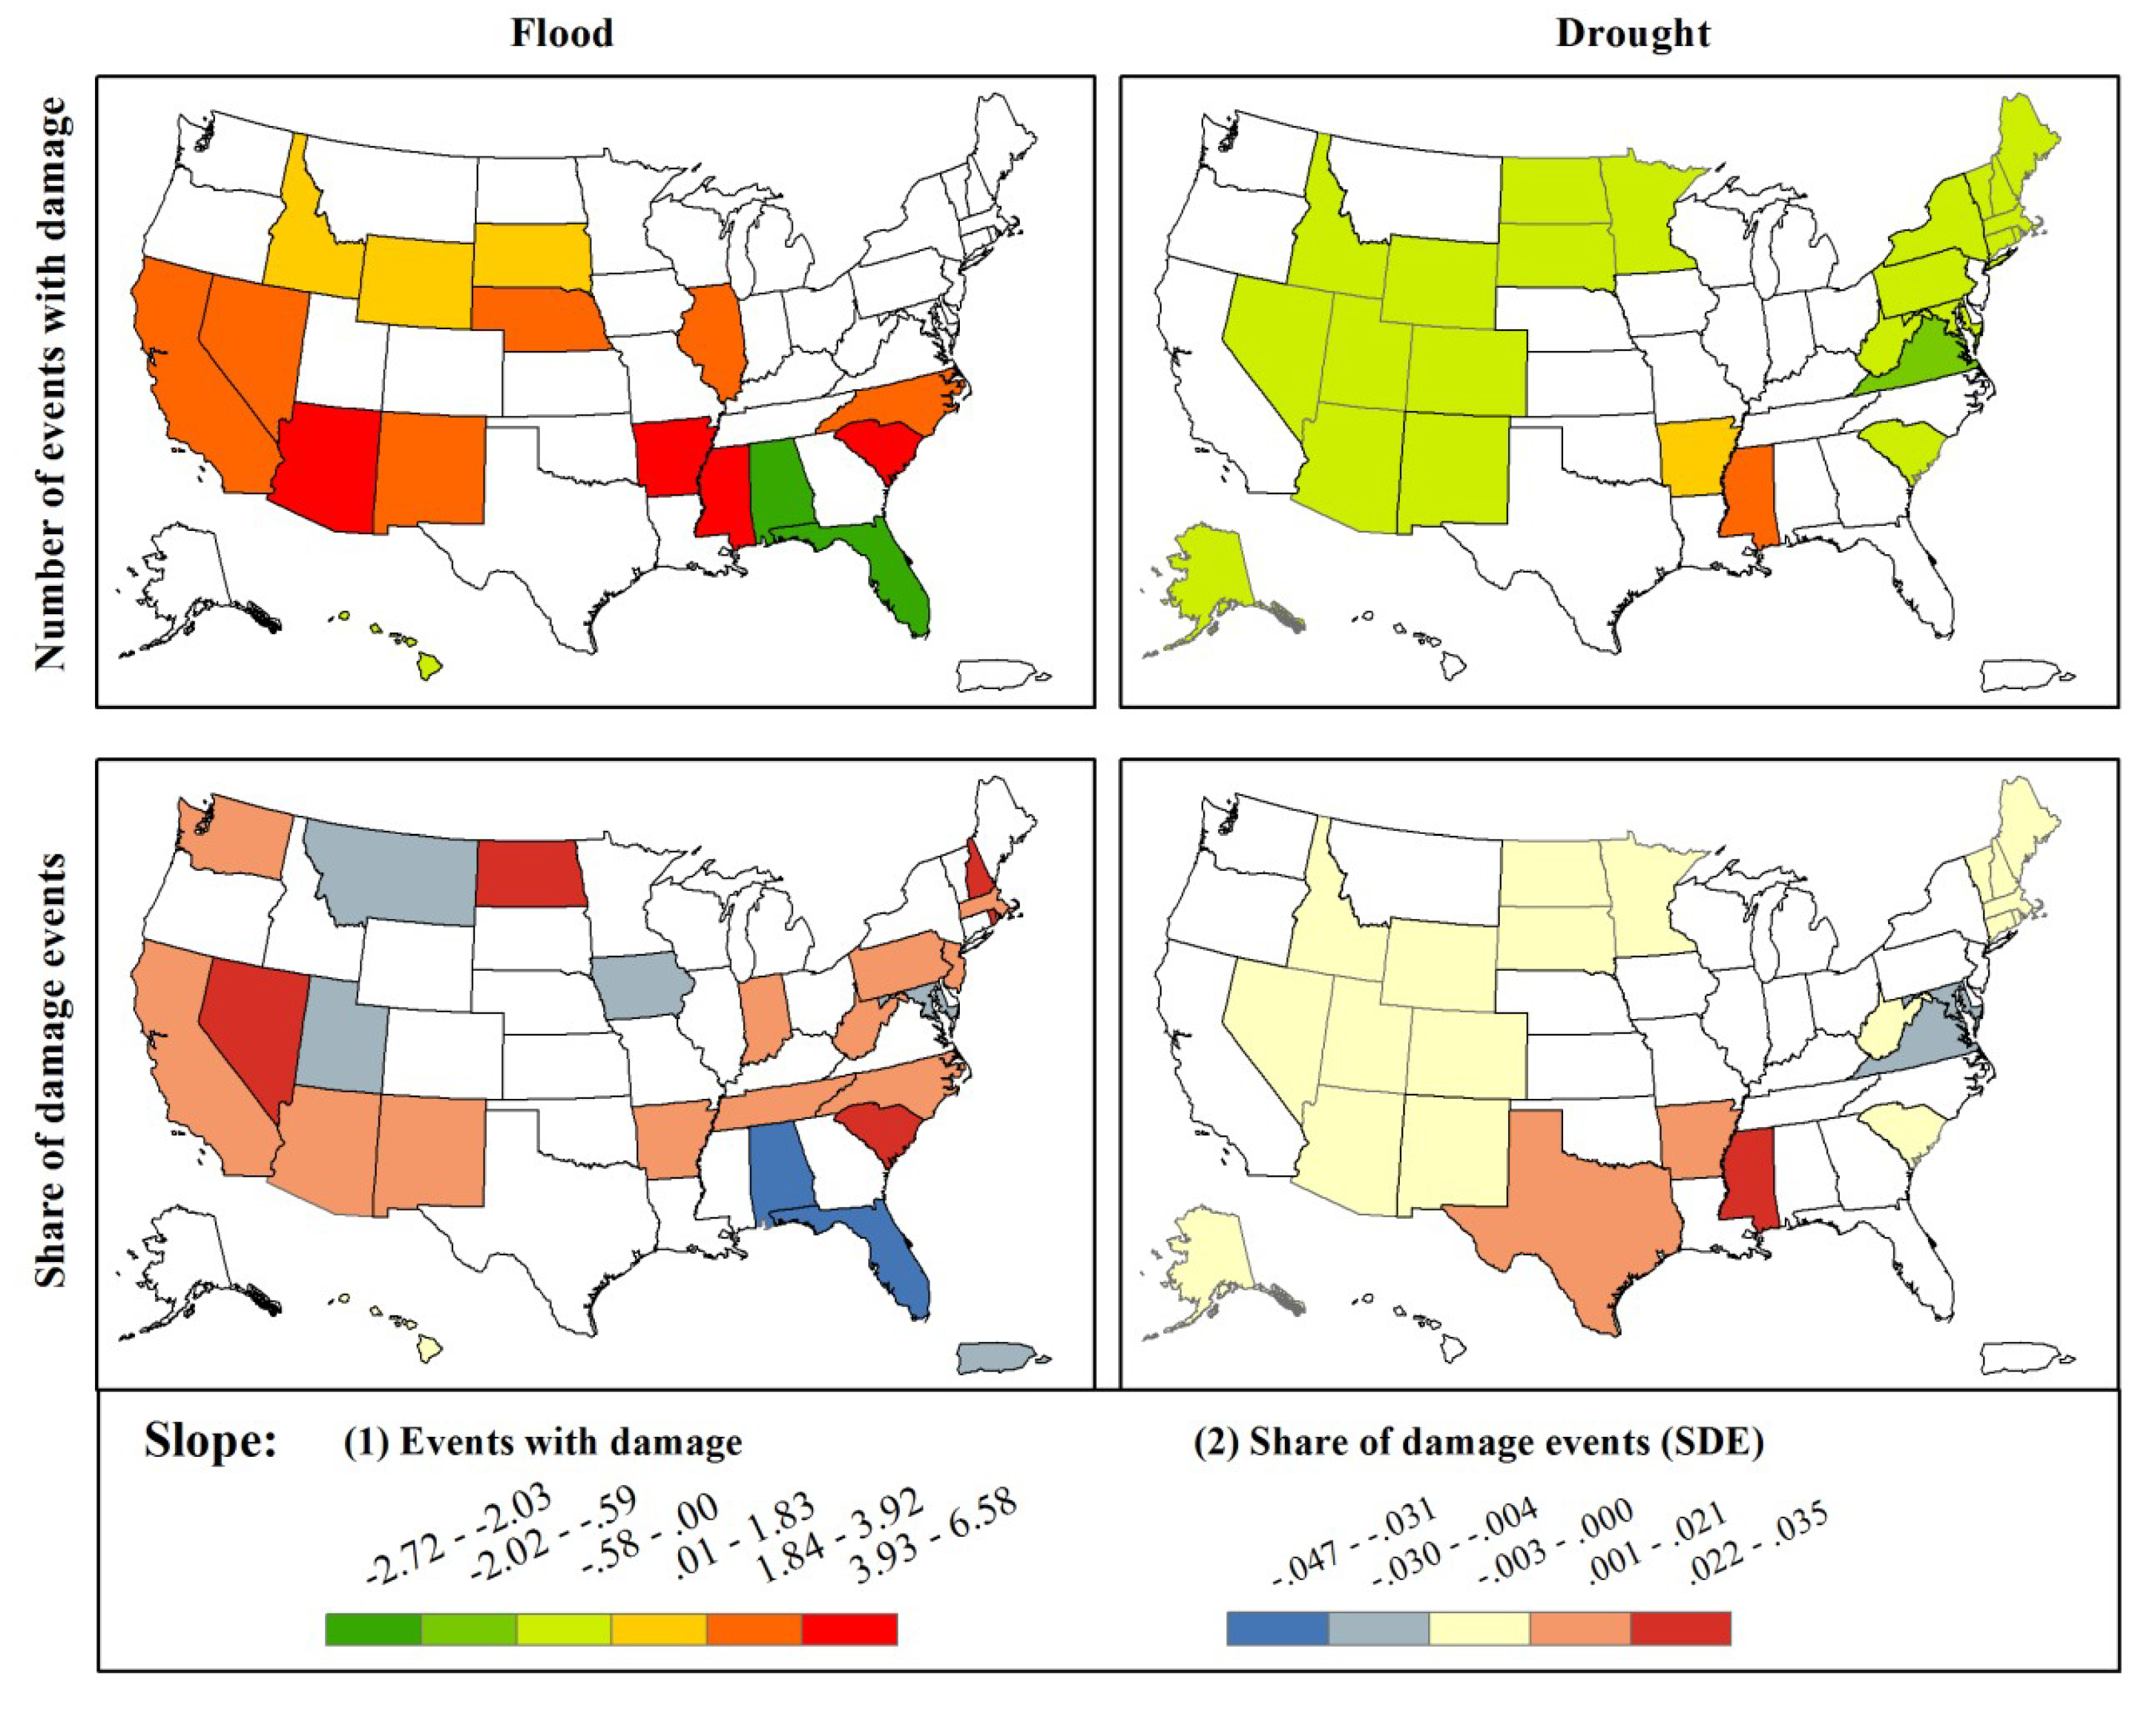
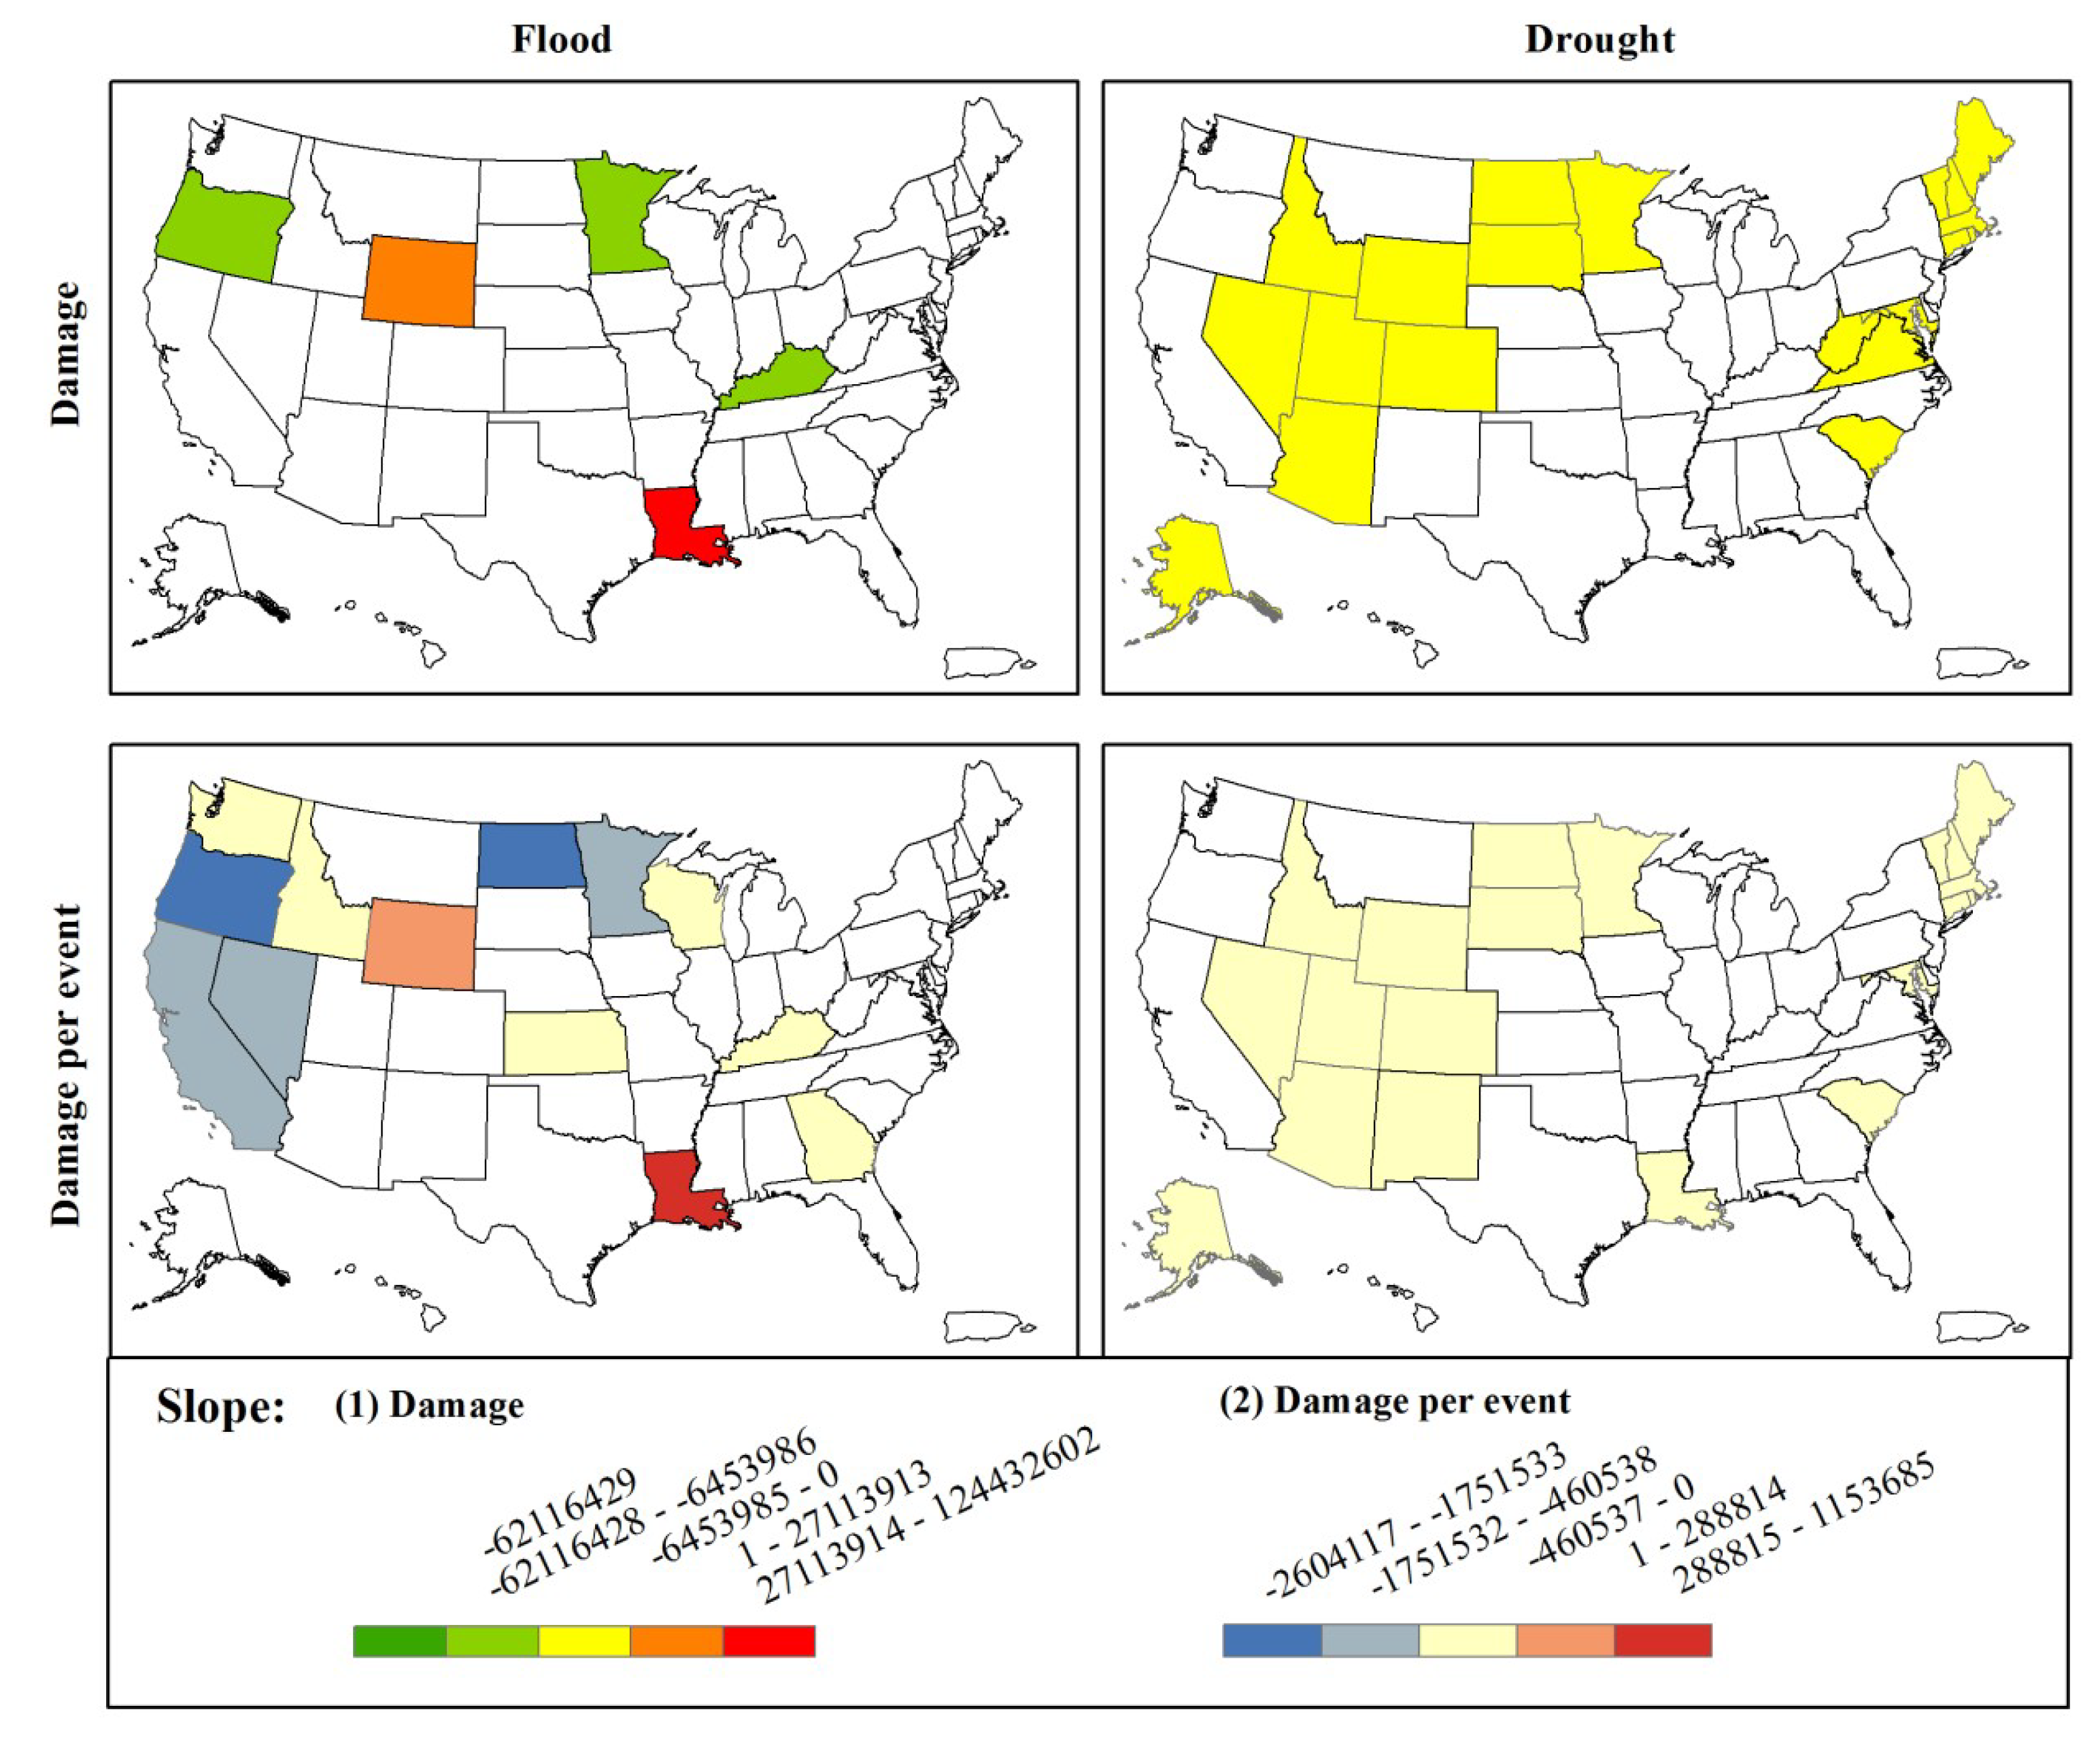
Spatially, a majority of the states have experienced increasing damaging events and an upward SDE for floods except for Georgia and Florida (Figure 4). Conversely, the average damage per event has decreased in most states (Figure 5). For example, the share of damaging events has increased in California, Nevada, North Dakota and Washington but with concurrent decrease in the event damage. This may imply a wider spread of flood hazards and/or an increased exposure of vulnerable assets in these regions but with better protection measures in the hazard prone areas that help reduce the magnitude or severity of damages. Floods may lead to enhanced prevention behaviour due to increased perceived risk [52] and such precautionary measures and reactive adaptation are effective in reducing damages in areas with frequent floods [53,54]. Among others, Wyoming and Louisiana are especially vulnerable to floods, as both annual damage and DPE have increased over the past two decades. Effective measures on flood impact mitigation are therefore required to mitigate flood impacts in the two states.
As for droughts, both NED and SDE have decreased across the country except for Mississippi, Arkansas and Texas (Figure 4). Among the 25 states with decreasing number of damaging events, 72% (i.e., 18 states) of which have also experienced downward trends in SDE, total damages and DPE (Figure 4 and Figure 5). This implies that drought risks may have been effectively mitigated in recent decades, which could be largely attributed to the reduction in regional vulnerability. One possible explanation could be due to the efficient management of water resources through rapid expansion of water storage and supply capacity and deployment of hydropower, irrigation and flood control measures in the 20th century [55].
4. Conclusions
Hydrological extremes such as floods and droughts have devastating impacts on the economic and human systems. Examination of recent changes in economic damages by hydrological extremes would greatly benefit adaptation and mitigation strategies. In this study, we compiled event-based records on recent floods and droughts events in the United States during 1996–2016 and inter-compared the spatial-temporal patterns in occurrences and damages between floods and droughts at the country and state levels. In total, 136,920 records of flood and 50,967 records of drought are used for analysis.
For the past two decades, an average of 6520 floods and 2427 droughts have occurred annually in the country. Floods have caused an annual average of 3986 million dollars of economic damages, which are approximately 1.5 times larger than that by droughts. However, the cumulative distribution functions show that the event damage (DPE) by catastrophic droughts can be costlier compared to floods. Importantly, no evident changing tendency is observed for annual economic damages by floods and droughts for the country as a whole, despite an upward trend in their annual occurrences. The possible mechanisms are explored with a focus on the changes in regional vulnerability, which has received limited attention in the literature. Overall, we have larger confidence on attributing the phenomenon to a possible decrease in vulnerability for droughts than floods. In addition, we also highlight the contrasting patterns in recent changes in regional vulnerability between floods and droughts. However, to what extent vulnerability has contributed to the observed changes in economic costs is unknown, due to lack of proper datasets characterizing hazard intensity and the exposed assets.
We acknowledge that there are several limitations in this study. First, the trend revealed by the analysis can be part of decadal variability rather than reflecting any multi-decadal trends, due to the relatively short time period of recording (i.e., 21 years). Second, although the dataset is one of the most comprehensive long-term records on hydrological hazards in the United States, limitations and bias are inherent in the records. Indeed, existing hazard databases are fraught with inconsistencies and suffer biases [48,56]. The uncertainties associated with data collection and compilation [40,42] can propagate and affect the reliability of the results obtained in this study. Thus, we call for standardization of data collection, documentation, accessibility and dissemination in the future to improve the data quality. In addition, more work is required in the future to better explore the mechanism behind the distinct spatial distribution patterns of damages caused by drought and flood. Nevertheless, despite the limitations and uncertainties, this study has great implications for targeted adaptation and mitigation across the United States, through identifying the regions where floods and droughts have increased significantly in occurrences and economic losses using survey-based records.
Author Contributions
Conceptualization, Q.Z. and G.L.; Methodology, Q.Z., G.L. and J.P.; Investigation, Q.Z., G.L. and J.P.; Data Curation, Q.Z. and G.L.
Funding
This research was funded by the National Natural Science Foundation of China (Grant No. 51809049), the Science and Technology Program of Guangzhou, China (Grant No. 201804010406), the Public Welfare Research and Ability Construction Project of Guangdong Province, China (Grant No. 2017A020219003), the Water Conservancy Science and Technology Innovation Project of Guangdong province, China (Grant No. 201710).
Acknowledgments
The authors thank the National Oceanic and Atmospheric Administration’s National Weather Service (NWS) for making the records of floods and droughts publically available.
Conflicts of Interest
The authors declare no conflict of interest.
References
- Hirabayashi, Y.; Mahendran, R.; Koirala, S.; Konoshima, L.; Yamazaki, D.; Watanabe, S.; Kim, H.; Kanae, S. Global flood risk under climate change. Nat. Clim. Chang. 2013, 3, 816. [Google Scholar] [CrossRef]
- Ntelekos, A.A.; Oppenheimer, M.; Smith, J.A.; Miller, A.J. Urbanization, climate change and flood policy in the united states. Clim. Chang. 2010, 103, 597–616. [Google Scholar] [CrossRef]
- Lamond, J.; Wilkinson, S.; Rose, C. Conceptualising the benefits of green roof technology for commercial real estate owners and occupiers. In Proceedings of the 20th Annual PRRES Conference, Christchurch, New Zealand, 19–22 January 2014; Pacific Rim Real Estate Society: Christchurch, New Zealand, 2014; pp. 1–10. [Google Scholar]
- Kundzewicz, Z.W.; Kaczmarek, Z. Coping with hydrological extremes. Water Int. 2000, 25, 66–75. [Google Scholar] [CrossRef]
- Billion-Dollar Weather and Climate Disasters: Overview. 2018. Available online: https://www.ncdc.noaa.gov/billions/ (accessed on 12 March 2018).
- Rabuñal, J.R.; Puertas, J.; Suárez, J.; Rivero, D. Determination of the unit hydrograph of a typical urban basin using genetic programming and artificial neural networks. Hydrol. Process. 2007, 21, 476–485. [Google Scholar] [CrossRef]
- Stewart, I.T.; Ficklin, D.L.; Carrillo, C.A.; McIntosh, R. 21st century increases in the likelihood of extreme hydrologic conditions for the mountainous basins of the southwestern united states. J. Hydrol. 2015, 529, 340–353. [Google Scholar] [CrossRef]
- Takeuchi, K. Increasing vulnerability to extreme floods and societal needs of hydrological forecasting. Hydrol. Sci. J. 2001, 46, 869–881. [Google Scholar] [CrossRef]
- Huang, S.; Leng, G.; Huang, Q.; Xie, Y.; Liu, S.; Meng, E.; Li, P. The asymmetric impact of global warming on us drought types and distributions in a large ensemble of 97 hydro-climatic simulations. Sci. Rep. 2017, 7, 5891. [Google Scholar] [CrossRef] [PubMed]
- Leng, G.; Tang, Q.; Rayburg, S. Climate change impacts on meteorological, agricultural and hydrological droughts in China. Glob. Planet. Chang. 2015, 126, 23–34. [Google Scholar] [CrossRef] [Green Version]
- Trenberth, K.E.; Dai, A.; van der Schrier, G.; Jones, P.D.; Barichivich, J.; Briffa, K.R.; Sheffield, J. Global warming and changes in drought. Nat. Clim. Chang. 2014, 4, 17–22. [Google Scholar] [CrossRef]
- Peterson, T.C.; Heim, R.R.; Hirsch, R.; Kaiser, D.P.; Brooks, H.; Diffenbaugh, N.S.; Dole, R.M.; Giovannettone, J.P.; Guirguis, K.; Karl, T.R.; et al. Monitoring and understanding changes in heat waves, cold waves, floods, and droughts in the united states: State of knowledge. Bull. Am. Meteorol. Soc. 2013, 94, 821–834. [Google Scholar] [CrossRef]
- Patz, J.A.; Campbell-Lendrum, D.; Holloway, T.; Foley, J.A. Impact of regional climate change on human health. Nature 2005, 438, 310. [Google Scholar] [CrossRef] [PubMed]
- Parr, D.; Wang, G.L.; Ahmed, K.F. Hydrological changes in the us northeast using the connecticut river basin as a case study: Part 2. Projections of the future. Glob. Planet. Change 2015, 133, 167–175. [Google Scholar] [CrossRef]
- U.S. Climate Extremes Index (CEI): Introduction. 2018. Available online: http://www.ncdc.noaa.gov/extremes/cei/ (accessed on 5 February 2018).
- Retchless, D.; Frey, N.; Wang, C.M.; Hung, L.S.; Yarnal, B. Climate extremes in the united states: Recent research by physical geographers. Phys. Geogr. 2014, 35, 3–21. [Google Scholar] [CrossRef]
- Villarini, G.; Smith, J.A.; Baeck, M.L.; Krajewski, W.F. Examining flood frequency distributions in the midwest US. J. Am. Water Resour. Assoc. 2011, 47, 447–463. [Google Scholar] [CrossRef]
- Kubal, C.; Haase, D.; Meyer, V.; Scheuer, S. Integrated urban flood risk assessment - adapting a multicriteria approach to a city. Nat. Hazards Earth Syst. Sci. 2009, 9, 1881–1895. [Google Scholar] [CrossRef]
- Knutti, R.; Furrer, R.; Tebaldi, C.; Cermak, J.; Meehl, G.A. Challenges in combining projections from multiple climate models. J. Clim. 2010, 23, 2739–2758. [Google Scholar] [CrossRef]
- Changnon, S.A. Assessment of flood losses in the United States. J. Contemp. Water Res. Educ. 2008, 138, 38–44. [Google Scholar] [CrossRef]
- Kundzewicz, Z.W.; Kanae, S.; Seneviratne, S.I.; Handmer, J.; Nicholls, N.; Peduzzi, P.; Mechler, R.; Bouwer, L.M.; Arnell, N.; Mach, K.; et al. Flood risk and climate change: Global and regional perspectives. Hydrol. Sci. J. 2014, 59, 1–28. [Google Scholar] [CrossRef]
- Ashley, S.T.; Ashley, W.S. Flood fatalities in the United States. J. Appl. Meteorol. Climatol. 2008, 47, 805–818. [Google Scholar] [CrossRef]
- Borden, K.A.; Cutter, S.L. Spatial patterns of natural hazards mortality in the United States. Int. J. Health Geogr. 2008, 7, 64. [Google Scholar] [CrossRef] [PubMed] [Green Version]
- Brown, R.R.; Farrelly, M.A. Delivering sustainable urban water management: A review of the hurdles we face. Water Sci. Technol. 2009, 59, 839–846. [Google Scholar] [CrossRef] [PubMed]
- Wilhite, D.A.; Svoboda, M.D.; Hayes, M.J. Understanding the complex impacts of drought: A key to enhancing drought mitigation and preparedness. Water Resour. Manag. 2007, 21, 763–774. [Google Scholar] [CrossRef] [Green Version]
- Sheffield, J.; Goteti, G.; Wen, F.; Wood, E.F. A simulated soil moisture based drought analysis for the United States. J. Geophys. Res. Atmos. 2004, 109. [Google Scholar] [CrossRef] [Green Version]
- Kron, W. Flood risk = hazard • values • vulnerability. Water Int. 2005, 30, 58–68. [Google Scholar] [CrossRef]
- Hohhot Water Bureau (HWB). Planning and Risk Assessment of Urban Drainage (Stormwater System) in Hohhot City; Technical Report; Hohhot Water Bureau: Hohhot, China, 2015.
- Wang, A.K.; Park, S.Y.; Huang, S.; Schmidt, A.R. Hydrologic response of sustainable urban drainage to different climate scenarios. In World Environmental and Water Resources Congress 2015: Floods, Droughts, and Ecosystems, Proceedings of the 2015 World Environmental and Water Resources Congress, Austin, TX, USA, 17–21 May 2015; American Society of Civil Engineers (ASCE): Reston, VA, USA, 2015; pp. 312–321. [Google Scholar]
- Yasari, E.; Pishvaie, M.R.; Khorasheh, F.; Salahshoor, K.; Kharrat, R. Application of multi-criterion robust optimization in water-flooding of oil reservoir. J. Pet. Sci. Eng. 2013, 109, 1–11. [Google Scholar] [CrossRef]
- Mechler, R.; Bouwer, L.M.; Linnerooth-Bayer, J.; Hochrainer-Stigler, S.; Aerts, J.C.J.H.; Surminski, S.; Williges, K. Managing unnatural disaster risk from climate extremes. Nat. Clim. Chang. 2014, 4, 235. [Google Scholar] [CrossRef]
- Ward, P.J.; Jongman, B.; Weiland, F.S.; Bouwman, A.; van Beek, R.; Bierkens, M.F.P.; Ligtvoet, W.; Winsemius, H.C. Assessing flood risk at the global scale: Model setup, results, and sensitivity. Environ. Res. Lett. 2013, 8, 044019. [Google Scholar] [CrossRef] [Green Version]
- Smedley, P.L.; Zhang, M.; Zhang, G.; Luo, Z. Mobilisation of arsenic and other trace elements in fluviolacustrine aquifers of the Huhhot basin, Inner Mongolia. Appl. Geochem. 2003, 18, 1453–1477. [Google Scholar] [CrossRef]
- Zhou, Q.; Leng, G.; Feng, L. Predictability of state-level flood damage in the conterminous united states: The role of hazard, exposure and vulnerability. Sci. Rep. 2017, 7, 5354. [Google Scholar] [CrossRef] [PubMed]
- Nicholls, N. Comments on “Have disaster losses increased due to anthropogenic climate change?”. Bull. Am. Meteorol. Soc. 2011, 92, 791. [Google Scholar] [CrossRef]
- Neumayer, E.; Barthel, F. Normalizing economic loss from natural disasters: A global analysis. Glob. Environ. Chang. 2011, 21, 13–24. [Google Scholar] [CrossRef] [Green Version]
- Mukherjee, A.; Bhattacharya, P.; Shi, F.; Fryar, A.E.; Mukherjee, A.B.; Xie, Z.M.; Jacks, G.; Bundschuh, J. Chemical evolution in the high arsenic groundwater of the Huhhot basin (inner Mongolia, Pr china) and its difference from the western Bengal basin (India). Appl. Geochem. 2009, 24, 1835–1851. [Google Scholar] [CrossRef]
- Peduzzi, P.; Chatenoux, B.; Dao, H.; De Bono, A.; Herold, C.; Kossin, J.; Mouton, F.; Nordbeck, O. Global trends in tropical cyclone risk. Nat. Clim. Chang. 2012, 2, 289. [Google Scholar] [CrossRef]
- Wu, J.; Han, G.; Zhou, H.; Li, N. Economic development and declining vulnerability to climate-related disasters in China. Environ. Res. Lett. 2018, 13, 034013. [Google Scholar] [CrossRef] [Green Version]
- National Weather Service Instruction 10–1605, Storm Data Preparation. 2016. Available online: https://www.ncdc.noaa.gov/stormevents/pd01016005curr.pdf (accessed on 8 March 2018).
- Sisco, M.R.; Bosetti, V.; Weber, E.U. When do extreme weather events generate attention to climate change? Clim. Chang. 2017, 143, 227–241. [Google Scholar] [CrossRef]
- Chen, J.; Hill, A.A.; Urbano, L.D. A gis-based model for urban flood inundation. J. Hydrol. 2009, 373, 184–192. [Google Scholar] [CrossRef]
- Dundon, L.; Nelson, K.; Camp, J.; Abkowitz, M.; Jones, A. Using climate and weather data to support regional vulnerability screening assessments of transportation infrastructure. Risks 2016, 4, 28. [Google Scholar] [CrossRef]
- Wobus, C.; Lawson, M.; Jones, R.; Smith, J.; Martinich, J. Estimating monetary damages from flooding in the united states under a changing climate. J. Flood Risk Manag. 2014, 7, 217–229. [Google Scholar] [CrossRef]
- Edwards, R.; LaDue, J.G.; Ferree, J.T.; Scharfenberg, K.; Maier, C.; Coulbourne, W.L. Tornado intensity estimation past, present and future. Bull. Am. Meteorol. Soc. 2013, 94, 641–653. [Google Scholar] [CrossRef]
- Belanger, J.I.; Curry, J.A.; Hoyos, C.D. Variability in tornado frequency associated with U.S. Landfalling tropical cyclones. Geophys. Res. Lett. 2009, 36. [Google Scholar] [CrossRef]
- Ashley, W.S.; Gilson, C.W. A reassessment of U.S. Lightning mortality. Bull. Am. Meteorol. Soc. 2009, 90, 1501–1518. [Google Scholar] [CrossRef]
- Gall, M.; Borden, K.A.; Cutter, S.L. When do losses count? Bull. Am. Meteorol. Soc. 2009, 90, 799–809. [Google Scholar] [CrossRef]
- Mishra, A.K.; Singh, V.P. A review of drought concepts. J. Hydrol. 2010, 391, 202–216. [Google Scholar] [CrossRef]
- Cook, B.I.; Ault, T.R.; Smerdon, J.E. Unprecedented 21st century drought risk in the American southwest and central plains. Sci. Adv. 2015, 1. [Google Scholar] [CrossRef] [PubMed]
- Barbero, R.; Fowler, H.J.; Lenderink, G.; Blenkinsop, S. Is the intensification of precipitation extremes with global warming better detected at hourly than daily resolutions? Geophys. Res. Lett. 2017, 44, 974–983. [Google Scholar] [CrossRef]
- Siegrist, M.; Gutscher, H. Natural hazards and motivation for mitigation behavior: People cannot predict the affect evoked by a severe flood. Risk Anal. 2008, 28, 771–778. [Google Scholar] [CrossRef] [PubMed]
- Kreibich, H.; Thieken, A.H.; Petrow, T.; Muller, M.; Merz, B. Flood loss reduction of private households due to building precautionary measures—Lessons learned from the Elbe flood in august 2002. Nat. Hazards Earth Syst. Sci. 2005, 5, 117–126. [Google Scholar] [CrossRef]
- Grothmann, T.; Reusswig, F. People at risk of flooding: Why some residents take precautionary action while others do not. Nat. Hazards 2006, 38, 101–120. [Google Scholar] [CrossRef]
- Stakhiv, E.Z.; Werick, W.; Brumbaugh, R.W. Evolution of drought management policies and practices in the United States. Water Policy 2016, 18, 122–152. [Google Scholar] [CrossRef]
- Downton, M.W.; Miller, J.Z.B.; Pielke, R.A. Reanalysis of U.S. National weather service flood loss database. Nat. Hazards Rev. 2005, 6, 13. [Google Scholar] [CrossRef]
Figure 1.
Changes in annual damages (red dotted line) and total occurrences (blue solid line) of (a) floods and (b) droughts during 1996–2016. The numbers out the brackets indicate the long-term annual mean values. The two numbers in the brackets are the changing trends and associated p values, respectively. The changing trends that are statistically significant at the 90% confidence level are highlighted with asterisks (*).

Figure 2.
Comparison of the cumulative distribution functions of (a) share of damaging events (SDE) and (b) event damage (DPE) for floods and droughts for the period 1996–2016.
Figure 2.
Comparison of the cumulative distribution functions of (a) share of damaging events (SDE) and (b) event damage (DPE) for floods and droughts for the period 1996–2016.

Figure 3.
Changes in (a) the share of events causing damage (SDE) and (b) damage per event (DPE) by floods and droughts during 1996–2016. The numbers indicate the long-term mean annual values and changing trends, respectively. The trends that are statistically significant at the 90% confidence level are highlighted with asterisks (*).

Figure 4.
Trends in annual number of events with damages (NED) (first row) and share of damaging events (SDE) (second row) of floods and droughts. Only states with statistically significant relations at the 90% confidence level are shown.
Figure 4.
Trends in annual number of events with damages (NED) (first row) and share of damaging events (SDE) (second row) of floods and droughts. Only states with statistically significant relations at the 90% confidence level are shown.

Figure 5.
Trends in annual damage (D) (first row) and damage per event (DPE) (second row) of floods and droughts. Only states with statistically significant relations at the 90% confidence level are shown.
Figure 5.
Trends in annual damage (D) (first row) and damage per event (DPE) (second row) of floods and droughts. Only states with statistically significant relations at the 90% confidence level are shown.


Table 1.
Descriptions of impact metrics.
| Group | Impact Metrics | Descriptions |
|---|---|---|
| 1 | Total occurrences | Annual number of recorded events (TO) |
| Number of events with impacts | Number of events with damages (NED) | |
| Ratio of events with impacts | Share of damaging events (SDE = NED/TO) | |
| 2 | Total impacts | Annual economic damages (D) |
| Impacts per event | Damage per event (DPE = D/TO) |
© 2018 by the authors. Licensee MDPI, Basel, Switzerland. This article is an open access article distributed under the terms and conditions of the Creative Commons Attribution (CC BY) license (http://creativecommons.org/licenses/by/4.0/).
Share and Cite
MDPI and ACS Style
Zhou, Q.; Leng, G.; Peng, J. Recent Changes in the Occurrences and Damages of Floods and Droughts in the United States. Water 2018, 10, 1109. https://doi.org/10.3390/w10091109
AMA Style
Zhou Q, Leng G, Peng J. Recent Changes in the Occurrences and Damages of Floods and Droughts in the United States. Water. 2018; 10(9):1109. https://doi.org/10.3390/w10091109
Chicago/Turabian StyleZhou, Qianqian, Guoyong Leng, and Jian Peng. 2018. "Recent Changes in the Occurrences and Damages of Floods and Droughts in the United States" Water 10, no. 9: 1109. https://doi.org/10.3390/w10091109
Note that from the first issue of 2016, this journal uses article numbers instead of page numbers. See further details here.