Multi-Objective Optimization of Resilient Design of the Multipurpose Reservoir in Conditions of Uncertain Climate Change


1
Institute of Landscape Water Management, Faculty of Civil Engineering, Brno University of Technology, 602 00 Brno, Czech Republic
2
Centre for Water Systems, College of Engineering, Mathematics and Physical Sciences, University of Exeter, Exeter EX4 4QF, UK
*
Author to whom correspondence should be addressed.
Water 2018, 10(9), 1110; https://doi.org/10.3390/w10091110
Submission received: 18 June 2018
/
Revised: 14 August 2018
/
Accepted: 16 August 2018
/
Published: 21 August 2018
(This article belongs to the Special Issue Adaptive Catchment Management and Reservoir Operation)
Abstract
:This paper presents and assesses a new approach to decision-making methods for the design of new reservoirs due in times of decreasing water resources. The methods used in this case are decision theory, Resilience and Robustness method. The methods have been selected primarily to analyze different design parameters of a new dam, mainly dam heights leading to different reservoir volumes. The study presents a novel approach to the optimal design of a multipurpose reservoir that would provide enough water for downstream environmental flow, residential and industrial water supply, agricultural water supply, and hydropower generation in the current conditions of climate uncertainty. Uncertainties are interpreted as possible future changes in the climate system using outputs from regional climatic models. In the case study, a simulation model was developed which is able to quantify long-term water balance and use this data to quantify resilience and robustness of its water supply. The simulation model was correlated to the GANetXL software in order to perform Genetic Algorithms based optimization of the reservoir’s operation. The simulation–optimization model was then applied to a real-life case study in the Czech Republic, in the Morava River Basin where a new dam with the multipurpose reservoir is planned to be built in the future. The results obtained in this way were analyzed in detail to identify the overall best solution consist of dam height and the total reservoir monthly outflow and new operational rules for the analyzed multipurpose reservoir.
1. Introduction
In Czechia, climate change has caused change of the hydrological cycle due to redistribution of precipitation during the hydrological year in the last decade. This phenomenon results in more frequent occurrences of extremes in the form of floods and droughts. But the most urgent problem is that the values of the long-term mean flows are decreasing in rivers as well as the yield of groundwater sources.
Moreover, the years 2015 and 2017 were considered extremely dry in many regions of Czechia. It is becoming a trend of the last couple of years that meteorologists start to call the previous year as the warmest year in the history of meteorological measurement, this confirms WMO Statement on the State of the Global Climate 2017 [1].
The above-mentioned factors create pressure on the effective management of the surface water resources which will become stronger as well as the Czech Republic is sometimes called “roof of Central Europe”, as there is no major inflow to the territory, but only outflows. The limited availability of water resources in this country requires the government to prepare new climate change adaptations and focus on increasing the retention capacity of water in the landscape, long-term water management planning, and environmental politics on global level.
The government of the Czech Republic has issued several documents on adaptation strategies to climate change [2,3,4,5], which have been developed by the research institutes: VÚV TGM, v.v.i; EKOTOXA s.r.o.; ČHMÚ in cooperation with Ministry of the Environment of the Czech Republic. These documents indicate many measures to achieve the objectives of protection against the negative impacts of drought namely adaptive measures leading to saving drinking water, increasing of water retention capacity of the soil, stabilizing of water regimes in river basins, restoration of small water reservoirs and increasing their reliability, optimization of the existing reservoir volumes, and importantly, identification of other locations suitable for new water reservoirs and strategic technical option is allocating new water resources like open water reservoirs. Under conditions of climate change uncertainties currently there are several locations surveyed in the process of feasibility studies. These new multipurpose reservoirs will be primarily ensuring drinking water supply, keep ecological flows in the rivers, ensuring water supply for industry and agriculture, and may help to resist the drought problems.
The overall objective of this paper is to introduce a novel approach to the multipurpose reservoir design. The evolutionary multi-objective optimization method was utilized to find the optimal design parameter values of the dam, mainly dam height leading to different reservoir volumes. For the design of dam height and reservoir management, a new level so-called water excess level (I) and the critical threshold level (II) were introduced. In order to complete the main goal, it is necessary that the design must follow the individual objectives:
- (a)
- the goal is to apply a suitable metric which is defined by the resilience of reservoir storage capacity and find optimal economic solutions (to maximize resilience and benefits from the reservoir) using the multi-objective optimization method with required robustness,
- (b)
- the objective of this method is to analyze a range of the dam heights and volumes of the multipurpose dam in conditions of uncertain climate change on the basis of given future climate scenarios using hydrological outputs from 15 regional climate models and potential demand scenarios.
This new approach responding to the actual demands of water under climate change can be a benefit for the design of the multipurpose reservoir under similar conditions. The methods are applied and tested on the case study in the Hanusovice dam profile.
2. Background
In the Czech Republic water reservoirs have always been designed according to the historical hydrological or generated time series. Czech National Standard [6] classifies open water reservoirs based on their strategic importance. Strategic classification is evaluated by temporal reliability RT which is defined as the ratio of the months without fault and the number of all months for the given time series [7,8]. The class A is the most strategic (A ≥ 99.5% RT) and D is the least strategic (D ≥ 95.0% RT). The water deficit is defined when the active storage capacity is in an unsatisfactory state. Water supply reservoirs have generally been designed and operated by a set of predetermined rules, not taking into consideration climate uncertainty. These rules were formulated based on hydrology, the ability of storage capacity, and yield criteria. Reliability has been the main objective in the sense of achieving the long-term target demand and the prevention against floods. The practice for the design and operation of the reservoir used reliability and the concepts of resilience, which experimental setting is different, were not used. The problem is that this approach does not take into consideration the consequences of possible future hydrological and climate changes when there is an increased social demand, increased needs of agriculture, and long-term decreasing flows. Climate change is creating a potentially large range of uncertainty of possible futures that could threaten the reliability of water supplies.
When modeling water resources systems, we need to determine reliability, vulnerability, resilience, and risk. First Kritskiy and Menkel [7] described the definition of evaluation criteria of water resources; reliability. Hashimoto et al. [8] were among the first to propose the use of the terms of water resource system performance evaluation. These performance criteria refer to (i) how probable is it that a system can get into a unsatisfactory or failure state (reliability), (ii) how severe the consequences of failure might be (vulnerability), and (iii) how quickly it can bounce back, which is the recovery from a failure (resilience) [8]. Using multi-objective linear programming, the trade-offs between reliability, vulnerability, and resilience were researched in water supply reservoir operation in a previous study [9].
Resilience for water resources has generally been quantified as the duration of time (maximum or average) when temporary restrictions are in place due to low supply availability. But its calculation is varied in the literature. Relationships among resilience, reliability, and vulnerability of water supply using many-objective analysis were explored in a past paper [10]. For example, resilience was used as a performance criterion metric [11], in a past work [12] resilience is calculated as the average duration of time when a system is under a temporary restriction, or in another previous work [13] resilience was calculated as a fraction of the total future time a system is under an unsatisfactory state. Roach [14,15] characterized and tested several potential resilience metrics and looked for the resilience of the water system and robustness of the water supply based on adaptation strategies. Watts et al. [16] and Amarasinghe et al. [17,18] have undertaken studies on the resilience of water supply systems. The reservoir resilience as a function of time (static and dynamic) for a multipurpose reservoir operation was compared a past study [19]. The resilience along with robustness to system design wastewater treatment plant control were used previously [20].
The risk and uncertainty were first described by Knight [21], who was the first to distinguish between risk and uncertainty. The risk assessment and risk analysis for water management purposes were described by Kaplan in [22]. Uncertainties used in hydrology have been presented by Beven and Binley [23]. Uncertainties can be categorized by the generation of multiple future scenarios that represent alternative likely conditions under different assumptions [24]. Uncertainties are the factors which can affect reservoir design or operation, as well as the accuracy of results. Uncertainty analysis focusing on reservoir capacity performance with various sizes and types of input uncertainties were tested for the design of the active storage capacity and reliability in the articles [25,26,27,28]. Based on the achieved results it is possible that both values active storage capacities and reliability, determined without considering input data uncertainty, may be undervalued. This can lead to failure of storage capacity.
Using Monte Carlo experiments the Markov model reproduced relationships between resilience and reliability for a wide class of water supply systems and provided a general theoretical foundation for understanding the trade-offs among reservoir system storage, yield, reliability, and resilience [29]. In a past paper [30] the behavior of statistical performance indices (reliability, resilience, and vulnerability for a multipurpose storage reservoir) using simulations Monte Carlo on a real reservoir in India was performed, and it was confirmed that traditional reliability for reservoir design and operation cannot completely describe the strengths and weaknesses of a given issue. A past paper [31] showed the optimized operation of the largest multipurpose reservoir in Vietnam using the complex evolution algorithm and the MIKE 11 simulation model. The optimization puts focus on the trade-off between flood control and hydropower generation for the reservoir operation in the flood season and the reservoir level at the beginning of the dry season. In another past paper [32] a novel multi-objective optimization modeling framework for the operation of multipurpose simple reservoirs was presented. This model uses genetic algorithms as optimization techniques. The main objective function minimizes the cost of the annual water shortage for irrigation and the secondary objective maximizes energy production. A previous work [33] presents an evolutionary multi-objective optimization approach NSGA-II for the study of multiple water usages in multiple interlinked reservoirs. The case studies involve, primarily, the objectives of power generation and navigability on the river.
One of the newest statistical concepts could be used to evaluate results under uncertainty is robustness. Robustness can be defined as the degree to which a water supply system performs at a satisfactory level across a range of future scenarios or conditions [34]. One of the types of satisficing criteria may be based on the proportion of possible future conditions under which system performs correctly. Developing robust long-term water resources plans described by the above definition have generally been assessed previously [35]. The robustness water resources system under deep uncertainty has been used in many other cases and the results from past papers [20,36,37,38,39,40,41,42] show that the using of the robustness concept is beneficial for the analysis of results under uncertainty.
For the case study, the optimizing method Non-dominated Sorting Genetic Algorithm II (NSGA II) described previously [43] was used. The NSGA II was successfully used in handling multi-objective optimization problems in water management in several past works [44,45,46,47,48,49,50]. The NSGA II was developed from the multi-objective algorithm NSGA [51], which was formulated based on the suggestions made by Goldberg in 1989 [52]. The relation between risk, reliability, water shortages, and hydropower energy in an open reservoir using the NSGA II optimization was tested previously [53]. The NSGA II algorithm and reservoir simulation model were applied in GENetXL [54]. The GENetXL was presented by a simple water supply hypothetical reservoir operation model with two objectives: maximize yield and maximize recreational benefit, and a large combinatorial optimization problem of pump scheduling in water distribution systems.
There is not much research on optimal reservoir design and management under uncertainty. In the world, complex water management planning and optimization of extensive water resources systems in the context of climatic uncertainties are mostly solved [40,55,56,57,58,59,60,61]. Given that case studies of water management systems are solved complexly and on a large scale on the other hand, we focus on the individual study in small scale but in more detail. A solution, in the sense of the whole reservoir capacity under climate change, has not been well-studied as an individual target in the design of reservoirs. In addition, the increasing water demand and distribution of water are not sufficiently safeguarded today. Current issues lead to use the uncertainty of climate change, multi-objective optimization, and concepts of resilience and robustness. All of these creating optimal effective design and new operational rules of a multipurpose water reservoir.
3. Case Study
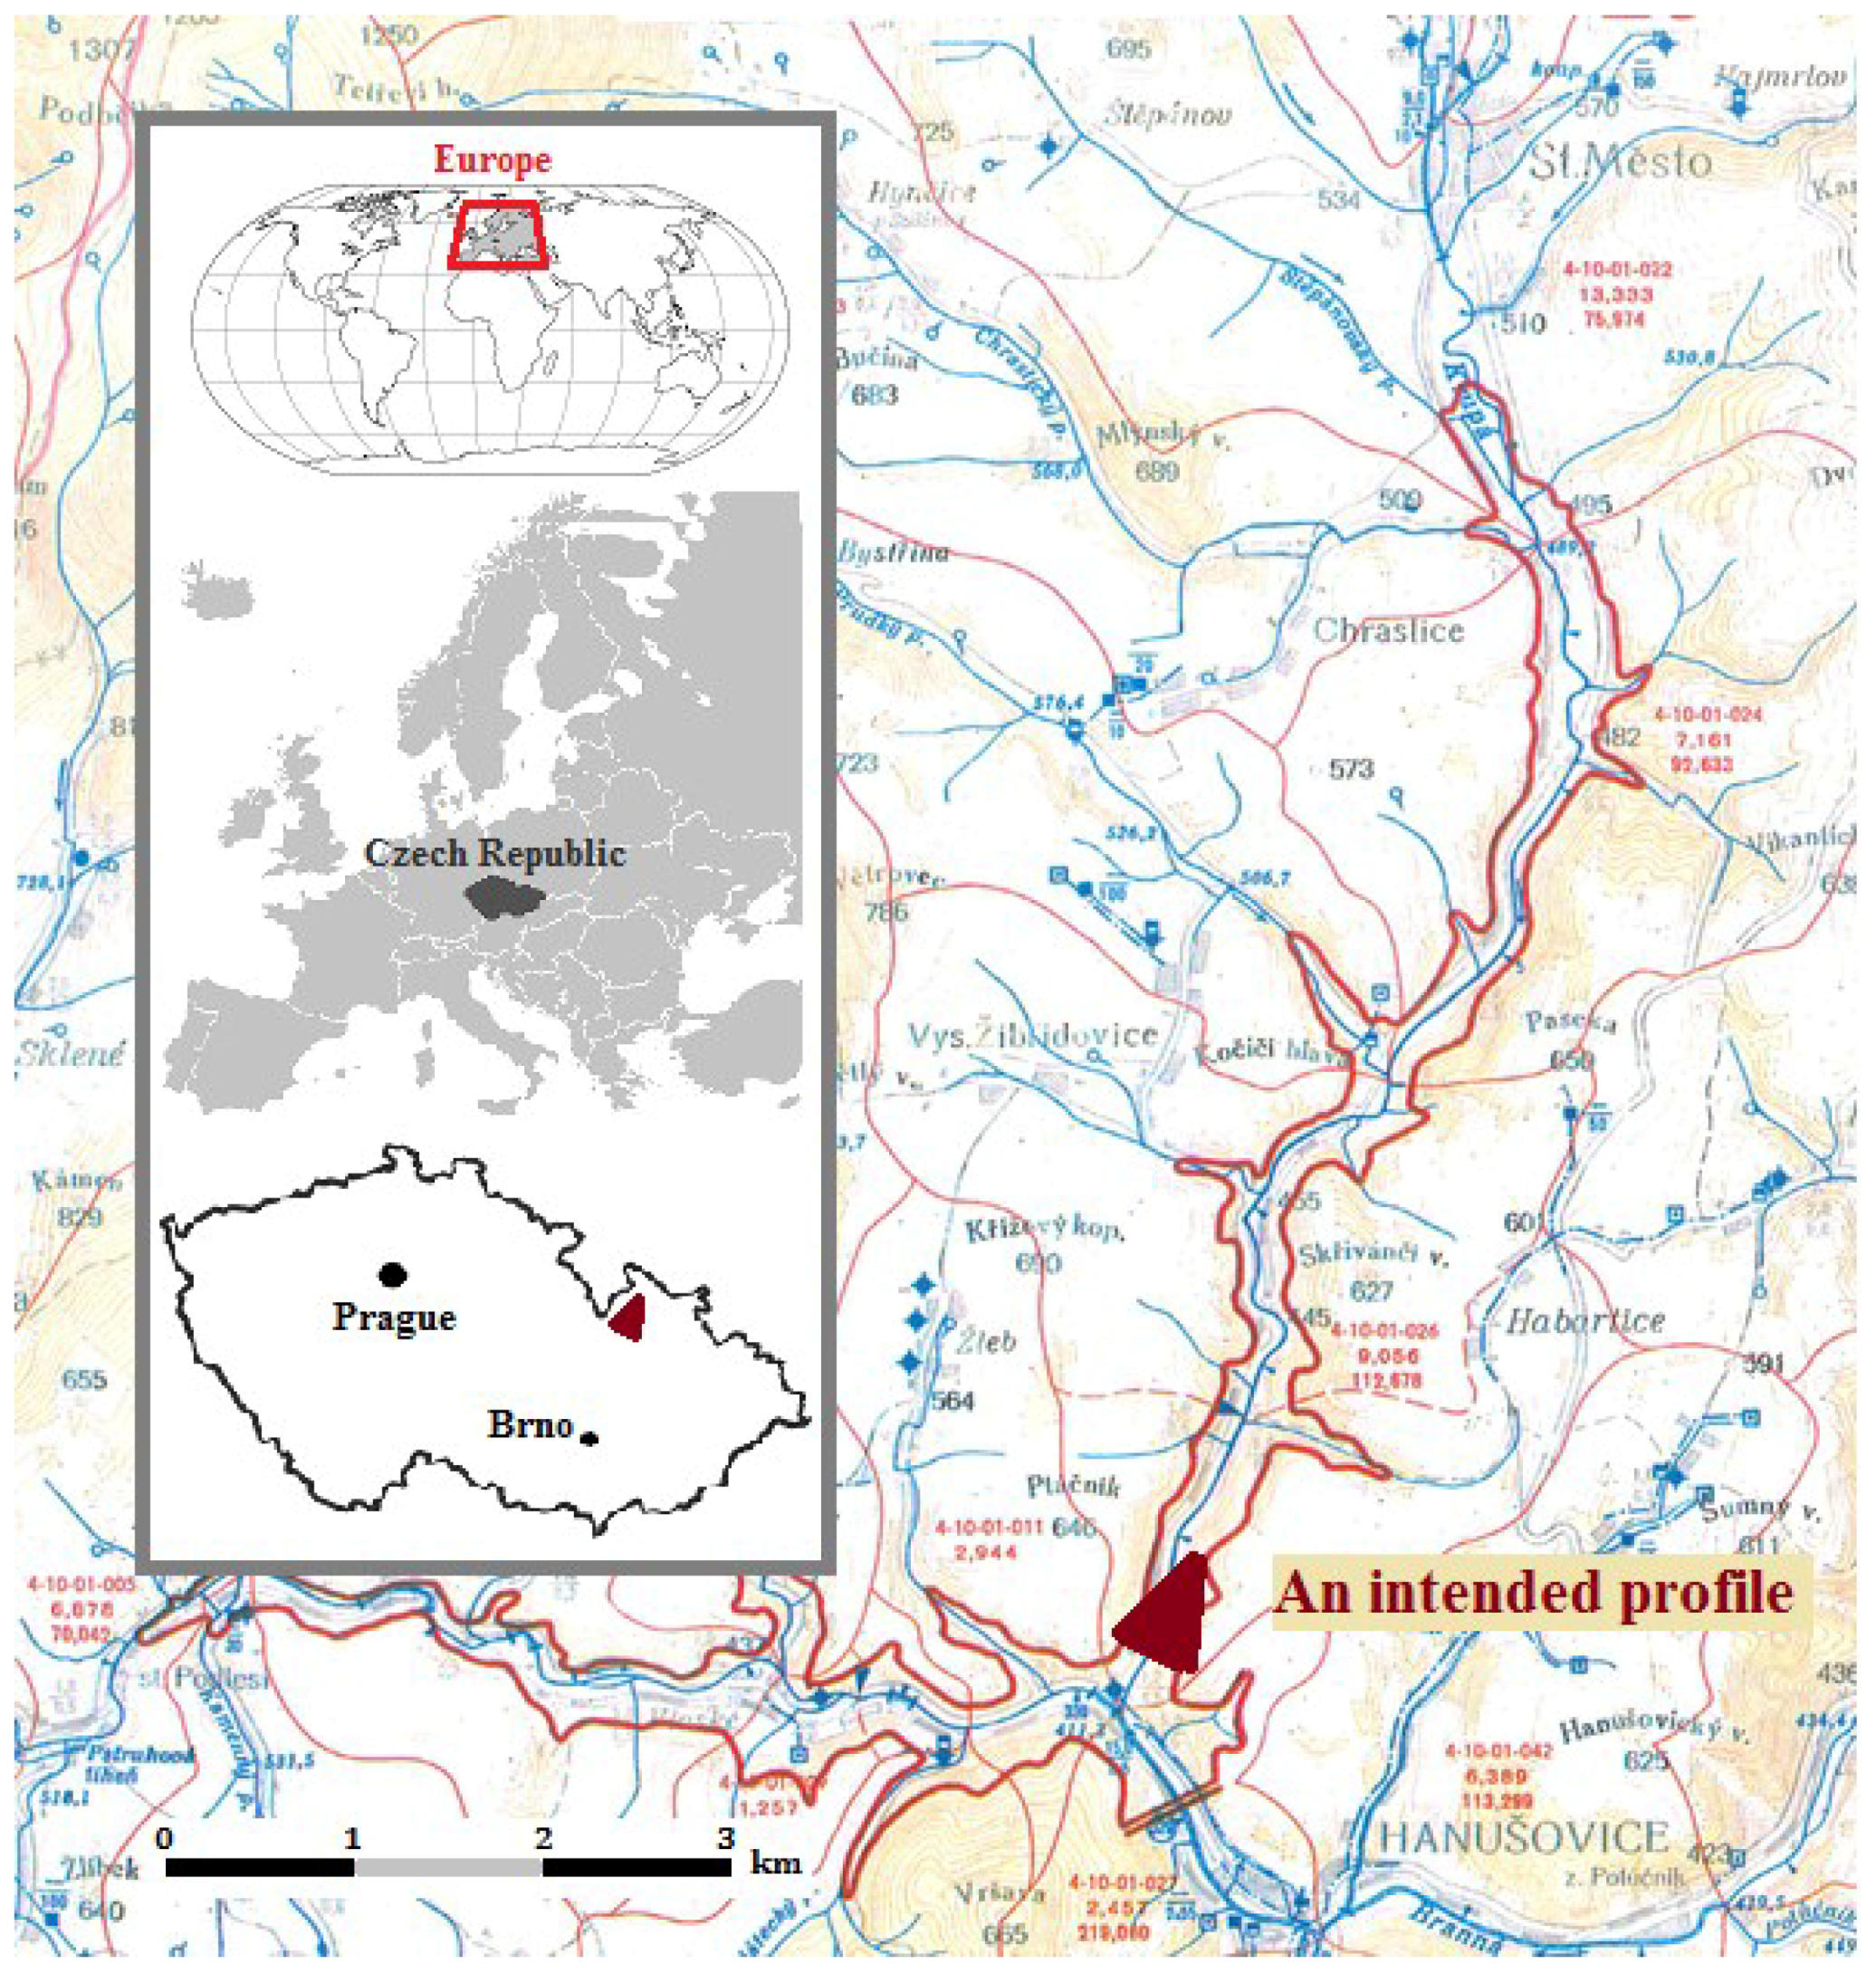
The case study is based on the intended profile in Hanusovice in the Czech Republic, 200 km east of the capital city Prague, see Figure 1. The new dam is planned in the Morava River Basin, maintained by the manager of the Morava River Basin, State Enterprise (PMO), and the Krupa River is the main inflow into the reservoir. The long-term mean river flow Qa is 2.12 m3 s−1. The elevation volume and area curves for a given profile were determined by a digital terrain model using GIS software. In this software, Figure 1 has been also generated showing one of the possible new dam locations.
Hydrologic data in the form of water inflows were derived from 15 regional climate models for the period 2015 to 2100. These are scenarios with a resolution of 25 km × 25 km which are controlled by one of the four global climate models. The results of the climate models are based on the IPCC SRES AR4 [62], only for the conservative emission scenario A1B which represents a very fast future economy growth and development of new technologies with a balance in the use of all fuels as energy sources. In the paper, each regional model represents 1 input of climate scenario. Data were taken from the project RSCN VUV [63]. The data were modified from hydrometric profile Morava/Raskov to hydrometric profile Krupa/Habartice using the analogy method for the river flows were determined.
Total water demand was determined as a sum of the QECO (ecological outflow to the river), QWS:drink (drinking water supply), and QWS:ind.+agric. (water supply for industry and agriculture). QECO = 0.54 m3 s−1 and is constant for all months, QWS:drink. and QWS:ind.+agric. are based on 25% of total current demand for the part of the Olomouc Region from the plan for the development of water supply [64]. Mean annual demand was divided to monthly demands, see Table 1. Potential monthly redistribution of water demand was set according to the data from the PMO.
The permanent storage capacity VP was simplified and evaluated to height 15.0 m and corresponds to 0.44 mil. m3. The flood storage capacity VF was calculated for flood hydrograph Q10.000. The Klemes method [65] was used to transform the controlled flood and to evaluate VF. The total flood storage capacity VF = 7.72 mil. m3. The safety reserve 2.0 m was used to prevent overflow of the dam.
The location of the power plant is situated just below the dam and water supply for industry and agriculture is taken downstream the power plant, while drinking water supply is taken in the reservoir itself.
For the case study, an earth dam was used. Parameters of the dam body are; width of the dam crown is 5.0 m, bottom length is 100.0 m, an upstream slope is 1:3, downstream slope is 1:2, and terrain slopes are 1:1 (left side) and 1:1.8 (right side). The height of dam was calculated ranging from 80.0 to 100.0 m.
The target levels of resilience were set for three targets the duration of the longest water deficit period is up to 3 months (main target), up to 5 months, and 0 months. Two target levels of robustness 80% and more and 90% and more were tested.
All prices in Equations (4)–(6) corresponded to the present trade prices in Euro. The PRICEWATER was 0.245 € m−3 charged by PMO last year and the PRICERED,ELE was 0.10 € kWh−1. The discount rate r according to a past paper [66] for 2015–2044 is presumed 0.035, 2045–2089 is presumed 0.03, and 2090–2100 is presumed 0.025. The total coefficient of efficiency η for the calculation of the energy from the hydropower in Equation (7) is 0.80. The cost of the dam ZCU in Equation (10), respectively (9), is around 26.2 € m−3 for the earth dam in this location.
The following configuration of parameters NSGA II optimization in GENetXL was used. Population size was 100 genes. The number of generations was 200. Selection the crowded tournament was set up. The crossover was set up the simple one point and the rate was 0.90. Mutation type was set up as simple with mutation rate 0.05. The number of chromosomes (decision variables) was 12 for i = 1, …, 12 months of year with boundary conditions QEXC,i ⟨0.0 m3 s−1; 2.0 m3 s−1⟩.
4. Methodology
4.1. Problem Formulation
Where designing the new multipurpose dam, the objective functions have to be defined to satisfy all requests at the same time and lead to a new approach for using a multi-objective optimization.
The resilience of storage capacity must be set to a target level to be considered as acceptable under given future climate scenarios and water demand scenario, as well as robustness. That means if the target levels of resilience and robustness are satisfactory then the designed solutions are acceptable.
In the analysis, 12 decision variables were created. Each of them was described as month excess water QEXC that was added to the total water demand.
In total, two objective functions were used, net present value and resilience. The results obtained from the 12 decision variables for four chosen climate scenarios. Then the robustness was evaluated based on decision variables and resilience.
4.2. Resilience and Robustness
In this case every kind of potential resilience (RES) [month] metrics, defined previously [14], were tested, and finally, was traditional metric of resilience was selected with the duration of the longest water deficit period:
The robustness (ROB) [%] is defined in this case as the percentage ratio of future supply and demand scenarios [36,39]:
where SA is the number of scenarios in which the reservoir simulation model performs at an acceptable level of resilience and ST is the total number of scenario combinations of supply and demand.
4.3. Costs and Benefit
One of the objectives is to minimize the cost of dam construction and maximize benefits from the dam. This is expressed by the net present value (NPV) [€], which is calculated according to the following Equation (3):
where BEN [mil €] are benefits from the utilization of water for hydropower and sales of water, CDAM is the cost of the dam construction, r is discount rate and t = 1, …, T for T = 86 (the total number of years until 2100).
We have three possible benefits: drinking water supply Equation (4), water supply for industry and agriculture Equation (5), and benefits from hydropower plant Equation (6):
where QWS:drink.,i is drinking water for residential water supply and QWS:ind.+agric.,i is water for industrial and agricultural water supply; PRICEWATER is the price for water consumption. PRICERED,ELE is the redemption price of electricity from the hydropower according to the Czech Energy Regulatory Office, i = 1, …, n for n = 12 (number months of the t-year) and EHPP,t [Wh·month−1] is generated energy from hydropower for a year Equation (7):
where ρ is density of water, g is gravity, Hi is the height of water level in given i-month, η is total coefficient of efficiency, i = 1, …, n for n = 12, Δt is one year and QHPP,i [m3 s−1] is flowed through a hydropower in given i-month and is calculated according to the Equation (8):
where QECO,i is ecological outflow for downstream environmental flow, QWS:ind.+agric.,i is water supply for industry, and QEXC,i is the water excess for hydropower and to a river in given i-month.
The last parameter of Equation (3) is CDAM [€], which describes the cost of the dam construction and is determined by following Equation (9):
where VDAM is the volume of the dam structure and ZCU [€m−3] is the cost of the dam calculated according to Czech property valuation decree [67]:
where ZC is a cost according to the type of material of the dam and K are coefficients according to the location of the dam.
4.4. Reservoir Simulation Model
A reservoir simulation model was created based on emptying and filling of reservoir storage capacity. The newly introduced water excess level (I) and critical threshold (II) were used to calculate the resilience. This principle can be described by the inequality (11) which proceeds from the mass balance equation [68]:
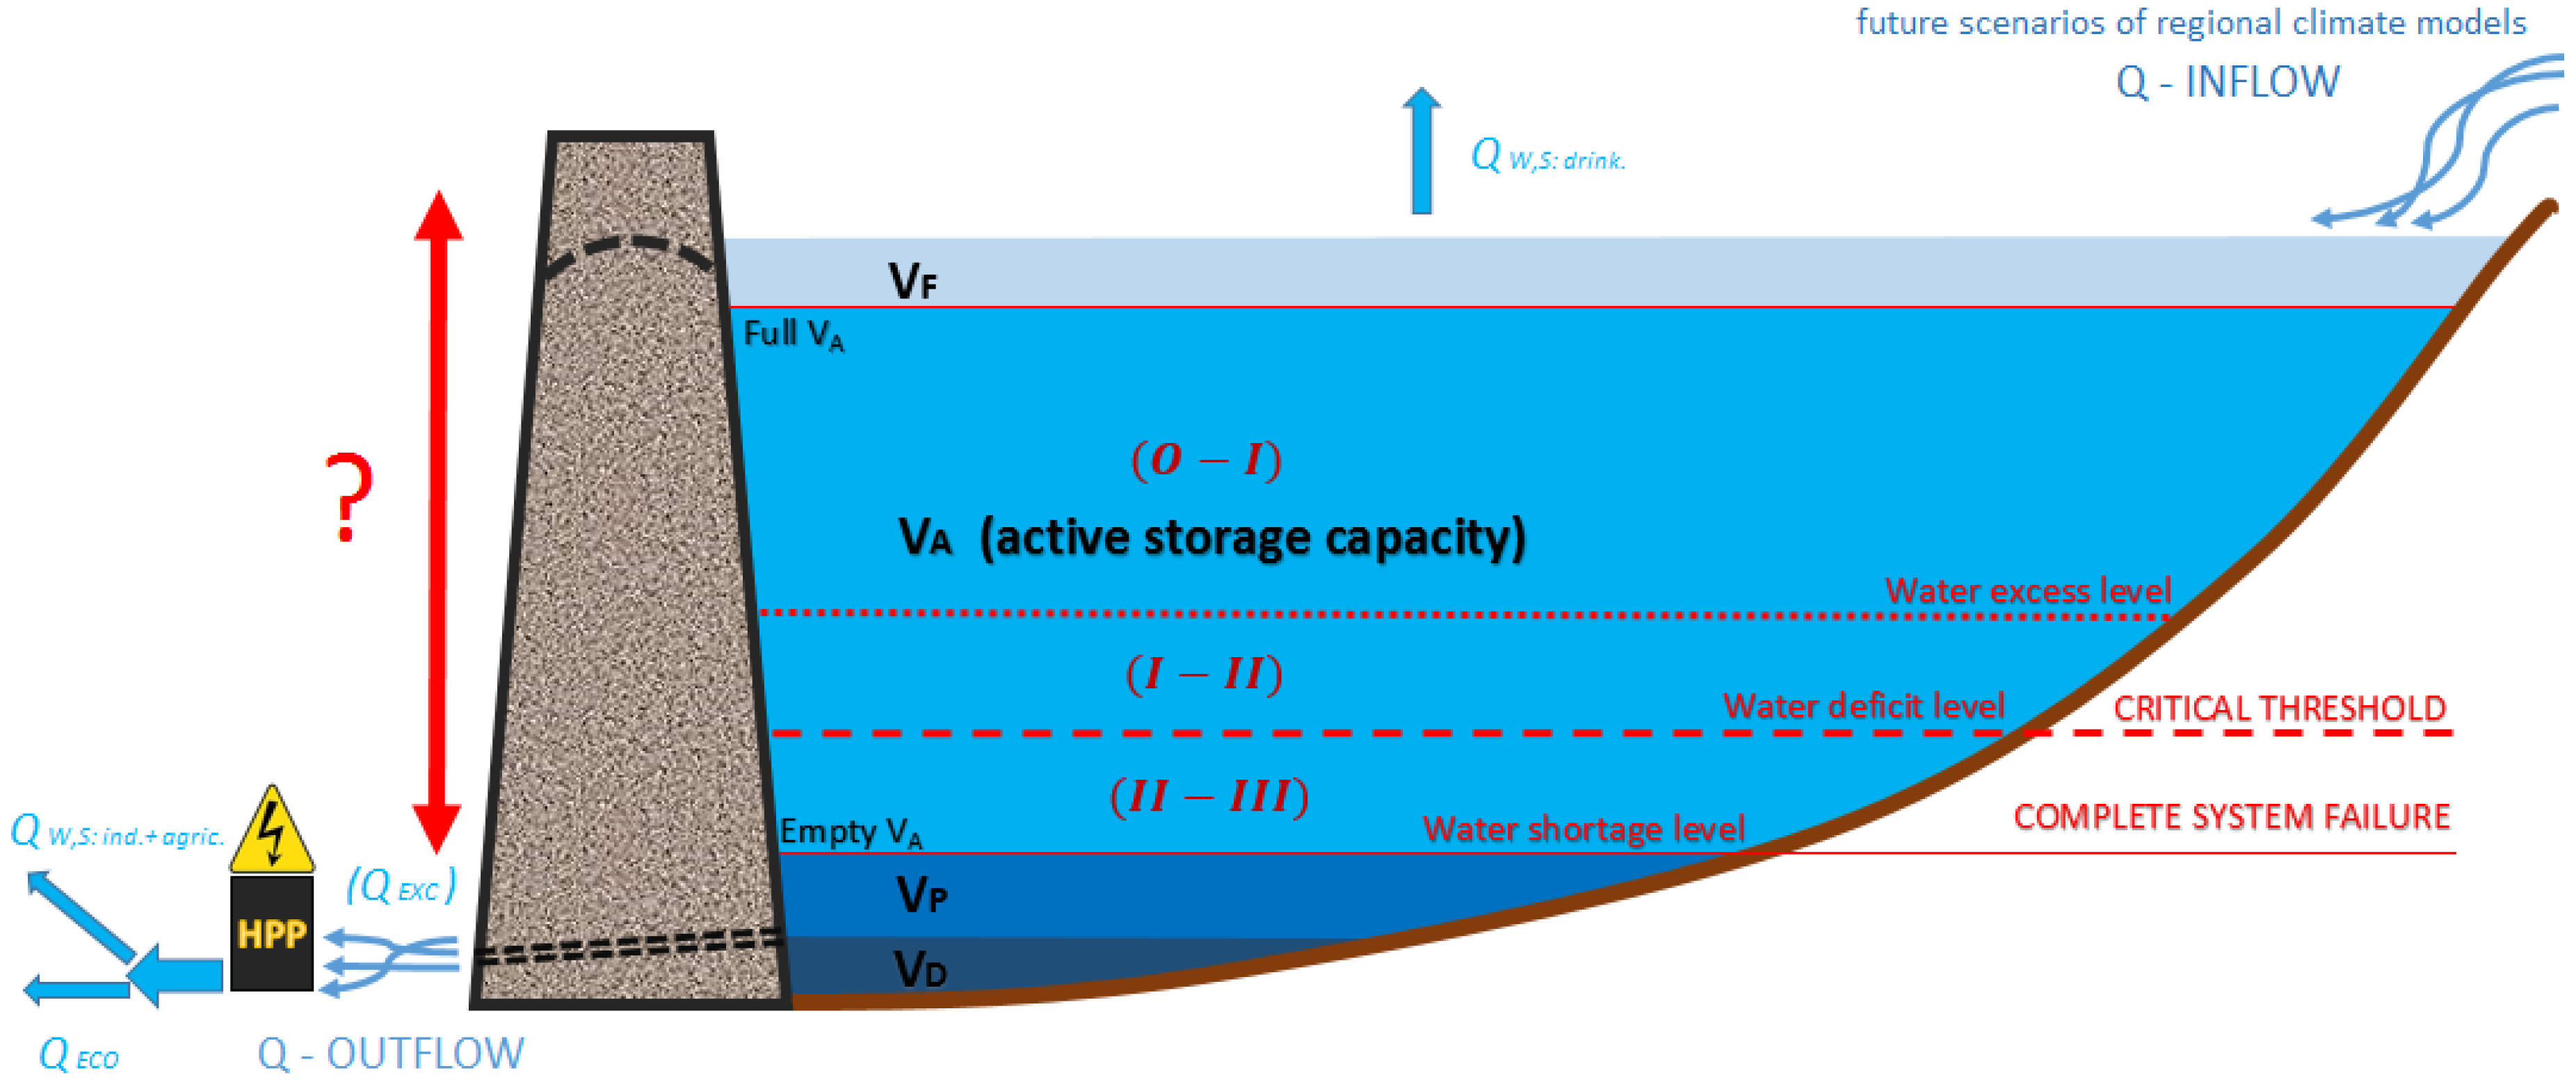
where QIN,i [m3 s−1] is inflow water to the reservoir for i = 0, …, n−1. QIN,i is generated by future scenarios of regional climate models from [63]. QOUT,i [m3 s−1] is the reservoir outflow for i = 0, …, n − 1. The QOUT,i is formulated by the sum of the QECO,i, QWS:drink.,i, QWS:ind.+agric.,i, and QEXC,i (water excess for hydropower). Δt is the time step of calculation (one month). For i = 0 it is necessary to enter the initial condition (full active storage capacity). Inequality (11) is limited from the left side by water level (0) which characterizes full active storage capacity and from the right as active storage capacity divided by level (I–III) as shown in Figure 2. Each level of active storage capacity is characterized by given outflow QOUT,i.
The resulting scheme of dam water storage in Figure 2 shows variants of water levels, where VF is flood storage capacity, VA is active storage capacity, VP is permanent storage capacity, and VD characterizes dead storage capacity.
When the current step i emptying and filling of storage capacity is going up from level (0–III) in (11), then the QOUT,i [m3 s−1] is equal to the QIN,i, [m3 s−1] otherwise new operating rules and restrictions are created according to the following control Equations (12)–(14):
As mentioned above, the water level (0) which characterizes full active storage capacity and water level (III) is empty active storage capacity. The volume between levels I–III is set up 11.6 mil. m3. This volume corresponds to three months of estimated total demand. The volume between levels II–III correspond to the total demand in given month of the year.
When the volume of water is between level I–II, water excess QEXC,i is null. When the volume of water drops down the critical threshold (II) the deficit begins. At this moment, the restriction of reservoir management by priority roles begins. The main rule is to guarantee QECO and next rule is to ensure QWS:drink. and QWS:ind.+agric. in the ratio of 70:30, see Equation (14).
4.5. Optimization Method
For the case study, the model in cooperation with the NSGA II algorithm was used in order to create decision variables population of an excess of water QEXC,i.
The key parameters for NSGA II are possible decision variables, dam heights and analyzes of reservoir performance across all climate scenarios in the simulation model. Data output of the optimization method are presented in a form of Pareto sets showing relations between net present value and resilience of the reservoir.
5. Result and Discussion
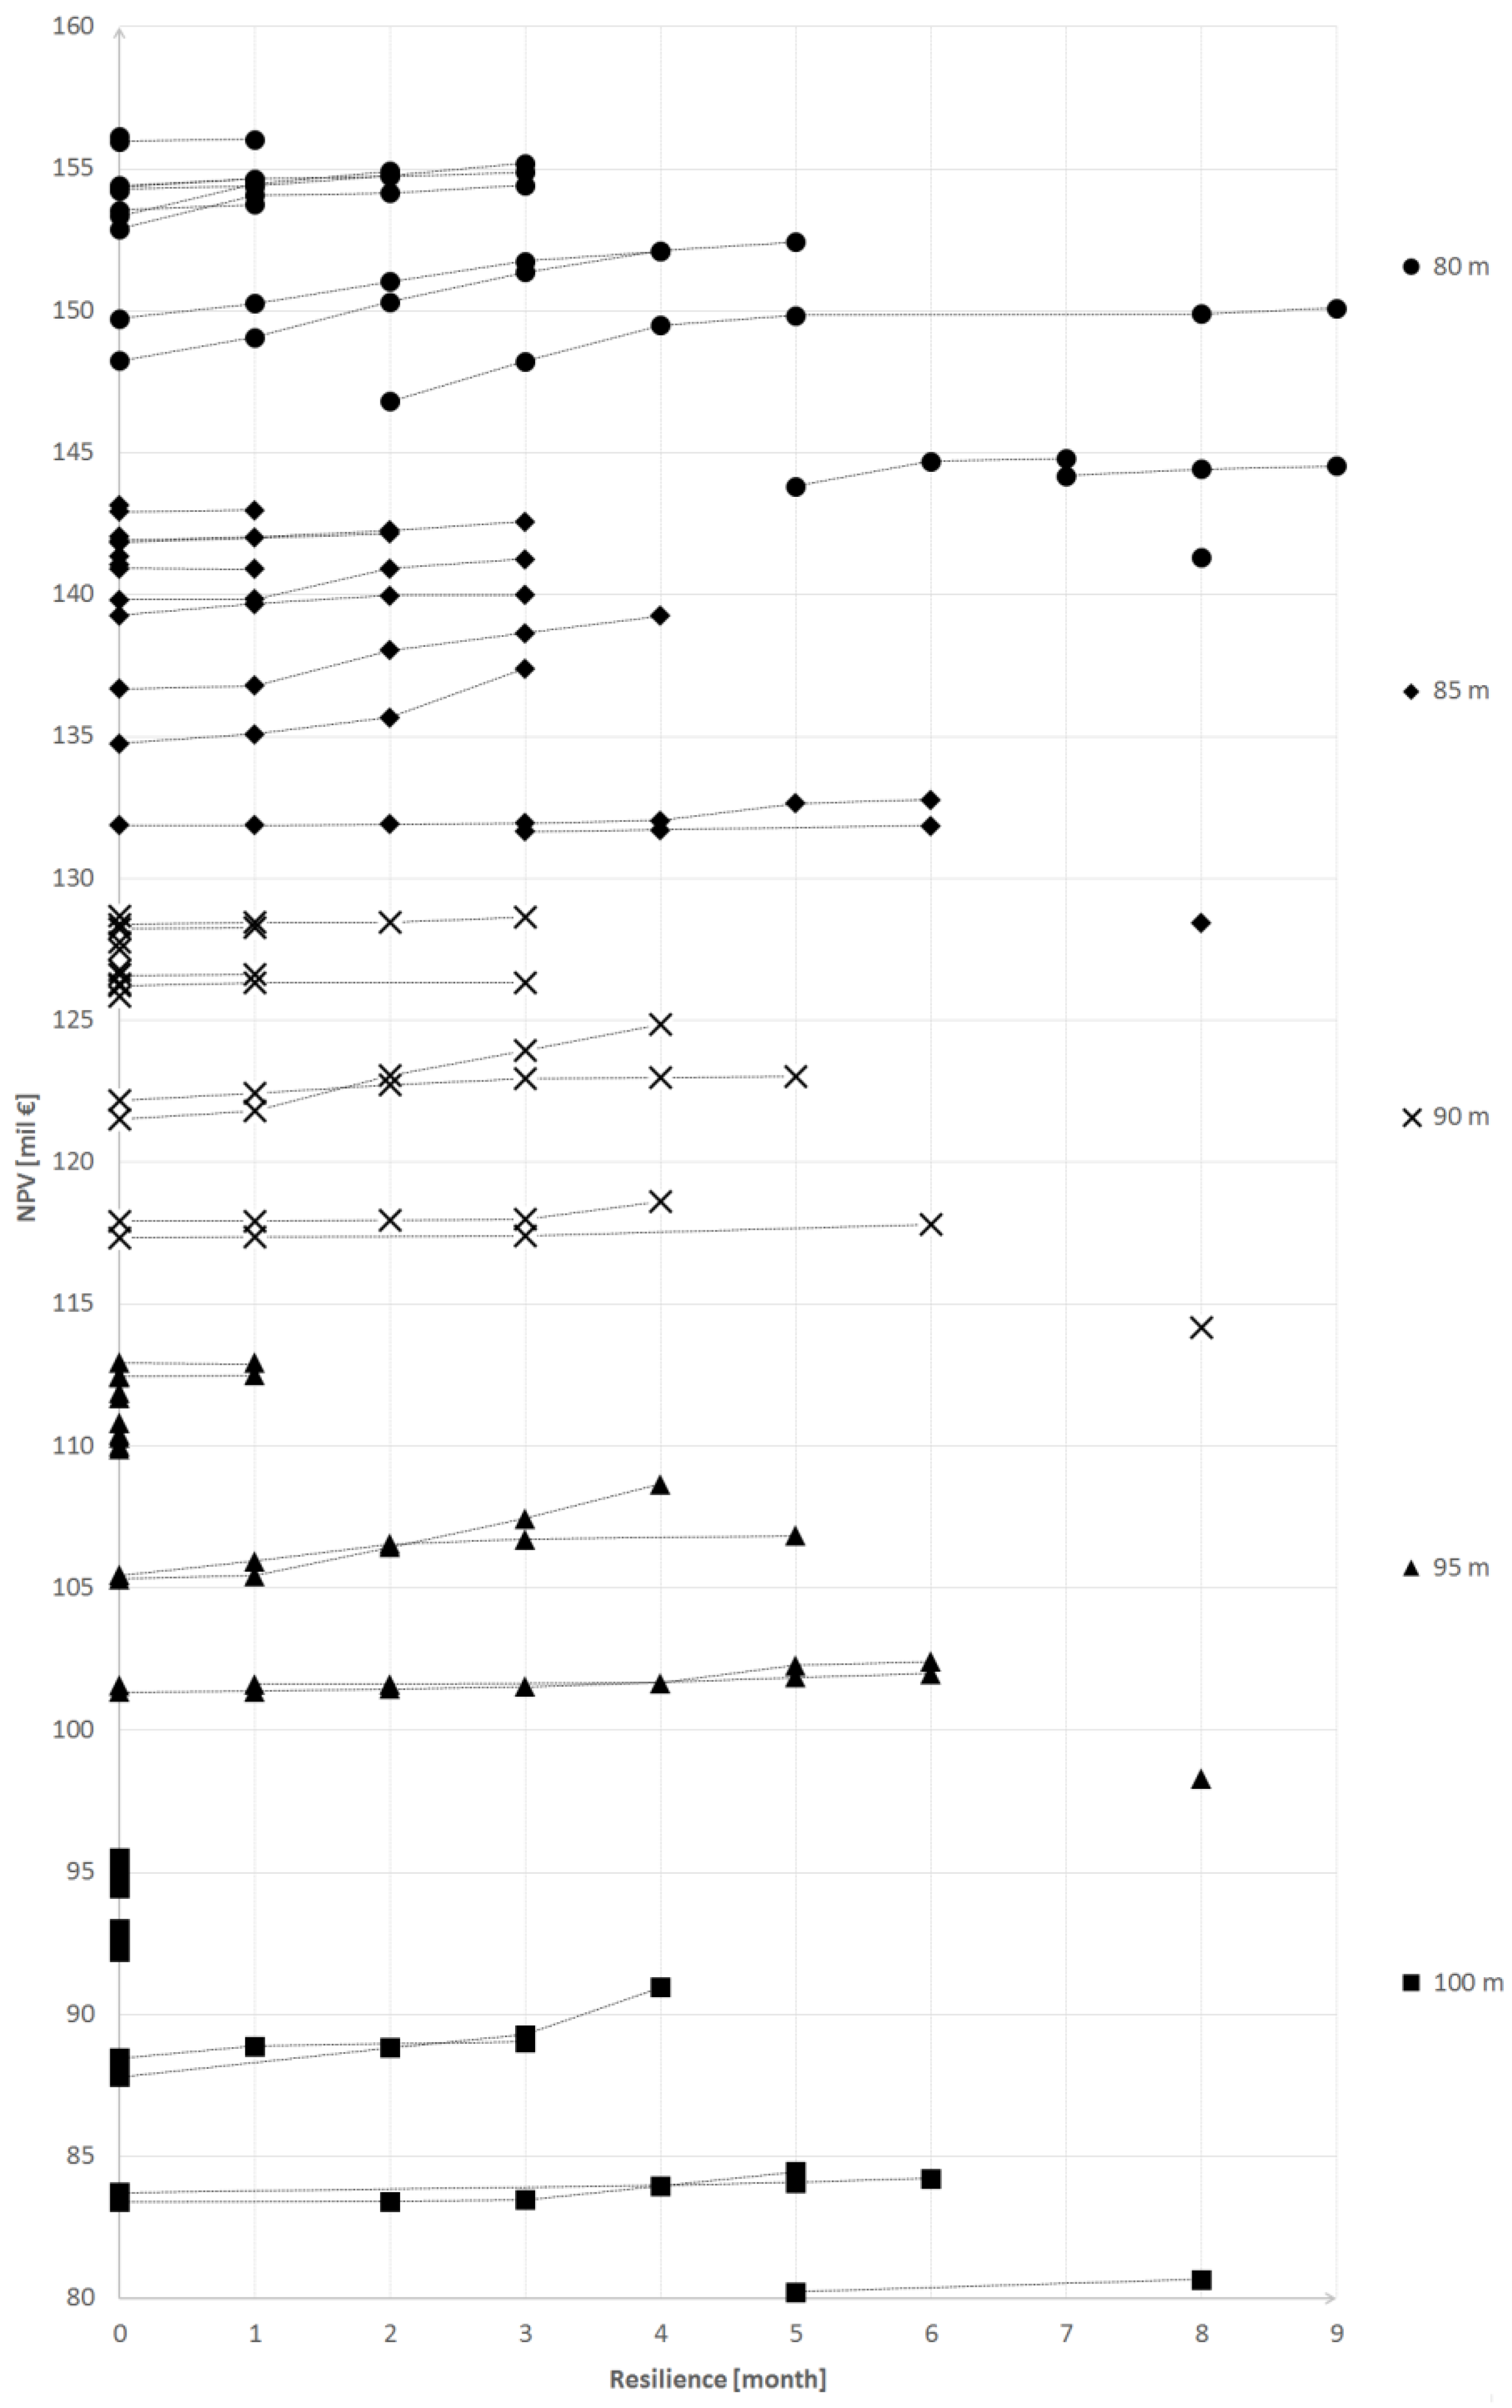
The obtained relation between resilience and NPV in the form of Pareto sets is in Figure 3. For each dam height, 15 climate scenarios from 2015 to 2100 were used from [63] for the planned profile.
Then each obtained point of these Pareto optimal sets presents the best solution and same a possible value of excess water QEXC (decision variables) or the total reservoir outflow QOUT. All these values can be applied to the design and operation of the dam.
Figure 3 shows increasing resilience (short deficit) in relation to reducing NPV. That means less resilient solution (longer deficit duration) representing higher NPV (higher benefits of the dam). Pareto sets are relatively flat (only slightly curved), this is mainly due to the setting of present prices for electric power and water supply. It could be expected that future water price increasing would make the Pareto sets more curved because the benefits will increase. Another factor that influences the shape of the Pareto sets could be the dam type.
As it can be seen from Figure 3, the results are better for the lower dam heights, as there are lower costs for construction of the dam. It is obvious that the increasing dam height increases the cost for construction of the dam, but benefits are lower than costs. Lower dam heights bring better results. In addition, building a bigger dam generally induces higher environmental costs, but it was not considered in this case study due to the difficult price quantification
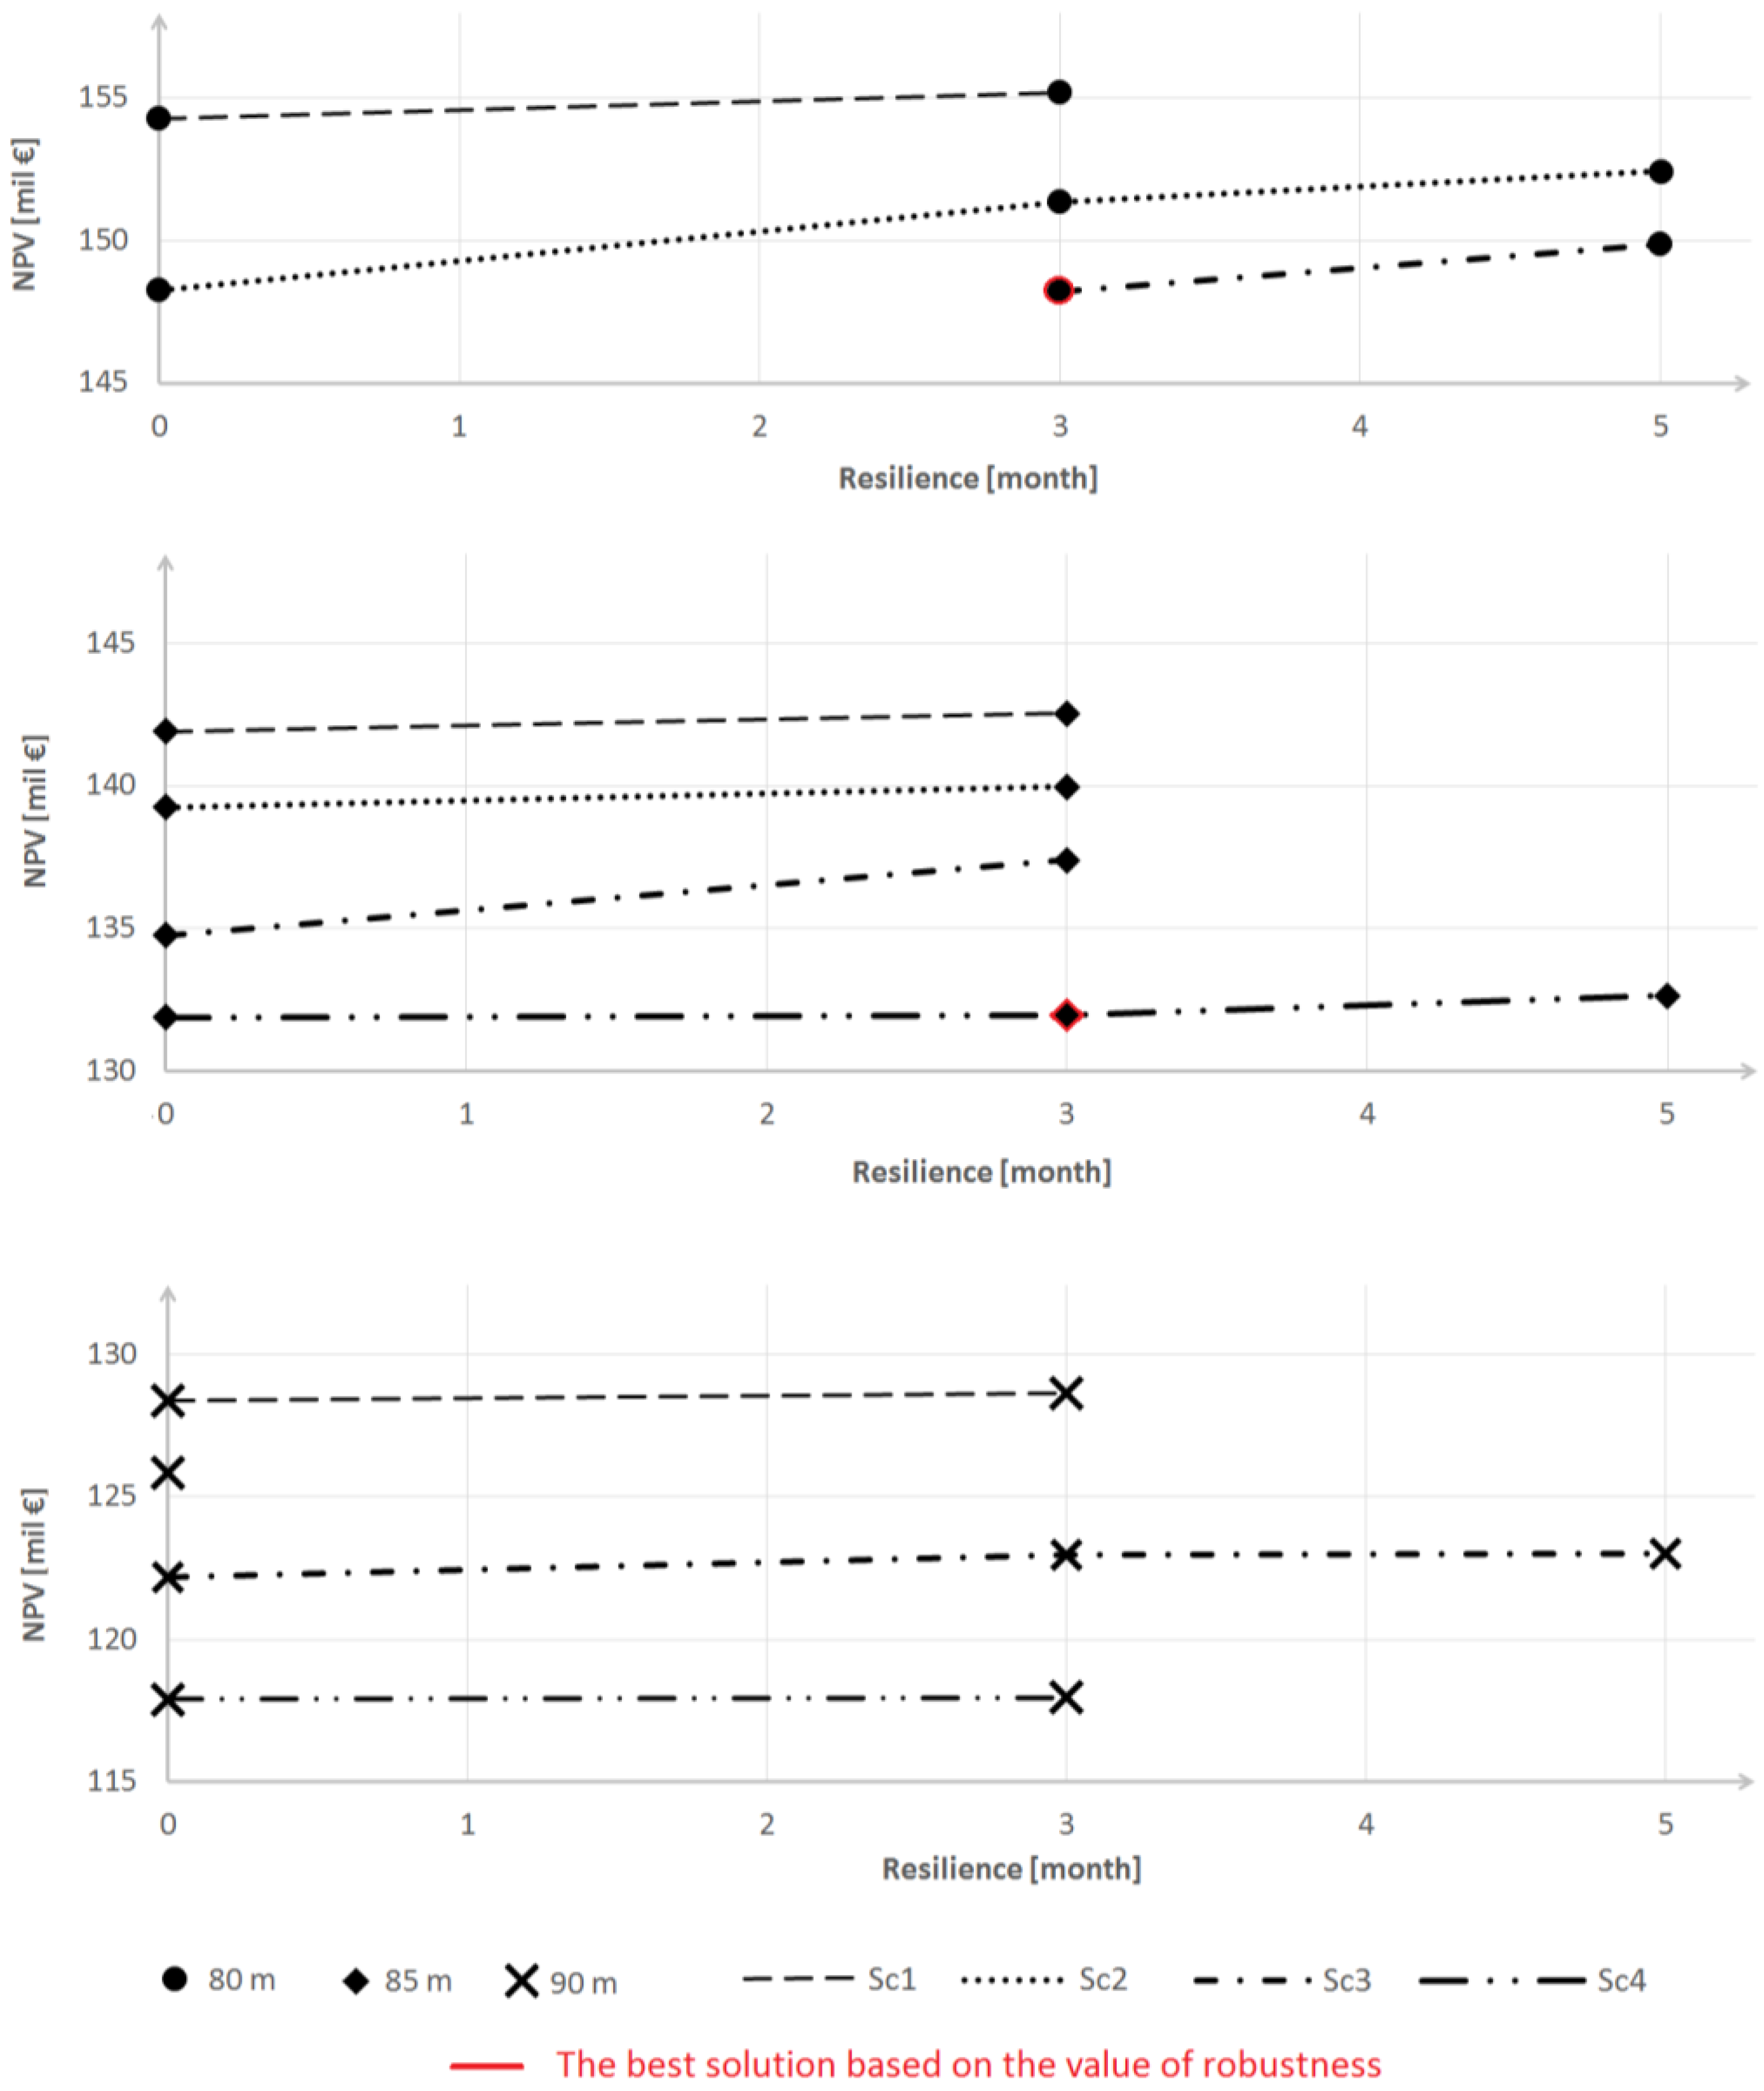
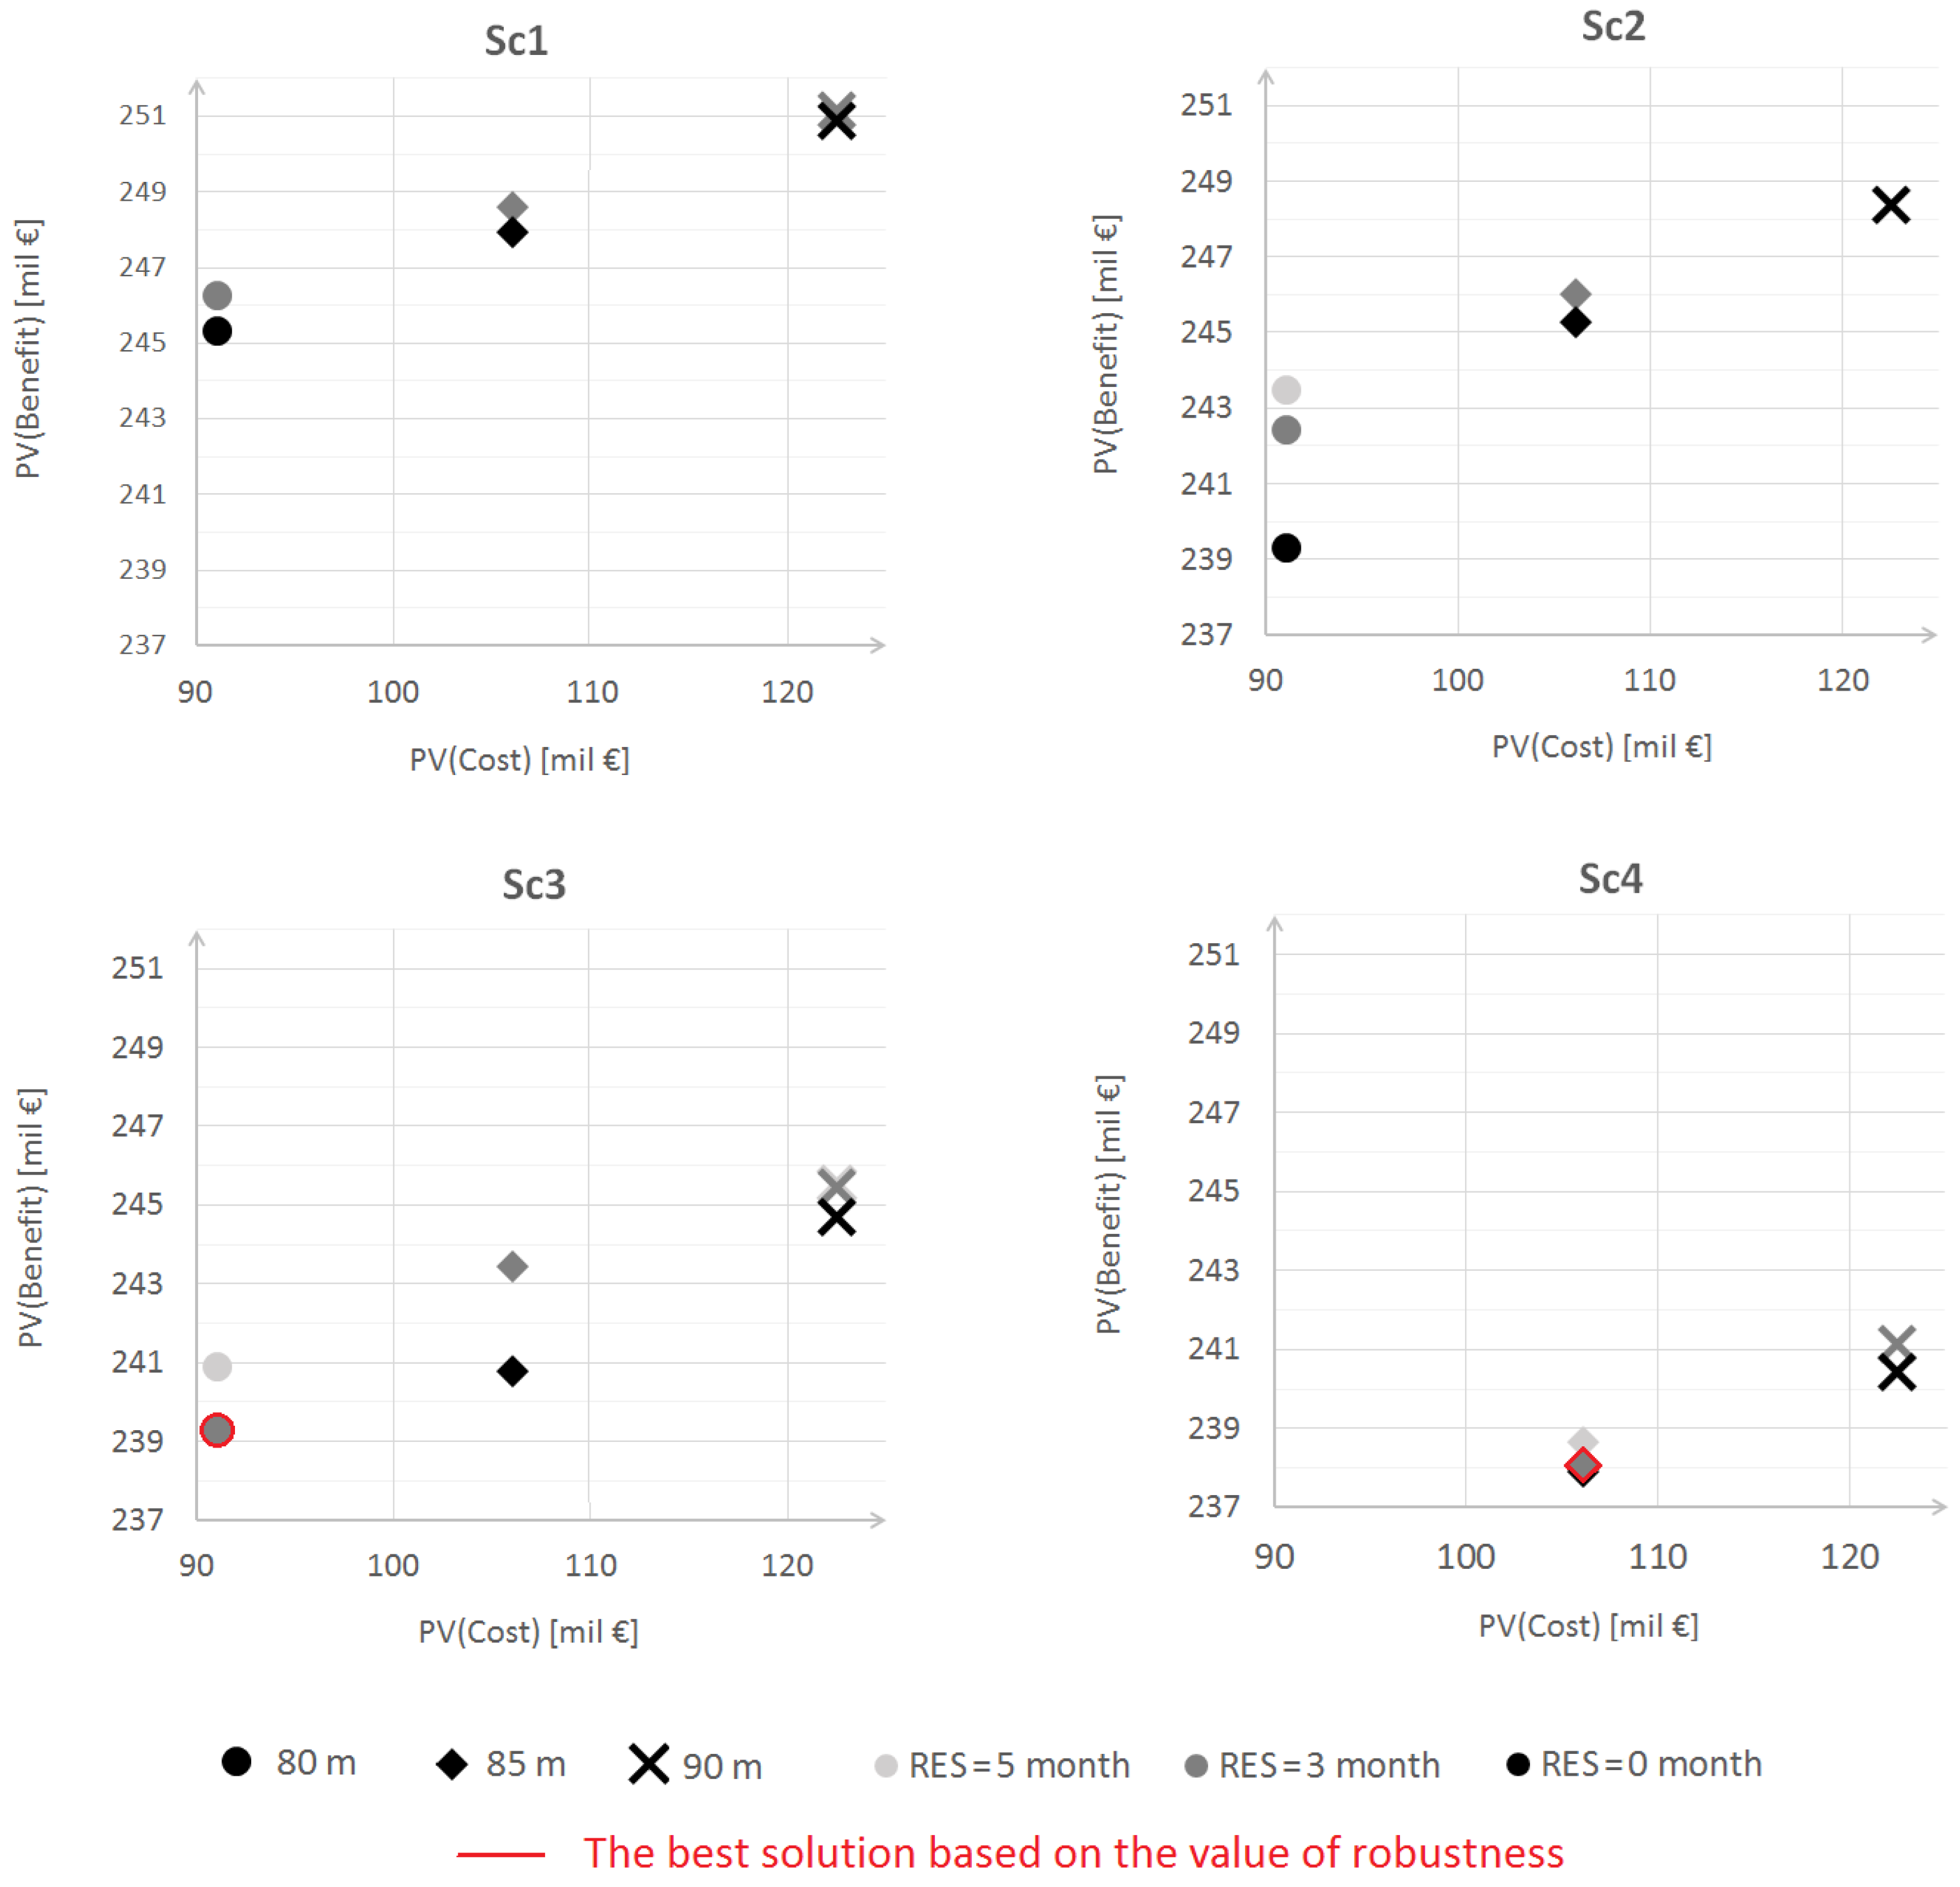
Only Pareto points with 0, 3, and 5 months of resilience, for the lower suitable dam heights of the 80 m, 85 m, and 90 m and only 4 from 15 climate scenarios with different mean annual flows Qa: as (Sc1) the most water (Qa = 2.29 m3 s−1), as (Sc2) more water (Qa = 2.17 m3 s−1), as (Sc3) less water (Qa = 2.09 m3 s−1), and as (Sc4) the least water (Qa = 1.84 m3 s−1) were chosen, see Figure 4.
Figure 4 shows the Pareto sets for lower dam heights of Figure 3 and only for selected climate scenarios Sc1, Sc2, Sc3, and Sc4. It is clear, that the more water scenarios (Sc1 and Sc2) produce higher the NPV, because the benefits are higher for the same cost and RES.
Figure 5 specifically shows the relation between the present value of benefit PV(benefit) and the present value of cost PV(cost) for the selected four climate scenarios with different mean annual flows Qa, resilience of the dam from 0 to 5 months and heights of dam 80, 85, and 90 m. As mentioned above, Figure 5 confirms that the more water scenarios (Sc1 and Sc2) cause higher the NPV (higher benefit) than less water scenarios (Sc3 and Sc4).
Lower points in Figure 5 are the points for the most resilient design of the dam (RES = 0 months) and the lowest benefits. The higher points refer to the lowest resilience (RES = 5 months) and the highest benefits.
The points in Figure 4 and Figure 5 mark the selected results which were chosen for testing of robustness. The results were in the form of decision variables (QEXC) achieved by optimization for four climatic scenarios. Then the decision variables were tested in the reservoir simulation model for 15 climatic scenarios and different dam heights variants to determine the resilience. After that robustness evaluation was finally made. The robustness was calculated as the fraction number of scenarios with RES = 3 months or less (5 months or less, 0 months) and the total number of climate scenarios, according to Equation (2). In Table 2, we can see the resulting robustness, and NPV for the points from Figure 4 and Figure 5 (RES = 0, 3, and 5 months or less).
In Table 2 we can see, if the decision variables for the less water scenarios (Sc3 and Sc4) are selected, than robustness for given solutions will be higher, because decision variables (QEXC) were lower than decision variables from the more water scenarios. According to Table 2, it is obvious that one of the best results is for the decision variables in Sc3, resilience RES ≤ 3 months, robustness ROB ≥ 80.0%, and then the dam height is 80.0 m. The average NPV is 147.8 mil. €, the cost of the construction of dam is 91.05 mil. €, and the benefits from the hydropower and water supply are on average 238.8 mil. €. The active storage capacity VA is 34.48 mil. m3 and total volume of the dam is 42.63 mil. m3.
Another optimal solution is for the decision variables in Sc4, RES ≤ 3 months and ROB ≥ 90.0%, and then the dam height is 85.0 m. The average NPV is 132.5 mil. €, the CDAM = 106.03 mil. €, and the BEN are on average 238.5 mil. €. The VA is 44.94 mil. m3 and total volume of the dam is 53.09 mil. m3. If we compare chosen results cost for construction, the dam in more robust solution will be about 15 mil. € (16.5%) more expensive than a less robust solution. Benefits are 0.3 mil. € (0.1%) lower and the NPV is lower about 15.3 mil. € (11.5%).
The results of the decision variables in form monthly water excess for hydropower QEXC and following the total reservoir outflow QOUT for each month and for ROB = 80.0% and 90.0% are presented in Table 3.
In Table 3 we can see that for ROB ≥ 80%, the dam height is only 80.0 m and water excess QEXC, and thus total reservoir outflow QOUT are higher than for the ROB ≥ 90%.
The decision variables (water excess QEXC) could increase in the future by the rise of water and electricity prices. The question is what the future evolution of water and electricity demand will be. The model is using only the long-term scenarios for hydrology changes and current prices for water and electricity. There is a huge amount of uncertainties in the prediction of water and electricity demands as well as market prices of these commodities in the upcoming decades. Thus, in future, it would be useful to add several future demands or socioeconomic scenarios. It should be noted that the climate scenarios in this study are based on only one conservative emission scenario A1B. Further, it could be very interesting to test the robustness effect on several percentage sets of an increase in water and electricity demand and increase in water and electricity prices for a given result.
6. Conclusions
This article describes a new possible attitude to support decision-making in the future for a new reservoir management within a decrease water resources scenario. A simulation model has been coupled with a cost model and an NSGA II multi-objective optimization algorithm to quantify resilience and robustness under a range of uncertain future climate supply scenarios and one possible demand scenario. The results obtained lead to the following key conclusions:
- The analysis of the different dam heights produced different recommendations for the multipurpose reservoir design. This approach has recommended a specific design of the dam height of 80 m for ROB = 80% and RES = 3 months or 85 m for ROB = 90% and RES = 3 months.
- As a result, recommended dam height, and also recommended total reservoir monthly outflows that, in combination with the control equations, determine new operational rules of a multipurpose water reservoir.
- The new operating rules have been created: The water management in the reservoir should be set according to the current month and recommended reservoir monthly outflows QOUT in Table 3. In the case of dry periods when the water level falls below level (I) or more as it is shown in Figure 1, the QOUT have to be restricted according to the control Equation (13) or (14).
- All potential resilience metrics are based on those in a past paper [14] which were tested in this analysis and gave similar shapes of Pareto sets, and therefore, the traditional metric of resilience with duration of the longest water deficit period was selected.
- The model clearly shows that the higher dam heights increase the cost for construction of the dam, but the benefits are lower than costs, therefore the results are better for lower dam height.
- Although, in the summer months, due to the higher water demands and lower flow in the river, the water excess is minimal or null, the minimal demand is guaranteed for targets resilience and robustness.
- A more robust solution generally produced lower benefits respectively lower NPV due to a lower water excess. Under the current conditions, it may seem as little profitable, but in the future, with the development of climate change uncertainty, the price of water is expected to increase, and the benefits will be higher.
- The key conclusions, based on the results obtained, serve only as recommendations, but a final decision on the safeness and economy of a new reservoir is on-site of decision-makers.
Based on the case study including climate scenarios, we can recommend using the created universal model considering drought prevention. This new approach to design and operation of the multipurpose reservoir in conditions of uncertain climate change has been tested on the case study and can be applicable to cases in similar conditions with the problem of decreasing water sources. However, several points of the methodological section are specific to the case study and cannot be generalized to all dams.
Author Contributions
S.P. performed the design, collected the data, made the calculations and analysis, and wrote the paper. Z.K. set the objectives of the optimization method, provided useful advice, contributed to the interpretation of results, and made a revision. D.M. helped with setting the reservoir simulation model, contributed to the interpretation of results, and text corrections.
Funding
This research was funded by [Design of the Flood Storage Capacity under Uncertainty Conditions] junior research project number [FAST-J-18-5044] and by [Climate Change Uncertainty Propagation in Hydrologic and Water Management Applications] research project number [FAST-S-18-5341].
Conflicts of Interest
The authors declare no conflict of interest.
References
- World Meteorological Organization. WMO Statement on the State of the Global Climate in 2017; Chairperson, Publications Board: Geneva, Switzerland, 2018; ISBN 978-92-63-11212-5. [Google Scholar]
- Czech Document: Příprava Realizace Opatření pro Zmírnění Negativních Dopadů Sucha a Nedostatku Vody. Meziresortní Komise VODA-SUCHO. 2015. Available online: http://eagri.cz/public/web/file/417667/_3_material_VLADA.pdf (accessed on 1 April 2018).
- Czech Government Document: Komplexní Studie Dopadů, Zranitelnosti a Zdrojů Rizik Souvisejících se Změnou Klimatu v ČR. 2015. EKOTOXA s.r.o.. Available online: https://www.mzp.cz/C1257458002F0DC7/cz/studie_dopadu_zmena_klimatu/$FILE/OEOK-Komplexni_studie_dopady_klima-20151201.pdf (accessed on 10 April 2018).
- Czech Government Document: Národní Akční Plán Adaptace na Změnu Klimatu. Ministerstvo Životního Prostředí. 2015. Available online: https://www.mzp.cz/C1257458002F0DC7/cz/narodni_akcni_plan_zmena_klimatu/$FILE/OEOK-NAP_cely_20170127.pdf (accessed on 3 April 2018).
- Czech Government Document: Strategie Přizpůsobení se Změně Klimatu v Podmínkách ČR. Ministerstvo Životního Prostředí. 2015. Available online: http://www.mzp.cz/C1257458002F0DC7/cz/zmena_klimatu_adaptacni_strategie/$FILE/OEOK-Adaptacni_strategie-20151029.pdf (accessed on 1 April 2018).
- Czech Technical Standard ČSN 75 2405 Reservoir Storage Capacity Analysis, ICS 93.160. Available online: http://seznamcsn.unmz.cz/Detailnormy.aspx?k=69792 (accessed on 3 April 2018).
- Kritskiy, S.N.; Menkel, M.F. Water Management Computations; GIMIZ: Leningrad, Russia, 1952. (In Russian) [Google Scholar]
- Hashimoto, T.; Stedinger, J.R.; Loucks, D.P. Reliability, resiliency, and vulnerability criteria for water resource system performance evaluation. Water Resour. Res. 1982, 18, 14–20. [Google Scholar] [CrossRef] [Green Version]
- Moy, W.-S.; Cohon, J.L.; ReVelle, C.S. A Programming Model for Analysis of the Reliability, Resilience, and Vulnerability of a Water Supply. Water Resour. Res. 1986, 22, 489–498. [Google Scholar] [CrossRef]
- Zhang, C.; Xu, B.; Li, Y.; Fu, G. Exploring the relationships among reliability, resilience, and vulnerability of water supply using many-objective analysis. J. Water Resour. Plan. Manag. 2017, 143. [Google Scholar] [CrossRef]
- Matrosov, E.S.; Padula, S.; Harou, J.J. Selecting portfolios of water supply and demand management strategies under uncertainty-contrasting economic optimisation and “Robust decision making” approaches. Water Resour. Manag. 2012, 27, 1123–1148. [Google Scholar] [CrossRef]
- Paton, F.L.; Dandy, G.C.; Maier, H.R. Integrated framework for assessing urban water supply security of systems with non-traditional sources under climate change. Environ. Model. Softw. 2014, 60, 302–319. [Google Scholar] [CrossRef]
- Fowler, H.J.; Kilsby, C.G.; O’Connell, P.E. Modeling the impacts of climatic change and variability on the reliability, resilience, and vulnerability of a water resource system. Water Resour. Res. 2003, 39, 1222. [Google Scholar] [CrossRef]
- Roach, T. Decision Making Methods for Water Resources Management Under Deep Uncertainty. Ph.D. Theses, University of Exeter, Exeter, UK, 2016. [Google Scholar]
- Roach, T.; Kapelan, Z.; Ledbetter, R. Comparison of Info-gap and Robust Optimisation Methods for Integrated Water Resource Management under Severe Uncertainty. Procedia Eng. 2015, 119, 874–883. [Google Scholar] [CrossRef] [Green Version]
- Watts, G.; Christierson, B.; Hannaford, J.; Lonsdale, K. Testing the resilience of water supply systems to long droughts. J. Hydraul. 2012, 414–415, 255–267. [Google Scholar] [CrossRef] [Green Version]
- Amarasinghe, P.; Liu, A.; Egodawatta, P.; Bernes, P.; McGree, J.; Goonetilleke, A. Quantitative assessment of resilience of a water supply system under rainfall reduction due to climate change. J. Hydraul. 2016, 540, 1043–1052. [Google Scholar] [CrossRef]
- Li, Y.; Lence, B.J. Estimating resilience for water resources systems. Water Resour. Res. 2007, 43, W07422. [Google Scholar] [CrossRef]
- Simonovic, S.P.; Arunkumar, R. Comparison of static and dynamic resilience for a multipurpose reservoir operation. Water Resour. Res. 2016, 52, 8630–8649. [Google Scholar] [CrossRef]
- Sweetapple, C.; Fu, G.; Butler, D. Reliable, Robust, and Resilient System Design Framework with Application to Wastewater-Treatment Plant Control. J. Environ. Eng. 2017, 143, 04016086. [Google Scholar] [CrossRef]
- Knight, F. Risk, Uncertainty and Profit; Hart, Schaffner & Marx: Boston, MA, USA; Houghton Mifflin Co.: Boston, MA, USA, 1921. [Google Scholar]
- Kaplan, S. Risk Assessment and Risk Management—Basic Concepts and Terminology. Risk Management: Expanding Horizons in Nuclear Power and other Industries; Hemisphere Publ. Corp.: Boston, MA, USA, 1991; pp. 11–28. [Google Scholar]
- Beven, K.J.; Binley, A.M. The future of distributed models: Model calibration and uncertainty prediction. Hydrol. Proceaaes 1992, 6, 279–298. [Google Scholar] [CrossRef]
- Mahmoud, M.; Liu, Y.; Hartmann, H.; Stewart, S.; Wagener, T.; Semmens, D.; Stewart, R.; Gupta, H.; Dominguez, D.; Dominguez, F.; et al. A formal framework for scenario development in support of environmental decision-making. Environ. Model. Softw. 2009, 24, 798–808. [Google Scholar] [CrossRef]
- Marton, D.; Paseka, S. Uncertainty Impact on Water Management Analysis of Open Water Reservoir. Environments 2017, 4, 10. [Google Scholar] [CrossRef]
- Marton, D.; Starý, M.; Menšík, P. Analysis of the influence of input data uncertainties on determining the reliability of reservoir storage capacity. J. Hydrol. Hydromech. 2015, 63, 287–294. [Google Scholar] [CrossRef] [Green Version]
- Marton, D.; Starý, M.; Menšík, P.; Paseka, S. Hydrological Reliability Assessment of Water Management Solution of Reservoir Storage Capacity in Conditions of Uncertainty. In Drought: Research and Science-Policy Interfacing; CRC Press Taylor & Francis Group: Leiden, The Netherlands, 2015; pp. 377–382. ISBN 978-1-138-02779-4. [Google Scholar]
- Paseka, S.; Marton, D.; Menšík, P. Uncertainties of reservoir storage capacity during low water period. In Proceedings of the SGEM International Multidisciplinary Geoconference: Hydrology and Water Resources; STEF92 Technology Ltd.: Sofia, Bulgaria, 2016; pp. 789–796, ISBN 978-619-7105-61-2. [Google Scholar]
- Vogel, R.M.; Bolognes, A. Storage-reliability-resilience-yield relations for over-year water supply systems. Water Resour. Res. 1995, 31, 645–654. [Google Scholar] [CrossRef]
- Jain, K.S.; Bhunya, K.P. Reliability, resilience and vulnerability of a multipurpose storage reservoir. Hydrol. Sci. J. 2008, 53, 434–447. [Google Scholar] [CrossRef]
- Ngo, L.L.; Madsen, H.; Rosbjerg, D. Simulation and optimisation modelling approach for operation of the Hoa Binh reservoir, Vietnam. J. Hydrol. 2007, 336, 269–281. [Google Scholar] [CrossRef]
- Villa, I.R.; Rodríguez, J.B.M.; Molina, J.L.; Tarragó, J.C.P. Multiobjective Optimization Modeling Approach for Multipurpose Single Reservoir Operation. Water 2018, 10, 427. [Google Scholar] [CrossRef]
- Scola, L.A.; Takahashi, R.H.C.; Cerqueira, S.A.A.G. Multipurpose Water Reservoir Management: An Evolutionary Multiobjective Optimization Approach. Math. Probl. Eng. 2014, 2014, 638259. [Google Scholar] [CrossRef]
- Groves, D.G.; Yates, D.; Tebaldi, C. Developing and applying uncertain global climate change projections for regional water management planning. Water Resour. Res. 2008, 44, W12413. [Google Scholar] [CrossRef]
- Herman, J.D.; Zeff, H.B.; Reed, P.M.; Characklis, G.W. Beyond optimality: Multistakeholder robustness tradeoffs for regional water portfolio planning under deep uncertainty. Water Resour. Res. 2014, 50, 7692–7713. [Google Scholar] [CrossRef] [Green Version]
- Beh, E.H.Y.; Maier, H.R.; Dandy, G.C. Adaptive, multiobjective optimal sequencing approach for urban water supply augmentation under deep uncertainty. Water Resour. Res. 2015, 51, 1529–1551. [Google Scholar] [CrossRef] [Green Version]
- Haasnoot, M.; Kwakkel, J.H.; Walker, W.E.; Maat, T.J. Dynamic adaptive policy pathways: A method for crafting robust decisions for a deeply uncertain world. Glob. Environ. Chang. 2013, 23, 485–498. [Google Scholar] [CrossRef] [Green Version]
- Jeuland, M.; Whittington, D. Water resources planning under climate change: Assessing the robustness of real options for the Blue Nile. Water Resour. Res. 2014, 50, 2086–2107. [Google Scholar] [CrossRef] [Green Version]
- Paton, F.L.; Maier, H.R.; Dandy, G.C. Including adaptation and mitigation responses to climate change in a multiobjective evolutionary algorithm framework for urban water supply systems incorporating GHG emissions. Water Resour. Res. 2014, 50, 6285–6304. [Google Scholar] [CrossRef] [Green Version]
- Roach, T.; Kapelan, Z.; Ledbetter, R.; Ledbetter, M. Comparison of Robust Optimization and Info-Gap Methods for Water Resource Management under Deep Uncertainty. J. Water Resour. Plan. Manag. 2017, 143. [Google Scholar] [CrossRef]
- Whateley, S.; Steinschneider, S.; Brown, C. A climate change range-based method for estimating robustness for water resources supply. Water Resour. Res. 2014, 50. [Google Scholar] [CrossRef]
- Borgomeo, E.; Mortazavi-Naeini, M.; Hall, J.W.; Guillod, B.P. Risk, Robustness and Water Resources Planning Under Uncertainty. Earth’s Future 2018, 6. [Google Scholar] [CrossRef]
- Deb, K.; Agrawal, S.; Pratap, A.; Meyarivan, T.; Amrit, P.; Meyarivan, T. A Fast Elitist Non-Dominated Sorting Genetic Algorithm for Multi-Objective Optimization: NSGA-II; Schoenauer, M., Deb, K., Rudolph, G., Yao, X., Lutton, E., Merelo, J.J., Schwefel, H.-P., Eds.; Parallel Problem Solving from Nature PPSN VI; Springer: Berlin/Heidelberg, Germany, 2000; pp. 849–858. [Google Scholar]
- Kollat, J.B.; Reed, P.M. Comparing state-of-the-art evolutionary multiobjective algorithms for long-term groundwater monitoring design. Adv. Water Res. 2006, 29, 792–807. [Google Scholar] [CrossRef]
- Nicklow, J.; Reed, P.; Savic, D.; Dessalegne, T.; Harrell, L.; Chan-Hilton, A.; Karamouz, M.; Minsker, B.; Ostfeld, A.; Singh, A.; et al. State of the art for genetic algorithms and beyond in Water resources planning and management. J. Water Resour. Plan. Manag. 2010, 136, 412–432. [Google Scholar] [CrossRef]
- Tukimat, N.N.A.; Harun, S. Optimization of water supply reservoir in the framework of climate variation. Inter. J. Softw. Eng. Appl. 2014, 8, 361–378. [Google Scholar] [CrossRef]
- Fu, G.; Kapelan, Z.; Kasprzyk, J.R.; Reed, P. Optimal Design of Water Distribution Systems Using Many-Objective Visual Analytics. J. Water Resour. Plan. Manag. 2013, 139. [Google Scholar] [CrossRef]
- Perelman, L.; Ostfeld, A.; Salomons, E. Cross Entropy multiobjective optimization for water distribution systems design. Water Resour. Res. 2008, 44. [Google Scholar] [CrossRef] [Green Version]
- Zheng, F.; Simpson, A.R.; Zecchin, A.C. An efficient hybrid approach for multiobjective optimization of water distribution systems. Water Resour. Res. 2014, 50. [Google Scholar] [CrossRef]
- Yang, G.; Guo, S.; Liu, P.; Li, L.; Liu, Z. Multiobjective Cascade Reservoir Operation Rules and Uncertainty Analysis Based on PA-DDS Algorithm. J. Water Resour. Plan. Manag. 2017, 143. [Google Scholar] [CrossRef]
- Srinivas, N.; Deb, K. Muiltiobjective Optimization Using Nondominated Sorting in Genetic Algorithms. Evol. Comput. 1994, 2, 221–248. [Google Scholar] [CrossRef] [Green Version]
- Goldberg, D.E. Genetic Algorithms in Search, Optimization, and Machine Learning; Addison-Wesley Publishing Company: Reading, MA, USA, 1989; ISBN 0-201-15767-5. [Google Scholar]
- Marton, D.; Kapelan, Z. Risk and reliability analysis of open reservoir water shortages using optimization. Procedia Eng. 2014, 89, 1478–1485. [Google Scholar] [CrossRef]
- Savić, D.A.; Bicik, J.; Morley, M.S. A DSS Generator for Multiobjective Optimisation of Spreadsheet-Based Models. Environ. Model. Softw. 2011, 26, 551–561. [Google Scholar] [CrossRef] [Green Version]
- Borgomeo, E.; Hall, J.W.; Fung, F.; Watts, G.; Colquhoun, K.; Lambert, C. Risk-based water resources planning: Incorporating probabilistic nonstationary climate uncertainties. Water Resour. Res. 2014, 50, 6850–6873. [Google Scholar] [CrossRef] [Green Version]
- Deepashree, R.; Mujumdar, P.P. Reservoir performance under uncertainty in hydrologic impacts of climate change. Adv. Water Res. 2010, 33, 312–326. [Google Scholar] [CrossRef]
- Kling, H.; Stanzel, P.; Preishuber, M. Impact modelling of water resources development and climate scenarios on Zambezi River discharge. J. Hydrol. 2014, 1, 17–43. [Google Scholar] [CrossRef]
- Majone, B.; Bovolo, C.I.; Bellin, A.; Blenkinsop, S.; Fowler, H.J. Modeling the impacts of future climate change on water resources for the Gállego river basin (Spain). Water Resour. Res. 2012, 48, W01512. [Google Scholar] [CrossRef]
- Mantel, S.K.; Hughes, D.A.; Slaughter, A.S. Water resources management in the context of future climate and development changes: A South African case study. J. Water Clim. Chang. 2015, 6, 772–786. [Google Scholar] [CrossRef]
- Maiolo, M.; Mendicino, G.; Senatore, A.; Pantusa, D. Optimization of drinking water distribution systems in relation to the effects of climate change. Water 2017, 9, 803. [Google Scholar] [CrossRef]
- Kapelan, Z.; Savić, D.; Mahmoud, H. A Response Methodology for Reducing Impacts of Failure Events in Water Distribution Networks. Procedia Eng. 2017, 186, 218–227. [Google Scholar] [CrossRef]
- IPCC Secretariat. Climate Change 2007: Impacts, Adaptation and Vulnerability: Summary for Policymakers; IPCC Secretariat: Geneva, Switzerland, 2007; ISBN 92-9169-121-6. [Google Scholar]
- Czech Project. Development of Information and Data Support for Design of Adaptation Measures and Long-Term Planning of Water Resources Considering the Climate Change Effects; T. G. Masaryk Water Research Institute: Praha, Czech Republic; Czech Hydro-Meteorological Institute: Praha, Czech Republic; Water Management Development, RSCN: Jubeiha, Jordan, 2012–2014. [Google Scholar]
- Czech Document PRVKUK. The Plan for the Development of Water Supply and Sewerage Systems in the Olomouc Region; The Regional Office of the Olomouc Region, Ministry of Agriculture of the Czech Republic: Olomouc, Czech Republic, 2006. [Google Scholar]
- Klemeš, V. A simlified solution of the flood-routing problem. Vodohosp. Časopis 1960, 8, 317–326. [Google Scholar]
- Government Finance Function. The Green Book: Appraisal and Evaluation in Central Government; Government Finance Function: London, UK, 2016.
- Czech Property Valuation Decree. Vyhlaska č. 441/2013 Sb., Vyhlaska k Provedeni Zakona o Ocenovani Majetku; Ministry of Finance of the Czech Republic: Praha, Czech Republic, 2013.
- Starý, M. Reservoir and Reservoir System; Education Tutorial, Faculty of Civil Engineering, Brno University of Technology: Brno, Czech Republic, 2006. [Google Scholar]
Figure 1.
The locality of the plan reservoir to be built in the future.

Figure 2.
The scheme of the model set up.

Figure 3.
The Pareto optimal sets for resilience vs. NPV for varying dam heights and all scenarios.

Figure 4.
The Pareto optimal sets from four selected climatic scenarios for resilience vs. NPV.

Figure 5.
The relations between PV (benefit) and PV (cost) for selected climate scenarios.


Table 1.
Potential monthly water demands.
| Demands [m3 s−1] | January | February | March | April | May | June | July | August | September | October | November | December |
|---|---|---|---|---|---|---|---|---|---|---|---|---|
| QECO | 0.54 | 0.54 | 0.54 | 0.54 | 0.54 | 0.54 | 0.54 | 0.54 | 0.54 | 0.54 | 0.54 | 0.54 |
| QWS:drink. | 0.54 | 0.56 | 0.56 | 0.58 | 0.58 | 0.60 | 0.56 | 0.55 | 0.55 | 0.56 | 0.55 | 0.53 |
| QWS:ind.+agric. | 0.35 | 0.35 | 0.36 | 0.37 | 0.38 | 0.40 | 0.40 | 0.40 | 0.38 | 0.36 | 0.35 | 0.35 |
| Total Demand | 1.43 | 1.45 | 1.46 | 1.49 | 1.50 | 1.54 | 1.50 | 1.49 | 1.47 | 1.46 | 1.44 | 1.42 |
Table 2.
Robustness for selected points.
| Height 80.0 m | Height 85.0 m | Height 90.0 m | |||||||||||
| CDAM [mil. €] | 91.05 | 106.03 | 122.51 | ||||||||||
| VA [m3] | 34,480,000 | 44,940,000 | 57,270,000 | ||||||||||
| RES [month] | Scenario: | Sc1 | Sc2 | Sc3 | Sc4 | Sc1 | Sc2 | Sc3 | Sc4 | Sc1 | Sc2 | Sc3 | Sc4 |
| 0 | ROB [%] | 66.7 | 73.3 | - | - | 66.7 | 73.3 | 80.0 | 93.3 | 66.7 | 66.7 | 80.0 | 93.3 |
| ⌀ NPV [mil. €] | 151.4 | 147.3 | - | - | 138.0 | 137.2 | 134.3 | 132.2 | 123.5 | 123.4 | 121.6 | 118.5 | |
| 3 | ROB [%] | 53.3 | 73.3 | 80.0 | - | 60.0 | 66.7 | 73.3 | 93.3 | 66.7 | - | 73.3 | 93.3 |
| ⌀ NPV [mil. €] | 151.0 | 149.7 | 147.8 | - | 137.9 | 138.1 | 137.1 | 132.5 | 123.5 | - | 122.8 | 118.6 | |
| 5 | ROB [%] | - | 60.0 | 60.0 | - | - | - | - | 80.0 | - | - | 66.7 | - |
| ⌀ NPV [mil. €] | - | 150.9 | 149.8 | - | - | - | - | 134.3 | - | - | 123.1 | - | |
Table 3.
Selected optimal results of the monthly water excess QEXC and the total reservoir monthly outflow QOUT for two target levels of ROB.
Table 3.
Selected optimal results of the monthly water excess QEXC and the total reservoir monthly outflow QOUT for two target levels of ROB.
| January | February | March | April | May | June | July | August | September | October | November | December | ||
|---|---|---|---|---|---|---|---|---|---|---|---|---|---|
| ROB ≥ 80% (h = 80 m) | QEXC [m3 s−1] | 0.93 | 1.12 | 0.06 | 0.00 | 0.13 | 0.00 | 0.00 | 0.01 | 0.00 | 0.00 | 0.00 | 0.02 |
| QOUT [m3 s−1] | 2.36 | 2.57 | 1.52 | 1.49 | 1.63 | 1.54 | 1.50 | 1.50 | 1.47 | 1.46 | 1.44 | 1.44 | |
| ROB ≥ 90% (h = 85 m) | QEXC [m3 s−1] | 0.18 | 0.01 | 0.00 | 0.01 | 0.00 | 0.00 | 0.00 | 0.00 | 0.00 | 0.00 | 0.09 | 0.02 |
| QOUT [m3 s−1] | 1.61 | 1.46 | 1.46 | 1.50 | 1.50 | 1.54 | 1.50 | 1.49 | 1.47 | 1.46 | 1.53 | 1.44 | |
© 2018 by the authors. Licensee MDPI, Basel, Switzerland. This article is an open access article distributed under the terms and conditions of the Creative Commons Attribution (CC BY) license (http://creativecommons.org/licenses/by/4.0/).
Share and Cite
MDPI and ACS Style
Paseka, S.; Kapelan, Z.; Marton, D. Multi-Objective Optimization of Resilient Design of the Multipurpose Reservoir in Conditions of Uncertain Climate Change. Water 2018, 10, 1110. https://doi.org/10.3390/w10091110
AMA Style
Paseka S, Kapelan Z, Marton D. Multi-Objective Optimization of Resilient Design of the Multipurpose Reservoir in Conditions of Uncertain Climate Change. Water. 2018; 10(9):1110. https://doi.org/10.3390/w10091110
Chicago/Turabian StylePaseka, Stanislav, Zoran Kapelan, and Daniel Marton. 2018. "Multi-Objective Optimization of Resilient Design of the Multipurpose Reservoir in Conditions of Uncertain Climate Change" Water 10, no. 9: 1110. https://doi.org/10.3390/w10091110
Note that from the first issue of 2016, this journal uses article numbers instead of page numbers. See further details here.