Quantity and Quality of Surface and Subsurface Runoff from an Eroded Loess Slope Used for Agricultural Purposes

Department of Environmental Engineering and Geodesy, University of Life Sciences in Lublin, Leszczyńskiego 7, 20-069 Lublin, Poland
Water 2018, 10(9), 1132; https://doi.org/10.3390/w10091132
Submission received: 27 July 2018
/
Revised: 18 August 2018
/
Accepted: 20 August 2018
/
Published: 24 August 2018
(This article belongs to the Special Issue Freshwater Quality as a Driver of Aquatic Ecosystem Health)
Abstract
:The purpose of the work was to determine the surface and subsurface water runoff and selected constituents of the matter contained and carried out from the eroded loess slope used as arable land. The research was carried out in 2008–2011 on the Lublin Upland. The quantity of water flowing out of the slope was measured and samples were collected in order to determine the concentration of the soil suspension of nitrogen and its forms as well as phosphorus and potassium. Soil tests were also carried out and the rainfall amount and intensity was monitored. The research results show that the amount of precipitation was significantly statistically correlated with the quantity of surface and subsurface water runoff and with the precipitation and surface runoff erosion indicator EI30 (correlations at the level of r = 0.75–0.78). In addition, the mass of eroded soil was strongly correlated with the erosion indicator of rain and surface runoff EI30 (r = 0.86). The annual soil losses were from 21.1 to 173.1 Mg ha−1. The concentration of chemical components dissolved in the surface and subsurface runoff water in most cases proved to be negatively statistically correlated with the amount of precipitation and indicator EI30. The correlation coefficients (r) were at levels from −0.32 to −0.52. The annual loss of nutrients caused by chemical erosion was: nitrogen 7.210–29.949 kg ha−1, phosphorus 0.846–5.279 kg ha−1 and potassium 7.065–21.660 kg ha−1. The highest intensity of water erosion was recorded in 2010, when root crops were grown in the field.
1. Introduction
The water erosion of soils, understood as a physical process consisting of the separation of the soil particles from the ground as a result of the impact of rain or flowing water and their transfer to sedimentation sites, has long been the subject of scientific research. The published results of studies on soil erosion clearly indicate that this is a destructive process, which transforms the relief and structure of soil profiles (sometimes leading to deeper layers or ravine erosion) [1,2,3]. It leads to the impoverishment of soils in humus compounds and nutrients for plants [4,5,6], the deterioration of the physicochemical properties of soils [7,8,9,10], and in the end, to lower productivity [11,12,13] and decreased crop yields [14,15,16]. The nutrients that are washed out as a result of erosion processes enter the surface water, causing pollution and eutrophication [17,18,19,20]. Incorrectly used soil easily undergoes erosive degradation [21], and reconstructing its original state is difficult, sometimes even impossible, because soil-forming processes are very slow [22,23]. Soils developed from loess belong to the most fertile soils in the world [24], but they are characterized by potentially high susceptibility to water erosion [25]. Research on soil erosion carried out in the belt of loess uplands of Poland is concerned with many aspects, e.g., the assessment of erosion size, determination of the intensity and range of erosion, conducting agrotechnical operations, erosion protection, erosion control, spatial management, and erosion process modeling [26,27,28,29,30]. Studies within the slope environment that regard quantitative–qualitative surface and subsurface water runoff along with constituents of matter are significantly less common in the scientific literature [31]. Studying the above issues in the loess areas of the Lublin Upland, under conditions of a strong threat of water erosion and intensive agricultural economy, will contribute to better recognition of the functioning of fluvial transport, allowing for the introduction of rational farming consistent with the principles of sustainable development.
The paper presents the empirical results of research from 2008–2011, carried out in natural conditions on the Lublin Upland, regarding quantity and quality of surface and subsurface water runoff as well as selected components of matter in an area of eroded loess slope used as arable land.
2. Material and Methods
2.1. Research Object
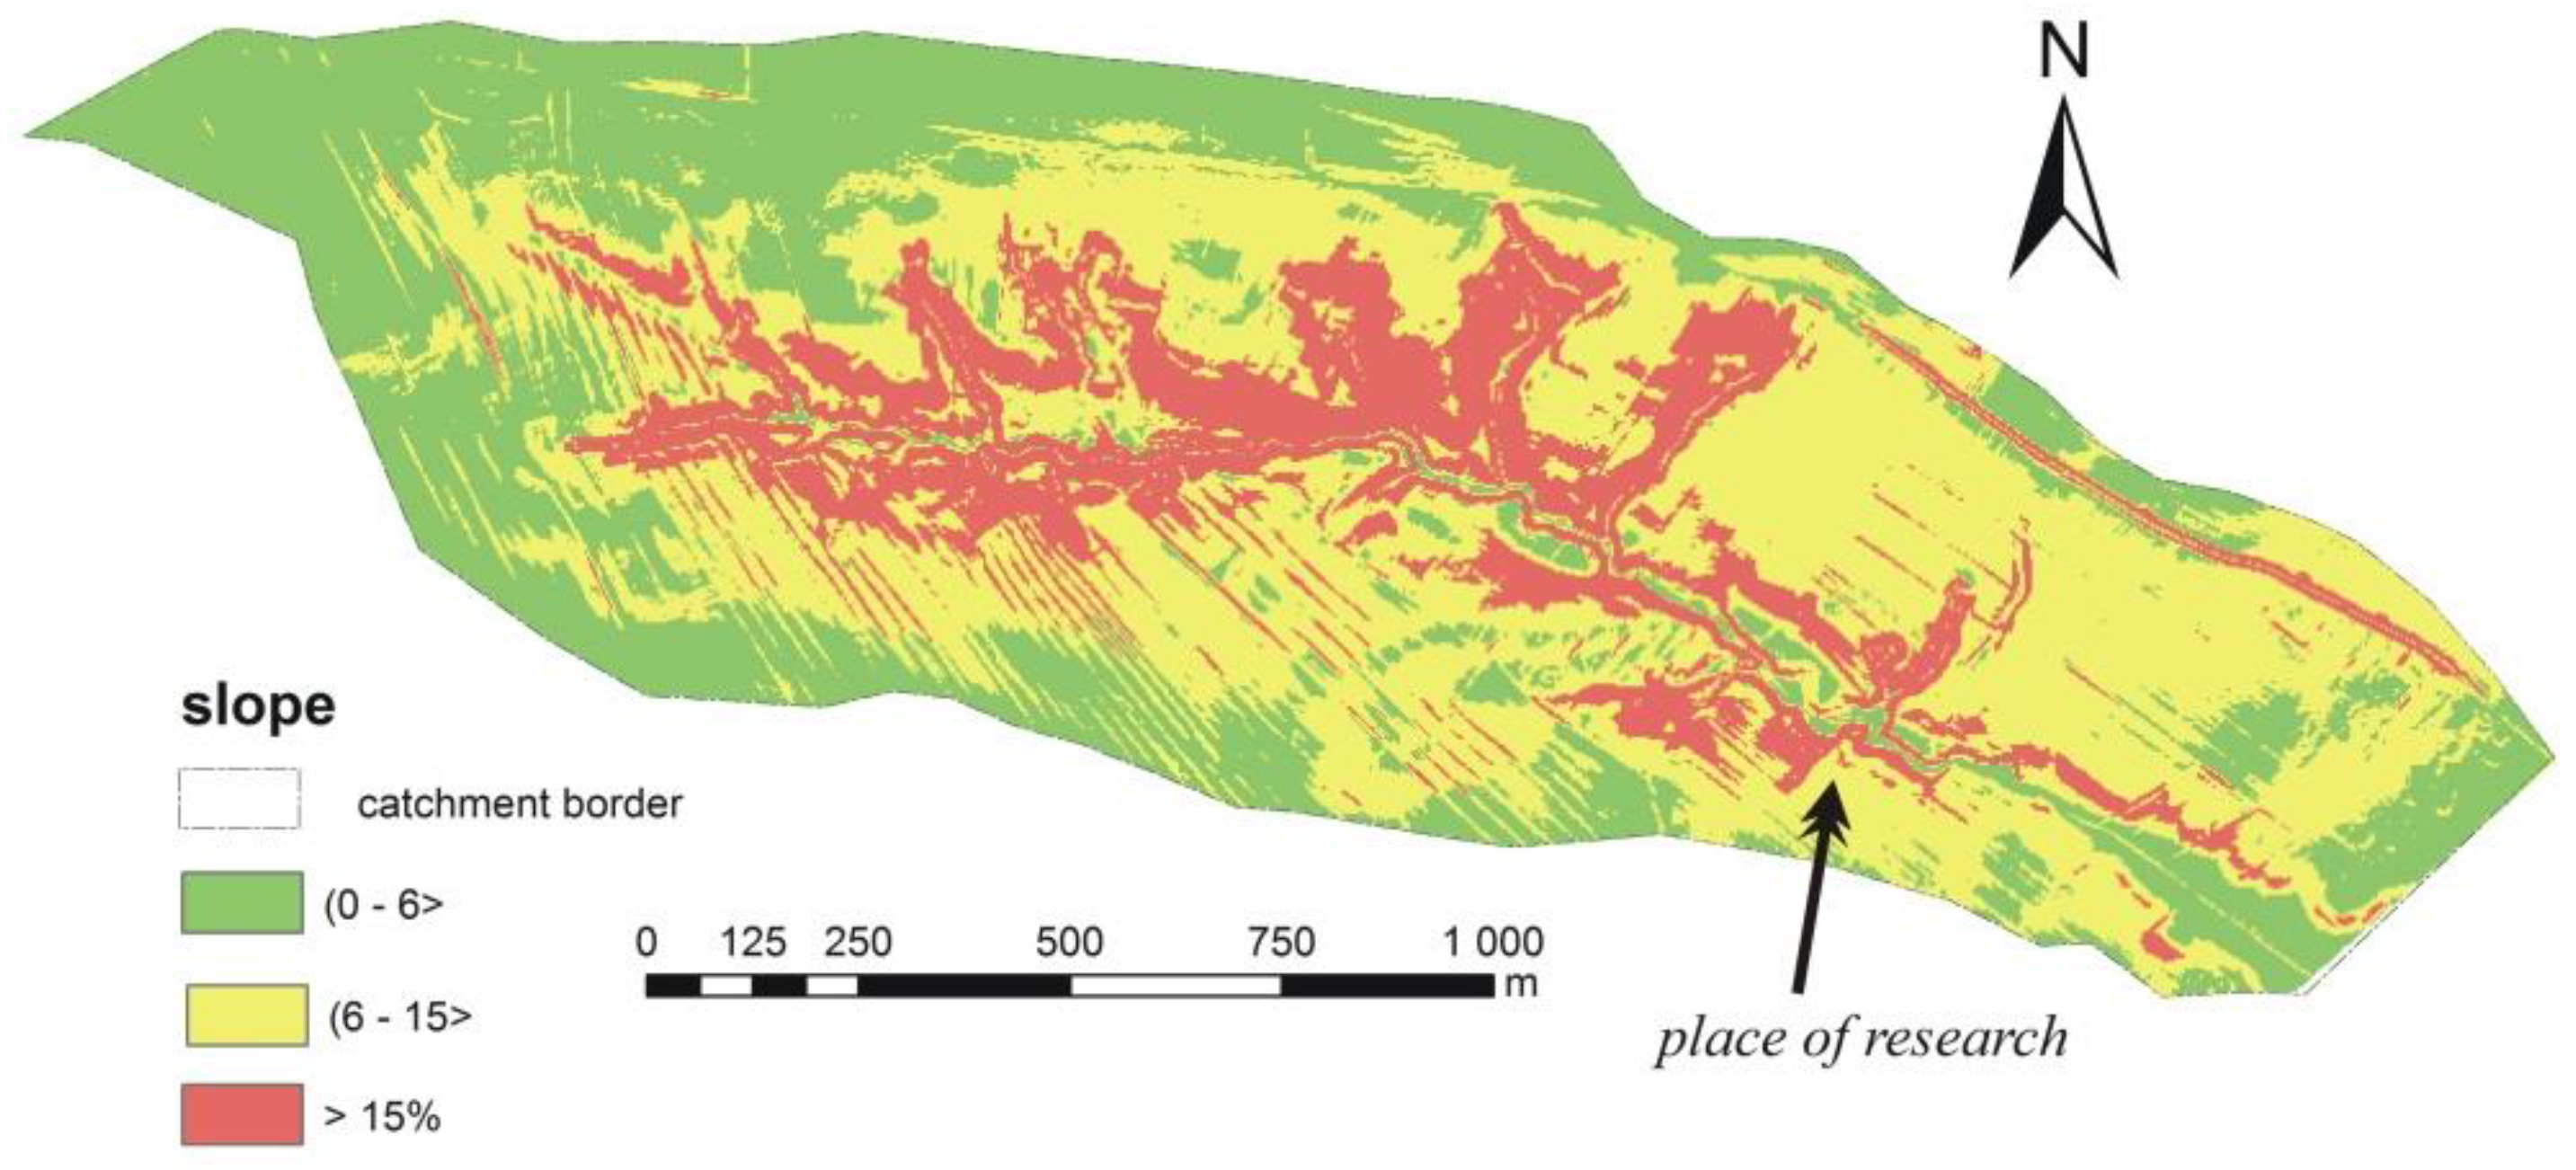
The research was carried out in the area of a small loess catchment on arable lands in Wielkopole (Figure 1) (50°57′26″ N, 23°01′01″ E), located in the eastern part of the mesoregion Wyniosłość Giełczewska (Lublin Upland) [32]. The catchment area is 188.5 ha, its length is 2550 m, and the maximum width reaches up to 850 m. In terms of the surface shape, it is a typical eroded catchment of the Lublin Upland, with soils made of loess, covering a thickness of a few to approximately a dozen meters of Cretaceous rocks that are well visible in the bottom of the soil profile in deep gorge gaps. The highest point in the catchment is 280 m above sea level, and the lowest point is 205 m above sea level. Denivelations reach up to 35 m and the maximum inclinations on the slopes reach 35%. Over 79% of the catchment area is used for agricultural purposes. The direction of the main valley runs from west to east [33].
2.2. Water Research
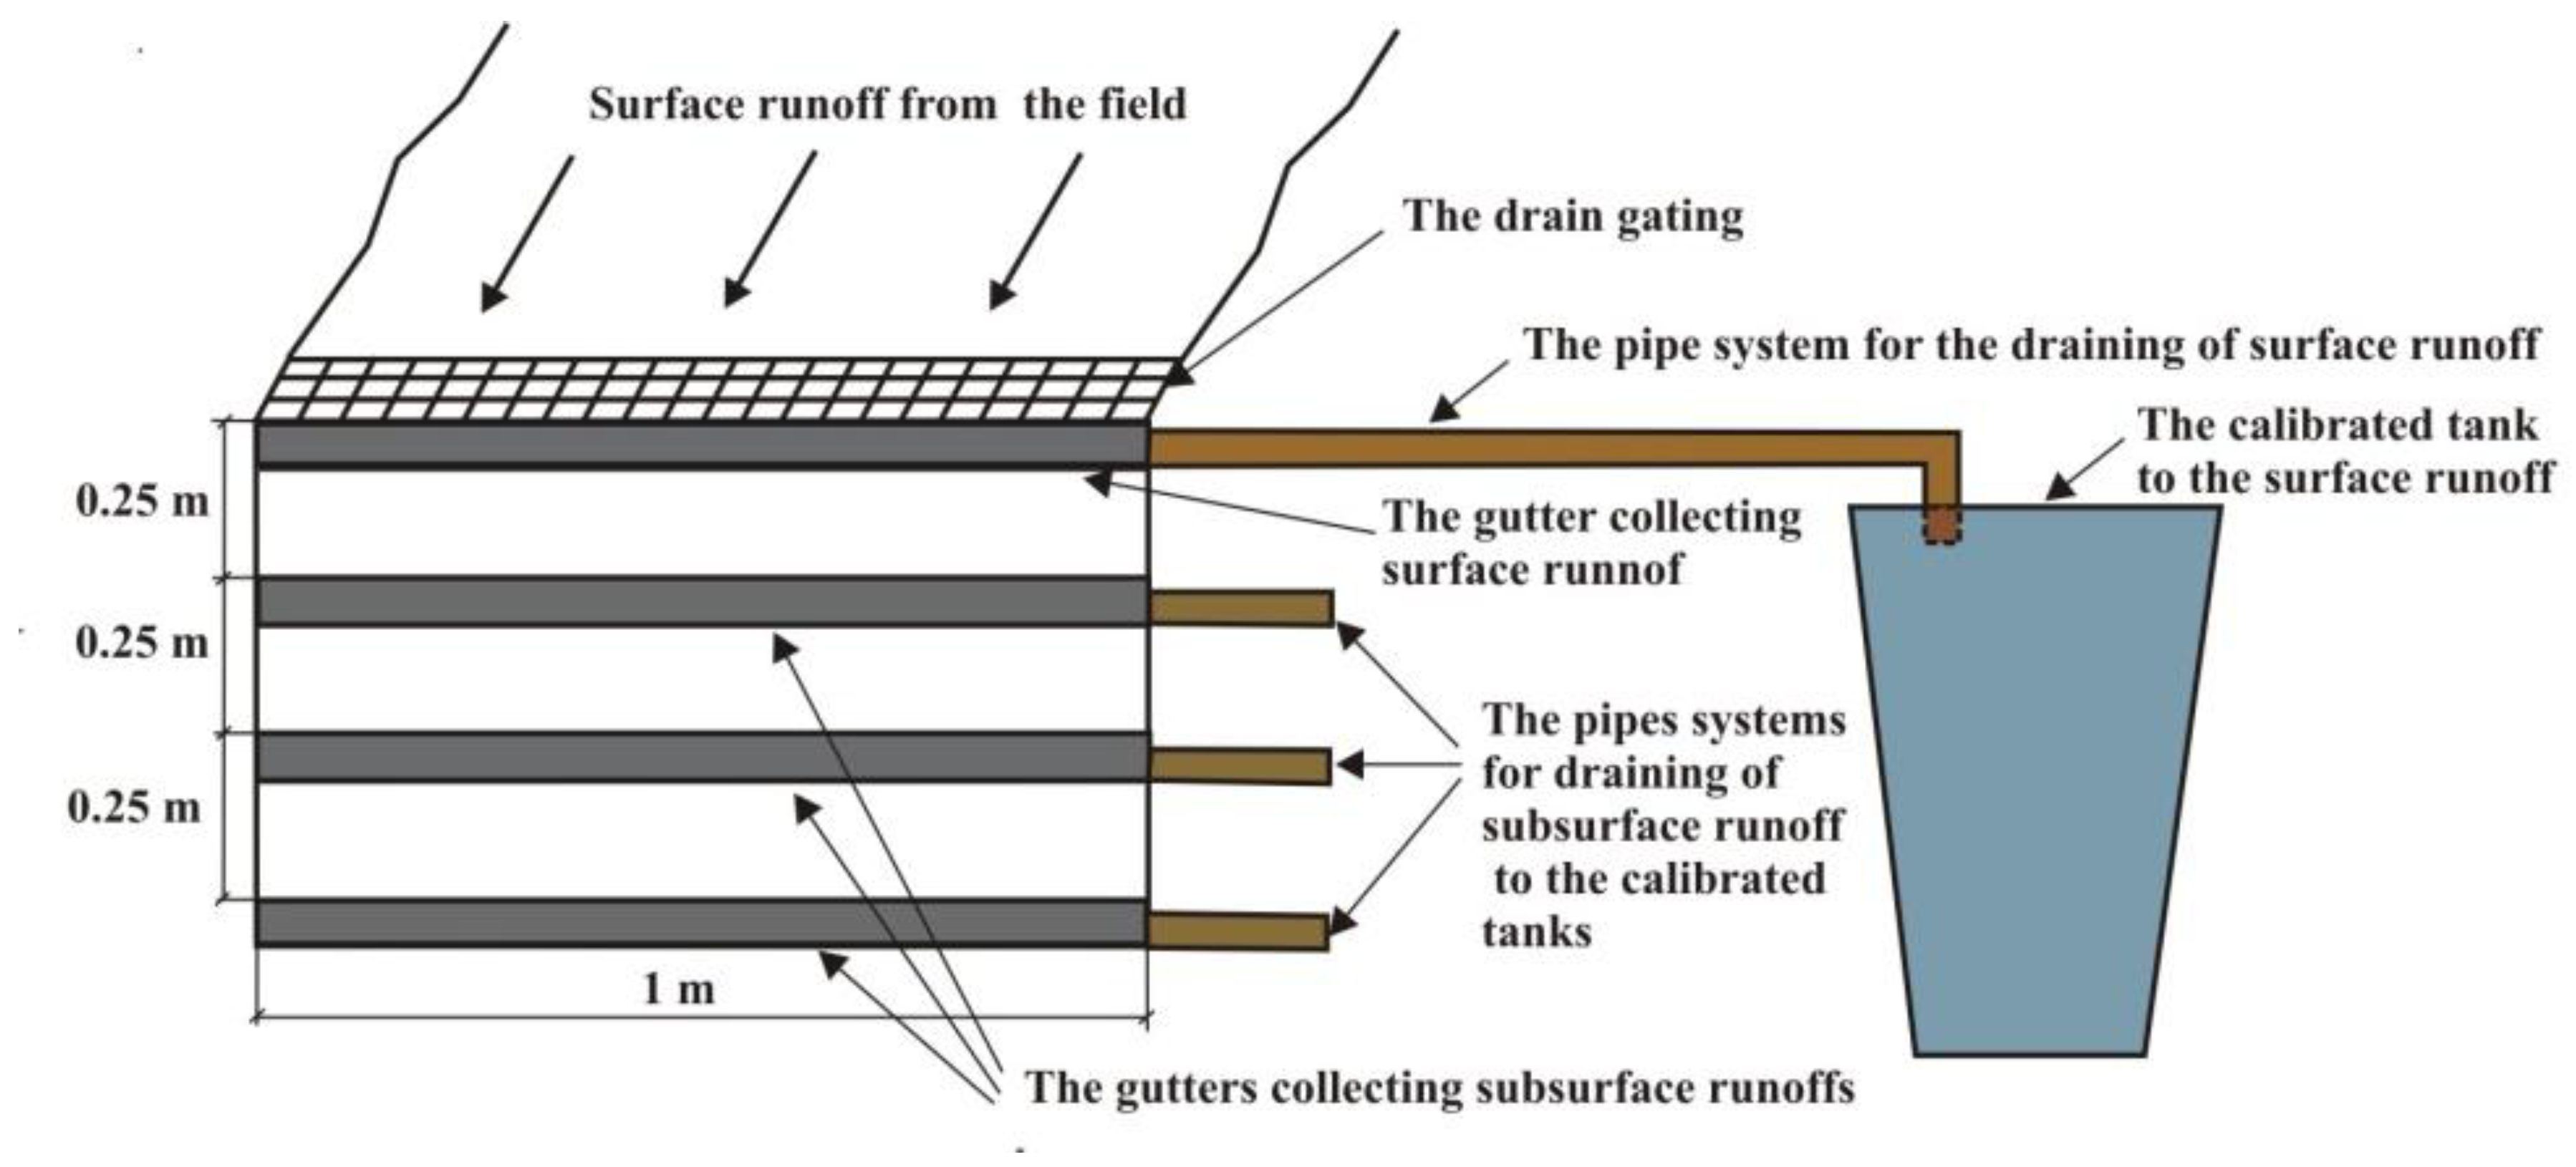
Measurement of the surface and subsurface runoff were carried out in a selected production field that is part of the catchment and situated on a slope with an average inclination of about 11% and NE exhibition (azimuth of 30°). The selected field is used as arable land, with a longitudinal direction for conducting agrotechnical procedures, and cultivation typical for the Lublin Upland. The field shape is similar to a square, with a side length of about 90 m, and its lower part reaches the edge of the valley gorge, which is located in the valley axis. In 2008, spring barley was grown, in 2009 winter triticale, in 2010 sugar beets and in 2011 winter wheat. In April 2008, in the lower part of the slope, a catcher for the surface and subsurface runoff to a depth of 0.75 m was installed. Made of sheet metal and structurally similar to a Gerlach catcher, it was housed in the soil outcrop. In the front wall, gaps with a width of 1 m were left, in which barriers collecting the outgoing water together with impurities from the depth of 0 m (surface runoff) and 0.00–0.25 m, 0.25–0.50 m; 0.50–0.75 m (subsurface runoff), were mounted. The water was discharged through PVC (polyvinyl chloride) pipes to calibrated tanks, which constituted the receivers of the outflowing water (Figure 2). In the case of the outflow presence, its volume was measured and taken in 1 liter water bathymeters for laboratory analysis, after the homogenization of the whole volume. The content of suspensions in the collected water samples was determined according to Brański [34] by means of the gravimetric method, and the nitrogen (total, ammonium, nitrate and nitrite), phosphorus and potassium were determined by applying the photometric method [35]:
- total nitrogen: WTW photometer model MPM 2010 (after oxidation of the test sample in thermo-reactor at the temperature 100 °C);
- ammonium and nitrite: WTW photometer model MPM 2010;
- nitrate, phosphorus, and potassium: Slandi photometer model LF 300.
Based on the concentration of components and the size of runoff, the loads of components transported in the water were determined.
2.3. Rainfall Research
Investigations into the rainfall, surface and subsurface runoff were conducted in total during 27 periods (5 each in 2008 and 2009, 7 each in 2010 and 10 each in 2011) (Table 1). Atmospheric precipitation was recorded using a daily recording pluviograph and a Hellmann rain gauge.
On the basis of pluviographs, the unit kinetic energy of precipitation was calculated according to the Equation (1) developed by Brown and Forester [36]:
where Ekin is the kinetic energy per area unit (MJ ha−1); Ii is the intensity of precipitation in time with a constant partial intensity i (mm h−1); and ΔPi is the sum of precipitation in time with a constant partial intensity i (mm).
According to definition included in the USLE (Universal Soil Loss Equation) model, a single rainfall was assumed as a precipitation, if it was separated from the next one by more than 6 h. For all precipitations with partial intensity with the threshold values 1, 2, 3, and 4 mm h−1, the sum, kinetic energy and erosion indicator of rain and surface runoff EI30 was calculated as a product of the kinetic energy of precipitation and its maximum intensity within 30 min [37].
2.4. Soil Research
Soil investigations were carried out in April 2008 (samples were collected during the installation of the runoff catcher). A description of the soil profile was made in the field on the basis of stratified diagnostic horizons according to the systematics developed by the Polish Society of Soil Science [38]. Soil samples were collected from the distinguished diagnostic horizons and subjected to determinations according to the recommended methods [39,40]:
- Granulometric composition, using the Bouyoucos areometric method modified by Casagrande and Prószyński;
- Density of the solid phase of the soil, by means of the pycnometric method;
- Soil bulk density, using gravimetry (after collecting the soil with an intact structure into metal cylinders);
- Total porosity, using Formula (2):where Po is the total porosity; is the density of the solid phase; and is the soil bulk density.
- Water permeability coefficient, using the Eijkelkamp device (after collecting the soil with an intact structure into metal cylinders).
On the basis of the obtained research results, the dependence of quality indicators of runoff water and losses of matter components on precipitation and runoff parameters was determined, based on the determination and r-Pearson correlation index, at a significance level of α = 0.05.
3. Results and Discussion
3.1. Meteorological Conditions
Climatic conditions, in particular the size and intensity of atmospheric precipitation, have a very significant impact on the intensity of water erosion. The supply of atmospheric precipitation in the catchment in Wielkopole is shown in Table 2. The average long-term 1987–2011 annual rainfall was 636.1 mm, of which more than half (around 64%) was summer rainfall. The lowest annual rainfall occurred in the winter months (January and February, with 31.5 and 30.2 mm), while the highest occurred in July (97.1 mm). During the research period, rainfall was higher than the average long-term rainfall by about 11% in 2008, 36% in 2010 and 38% in 2011. Only in the hydrological year 2008–2009, was precipitation lower by about 7.7% in relation to the average long-term rainfall. High precipitation, almost two or three times higher than the average monthly rainfall for many years, was recorded in September 2008, June 2009, August 2010 and July 2011, of which the latter had the highest precipitation recorded in the history of observation at this meteorological station, accounting for as much as 349% of the average monthly rainfall in July.
The amount of rainfall was not evenly distributed over the year. The rainfall from the summer period during the study period constituted 64% in 2008, 72% in 2009 and 76% in 2010 and 2011. The obtained results for the precipitation distribution were similar to those recorded by Mazur et al. [33]. They found that the climate of the Lublin Upland is distinguished by an increasing continental characteristic in an easterly direction. This is evidenced by the high amplitudes of air temperatures, small sums of annual rainfall (500–600 mm) and the prevalence of summer precipitation, which often consists of short-term, sudden, and local downpours [33].
3.2. Soil Properties
On the basis of the stratification of the distinguished diagnostic horizons made in the soil outcrop, in this study area the soils developed from loess and are of the lessive type (Haplic Luvisols). These are medium-eroded soils with an Ap-B2t-BC-Cca structure profile (Ap—arable-humic horizon, B2t—illuvian horizon, BC—transitional horizon, Cca—bedrock horizon), in which the arable-humus level was developed from the B2t horizon. In their composition, no skeletal fractions were found, and the sand fraction constituted a small proportion (2.8–4.1%) (Table 3). The dominant fraction in the granulometric composition was dust, constituting about 60% of the volume of the soil samples, of which fine dust constituted from 46.2% to 47.9%. The alluvial parts (<0.02 mm) also constituted a high percentage (about 34%), and the largest of these was a thick dusty loam. The granulometric composition of the studied soils was similar to those found elsewhere in the Lublin Upland [29,41].
An important feature of loess formations are their physical properties, which determine the water permeability, storage of water in the soil, as well as the occurrence of water runoff. The average specific soil density was 2.6 Mg m−3 and ranged from 2.59 to 2.67, being the lowest in the upper arable-humic Ap horizon and the highest at a depth of 25–35 cm (Table 4). The bulk density was similar, and increased with depth. The highest overall porosity was found in the Ap horizon (45.9%), and the lowest (39%) in the subsurface layer at a depth of 25–35 cm. The examined soils, in terms of physical properties, turned out to be similar to those ones developed from loess in the Lublin Upland [41]. The results presented in Table 4 clearly indicate a higher degree of compaction of the subsurface layer and the formation of a so-called plough pan. This unfavorable thickening of the solid phase below the range of the cultivation tools (plow, cultivator, etc.) clearly affects the water infiltration conditions, especially during intense precipitation. In the arable layer, the water permeability coefficient was 6.152 × 10⁻⁶ m s−1, while in the direct subsurface layer, it decreased three times to the value 2.132 × 10⁻⁶ m s−1. In deeper layers, it ranged from 3.256 to 3.869 × 10⁻⁶ m s−1.
3.3. Water Outflow and Selected Matter Components
Investigations of the quantity and quality of the surface runoff and water outflow were carried out for a wide range of rainfall totals, from 15.3 to 63.6 mm (Table 5). The obtained test results were very diversified, as evidenced by the standard deviation values. Of all the recorded erosive precipitations, they occurred most frequently in July (33.3%) and June (22.2%). In May and August, their incidence was 18.5%, and in April and September 3.7% (Table 1).
The value of the EI30 index in the summer half of particular hydrological years varied in a wide range from 8.9 to 450.2 MJ mm ha−1 h−1. Higher values occurred in wet years (2010 and 2011), when the annual rainfall sums exceeded the average sum of many years. The highest value of the EI30 index was recorded on 9.08, 2010 (450.2 MJ mm ha−1 h−1), and was caused by precipitation from one high intensity storm (63.6 mm), reaching a maximum of 229.3 mm h−1. Dependence between the erosion rate of precipitation and surface runoff EI30 and the sum of the rainfall is shown in Figure 3 (the trend line was best described by the quadratic equation). The erosive potential of the high precipitation expressed by the EI30 index does not necessarily depend on the sum of the rainfall (sometimes rainfall with high sums was characterized by a low index and vice versa). However, it should be emphasized that the EI30 indicator is significantly correlated with the sum of precipitation (r = 0.78) and the determination index was R2 = 0.68. A high dependence (determination index R2 = 0.54) between the EI30 index and the amount of precipitation was also confirmed by results obtained by Rejman [29]. In Szewrański’s research [42] one can note a high dependence between the amount of precipitation and the kinetic energy that determines the intensity of soil erosion. The correlation coefficient between the rain erosion index (EI30) and the rain layer (P) calculated by and Święchowicz [43] amounted to 0.51.
The surface water runoff level on the slope was from 1.2 to 18.2 mm (Table 5), which constituted from 5.7% to 28.8% of the precipitation causing the erosive event. In total, higher outflows were recorded in the wet years 2010 and 2011 (76.4 and 58.9 mm), which accounted for 8.8% and 6.7% of annual precipitation, respectively. In 2008 and 2009, the outflow was 22.1 and 22.0 mm, or 3.1% and 4.8% of the annual rainfall, respectively. The obtained research results prove that a high amount of precipitation does not always result in high surface runoff (Figure 4a). The trend line was best described by the quadratic equation. However, the obtained correlation coefficient r = 0.75 (determination index R2 = 0.58) shows that the height of the surface runoff is highly correlated with the amount of precipitation. Research conducted by Kim et al. [18], Zhang et al. [20] and Żmuda [31] prove that the outflow rate is also influenced by a number of other factors, for example precipitation intensity, vegetation cover and soil moisture. However, it is mainly the intensity of precipitation that initiates the surface runoff. If it is greater than the soil infiltration, a layer of water is formed on the surface of the terrain, which begins to run down the slope due to gravity [43,44]. The subsurface runoff during the research period occurred only from the confined layer up to 0.25 m. It ranged from 0.2 to 3.6 mm (Table 5), which accounted for 0.9% and 6.3% of the precipitation causing the erosive event, respectively. As in the case of surface runoff, it was higher in 2010 and 2011 (10.1 and 12.4 mm), accounting for 1.2% and 1.4% of the annual precipitation, respectively. In 2008 and 2009, the subsurface runoff was at the level of 3.6 and 4.3 mm (0.5% and 0.7% of annual rainfall), respectively. The relationship between the height of the subsurface runoff and the amount of precipitation causing this outflow is shown in Figure 4b (the trend line was best described by the quadratic equation). The correlation here is stronger r = 0.77 (determination index R2 = 0.63) than in the case of the surface runoff, but the amount of subsurface outflow cannot be inferred from the amount of rainfall.
Water draining from the surface or deeply from the slope carries dissolved or suspended constituents of matter [45]. Under the research conditions, the concentration of soil suspension contained in the surface runoff water varied within a wide range from 8.354 to 301.278 g dm−3, while the range in the subsurface runoff water was 1.021–51.235 g dm−3 (Table 5). The highest mean concentration of soil suspension in the surface runoff water (190.817 g dm−3) and subsurface runoff water (20.208 g dm−3) was recorded in 2010, whereas the lowest recorded was 43.376 g dm−3 in 2009 (surface runoff) and 2.216 g dm−3 in 2008 (subsurface runoff). Such large differences could have been caused by crop rotation, as in 2010 sugar beets were grown and cereals were grown in other years. Soil washing from the slope during individual erosive events varied within a wide range from 0.112 to 54.833 Mg ha−1 for the surface runoff and from 0.002 to 1.844 Mg ha−1 for the subsurface runoff. Slightly higher values were found by Żmuda [31] while conducting research in the area of Wzgórza Trzebnickie, where in a sugar beet field, the maximum surface soil runoff during a single event was determined to be 60.132 Mg ha−1. However, in the research carried out by Rejman [29] in the Lublin Upland, this figure reached 20.640 Mg ha−1 (cultivation of root crops, such as sugar beet and potato). Figure 5 presents the relationship between the soil surface runoff and the amount of precipitation causing the erosive event (Figure 5a) and the EI30 indicator (Figure 5b). They show that the soil reaction, both towards the level of precipitation and their potential erosion (expressed by the EI30 index), is very diverse and it is not possible to draw conclusions regarding the size of the soil wash on the basis of these indicators. However, the mass of the eroded soil proved to be strongly correlated with the EI30 index r = 0.86 (determination index R2 = 0.73), while it was less correlated with the sum of precipitation r = 0.65 (determination index R2 = 0.35). The relationship between the rainfall and mass eroded soil was the subject of research of many authors. Experiments in simulated conditions [46] showed that an increasing rainfall intensity had a larger effect on the sediment yield than increasing slope. Other laboratory research [47] suggested that the collected sediment yield and eroded soil volume increased with rainfall duration and slope. In their research, Shen et al. [48] generated an equation describing the relationship between the rill erosion rate and rainfall intensity and slope gradient. The authors indicated that the impact of rainfall intensity on hillslope rill erosion were greater than those of the slope gradient. For the experimental treatments, the mean headward erosion rates increased with an increase in either rainfall intensity or slope gradient.
The soil losses through the subsurface runoff were more strongly correlated (r = 0.70) with the amount of precipitation causing the erosive event (Figure 6a), than in the case of soil loss during surface runoff (Figure 5a). However, also in this case, there was erosive precipitation with a large volume of water, during which the soil losses were relatively small. An even stronger correlation (r = 89) was obtained between the soil losses in the subsurface runoff and the erosivity indicator of the precipitation and surface runoff EI30 (Figure 6b). In both cases, the trend lines were best described by quadratic equations.
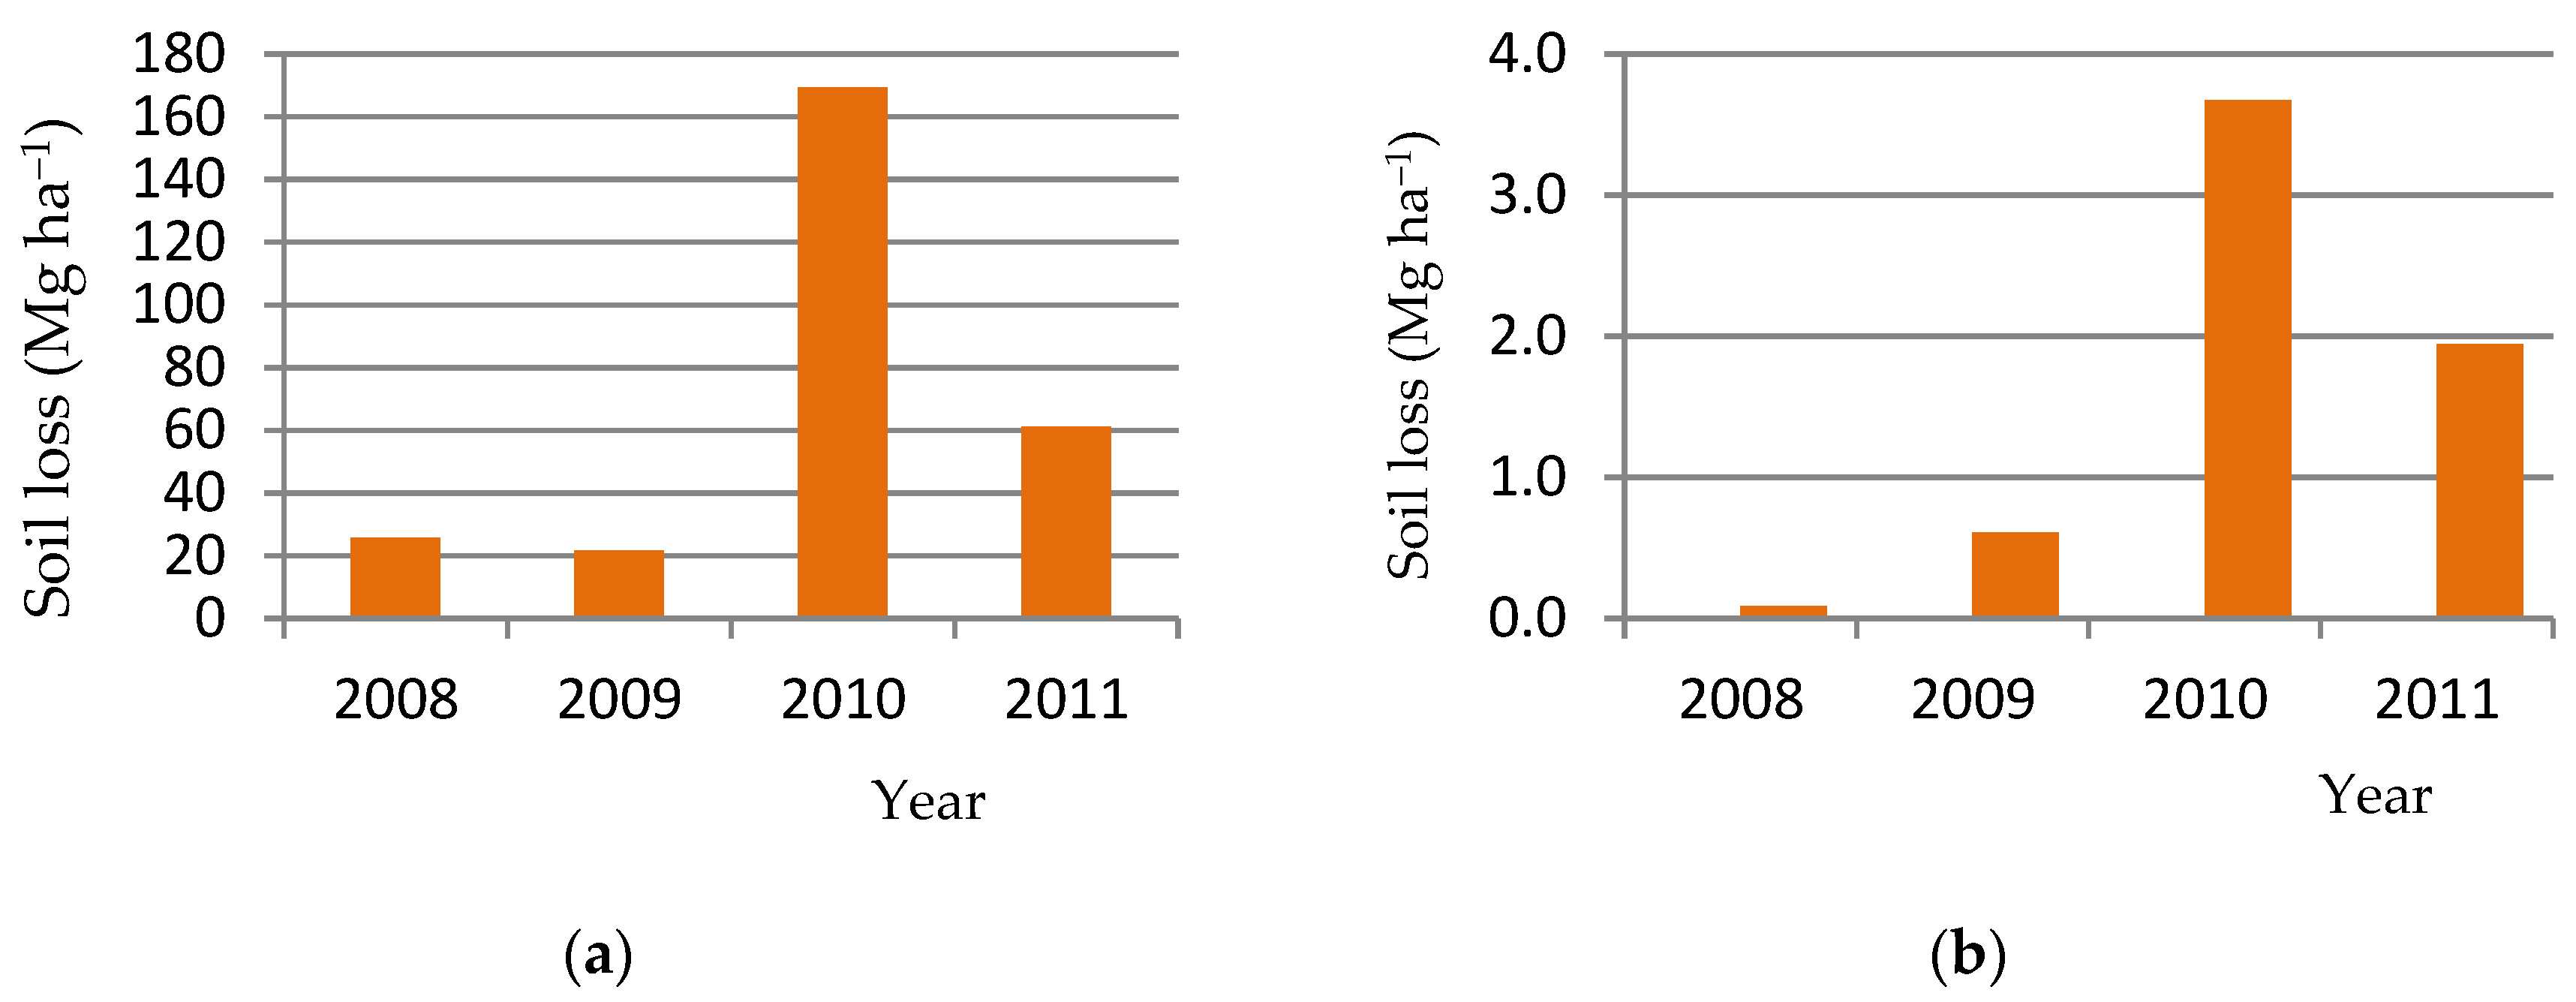
The surface washing of soil from the slope during the four years of research was 304.930 Mg ha−1. The largest amount of soil (55.6% of the weight of the eroded soil over four years) flowed away in 2010 (169.458 Mg ha−1), when sugar beets were grown, and almost eight times less soil (21.623 Mg ha−1) (Figure 7a) was lost when winter triticale was grown in 2009. During the subsurface runoff, the mass of the eroded soil during the four-year study period was 6.314 Mg ha−1. The largest soil loss (3.674 Mg ha−1, which accounts for 58.2% of the eroded soil mass for four years) was recorded in 2010, while the smallest soil loss (0.085 Mg ha−1) (Figure 7b) occurred in 2008, when spring barley was grown. The results obtained from field tests regarding soil loss are difficult to relate to other results. This is due to differences in the inclination of slopes and soil conditions, but mainly due to the erosive nature of rainfall. Research conducted by Gil [49,50] clearly shows that even the average ten-year size of soil loss can differ by up to 140% for cereal crops and 50% for potato cultivation.
The chemistry of water flowing off the slope was very diverse in individual years and during outflow periods (Table 5). The concentrations of total nitrogen in the surface runoff water varied from 0.652 to 6.321 mg dm−3 N-Ntot. The concentration of other nitrogen forms was at the level of: ammonium 0.354–4.224 mg dm−3 N-NH4, nitrate 0.156–1.623 mg dm−3 N-NO3, nitrite 0.098–1.315 mg dm−3 N-NO2. The concentration of phosphorus flowing away in the dissolved form was on the level of 0.039–2.105 mg dm−3 P, while for potassium this was 0.698–7.852 mg dm−3 K. It is worth noting that the average content of biogenic nutrients, such as phosphorus and ammonium nitrogen, exceeded the threshold values corresponding to a good surface water class (Table 6), contained in the Regulation of the Minister of Environment of 9 November 2011, which set out the method of classification of uniform state surface water bodies and environmental quality standards for priority substances [51]. These excesses did not occur in the case of nitrate nitrogen. Almost all tested chemical indicators of water quality reached the highest values in 2010. This applies both to the maximum concentrations and average values.
Analysis of the concentration of the chemical components in surface runoff water showed a negative significant dependence on the majority of the analyzed factors (Table 7). The relationship between the concentration of the chemical components and the amount of precipitation was best described by linear equations, and the correlation coefficients (r) were at levels from −0.32 to −0.44, and the determination index (R2) ranged from 0.10 to 0.20. Correlations between the concentration of chemical constituents and the indicator of rain erosion and surface runoff EI30 were at a slightly higher level. The correlation coefficients (r) fluctuated from −0.39 to −0.49, and the determination index (R2) ranged from 0.27 to 0.37.
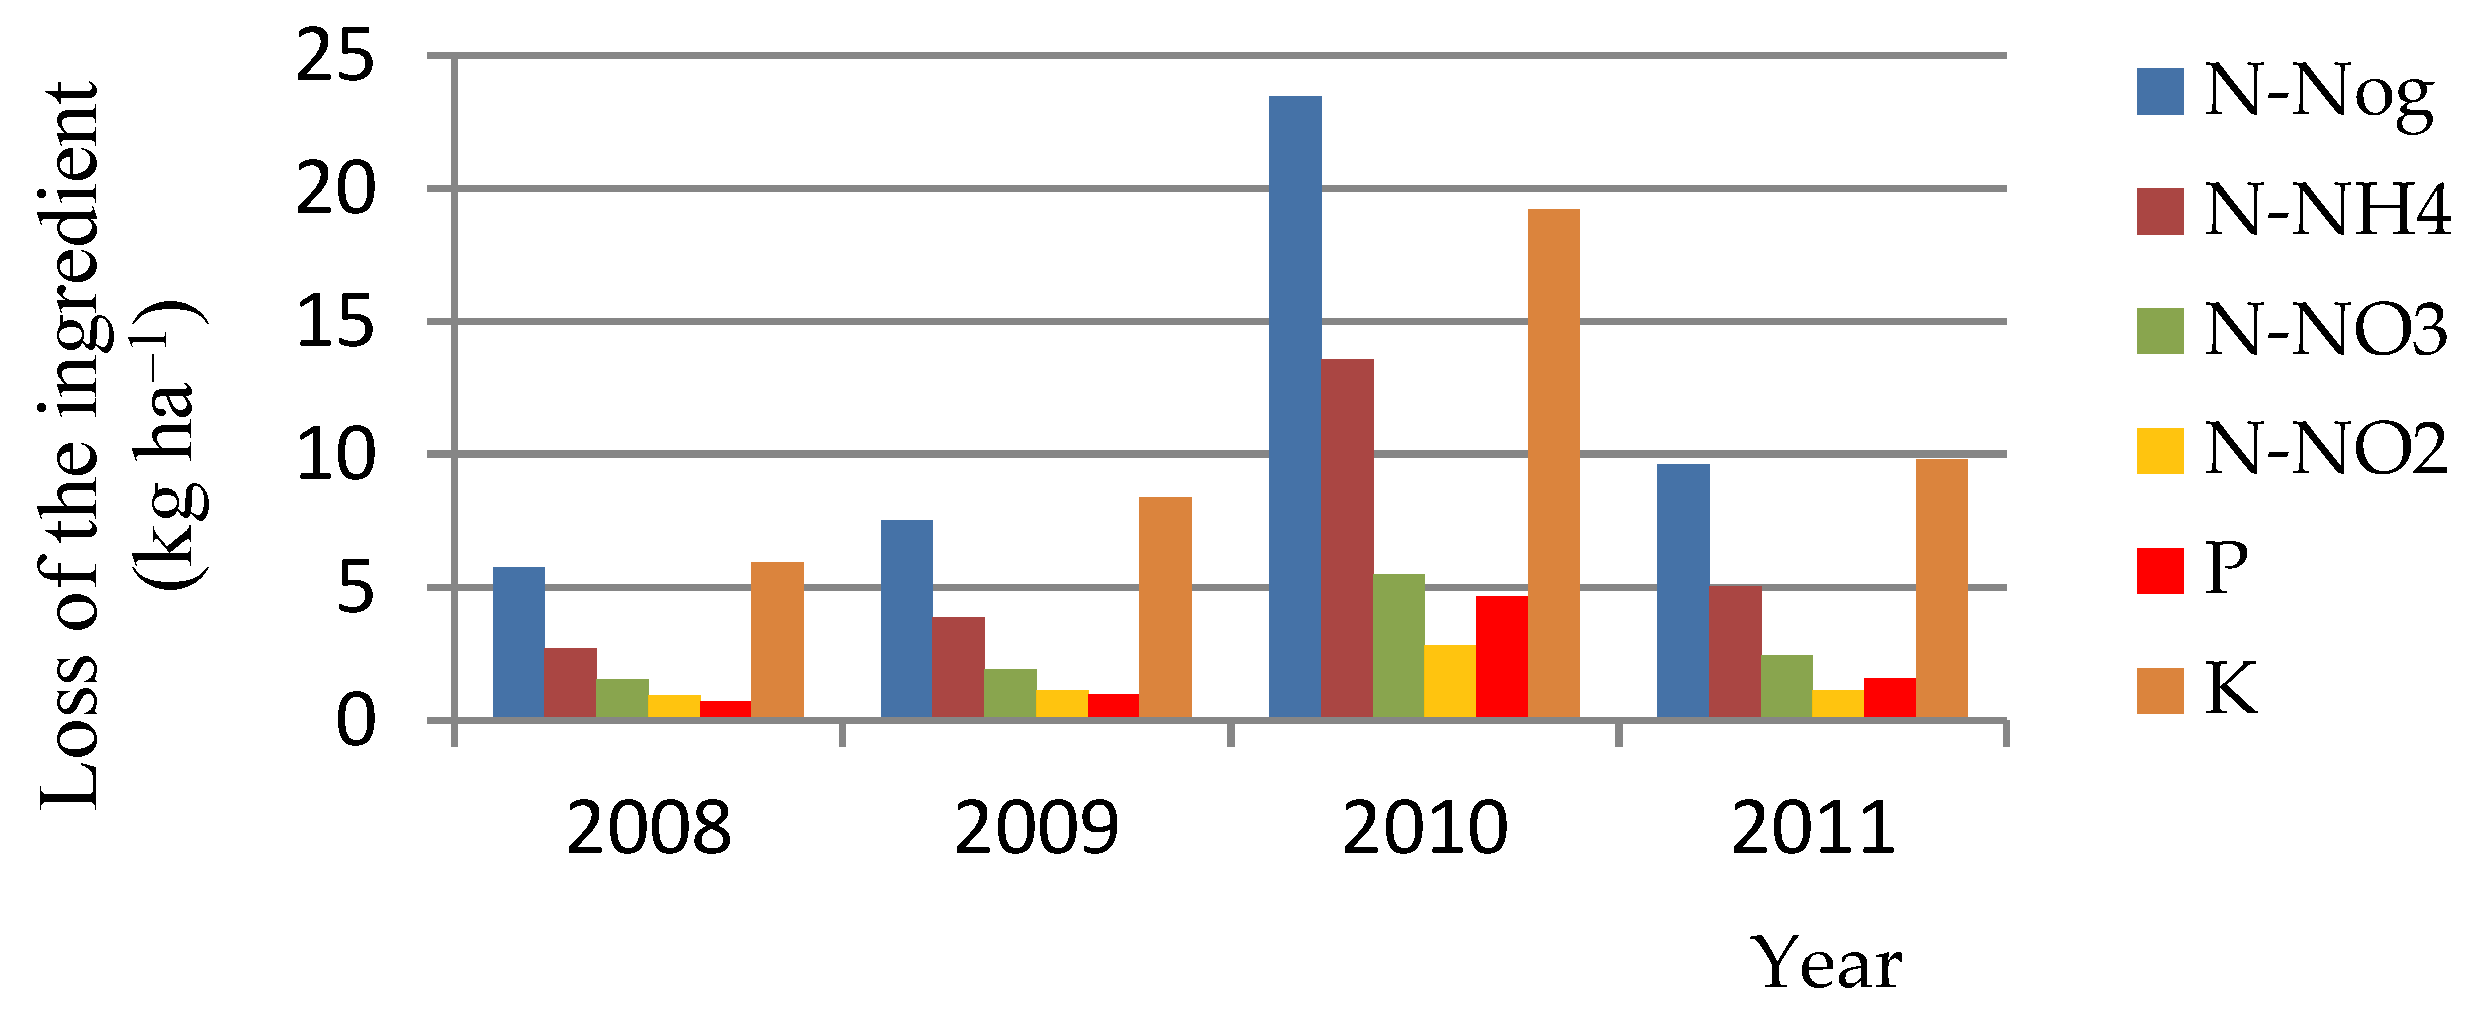
In the surface runoff, the total annual dissolved nutrients in the surface runoff water that flowed from the slope were as follows: from 5.762 to 23.448 kg ha−1 N-Ntot, 2.706–13.561 kg ha−1 N-NH4, 1.548–5.478 kg ha−1 N-NO3, 0.950–2.824 kg ha−1 N-NO2, 0.696–4.644 kg ha−1 P, and 5.937–19.216 kg ha−1 K. Kim et al. [18] determined nutrient losses of N-Ntot 5.63–13.97 kg ha−1 and P 0.96–11.00 kg ha−1, depending on the location and method of use. The largest outflows of all studied nitrogen forms, as well as phosphorus and potassium, were recorded in 2010 (Figure 8) and each outflow was at a level close to 50% of the total mass of eroded matter in the four-year study period.
When analyzing the results obtained regarding the chemistry of the water draining from the 0–0.25 m subsurface layer (Table 5), it was concluded that the concentration of the majority of the tested water quality indicators was higher than in surface runoff water. This applied to the maximum and the average values. This is likely the result of chemical erosion, i.e., infiltrating water washing out the chemical components naturally contained in the soil or chemicals applied to the surface (arable) layer during plant production [31]. The total nitrogen concentrations varied from 1.132 to 8.563 mg dm−3 N-Ntot. Concentrations of other nitrogen forms were at the following levels: ammonium 0.525–4.954 mg dm−3 N-NH4, nitrate 0.214–2.394 mg dm−3 N-NO3, nitrite 0.081–1.456 mg dm−3 N-NO2. The concentration of phosphorus flowing away in the dissolved form was 0.045–2.563 mg dm−3 P, while potassium was 1.023–8.234 mg dm−3 K. Analysis of the concentration of the chemical components in the subsurface runoff water showed a negative correlation with the analyzed factors (Table 7), and these relationships were stronger than for the surface runoff water. The relationship between the concentration of chemical components and the amount of precipitation was best described by linear and quadratic equations, but the correlation coefficients (r) were at levels from −0.32 to −0.42, and the determination index (R2) ranged from 0.18 to 0.23. Correlations between the concentration of the chemical components and the erosion rate of the rain and surface runoff EI30 were present at slightly higher levels (the correlation coefficient r ranged from −0.42 to −0.52), and the determination index R2 ranged from 0.25 to 0.44.
During the outflow of subsurface water, the annual dissolved forms of the nutrients were: 1.447–3.500 kg ha−1 N-Ntot, 0.746–1.811 kg ha−1 N-NH4, 0.377–0.902 kg ha−1 N-NO3, 0.251–0.442 kg ha−1 N-NO2, 0.149–0.635 kg ha−1 P, 1.128–2.645 kg ha−1 K. As in the case of surface outflow, the largest outflows of all nitrogen forms tested were recorded in 2010 (Figure 9) and each outflow was at the level of 37–38% of the total mass of eroded components in the four-year study period. Phosphorous outflow in 2010 accounted for approximately 47.8% of the sum of the eroded components of the four years. The highest potassium outflow was recorded in 2011 (33.7%), although in 2010 this outflow was very similar and represented 31.2% of the four-year total.
Our research showed a high dependence between the EI30 index and the mass of eroded soil (R2 = 0.73). Also, the value of the determination coefficient (R2 = 0.62) was increased by Rejman [29]. Święchowicz [43] determined that with an increase of the EI30 index, soil loss on bare fallow land increases. However, the total surface and subsurface annual outflows of nitrogen 7.210–29.949 kg ha−1, phosphorus 0.846–5.279 kg ha−1 and potassium 7.065–21.660 kg ha−1, were higher than those found in the literature (4.5–20 kg ha−1 N-Ntot, 0.5 kg ha–1 P, 2–17 kg ha−1 K) [31,52,53]. The obtained results are difficult to explicitly relate to those of erosive research conducted on other objects due to the complexity of the problem. The intensity of erosive processes in a given place is determined by many local factors, e.g., precipitation erosivity, soil erosion, land relief, vegetation cover, land use, etc. [18,54,55,56]. These factors, when interrelated, can intensify or reduce the soil erosion.
4. Conclusions
The research carried out on a loess slope in the catchment area in Wielkopole in the Lublin Upland, regarding the outflow of surface and subsurface water and selected components of matter, found that this area is highly affected by erosion, and the outgoing water is loaded with a high concentration of pollutants. This is the result of strong denuding processes. The possibility of erosive phenomena is favored by the formation of a plough pan, which impedes the infiltration of water and intensifies the surface and subsurface runoff. The intensity and occurrence of meteorological events significantly affect the size of water and soil outflow. Surface and subsurface drainage was highly correlated with the amount of precipitation with r = 0.75 and 0.77, respectively. High correlation (r = 0.78) was found between the erosivity index of the precipitation, the runoff EI30, and the sum of precipitation. Also, the mass of eroded soil was strongly correlated with the indicator EI30 (r = 0.86), while less correlated with the sum of rainfall (r = 0.65). The largest soil outflows occurred in 2010 when individual erosion events mobilized up to 60 Mg ha−1 of soil material on the slope and over 170 Mg ha−1 in total over one year. In addition to the atmospheric conditions, crop rotation, which included sugar beet crops, could have contributed to such large losses of soil and nutrients. Root plants poorly protected the soil against water erosion. In the remaining years of the study, soil losses were three to eight times smaller, which could partly be the result of cereal cultivation. The cultivation of root crops is associated with the use of mechanical care treatments that loosen the topsoil. In addition, root crops cover the soil poorly, especially in the early stages of development. This promotes soil erosion due to surface flushing. However, no mechanical care is carried out in the production of cereals. In addition, cereals (especially winter) are well-rooted, and the number of plants per unit area is high. As a result, the soil is more effectively protected against water erosion.
The chemistry of the outgoing water fluctuated over a wide range, and the concentrations of biogenic components, such as phosphorus and ammonium nitrogen, exceeded the threshold values for good surface water. In the surface-draining water, the maximum concentrations were: 6.321 mg dm−3 N-Ntot, 4.224 mg dm−3 N-NH4, 1.623 mg dm−3 N-NO3, 1.315 mg dm−3 N-NO2. The maximum phosphorus concentration was 2.105 mg dm−3 P, while the potassium level was 7.852 mg dm−3 K. In the subsurface runoff water, the concentrations of the analyzed indicators were higher and were as follows: 8.563 mg dm−3 N-Ntot, 4.954 mg dm−3 N-NH4, 2.394 mg dm−3 N-NO3, 1.456 mg dm−3 N-NO2, 2.563 mg dm−3 P, 8.234 mg dm−3 K. The concentration of chemical components in the surface and subsurface runoff water in most cases proved to be negatively statistically correlated with the amount of precipitation and the indicator EI30. The correlation coefficients (r) were at levels from −0.32 to −0.52, and the determination index (R2) ranged from 0.10 to 0.44. The largest loss of nutrients caused by chemical erosion occurred in 2010 and amounted to 29.949 kg ha−1 of nitrogen; 5.279 kg ha−1 of phosphorus; and 21.660 kg ha−1 of potassium.
The agricultural use of severe water erosion threatened loess areas in case of the poor selection of rotating crops (especially root crops) may result in large amounts of biogenic components and soil suspension in the water, causing the pollution and eutrophication of the aquatic environment.
Conflicts of Interest
The author declares no conflict of interest.
References
- Jankauskas, B.; Fullen, M.A. A pedological investigation of soil erosion severity on undulating land in Lithuania. Can. J. Soil Sci. 2002, 82, 311–321. [Google Scholar] [CrossRef] [Green Version]
- Mazur, A.; Obroślak, R.; Nieścioruk, K.; Król, Ż.; Gabryszuk, J.; Rybicki, R. Analysis of erosion control constructions effectiveness the case of a road gully in Wielkopole (Lublin Upland). J. Ecol. Eng. 2016, 17, 180–183. [Google Scholar] [CrossRef]
- Young, F.J.; Hammer, R.D. Soil-landform relationship on a loess-mantled upland landscape in Missouri. Soil Sci. Soc. Am. J. 2000, 64, 1443–1454. [Google Scholar] [CrossRef]
- Lal, R. Soil erosion and carbon dynamics. Soil Tillage Res. 2005, 81, 137–142. [Google Scholar] [CrossRef]
- Olson, K.R. Soil organic carbon storage in southern Illinois woodland and cropland. Soil Sci. 2007, 172, 623–630. [Google Scholar] [CrossRef]
- Olson, K.R.; Jones, R.L. Soil organic carbon and fly-ash distribution in eroded phases of soils in Illinois and Russia. Soil Tillage Res. 2005, 81, 143–153. [Google Scholar] [CrossRef]
- Bu, C.-F.; Wu, S.-F.; Yang, K.-B. Effects of physical soil crusts on infiltration and splash erosion in three typical chinese soils. Int. J. Sediment Res. 2014, 29, 491–501. [Google Scholar] [CrossRef]
- Fullen, M.A.; Brandsma, R.T. Property changes by erosion of loamy sand soils in east Shropshire—UK. Soil Technol. 1995, 8, 1–15. [Google Scholar] [CrossRef]
- Hladký, J.; Novotná, J.; Elbl, J.; Kynický, J.; Juřička, D.; Novotná, J.; Brtnický, M. Impacts of Water Erosion on Soil Physical Properties. Acta Univ. Agric. Silvic. Mendel. Brun. 2016, 64, 1523–1527. [Google Scholar] [CrossRef] [Green Version]
- Ijaz, A.; Khan, F.; Bhatti, A.U. Some physico-chemical properties of soil as influenced by surface erosion under different cropping systems on upland-sloping soil. Soil Environ. 2006, 25, 28–34. [Google Scholar]
- Bakker, M.M.; Govers, G.; Rounsevell, M.D.A. The crops productivity-erosion relationship: An analysis based on experimental work. Catena 2004, 57, 55–76. [Google Scholar] [CrossRef]
- Duan, X.; Xie, Y.; Ou, T.; Lu, H. Effects of soil erosion on long-term soil productivity in the black soil region of northeastern China. Catena 2011, 87, 268–275. [Google Scholar] [CrossRef]
- Lobo, D.; Lozano, Z.; Delgado, F. Water erosion risk assessment and impact on productivity of a Venezuelan soil. Catena 2005, 64, 297–306. [Google Scholar] [CrossRef]
- Arriaga, F.J.; Lowery, B. Corn production on an eroded soil: Effects of total rainfall and soil water storage. Soil Tillage Res. 2003, 71, 87–93. [Google Scholar] [CrossRef]
- Daniels, R.B.; Gilliam, J.W.; Cassel, D.K.; Nelson, L.A. Soil erosion has limited effect on scale crop productivity in the southern Piedmont. Soil Sci. Soc. Am. J. 1989, 53, 917–920. [Google Scholar] [CrossRef]
- Papiernik, S.K.; Lindstrom, M.J.; Schumacher, J.A.; Farenhorst, A.; Stephens, K.D.; Schumacher, T.E.; Lobb, D.A. Variation in soil properties and crop yield across an eroded prairie landscape. J. Soil Water Conserv. 2005, 60, 388–395. [Google Scholar]
- Grzywna, A.; Tarkowska-Kukuryk, M.; Bochniak, A.; Marczuk, A.; Jóźwiakowski, K.; Marzec, M.; Mazur, A.; Obroślak, R.; Nieścioruk, K.; Zarajczyk, J. Application of chemical and biological indicators for assessment of an ecological potential of artificial watercourses. Przem. Chem. 2015, 94, 1954–1957. [Google Scholar]
- Kim, K.; Kim, B.; Eum, J.; Seo, B.; Christopher, L.; Shope, C.L.; Peiffer, S. Impacts of land use change and summer monsoon on nutrients and sediment exports from an agricultural catchment. Water 2018, 10, 544. [Google Scholar] [CrossRef]
- Skowron, P.; Skowrońska, M.; Bronowicka-Mielniczuk, U.; Filipek, T.; Igras, J.; Kowalczyk-Juśko, A.; Krzepiłko, A. Anthropogenic sources of potassium in surface water: The case study of the Bystrzyca river catchment, Poland. Agric. Ecosyst. Environ. 2018, 265, 454–460. [Google Scholar] [CrossRef]
- Zhang, F.; Wang, J.; Xiaoping Wang, X. Recognizing the relationship between spatial patterns in water quality and land-use/cover types: A case study of the Jinghe Oasis in Xinjiang, China. Water 2018, 10, 646. [Google Scholar] [CrossRef]
- Olson, K.R.; Gennadiyew, A.N.; Jones, R.L.; Chernyanskii, S. Erosion pattern on cultivated and reforested hillslopes in Moscow Region, Russia. Soil Sci. Soc. Am. J. 2002, 66, 193–201. [Google Scholar] [CrossRef]
- Pimentel, D.; Allen, J.; Beers, A.; Guinand, L.; Hawkins, A.; Linder, R.; McLanghlin, P.; Meer, B.; Musonda, D.; Perdue, D.; et al. Soil erosion and agricultural productivity. In World Soil Erosion and Conservation; David, P., Ed.; Cambridge University Press: Cambridge, UK, 1993. [Google Scholar]
- Seybold, C.A.; Herrick, J.E.; Brejda, J.J. Soil resilience: A fundamental component of soil quality. Soil Sci. 1999, 164, 224–234. [Google Scholar] [CrossRef]
- Catt, J.A. The agricultural importance of loess. Earth-Sci. Rev. 2001, 54, 213–229. [Google Scholar] [CrossRef]
- Shi, H.; Shao, M. Soil and water loss from the loess plateau in China. J. Arid Environ. 2000, 45, 9–20. [Google Scholar] [CrossRef]
- Józefaciuk, Cz.; Józefaciuk, A.; Nowocień, E.; Wawer, R. Structure of soil hazard with surface water erosion in the Zachodniopomorskie Voivodeship. Folia Univ. Agric. Stetin. Agric. 2001, 87, 285–290. Available online: http://yadda.icm.edu.pl/yadda/element/bwmeta1.element.agro-article-38990215-ab59-49ee-a459-eb2f377229d6?q=bwmeta1.element.agro-volume-3b5c3bd3-025b-4231-baad-1d6667682f21;10&qt=CHILDREN-STATELESS (accessed on 22 August 2018). (In Polish).
- Licznar, P. Modeling of soil water erosion. Zesz. Nauk. AR Wrocław 2003, 456. (In Polish) [Google Scholar]
- Nowocień, E.; Podolski, B.; Wawer, R. Estimating Outflow and Sediment Uptake Chosen Polish Soil Kinds in Simulated Conditions, 2004. Available online: https://www.infona.pl/resource/bwmeta1.element.agro-article-5796a670-d7d2-4d99-9491-090ca9fa2375 (accessed on 20 August 2018).
- Rejman, J. Effect of Water and Tillage Erosion on Transformation of Soils and Loess Slopes, 2006. Available online: http://agris.fao.org/agris-search/search.do?recordID=PL2006001095 (accessed on 20 August 2018).
- Żmuda, R.; Sasik, J.; Szewrański, S. Analysis of needs for spatial planing changes in Trzebnica Hills aimed at water erosion control. Acta Agrophys. 2005, 5, 229–237. (In Polish) [Google Scholar]
- Żmuda, R. Fluvial Transport System Functioning in Small Catchment Threatened by Soil Water Erosion, 2006. Available online: http://agris.fao.org/agris-search/search.do?recordID=PL2009001226 (accessed on 20 August 2018).
- Kondracki, J. Regional Geography of Poland; PWN Warsaw: Warsaw, Poland, 2000. (In Polish) [Google Scholar]
- Mazur, Z.; Pałys, S.; Grodzieński, W.; Mitrus, W. Water erosion in the period of thaw runoffs of 1987 in two agricultural and one afforested catchment basin in the Lublin Upland. Rocz. Nauk Roln. 1990, 82, 81–99. (In Polish) [Google Scholar]
- Brański, J. Determination of the amount of suspension by gravimetric method, direct using filters. Pr. Inst. Hydrol. Melior. 1969, 94, 13–21. (In Polish) [Google Scholar]
- Hermanowicz, W.; Dojlido, W.; Dożańska, W.; Kosiorowski, B.; Zerbe, J. Physico-Chemical Testing of Water and Sewage; Wyd. Arkady: Warszawa, Poland, 1999. (In Polish) [Google Scholar]
- Brown, L.C.; Forester, G.R. Storm erosivity using idealized intensity distributions. Trans. ASAE 1987, 30, 379–386. [Google Scholar] [CrossRef]
- Wischmeier, W.H.; Smith, D.D. Predicting Rainfall Erosion Losses—A Guide to Conservation Planning; USDA, Science and Education Administration: Hyattsville, MD, USA, 1978.
- Polish Society of Soil Science. Systematics of Polish soils. Roczn. Gleb. 1989, 40, 1–155. (In Polish) [Google Scholar]
- Ostrowska, A.; Gawliński, S.; Szczubiałka, Z. Methods of Analysis and Assessment of Soil and Plant Properties—Catalog; Inst. Ochr. Środ: Warszawa, Poland, 1991. (In Polish) [Google Scholar]
- Van Reeuwijk, L.P. Procedures for Soil Analysis; ISRIC, World Soil Information: Wageningen, The Netherlands, 2002. [Google Scholar]
- Turski, R.; Słowińska-Jurkiewicz, A.; Paluszek, J. The effect of erosion on the spatial differentation of the physical prperties of Orthic Luvisols. Int. Agrophys. 1992, 6, 123–136. [Google Scholar]
- Szewrański, S. Raindrop Splash as the Form of Loess Soils Water Erosion, 2009. Available online: http://agris.fao.org/agris-search/search.do?recordID=PL2011000251 (accessed on 20 August 2018).
- Święchowicz, J. Rainfall thresholds for erosion processes in agricultural catchments, 2012. Available online: http://www.geo.uj.edu.pl/publikacje.php?pdf=000130-097 (accessed on 20 August 2018).
- Banasik, K.; Górski, D. Determination of erosive rainfall in the universal soil loss equation. Zesz. Nauk. AR Wrocław 1990, 189, 103–109. (In Polish) [Google Scholar]
- Sharpley, A.N. The selective erosion of plant nutrients in runoff. Soil Sci. Soc. Am. J. 1985, 49, 1527–1534. [Google Scholar] [CrossRef]
- Berger, C.; Schulze, M.; Rieke-Zapp, D.; Schlunegger, F. Rill development and soil erosion: A laboratory study of slope and rainfall intensity. Earth Surf. Process. Landf. 2010, 35, 1456–1467. [Google Scholar] [CrossRef]
- Wang, Y.-C.; Lai, C.-C. Evaluating the erosion process from a single-stripe laser-scanned topography: A laboratory case study. Water 2018, 10, 956. [Google Scholar] [CrossRef]
- Shen, H.; Zheng, F.; Wen, L.; Han, Y.; Hu, W. Impacts of rainfall intensity and slope gradient on rill erosion processes at loessial hillslope. Soil Tillage Res. 2016, 155, 429–436. [Google Scholar] [CrossRef]
- Gil, E. The role of land use in the course of surface runoff and rinsing on flysch slopes. Przegląd Geograficzny 1986, 58, 51–65. Available online: http://rcin.org.pl/Content/13228/WA51_16244_r1986-t58-z1-2_Przeg-Geogr.pdf (accessed on 23 August 2018). (In Polish).
- Gil, E. Water circulation and rinsing on flysch slopes used for agricultural purposes in the years 1980–1990. Zesz. IGiPZ PAN 1999, 60, 1–77. (In Polish) [Google Scholar]
- Regulation of the Minister of Environment of November 9, 2011 on the Method of Classification of Uniform State Surface Water Bodies and Environmental Quality Standards for Priority Substances, 2011. Available online: http://prawo.sejm.gov.pl/isap.nsf/download.xsp/WDU20112571545/O/D20111545.pdf (accessed on 23 August 2018). (In Polish)
- Koc, J. The effect of the intensity of the area’s use on the amount of nutrients outflow from agricultural areas. Roczn. AR w Poznaniu 1998, 52, 101–106. (In Polish) [Google Scholar]
- Rajda, W.; Ostrowski, K.; Kowalik, T.; Marzec, J. Chemical erosion in agricultural micro-watersheds in the areas at the mountain feet. Rocz. AR w Poznaniu 1994, 266, 139–152. (In Polish) [Google Scholar]
- Dupas, R.; Delmas, M.; Dorioz, J.M.; Garnier, J.; Moatar, F.; Gascuel-Odoux, C. Assessing the impact of agricultural pressures on N and P loads and eutrophication risk. Ecol. Indic. 2015, 48, 396–407. [Google Scholar] [CrossRef]
- Laflen, J.M.; Moldehauer, W.C. Pioneering Soil Erosion Prediction: The USLE Story; World Association of Soil and Water Conservation: Bangkok, Thailand, 2003. [Google Scholar]
- Shainberg, I.; Mamedow, A.I.; Levy, G.J. Role of wetting rate and rain energy in seal formation and erosion. Soil Sci. 2003, 168, 54–62. [Google Scholar] [CrossRef]
Figure 1.
Research location in the agricultural loess catchment in Wielkopole.

Figure 2.
Schema of the catcher surface and subsurface runoff.

Figure 3.
Rainfall erosivity index EI30 in dependence on rainfall amount.

Figure 4.
Surface runoff of water (a) and subsurface runoff of water (b) in dependence on the rainfall amount.
Figure 4.
Surface runoff of water (a) and subsurface runoff of water (b) in dependence on the rainfall amount.

Figure 5.
Soil loss through surface runoff per unit area depending on the rainfall amount (a) and index EI30 (b).
Figure 5.
Soil loss through surface runoff per unit area depending on the rainfall amount (a) and index EI30 (b).

Figure 6.
Soil loss in the subsurface runoff per unit area depending on rainfall amount (a) and index EI30 (b).
Figure 6.
Soil loss in the subsurface runoff per unit area depending on rainfall amount (a) and index EI30 (b).

Figure 7.
Soil losses during surface (a) and subsurface (b) runoff in 2008–2011.

Figure 8.
Mass of eroded chemical components (surface runoff).

Figure 9.
Mass of eroded chemical components (subsurface runoff).


Table 1.
Date of occurrence and amount of erosive precipitation.
| Month | 2008 | 2009 | 2010 | 2011 | ||||
|---|---|---|---|---|---|---|---|---|
| Day | Rainfall (mm) | Day | Rainfall (mm) | Day | Rainfall (mm) | Day | Rainfall (mm) | |
| Apr | - | - | - | - | - | - | 11–12 | 21.2 |
| May | 2–4 18–20 | 22.2 26.3 | 19 | 18.2 | 14–18 | 31.2 | 2 | 33.2 |
| Jun | - | - | 6 23 25 | 19.1 19.8 50.8 | 1–3 19–20 | -37.2 23.2 | - 29–30 | 32.1 |
| Jul | 7 20–22 | 31.5 28.4 | 25 | 15.3 | 24 | 59.8 | 3–4 5 14–15 20 27–28 | 63.5 57.2 38.8 32.1 46.3 |
| Aug | - | - | - | - | 6–7 9 30 | 44.2 63.6 41.5 | 13–14 18 | 42.1 22.2 |
| Sep | 16–20 | 46.1 | - | - | - | - | - | - |
Table 2.
Monthly and annual rainfall totals (mm) in the catchment in Wielkopole in the hydrological years 2008–2011 and average values from 1987–2011.
Table 2.
Monthly and annual rainfall totals (mm) in the catchment in Wielkopole in the hydrological years 2008–2011 and average values from 1987–2011.
| Year | Month | Sum (mm) | |||||||||||
|---|---|---|---|---|---|---|---|---|---|---|---|---|---|
| Nov | Dec | Jan | Feb | Mar | Apr | May | Jun | Jul | Aug | Sep | Oct | ||
| 2008 | 45.7 | 19.7 | 42.3 | 21.3 | 78.9 | 49.3 | 70.2 | 39.0 | 102.3 | 77.8 | 108.9 | 52.1 | 707.5 |
| 2009 | 26.6 | 24.0 | 25.2 | 20.0 | 56.4 | 12.0 | 61.5 | 143.4 | 72.3 | 28.3 | 35.3 | 82.0 | 587.0 |
| 2010 | 41.1 | 47.6 | 35.5 | 37.5 | 14.8 | 29.4 | 100.8 | 71.8 | 169.5 | 200.5 | 102.8 | 16.4 | 867.7 |
| 2011 | 42.0 | 36.7 | 23.8 | 23.4 | 14.7 | 70.4 | 83.0 | 86.4 | 339.0 | 109.0 | 16.2 | 30.7 | 875.3 |
| Average long-term 1987–2011 | 39.8 | 34.0 | 31.5 | 30.2 | 39.8 | 50.9 | 61.1 | 74.4 | 97.1 | 73.1 | 65.2 | 39.0 | 636.1 |
Table 3.
Soil granulometric composition.
| Horizon | Depth (cm) | Percent of Fraction of Diameter in mm | Sum of Floatable Parts <0.02 | |||||
|---|---|---|---|---|---|---|---|---|
| 1–0.1 | 0.1–0.05 | 0.05–0.02 | 0.02–0.006 | 0.006–0.002 | <0.002 | |||
| Ap | 0–24 | 4.1 | 15.2 | 46.5 | 17.2 | 10.8 | 6.2 | 34.2 |
| Bt2 | 24–52 | 3.9 | 15.5 | 47.3 | 16.5 | 10 | 6.8 | 33.3 |
| BC | 52–70 | 2.7 | 17.1 | 46.2 | 16.3 | 9.6 | 8.1 | 34.0 |
| Cca | >70 | 2.8 | 15.8 | 47.9 | 17.4 | 8.2 | 7.9 | 33.5 |
Table 4.
Selected physical properties of the studied soils.
| Horizon | Depth (cm) | Specific Density | Bulk Density | Total Porosity | Water Permeability |
|---|---|---|---|---|---|
| (Mg m−3) | (Mg m−3) | (%) | (×10−6 m s−1) | ||
| Ap | 0–25 | 2.59 | 1.40 | 45.9 | 6.152 |
| Bt2 | 25–35 | 2.67 | 1.63 | 39.0 | 2.132 |
| Bt2 | 35–52 | 2.65 | 1.60 | 39.6 | 3.256 |
| BC | 52–70 | 2.64 | 1.59 | 39.8 | 3.746 |
| Cca | >70 | 2.64 | 1.63 | 38.3 | 3.869 |
Table 5.
Range, average and standard deviation values characterizing the precipitation as well as the quantity and quality of water outflow from the slope.
Table 5.
Range, average and standard deviation values characterizing the precipitation as well as the quantity and quality of water outflow from the slope.
| Parameter | Year | |||
|---|---|---|---|---|
| 2008 | 2009 | 2010 | 2011 | |
| Range | ||||
| Average/Standard Deviation | ||||
| Rainfall (mm) | 22.2–46.1 | 15.3–50.8 | 31.2–63.6 | 21.2–63.5 |
| 30.9/8.1 | 24.6/13.2 | 42.9/13.5 | 38.9/13.1 | |
| Kinetic energy per area unit (J ha−1) | 132.5–388.6 | 176.3–623.5 | 145.1–699.3 | 123.5–586.7 |
| 235.6/111.4 | 310.5/169.3 | 376.1/199.7 | 315.1/164.4 | |
| Index EI30 (MJ mm ha−1 h−1) | 11.5–145.6 | 53.4–324.5 | 23.5–450.2 | 8.9–396.1 |
| 49.6/50.7 | 115.3/104.9 | 197.1/162.8 | 134.7/113.1 | |
| Surface Runoff | ||||
| Outflow (mm) | 2.8–8.9 | 3.4–12.3 | 3.2–18.2 | 1.2–11.2 |
| 4.4/2.3 | 5.6/3.4 | 10.9/4.9 | 5.9/2.6 | |
| Soil suspension (g dm−3) | 56.365–186.235 | 12.421–156.232 | 98.445–301.278 | 9.345–175.324 |
| 120.323/53.712 | 43.376/56.474 | 190.817/74.899 | 82.855/55.273 | |
| N-Ntot (mg dm−3) | 0.923–5.854 | 0.652–5.023 | 1.156–6.321 | 0.956–5.354 |
| 3.088/2.043 | 2.655/1.641 | 3.721/2.080 | 2.147/1.593 | |
| N-NH4 (mg dm−3) | 0.501–2.524 | 0.354–2.498 | 0.654–4.224 | 0.551–3.195 |
| 1.450/0.882 | 1.359/0.785 | 3.721/1.311 | 1.161/0.913 | |
| N-NO3 (mg dm−3) | 0.222–1.623 | 0.156–1.212 | 0.247–1.514 | 0.211–1.365 |
| 0.856/0.620 | 0.658/0.409 | 0.858/0.405 | 0.543/0.407 | |
| N-NO2 (mg dm−3) | 0.102–1.315 | 0.118–0.956 | 0.113–0.921 | 0.098–0.786 |
| 0.533/0.465 | 0.421/0.330 | 0.478/0.336 | 0.260/0.227 | |
| P (mg dm−3) | 0.039–1.141 | 0.041–0.852 | 0.131–2.105 | 0.112–1.125 |
| 0.454/0.495 | 0.452/0.350 | 0.837/0.814 | 0.393/0.375 | |
| K (mg dm−3) | 1.126–5.023 | 1.156–5.234 | 0.885–7.852 | 0.698–5.734 |
| 2.965/1.431 | 3.201/1.419 | 3.185/2.602 | 2.230/1.834 | |
| Subsurface Runoff | ||||
| Outflow (mm) | 0.5–0.9 | 0.5–2.3 | 0.3–3.6 | 0.2–3.6 |
| 0.7/0.2 | 1.0/0.6 | 1.4/1.3 | 1.2/0.9 | |
| Soil suspension (g dm−3) | 1.213–3.245 | 1.456–23.455 | 1.245–51.235 | 1.021–24.254 |
| 2.216/0.905 | 6.474/8.524 | 20.208/19.292 | 10.560/8.809 | |
| N-Ntot (mg dm−3) | 1.345–8.542 | 1.561–8.245 | 1.982–8.256 | 1.132–8.563 |
| 4.619/3.153 | 3.651/2.549 | 4.882/2.639 | 3.050/2.513 | |
| N-NH4 (mg dm−3) | 0.723–4.456 | 0.554–4.562 | 0.856–4.952 | 0.525–4.954 |
| 2.380/1.617 | 1.948/1.433 | 2.651/1.66 | 1.584/1.466 | |
| N-NO3 (mg dm−3) | 0.308–2.394 | 0.214–2.280 | 0.512–2.312 | 0.242–2.212 |
| 1.227/0.941 | 0.999/0.733 | 1.311/0.741 | 0.795/0.720 | |
| N-NO2 (mg dm−3) | 0.122–1.456 | 0.098–1.145 | 0.298–0.962 | 0.081–0.985 |
| 0.795/0.561 | 0.410/0.402 | 0.582/0.284 | 0.795/0.307 | |
| P (mg dm−3) | 0.045–1.325 | 0.071–1.008 | 0.312–2.563 | 0.123–1.262 |
| 0.513/0.544 | 0.523/0.397 | 1.081/0.884 | 0.466/0.440 | |
| K (mg dm−3) | 1.156–6.256 | 1.521–5.214 | 1.324–8.234 | 1.023–7.234 |
| 3.461/1.935 | 3.407/1.283 | 3.729/2.602 | 3.126/2.510 | |
Table 6.
The threshold values of water quality indices.
| Index | Threshold Values | |
|---|---|---|
| I Quality Class | II Quality Class | |
| N-NH4 (mg dm−3) | ≤0.78 | ≤1.56 |
| N-NO3 (mg dm−3) | ≤2.2 | ≤5 |
| P-PO4 (mg dm−3) | ≤0.07 | ≤0.10 |
Table 7.
Equation of the dependence of water quality indicators on the concentration of the surface and subsurface runoff water depending on the amount of precipitation and indicator EI30.
Table 7.
Equation of the dependence of water quality indicators on the concentration of the surface and subsurface runoff water depending on the amount of precipitation and indicator EI30.
| Parameter | Rainfall (mm) | R2 | r | EI30—Index | R2 | r |
|---|---|---|---|---|---|---|
| Surface Runoff | ||||||
| N-Ntot (mg dm−3) | y = −0.0486x + 4.5634 | 0.1264 | −0.36 | y = −0.98ln(x) + 7.0755 | 0.3231 | −0.41 |
| N-NH4 (mg dm−3) | y = −0.0246x + 2.3867 | 0.1032 | −0.32 | y = −0.503ln(x) + 3.69 | 0.2715 | −0.39 |
| N-NO3 (mg dm−3) | y = −0.0121x + 1.1377 | 0.1238 | −0.35 | y = −0.263ln(x) + 1.8474 | 0.3695 | −0.40 |
| N-NO2 (mg dm−3) | y = −0.0103x + 0.7673 | 0.1768 | −0.42 | y = −0.182ln(x) + 1.1881 | 0.3464 | −0.44 |
| P (mg dm−3) | y = −0.015x + 1.0676 | 0.1382 | −0.37 | y = −0.275ln(x) + 1.7231 | 0.2922 | −0.47 |
| K (mg dm−3) | y = −0.0622x + 5.022 | 0.1959 | −0.44 | y = −1.05ln(x) + 7.3505 | 0.3516 | −0.49 |
| Subsurface Runoff | ||||||
| N-Ntot (mg dm−3) | y = −0.0872x + 7.2027 | 0.1949 | −0.39 | y = −1.479ln(x) + 10.488 | 0.3717 | −0.45 |
| N-NH4 (mg dm−3) | y = −0.048x + 3.8796 | 0.1789 | −0.37 | y = −0.816ln(x) + 5.6974 | 0.3417 | −0.44 |
| N-NO3 (mg dm−3) | y = 0.0002x2 − 0.0391x + 2.2444 | 0.2102 | −0.40 | y = −0.435ln(x) + 2.974 | 0.3886 | −0.47 |
| N-NO2 (mg dm−3) | y = 0.0002x2 − 0.0258x + 1.2236 | 0.2286 | −0.42 | y = −0.24ln(x) + 1.5563 | 0.4352 | −0.46 |
| P (mg dm−3) | y = −0.0169x + 1.2804 | 0.1333 | −0.32 | y = 0.00001x2 − 0.0072x + 1.2016 | 0.2521 | −0.42 |
| K (mg dm−3) | y = −0.0751x + 6.215 | 0.2201 | −0.41 | y = −1.258ln(x) + 8.9784 | 0.4120 | −0.52 |
© 2018 by the author. Licensee MDPI, Basel, Switzerland. This article is an open access article distributed under the terms and conditions of the Creative Commons Attribution (CC BY) license (http://creativecommons.org/licenses/by/4.0/).
Share and Cite
MDPI and ACS Style
Mazur, A. Quantity and Quality of Surface and Subsurface Runoff from an Eroded Loess Slope Used for Agricultural Purposes. Water 2018, 10, 1132. https://doi.org/10.3390/w10091132
AMA Style
Mazur A. Quantity and Quality of Surface and Subsurface Runoff from an Eroded Loess Slope Used for Agricultural Purposes. Water. 2018; 10(9):1132. https://doi.org/10.3390/w10091132
Chicago/Turabian StyleMazur, Andrzej. 2018. "Quantity and Quality of Surface and Subsurface Runoff from an Eroded Loess Slope Used for Agricultural Purposes" Water 10, no. 9: 1132. https://doi.org/10.3390/w10091132
Note that from the first issue of 2016, this journal uses article numbers instead of page numbers. See further details here.