Utilization Characteristics and Sustainability Evaluation of Water Resources in China

1
Key Laboratory for Agricultural Soil and Water Engineering in Arid Area of Ministry of Education, Northwest A&F University, Yangling 712100, China
2
Institute of Water Saving Agriculture in Arid regions of China, Northwest A&F University, Yangling 712100, China
3
College of Economics and Management, Northwest A&F University, Yangling 712100, China
*
Authors to whom correspondence should be addressed.
†
These authors contributed equally to this work.
Water 2018, 10(9), 1142; https://doi.org/10.3390/w10091142
Submission received: 12 June 2018
/
Revised: 24 July 2018
/
Accepted: 3 August 2018
/
Published: 27 August 2018
(This article belongs to the Section Water Resources Management, Policy and Governance)
Abstract
:Water is an important factor of production contributing to all sectors and regions in the world. With the rapid development of the economy and the increase of population, the water crisis is becoming more and more serious, and will become an important obstacle to the sustainable development of society. It is particularly important to evaluate the sustainability of water resources utilization. Based on the analysis of the regional water resources utilization characteristics, this paper takes 31 provinces in mainland China as the research object and comprehensively evaluates the regional water resources’ sustainability from the aspects of hydrology, environment, economy and technology. The results show: From the regional perspective, the regionalization of China’s various indexes is obvious, the hydrological and environmental indexes in western regions are significantly higher than that in eastern regions; while the economic index in eastern regions is higher than that in western regions. From the time perspective, from 2010 to 2015, the sustainable development of water resources in seven provinces showed an increasing trend. Zhejiang changed from “Good” to “Excellent” and Hubei, Hunan, Guangxi, Sichuan, Guizhou and Xinjiang all had slight growth. There are six provinces which show varying degrees of decline, of which Liaoning changes from “Excellent” to “Medium”, Beijing, Hebei, Jilin, Guangdong, Hainan also had a slight decline; the rest of the provinces did not change, Qinghai and Chongqing have been maintained as “Excellent”. Taken together, the western regions of China have significant advantages in terms of quantity and quality of water resources, but its water use efficiency is low. However, the economic development in the eastern regions is rapid with high efficiency of water use, but there are some serious problems such as water resources insufficiency and river pollution.
1. Introduction
Water is an indispensable basic resource for mankind to survive and is an irreplaceable natural resource for industrial and agricultural production and social and economic development [1]. On the one hand, with the acceleration of China’s industrialization and urbanization, the contradictions between social and economic development and water resources and water environment become more prominent [2]. On the other hand, due to the backward technology of industrial and agricultural water use, the waste of water resources is serious; the deterioration of the ecological environment and water pollution have become increasingly prominent [3]. As a result, the contradictions between supply and demand of water resources become increasingly acute. The issue of water resources has become a bottleneck in the social and economic development of the country. Therefore, it is urgent to realize the sustainable development of water resources. The evaluation of sustainable use of regional water resources is the foundation and precondition of sustainable water resources management [4]. It plays a guiding role in the rational development, utilization, effective management and protection of water resources. It is of great significance to realize the sustainable development of social economy and the ecosystem’s virtuous circle [5].
Regarding the aspect of the evaluation index system of the sustainable utilization of water resources, Hellström, et al. established the evaluation criteria and evaluation system of sustainable development of water resources [6]; Ioris, et al. established a comprehensive water resources management indicator system at the basin scale, which is based on environmental, social, economic and other aspects to explore the factors that affect sustainable development [7]; The Blue Water Sustainability Index (BWSI) was introduced by Wada, et al. as a new indicator to evaluate the sustainability of global water consumption during the period of 1960 to 2010 [8]; The scientific use of water resources was proposed by Thomas based on space-temporal evolution and interdiscipline [9]; Loukas, et al. constructed a comprehensive evaluation system for sustainable development of water resources, and used a water demand forecasting model, hydrological model and reservoir management model to explore water resources management measures that affect the balance between supply and demand [10]; Ryu, et al. adopted indicators about runoff, cultivated area, forest area, residential and industrial land to evaluate water resources in East Snake Plain, Idaho, USA [11]; Pires, et al. evaluated 170 indicators related to water resources utilization and management to identify whether they meet the sustainable conditions [12]; Lumb, et al. were mainly from five aspects such as the resource level, ecosystem health, human health, infrastructure utilization and economic level to analyze the indicator system [13]; Iribarnegaray, et al. screened 15 indicators in terms of the level of water resources availability, infrastructure-related water resources and government planning [14]; Ding, et al. discussed state-of-the-art management and indicators to assess water scarcity with regards to water supply and demand [15]. Regarding the aspect of research scale, they are countries, regions and watersheds, respectively [16,17,18]. In terms of research methods, Sun, et al. used the system dynamics model to simulate China’s water supply and demand during 2005–2020 [19]; Chen, et al. evaluated the sustainable use of urban water resources based on disaster theory [20]; Xu, et al. evaluated the sustainability of water resource uses in Hunan Province by using the gray water footprint assessment method [21]; Sun, et al. established the index system based on the DPSIR model and evaluated the sustainability of water resources [19]; Karatayev, et al. assessed the key factors affecting the sustainable management of water resources in Kazakhstan based on stakeholder relations [22]; Lou, et al. discussed the relationship between sustainable use of water resources and the carrying capacity of water resources, and evaluated the sustainable use of resources with neural networks method [23]; Dai, et al. adopted the fuzzy hierarchy process and projection pursuit model to evaluate the sustainable use of regional water resources [24].
Previous studies on the sustainable development and the sustainable utilization of water resources are quite rich, but most of them have focused on the establishment and improvement of the evaluation indexes, or evaluating the sustainable utilization of water resources from the quantity and quality of water resources solely; the sustainability of water resources cannot be fully and completely reflected. Therefore, a scientific evaluating method is needed to evaluate the regional water resources conditions and the compatible extent between regional water resources and all aspects of development.
This paper takes 31 provinces in mainland China as the research object, and evaluates the regional water resources endowment and utilization characteristics by constructing a hydrological, environmental, economic, scientific and technological index from four dimensions, and explores the spatial differences and temporal evolution of water resource’s sustainability of 31 provinces with a spatial autocorrelation method. This study can provide reference for the evaluation and management of regional water resources.
2. Data and Methods
2.1. Data Sources
The data required for this study include regional total water resources, population, total water consumption, regional river water quality and river length, regional GDP, regional research and development investment, and water conservancy environment investment. These data mainly come from “China Statistical Yearbook” [25] and “China Water Resources Bulletin” [26].
2.2. Methods
2.2.1. Index Selection
In this paper, a total of five evaluation indexes are selected to evaluate the sustainable utilization of regional water resources, they are Hydrological Index (H), Environmental Index (En), Economic Index (Ec), Technology Index (T) and the Watershed Sustainability Index (WSI). The evaluation indexes are determined as follows:
The hydrological index is determined by two variables, per capita water resources (WP) and water resources utilization rate (R). WP > 6800; 5100 < WP < 6800; 3400 < WP < 5100; 1700 < WP < 3400, WP< 1700 correspond to indexes for 1.00, 0.75, 0.50, 0.25, 0.00, respectively, and the evaluations are “Excellent”, “Good”, “Medium”, “Poor”, “Worst”. R < 20%, 20% < R < 30%, 30% < R < 40%, 40% < R < 50%, R > 50% correspond to indexes for 1.00, 0.75, 0.50, 0.25, 0.00, respectively, and have the same evaluation from “Excellent” to “Worst”. The final hydrological index is the average value of the two indexes. WP and R are calculated as follows:
where WP is the regional per capita water resources, m3/person; W is the regional total water resources, m3; P is the regional total population; R is the regional water resources utilization rate, %; Wu is the regional water consumption, m3.
The environmental index is mainly determined by the river water quality. The river water quality is mainly divided into I, II, III, IV, V and below according to the criteria of water quality (Table 1), and the corresponding water quality level index Li are respectively 1.00, 0.75, 0.5, 0.25, 0.00. Calculating the regional water quality index RQ with the weighted average method, then according to the top 20%, 20–40%, 40–60%, 60–80%, 80–100%, environmental index indexes are respectively 1.00, 0.75, 0.5, 0.25, 0.00, and evaluation is from “Excellent” to “Worst”. RQ is calculated as follows:
where RQ is regional water quality index; Li is water quality level index; fi is the length of river with i level water quality accounts for the total length of the river.
The economic index is mainly based on the comprehensive output value per cubic meter of water (V), and then according to the top 20%, 20–40%, 40–60%, 60–80%, 80–100%, environmental index indexes are respectively 1.00, 0.75, 0.5, 0.25, 0.00. Evaluation is from “Excellent to “Worst”. V is calculated as follows:
where V is the regional comprehensive output value per cubic meter of water, yuan/m3; GDP is gross regional product, yuan; Wu is the regional water consumption, m3.
The technology index of this paper is mainly determined by the per capita R&D funding (FP) and per capita water environment investment (IP) [27]. Per capita R&D funding according to the top 220%, 20–40%, 40–60%, 60–80%, 80–100% correspond to indexes for 1.00, 0.75, 0.50, 0.25, 0.00, respectively, and water environment investment according to the top 20%, 20–40%, 40–60%, 60–80%, 80–100% correspond to indexes for 1.00, 0.75, 0.50, 0.25, 0.00, respectively. The final technology index is the average value of the two indexes. FP and IP are calculated as follows:
where FP is the regional per capita R&D funding, yuan/person; FR&D is the regional investment in research and development, yuan; PR&D is the regional number of researchers; IP is the regional per capita water environment investment, yuan/person; Ie is the regional total water environment investment, yuan; P is the regional total population.
The Watershed Sustainability Index (WSI) is the average value of Hydrological Index, Environmental Index, Economic Index, Technology Index [28]. According to the top 10%, 10–30%, 30–70%, 70–100%, corresponding indexes are respectively 1.00, 0.75, 0.50, 0.25, 0.00, and the evaluation is from “Excellent” to “Worst”. WSI is calculated as follows:
where H is Hydrological Index, En is Environmental Index, Ec is Economic Index, T is Technology Index.
2.2.2. Spatial Autocorrelation Analysis Method
The purpose of spatial autocorrelation analysis is to determine whether a variable is spatially relevant and reflects the degree of spatial dependence between the values of the variables geographically. The most commonly used method in spatial autocorrelation analysis is Moran’s I [29]. This paper mainly uses the Local Indicators of Spatial Association (LISA), LISA cluster map categorizes the nature of the spatial autocorrelation into four types: High–High (H-H), Low–Low (L-L), High–Low (H-L) and Low–High (L-H) [30]. H-H and L-L are the observation of a phenomenon that appears high or low spatially, and the surrounding areas are also high or low, which shows a spatial positive correlation. H-L is areas with high observation and surrounding areas are low, L-H is areas with low observations and surrounding areas are high, which shows a spatial negative correlation. GeoDa software was adopted to conduct the local spatial autocorrelation analysis of evaluation indexes to explore their spatial agglomeration characteristics, so as to illustrate the characteristics of the sustainable utilization of regional water resources in China more directly and provide reference for the sustainable development of regional water resources.
3. Results
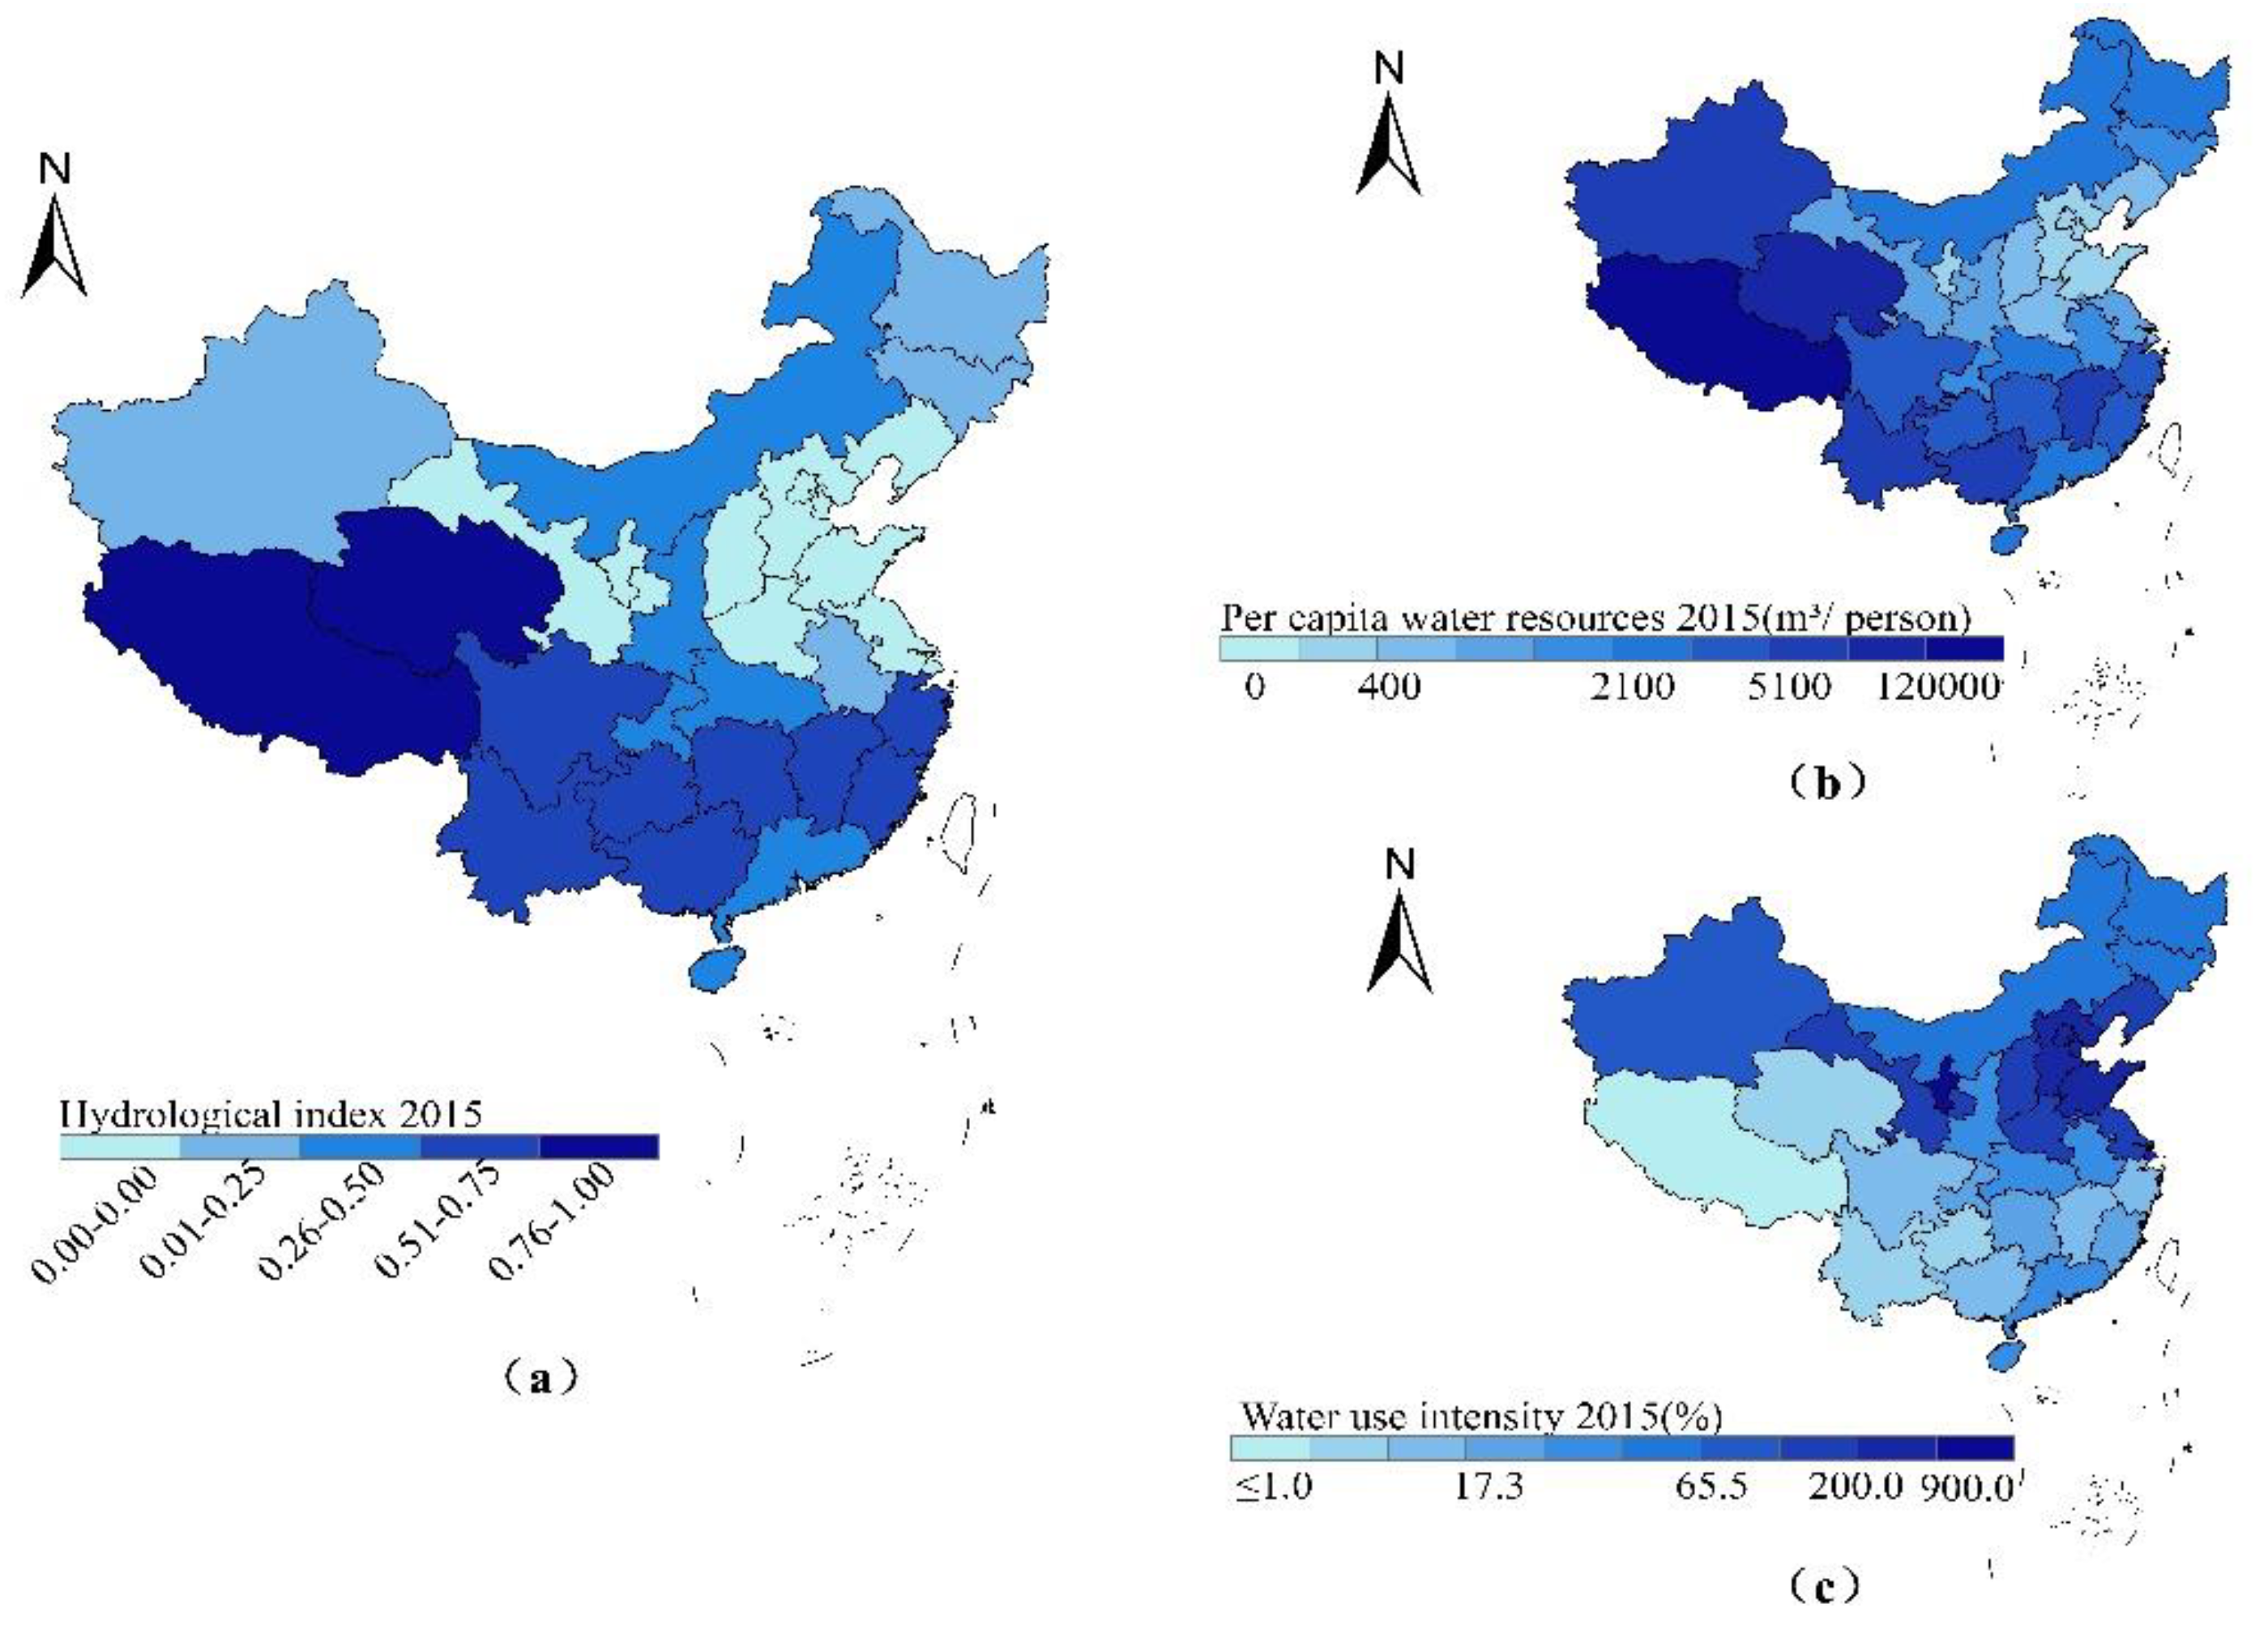
3.1. Spatial Distribution Characteristics of Hydrological Index
Figure 1 shows the spatial distribution of (a) hydrological index, (b) per capita water resources and (c) the water resources utilization rate of 31 provinces in mainland China in 2015. The regional differences in the utilization of water resources in China are obvious, there are only two provinces whose hydrological indexes are in the “Excellent” category, respectively, Tibet and Qinghai, which are both in the western regions. Ten provinces in the “Poor”, the east regions, account for 8. The specific grades of each evaluation index in each province are shown in Table 2. The per capita water resources in these provinces are far below the standard; their water resources utilization rate is more than 50%, even Beijing, Tianjin, Hebei, Shanghai, Jiangsu, Ningxia and other provinces have all exceeded 100%. Here, Ningxia has an extremely high utilization rate of water resources because of the amount of water used from transit rivers.
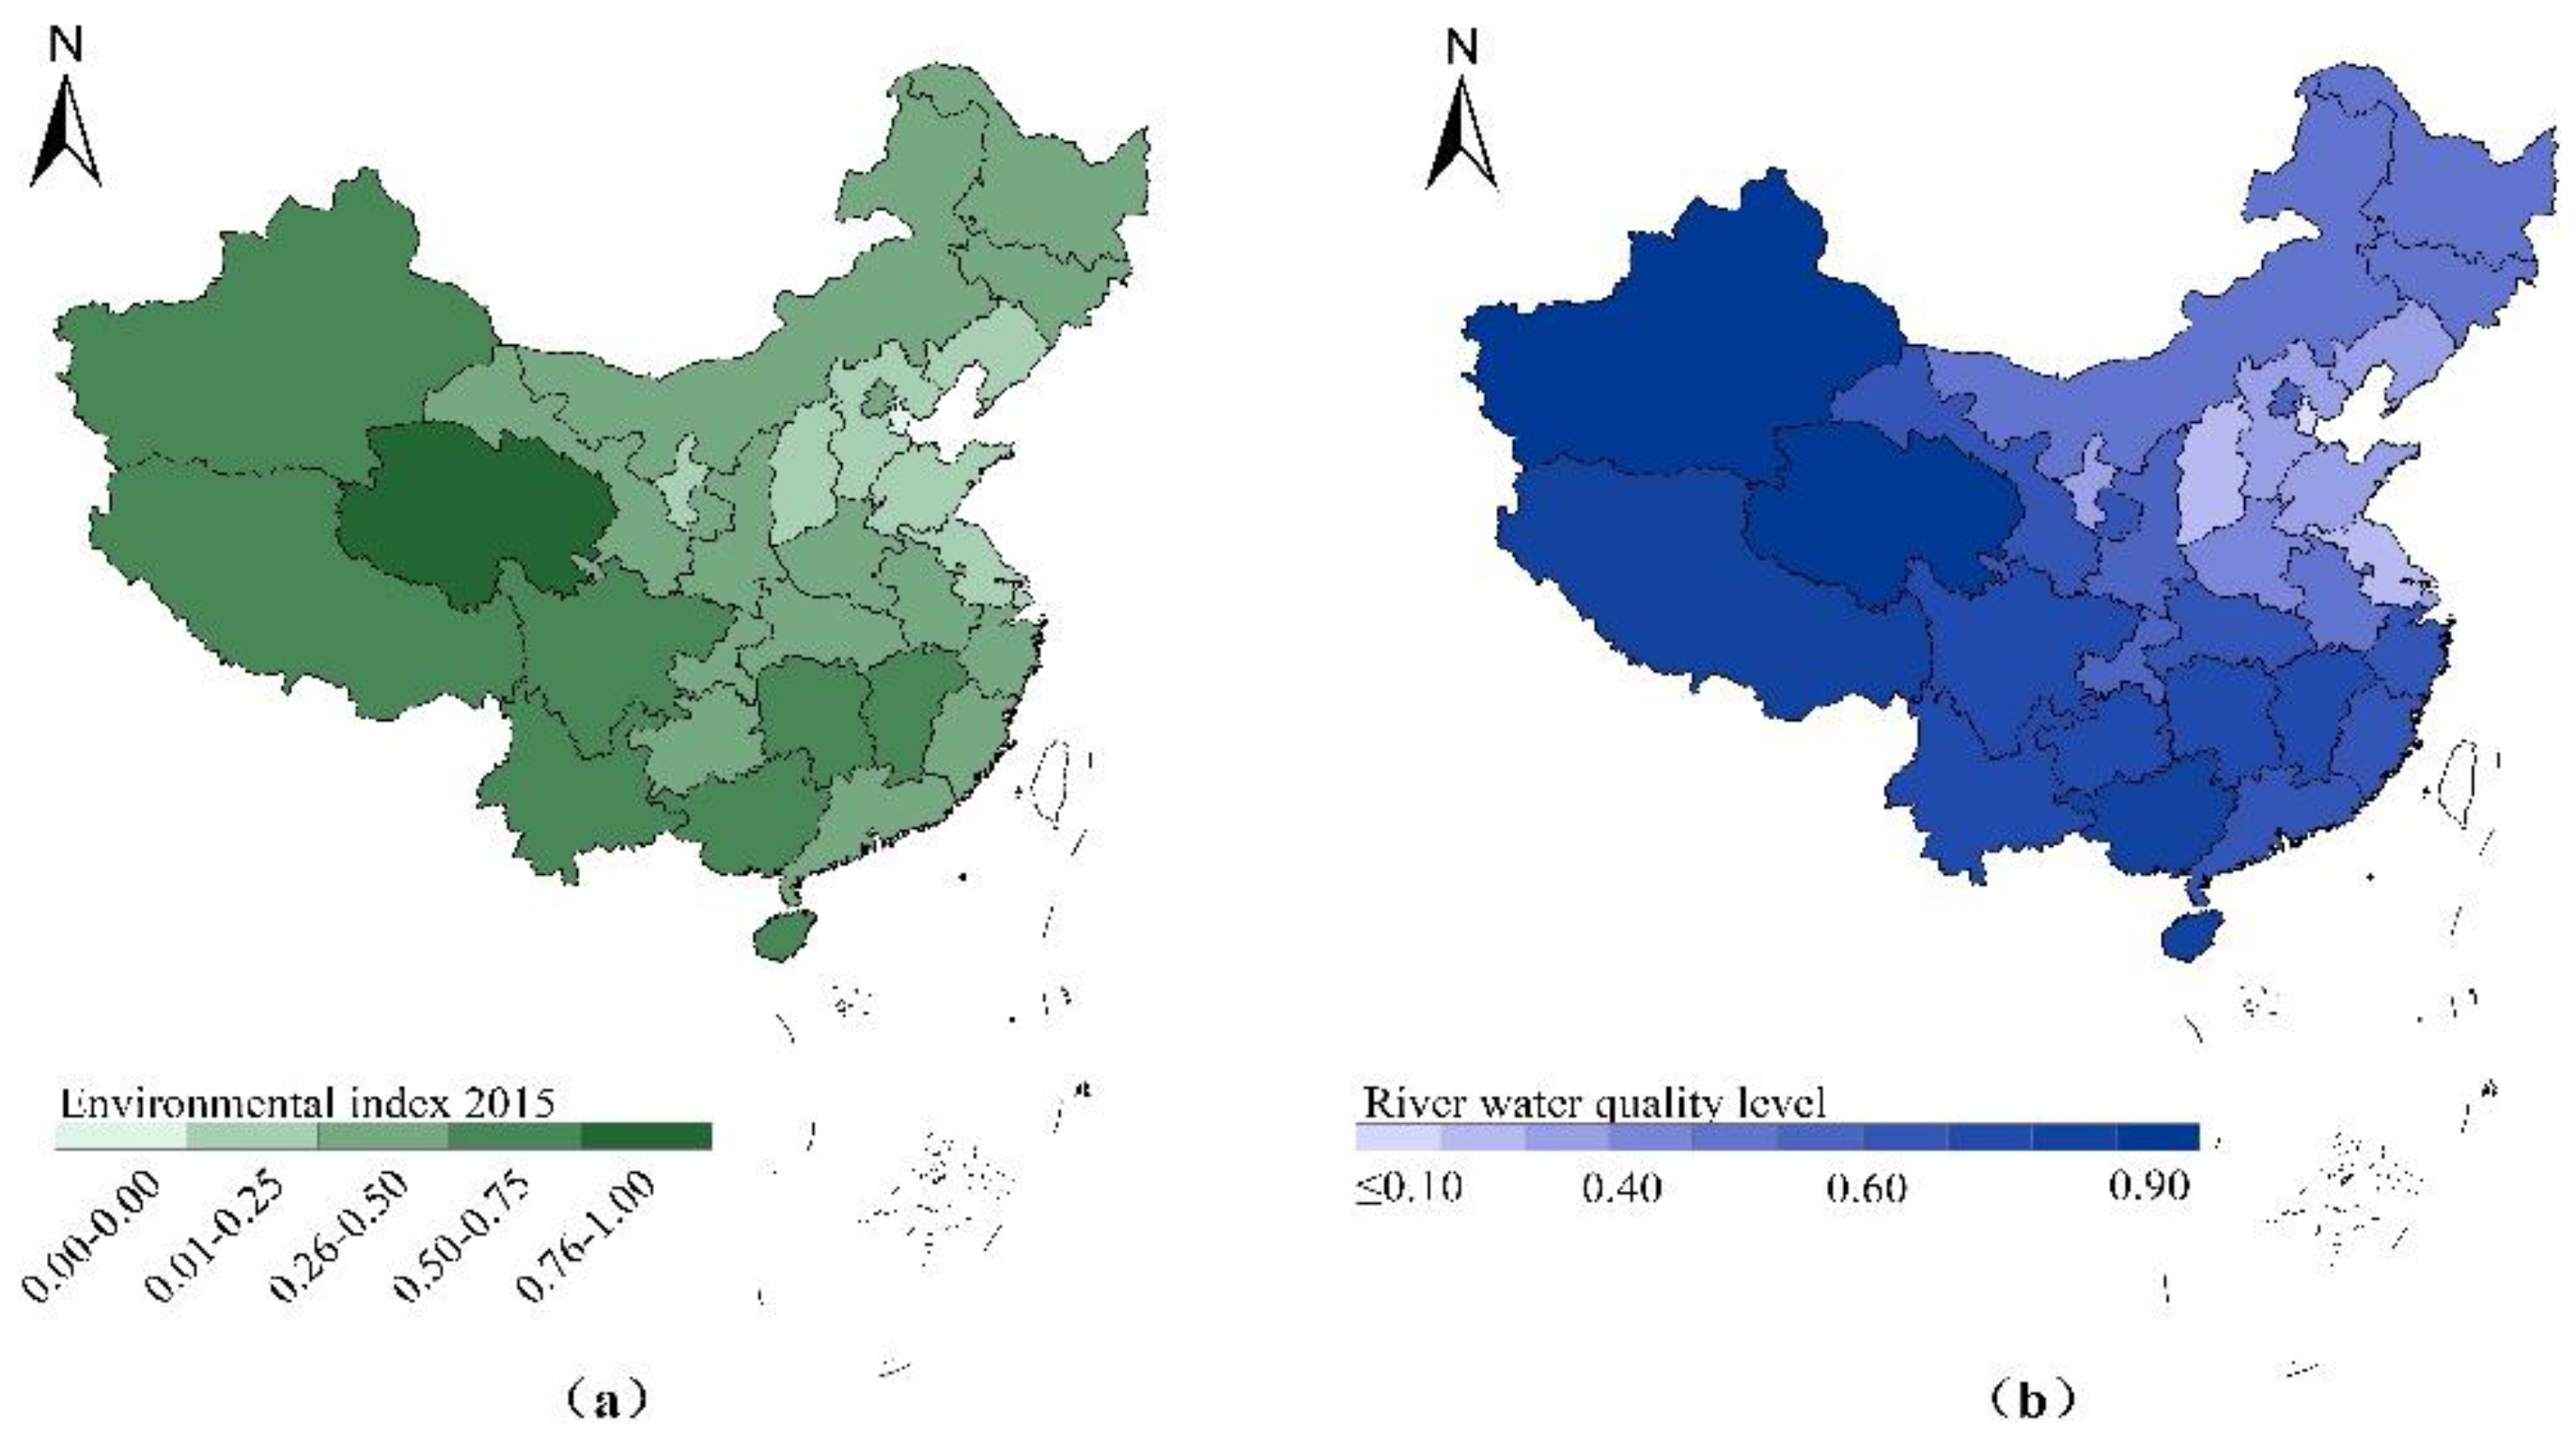
3.2. Spatial Distribution Characteristics of Environmental Index
Figure 2 shows the spatial distribution of (a) the regional environmental index and (b) river water quality level in 2015. Provinces in “Excellent” or “Good” are: Qinghai, Xinjiang, Tibet, Yunnan, Guangxi, Sichuan, Hainan, Jiangxi and Hunan. Most of these provinces are located in the west, and the water quality of rivers in these provinces is also relatively high. The provinces at the level of “Poor” or “Worst” are: Tianjin, Ningxia, Hebei, Shanxi, Liaoning, Shanghai, Jiangsu and Shandong. Most of these provinces are located in the economically developed eastern part of the country, and their water quality in these provinces is relatively low; the regional environmental pollution is serious.
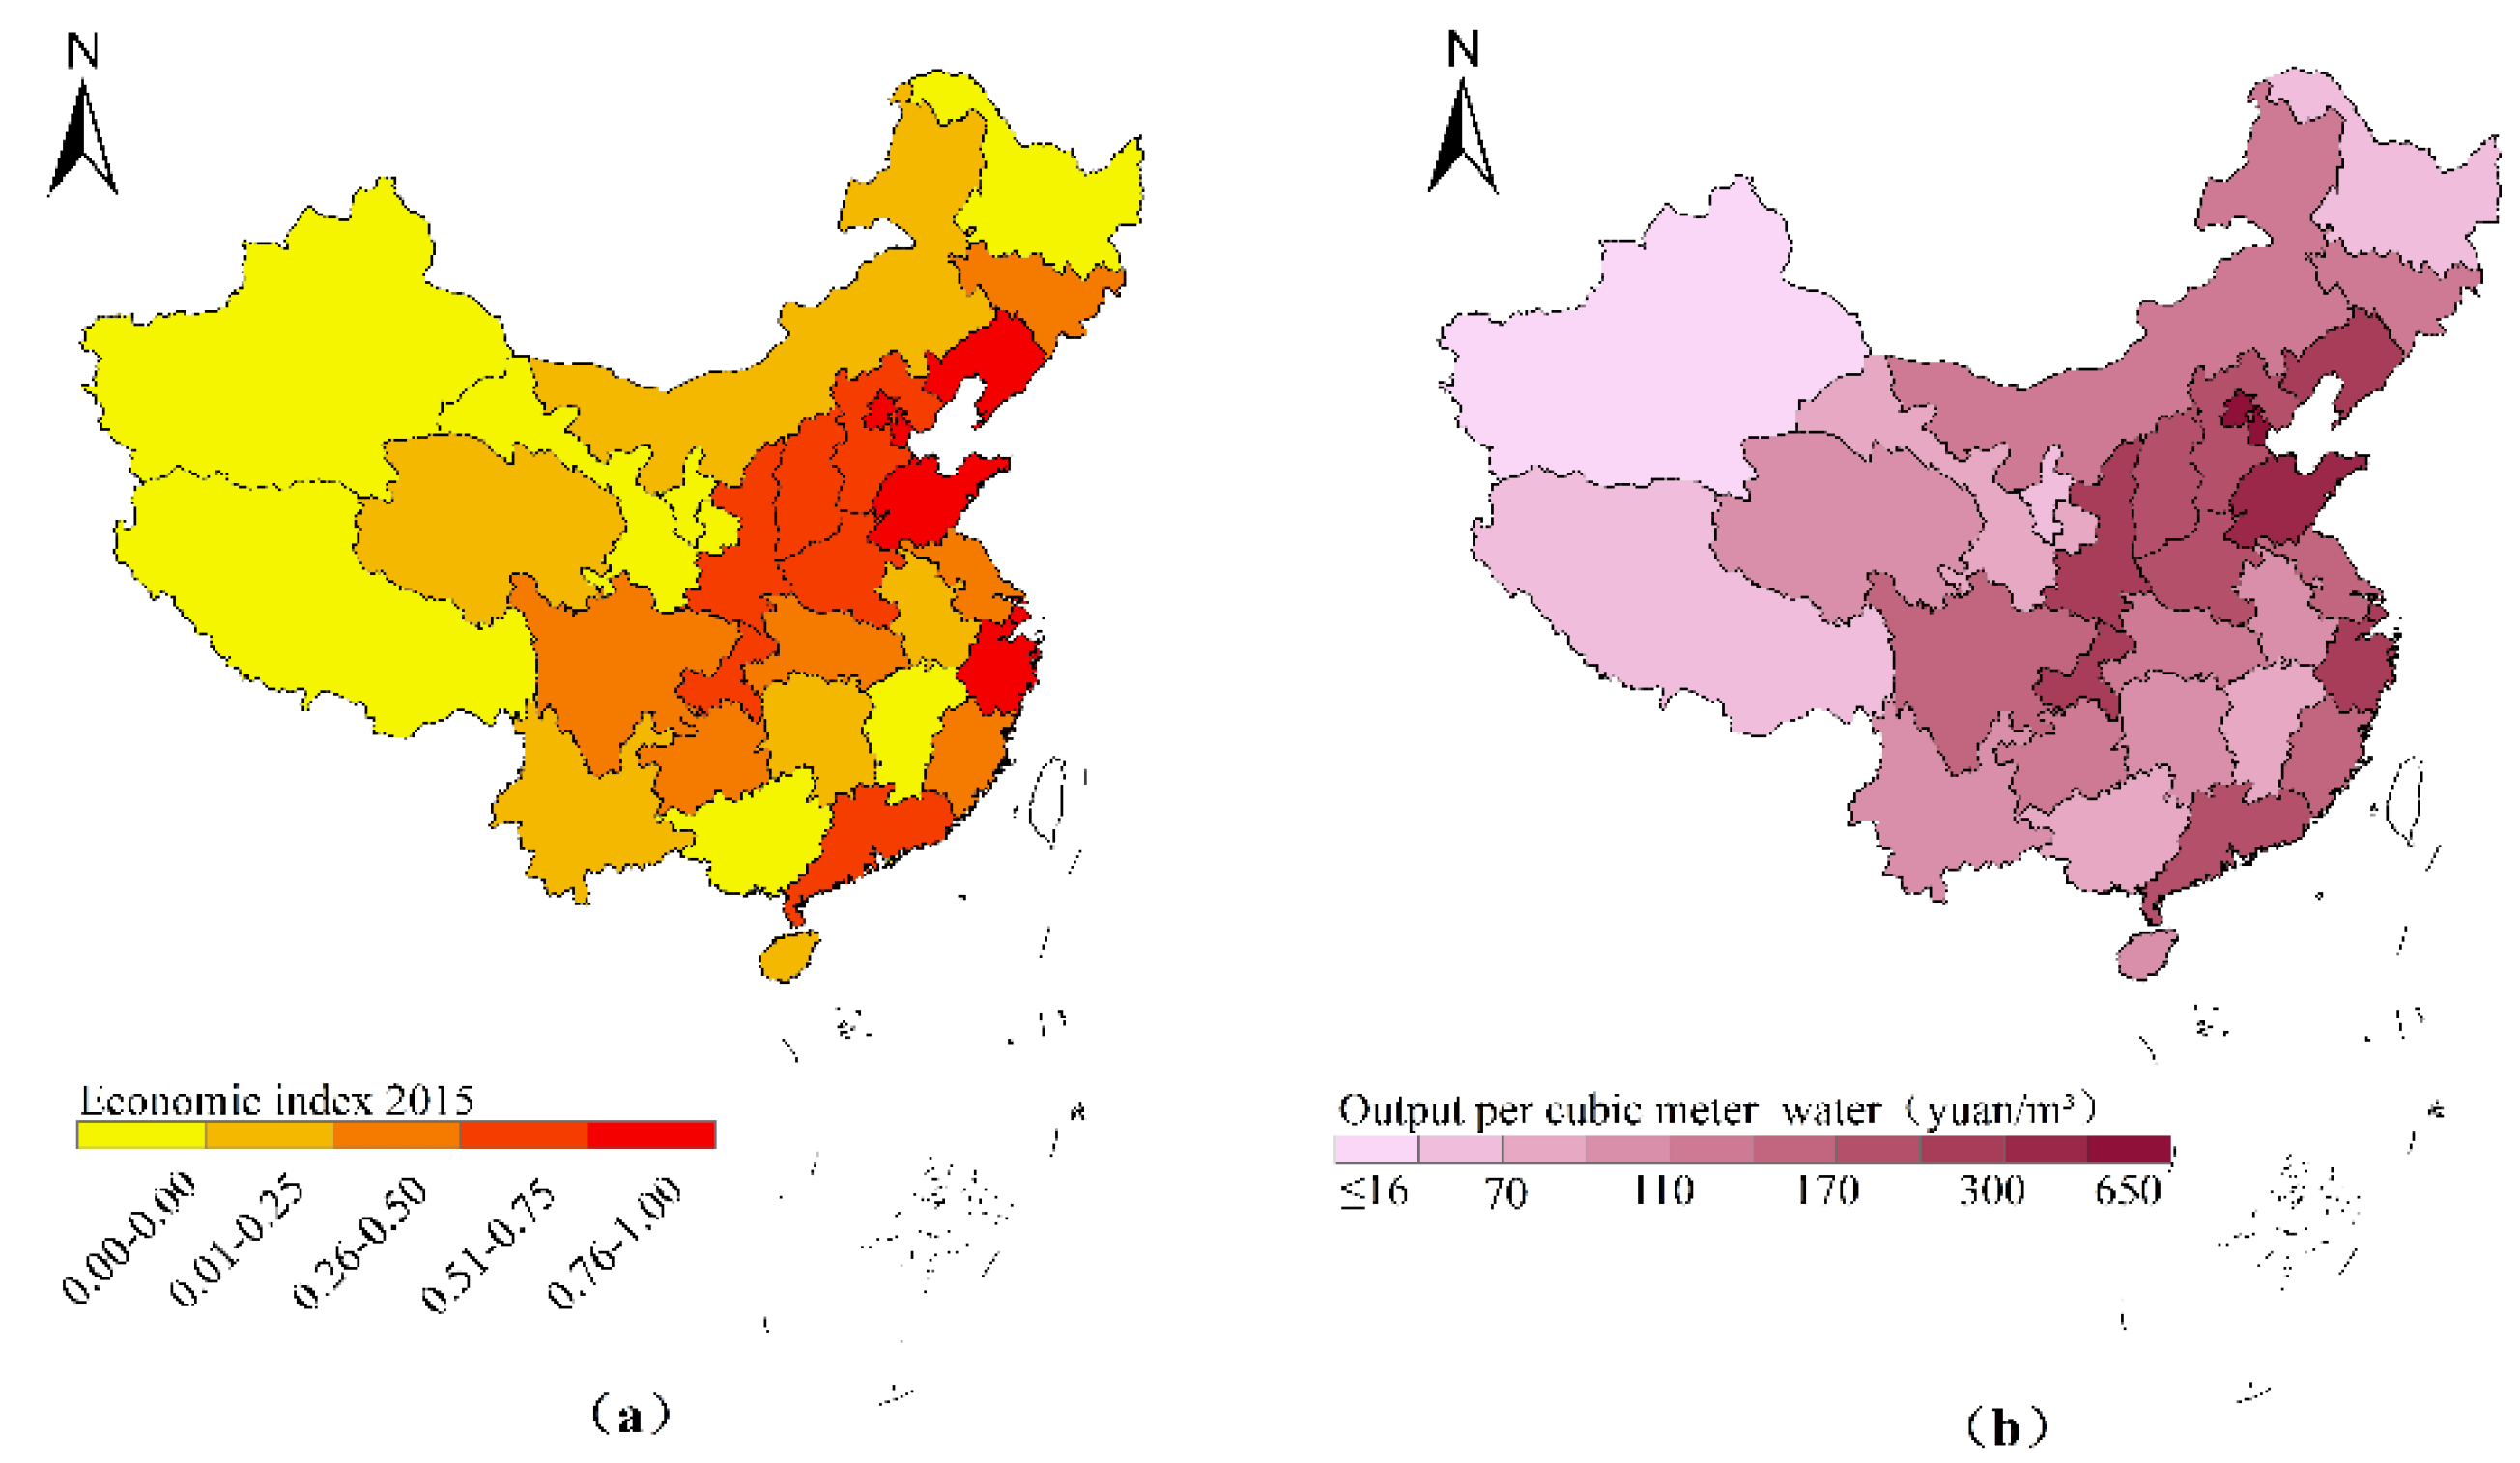
3.3. Spatial Distribution Characteristics of Economic Index
Figure 3 shows the spatial distribution of (a) the regional economic index and (b) the comprehensive output value per cubic meter of water in 2015. A total of 12 provinces’ economic indexes are at the level of “Excellent” or “Good”, most of them are located in the economically developed regions of North and East China, such as Beijing, Tianjin, Liaoning, Hebei, Shandong and Henan, and the southeastern coastal provinces such as Zhejiang, Shanghai and Guangdong are also at the level of “Excellent”. There are seven provinces in the “Worst”, respectively, Heilongjiang, Jiangxi, Guangxi, Tibet, Gansu, Ningxia, Xinjiang. Thus, the efficiency of economic development and water use in our country is quite different between the eastern, central and western regions. The efficiency of water use in the eastern regions are high, and the central and western regions still need to be improved.
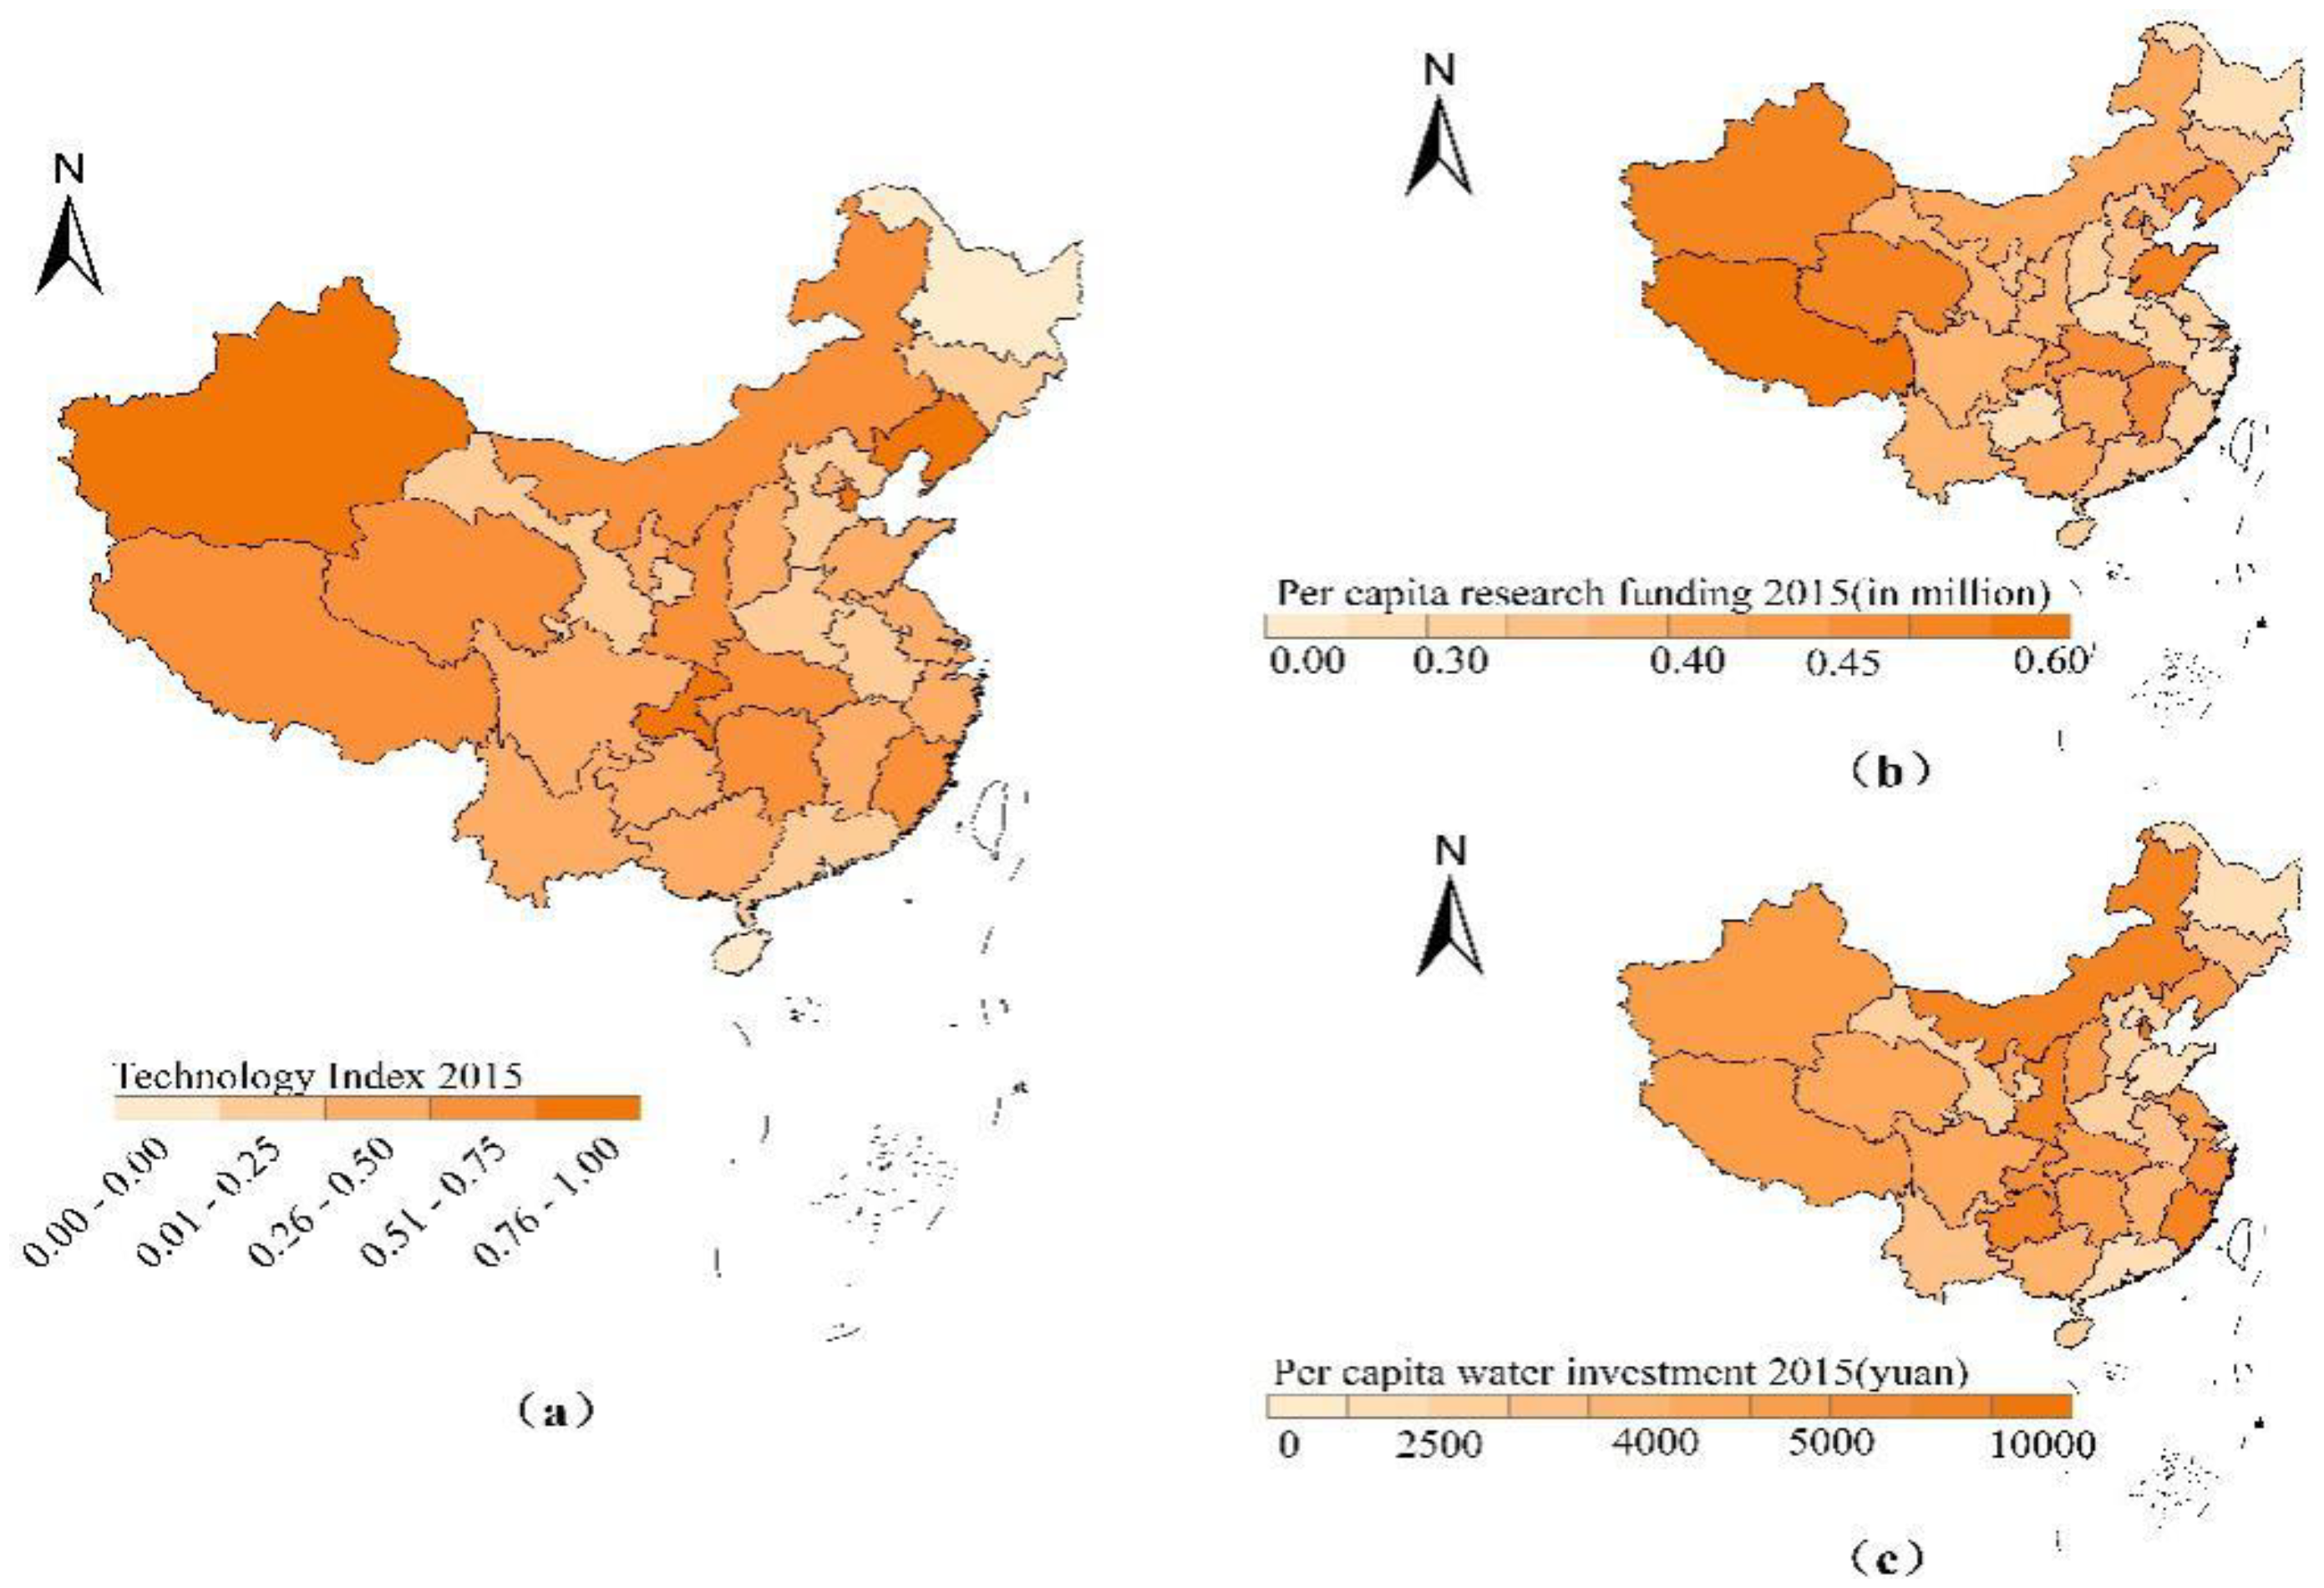
3.4. Spatial Distribution Characteristics of Technology Index
Figure 4 shows the spatial distribution of (a) the technology index, (b) the per capita R&D funding and (c) the per capita water environment investment in 2015. The regionalization of the technology index is not obvious. Most provinces are at the level of “Good” or “Medium”. The provinces at the level of “Excellent” or “Good” are: Tianjin, Xinjiang, Liaoning and Chongqing, these provinces have relatively high per capita scientific research funding and per capita water environment investment. With regards to other provinces such as Shandong, Jiangsu, Zhejiang and Guangdong, data shows that their investment in research and water conservancy are not low, but their technology indexes are lower, this is due to their larger population base. Provinces in the “Worst” are Heilongjiang and Hainan; the scientific research funding and investment in water conservancy environment of the two provinces are relatively few.
3.5. Spatial Distribution Characteristics of WSI
Figure 5 shows the spatial distribution of WSI in 2015. The provinces in “Excellent” are: Qinghai, Zhejiang and Chongqing. Qinghai’s hydrological and environmental indexes are 1.00, technology index is 0.75 and economic index is 0.25; Zhejiang’s economic index is 1.00, hydrological index is 0.75, technology and environmental indexes are 0.50; Chongqing’s hydrological and environmental indexes are 0.50, technology index is 1.00, economic index is 0.75. Although the three provinces are relatively good, they each have strengths and weaknesses. Beijing, Tianjin, Liaoning and Shanghai have a relatively high technology index and economic index, but their hydrological and environmental indexes are too low to keep their watershed sustainability at a “Medium” level. Hydrology and environmental indexes in Tibet, Qinghai and other regions are high, but their economic index is so low that they cannot reach the “Excellent” level. The regionalization of China’s indexes in all aspects is obvious. The hydrological and environmental indexes of western regions are better than eastern regions while the economic index shows the obvious preference in the eastern regions. This shows that the western regions of the country have significant advantages in terms of quantity and quality of water resources, but the efficiency of water use is low. The eastern regions have a high level of economic development and a higher water use efficiency, but there are some serious problems such as water resources insufficiency, river pollution and other environmental issues.
3.6. Interannual Variation Characteristics of Evaluation Indexes
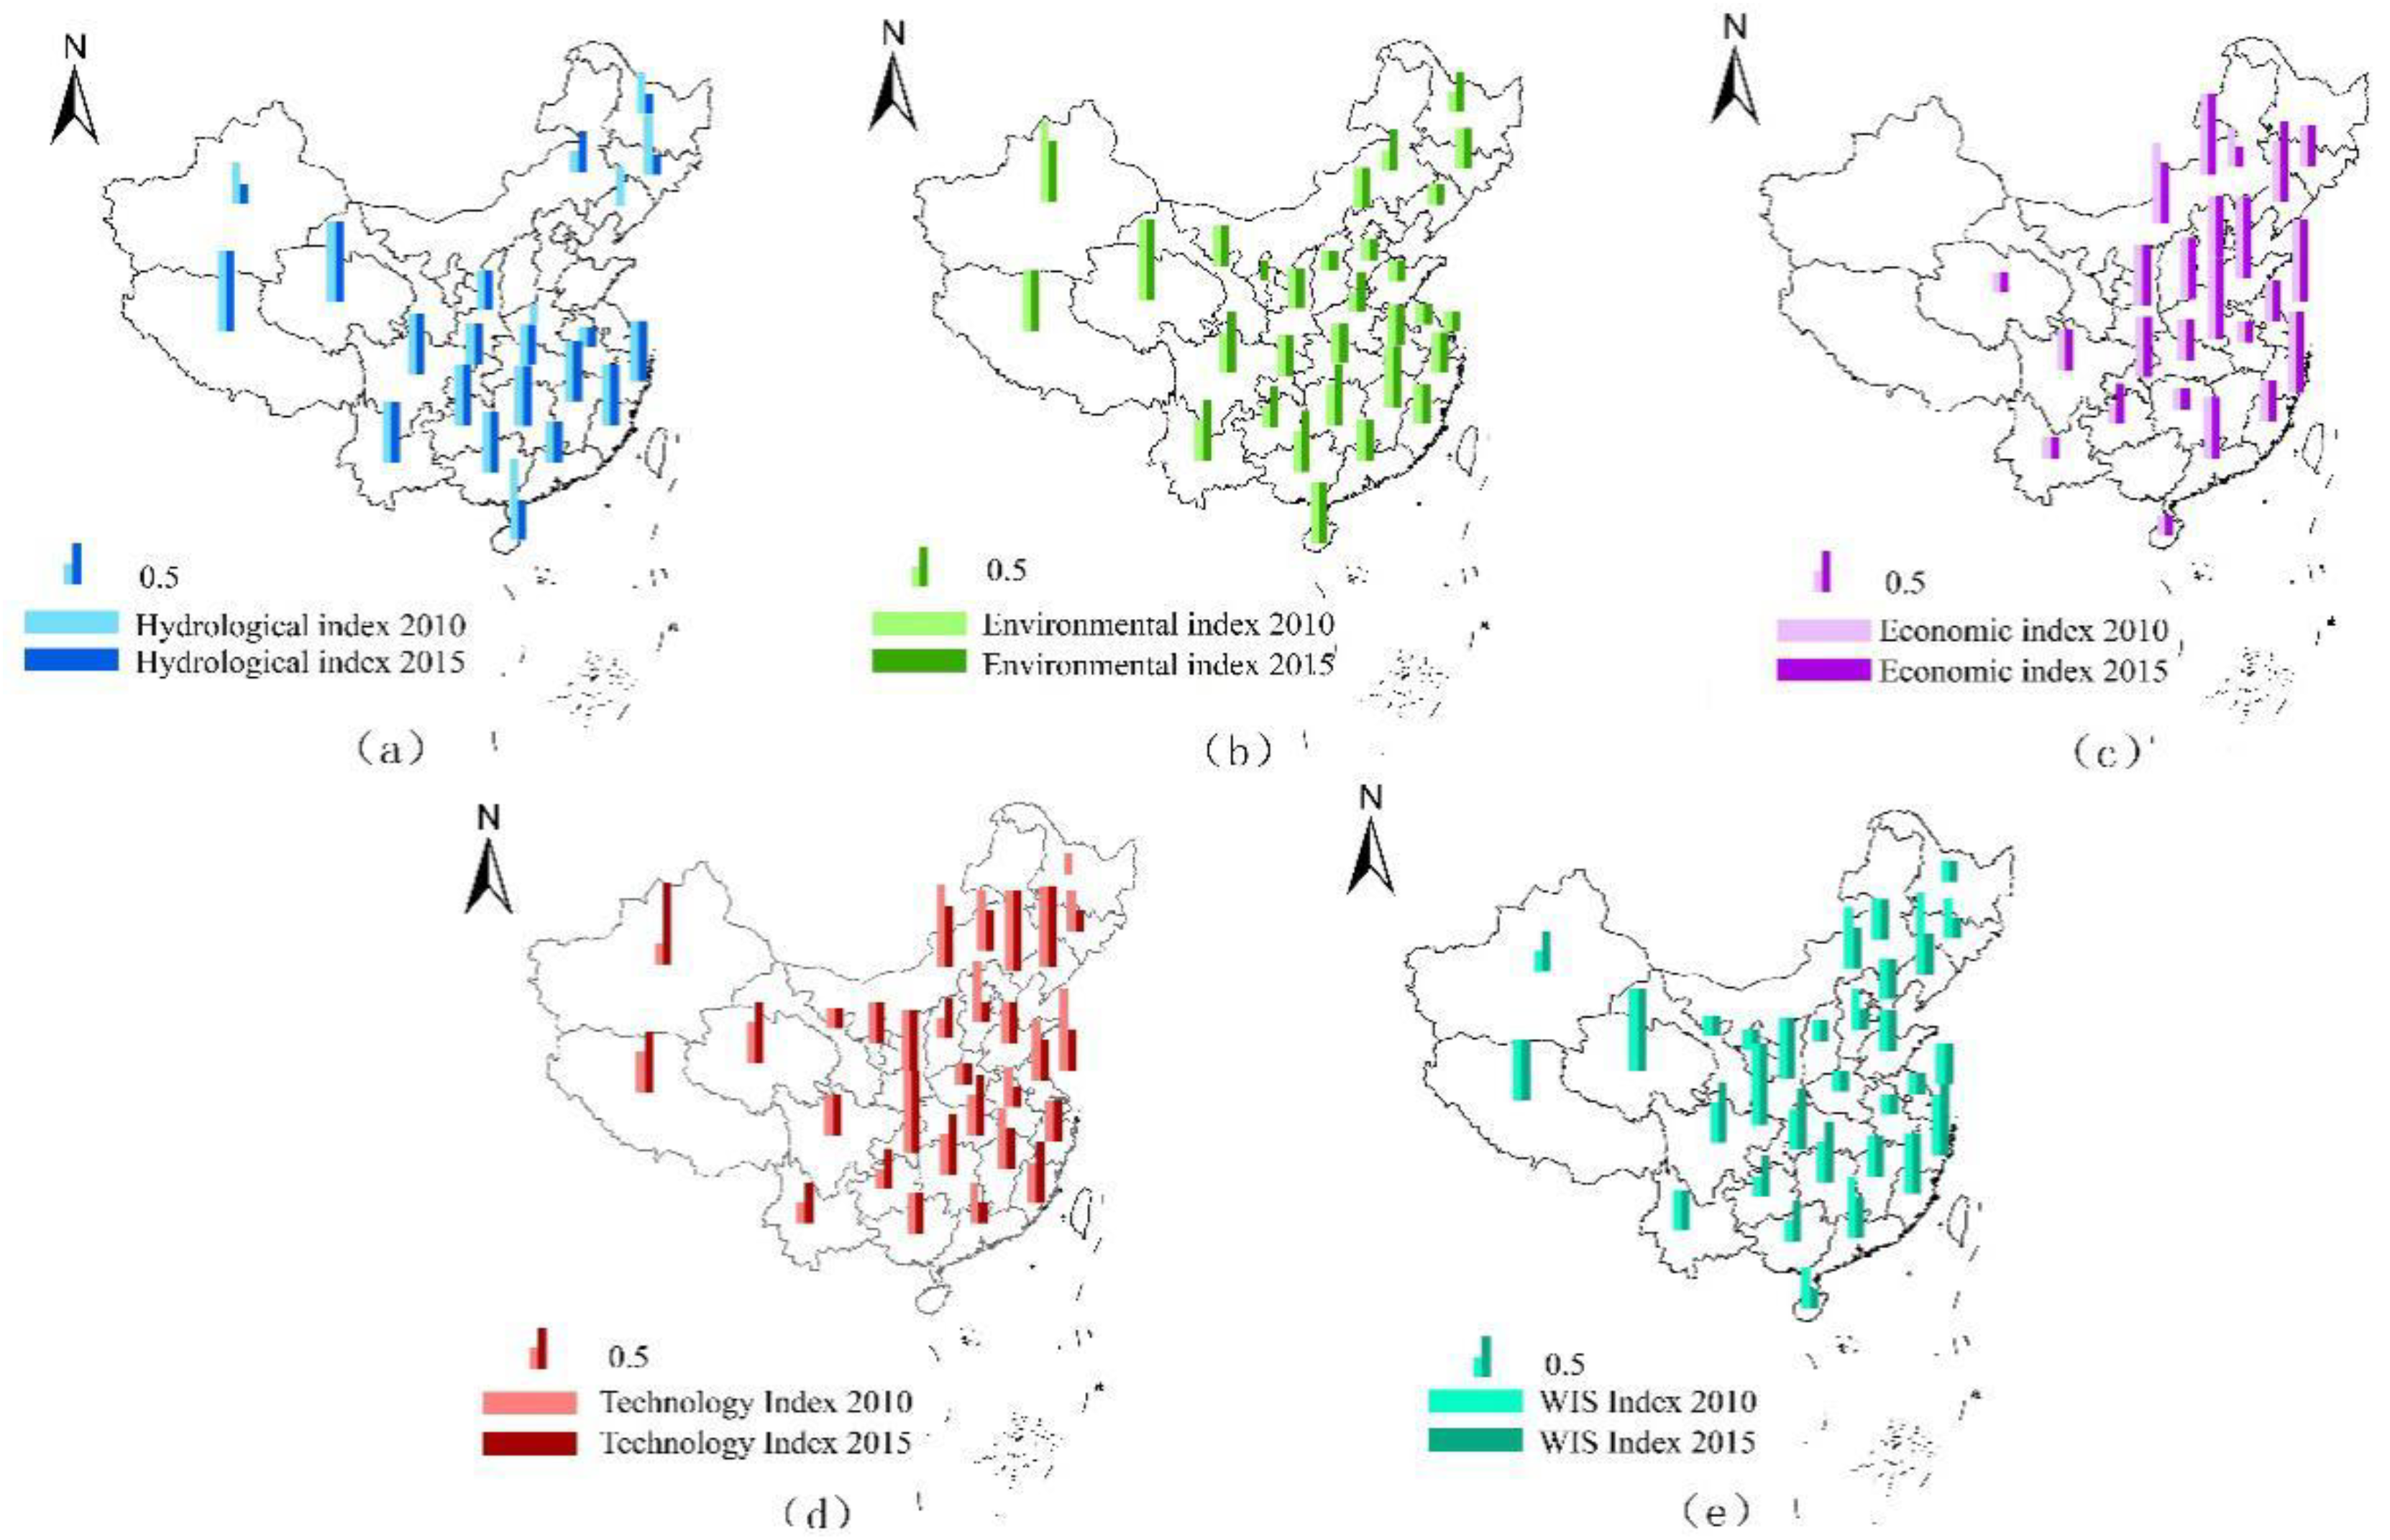
Based on the analysis of the spatial distribution characteristics of each evaluation index in 2015 and combining this with the relevant data in 2010, the interannual variation characteristics of each evaluation index are analyzed. The results are as follows (Figure 6): The hydrological index of most provinces remained unchanged. Only inner Mongolia has the trend of growth, the northeast regions show a downward trend. Nine provinces’ environmental indexes were upgraded, most of them in the south. Only the environmental index of Xinjiang was declining and the environmental index in the eastern regions have not changed; this shows that environmental pollution has not been significantly improved in the eastern regions. As for the economic index, there are still significant differences between eastern and western regions; the economic backwardness in the western regions of Xinjiang, Tibet and Gansu is not improved. Although most of the provinces’ economic index have not changed, the comprehensive output value per cubic meter of water in each province shows different degrees of increase from the data. As for the technology index, the western regions show an increasing trend while the eastern regions show a downward trend. As for the comprehensive evaluation index WSI during 2010–2015, there are seven provinces that show an increasing trend, Zhejiang changed from “good” to “excellent” and Hubei, Hunan, Guangxi, Sichuan, Guizhou and Xinjiang all experienced a slight increase; six provinces show varying degrees of decline, Liaoning declined from “Excellent” to “Medium” with a larger decrease; the remaining 18 provinces remained unchanged in the WSI index; Qinghai and Chongqing have been maintained at “Excellent” level all the time and their sustainable development has been better.
4. Discussion
4.1. Distribution Characteristics of Evaluation Indexes and Research Limitations
The water resource system is an entirety with complex internal relationship. Its evaluation and management should emphasize complexity, systematization, synergy and integrity. It is too one-sided and unconvincing to evaluate the sustainable use of water resources from the aspects of water endowment or water quality. Figure 7 shows the rank distribution of the evaluation indexes for the sustainable use of water resources in all 31 provinces in mainland China. The eastern provinces, such as Shandong, have quite high economic and technology index rankings, but their hydrological and environmental index rankings are far behind. Therefore, the most urgent problems to be solved in these regions are per capita water resources and river water pollution. The first problem to be solved is the population problem in the big cities; second, limiting the irrational use and waste of water resources; and finally promoting green development and striving to resolve the outstanding environmental problems. Huang, et al. [31] and Leng, et al. [32] proposed a system optimization method for evaluating the sustainable development of water resources in Shandong province. It is suggested that Shandong should strengthen the ecological construction and sewage treatment efforts, which confirms the research results. The western regions such as Tibet, Xinjiang and Qinghai have the highest hydrological index and environmental index, but the economy and technology are relatively backwar; these regions need to conduct industrial upgrading, improve their investment in science and technology, and increase the input-output benefit of water resources, while at the same time preventing over-exploitation and water pollution are necessary. Liu, et al. [33] constructed a comprehensive evaluation index system for the sustainable use of water resources. Due to the inefficient use of agricultural irrigation water and the high difficulty of development and utilization of water resources, the provinces such as Guangxi and Tibet are classified into low-development groups in terms of sustainable development. This is basically similar to the results of this study. In northwestern regions such as Gansu and Ningxia, the rankings of the four indexes all fall behind. For such regions, firstly, the extent of water resources development must be strictly limited to the allowable limits; secondly, they must develop the non-water consumption industry, improve the utilization efficiency, and finally it is important that they resolutely prevent and control water pollution, protect water quality and fundamentally improve the ecological environment. For Sichuan, Chongqing and other regions, all their indexes are at an average level, this requires them to be on the premise of development, committed to the adjustment of industrial structure and the rational development and effective utilization of water resources. Tong, et al. [34] used the Principal Component Analysis (PCA) method and DEA model to evaluate the ability of China’s sustainable use of water resources. It was found that the higher the level of urban development, the worse the quality of water environment—there is a negative correlation between the two, which further indicated China has not yet fully transformed from an extensive economic growth model. The conclusions are similar to those presented in this study.
The research carried out in this paper also has some limitations. In the choice of methods, due to the limitation of data, four dimensions of evaluation indicators were selected, but each indicator contains only 1–2 original variables; this means the indicator may not be fully supported, and the indicator definition and calculation method are relatively simple. The representativeness and scientificity of the evaluation indexes need to be further improved in subsequent studies. In addition, in order to obtain more comprehensive evaluation results, the next step needs to conduct a key study of the multi-time series of sustainable water use levels in China.
4.2. Spatial Autocorrelation Analysis
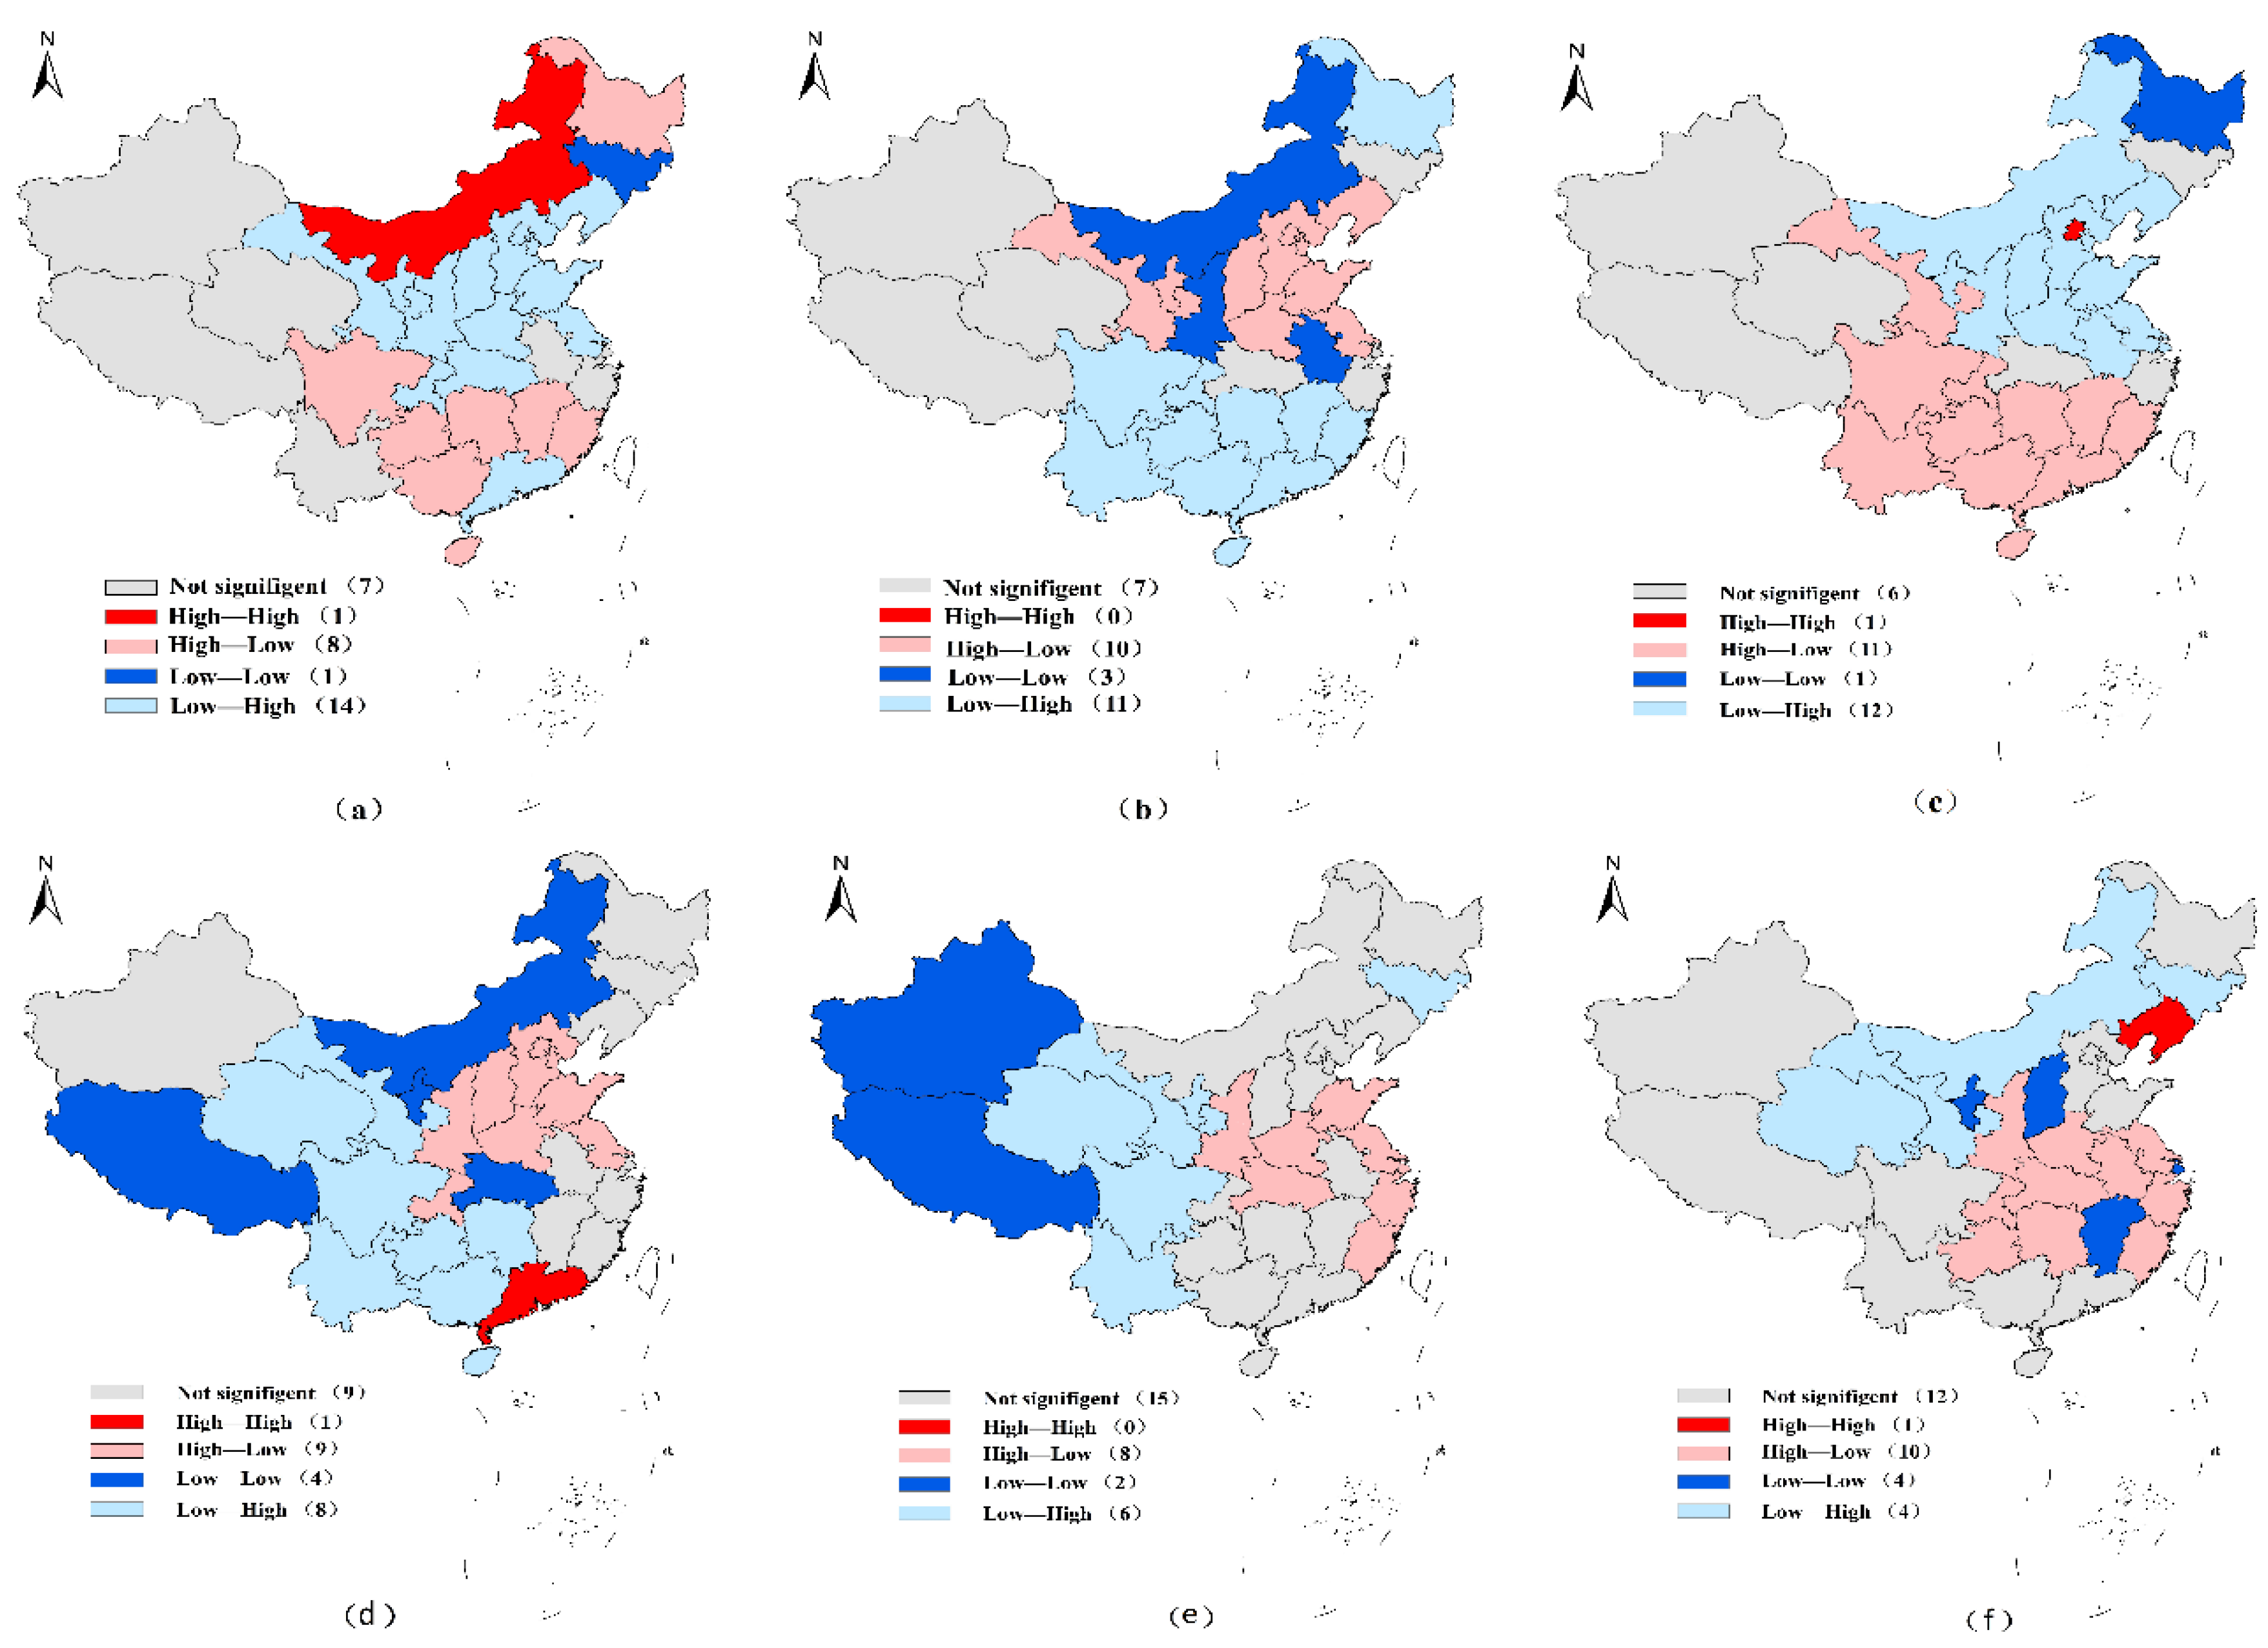
Figure 8a,b shows the spatial autocorrelation analysis of per capita water resources and water resources utilization rate. In terms of per capita water resources, only Inner Mongolia is H-H agglomeration, most of the southern regions are H-L agglomeration and most regions of central China are L-H agglomeration. As for water resources utilization rate, Gansu, Ningxia and eastern provinces are H-L agglomeration and most of the southern provinces are L-H agglomeration. The main reasons may be: Natural causes such as special geographical location and complex climatic conditions; some human factors such as extensive economic growth mode; the rainfall in the south is more abundant than the north and the water resources consumption in central and eastern regions is relatively large. Figure 8c is the spatial autocorrelation analysis of the river water quality index. Only Beijing is H-H agglomeration. Most of the southern regions are H-L agglomeration and the northern provinces are L-H agglomeration. The reason may be that Beijing’s environmental governance system is more complete and its ecological investment is relatively higher. However, the southern provinces such as Yunnan may be due to relatively backward economic development; their natural resources and ecological environment have not been seriously damaged, so the river water quality level is relatively high. Inner Mongolia, Shaanxi, Liaoning and other regions have poor river water quality, which may be due to these areas paying more attention to economic and agricultural development, while paying less attention to the environmental pollution caused by economic development. Figure 8d is spatial autocorrelation analysis of the output per cubic meter of water. Guangdong is H-H agglomeration and the provinces of Shaanxi, Chongqing and Huang-Huai-Hai Plain areas are H-L agglomeration. The reason may be that the economy of Guangdong Province is relatively developed, its technology input and production efficiency are higher, and therefore its efficiency of water use is relatively high. Shaanxi and Huang-Huai-Hai areas may be due to more emphasis on agricultural development and having more advanced agricultural technologies so the water utilization efficiency is higher. Figure 8e,f shows the spatial autocorrelation analysis of per capita R&D funding and per capita water environment investment. Two variables in Shaanxi, Henan, Hubei and eastern coastal cities are higher, probably due to these regions having water conservancy research institutes, thereby they pay more attention to water resources development, utilization and protection with strong theoretical and financial support. R&D funding in the western regions such as Xinjiang, Tibet, Qinghai and Gansu is relatively less, which may be affected by factors such as geographical location, traffic and economic level, which causes the development and protection of water resources to be restricted.
5. Conclusions
This paper takes 31 provinces in mainland China as the research object and comprehensively evaluates the regional water resources sustainability from the aspects of hydrology, environment, economy and technology. The main conclusions are as follows:
From the regional perspective, the regionalization of all aspects of the evaluation indexes is obvious. The hydrological and environmental index in the western regions are significantly higher than that in eastern regions, while the economic index in eastern regions is higher than that in western regions. This also indicates that the western regions of China have prominent advantages in terms of quantity and quality of water resources, but their efficiency of water use is not high. The eastern regions have a high level of economic development and higher water use efficiency, but there are some serious problems such as water shortage, river pollution and other environmental issues. The original data of each evaluation index shows a certain agglomeration law in spatial distribution: The amount of water resources per capita shows a trend of south is much and north is less, and there is a higher dependence degree among regions. The south is superior to the north in terms of river water quality. Areas with high output per cubic meter water are concentrated in the central and eastern regions, and Guangdong’s economy is relatively developed and drives economic development in the surrounding areas. Shaanxi, Henan and Jiangsu have invested more in R&D funding and water environment. The results of spatial autocorrelation analysis have confirmed the spatial distribution law of each evaluation index.
From the time perspective, during the period from 2010 to 2015, seven provinces showed an increasing trend of water resources sustainability, Zhejiang changed from “Good” to “Excellent” and Hubei, Hunan, Guangxi, Sichuan, Guizhou and Xinjiang all showed slight growth. Six provinces showed a certain degree of decline, among them, Liaoning changed from “Excellent” to “Medium”, with a big decline. Beijing, Hebei, Jilin, Guangdong and Hainan also had a slight decline. The remaining 18 provinces did not change. Qinghai and Chongqing maintained at “Excellent” level; their degree of sustainable development is better.
Author Contributions
Conceptualization, Q.X.; Data curation, J.S. (Jingxin Sun), X.Y., Q.X., J.S. (Jianfeng Song). and S.S.; Formal analysis, J.S. (Jingxin Sun) and X.Y.; Funding acquisition, S.S.; Investigation, Q.X. and J.S. (Jianfeng Song); Methodology, J.S. (Jingxin Sun) and X.Y.; Project administration, J.S. (Jingxin Sun), X.Y. and S.S.; Software, J.S. (Jingxin Sun) and X.Y.; Supervision, S.S.; Validation, S.S.; Writing—original draft, J.S. (Jingxin Sun) and X.Y.; Writing—Review & editing, J.S. (Jingxin Sun) and X.Y.
Funding
This research was funded by [National Key Research and Development Program of China] grant number [2016YFC0400201]; [Natural Science Basic Research Plan in Shaanxi Province of China] grant number [2016JQ5092]; [Science & Technology Co-ordination & Innovation Project in Shaanxi Province of China] grant number [2016KTZDNY-01-01]; [Innovative Talents Promotion Project in Shaanxi Province of China] grant number [2018KJXX-053] and [Young Scholar Project of Cyrus Tang Foundation] grant number [YSCTF201710].
Conflicts of Interest
The authors declare no conflict of interest
References
- Brown, L.R.; Halweil, B. China’s water shortage could shake world food security. World Watch 1998, 11, 10. [Google Scholar] [PubMed]
- Sun, S.-K.; Wang, Y.-B.; Engel, B.A.; Wu, P. Effects of virtual water flow on regional water resource stress: A case study of grain in China. Sci. Total Environ. 2016, 550, 871–879. [Google Scholar] [CrossRef] [PubMed]
- Karaouzas, I.; Smeti, E.; Vourka, A.; Vardakas, L.; Mentzafou, A.; Tornés, E.; Sabater, S.; Muñoz, I.; Skoulikidis, N.T.; Kalogianni, E. Assessing the ecological effects of water stress and pollution in a temporary river—Implications for water management. Sci. Total Environ. 2018, 618, 1591–1604. [Google Scholar] [CrossRef] [PubMed]
- Sun, S.; Wang, Y.; Liu, J.; Cai, H.; Wu, P.; Geng, Q.; Xu, L. Sustainability assessment of regional water resources under the DPSIR framework. J. Hydrol. 2016, 532, 140–148. [Google Scholar] [CrossRef]
- Kong, Y.; Kong, Z.; Liu, Z.; Wei, C.; An, G. Substituting small hydropower for fuel: The practice of China and the sustainable development. Renew. Sustain. Energy Rev. 2016, 65, 978–991. [Google Scholar] [CrossRef]
- Hellström, D.; Jeppsson, U.; Kärrman, E. A framework for systems analysis of sustainable urban water management. Environ. Impact Assess. Rev. 2000, 20, 311–321. [Google Scholar] [CrossRef]
- Ioris, A.A.; Hunter, C.; Walker, S. The development and application of water management sustainability indicators in Brazil and Scotland. J. Environ. Manag. 2008, 88, 1190–1201. [Google Scholar] [CrossRef] [PubMed] [Green Version]
- Wada, Y.; Bierkens, M.F.P. Sustainability of global water use: Past reconstruction and future projections. Environ. Res. Lett. 2014, 9, 104003. [Google Scholar] [CrossRef]
- Thomas, J.S.; Durham, B. Integrated water resource management: Looking at the whole picture. Desalination 2003, 156, 21–28. [Google Scholar] [CrossRef]
- Loukas, A.; Mylopoulos, N.; Vasiliades, L. A modeling system for the evaluation of water resources management strategies in Thessaly, Greece. Water Resour. Manag. 2007, 21, 1673–1702. [Google Scholar] [CrossRef]
- Ryu, J.H.; Contor, B.; Johnson, G.; Allen, R.; Tracy, J. System dynamics to sustainable water resources management in the Eastern Snake Plain Aquifer under water supply uncertainty. J. Am. Water Resour. Assoc. 2012, 48, 1204–1220. [Google Scholar] [CrossRef]
- Pires, A.; Morato, J.; Peixoto, H.; Botero, V.; Zuluaga, L.; Figueroa, A. Sustainability assessment of indicators for integrated water resources management. Sci. Total Environ. 2016, 578, 139. [Google Scholar] [CrossRef] [PubMed]
- Lumb, A.; Sharma, T.C.; Bibeault, J.F.; Klawunn, P. A comparative study of USA and Canadian water quality index models. Water Qual. Expo. Health 2011, 3, 203–216. [Google Scholar] [CrossRef]
- Iribarnegaray, M.A.; D’Andrea, M.L.G.; Rodriguez-Alvarez, M.S.; Hernandez, M.E.; Brannstrom, C.; Seghezzo, L. From indicators to policies: Open sustainability assessment in the water and sanitation sector. Sustainability 2015, 2015, 14537–14557. [Google Scholar] [CrossRef]
- Ding, G.K.C.; Ghosh, S. Sustainable water management—A strategy for maintaining future water resources. In Reference Module in Earth Systems and Environmental Sciences; Elsevier Inc.: New York, NY, USA, 2017. [Google Scholar]
- Salvati, L.; Carlucci, M. A composite index of sustainable development at the local scale: Italy as a case study. Ecol. Indic. 2014, 43, 162–171. [Google Scholar] [CrossRef]
- Manandhar, S.; Pandey, V.P.; Kazama, F. Application of water poverty index (WPI) in nepalese context: A case study of kali gandaki river basin (KGRB). Water Resour. Manag. 2012, 26, 89–107. [Google Scholar] [CrossRef]
- Uddameri, V.; Honnungar, V. Combining rough sets and GIS techniques to assess aquifer vulnerability characteristics in the semi-arid south texas. Environ. Geol. 2007, 51, 931–939. [Google Scholar] [CrossRef]
- Sun, Y.; Liu, N.; Shang, J.; Zhang, J. Sustainable utilization of water resources in China: A system dynamics model. J. Clean. Prod. 2017, 142, 613–625. [Google Scholar] [CrossRef]
- Chen, Y.; Zhang, S.; Zhang, Y.; Xu, L.; Qu, Z.; Song, G.; Zhang, J. Comprehensive assessment and hierarchical management of the sustainable utilization of urban water resources based on catastrophe theory. J. Taiwan Inst. Chem. Eng. 2016, 60, 430–437. [Google Scholar] [CrossRef]
- Xu, M.; Li, C.; Lu, S. Sustainable water resources utilization on energy industry based on the gray water footprints assessment in Hunan province. Energy Procedia 2017, 105, 3758–3764. [Google Scholar] [CrossRef]
- Karatayev, M.; Kapsalyamova, Z.; Spankulova, L.; Skakova, A.; Movkebayeva, G.; Kongyrbay, A. Priorities and challenges for a sustainable management of water resources in Kazakhstan. Sustain. Water Qual. Ecol. 2017, 9–10, 115–135. [Google Scholar] [CrossRef]
- Lou, W.; Liu, S. Neural network method for evaluation of sustainable utilization of regional water resources. Nat. Syst. Sci. Compr. Res. 2004, 2, 113–116. (In Chinese) [Google Scholar]
- Dai, T.; Sun, S.; Zhao, W.; Gu, B. FAHP-PP model for evaluation of regional water resources sustainable use. Resour. Environ. Yangtze River Basin 2009, 18, 421–426. (In Chinese) [Google Scholar]
- NBSC (National Bureau of Statistics of China). China Statistical Yearbook 2015; China Statistics Press: Beijing, China, 2016.
- MWR (Ministry of Water Resources of the People’s Republic of China). China Water Resources Bulletin 2015; China Water Resources & Hydropower Press: Beijing, China, 2016.
- Xu, M.; Li, H.; Zhang, H.; Yuan, R. Research and analysis on investment in water conservancy science and technology in China. Water Conserv. Econ. 2007, 1, 23–26. (In Chinese) [Google Scholar]
- Brown, A.; Matlock, M. A Review of Water Scarcity Indices and Methodologies; The Sustainability Consortium: Tempe, AZ, USA, 2011. [Google Scholar]
- Moran, P. Notes on continuous stochastic phenomena. Biometrika 1950, 37, 17. [Google Scholar] [CrossRef] [PubMed]
- Anselin, L. Local Indicators of Spatial Association—LISA. Geol. Anal. 1995, 27, 93–115. [Google Scholar] [CrossRef]
- Huang, L.; Cao, Y.; Zhao, N.; Xu, Y. The sustainable development of water resources in Shandong based on system dynamics simulation. Water Power 2008, 34, 1–4. (In Chinese) [Google Scholar]
- Leng, M.-M.; Zhao, J.-Y.; Li, Q.-G.; Zhang, J.; Fu, Y.-C. Optimal allocation of water resources in the blue economy region of shandong peninsular based on water network interconnection. J. China Inst. Water. Res. Hydropower Res. 2017, 15, 180–186. (In Chinese) [Google Scholar]
- Liu, Y.; Jia, R.-X.; Hou, X.-L. Evaluation of China’s regional sustainable utilization of water resources and its type classification. Environ. Sci. 2005, 26, 42. (In Chinese) [Google Scholar]
- Tong, J.-X.; Liang, F.-R. Evaluation of Sustainable Utilization of Water Resources in China. J. Econ. Water Res. 2015, 33, 55–60. (In Chinese) [Google Scholar]
Figure 1.
Spatial distribution map: (a) hydrological index, (b) per capita water resources, (c) water resources utilization rate in 2015.
Figure 1.
Spatial distribution map: (a) hydrological index, (b) per capita water resources, (c) water resources utilization rate in 2015.

Figure 2.
Spatial distribution map: (a) environmental index, and (b) river quality level in 2015.

Figure 3.
Spatial distribution map: (a) economic index, (b) output per cubic meter water in 2015.

Figure 4.
Spatial distribution map: (a) technology index, (b) per capita R&D funding, (c) and per capita water environment investment in 2015.
Figure 4.
Spatial distribution map: (a) technology index, (b) per capita R&D funding, (c) and per capita water environment investment in 2015.

Figure 5.
Spatial distribution map of WSI in 2015.

Figure 6.
Interannual variation trend of (a) Hydrological index, (b) Environmental index, (c) Economic index, (d) Technology index and (e) WSI.
Figure 6.
Interannual variation trend of (a) Hydrological index, (b) Environmental index, (c) Economic index, (d) Technology index and (e) WSI.

Figure 7.
Ranking the distribution of regional evaluation indexes of the sustainability of water resources in 2015.
Figure 7.
Ranking the distribution of regional evaluation indexes of the sustainability of water resources in 2015.

Figure 8.
LISA cluster map of (a) per capita water resources, (b) water resources utilization rate, (c) river water quality index, (d) comprehensive output value per cubic meter of water, (e) per capita R&D funding, (f) and per capita water environment investment.
Figure 8.
LISA cluster map of (a) per capita water resources, (b) water resources utilization rate, (c) river water quality index, (d) comprehensive output value per cubic meter of water, (e) per capita R&D funding, (f) and per capita water environment investment.


Table 1.
The criteria of river water quality.
| Indicators | Level I | Level II | Level III | Level IV | Level V |
|---|---|---|---|---|---|
| Chemical oxygen demand (COD) (mg/L) ≤ | 15 | 15 | 20 | 30 | 40 |
| Total phosphorus (P) (mg/L) < | 0.01 | 0.025 | 0.05 | 0.1 | 0.2 |
| Total nitrogen (N) (mg/L) ≤ | 0.2 | 0.5 | 1 | 1.5 | 2 |
| Number of fecal coliforms | 200 | 2000 | 10,000 | 20,000 | 40,000 |
| (per liter) ≤ |
Table 2.
Spatial evolution analysis of five indices in provinces and cities of China.
| Provinces | Hydrological Index | Environmental Index | Economic Index | Technology Index | WSI |
|---|---|---|---|---|---|
| Beijing | Worst | Medium | Excellent | Medium | Medium |
| Tianjin | Worst | Worst | Excellent | Excellent | Medium |
| Hebei | Worst | Poor | Good | Poor | Poor |
| Shanxi | Worst | Poor | Good | Medium | Poor |
| Inner Mongolia | Poor | Medium | Poor | Good | Medium |
| Liaoning | Medium | Poor | Excellent | Excellent | Medium |
| Jilin | Good | Medium | Medium | Poor | Poor |
| Heilongjiang | Medium | Medium | Worst | Worst | Poor |
| Shanghai | Worst | Poor | Excellent | Medium | Medium |
| Jiangsu | Worst | Poor | Medium | Medium | Poor |
| Zhejiang | Good | Medium | Excellent | Medium | Excellent |
| Anhui | Poor | Medium | Poor | Poor | Poor |
| Fujian | Good | Medium | Medium | Good | Good |
| Jiangxi | Good | Good | Worst | Medium | Medium |
| Shandong | Worst | Poor | excellent | Medium | Medium |
| Henan | Poor | Medium | Good | Poor | Poor |
| Hubei | Medium | Medium | Medium | Good | Good |
| Hunan | Good | Good | Poor | Good | Good |
| Guangdong | Medium | Medium | Good | Poor | Medium |
| Guangxi | Good | Good | Worst | Medium | Medium |
| Hainan | Excellent | Good | Poor | Worst | Poor |
| Chongqing | Medium | Medium | Good | Excellent | Excellent |
| Sichuan | Good | Good | Medium | Good | Good |
| Guizhou | Good | Medium | Medium | Good | Medium |
| Yunnan | Good | Good | Poor | Good | Medium |
| Xizang | Excellent | Good | Worst | Good | Good |
| Shaanxi | Medium | Medium | Good | Good | Good |
| Gansu | Worst | Good | Worst | Worst | Poor |
| Qinghai | Excellent | Excellent | Poor | Good | Excellent |
| Ningxia | Worst | Poor | Worst | Medium | Poor |
| Xinjiang | Medium | Good | worst | Excellent | Medium |
© 2018 by the authors. Licensee MDPI, Basel, Switzerland. This article is an open access article distributed under the terms and conditions of the Creative Commons Attribution (CC BY) license (http://creativecommons.org/licenses/by/4.0/).
Share and Cite
MDPI and ACS Style
Sun, J.; Yu, X.; Xiao, Q.; Song, J.; Sun, S. Utilization Characteristics and Sustainability Evaluation of Water Resources in China. Water 2018, 10, 1142. https://doi.org/10.3390/w10091142
AMA Style
Sun J, Yu X, Xiao Q, Song J, Sun S. Utilization Characteristics and Sustainability Evaluation of Water Resources in China. Water. 2018; 10(9):1142. https://doi.org/10.3390/w10091142
Chicago/Turabian StyleSun, Jingxin, Xiang Yu, Qishan Xiao, Jianfeng Song, and Shikun Sun. 2018. "Utilization Characteristics and Sustainability Evaluation of Water Resources in China" Water 10, no. 9: 1142. https://doi.org/10.3390/w10091142
Note that from the first issue of 2016, this journal uses article numbers instead of page numbers. See further details here.