Development of a Field Laboratory for Monitoring of Fecal-Sludge Treatment Plants
by
 ,
,
Johannes Bousek
1,* ,
,
Marco Skodak
1,
Magdalena Bäuerl
2,
Georg Ecker
2,
Jan Spit
3,
Adam Hayes
4 and
Werner Fuchs
1 1
Institute of Environmental Biotechnology, University of Natural Resources and Life Sciences, Konrad Lorenz Straße 20, Tulln, 3430 Vienna, Austria
2
Austrian Red Cross, Wiedner Hauptstraße 32, 1040 Vienna, Austria
3
Wastes COOP, Lange Houtstraat 26, 2511 CW The Hague, The Netherlands
4
Butyl Products Ltd., Lingfield House, 11 Radford Crescent Billericay, Essex CM12 0DW, UK
*
Author to whom correspondence should be addressed.
Water 2018, 10(9), 1153; https://doi.org/10.3390/w10091153
Submission received: 1 July 2018
/
Revised: 20 August 2018
/
Accepted: 21 August 2018
/
Published: 28 August 2018
(This article belongs to the Special Issue Water, Sanitation, and Hygiene in Humanitarian Contexts)
Abstract
:In urban humanitarian-aid operations, safe treatment of fecal sludge is highly important. While currently field-deployable fecal-sludge treatment plants are being developed, field-ready analytical equipment for process-control and public health monitoring is missing. Within the Microbial Sludge Quality project, a field laboratory was developed. A minimum set of parameters for the considered processes was developed through literature research. The analytical methods were tested on their field applicability and, if necessary, modified. The following methods were modified for field use: bacteriological analysis (sample homogenization and counting), chemical oxygen demand (sample digestion), volatile fatty acid–alkalinity titration (redesigned test setup), total solids (redesigned test setup), and ammonia determination (redesigned test setup). For bacteriological analysis, chemical oxygen demand, and total solids the modifications lead to highly comparable analytical results. The results obtained by the field methodology for volatile fatty acid–alkalinity titration and ammonia determination were sufficient for field-process monitoring; however, they did not correlate as well. To enable rapid startup of the laboratory during humanitarian-aid missions, it was developed to include analytical and support equipment. The usage of the developed laboratory should allow close-in-time process monitoring and public-health assessments of fecal-sludge treatment plants.
1. Introduction
In urban or camp humanitarian-aid settings, fecal-sludge (FS) treatment is of utmost importance [1,2]. Regarding the public-health aspect, the 2010 cholera outbreak in Haiti [3] can be considered as one of the worst examples of failed fecal-sludge treatment. The impact of untreated fecal sludge released in the environment is quite dramatic and may result in algae blooms, pest problems, and overfertilization of fields. FS-treatment processes, decision-making tools for field use in humanitarian aid are currently being developed [2,4,5]. The importance of the regular monitoring of FS treatment plants is stressed in the literature [6,7]. However, due to the inhomogeneity of the samples and often inconsistency of the influent load, a publication on the characterization of fecal sludge, including analytical methods and equipment in developing countries, was published by the Swiss Federal Institute of Aquatic Science and Technology [8]. However, field-ready analytical equipment for process and public-health monitoring was found missing. To close this gap, the Microbial Sludge Quality project (November 2016–October 2017) was funded by the Humanitarian Innovation Fund to develop a field lab for the public-health and process monitoring of field FS treatment plants.
Humanitarian-aid organizations were defined as the primary target group. During the project duration, a secondary target group consisting of social enterprises, development-cooperation organizations and local utility operators were established. Together with the Austrian Red Cross, as the project consortium’s humanitarian-aid organization, and its contacts in the emergency WASH community, the following design criteria for the field laboratory were developed:
- Appropriateness: the analytical results are comparable to a fixed laboratory
- Applicability: the laboratory must work in the field
- Affordability: the laboratory has to be more cost-effective than standard solutions
- Mobility: the laboratory has to fit in a Toyota Landcruiser
These design criteria were translated into product properties. Field appropriateness was considered to be most important. Equipment weight and power consumption were to be kept at a minimum to ensure transportability and allow usage of car batteries as back-up power supply.
Unlike in water treatment or latrine construction [9], no standardized field fecal-sludge treatment plants are deployed by large humanitarian-aid organizations. Therefore, no treatment process cascade has been standardized. Thus, it was deemed highly important to enable the field laboratory to monitor a broad spectrum of different processes. A list of field-applicable treatment processes (Table 1) was compiled out of different literature sources [5,10,11,12]. Regarding these processes, a basic set of parameters for the field laboratory (Table 1) was established by a literature search [6,7,12,13,14,15,16,17] before onset of the development. In many countries, national regulations governing effluent qualities of fecal-sludge or wastewater treatment plants [15,16,18,19] do exist; however, guidelines regarding fecal-sludge treatment comparable to the WHO guidelines on water quality [20] on an international level are currently missing. The exception is the WHO guidelines on wastewater use in agriculture [17] and a drafted ISO norm for non-sewer sanitations systems [21]. While in the former public-health thresholds are established for the use of effluent streams in agriculture, minimum treatment efficiencies are indicated in the latter publication.
The parameters defined in the chosen literature and regulations concerning the public health impact of treatment-plant effluents and their subsequent use, mainly in agriculture, are focused on several different bacteriological indicator organisms and the absence of helminth eggs.
The parameters used for process control strongly depend on the chosen treatment process. However, through the literature study a parameter set was developed that would allow minimum monitoring of a wide range of processes. The process-control equipment should allow the fecal-sludge treatment plant to be balanced (e.g., chemical oxygen demand, nitrogen, total solids). The estimation of treatment efficiency and subsequent comparison over time and with different plants is enabled by the calculation of influent and effluent freights. Further on, the process-control equipment is also used to characterize the effluent quality.
Analytical methods of field laboratory were chosen according to previously mentioned design criteria and the CATNAP principle defined by Duncan Mara [7]. CATNAP stands for “cheapest-available technology narrowly avoiding prosecution”. While it was originally intended to be used in the construction of wastewater treatment plants, the mentality also applies to this field lab. For process control directly in the field during an emergency aid operation, a trade-off between ruggedness, ease of handling, and analytical precision can be made. For example, in the process monitoring of biogas plants for most parameters, ranges are given [14]. Thus, the needed precision in the field lab is to know if the analyte concentration is in a certain range. To reduce development time, the methods were based on well-established methods and only adapted to field conditions when needed.
In public-health monitoring of fecal-sludge treatment plants, bacteriological indicator organisms and helminth eggs are used. The analysis of the bacteriological indicator organism is discussed later on. The detection of helminth eggs are considered an increasingly important parameter for the public-health assessment of fecal-sludge treatment and subsequent reuse [22,23,24] Currently, helminth eggs are detected by microscopic identification. These methods can be considered challenging and expert training is needed. Digital-picture analysis software for automatic helminth-egg detection was developed by the University of Mexico [25]. The public availability of such software would ease the detection process and allow faster sample analytics. For the detection of helminth eggs in the field laboratory, MiniFlotac and FillFlotac and the corresponding methods developed by the University of Naples, Federico II, were used [26]. The pellet method was only modified by changing from an electrical to a hand-driven centrifuge and is thus not further elaborated in this study.
In any emergency-aid mission, any field lab needs to be set up and operational within the shortest time possible. To ensure the semi-independent operation of the lab support equipment (e.g., general lab equipment, personal protective equipment, and power converter with UPS function and solar panels to recharge batteries) was added and tested.
Each of the modified analytical method (Table 1) was tested and adapted to field conditions (e.g., ruggedness, low power consumption, easy handling). To ensure functionality, each adapted method was cross-checked and compared to the results of the established, parent counterpart.
2. Materials and Methods
2.1. Samples
For the development of the analytical methodology of the field laboratory, the following different samples sources were used:
- Nonpathogenic Escherichia coli (E. coli) strain
- Ammonia sulphate solution from ammonia-extraction experiments
- Autoclaved garden soil spiked with E. coli
- Garden soil
- Pig manure of an Austrian pig-fattening farm
- Fecal sludge from a household septic tank
- Wastewater treatment plant influent and effluent of Tulln, Austria
- Effluent of a mesophilic lab-scale biogas plant
All samples were taken during the method-development work packages (November 2016–June 2017) of the Microbial Sludge Quality project. Sample characterization was not considered the main aim of the analytical work. In method development, the samples were used for comparison of results of the established and of the field laboratory method.
2.2. Bacteriology
One part of the public-health side is covered by the determination of bacteriological indicator organisms. The concept of fecal indicator organisms was developed in the late 19th century mainly to ensure microbiological safety of potable water [7]. These indicator organisms, which are excreted in large numbers with feces, in the best case are nonpathogenic, do not replicate in water, and easy to cultivate. For drinking water, absence of these organisms indicates a high chance of absence of pathogenic organisms. However, in fecal-sludge treatment, the analytical question is not detecting an absence of fecal indicator organisms but measuring their reduction through the treatment process. E. coli and coliforms are the oldest fecal indicator organism in use, but their viability has been discussed in the recent past, especially in its use in fecal-sludge and wastewater analytics [27]. Enterococci and Salmonella are two other fecal indicator organisms used in the public health assessment [28]. Enterococci are discussed as successor to E. coli due to their inability to grow in environmental water and higher resistance to disinfection methods [29]. Salmonella is of interest since most species are considered pathogenic. A plethora of different methods and analytical equipment is available for bacteriological analysis. As method, membrane filtration was chosen due to its relative precision, ease of handling, and its prevalence in water-quality-testing laboratories used in the humanitarian-aid community. In fecal sludge, soil, or wastewater, homogenization of samples is needed [30]. In fixed laboratories, a sterile blender or stomacher is used. Stomachers are heavy, expensive, and require several hundred watts of power. For the field lab, the stomacher was replaced with approximately 1000 stainless-steel cleaning beads in a bottle. The bottle was shaken for several minutes and the sludge was homogenized by the beads.
The bacteriological analytical method for detection of E. coli, Enterococcus, and Salmonella in the field lab was based on the U.K. Environmental Agency [31], the Standard Methods for the Examination of Water and Wastewater [32], and Sartorius [33] analytical methods for membrane filtration. A buffered solution (KH2PO4 and MgCl2 6 × H2O) was used for the dilution of sample. Stock solutions of both chemicals were separately prepared by weighing in 34 g KH2PO4/L (Carl Roth, Karlsruhe, Germany) and 81 g MgCl2 6 × H2O/L (Carl Roth, Karlsruhe, Germany), dissolving it in filtered (0.2 µm glass fiber membrane, Base Camp Pro 10 L, Katadyn, Wallisellen, Switzerland) tap water and autoclaving the bottles. The buffered, working solution was prepared from 1.25 mL KH2PO4 stock solution/L and 5.0 mL MgCl2 6 × H2O stock solution/L. The working solution was afterwards autoclaved, and stored dark and cool.
For homogenizations, the samples were diluted 1:10 with the dilution solution. In the established laboratory method, a stomacher (Maxicator, IUL, Barcelona, Spain) was used. A 10 mL sample was directly diluted in the stomacher bag with 90 mL of the dilution solution and afterwards homogenized (8 strokes/second and 240 s). For the field-lab method, the stomacher was replaced with 1000 stainless-steel cleaning beads (2 mm, Ecooe, Hong Kong, China). A 10 mL sample was diluted with a 90 mL dilution solution in an autoclaved 250 mL PP bottle (VWR, Radnor, PA, USA). The beads were placed in the bottle before autoclavation. To homogenize the sample, the bottle was manually shaken for 5 min, corresponding to 750 to 1000 shakes.
Both in the fixed- and field-laboratory method, the homogenized sample was further diluted by log steps (4 mL sample and 36 mL dilution solution) in autoclaved 50 mL PP bottles (VWR, Radnor, Pa, USA). Before membrane filtration, the filter holder (Witeg, Wertheim, Germany) was heat-sterilized using a gas-soldering torch. Membrane filtration was performed according to Sartorius guidelines [33]. For the three analyzed bacteriological parameters, E. coli coliforms, Enterococcus, and Salmonella, nutrient plates (Sartorius, Göttingen, Germany) Endo, Azide, and Bismuth Sulfite, respectively, were used. Each sample was plated out in three successive dilution steps and in duplicates. Every 10 samples a blank water sample was filtrated. The nutrient plates were incubated for the specified time period at 36 ± 1 °C. The incubated nutrient plates were photographed using a commercial compact camera or smartphone and afterwards autoclaved. The colonies were counted on the pictures using Fiji (USA), open-source image-analysis software, and colony-forming units per mL.
For the field laboratory, two different incubators, a Hova Bator 1588 (GQF, Savannah, GA, USA) and a Cultura M (Merck Millipore, Burlington, MA, USA), were tested and compared. The Cultura M was further modified by installing a PC ventilator to ensure better temperature distribution. Both incubators were tested by a comparison of measured and set temperature in several different places.
2.3. Chemical Oxygen Demand (COD)
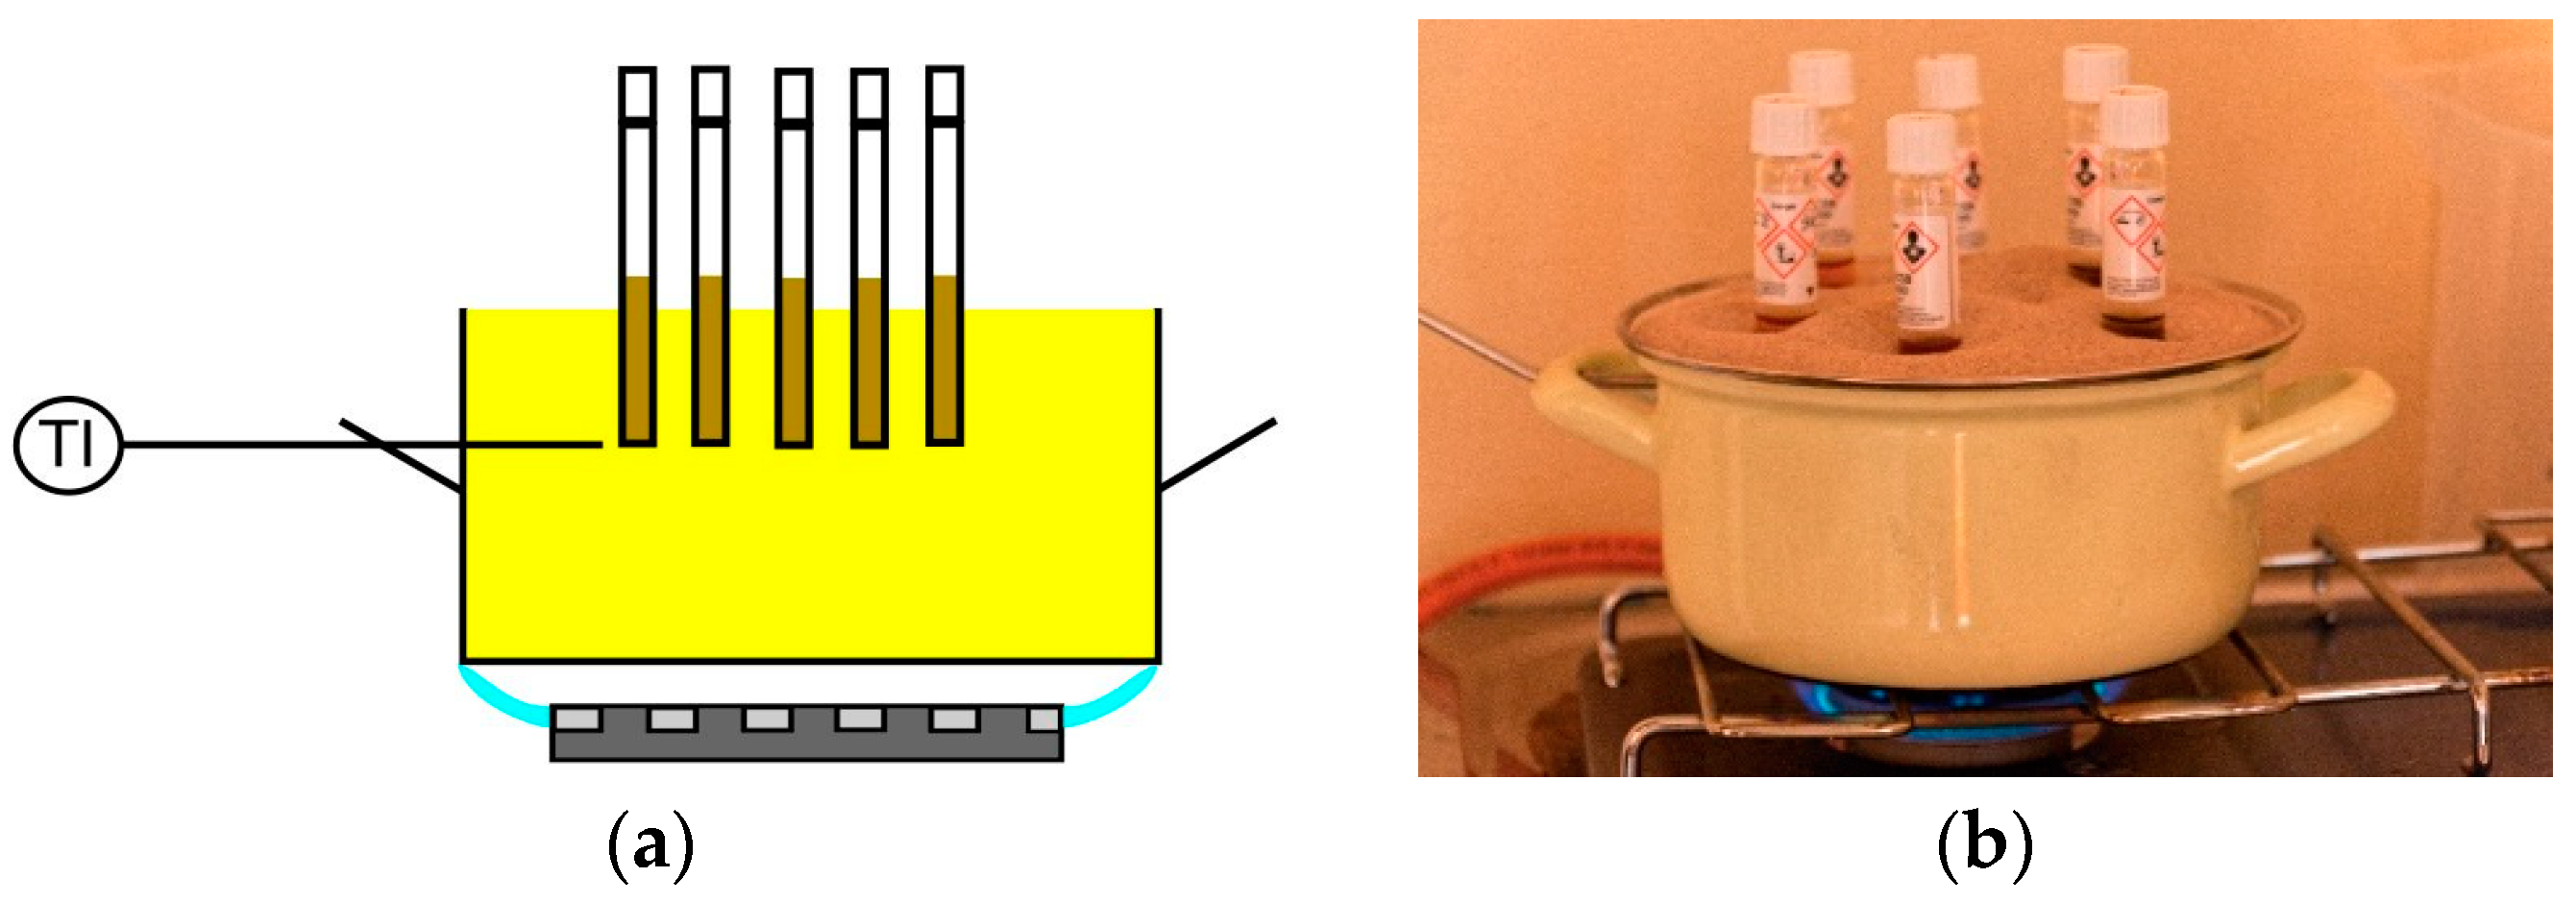
The oxygen demand is determined in two different ways and is an important parameter for process control and effluent quality [6]. The total chemical oxidizable content of a sample is represented by the COD and indicates the energy content or organic pollution [14]. For the determination of the biological oxygen demand (BOD), aerobic micro-organisms are used to degrade the sample. Their oxygen consumption is used to estimate the biological degradability of the sample. While BOD would be of higher interest for biological treatment processes, in the field laboratory only COD is determined. COD determination is considerably faster and itself of a higher precision, especially when fecal sludge is analyzed. In fecal sludge, several noncarbonaceous chemicals are often present in an unoxidized form. During a BOD determination, these chemicals increase the total oxygen consumption and thus bias the result [6]. For COD determination, a digestion system is needed. The samples are digested using sulphuric acid and heat. Laboratories customarily use electric digestion systems. These consume several hundred watts of electrical power, and are heavy and expensive. For the field lab a digestion method was developed employing a sand bath in a cooking pot placed on a gas stove.
For the determination of COD, a photometric cuvette test was used. During the laboratory development, an LCK 014 and 114 test set, a DR2800 photometer, and a HT200S digestion block, all from Hach (Loveland, CO, USA), were used.
For field use, a sand bath (Figure 1b) digestion setup was developed and tested. The sand bath consisted of a 2 L metal cooking pot with a digital temperature indicator fixed to it. The temperature indicator was fixed at the height of the maximum immersion depth of the photometric cuvettes (Figure 1a). The sand bath was heated on a gas stove. The digestion method was developed to mimic the Hach (USA) high-temperature method, which uses a digestion temperature of 170 °C and a time of 20 min. For the field method, a temperature range of 160 to 180 °C for digestion was established and tested. Due to heat stored in the sand, the temperature would increase after the heat source was shut off. Before the first digestion of samples, a dry run without samples to establish the right shut-off point was needed to be done. The sand bath was heated on a gas stove. The cuvettes were prepared according to the manufacturer’s instructions. All samples used for method development were analyzed in duplicate. At a sand temperature of approximately 100 °C, the cuvettes were placed in the sand bath. At a beforehand-determined point, commonly 160 °C, the heat source was shut off and the temperature increased but stayed in the temperature band. After 20 min, the cuvettes were removed from the sand bath and put aside to cool. Before measurement, according to the Hach guidelines, the cuvettes were wiped to remove residual sand particles to protect the photometer.
2.4. Volatile Fatty Acid (VFA)/Bicarbonate Alkalinity (Alk) Titration
For biogas plants, the ratio of VFAs to the Alk is powerful process stability indicator [14]. Inhibitions in biogas plants are often accompanied by an increase in the VFA concentration. The applied method uses an acid titration and is considered routine analysis for biogas plants. In the established laboratory method, a fully automated titration device is used. Automatic titrators are quite expensive and need a stable (110 or 230 V) power supply. For the field laboratory, a similar device was constructed out of Vernier parts. Most of the Vernier equipment is also used for the analysis of different parameters, operates on batteries and is less expensive.
VFAs and Alk were measured in both lab setups by titration. In the fixed laboratory an autotitrator (Titrino 721 NET, Metrohm, Herisau, Switzerland) was used and compared to the field-lab method using a pH sensor (ph-bta), a drop counter (VDC-BTD), and a LabQuest Stream data collector, all from Vernier (Beaverton, OR, USA). The drop counter’s original tip was replaced with an injection cannula to decrease droplet size. 1 mL of sample, diluted to 50 mL with reverse-osmosis water, was titrated with 0.1 M HCl to the pH point 5.0 and a pH end point of 4.5 following a protocol provided by the manufacturer. All samples were determined in triplicates. The formula provided by Drosg [14] was used for calculation of results.
2.5. Total Solids (TS) Determination
TS are determined by drying a sample and differential weighing. Two different determination methods are used in laboratories. The first method, described in most handbooks calls for drying the sample overnight at 105 °C [32]. Customarily, electrical-drying ovens are used. These are large, heavy, expensive, and consume a lot of power. Infrared moisture analyzers are used in the second common method. These analyzers combine a drying element with a scale. A sample is placed in a tin crucible on the scale and dried at a higher temperature (often 120 °C) in place. The scale automatically controls the drying process and calculates the total solids content. These moisture analyzers are expensive, fragile, and, due to use of electronics, rely on stable power supply. For the field laboratory a camping baking oven placed on a gas stove was used instead of an electric drying oven. This system is cheaper, lighter, and more rugged than both alternatives.
Total solids in the fixed laboratory were determined by differential weighing after drying at 105 °C over night in an Heraeus drying oven (Fisher Scientific, Hampton, NH, USA). In the field lab a camping baking oven (Coleman, Wichita, KS, USA) on a gas stove was used. To reduce drying time the temperature was increased to 120–140 °C. The temperature was manually regulated by adjusting the gas flame. The samples were determined in duplicate.
2.6. Ammonia Determination
Test strips offer the possibility to analyze a wide range of different parameters at a comparatively low price per test. However, two challenges were found when used with fecal sludge or wastewater. Most test strips were designed to analyze water samples. Fecal sludge and wastewater have a higher particle density and often a distinct color—both can bias the test result. To reduce the particle load, the samples were centrifuged and only the supernatant analyzed. Test strips are normally assessed with the operator’s eyesight. Thus, a human-error element is introduced. Test-strip manufacturers have recognized this problem and developed test-strip photometers. While they are light and operate on batteries, these photometers are expensive. The Dutch Akvo foundation has developed a method that allows assessment of test strips using a color card and a smartphone app [34]. In the field lab the methodology was adapted to fecal sludge. In this study a focus was laid on ammonia test strips. Their results were compared with two established methods (photometric tests and water-vapor distillation).
Ammonia concentration in the field laboratory was determined using Quantofix test strips (Macherey-Nagel, Düren, Germany) in combination with Akvo Caddisfly color cards and smartphone app (Akvo foundation, Amsterdam, The Netherlands). Due to the coloration of fecal-sludge samples were centrifuged (1500 rpm, 2 min, Hettich hand centrifuge, Kirchlengern, Germany) and, if necessary, diluted with reverse-osmosis water.
The field-laboratory method was compared to two ammonia-determination methods. One sample set was analyzed using a Büchi distillation/titration unit (K370, Büchi, Flawil Switzerland). The second sample set was analyzed a photometric method based on indophenol formation with sodium salicylate. The method follows the protocol described in the German standard methods (DIN 38406/5) but was downsized to the ml scale to allow the use of 24-well microtiter plates (Falcon, Cornig, NY, USA) and photometric analyses in a plate reader (Infinite M200 Pro, Tecan, Männedorf, Switzerland). Samples were centrifuged (12,500 rpm 15 min; CS-15 Beckman Coulter, Brea, CA, USA), the supernatant was used for further analysis. Samples from the scrubber were analyzed directly without pretreatment. Each sample was diluted in three different ratios, and the average of values within the calibration range was taken as the result. All ammonia determinations, with either the field method or the laboratory methods, were conducted in duplicate.
3. Results
3.1. Bacteriology
For precise bacteriological results, stable incubation temperatures are needed. For the incubation of all indicator organisms used in the field laboratory, a temperature of 36 ± 1 °C was required [30]. Two different commercially available field incubators were tested (Table 2). The Cultura Mini, due to previous usage within the Austrian Red Cross, was acquired and tested first. After analysis of the first test results, the incubator was modified by installing a small PC fan to improve the temperature distribution. While through this modification the required temperature range was reached, it was decided to search for a commercial available product with a different design. The Hova Bator Genesis was suggested by a water-quality-testing manual [35]. This incubator was originally intended for incubation of poultry eggs, which requires precise temperature control. It was already equipped with a fan, better temperature control system, and operated on a 12 V power supply.
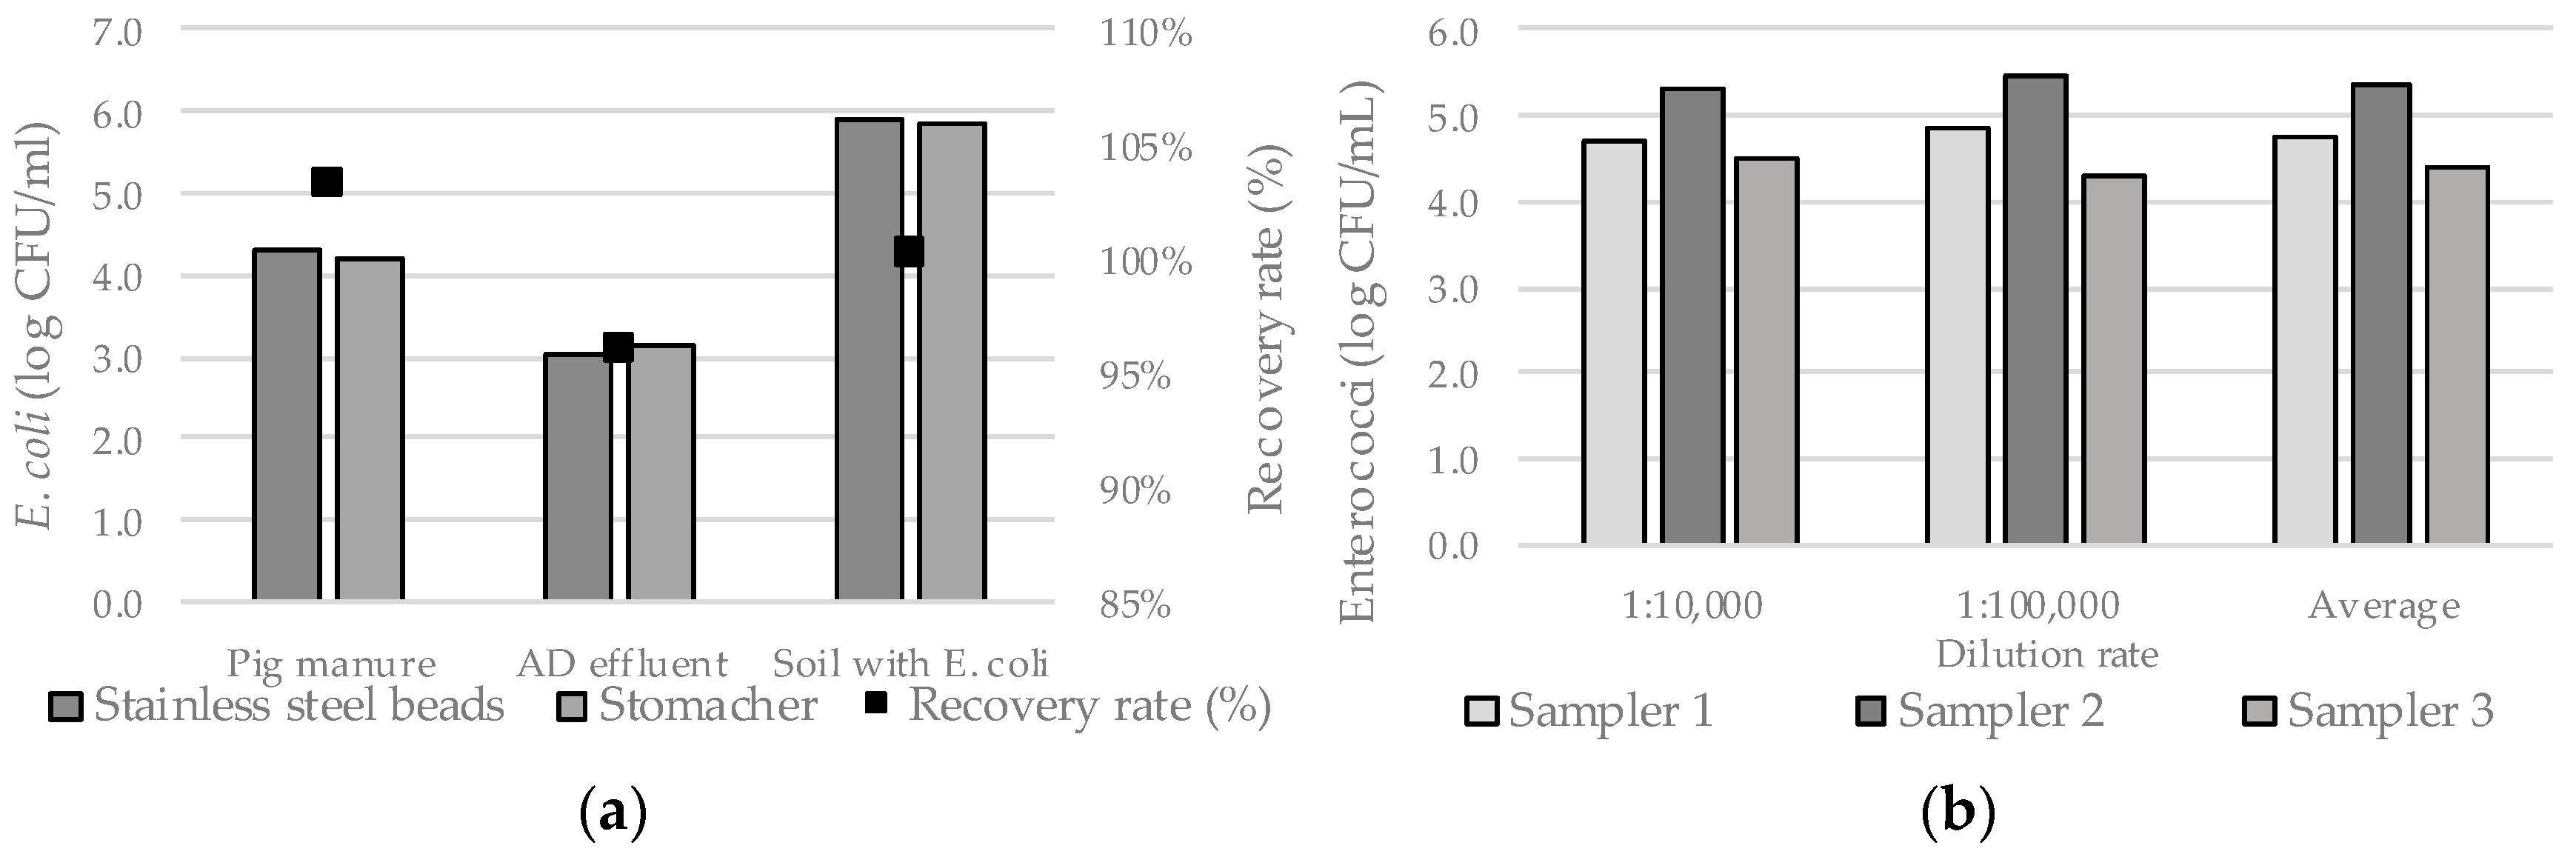
For bacteriological analysis of fecal-sludge sample homogenization is considered highly important. A laboratory stomacher was compared to the stainless-steel homogenization field method with different sample matrices (Figure 2a and Table A1). The results displayed are the average of multiple analysis (Table A2 and Table A3). For liquid-sludge samples, fecal sludge from a septic tank and pig manure from a farm storage tank were analyzed. To simulate soil and compost samples, garden soil was autoclaved and dried and seeded with a known E. coli concentration (log 5 CFU/mL). On average, 5.9 ± 0.1 log CFU/mL was found. The recovery rate for all different sample matrices ranged between 67% and 133%.
In a second set of experiments (Figure 2b and Table A4), the effects of sampling were investigated. A 60 L barrel was filled with fecal sludge and stirred for several minutes before it was sampled by three laboratory technicians. While the analytical results were consistent between the dilutions steps of a sampler, the averaged results of each sampler differed by up to one log unit. Enterococci concentration of 4.4 ± 0.1 to 4.8 ± 0.1 log CFU/mL was reported by sampler 1 and 3. Concentrations of one log unit higher (5.4 ± 0.1) were reported by sampler 2 (Table A5).
3.2. Chemical Oxygen Demand Determindation
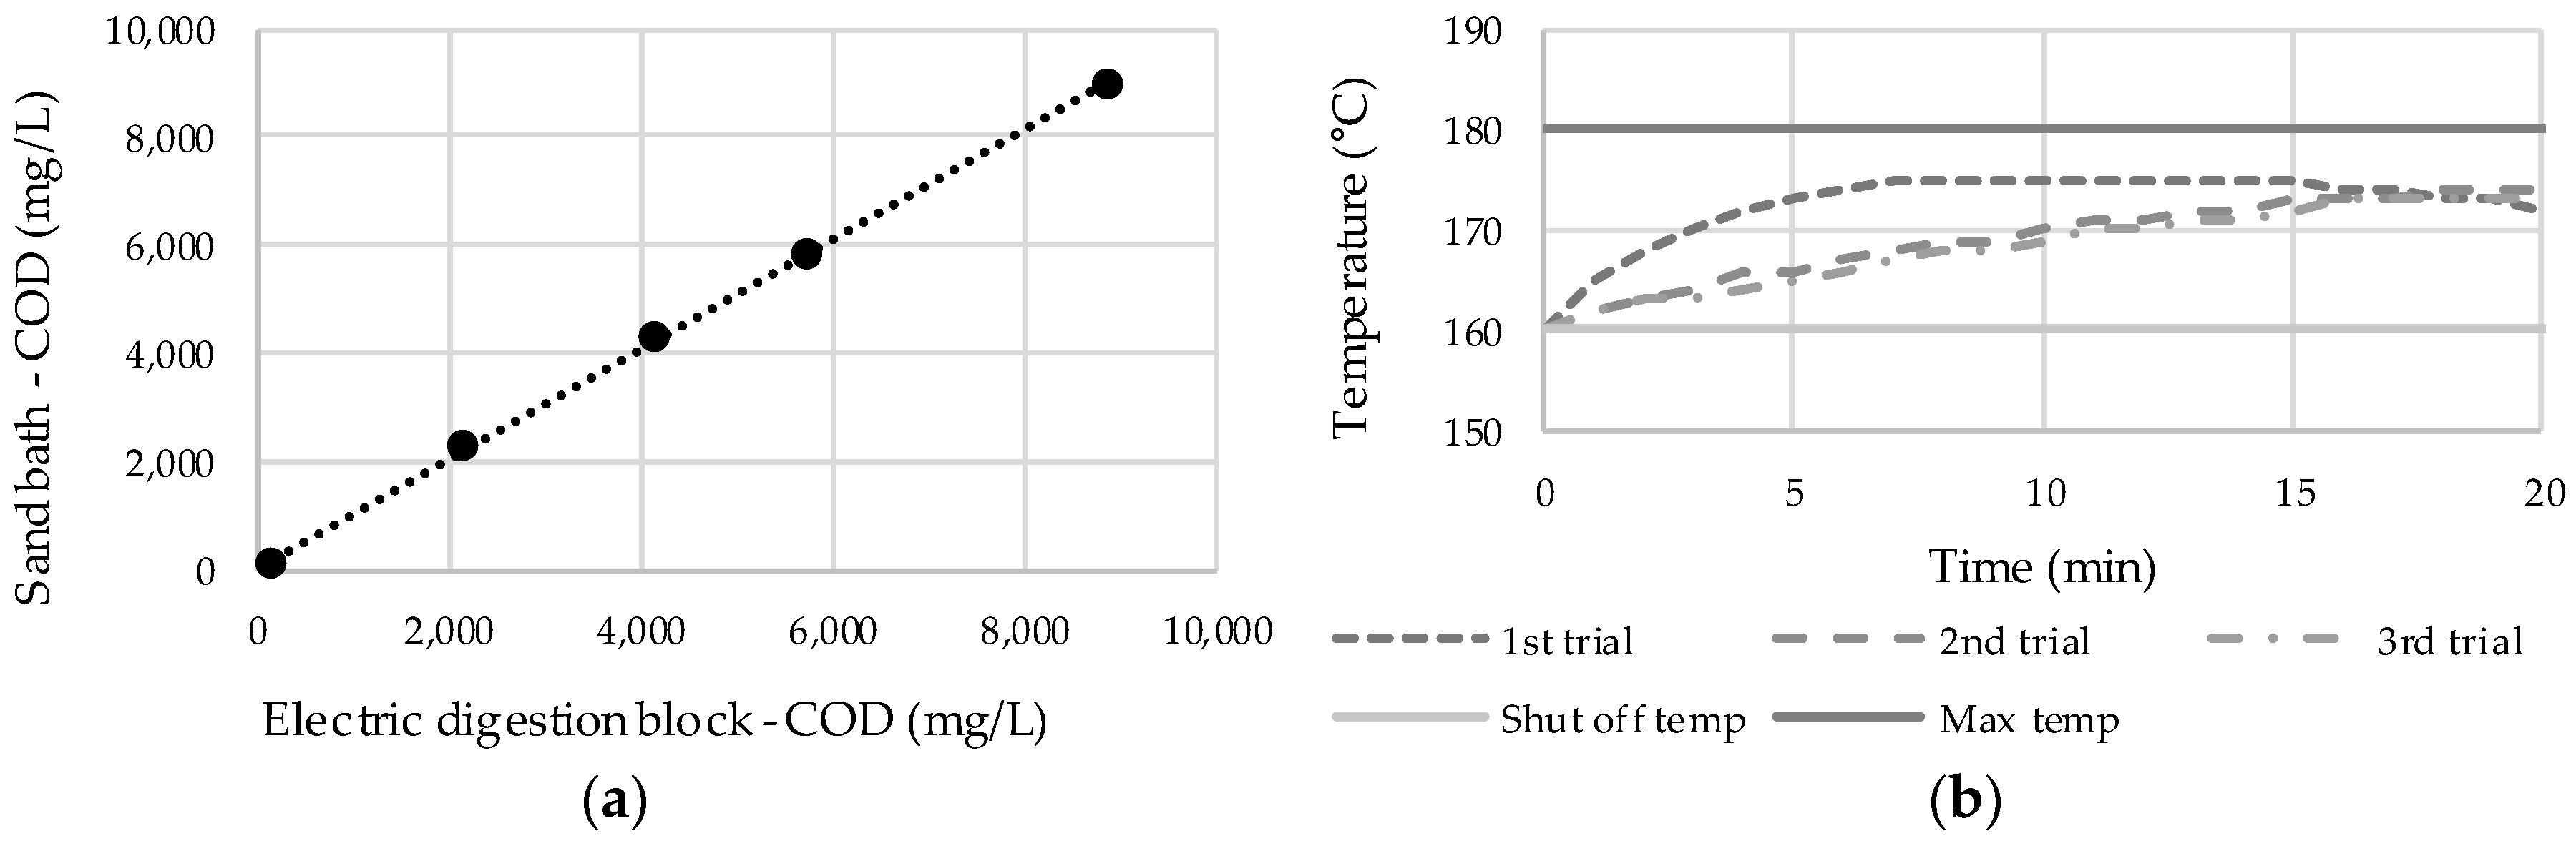
A sand bath on a gas stove was used as the sample digestion system. To estimate the shut-off temperature of the gas stove, several trials were conducted (Figure 3b). The gas stove was shut off at 160 °C. In all experiments, the temperature stayed in the required band for over 20 min.
Wastewater, manure, and fecal-sludge samples with different COD concentrations were measured using both digestions systems and the results compared to each other (Figure 3a and Table A6). The measured COD ranged from 160 to 9.070 mg/L COD and a recovery rate between 95%–106% was calculated. Due to the range limitation of the photometric COD tests, two different test sets had to be used.
3.3. Volatile Fatty Acid to Alkalinity Titration
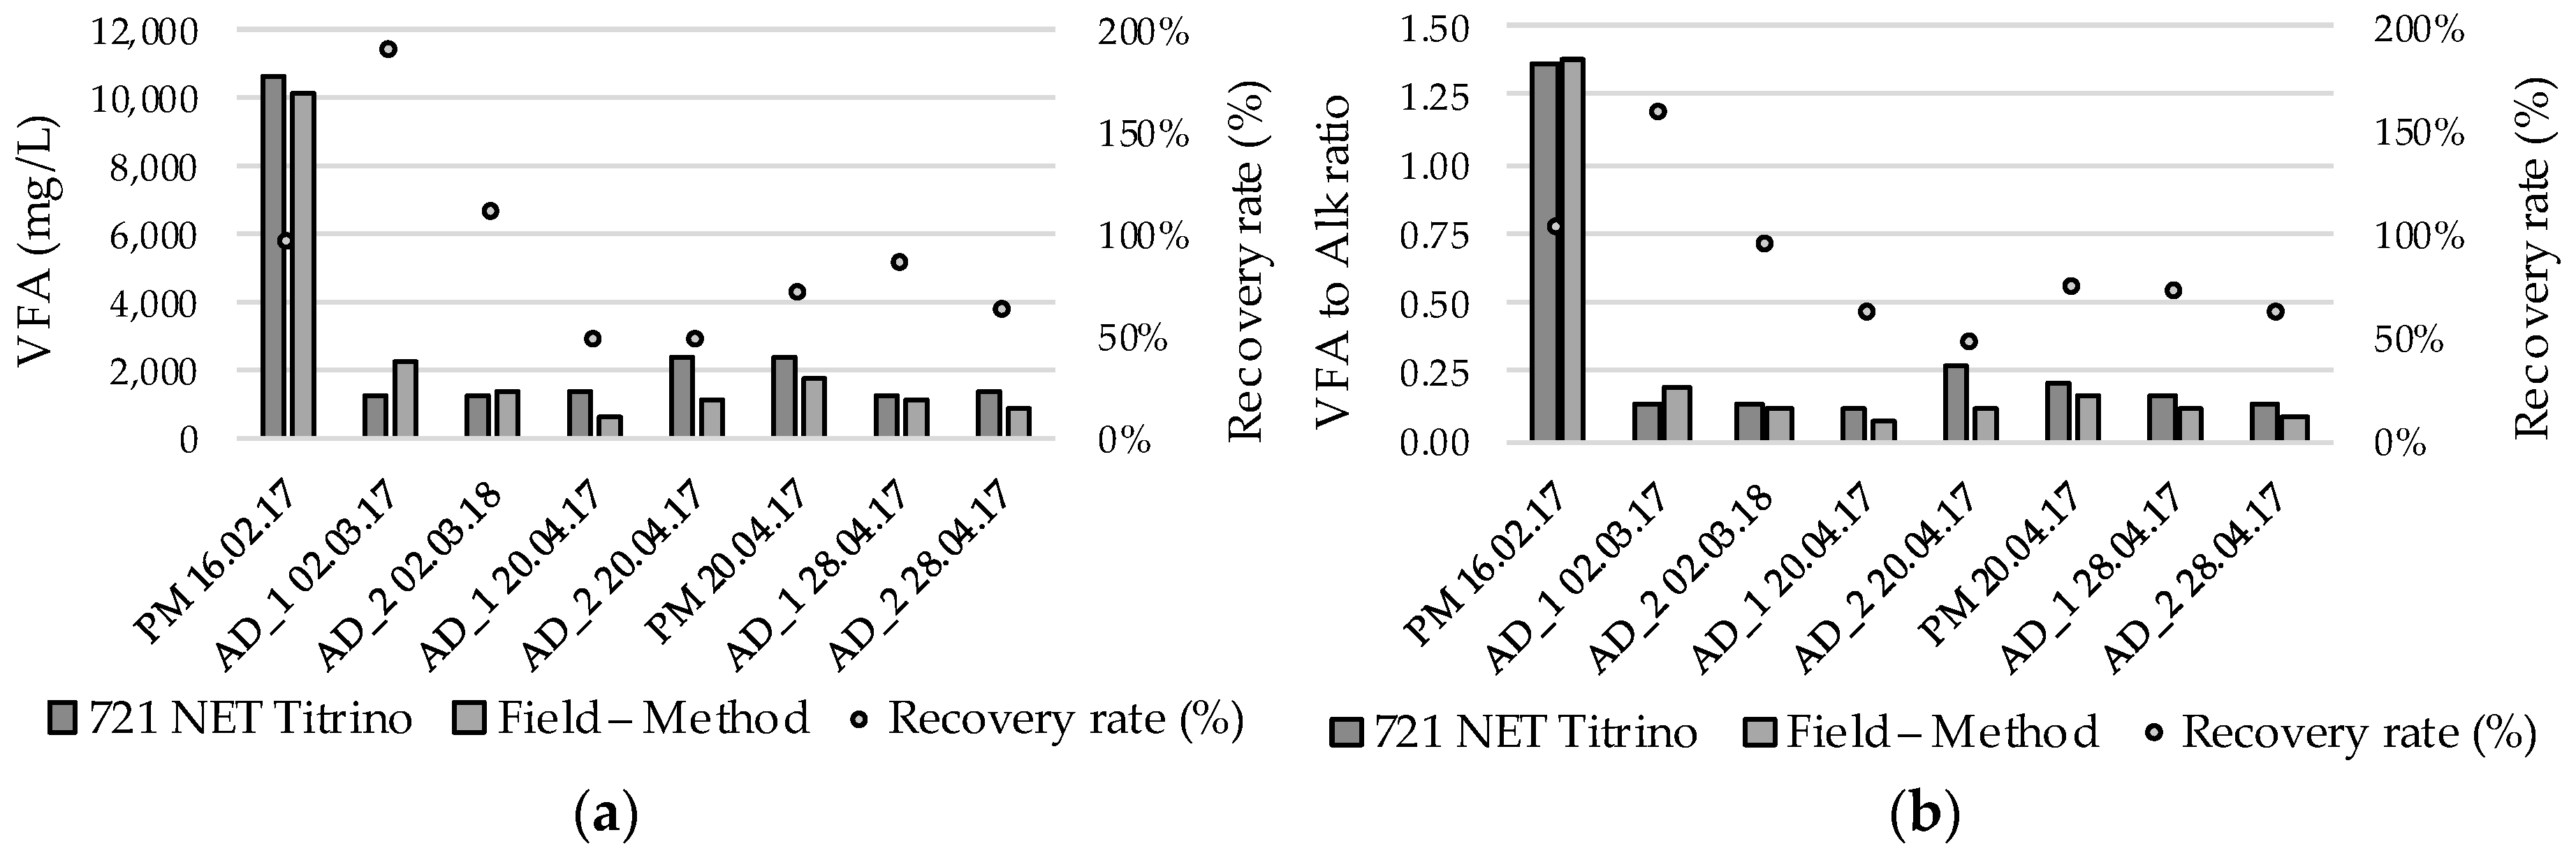
For the method development, pig manure and anaerobic digestion (AD) effluent samples were analyzed with the autotitrator and the field set up. In Figure 4a, the results of the VFA titration and in Figure 4b the results of the VFA/Alk are shown. The raw data are shown in Table A7, Table A8 and Table A9. The recovery rate for VFA and the ratio ranged between 48% to 190% and 46% to 157%, respectively.
3.4. Total Solids Determination
For the evaluation of the TS methodology, fecal sludge from a household septic tank and soil was used. The results (Table 3 and Table A10) represent the average of multiple determinations. The fecal-sludge sample was take from the septic tank of a family house and stored in a 60 L barrel. The TS samples were taken in the course of a month.
3.5. Ammonia Determination
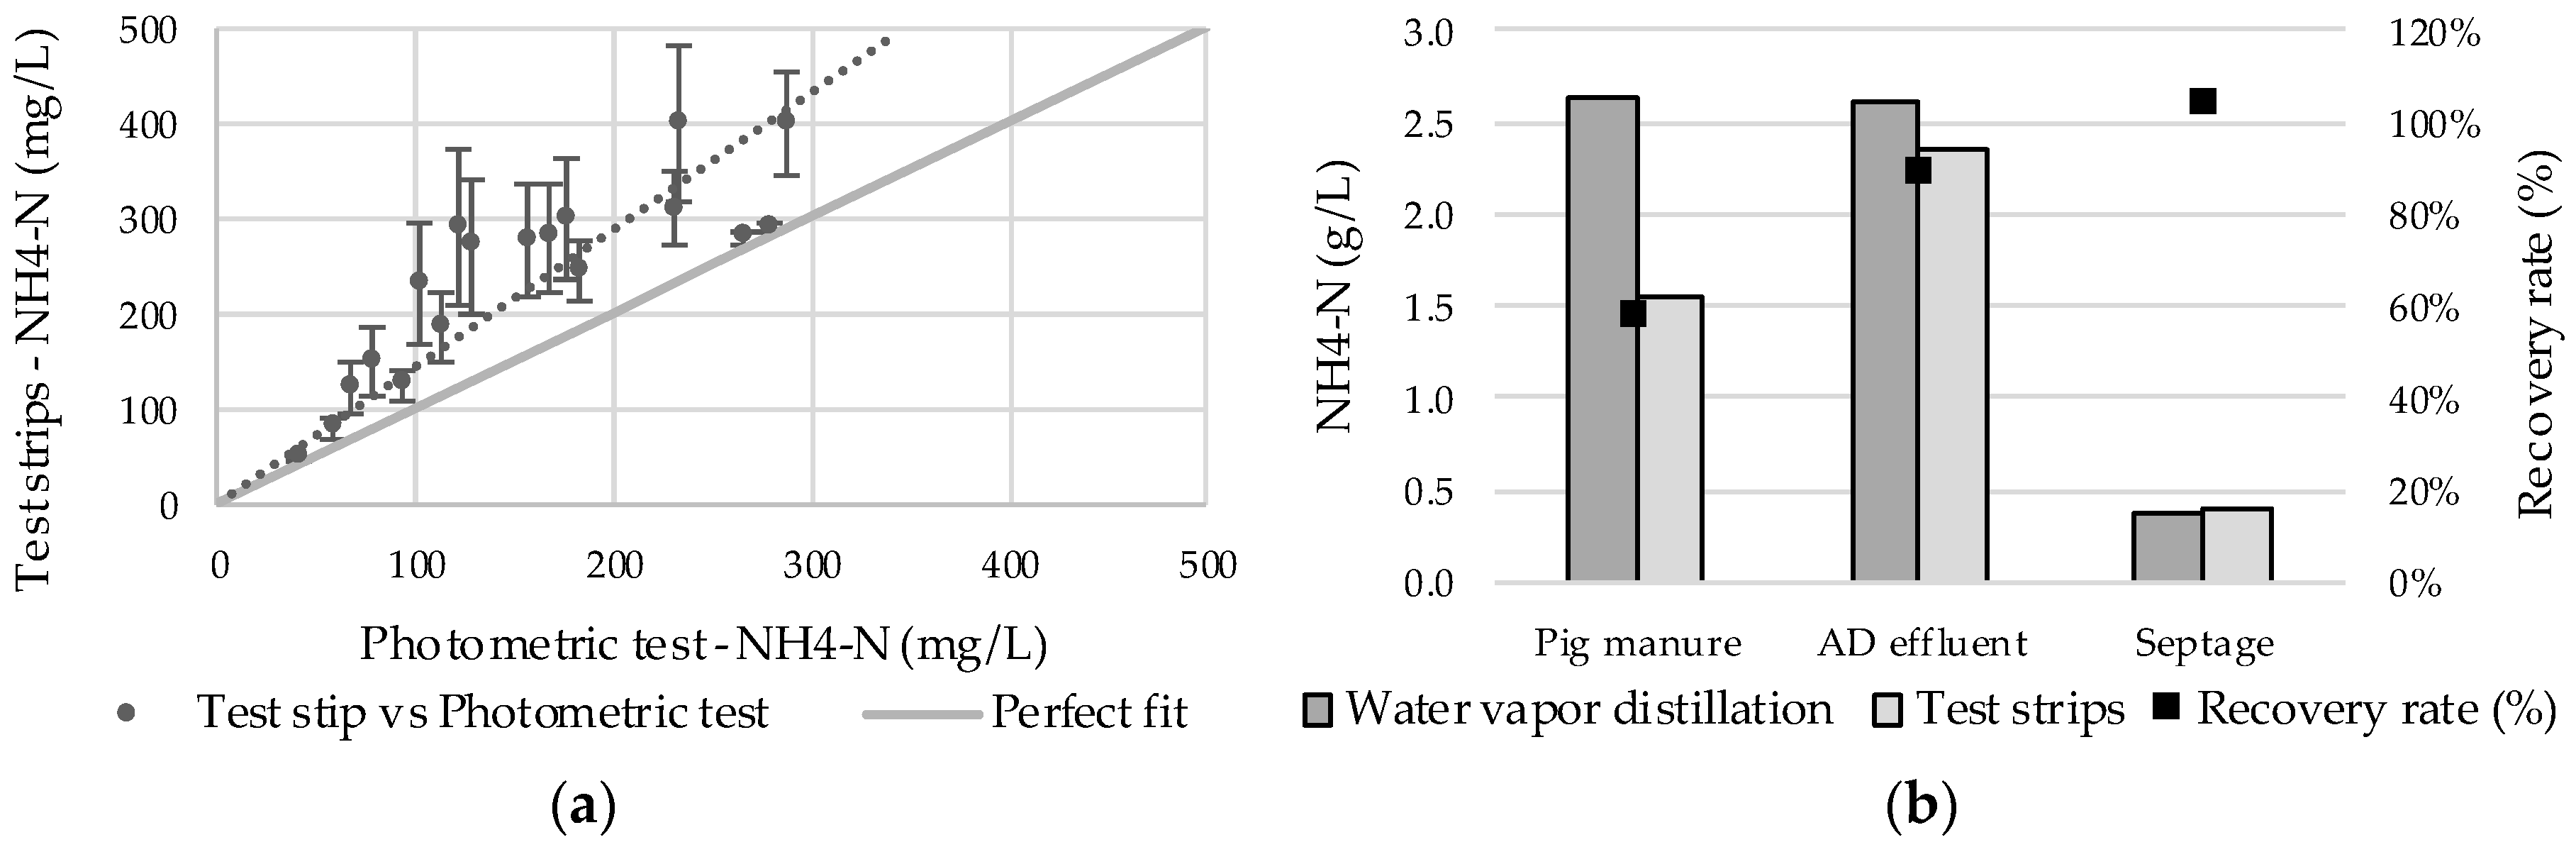
For the first tests of the ammonia–nitrogen (NH4-N) test strips, samples from an ammonia-stripping experiment were used. The samples were clear diluted sulphuric acid with an increasing ammonia concentration. The test-strip results were compared with photometric tests (Figure 5a and Table A11). A general trend of higher results reported by the test strips was observed. The recovery rate was averaged at 160%. A second set of tests (Figure 5b and Table A12) was conducted with real samples (pig manure, AD effluent, fecal sludge). The previously observed trend of higher results was not repeated. A recovery rate of 59% to 105% was reported.
4. Discussion
4.1. Analytical Methods Modified for Field Use
4.1.1. Bacteriology
By using the stainless-steel bead methodology instead of a stomacher, no significant differences in homogenization were noticed. During the bacteriological analysis of sterilized soil spiked with E. coli, a significantly lower standard deviation was found than in similar research [36]. The difference in the bacteriological results between samplers, with a standard deviation of 0.4 log units, was found to be in range with results presented by the literature [5,37].
Manual digital colony counting using an image-processing system sped up the process and reduced the contact time with possibly contaminated equipment. Freeware colony-counting software was tested, but due to a low colony-recognition percentage, it was found to be unhelpful. However, when these systems become fully operational, it is estimated that bacteriological analysis will be sped up. Membrane filtration was chosen due to its wide spread use in water analysis with humanitarian-aid organizations. However, fecal-sludge analytics compared to water analytics is significantly more complex. For future iterations of the laboratory, it might be prudent to develop an easier bacteriological methodology.
4.1.2. Chemical Oxygen Demand
The results from the sand-bath digestion system correlated (R2 = 0.999) with the results of the electric digestion system. Compared to the electric digestion system, the field method is slower and more difficult to handle; however, it is cheaper and does not require electricity. If the sand-bath digestion is used, the cuvettes need to be wiped off to remove residual sand particles before measurement in a photometer. To enable the usage of the sand-bath digestion system, the high-temperature digestion methodology developed by Hach must be supported by the used brand of cuvette tests. While the focus of the experiments was laid on COD determination, total nitrogen and total phosphate also require sample digestion and could use the sand bath.
4.1.3. Volatile Fatty Acid and Alkalinity Titration
The VFA/Alk ration, determined by titration, is an important process parameter for anaerobic digestion plants. It indicates the process stability regarding feeding regime and inhibition of the acetogenisis and methanogenesis. Using the field method, generally lower results were found in comparison to the autotitrator. The different results in the titration can be attributed to different pH electrodes, inhomogeneous samples, and the more exact dosage system of the autotitrator. However, these differences are not as significant, because the aim of the VFA/Alk ratio measurement is the detection of a change or drift in the ratio. Further on, differences, e.g., in feed compositions and reactor management, make a realistic comparison between different anaerobic digestion plants not feasible [14].
4.1.4. Total Solids
Due to the manual control of the temperature of the camping baking oven, the drying time had to be reduced by increasing the temperature. The chosen temperature of 140 °C was copied from a Sartorius infrared moisture used for quick analysis for wastewater and anaerobic digestion samples. For the field method it was broadened to 120–140 °C. A loss of volatile compounds due to the higher drying temperature was not observed during the experiments.
4.1.5. Ammonia Determination
Test strips in general, and especially the tested ammonia test strip, were developed for water testing and not with fecal sludge as matrix in mind. Some of the matrix effects were countered by adaptions in the analytical method, e.g., analyzing centrifuged sludge. Therefore, lower analytical precision was expected and found. However, similar problems are encountered with most photometric cuvette tests used in the process control of state-of-the-art anaerobic digestion plants.
As the test strips are to be used for process control in a field fecal sludge treatment plant in a humanitarian aid setting, a lower analytical precision was found acceptable. In the process control of most treatment processes the values are allowed in a certain range (e.g., for anaerobic digestion plants [14]). The experiments were focused on ammonium; however, nitrate, nitrite, phosphate, and potassium are as well determined with test strips.
4.1.6. Overall Considerations on Modified Methods
While the modified methods were analytically compared to their respective laboratory counter parts, the field methods were not analytically validated. As already discussed above, some of the analytical results from both sets of methods differ significantly (mainly test strips, VFA/Alk titration). However, even these methods can be considered viable for field-process control of fecal-sludge treatment plants, since in process control thresholds are expressed in ranges and trends are monitored. More research is needed to validate each of the modified analytical methods.
4.2. Design Creiteria
For the successful development of the field laboratory, the previously described design criteria have to be met. The design criterion “Appropriateness” is defined by obtaining comparable analytical results of a fixed, modern laboratory. Modifications of methods like bacteriology or COD digestion have yielded highly comparable results. While the results of some of the modified methods (e.g., ammonia or VFA/Alk) are not as exact as their respective originals, they still fulfill the aim of enabling process control of a fecal-sludge treatment plant directly in the field.
By “Applicability”, the operability of the laboratory in the field is meant. In short, the laboratory must work in the field. Some methods were required to be adapted to field conditions. The main reasons for modifications were equipment weight and power consumption. Through these changes, these methods have become more labor-intensive and rely heavily on manual control of previously automated equipment. It is estimated that in comparison to a fixed laboratory, the field laboratory will have a lower sample throughput per day. While more labor-intensive, the modified methods have not necessarily become more complicated. However, skilled and well-trained technicians are needed to operate any laboratory, especially a field laboratory. Besides the redevelopment of analytical methodology, the aim of the project was the development of a whole field laboratory. Therefore, support equipment was added. This equipment allows immediate semi-operation of the laboratory in the field.
For humanitarian-aid organizations, the main target group “Affordability” is of high importance. Even during humanitarian-aid, operations budgets are often constricted. The product choices were guided by the CATNAP principle [7]. Through the adaption of analytical methods to field conditions, a cost reduction in comparison to regular laboratory equipment was reached. The first example is the electrical laboratory drying costs—approximately €1000—while the camping baking oven is around 65€. The second example is the COD digestion block, which costs between €1000–2500. The sand-bath sample digestion costs below 100€.
“Mobility” is a crucial attribute for any humanitarian-aid equipment. It was defined by the project team that the laboratory has to fit in a Toyota Landcruiser [38], which can be considered the universal vehicle of humanitarian aid. While no Landcruiser was available, the laboratory nicely fit into the trunk of a VW transporter. The whole field laboratory with consumables for 100 samples, deployed to Malawi for the filed trail, not covered in this study, weighed approximately 220 kg and had a shipping volume below 2 m3.
5. Conclusions
Usage of the field lab should provide direly needed information on the effluent characteristics of field-treatment plants on site and close in time. This information will allow treatment-plant operators better control of their treatment process, thus ensuring better public health and environmental protection in humanitarian aid. To reach this goal, several analytical methods were modified for field use and compared the original methods. Of the modified methods, the bacteriological analysis, COD, and total solids determination provided highly comparable results. The results of titration of VFA/Alk ratio and ammonia determination were not as well comparable. However, the obtained results were considered acceptable for the purpose of field-process monitoring of fecal-sludge treatment plants.
As the work presented in this study is the first version of a field laboratory for the process and public-health monitoring of fecal-sludge treatment plants, the researchers acknowledge that room for improvement in the laboratory exist.
Author Contributions
Conceptualization, J.B., G.E., J.S., and A.H.; methodology, J.B., M.S., and W.F.; investigation, J.B., M.S., and M.B.; resources, W.F.; writing—original draft preparation, J.B.; writing—review and editing, W.F.; visualization, J.B. and M.S.; supervision, W.F.; project administration, J.B. and M.B.; funding acquisition, G.E., A.H., and J.S.
Funding
This research was funded by the Humanitarian Innovation Fund, grant number (Large Grant Full Application 2016/17).
Acknowledgments
First the authors would like to thank the Humanitarian Innovation Fund for the possibility and the excellent support during the execution of the project; further on, we would like to thank all members of the project consortium, especially the support staff at IFA and the Waste, Malawi Office.
Conflicts of Interest
The authors declare no conflict of interest.
Appendix A

Table A1.
Raw data from bacteriological homogenization experiments.
| Source | Type of Homogenization | Colonies | Dilution Rate | E. coli (log CFU/mL) |
|---|---|---|---|---|
| Pig manure | Stainless steel beads | 43 | 10,000 | 4.3 |
| Pig manure | Stainless steel beads | 68 | 10,000 | 4.5 |
| Pig manure | Stainless steel beads | 3 | 100,000 | 4.2 |
| Pig manure | Stainless steel beads | 4 | 100,000 | 4.3 |
| Pig manure | Stomacher | 52 | 10,000 | 4.3 |
| Pig manure | Stomacher | 38 | 10,000 | 4.1 |
| Pig manure | Stomacher | 3 | 100,000 | 4.0 |
| Pig manure | Stomacher | 5 | 100,000 | 4.3 |
| AD effluent | Stomacher | 49 | 1000 | 3.2 |
| AD effluent | Stomacher | 35 | 1000 | 3.1 |
| AD effluent | Stomacher | 3 | 10,000 | 3.0 |
| AD effluent | Stomacher | 6 | 10,000 | 3.3 |
| AD effluent | Stainless steel beads | 33 | 1000 | 3.0 |
| AD effluent | Stainless steel beads | 28 | 1000 | 3.1 |
| AD effluent | Stainless steel beads | 2 | 10,000 | 2.8 |
| AD effluent | Stainless steel beads | 4 | 10,000 | 3.1 |
| Soil with E. coli | Stomacher | 206 | 100,000 | 5.8 |
| Soil with E. coli | Stomacher | 196 | 100,000 | 5.8 |
| Soil with E. coli | Stomacher | 25 | 1,000,000 | 5.9 |
| Soil with E. coli | Stomacher | 23 | 1,000,000 | 5.9 |
| Soil with E. coli | Stainless steel beads | 138 | 100,000 | 5.7 |
| Soil with E. coli | Stainless steel beads | 209 | 100,000 | 5.8 |
| Soil with E. coli | Stainless steel beads | 220 | 100,000 | 5.9 |
| Soil with E. coli | Stainless steel beads | 213 | 100,000 | 5.9 |
| Soil with E. coli | Stainless steel beads | 34 | 1,000,000 | 6.1 |
| Soil with E. coli | Stainless steel beads | 40 | 1,000,000 | 6.1 |
| Soil with E. coli | Stainless steel beads | 20 | 1,000,000 | 5.8 |
| Soil with E. coli | Stainless steel beads | 25 | 1,000,000 | 5.9 |
Table A2.
Averages of homogenization experiments.
| Average (log CFU/mL) | Pig Manure | AD Effluent | Soil with E. coli |
|---|---|---|---|
| Stainless steel beads | 4.3 | 3.0 | 5.9 |
| Stomacher | 4.2 | 3.2 | 5.7 |
| Recovery rate (%) | 104% | 96% | 100% |
Table A3.
Standard deviation of the homogenization experiments.
| SD (log CFU/mL) | Pig Manure | AD Effluent | Soil with E. coli |
|---|---|---|---|
| Stainless steel beads | 0.1 | 0.1 | 0.1 |
| Stomacher | 0.1 | 0.1 | 0.1 |
Table A4.
Raw data from the differences in sampling experiments.
| Sampled by | Colonies Counted | Dilution Rate | Enterococci (log CFU/mL) |
|---|---|---|---|
| Sampler 1 | 127 | 10,000 | 4.7 |
| Sampler 1 | 137 | 10,000 | 4.7 |
| Sampler 1 | 22 | 100,000 | 4.9 |
| Sampler 1 | 20 | 100,000 | 4.8 |
| Sampler 2 | 478 | 10,000 | 5.2 |
| Sampler 2 | 74 | 100,000 | 5.4 |
| Sampler 2 | 83 | 100,000 | 5.4 |
| Sampler 3 | 83 | 10,000 | 4.5 |
| Sampler 3 | 92 | 10,000 | 4.5 |
| Sampler 3 | 6 | 100,000 | 4.3 |
| Sampler 3 | 6 | 100,000 | 4.3 |
Table A5.
Averages and standard deviation of the differences in sampling experiments.
| (log CFU/mL) | 1:10,000 | 1:100,000 | Average | SD |
|---|---|---|---|---|
| Sampler 1 | 4.7 | 4.8 | 4.8 | 0.1 |
| Sampler 2 | 5.3 | 5.4 | 5.4 | 0.1 |
| Sampler 3 | 4.5 | 4.3 | 4.4 | 0.1 |
| All Samplers | 4.8 | 4.9 | 4.8 | 0.4 |
Table A6.
COD measurement raw data.
| Laboratory Method | Field Method | ||||||
|---|---|---|---|---|---|---|---|
| Test (COD mg O2/L) | 1 | 2 | Average | 1 | 2 | Average | Recovery Rate (%) |
| 1 | 5750 | 5980 | 5870 | 5950 | 5710 | 5830 | 99% |
| 2 | 2150 | 2160 | 2160 | 2290 | 2280 | 2290 | 106% |
| 3 | 8730 | 8950 | 8840 | 9070 | 8950 | 9010 | 102% |
| 4 | 164 | 166 | 170 | 162 | 150 | 160 | 94% |
| 5 | 4220 | 4100 | 4160 | 4170 | 4450 | 4310 | 104% |
Table A7.
VFA titration results, PM—pig manure; AD—anaerobic digestion effluent.
| VFA (mg/L) | 721 NET Titrino | Field—Method | Recovery Rate (%) |
|---|---|---|---|
| PM 16.02.17 | 10,600 | 10,200 | 96% |
| AD_1 02.03.17 | 1200 | 2290 | 190% |
| AD_2 02.03.18 | 1290 | 1410 | 109% |
| AD_1 20.04.17 | 1350 | 660 | 48% |
| AD_2 20.04.17 | 2350 | 1120 | 48% |
| PM 20.04.17 | 2380 | 1700 | 71% |
| AD_1 28.04.17 | 1290 | 1090 | 85% |
| AD_2 28.04.17 | 1420 | 890 | 63% |
Table A8.
Alkalinity titration results, PM—pig manure; AD—anaerobic digestion effluent.
| Alk (mg/L) | 721 NET Titrino | Field—Method | Recovery (%) |
|---|---|---|---|
| PM 16.02.17 | 7800 | 7380 | 95% |
| AD_1 02.03.17 | 9600 | 11,610 | 121% |
| AD_2 02.03.18 | 10,120 | 11,790 | 116% |
| AD_1 20.04.17 | 11,310 | 8930 | 79% |
| AD_2 20.04.17 | 8770 | 9110 | 104% |
| PM 20.04.17 | 11,080 | 10,720 | 97% |
| AD_1 28.04.17 | 8130 | 9770 | 120% |
| AD_2 28.04.17 | 10410 | 10700 | 103% |
Table A9.
VFA to alkalinity ratio, PM—pig manure; AD—anaerobic digestion effluent.
| VFA/Alk | 721 NET Titrino | Field—Method | Recovery Rate (%) |
|---|---|---|---|
| PM 16.02.17 | 1.36 | 1.38 | 101% |
| AD_1 02.03.17 | 0.13 | 0.20 | 157% |
| AD_2 02.03.18 | 0.13 | 0.12 | 94% |
| AD_1 20.04.17 | 0.12 | 0.07 | 61% |
| AD_2 20.04.17 | 0.27 | 0.12 | 46% |
| PM 20.04.17 | 0.21 | 0.16 | 74% |
| AD_1 28.04.17 | 0.16 | 0.11 | 70% |
| AD_2 28.04.17 | 0.14 | 0.08 | 61% |
Table A10.
Raw data of the total solid determination experiments.
| Camping Oven (g/kg) | Electric Drying Oven (g/kg) | |
|---|---|---|
| FS Sample 1 | 69.0 | 70.9 |
| FS Sample 1 | 68.8 | 70.3 |
| FS Sample 1 | 75.4 | - |
| FS Sample 1 | 72.7 | - |
| FS Sample 2 | 69.9 | 72.3 |
| FS Sample 2 | 72.2 | 72.4 |
| FS Sample 2 | 70.5 | 74.8 |
| FS Sample 2 | 70.7 | - |
| FS Sample 2 | 71.9 | - |
| FS Sample 2 | 72.8 | - |
| FS Sample 3 | 70.8 | 72.7 |
| FS Sample 3 | 70.6 | 72.8 |
| FS Sample 3 | 71.1 | 72.5 |
| FS Sample 3 | 71.8 | 73.4 |
| FS Sample 3 | 69.2 | 72.6 |
| FS Sample 3 | 69.4 | 70.8 |
| Soil | 440.0 | 448.3 |
| Soil | 419.4 | 400.0 |
Table A11.
Raw data photometric testing vs. test strips.
| Test | Photometric Test (mg NH4-N/L) | Test Strip (mg NH4-N/L) | Recovery Rate (%) |
|---|---|---|---|
| 1 | 58 | 80 | 137% |
| 2 | 113 | 185 | 164% |
| 3 | 167 | 280 | 167% |
| 4 | 230 | 310 | 135% |
| 5 | 278 | 290 | 104% |
| 6 | 94 | 125 | 133% |
| 7 | 175 | 300 | 171% |
| 8 | 266 | 280 | 105% |
| 9 | 41 | 47.5 | 115% |
| 10 | 66 | 120 | 181% |
| 11 | 101 | 230 | 227% |
| 12 | 129 | 270 | 210% |
| 13 | 156 | 275 | 177% |
| 14 | 78 | 150 | 193% |
| 15 | 122 | 290 | 238% |
| 16 | 183 | 245 | 134% |
| 17 | 233 | 400 | 172% |
| 18 | 288 | 400 | 139% |
Table A12.
Comparison water-vapor distillation vs. test strips.
| Water Vapor Distillation (g NH4-N/L) | Test Strips (g NH4-N/L) | Recovery Rate (%) | |
|---|---|---|---|
| Pig manure | 2.62 | 1.55 | 59% |
| AD effluent | 2.62 | 2.35 | 90% |
| Septage | 0.37 | 0.39 | 105% |
References
- Cumming, O. The sanitation imperative: A strategic response to a development crisis. Desalination 2009, 248, 8–13. [Google Scholar] [CrossRef]
- Fenner, R.A.; Guthrie, P.M.; Piano, E. Process selection for sanitation systems and wastewater treatment in refugee camps during disaster-relief situations. Water Environ. J. 2007, 21, 252–264. [Google Scholar] [CrossRef]
- Piarroux, R.; Barrais, R.; Faucher, B.; Haus, R.; Piarroux, M.; Gaudart, J.; Magloire, R.; Raoult, D. Understanding the cholera epidemic, Haiti. Emerg. Infect. Dis. 2011, 17, 1161–1168. [Google Scholar] [CrossRef] [PubMed]
- Zakaria, F.; Garcia, H.A.; Hooijmans, C.M.; Brdjanovic, D. Decision support system for the provision of emergency sanitation. Sci. Total Environ. 2015, 512–513, 645–658. [Google Scholar] [CrossRef] [PubMed]
- Anderson, C.; Malambo, D.H.; Perez, M.E.G.; Nobela, H.N.; de Pooter, L.; Spit, J.; Hooijmans, C.M.; van de Vossenberg, J.; Greya, W.; Thole, B.; et al. Lactic acid fermentation, urea and lime addition: Promising faecal sludge sanitizing methods for emergency sanitation. Int. J. Environ. Res. Public Health 2015, 12, 13871–13885. [Google Scholar] [CrossRef] [PubMed]
- Strande, L.; Ronteltap, M.; Brdjanovic, D. Faecal Sludge Management—Systems Approach for Implementation and Operation, 1st ed.; IWA Publishing: London, UK, 2014. [Google Scholar]
- Mara, D.D. Domestic Wastewater Treatment in Developping Countries, 1st ed.; Earthscan: London, UK, 2003. [Google Scholar]
- Bassan, M.; Ferré, A.; Hoai, A.; Nguyen, V.A.; Strande, L. Methods for the Characterization of Faecal Sludge in Vietnam, 1st ed.; Swiss Federal Institute of Aquatic Science and Technology; Sandec; Department Water and Sanitation in Developing Countries: Dübendorf, Switzerland, 2016. [Google Scholar]
- Harvey, P. Excreta Disposal in Emergencies, 1st ed.; Water, Engineering and Development Centre, Loughborough University: Leicestershire, UK, 2007. [Google Scholar]
- Spit, J.; Malambo, D.; Gonzalez, M.E. Emergency Sanitation Field Summary Report; WASTE: Gauda, The Netherlands, 2014. [Google Scholar]
- Gensch, R.; Jennings, A.; Renggli, S.; Reymond, P. Compendium of Sanitation Technologies in Emergencies, 1st ed.; German WASH Network (GWN); Swiss Federal Institute of Aquatic Science and Technology (Eawag); Global WASH Cluster (GWC) and Sustainable Sanitation Alliance (SuSanA): Berlin, Germany, 2018. [Google Scholar]
- Tilley, E.; Ulrich, L.; Lüthi, C.; Reymond, P.; Schertenleib, R.; Zurbrügg, C.; Morel, A.; Zurbrügg, C.; Schertenleib, R. Compendium of Sanitation Systems and Technologies; Swiss Federal Institute of Aquatic Science and Technology (Eawag): Duebendorf, Switzerland, 2014; 180p. [Google Scholar]
- Mara, D.D.; Kramer, A. The 2006 WHO Guidelines for Wastewater and Greywater Use in Agriculture: A Practical Interpretation. In Efficient Management of Wastewater: Its Treatment and Reuse in Water Scarce Countries; Al Baz, I., Otterpohl, R., Wendland, C., Eds.; Springer: Heidelberg, Germany, 2008; p. 19. [Google Scholar]
- Drosg, B. Process Monitoring in Biogas Plants; IEA Bioenergy: Paris, France, 2013. [Google Scholar]
- Klärschlammverordnung LGBI. 6160/2; Rechtsinformationssystem Bundeskanzleramt: St. Pölten, Austria, 2005.
- Verordnung des Bundesministers für Land- und Forstwirtschaft über die Begrenzung von Abwasseremissionen aus Abwasserreinigungsanlagen für Siedlungsgebiete (1. AEV für kommunales Abwasser) StF: BGBl. Nr. 210/1996; Rechtsinformationssystem Bundeskanzleramt: Wien, Austria, 2000; p. 7.
- World Health Organization (WHO). Excreta and Greywater use in Agriculture. In Guidelines for the Safe Use of Wastewater, Excreta and Greywater; World Health Organization: Geneva, Switzerland, 2006; Volume 4, p. 114. [Google Scholar]
- Budewig, S.; Hartwig, P. Bangladesh Standards and Guidelines for Sludge Management; Shahjahan, M., Sohrad Ali, M., Ahsan Nazmul, S., Shrestha, E., Bhattacharjee, T., Eds.; Department of Environment (DoE)—Ministry of Environment and Forests: Dhaka, Bangladesh, 2015.
- Düngemittelverordnung 2004; Rechtsinformationssystem Bundeskanzleramt: Vienna, Austria, 2015; p. 19.
- Gorchev, H.G.; Ozolins, G. WHO guidelines for drinking-water quality. WHO Chron. 1984, 38, 104–108. [Google Scholar] [PubMed]
- ISO 30500: Non-Sewered Sanitation Systems—Prefabricated Integrated Treatemtn Units—General Saftey and Performacne Requirements for Design and Testing; International Organization for Standardization: Geneva, Switzerland, 2018; 89p.
- Strunz, E.C.; Addiss, D.G.; Stocks, M.E.; Ogden, S.; Utzinger, J.; Freeman, M.C. Water, sanitation, hygiene, and soil-transmitted helminth infection: A systematic review and meta-analysis. PLoS Med. 2014, 11, e1001620. [Google Scholar] [CrossRef] [PubMed] [Green Version]
- Ziegelbauer, K.; Speich, B.; Mäusezahl, D.; Bos, R.; Keiser, J.; Utzinger, J. Effect of sanitation on soil-transmitted helminth infection: Systematic review and meta-analysis. PLoS Med. 2012, 9, e1001162. [Google Scholar] [CrossRef] [PubMed] [Green Version]
- Hatam-Nahavandi, K.; Mahvi, A.H.; Mohebali, M.; Keshavarz, H.; Mobedi, I.; Rezaeian, M. Detection of parasitic particles in domestic and urban wastewaters and assessment of removal efficiency of treatment plants in Tehran, Iran. J. Environ. Health Sci. Eng. 2015, 13, 4. [Google Scholar] [CrossRef] [PubMed]
- Jiménez, B.; Maya, C.; Velásquez, G.; Torner, F.; Arambula, F.; Barrios, J.A.; Velasco, M. Identification and quantification of pathogenic helminth eggs using a digital image system. Exp. Parasitol. 2016, 166, 164–172. [Google Scholar] [CrossRef] [PubMed]
- Barda, B.D.; Rinaldi, L.; Ianniello, D.; Zepherine, H.; Salvo, F.; Sadutshang, T.; Cringoli, G.; Clementi, M.; Albonico, M. Mini-FLOTAC, an innovative direct diagnostic technique for intestinal parasitic infections: Experience from the field. PLoS Negl. Trop. Dis. 2013, 7, e2344. [Google Scholar] [CrossRef] [PubMed] [Green Version]
- Cheremisinoff, N.P. Handbook of Water and Wastewater Treatment Tchnologies, 1st ed.; Butterworth-Heinemann: Woburn, MA, USA, 2002. [Google Scholar]
- Sahlström, L. A review of survival of pathogenic bacteria in organic waste used in biogas plants. Bioresour. Technol. 2003, 87, 161–166. [Google Scholar] [CrossRef]
- Cabral, J.P.S. Water Microbiology. Bacterial Pathogens and Water. Int. J. Environ. Res. Public Health 2010, 7, 3657–3703. [Google Scholar] [CrossRef] [PubMed] [Green Version]
- Barrell, R.; Boyd, P.; Chadwick, K.; Cole, S.; Davies, A.; Down, R.; Finch, P.; Gawler, A.; Hockin, A.; Jonas, A.; et al. The Microbiology of Sewage Sludge, Part 2—Practices and Procedures for Sampling and Sample Preparation; Environemnt Agency: Bristol, UK, 2003. [Google Scholar]
- Barrell, R.; Boyd, P.; Chadwick, K.; Cole, S.; Davies, A.; Down, R.; Finch, P.; Gawler, A.; Hockin, A.; Jonas, A.; et al. The Microbiology of Sewage Sludge, Part 3—Methods for the Isolation an Enumeration of Escherichia coli; Environemnt Agency: Bristol, UK, 2003. [Google Scholar]
- Eation, A.D.; Clesceri, L.S.; Greenberg, A.E.; Franson, M.A.H. Standard Methods for the Examination of Water and Wastewater; American Public Health Association; American Water Works Association; Water Environment Federation: Washington, DC, USA, 1999. [Google Scholar]
- Sartorius. Microbiological Testing of Foods, Beverages, Drinking Water and Pharmaceuticals; Sartorius: Göttingen, Germany, 2014. [Google Scholar]
- Thomas, E.; Andres, L.; Boateng, K.; Borja-Vega, C. A Review of In-Situ and Remote Sensing Technologies to Monitor Water and Sanitation Interventions. Water 2018, 10, 13. [Google Scholar] [CrossRef]
- Centre for Affordable Water and Sanitation Technology. Introduction to Drinking Water Quality Testing; Centre for Affordable Water and Sanitation Technology: Calgary, AB, Canada, 2013. [Google Scholar]
- Huong, L.Q.; Madsen, H.; Anh, L.X.; Ngoc, P.T.; Dalsgaard, A. Hygienic aspects of livestock manure management and biogas systems operated by small-scale pig farmers in Vietnam. Sci. Total Environ. 2014, 470–471, 53–57. [Google Scholar] [CrossRef] [PubMed]
- Wu, S.; Carvalho, P.N.; Müller, J.A.; Manoj, V.R.; Dong, R. Sanitation in constructed wetlands: A review on the removal of human pathogens and fecal indicators. Sci. Total Environ. 2016, 541, 8–22. [Google Scholar] [CrossRef] [PubMed]
- Mills, K. The Postmodern Tank of the Humanitarian International. Peace Rev. 2006, 18, 261–267. [Google Scholar] [CrossRef]
Figure 1.
Gas stove sand bath digestion system. (a) Scheme of the digestion system; (b) picture of the system during a field test.
Figure 1.
Gas stove sand bath digestion system. (a) Scheme of the digestion system; (b) picture of the system during a field test.

Figure 2.
Results of bacteriological method development. (a) Homogenization experiments and (b) differences through sampling.
Figure 2.
Results of bacteriological method development. (a) Homogenization experiments and (b) differences through sampling.

Figure 3.
Modification of the Chemical Oxygen Demand (COD) method (a) comparison between electric digestion block and sand bath; (b) temperature curves for the sand bath digestion system.
Figure 3.
Modification of the Chemical Oxygen Demand (COD) method (a) comparison between electric digestion block and sand bath; (b) temperature curves for the sand bath digestion system.

Figure 4.
Modification of Volatile Fatty Acid (VFA)/Bicarbonate Alkalinity (Alk) titration; comparisons of (a) VFA results and (b) the complete VFA/Alk ratio PM—pig manure; AD—anaerobic digestor effluent.
Figure 4.
Modification of Volatile Fatty Acid (VFA)/Bicarbonate Alkalinity (Alk) titration; comparisons of (a) VFA results and (b) the complete VFA/Alk ratio PM—pig manure; AD—anaerobic digestor effluent.

Figure 5.
Ammonium–nitrogen (NH4-N) determination: comparison of test strips with (a) photometric tests with watery samples and (b) water-vapor distillation with sludges.
Figure 5.
Ammonium–nitrogen (NH4-N) determination: comparison of test strips with (a) photometric tests with watery samples and (b) water-vapor distillation with sludges.

Table 1.
Parameters included, and processes considered in the field lab; parameters highlighted in grey were modified for field use.
Table 1.
Parameters included, and processes considered in the field lab; parameters highlighted in grey were modified for field use.
| Parameter | Treatment Processes | ||||||||||||
|---|---|---|---|---|---|---|---|---|---|---|---|---|---|
| 1 | 2 | 3 | 4 | 5 | 6 | 7 | 8 | 9 | 10 | 11 | 12 | 13 | |
| Ph-value | x | x | x | x | x | x | x | x | x | x | x | x | x |
| Temperature | x | x | x | x | x | x | x | x | x | x | x | x | x |
| E. coli/coliforms | x | x | x | x | x | x | x | x | x | x | x | x | x |
| Enterococci | x | x | x | x | x | x | x | x | x | x | x | x | x |
| Salmonella | x | x | x | x | x | x | x | x | x | x | x | x | x |
| Helminth eggs | x | x | x | x | x | x | x | x | x | x | x | x | x |
| Chemical Oxygen Demand | x | x | x | x | x | x | x | x | x | ||||
| Biogas potential | x | x | x | ||||||||||
| Biogas composition | x | x | x | ||||||||||
| VFA/Alk titration | x | x | x | x | x | ||||||||
| Sludge volume | x | x | x | x | x | x | x | ||||||
| Total solids | x | x | x | x | x | x | x | x | x | x | x | ||
| Ash | x | x | x | x | x | x | x | x | x | x | x | ||
| Soil moisture | x | x | x | x | x | ||||||||
| Ammonia | x | x | x | x | x | x | |||||||
| Nitrate | x | x | x | ||||||||||
| Potassium | x | ||||||||||||
| Phosphate | x | x | x | ||||||||||
| Total nitrogen (TN) | x | x | x | x | x | x | |||||||
| Total phosphate (TP) | x | x | x | ||||||||||
1—Anaerobic digestion; 2—aerobic wastewater treatment; 3—lime addition; 4—urea addition; 5—lactic acid fermentation; 6—vermicomposting; 7—co-composting; 8—solar drying, 9—thermal drying and palletization; 10—black solider flies; 11—mechanical fecal-sludge (FS) treatment; 12—Imhoff tank; 13—cotreatment in waste-stabilization ponds.
Table 2.
Temperature comparison of different tested incubators.
| Cultura Mini | Cultura Mini Mod. | Hova Bator Genesis 1588 | |
|---|---|---|---|
| Set temperature (°C) | 37.0 | 32.0 | 36.0 |
| Average temperature (°C) | 38.8 | 31.2 | 36.1 |
| Deviation from set temperature (°C) | 1.8 | 0.8 | 0.1 |
| Standard deviation (°C) | 1.9 | 0.8 | 0.1 |
| Time until temperature stable (min) | 260 | 180 | 10 |
Table 3.
Modification of the Total Solids (TS) method; comparison of camping baking oven and electrical oven.
Table 3.
Modification of the Total Solids (TS) method; comparison of camping baking oven and electrical oven.
| Fecal Sludge | Soil | |||
|---|---|---|---|---|
| Sampling Point 1 | Sampling Point 2 | Sampling Point 3 | ||
| Camping oven (g/kg) | 71.5 ± 3.2 | 71.3 ± 1.1 | 70.5 ± 1.0 | 429.7 |
| Lab drying oven (g/kg) | 70.6 ± 0.4 | 73.2 ± 1.4 | 72.5 ± 0.9 | 424.1 |
| Recovery (%) | 101% | 97% | 97% | 101% |
© 2018 by the authors. Licensee MDPI, Basel, Switzerland. This article is an open access article distributed under the terms and conditions of the Creative Commons Attribution (CC BY) license (http://creativecommons.org/licenses/by/4.0/).
Share and Cite
MDPI and ACS Style
Bousek, J.; Skodak, M.; Bäuerl, M.; Ecker, G.; Spit, J.; Hayes, A.; Fuchs, W. Development of a Field Laboratory for Monitoring of Fecal-Sludge Treatment Plants. Water 2018, 10, 1153. https://doi.org/10.3390/w10091153
AMA Style
Bousek J, Skodak M, Bäuerl M, Ecker G, Spit J, Hayes A, Fuchs W. Development of a Field Laboratory for Monitoring of Fecal-Sludge Treatment Plants. Water. 2018; 10(9):1153. https://doi.org/10.3390/w10091153
Chicago/Turabian StyleBousek, Johannes, Marco Skodak, Magdalena Bäuerl, Georg Ecker, Jan Spit, Adam Hayes, and Werner Fuchs. 2018. "Development of a Field Laboratory for Monitoring of Fecal-Sludge Treatment Plants" Water 10, no. 9: 1153. https://doi.org/10.3390/w10091153
Note that from the first issue of 2016, this journal uses article numbers instead of page numbers. See further details here.