Analysis of Natural Streamflow Variation and Its Influential Factors on the Yellow River from 1957 to 2010


1
Hydrology and Water Resources Institute, Hohai University, Nanjing 210000, China
2
Yellow River Institute of Hydraulic Research, Yellow River Conservancy Commission, Zhengzhou 450003, China
3
Institute of Geographic Sciences and Natural Resources Research, Chinese Academy of Sciences, Beijing 100101, China
*
Author to whom correspondence should be addressed.
Water 2018, 10(9), 1155; https://doi.org/10.3390/w10091155
Submission received: 10 July 2018
/
Revised: 20 August 2018
/
Accepted: 24 August 2018
/
Published: 29 August 2018
(This article belongs to the Special Issue Climate Variability and Climate Change Impacts on Land Surface, Hydrological Processes and Water Management)
Abstract
:In this study, variation characteristics of hydrometeorological factors were explored based on observed time-series data between 1957 and 2010 in four subregions of the Yellow River Basin. For each region, precipitation–streamflow models at annual and flood-season scales were developed to quantify the impact of annual precipitation, temperature, percentage of flood-season precipitation, and anthropogenic interference. The sensitivities of annual streamflow to these three climatic factors were then calculated using a modified elasticity coefficient model. The results presented the following: (1) Annual streamflow exhibited a negative trend in all regions; (2) The reduction of annual streamflow was mainly caused by a precipitation decrease and temperature increase for all regions before 2000, whereas the contribution of anthropogenic interference increased significantly—more than 45%, except for Tang-Tou region after 2000. The percentage of flood-season precipitation variation can also be responsible for annual streamflow reduction with a range of 7.36% (Tang-Tou) to 21.88% (Source); (3) Annual streamflow was more sensitive to annual precipitation than temperature in the humid region, and the opposite situation was observed in the arid region. The sensitivities to intra-annual climate variation increased after 2000 for all regions, and the increase was more significant in Tou-Long and Long-Hua regions.
1. Introduction
A number of studies have reported streamflow reduction in several rivers throughout the world [1,2,3,4,5], putting enormous stress on ecological and socioeconomic systems. This is especially stressful for semiarid and semihumid regions, where the hydrological cycle and water yield will be more vulnerable to climate change and anthropogenic interference [6]. Climatic changes include temperature changes and the redistribution of precipitation, which together affect streamflow discharge [7]. Anthropogenic interference mainly consists of land use/cover change (LUCC), urbanized and industrialized extension, and hydropower development and irrigation intensification, which greatly alter the underlying surface and water resource reapportionment [8]. Quantification of streamflow changes and identification of the various contributing factors are of considerable importance for a better understanding of the hydrologic mechanisms, which is beneficial for planning suitable adaptation strategies and water management.
There are various methods to separate the impacts of climate change and anthropogenic interference on streamflow, mainly including catchment experiments, hydrological models, and statistical methods [9]. Catchment experiments are the most rigorous empirical research design for estimating the effects of land use on aquatic systems [10], but they can be influenced by the variation in experimental conditions and the presentation of results [11]. Most relevant studies indicate that catchment streamflow decreased significantly after afforestation and increased after deforestation [10,12,13]. Hydrological models, both distributed and lumped, have been widely used [7,14,15,16]. Hu et al. applied the water and energy budget-based distributed hydrological model (WEB-DHM) to diagnose and quantify climate and human impacts on streamflow change [17]. Hundecha et al. applied a conceptual rainfall–runoff model to 95 catchments in the Rhine basin to model the effect of land use change on runoff [18]. Statistical methods such as streamflow elasticity have also been used in regions specifically with available long-term climate and hydrologic data [9,19,20]. Tian et al. used regression analysis to illustrate runoff decline via comparison of precipitation–runoff correlation for the period prior to and after sharp runoff decline [21].
The semiarid and arid Yellow River Basin (YRB) is the main source of surface water in the northwest and northern part of China. The annual streamflow is about 58 billion m3, and the water resource per capita is 905 m3—only a third of the national average, which poses a threat to the YRB’s water resources availability. The climbing industry, agriculture, and household demand for water induced by rapid economic development and expanding urbanization is also a challenge [22]. In addition, some ecological programs launched by the Chinese government since 1999 have greatly altered the regional water cycle, including the Natural Forest Conservation Program (NFCP) and Grain for Green Project (GFGP) (http://tghl.forestry.gov.cn/) [6,23], and therefore, the basin is very sensitive to climate change and anthropogenic interference. Attempts have been made to understand the long-term streamflow variation and the sensitivity of streamflow to climate change in the Yellow River Basin. Tang et al. used a distributed biosphere hydrological (DHB) model system to simulate hydroclimate connections in the Yellow River Basin and found that climate change dominated the predicted changes in the upper and middle reaches, but anthropogenic interference dominated the lower reaches [24]. Liu et al. found that streamflow was more sensitive to precipitation in humid regions or wet years than in arid regions or dry years by means of streamflow elasticity [25]. Li et al. investigated the changing properties and underlying causes for decreased streamflow by both the Budyko framework and hydrological modeling techniques [26]. However, most of these previous studies focused on the entire basin or a local scale of catchments instead of comparing different subregions, let alone the comparison before and after the implementation of Natural Forest Conservation Program and Grain for Green Project. Moreover, few studies have paid attention to the contribution made by variations in the intra-annual distribution of precipitation, with only the annual precipitation considered.
The objectives of this paper are as follows: (1) to explore the spatial–temporal variation of annual precipitation, average temperature, the percentage of flood-season precipitation and natural streamflow in different subregions of YRB; (2) to quantitatively analyze the spatial–temporal characteristics of the contribution made by different meteorological factors and anthropogenic interference to streamflow changes in different subregions; (3) to analyze the spatial–temporal characteristics of the sensitivity of annual streamflow to various meteorological factors.
2. Study Area and Data
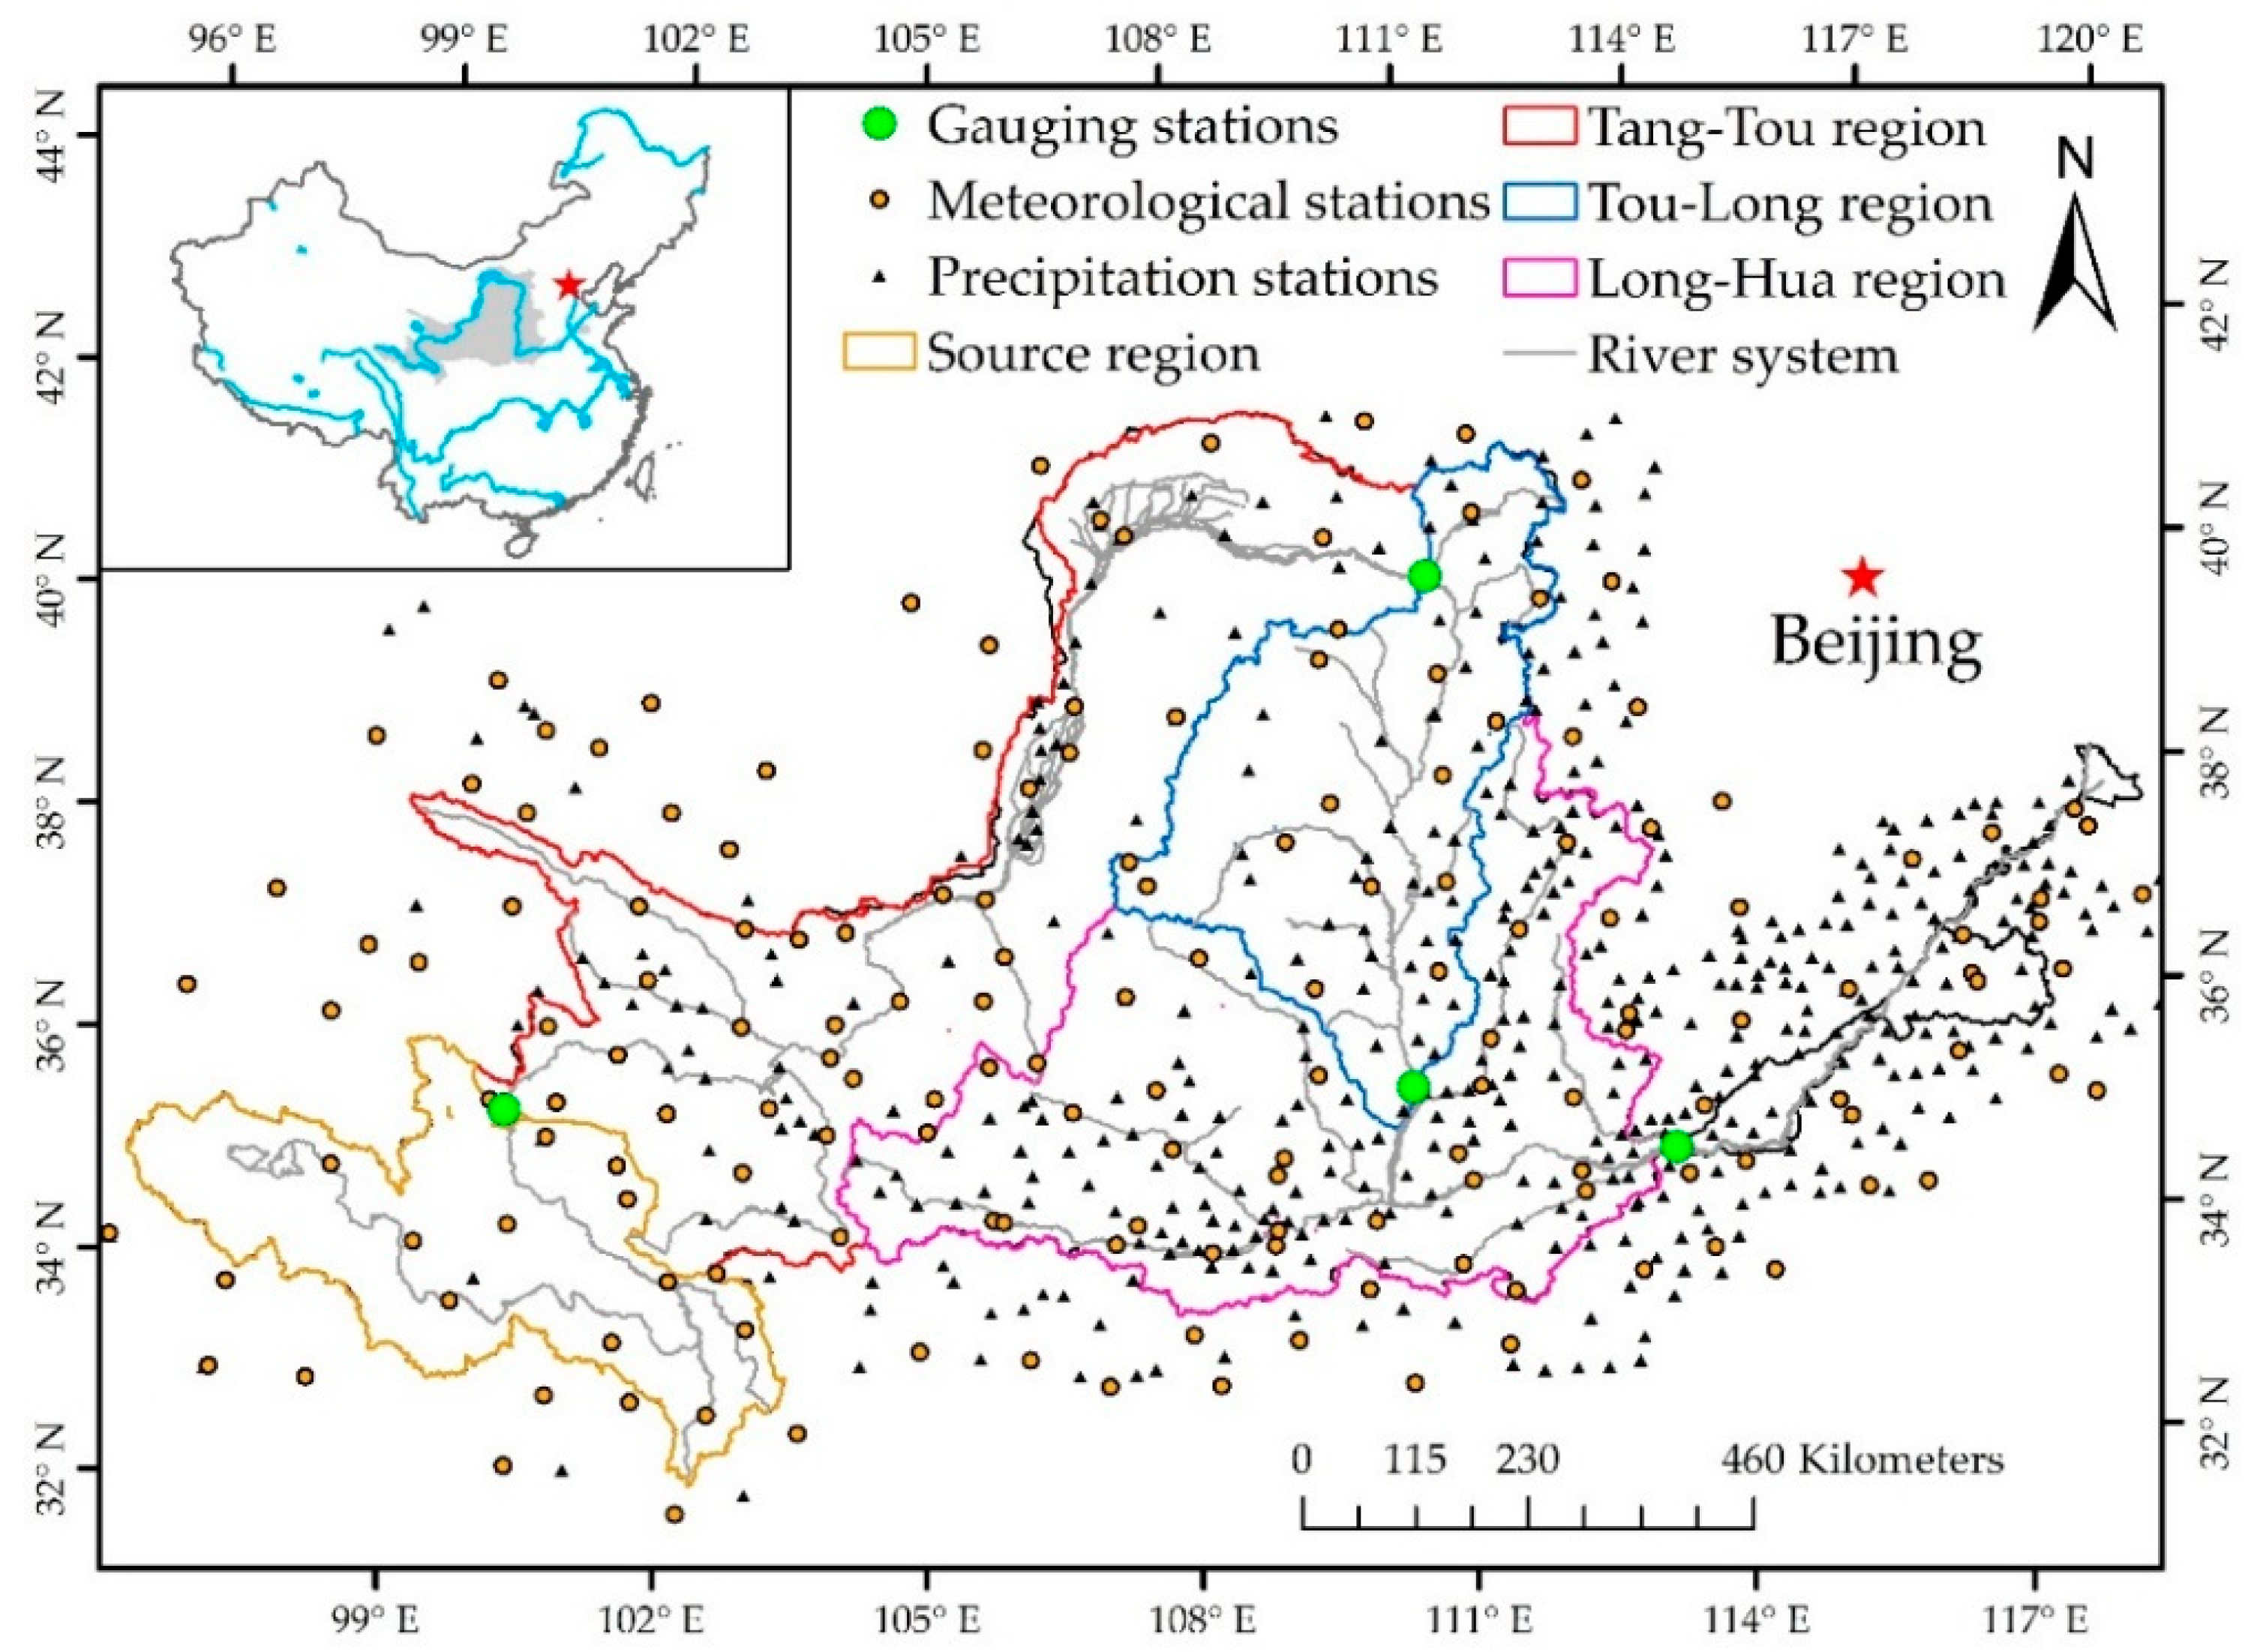
2.1. Study Area
The Yellow River (Figure 1) originates in the Qinghai Province of China and flows into Bohai Bay, forming the Yellow River Basin, which covers a total watershed area of 795,000 km2 (including endoreic inter flow area). The main stream is 5464 km long with a slope of 4480 m. It can be divided into three parts. The upper reach travels 3472 km and drains 428,000 km2 of land. The middle reach flows for 1206 km, with a drainage area of 344,000 km2. When the middle reach flows through the Loess Plateau, the tributaries transport vast amounts of sediment, proclaiming the Yellow River as having the highest sediment content in the world. The remaining down reach has a length of 786 km and a drainage area of 23,000 km2. The climatic and hydrologic conditions of the YRB are complex because of the large geographical extent and elevation difference. The precipitation exhibits high spatial and temporal variabilities: the ratio of rainfall between the North and South is greater than 5, 70% of precipitation falls between June and September, and the variation coefficient (Cv) is between 0.15 and 0.4. Temperature disparity is one of the major climate features in the YRB, with an annual mean temperature fluctuating from −4 °C to 14 °C. Considering the critical role played by the Yellow River in regional water supply and the tremendous challenges posed by water shortages, an analysis of the variation and sensitivity of annual streamflow is both important and imperative.
2.2. Data Collection and Preprocessing
The datasets used in this study include climate, streamflow, leaf area index (LAI), and Digital Elevation Model (DEM) data.
Climate data were obtained from the China Meteorological Administration (CMA), including daily precipitation from 582 rainfall gauges and the daily mean, maximum, and minimum temperatures from 97 meteorological stations inside and near the Yellow River basin from 1957 to 2010.
The monthly naturalized streamflow time-series for four hydrological stations (Tangnaihai, Toudaoguai, Longmen, and Huayuankou) between 1957 and 2010 were obtained from the Yellow River Hydrographic Bureau (YRHB). These four-gauge stations were selected with the intent of determining streamflow changes in four different subregions. Specifically, streamflow at Tangnaihai was considered the source region; the streamflow from the upper reach was the difference between Toudaoguai and Tangnaihai; the difference between Huayuankou and Toudaoguai was declared as the middle reach streamflow. Due to the complex hydrogeological conditions in middle reach (Loess Plateau), Longmen station was added to separate the middle reach into two detailed parts. Four regions were thus formed: the source region, Tang-Tou region, Tou-Long region, and Long-Hua region. Particularly, this dataset was the naturalized streamflow, having removed the variation caused by artificial water intake and reservoir storage and streamflow. That is to say, different from the broad sense, the anthropogenic interference defined in this study mainly included soil and water conservation measures.
GLASS LAI, one of the five typical global LAI products, was chosen for this study because it includes the longest duration (1982–2013) LAI product. Additionally, compared with those of the current MODIS and CYCLOPES LAI products, it provides temporally continuous LAI profiles with much better quality and accuracy [27].
Furthermore, a 30 × 30 m digital elevation model (DEM) was used for the interpolation of climatic variables. ANUSPLIN, a well-performed spatial interpolation package based on thin-plate smooth-spline interpolation, was selected to interpolate climatic variables. Developed by Australian National University, it is a tool mainly used for the transparent analysis and interpolation of noisy multi-variants data [28]. Using the longitude, latitude, and elevation of the meteorological stations as variables, daily precipitation and mean temperature datasets were aggregated to obtain mean monthly and annual values in four different subregions.
3. Methodology
3.1. Time-Series Analysis Method
3.1.1. Change-Point Detection and Trend Analysis of Hydrological and Climate Data
Both the change-point detection of annual streamflow data and trend analysis of hydrometeorological data were conducted by a Mann–Kendall (MK) test, which is widely used for its simplicity, robustness and the ability to deal with non-normal and missing data distributions [29,30]. After estimating the test statistics UFi and UBi, the curve of these two test statistics are plotted. If a match point of the two curves exists and the trend is statistically significant, the match point can be regarded as a change-point of the time series [17]. In terms of trend analysis, the MK test statistic Z was calculated. A positive and negative Z value represent increasing and declining trends, respectively. The null hypothesis, H0, states that there is no statistically significant trend in the series for a given significance level α. In this paper, α was set to be 0.05 and the 1−α/2 quantile of the standard normal distribution for α (Z(1−α/2)) was 1.96. If |Z| > Z(1−α/2), the null hypothesis is rejected, indicating the trend is significant. Otherwise, the H0 hypothesis is accepted.
In addition, the precipitation–runoff double cumulative curve (DCC) was also used as an auxiliary confirmation of the change-points by providing a visual representation of the consistency of the precipitation and streamflow data [31].
3.1.2. Trend Analysis of LAI
The temporal and spatial variation of the mean LAI were analyzed using a linear regression analysis method in this study. Using overall LAI trend computations to identify spatial patterns of directions and rates of change, a least squares regression was fit through the time series of each pixel and the slope coefficient that represent trends was calculated [27]. The slope of the trend coefficient was defined as follows:
where n is the cumulative number of years in the study periods, i is the order of year, and is the value of LAI in the ith year. In general, if slope > 0, LAI will increase, suggesting better vegetation in this pixel.
3.2. Multitemproal-Scale Precipitation–Runoff Model
Since access to very limited information and data for basin geometry can hardly satisfy the minimal requirements of basin-scale models, statistical methods were employed to determine the relationship of streamflow and other climatic factors for the baseline period. Both an annual scale model and flood and nonflood season model were built.
At annual scale, the precipitation–runoff model was built using multiple linear regression analysis. At flood and nonflood season scale, given the fact that linear regression analysis method may not satisfy the requirement of model accuracy, a statistical model based on the Random Forest (RF) regression, which is one of the most effective machine learning models for predictive analytical approaches [32,33], was trained to reconstruct streamflow data in the human-affected period. RFs were developed as a method of improving the predictions of classification and regression trees by alleviating the overfitting concern of regression trees [34]. It has proved to be more robust and accurate than traditional linear (e.g., multiple linear regression) or more complex methods [35]. Two parameters need to be set in order to produce the forest trees: the number of decision trees to be generated (Ntree) and the number of variables to be selected and tested for the best split when growing the trees (Mtry) [36]. In this paper, Ntree was set as 200, and Mtry was set as the default value in the R package for random forests.
In this study, the correlation of different climatic variables (annual precipitation, mean temperature, precipitation in the former years, flood-season precipitation and mean temperature, nonflood season precipitation and mean temperature, precipitation of the last month of the flood season) between annual streamflow, flood-season streamflow and nonflood season streamflow were analyzed using Pearson correlation coefficient analysis respectively, and those with a high correction coefficient between streamflow were chosen as the independent variable [36] for developing annual, flood and nonflood seasonal precipitation–runoff models. Furthermore, variance analysis and an F-test were conducted to test the accountability of the statistical models.
3.3. Contribution Calculation of Climatic and Anthropogenic Factors on Annual Streamflow
Model simulation, along with the hypothesis that climate fluctuations and anthropogenic interference are independent, was employed to separate the impacts on streamflow variation. Several scenarios were designed to reconstruct natural streamflow and then separate the impact of climatic fluctuations and anthropogenic interference on natural streamflow:
S1: Conducting the control simulation based on the annual precipitation–runoff model with observed changes in precipitation and temperature over the human-affected period;
S2: Using the same forcing data as the control simulation S1, except the mean value of the temperature was fixed to the mean of the baseline period;
S3: Conducting the control simulation based on the flood and nonflood season precipitation–runoff model with observed changes in precipitation and temperature over the human-affected period;
S4: Using the same forcing data as the control simulation S3, except the mean of the percentage of flood-season precipitation was fixed at the level of the baseline period and the annual precipitation remained as the S3 observations.
The total streamflow change () can be obtained by the difference between the observed streamflow in baseline period (Rob) and that in human-affected period (Roh), which can be expressed as:
where includes two main parts, the streamflow change caused by climate fluctuations and anthropogenic interference , and the former is made up of precipitation-induced change and temperature-induced variation .
The difference between S1 and S2 (S1–S2) was used to estimate the change magnitude of the simulated annual streamflow caused by the temperature variation :
where is the mean of simulated annual natural streamflow in the scenario S1, and is the mean of simulated annual natural streamflow for the scenario S2.
can be calculated by the following equation:
The streamflow change magnitudes caused by anthropogenic factor () and annual precipitation variation () are calculated using Equation (2).
The contribution rate of each factor, which is defined as , is quantitatively estimated by:
where k can be referred to as precipitation (P), temperature (T), and anthropogenic interference (H).
The difference between S3 and S4 (S3–S4) was used to estimate the change magnitude of the simulated annual streamflow caused by the variation of the percentage of flood-season precipitation:
where is the mean of simulated annual natural streamflow in S3, and is the mean of simulated annual natural streamflow for S4. is the change magnitude of natural streamflow caused by the variation of the percentage of flood-season precipitation.
3.4. Sensitivity Calculation of Annual Streamflow to Climatic Factors
Contribution assessment alone cannot fully explain the response of streamflow to different variables. For example, certain variable contributions may be greater because of the larger change magnitude of this variable. Therefore, to better understand the streamflow response to climatic factor changes in different regions and periods, a modified sensitivity coefficient was defined that reflects sensitivity of streamflow to various climatic variables: The formula uses simulated streamflow data in different scenarios and observed meteorological factor data to calculate the sensitivity of streamflow to different meteorological factors. The specific calculation formulas are as follows:
where , , , are the means of annual natural streamflow, precipitation, temperature, and percentage of flood-season precipitation over the baseline period, respectively. , , are the simulated natural streamflow in the ith year in S1, S3, and S4, respectively. is the mean of simulated annual natural streamflow for S4. , , are the observed annual precipitation, temperature, and percentage of flood-season precipitation over the human-affected period, respectively.
4. Results
4.1. Spatial–Temporal Variation Characters for Hydrometeorological Variables
4.1.1. Change-Point Detection
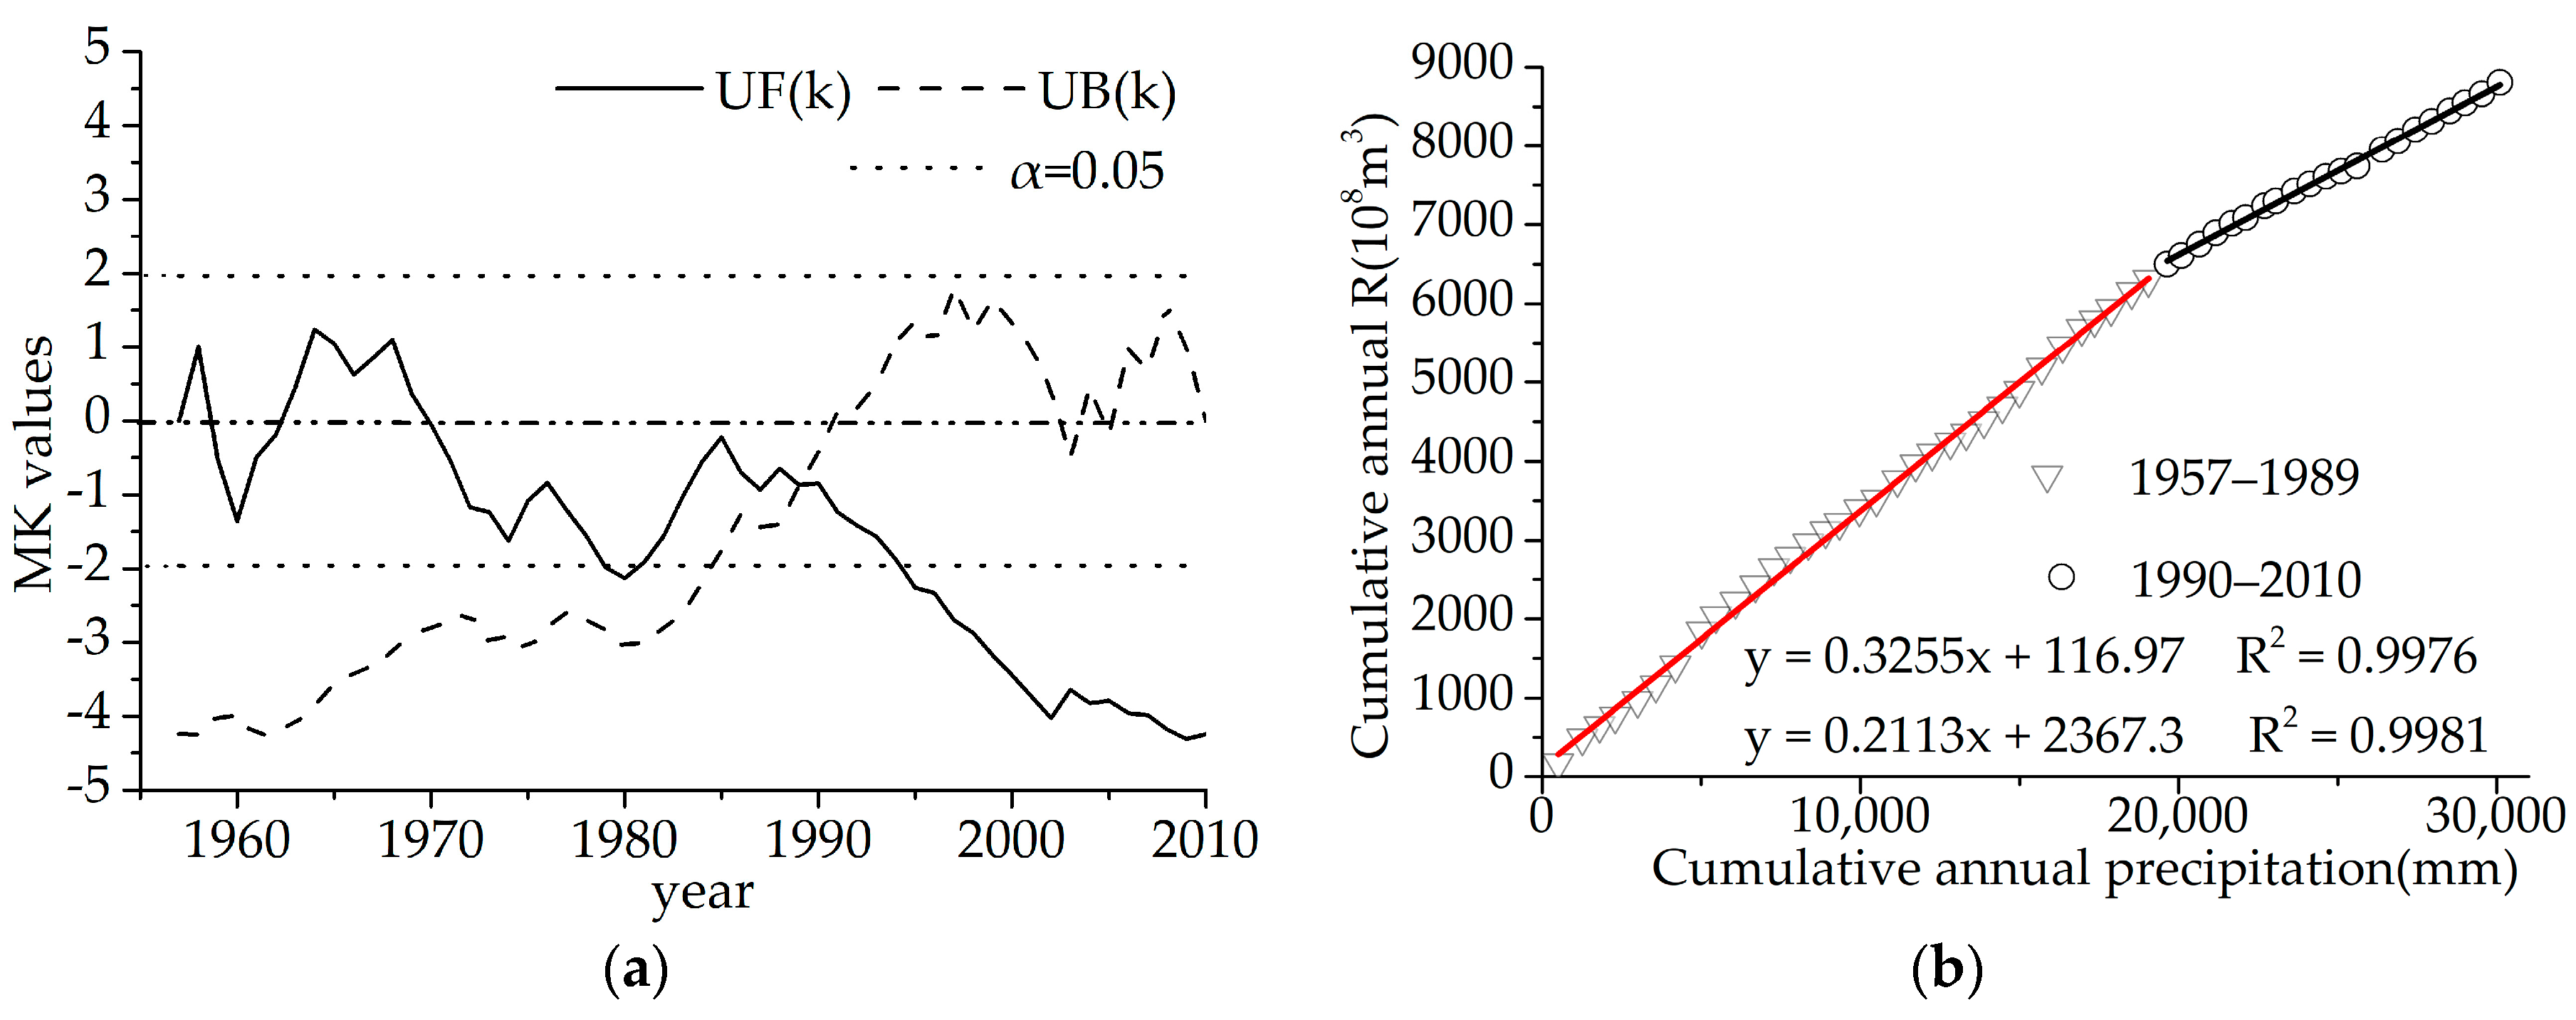
The change-point detection of annual streamflow was mainly conducted using MK mutation analysis, combined with the auxiliary annual precipitation–streamflow double cumulative curve. Figure 2a,b demonstrate a change in the relationship between annual precipitation and streamflow in the Long-Hua region in 1989. Consequently, the study period in Long-Hua region was separated into two parts: the baseline period (1957–1989) and human-affected period (1990–2010). The change-points of the source region, Tang–Tou region, and Tou-Long region were 1989, 1991, and 1982, respectively.
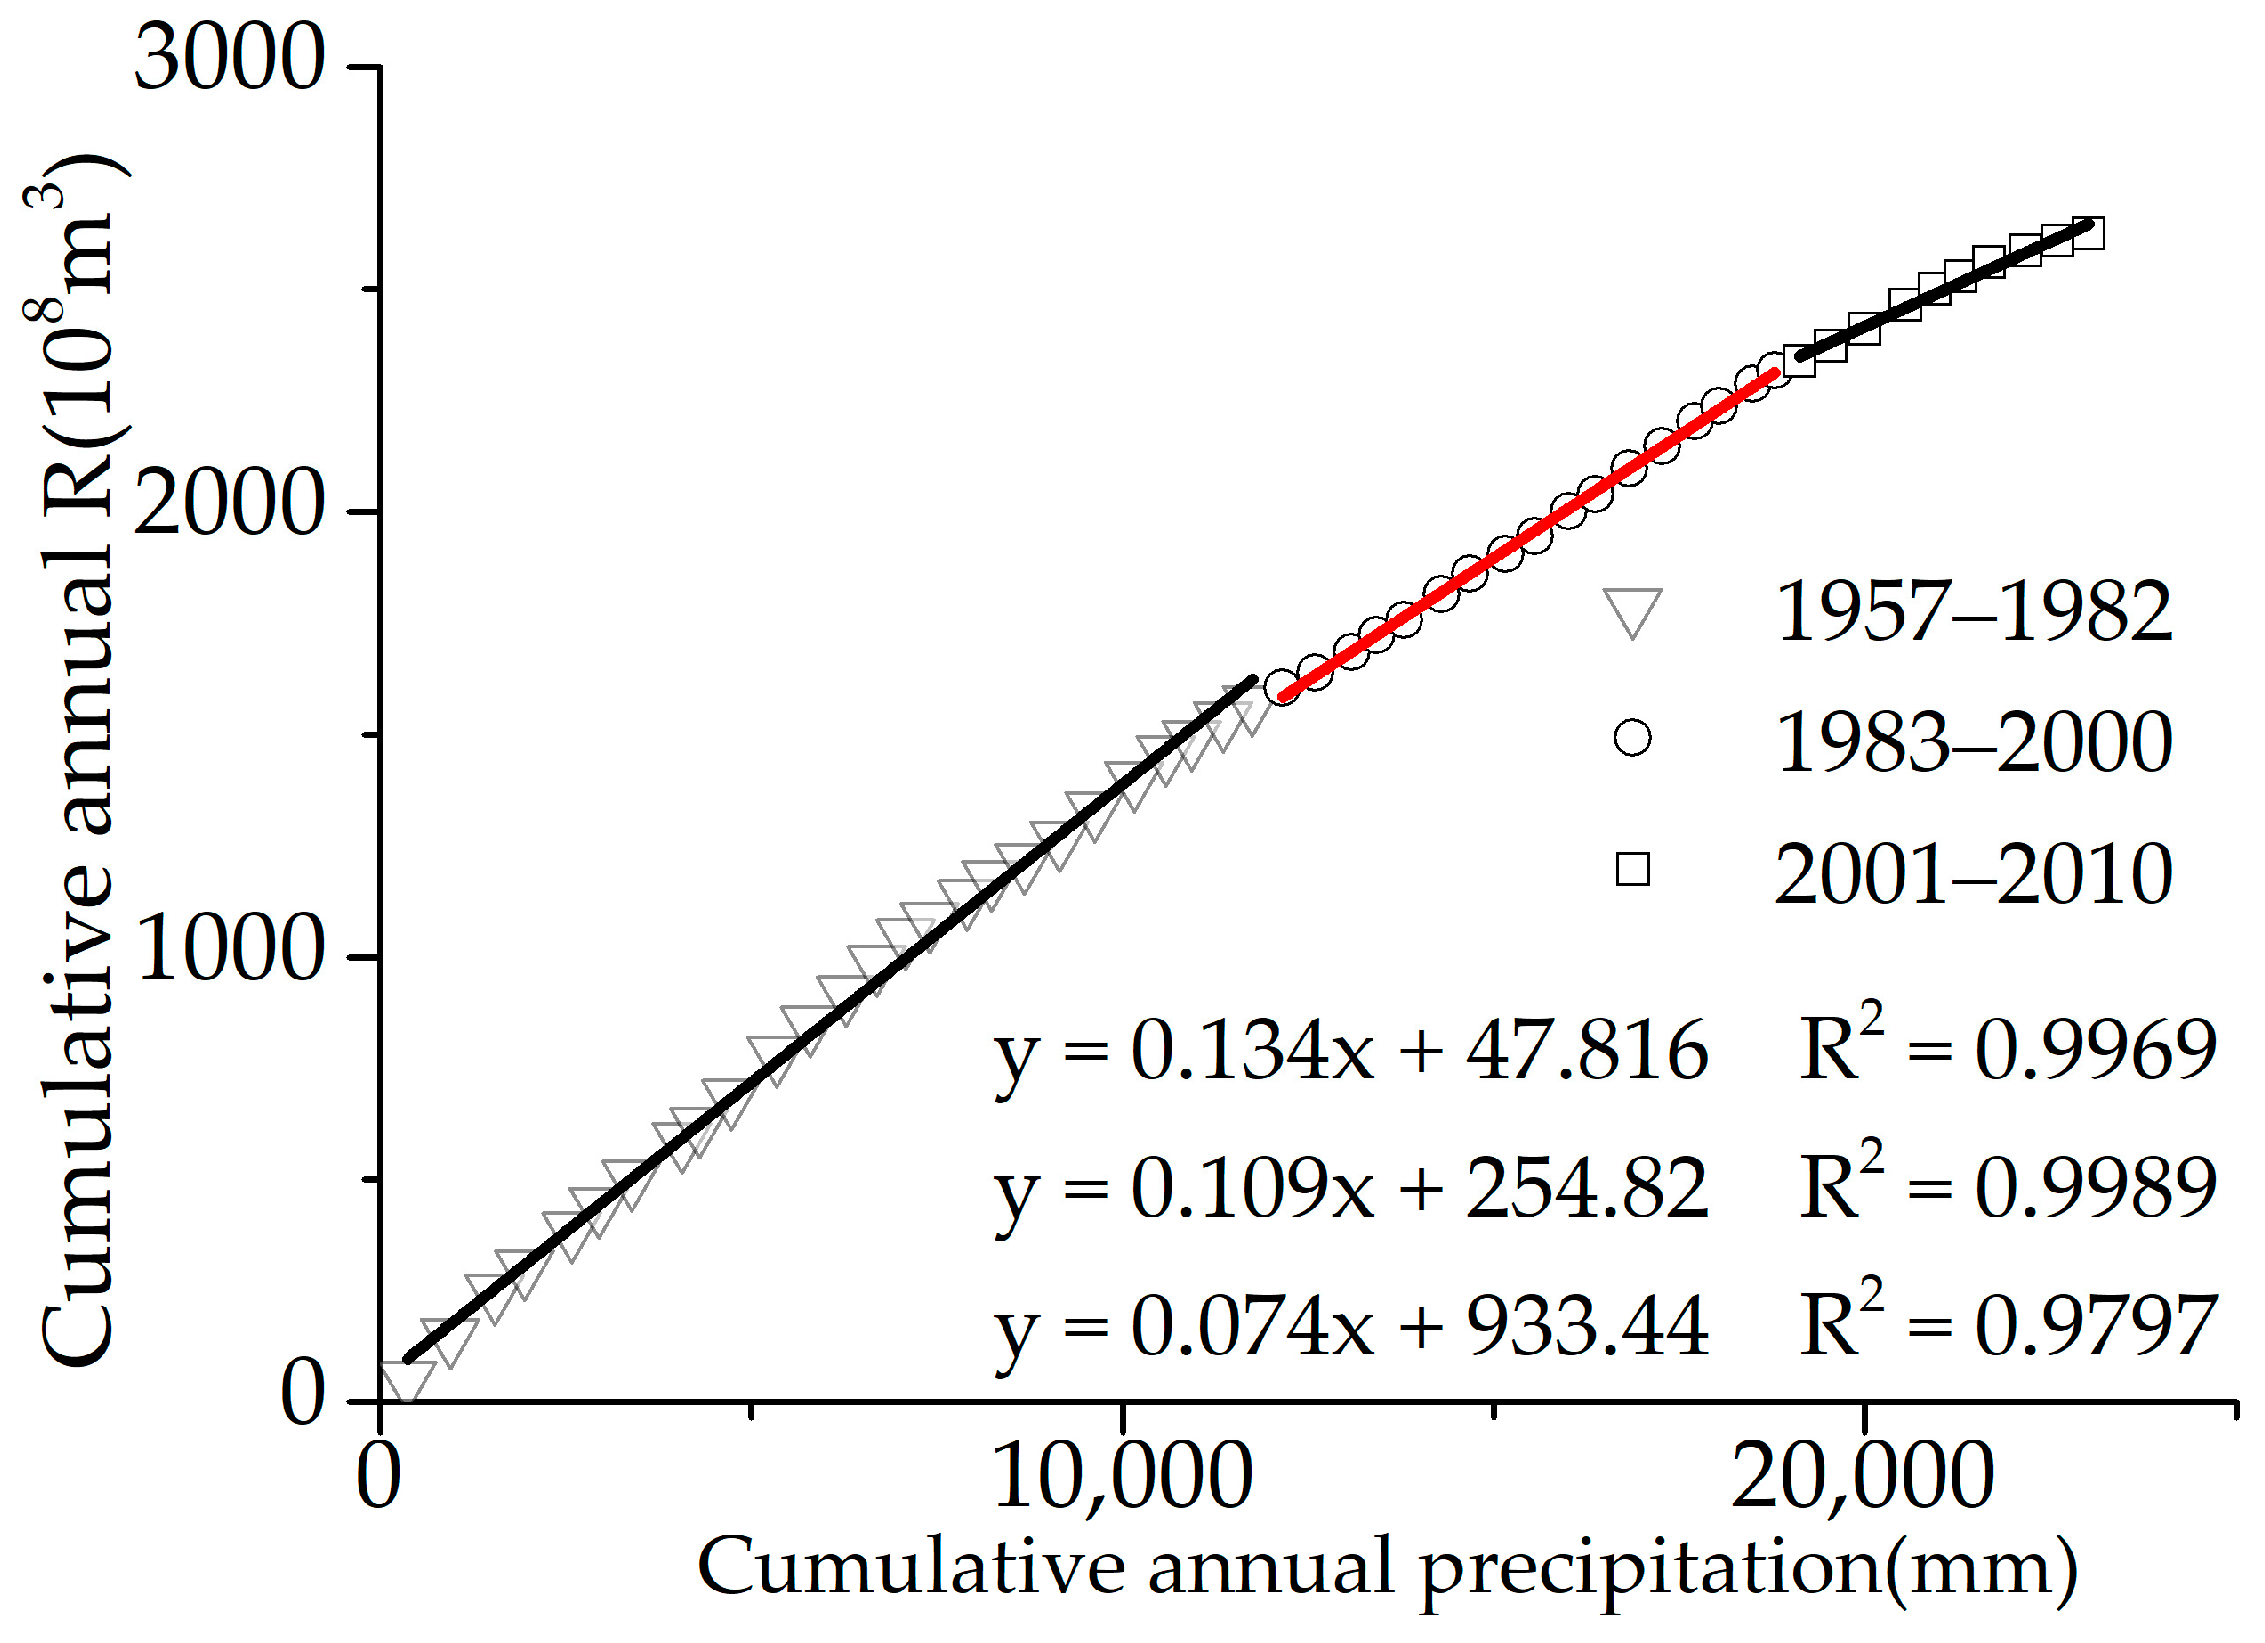
Particularly, the Chinese government launched the Grain for Green Project (GFGP) in 1999. Since then, the land cover and vegetation in the middle reaches of the Yellow River have undergone drastic changes, which may also affect streamflow. In addition, it is found that there is a significant change point in 2000 in Tou-Long region by DCC in Figure 3, indicating that the impacts of human activities became more prominent in the Yellow River Basin, especially in the Loess Plateau after 2000. Therefore, the year 2000 was added to further divide the human-affected period into two parts: from the change-point year to 2000 (Period I) and from 2001 to 2010 (Period II), with the intent of analyzing how much non-meteorological factors have affected the streamflow after 2000 when land cover and vegetation change became more intense.
4.1.2. Trend Analysis of Annual Precipitation, Mean Temperature, and Naturalized Streamflow
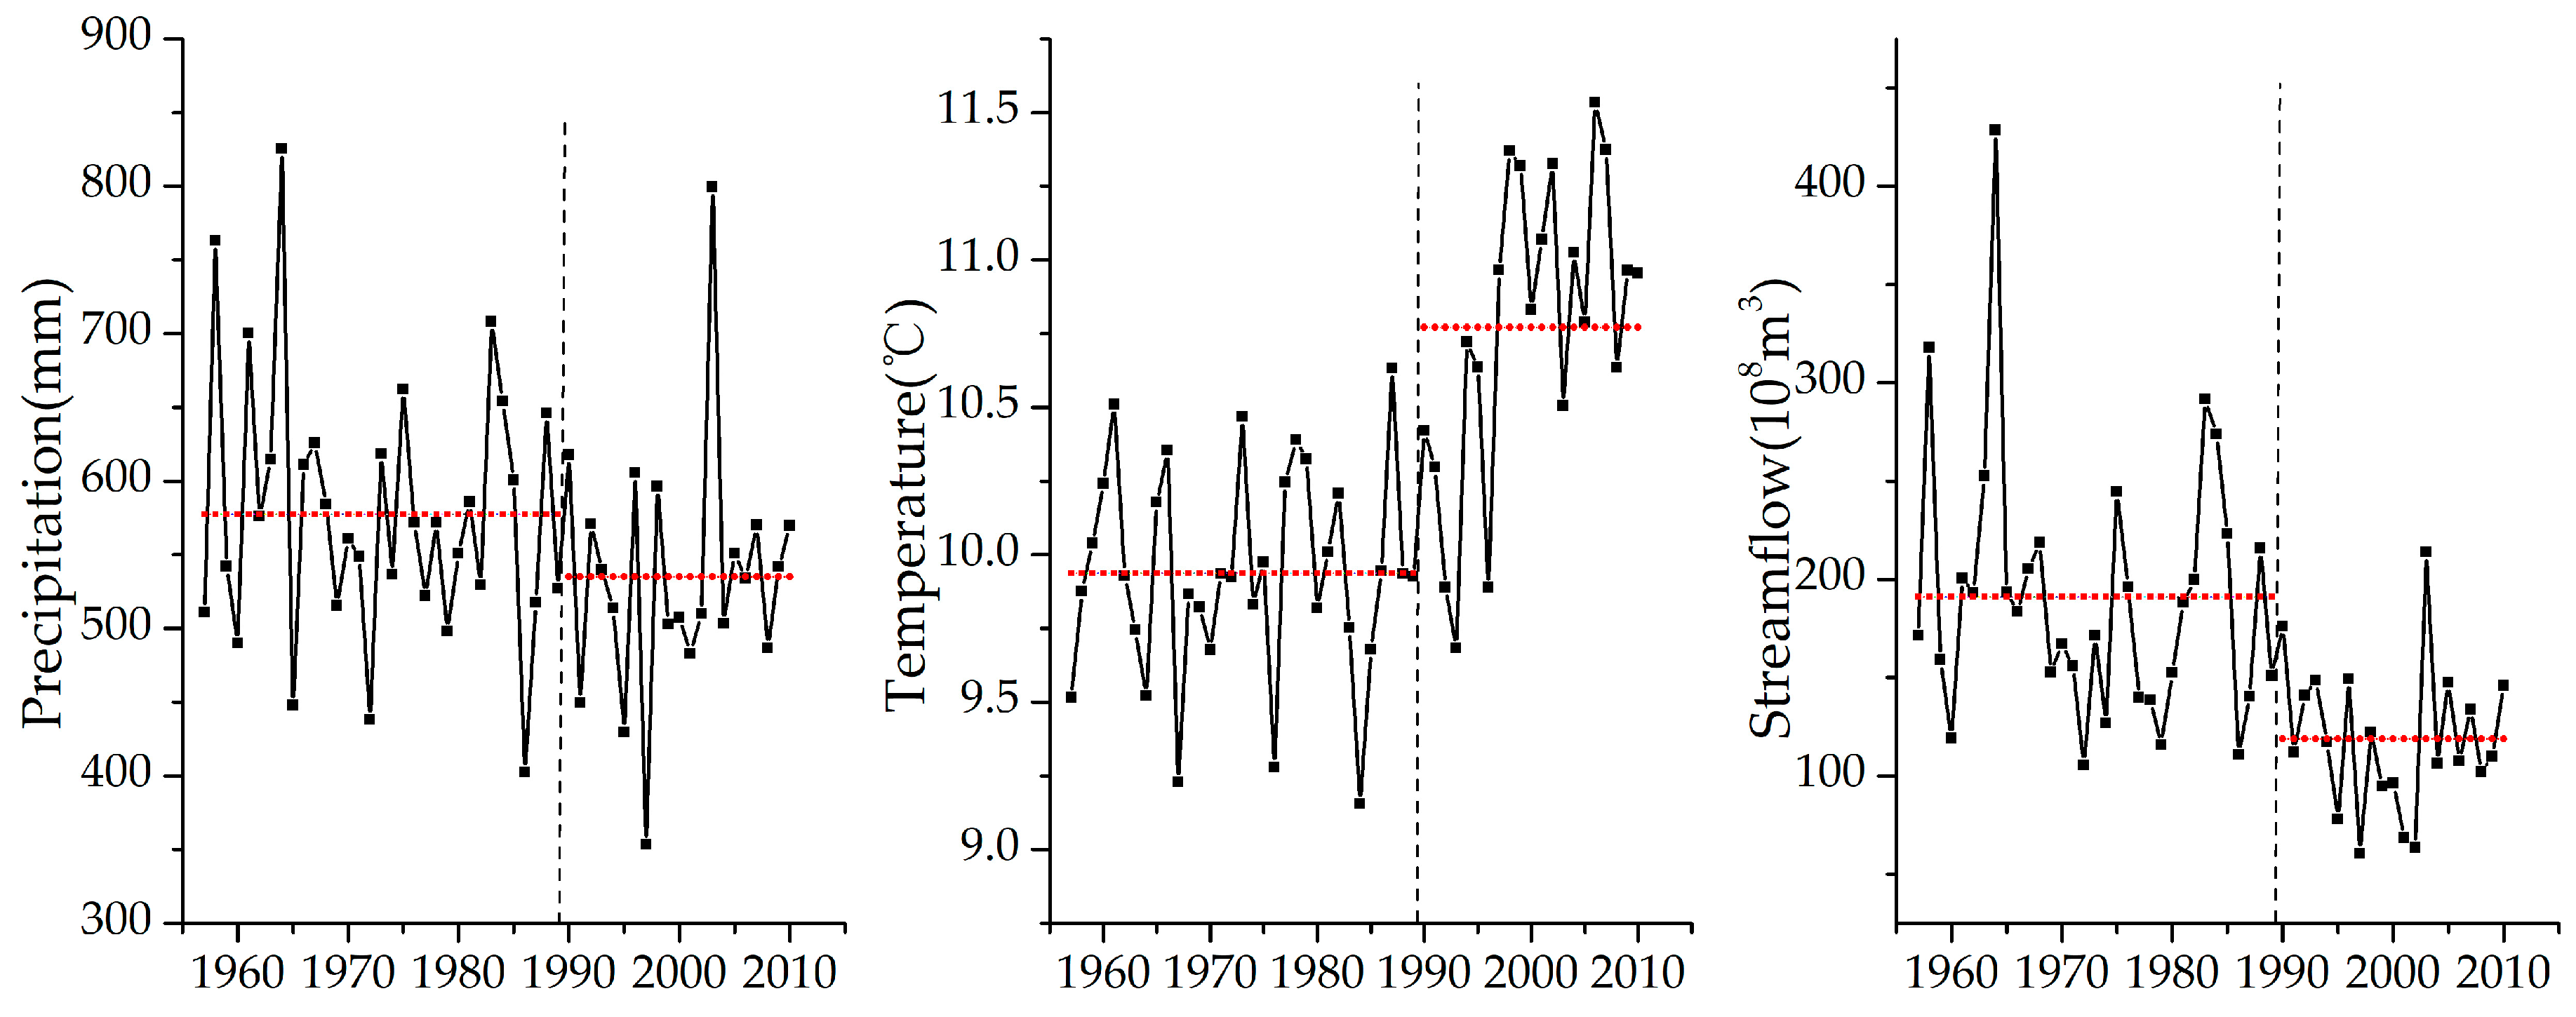
Overall, a drying and warming trend was apparent in the YRB throughout the past 54 years. Figure 4 plots the annual time series of precipitation, mean temperature, naturalized streamflow, and their mean value before and after the change-point across the Long-Hua region. Both the annual precipitation and streamflow decreased, whereas mean temperature increased.
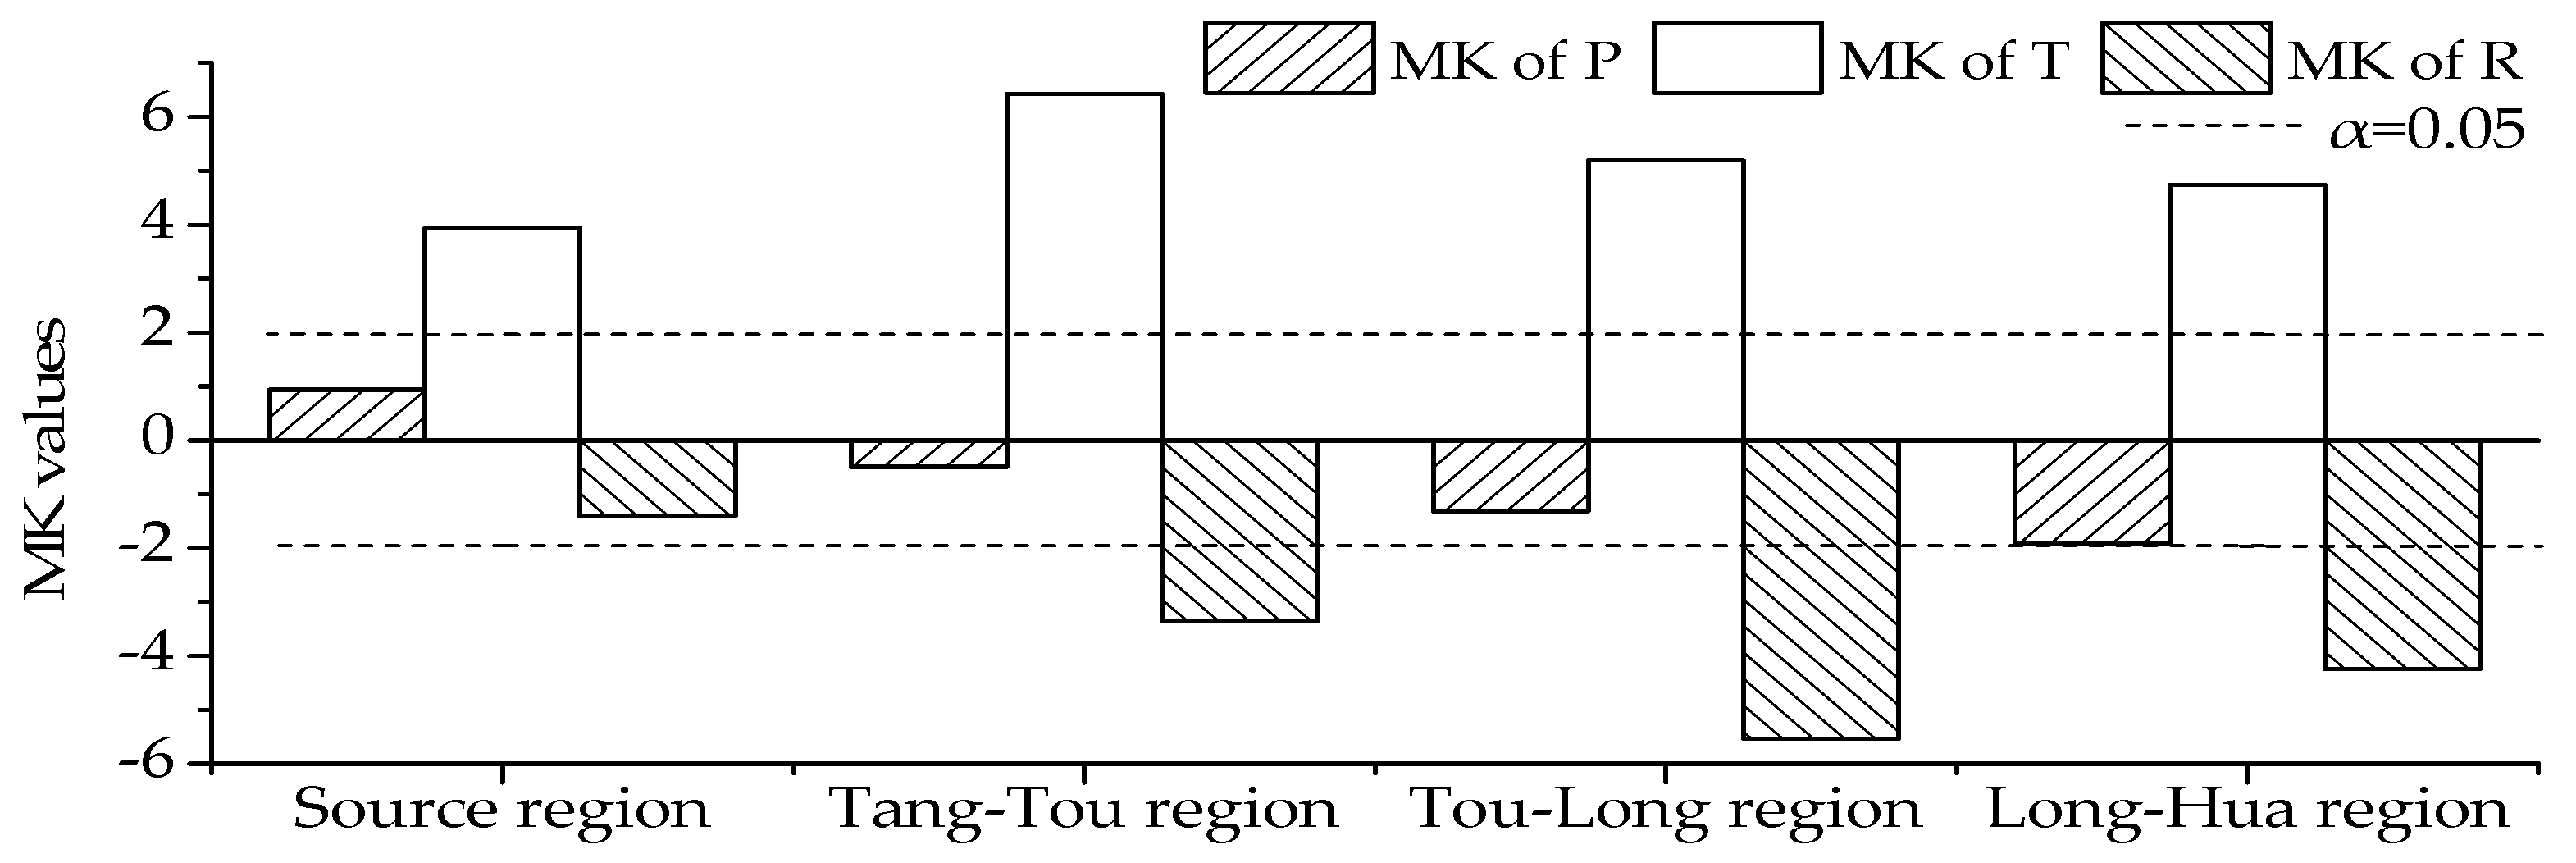
The other three regions in the YRB also exhibited a similar trend. According to the MK analysis results in Figure 5, a decreasing trend of precipitation was detected in the YRB, excluding the source region, which had a positive MK value. As for the reduction rate, Table 1 shows that the precipitation of Tou-Long and Long-Hua in the middle reach reduced faster than that of Tang–Tou in the upper reach. However, none of the decreasing trends of precipitation were statistically significant. Conversely, the obvious warmer trend was statistically significant in the whole study area, with an average increasing rate of about 0.04 °C/a. A decreasing streamflow occurred in the whole basin, with the reduction rate ranging from 0.57 × 10⁸ m3/a to 2.21 × 10⁸ m3/a.
4.1.3. Trend Analysis of Percentage of Flood-Season Precipitation
Table 2 presents the MK test results and the average change in the percentage of flood-season precipitation (). The overall declining trend of indicates that the intra-annual distribution of precipitation had changed. Spatially, the absolute value of MK decreased from the upper reach to the middle reach, with a significant trend in the source region (significance level = 0.05). For the entire human-affected period, dropped 4.63%, 1.18%, 6.89%, and 3.21%. It should be noted that increased by 2.70% during period I in the Tang-Tou region.
4.2. Precipitation–Runoff Model Calibration and Validation
4.2.1. Annual Model
According to the correlation coefficients in Table 3, annual precipitation was positively related to annual streamflow, the largest coefficient among the influential factors, suggesting that annual precipitation dominated the annual streamflow change in the Yellow River Basin. To better reflect the condition of soil moisture content, precipitation from the former year was introduced as a factor [37] and was also positively related to annual streamflow, with a varying correlation of 0.03 to 0.27. In contrast, temperature was negatively related to annual streamflow. Among the four regions, the correlation coefficient between temperature and annual streamflow in the source region was far less than that of the other three regions, revealing a spatial difference. Thus, annual precipitation (P), precipitation of the former year (P−1), and mean temperature (T) were considered the main factors in the construction of the annual-scale model.
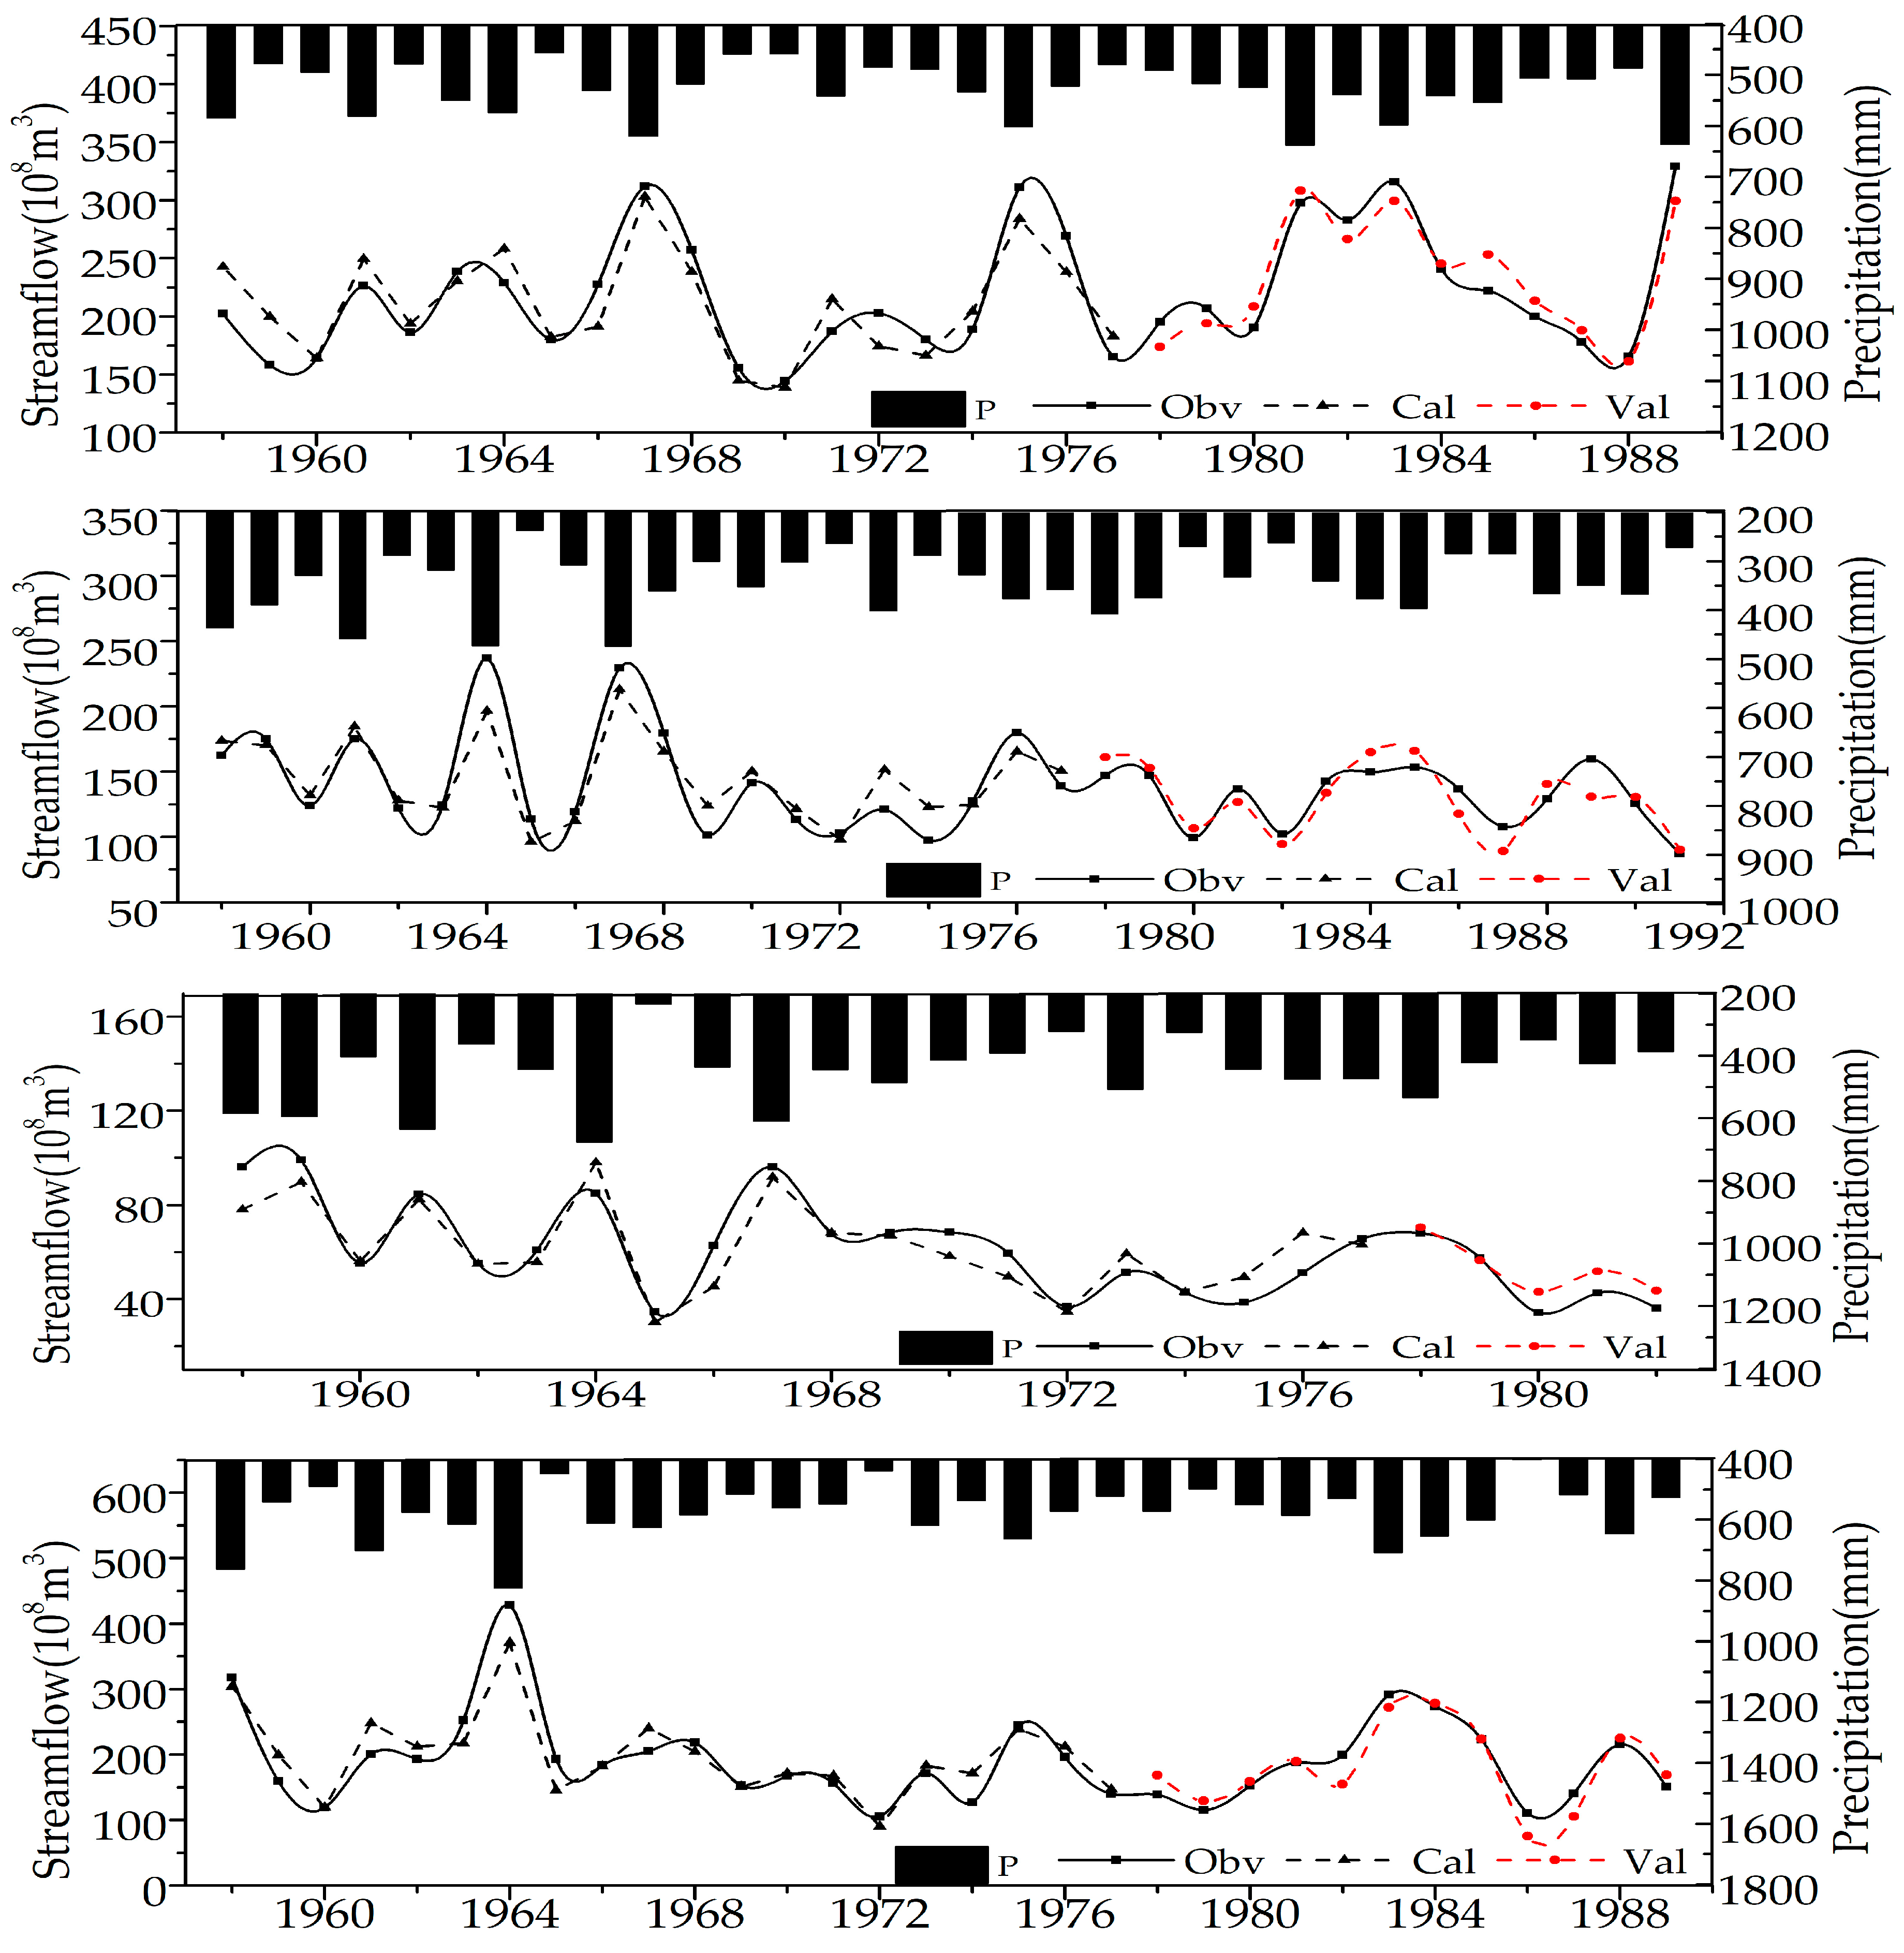
Based on the correlation coefficients analysis results, a three-parameter linear regression model was built for each region. All models were calibrated in the period of 1957–1977 with climatic data and then validated in the period from 1978 to the change-point year. The observed annual streamflow and simulated streamflow during calibration and validation period in each region are plotted in Figure 6. The relative bias (BIAS), relative root-mean-square error (RRMSE), and Nash–Sutcliffe efficiency coefficient (NSE) are given in Table 4. All four models performed reasonably well: their NSE values were in the range of 0.75–0.89, and BIAS and RRMSE were within the range of 2.90% and 0.34, respectively. Moreover, nearly all the trends were captured, and all models passed the F-test. Overall, the model performance was acceptable within the study domain.
4.2.2. Flood and Nonflood Seasonal Model
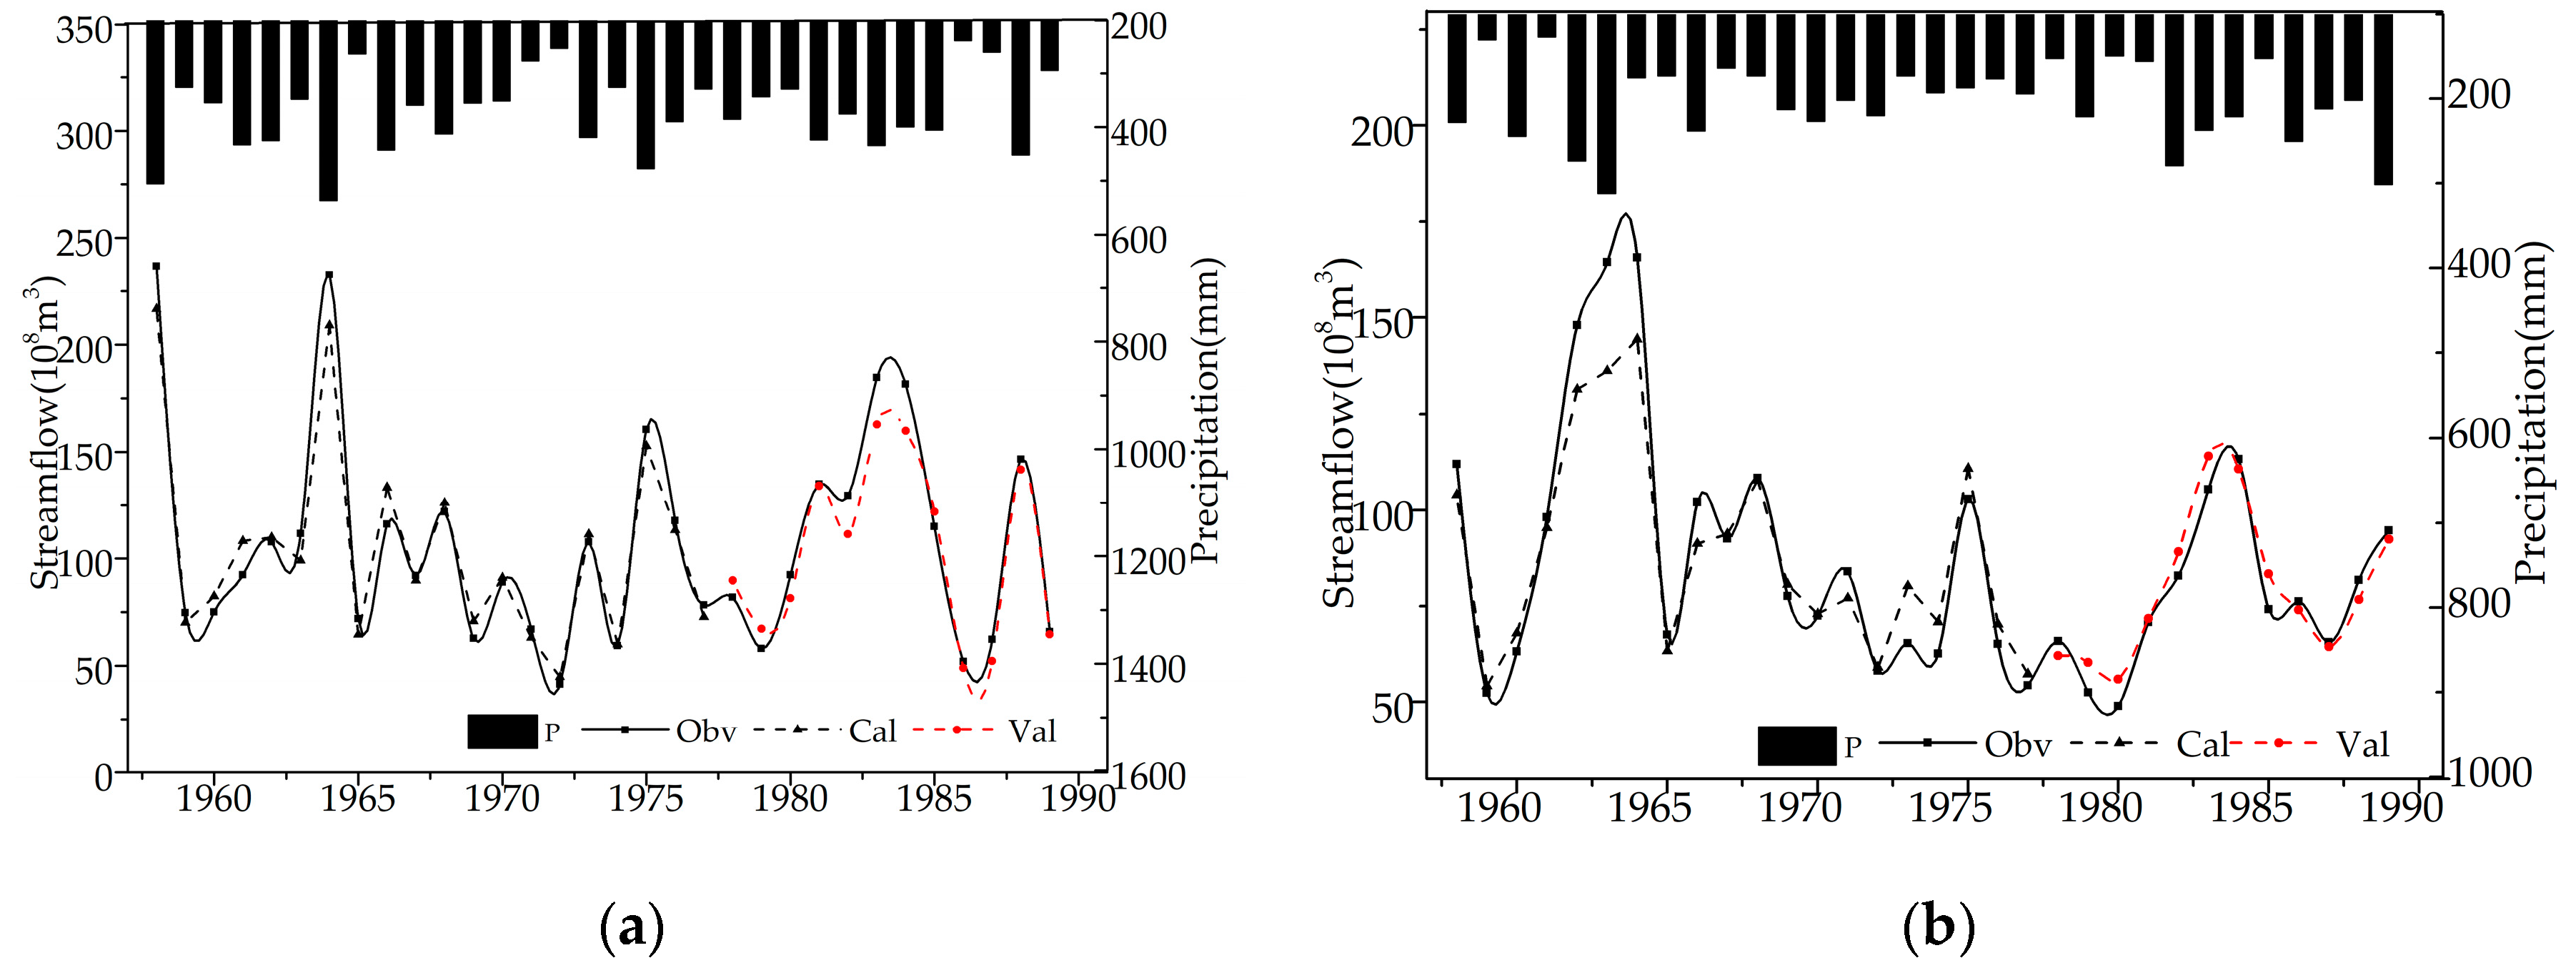
To further identify the contribution made by the variation of the flood-season precipitation percentage, a flood season model and nonflood season model were built, calibrated and validated after identifying the contributing factor by correlation coefficients analysis. Specifically, flood season precipitation and mean temperature were introduced to build the flood season model. In the construction of nonflood season model, in addition to nonflood season precipitation and average temperature, precipitation in October (the last month of the flood season in YRB) was also introduced as a factor [38]. The model performance in Table 4 and Figure 7, as well as the successful F-test, suggest that these models were reliable when reconstructing the natural streamflow, despite some peak differences.
4.3. Contribution Assessment
The quantitative assessment of the effects on streamflow due to climate fluctuations and anthropogenic interference was carried out in four regions of the YRB. It can be seen from Table 5 that a tremendous reduction had taken place in annual streamflow, up to 41.64 × 10⁸ m3/a, 31.31 × 10⁸ m3/a, 21.96 × 10⁸ m3/a, and 72.24 × 10⁸ m3/a, during the entire human-affected period. The reduction accounted for 19.00%, 22.77%, 36.35%, and 37.82%, from the source region to the middle reach. Both climate change and anthropogenic interference had a negative effect on annual streamflow in the YRB, except for the annual precipitation in the source region from 2001 to 2010, which contributed to a rise in annual streamflow of 20.72 × 10⁸ m3/a. The climate fluctuations and anthropogenic interference effects varied spatially and temporally. From the Tang-Tou to the Long-Hua regions, the negative effect of precipitation increased from 6.68% to 53.07%, while the temperature impact decreased from 78.10% to 17.55%. Anthropogenic interference had a greater contribution in the middle-reach Tou-Long and Long-Hua regions than in the upper Tang-Tou region. Temporally, the dominant contributor shifted from precipitation before 2000, to anthropogenic interference after 2000, in the Tou-Long and Long-Hua regions.
It is obvious that the combination of decreased precipitation and increased mean temperature caused the annual streamflow reduction in the YRB. Furthermore, the change in the percentage of flood-season precipitation also affected streamflow variation. Table 6 shows that the flood-season precipitation percentage variation mainly caused the streamflow reduction, up to 9.45 × 10⁸ m3/a, 2.32 × 10⁸ m3/a, 2.01 × 10⁸ m3/a, and 14.81 × 10⁸ m3/a—comprising 21.88%, 7.36%, 10.28%, and 18.24%, respectively, of the total streamflow variation. The effects in the Tang-Tou region in Period I were an exception, causing a 0.70 × 10⁸ m3/a rise in streamflow. With the variation of the flood-season precipitation percentage (Table 2) taken into consideration, a decline in the percentage of flood-season precipitation led to a corresponding drop in streamflow. In contrast, a rise of resulted in an increase in streamflow in the Tang-Tou region during Period I. This indicated that the greater the percentage of precipitation in flood season, the greater the simulated streamflow in YRB, assuming the same annual precipitation.
Specifically, the contribution made by the variation in the percentage of flood-season precipitation was relatively higher in the source and Long-Hua regions. Furthermore, the contribution lowered after 2000 in source and Tou-Long region. To conclude, the streamflow was affected not only by the amount of annual precipitation but also the intra-annual distribution of precipitation.
4.4. Sensitivity Assessment
In this study, Equations (8) and (9) were used to calculate the sensitivity of streamflow to different climatic factors in four regions and the results were presented in Table 7. In general, the absolute value of the sensitivity coefficient to precipitation was larger than that to mean temperature in the humid regions including Source and Long-Hua regions, whereas an opposite situation was observed in the relatively arid regions including Tang-Tou and Tou-Long regions, indicating that the sensitivity of streamflow to various climatic factors are different for regions with different hydrothermal conditions in YRB.
In Period I, regarding the four regions of YRB, a 1% increase in annual precipitation would generate a 0.99–1.73% (1.36% on average) annual streamflow increase, whereas a 1% increase in temperature would produce a 0.01–1.16% (0.79% on average) decrease in annual streamflow. In addition, the sensitivity to the percentage of flood-season precipitation ranged from 0.19 to 0.63 in Period I. It should also be noted that the sensitivity of streamflow to various factors was not a constant. The sensitivity to precipitation and temperature increased considerably in Period II compared to that of Period I, suggesting that streamflow would be more sensitive to climate change. The sensitivities to intra-annual climate variation increased after 2000 as well, and the increase in sensitivity to percentage of flood-season precipitation was more significant in Tou-Long and Long-Hua regions.
5. Discussion
5.1. Analysis of the Impact of Anthropogenic Interference on Natural Streamflow
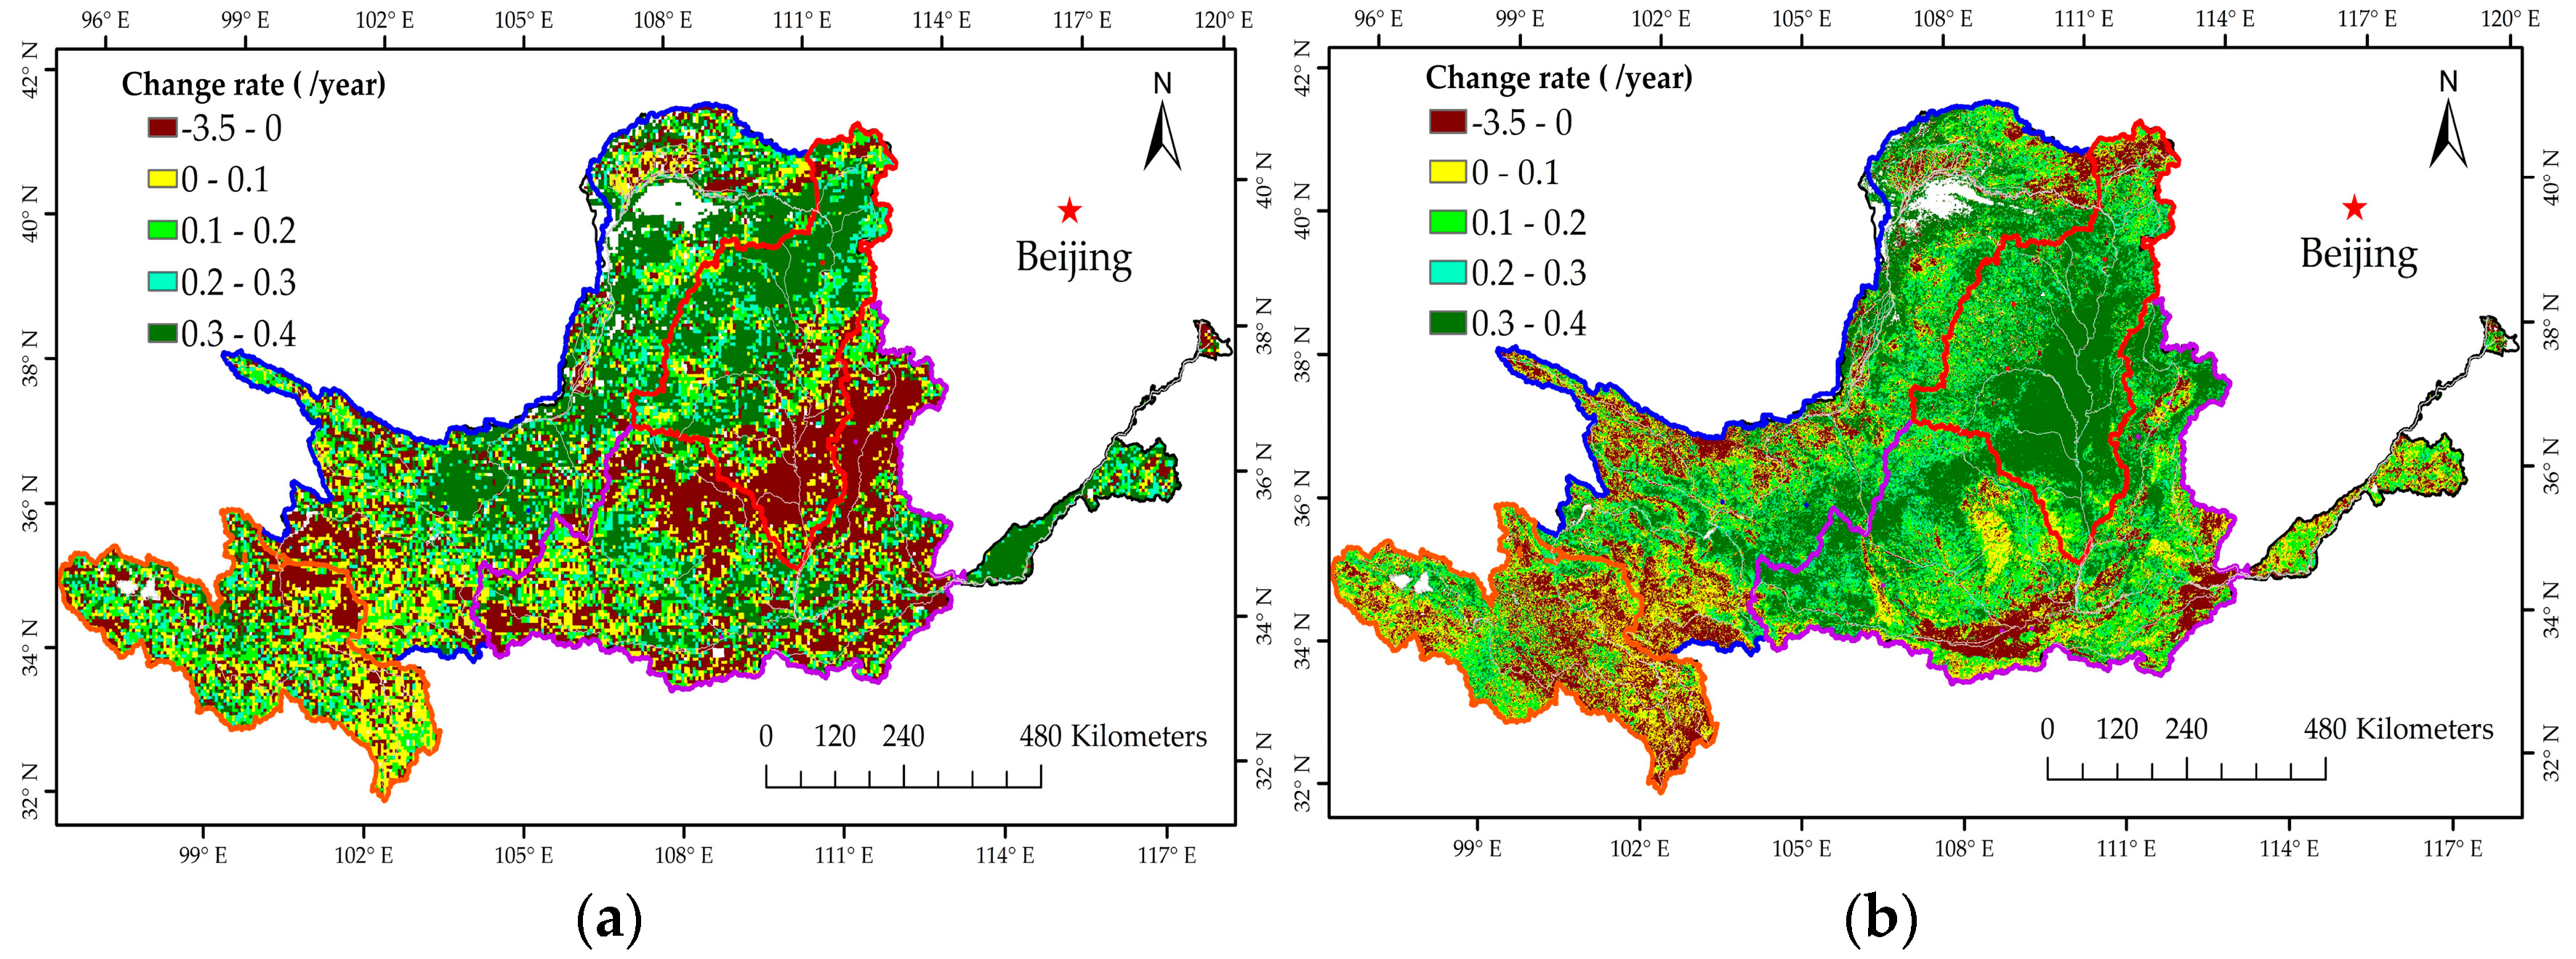
Overall, the findings of this study agreed with the results of other research in the contribution assessment [8,29,32,39]. Table 5 shows that anthropogenic interference had a greater contribution in Tou-Long and Long-Hua regions after 2000, which was mainly due to the ecological program launched by the Chinese government in these two regions. Table 8 displays the implementation of different soil and water conservation measures in the Tou-Long region (including 25 tributaries) in 1997, 2000, 2003, and 2006 [40]. According to the table, the amount of all kinds of soil and water conservation had risen gradually. Among them, forestland and grassland increased more sharply. By 2006, 28,540 km2 of terraced area, 1310.26 km2 of dammed land, 58,613.53 km2 of forest land, 14,072.64 km2 of grassed land, and 8380.18 km2 of closed hillside area had been constructed in the Tou-Long region. Moreover, according to the analysis of LAI data before and after 2000 in Figure 8, the change intensity in forest and grass vegetation was largest in the Tou-Long region, followed by Long-Hua.
Studies have demonstrated that such large-scale land use and land-cover change, driven by soil and water conservation measures, were closely related to streamflow reduction [41,42]. For example, the terraced area can reduce the hillside slope and prolong streamflow retention, reducing surface streamflow [17]. The increasing forests and grasslands play an important role in intercepting rainfall and alleviating streamflow [43]. To conclude, all of these can explain why anthropogenic interference played a more critical role in streamflow reduction in the Tou-Long and Long-Hua regions, especially during Period II.
5.2. Analysis of the Sensitivity of Streamflow to Annual Precipitation and the Percentage of Flood-Season Precipitation
This study modified the traditional formula of the elasticity coefficient and used the calculated sensitivity coefficient to analyze the sensitivity of streamflow to meteorological factors. It should be pointed out that the advantage of this modified sensitivity coefficient calculation formula is that it can be combined with the runoff derived from scenario simulation. That is, the dynamic streamflow time series under the influence of the target factor (such as precipitation, mean temperature, the percentage of flood season precipitation, etc.) can be constructed by the scenario simulation method, and then the sensitivity of streamflow to the certain target factor can be directly calculated based on the sensitivity formula, and the underlying mechanics for calculating the sensitivity of streamflow to the specific factor is relatively easy to understand. In contrast, the traditional elastic coefficient model can only use the original observed streamflow, and the simulation accuracy of the elastic coefficient is affected by the type and number of factors selected in the construction of the elastic model, leading to the greater uncertainty in the sensitivity analysis of specific factors.
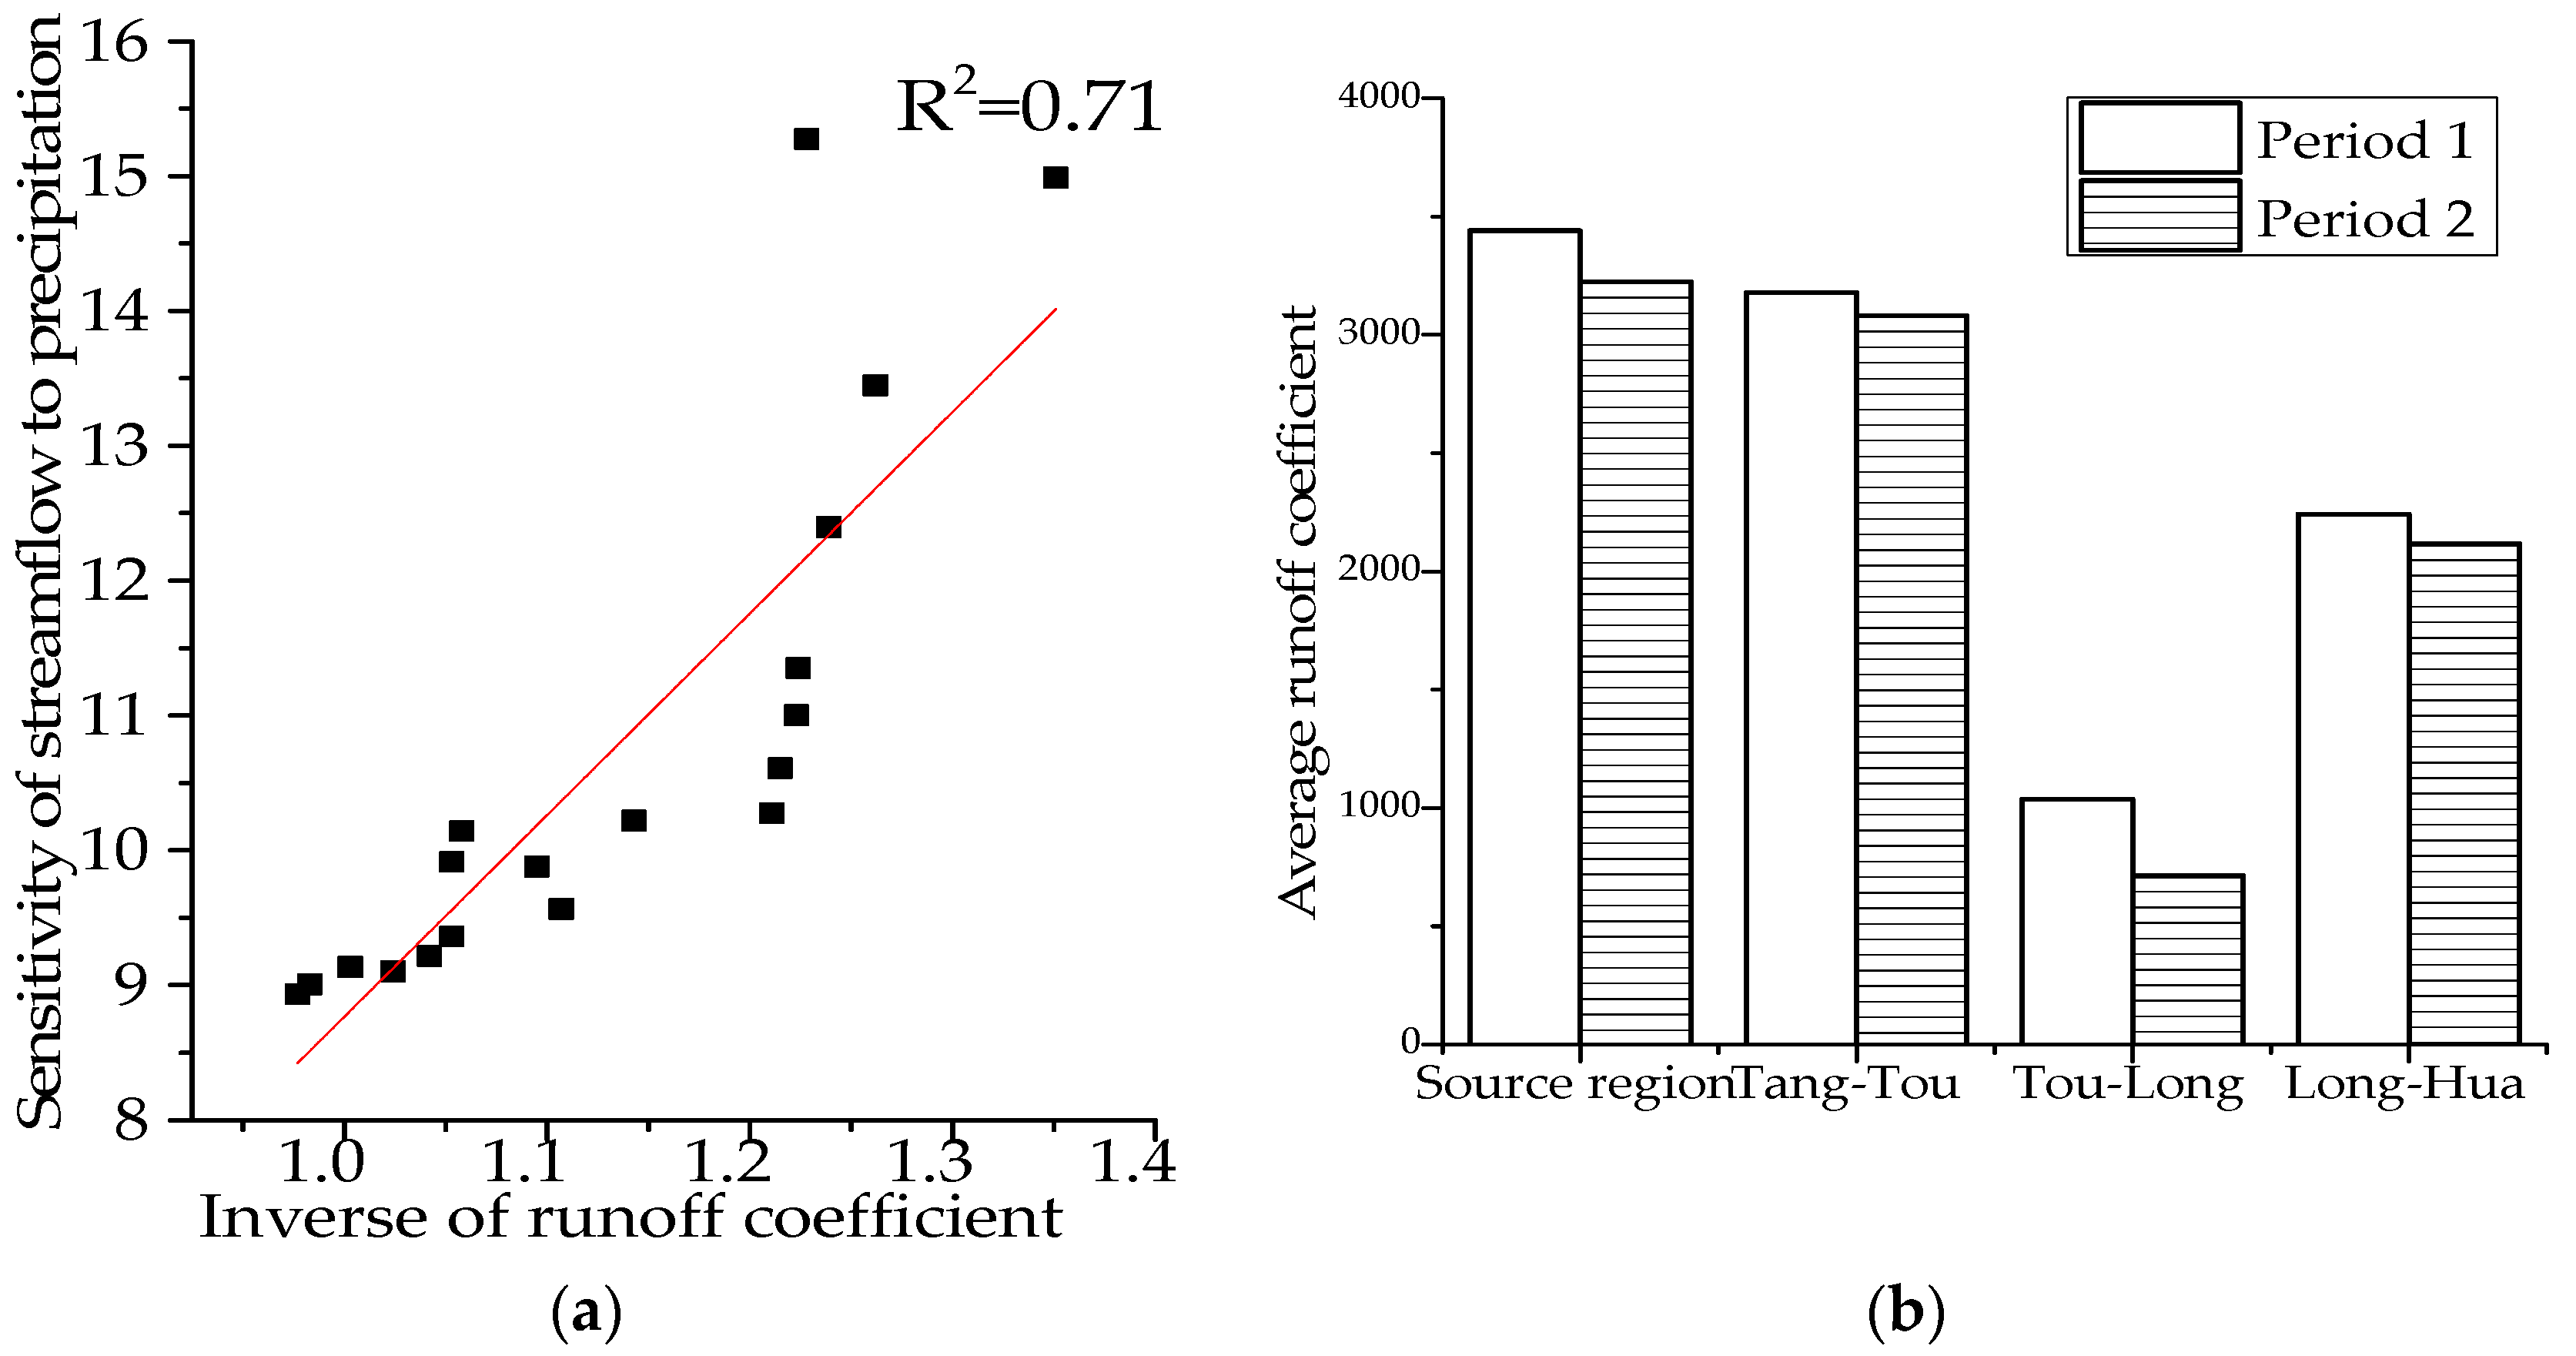
According to the results shown in Table 7, the sensitivity to annual precipitation exhibited both temporal and spatial differences. The annual streamflow after 2000 became more sensitive to annual precipitation in the whole basin. Chiew [44] reported a strong negative correlation between the elasticity coefficient to precipitation and streamflow coefficient (RC) for 219 catchments in Australia. Inspired by Zheng et al. [39], the relationship between the sensitivity to annual precipitation () and RC, which were estimated within a moving window of 10 years, was analyzed in this study. The relationship in Figure 9a shows that the sensitivity to annual precipitation () was positively related to the inverse of the runoff coefficient (1/Rc), indicating that streamflow was more sensitive to precipitation in catchments or periods with low streamflow coefficients. The declining trend of streamflow coefficients of four regions, illustrated in Figure 8b, successfully explained the rise in sensitivity to annual precipitation from period I to period II. This also shows that the sensitivity coefficient calculated in this study has similar properties to the traditional elastic coefficient and can appropriately reflect the sensitivity of streamflow to meteorological elements. Furthermore, part of the reason for a streamflow coefficient decline may be that these regions experienced a significant rise in forest and grass vegetation, as demonstrated in previous studies [42].
Table 7 also shows that streamflow in the source, Tou-Long, and Long-Hua regions was more sensitive to precipitation than that in the Tang-Tou region. This spatial difference partly accorded with their streamflow coefficient except for the source area, which was expected to have a similar sensitivity to that of Tang-Tou. In fact, the value of the sensitivity of streamflow depends on many factors, such as the stochastic nature of climate, vegetation conditions, field capacity of soils, soil moisture levels, length of soil water depletion, and saturated hydraulic conductivity [24]. Compared with other regions, the source region has a relatively saturated soil condition ascribed to good vegetation cover (Figure 8) and humid climate conditions (Table 1), making it easy to form streamflow. Thus, streamflow in the source region is more sensitive to precipitation change than that in other dry regions, such as the arid Tang-Tou region.
As for the sensitivity to the percentage of flood-season precipitation, it increased more in the Tou-Long and Long-Hua regions than in the source and Tang-Tou regions. Given the same annual precipitation, streamflow yield would not be affected by the precipitation temporal pattern in the regions with less forest and grass vegetation. However, as illustrated in Figure 8, forest and grass vegetation increased in the Tou-Long and Long-Hua regions, playing a crucial role in streamflow yield: streamflow would become more sensitive to flood-season precipitation, leading to greater sensitivity to the percentage of flood-season precipitation.
5.3. Uncertainties Analysis
There are some uncertainties associated with the contribution assessment and sensitivity analysis. First, combining two different-scaled models—namely, the annual model and flood and nonflood season model—generates some uncertainties. Another uncertainty in the results exists in the assumption that climate change is independent of anthropogenic interference. In fact, these two factors are interrelated. For example, land cover change and vegetation increase caused by afforestation would also lead to climatic changes.
Despite the uncertainties and limitations, this study provides a relatively easy way to analyze the contribution of climate variables and the sensitivity of streamflow to these factors, including the intra-annual distribution of precipitation. More detailed work, such as distributed models, should be introduced to improve the understanding of the monthly streamflow response mechanism.
6. Conclusions
With the intent of distinguishing the effect of climate fluctuations and anthropogenic interference on streamflow reduction and analyzing the sensitivity of streamflow, an improved three-parameter annual precipitation–streamflow model and flood and nonflood season models were built to simulate natural streamflow. The major findings from this study are summarized below.
The MK results demonstrated a decreasing trend in annual precipitation, significant increasing trend in mean temperature, and decreasing trend in annual streamflow across the Yellow River, excluding the increasing annual precipitation in the source region during 1957–2010. Abrupt change did not take place simultaneously, with the earliest change-point detected in the Tou-Long region. On average, the percentage of flood-season precipitation exhibited a decreasing trend, with each of the four regions experiencing a different level of decline.
The intensity of streamflow reduction improved spatially from 19.00% in the source region to 37.82% in Long-Hua. The contribution made by the climatic fluctuations and anthropogenic interference varied spatially and temporally. From Tang-Tou to Long-Hua, the impacts of annual precipitation and anthropogenic interference increased, while the temperature effect decreased. Temporally, the dominant factor in the Tou-Long and Long-hua regions had shifted from precipitation to anthropogenic interference after 2000. Further, the variation in the percentage of flood-season precipitation was responsible for streamflow variation. The greater the percentage of flood-season precipitation, the greater the simulated streamflow will be.
The sensitivity of streamflow to various climatic factors are different for regions with different hydrothermal conditions in YRB: annual streamflow was more sensitive to annual precipitation than temperature in the humid regions, whereas an opposite situation was observed in the relatively arid regions. Sensitivity to precipitation and temperature both increased in the whole basin after 2000, indicating that substantial challenges and uncertainties might be introduced to regional water availability. The sensitivity of streamflow to the percentage of flood-season precipitation increased most significantly in the Tou-Long and Long-Hua regions, where the highest change intensity of forest and grass vegetation occurred after 2000. These research conclusions can provide a scientific reference for future Yellow River water resource management and ecological construction planning.
Author Contributions
All authors contributed to the design and development of this manuscript. J.W. performed the data processing and wrote the first draft of the manuscript. Z.W. and Z.D. are the graduate supervisors of J.W. and gave constructive suggestions on the design and modification of the manuscript. Z.W. also helped process the LAI data. Q.T., X.L., and G.D. helped edit the manuscript prior to submission.
Funding
This research was funded by the National Key R&D Program of China (2016YFC0402402), China Postdoctoral Science Foundation (2017M610458), Young Elite Scientists Sponsorship by CAST (2017QNRC023), Foundation of development on science and technology by YRIHR (HKF201709) and National Natural Science Foundation of China (41701509, 51509102, 51779099).
Acknowledgments
We gratefully thank the anonymous reviewers for their critical comments and constructive suggestions on the manuscript.
Conflicts of Interest
The authors declare no conflicts of interest.
References
- Razmara, P.; Bavani, A.R.M.; Motiee, H. Investigating uncertainty of climate change effect on entering runoff to Urmia Lake Iran. Hydrol. Earth Syst. Sci. Discuss. 2013, 10, 2183–2214. [Google Scholar] [CrossRef]
- Stahl, K.; Hisdal, H.; Tallaksen, L. Trends in low flows and streamflow droughts across Europe. In Proceedings of the UNESCO, Paris, France, 14 March 2008. [Google Scholar]
- Rood, S.B.; Samuelson, G.M.; Weber, J.K. Twentieth-century decline in streamflows from the hydrographic apex of North America. J. Hydrol. 2005, 306, 215–233. [Google Scholar] [CrossRef]
- Xu, X.Y.; Yang, D.W.; Yang, H.B. Attribution analysis based on the Budyko hypothesis for detecting the dominant cause of runoff decline in Haihe basin. J. Hydrol. 2014, 510, 530–540. [Google Scholar] [CrossRef]
- Hughes, J.D.; Petrone, K.C.; Silberstein, R.P. Drought, groundwater storage and stream flow decline in southwestern Australia. Geophys. Res. Lett. 2012, 39, L03408. [Google Scholar] [CrossRef]
- Li, Y.Z.; Liu, C.M.; Zhang, D. Reduced Runoff Due to Anthropogenic Intervention in the Loess Plateau, China. Water 2016, 8, 458. [Google Scholar] [CrossRef]
- Wang, D.; Hejazi, M. Quantifying the relative contribution of the climate and direct human impacts on mean annual streamflow in the contiguous United States. Water Resour. Res. 2011, 47, 411. [Google Scholar] [CrossRef]
- Feng, A.Q.; Li, Y.Z.; Gao, J.B. The determinants of streamflow variability and variation in Three-River Source of China: Climate change or ecological restoration? Environ. Earth Sci. 2017, 76, 696. [Google Scholar] [CrossRef]
- Chang, J.X.; Zhang, H.X.; Wang, Y.M.; Zhu, Y.L. Assessing the impact of climate variability and human activity to streamflow variation. Hydrol. Earth Syst. Sci. 2016, 20, 1547–1560. [Google Scholar] [CrossRef]
- Tamai, K. A paired-catchment experiment in the Tatsunokuchiyama experimental forest, Japan: the influence of forest disturbance on water discharge. In River Basin Management III; WIT Press: Southampton, UK, 2005; Volume 2, pp. 173–182. [Google Scholar]
- Bosch, J.M.; Hewlett, J.D. A review of catchment experiments to determine the effect of vegetation changes on water yield and evapotranspiration. J. Hydrol. 1982, 55, 3–23. [Google Scholar] [CrossRef]
- Tuteja, N.K.; Vaze, J.; Teng, J.; Mutendeudzi, M. Partitioning the effects of pine plantations and climate variability on streamflow from a large catchment in southeastern Australia. Water Resour. Res. 2007, 43, W08415. [Google Scholar] [CrossRef]
- Buendia, C.; Batalla, R.J.; Sabater, S. Runoff Trends Driven by Climate and Afforestation in a Pyrenean Basin. Land Degrad. Dev. 2016, 27, 823–838. [Google Scholar] [CrossRef]
- Adam, J.C.; Haddeland, I.; Su, F. Simulation of reservoir influences on annual and seasonal streamflow changes for the Lena, Yenisei, and Ob’ rivers. J. Geophys. Res.-Atmos. 2007, 112, D24114. [Google Scholar] [CrossRef]
- Tesfa, T.K.; Li, H.Y.; Leung, L.R. A subbasin-based framework to represent land surface processes in an Earth system mode. Geosci. Model Dev. Dis. 2013, 6, 2699–2730. [Google Scholar]
- Petchprayoon, P.; Blanken, P.D.; Ekkawatpanit, C. Hydrological impacts of land use/land cover change in a large river basin in central-northern Thailand. Int. J. Clim. 2010, 30, 1917–1930. [Google Scholar] [CrossRef] [Green Version]
- Hu, Z.D.; Wang, L.; Wang, Z.J.; Yang, H.; Hang, Z. Quantitative assessment of climate and human impacts on surface water resources in a typical semiarid watershed in the middle reaches of the Yellow River from 1985 to 2006. Int. J. Clim. 2015, 35, 97–113. [Google Scholar] [CrossRef]
- Hundecha, Y.; Bardossy, A. Modeling of the Effect of Land Use Changes on the Runoff Generation of a River Basin Through Parameter Regionalization of a Watershed Model. J. Hydrol. 2004, 292, 281–295. [Google Scholar] [CrossRef]
- Ye, B.S.; Yang, D.Q.; Kane, D.L. Changes in Lena River streamflow hydrology: Human impacts versus natural variations. Water Resour. Res. 2003, 39, SWC14. [Google Scholar] [CrossRef]
- Liu, X.M.; Liu, C.M.; Luo, Y.Z. Dramatic decrease in streamflow from the headwater source in the central route of China’s water diversion project: Climatic variation or human influence? Geophys. Res.-Atmos. 2012, 117, D06113–D06122. [Google Scholar] [CrossRef]
- Tian, F.; Yang, Y.H.; Han, S.M. Using runoff slope-break to determine dominate factors of runoff decline in Hutuo River Basin, North China. Water Sci. Technol. 2009, 60, 2135–2144. [Google Scholar] [CrossRef] [PubMed]
- Zhang, L.; Yang, X. Applying a Multi-Model Ensemble Method for Long-Term streamflow Prediction under Climate Change Scenarios for the Yellow River Basin, China. Water 2018, 10, 301. [Google Scholar] [CrossRef]
- Zhang, P.C.; Shao, G.F.; Zhao, G.; Master, D.C.L.; Parker, G.R.; Dunning, J.B.J.; Li, Q. China’s forest policy for the 21st century. Science 2000, 288, 2135–2136. [Google Scholar] [CrossRef] [PubMed]
- Tang, Q.H.; Oki, T.; Kanae, S. Hydrological Cycles Change in the Yellow River Basin during the Last Half of the Twentieth Century. J. Clim. 2008, 21, 1790–1806. [Google Scholar] [CrossRef]
- Liu, Q.H.; Cui, B. Impacts of climate change/variability on the streamflow in the Yellow River Basin, China. Ecol. Model. 2011, 222, 268–274. [Google Scholar] [CrossRef]
- Li, B.; Li, C.Y.; Liu, J.Y.; Zhang, Q.; Duan, L.M. Decreased Streamflow in the Yellow River Basin, China: Climate Change or Human-Induced? Water 2017, 9, 116. [Google Scholar] [CrossRef]
- Guli, J.; Liang, S.L.; Yi, Q.X. Vegetation dynamics and responses to recent climate change in Xinjiang using leaf area index as an indicator. Ecol. Indic. 2015, 58, 64–76. [Google Scholar]
- Shu, S.J.; Liu, C.S.; Shi, R.H.; Gao, W. Research on spatial interpolation of meteorological elements in Anhui Province based on ANUSPLIN. In Proceedings of the SPIE 8156, Remote Sensing and Modeling of Ecosystems for Sustainability VIII, San Diego, CA, USA, 22–23 August 2011. [Google Scholar]
- Mann, H.B. Non-parametric tests against trend. Econ. J. Econ. Soc. 1945, 13, 245–259. [Google Scholar]
- Kendall, M.G. Rank Correlation Methods; Griffin: London, UK, 1975. [Google Scholar]
- Matouškov, M.; Kliment, Z. Runoff changes in the Šumava Mountains (black forest) and the foothill regions: Extent of influence by human impact and climate change. Water Resour. Manag. 2009, 23, 1813–1834. [Google Scholar]
- Breiman, L. Random forests. Mach. Learn. 2001, 45, 5–32. [Google Scholar] [CrossRef]
- Liu, X.H.; Guanter, L.; Liu, L.Y. Downscaling of solar-induced chlorophyll fluorescence from canopy level to photosystem level using a random forest model. Remote Sens. Environ. 2018. [Google Scholar] [CrossRef]
- Carlisle, D.M.; Falcone, J.; Wolock, D.M. Predicting the natural flow regime: Models for assessing hydrological alteration in streams. River Res. Appl. 2010, 26, 118–136. [Google Scholar] [CrossRef]
- Belgiu, M.; Dragut, L. Random forest in remote sensing: A review of applications and future directions. ISPRS J. Photogramm. 2016, 114, 24–31. [Google Scholar] [CrossRef]
- He, Y.H.; Lin, K.R.; Chen, X.H. Effect of Land Use and Climate Change on Runoff in the Dongjiang Basin of South China. Math. Probl. Eng. 2013, 2013, 14–26. [Google Scholar] [CrossRef]
- Xu, X.Y. Hydrological Response of Typical Watersheds under Climate Change. Ph.D. Thesis, Tsinghua University, Beijing, China, 2012. [Google Scholar]
- Bao, W.M. Hydrological Forecast, 4th ed.; China Water Resources and Hydropower Press: Beijing, China, 2009; pp. 250–257. ISBN 9787508461922. (In Chinese) [Google Scholar]
- Zheng, H.X.; Lu, Z.; Zhu, R.R. Responses of streamflow to climate and land surface change in the headwaters of the Yellow River Basin. Water Resour. Res. 2009, 45, 641–648. [Google Scholar] [CrossRef]
- Yao, W.Y.; Xu, J.H.; Ran, D.C. Analysis and Evaluation of Water and Sediment Changes in the Yellow River Basin, 1st ed.; Yellow River Conservancy Press: Zhengzhou, China, 2011; pp. 37–39. ISBN 9787550901414. (In Chinese) [Google Scholar]
- Mu, X.; Gao, P.; Basangchilie. Application of flow duration curves to analyze the effect of water and soil conservation measures on river runoff in the Loess Plateau. Adv. Earth Sci. 2008, 23, 382–389. (In Chinese) [Google Scholar]
- Liu, X.; Liu, C.; Yang, S. Effect of remote sensing on changes of forest and grass vegetation in the Loess Plateau to river runoff. Acta Geogr. Sin. 2014, 69, 1595–1603. (In Chinese) [Google Scholar]
- Chen, L.D.; Wei, W.; Fu, B.J. Soil and Water Conservation on the Loess Plateau in China: Review and Perspective. Prog. Phys Geogr. 2007, 31, 3547–3554. [Google Scholar] [CrossRef]
- Chiew, F.S. Estimation of rainfall elasticity of streamflow in Australia. Int. Assoc. Sci. Hydrol. Bull. 2006, 51, 613–625. [Google Scholar] [CrossRef] [Green Version]
Figure 1.
Location and national network of the meteorological and hydrological stations in the YRB.

Figure 2.
Mann–Kendall test values (a) and precipitation–streamflow double cumulative curve (b) for change-point detection in Long-Hua region of YRB (1957–2010).
Figure 2.
Mann–Kendall test values (a) and precipitation–streamflow double cumulative curve (b) for change-point detection in Long-Hua region of YRB (1957–2010).

Figure 3.
Precipitation–streamflow double cumulative curve for change-point detection in Tou-long region of YRB (1957–2010).
Figure 3.
Precipitation–streamflow double cumulative curve for change-point detection in Tou-long region of YRB (1957–2010).

Figure 4.
Long-term variations in annual precipitation (P), temperature (T), and streamflow (R) in the Long-Hua region in YRB.
Figure 4.
Long-term variations in annual precipitation (P), temperature (T), and streamflow (R) in the Long-Hua region in YRB.

Figure 5.
MK results of the trend analysis for annual precipitation, mean temperature, and streamflow in four regions of YRB.
Figure 5.
MK results of the trend analysis for annual precipitation, mean temperature, and streamflow in four regions of YRB.

Figure 6.
Observed and simulated annual streamflow in four regions during calibration and validation period.
Figure 6.
Observed and simulated annual streamflow in four regions during calibration and validation period.

Figure 7.
Observed and simulated streamflow in Long-Hua region during the calibration and validation period in the flood season model (a) and nonflood season model (b).
Figure 7.
Observed and simulated streamflow in Long-Hua region during the calibration and validation period in the flood season model (a) and nonflood season model (b).

Figure 8.
Overall change trend in annual LAI in 1982–2000 (a) and in 2001–2013 (b) in the YRB.

Figure 9.
Correlation between sensitivity to precipitation and streamflow coefficient in the Tou-Long region (a) and the streamflow coefficients in different periods in four regions (b).
Figure 9.
Correlation between sensitivity to precipitation and streamflow coefficient in the Tou-Long region (a) and the streamflow coefficients in different periods in four regions (b).


Table 1.
Average of annual precipitation, mean temperature, and streamflow and their change rate in four regions of YRB.
Table 1.
Average of annual precipitation, mean temperature, and streamflow and their change rate in four regions of YRB.
| Sub Basin | Precipitation | Mean Temperature | Streamflow | |||
|---|---|---|---|---|---|---|
| (mm) | Δ (mm/a) | (°C) | Δ (°C/a) | (108 m3) | Δ (108 m3/a) | |
| Source | 528.93 | 0.42 | 0.39 | 0.04 | 201.78 | −0.57 |
| Tang–Tou | 342.27 | −0.43 | 6.23 | 0.05 | 126.50 | −1.03 |
| Tou-Long | 433.85 | −1.39 | 7.93 | 0.04 | 49.02 | −0.86 |
| Long-Hua | 560.92 | −1.38 | 10.26 | 0.03 | 162.91 | −2.21 |
Table 2.
MK results and average change of the percentage of flood-season precipitation in four regions of YRB.
Table 2.
MK results and average change of the percentage of flood-season precipitation in four regions of YRB.
| Sub Basin | M-K Test from 1957 to 2010 | Average Change (%) Compared with Baseline Period | |||
|---|---|---|---|---|---|
| Z | H0 | Period I | Period II | Human-Affected Period | |
| Source region | −2.69 | R | −5.54 | −3.52 | −4.63 |
| Tang-Tou region | −1.37 | A | 2.70 | −5.06 | −1.18 |
| Tou-Long region | −1.27 | A | −6.75 | −7.18 | −6.89 |
| Long-Hua region | −0.81 | A | −4.52 | −1.61 | −3.21 |
R: reject H0; A: accept H0.
Table 3.
The correlation coefficient of each element to annual streamflow in four regions of the YRB.
Table 3.
The correlation coefficient of each element to annual streamflow in four regions of the YRB.
| Sub Basin | Basin Scope | P | P−1 | T |
|---|---|---|---|---|
| Source region | Source region | 0.84 | 0.27 | −0.13 |
| Tang-Tou region | Upper | 0.84 | 0.10 | −0.53 |
| Tou-Long region | Midstream | 0.84 | 0.03 | −0.35 |
| Long-Hua region | Midstream | 0.87 | 0.11 | −0.45 |
Table 4.
Calibration and validation of the annual, flood and nonflood season model in four subregions of the YRB.
Table 4.
Calibration and validation of the annual, flood and nonflood season model in four subregions of the YRB.
| Sub Basin | Period | Annual | Flood Season | Non-Flood Season | ||||||
|---|---|---|---|---|---|---|---|---|---|---|
| BIAS (%) | RRMSE | NSE | BIAS (%) | RRMSE | NSE | BIAS (%) | RRMSE | NSE | ||
| Source | Calibration | 0.40 | 0.22 | 0.76 | 1.19 | 0.29 | 0.93 | 0.47 | 0.21 | 0.91 |
| Validation | 0.41 | 0.22 | 0.89 | 2.60 | 0.25 | 0.92 | 0.38 | 0.22 | 0.90 | |
| Tang-Tou | Calibration | 0.57 | 0.25 | 0.83 | 0.28 | 0.32 | 0.93 | 1.71 | 0.21 | 0.92 |
| Validation | 1.05 | 0.18 | 0.81 | 0.23 | 0.28 | 0.94 | 2.68 | 0.15 | 0.83 | |
| Tou-Long | Calibration | 2.90 | 0.30 | 0.78 | 1.53 | 0.49 | 0.94 | 2.09 | 0.17 | 0.87 |
| Validation | 0.11 | 0.24 | 0.75 | 8.55 | 0.40 | 0.89 | 9.70 | 0.21 | 0.76 | |
| Long-Hua | Calibration | 1.14 | 0.34 | 0.85 | 1.30 | 0.45 | 0.92 | 2.65 | 0.34 | 0.90 |
| Validation | 2.22 | 0.32 | 0.83 | 5.24 | 0.40 | 0.93 | 2.49 | 0.24 | 0.91 | |
Table 5.
Contribution of precipitation, temperature, and anthropogenic interference on annual streamflow variation in four regions of the YRB.
Table 5.
Contribution of precipitation, temperature, and anthropogenic interference on annual streamflow variation in four regions of the YRB.
| Sub Basin | Period | Total Change | Precipitation | Temperature | Anthropogenic Interference | ||||
|---|---|---|---|---|---|---|---|---|---|
| ΔRtotal | % | ΔRP | % | ΔRT | % | ΔRH | % | ||
| Source region | 1990–2000 | −43.78 | −19.98 | −21.95 | 50.14 | −3.73 | 8.52 | −18.10 | 41.34 |
| 2001–2010 | −39.28 | −17.92 | 20.72 | −52.74 | −18.89 | 48.08 | −41.11 | 104.66 | |
| 1990–2010 | −41.64 | −19.00 | −1.63 | 3.92 | −10.95 | 26.29 | −29.06 | 69.78 | |
| Tang-Tou region | 1992–2000 | −31.04 | −22.57 | −4.22 | 13.60 | −19.46 | 62.67 | −7.36 | 23.72 |
| 2001–2010 | −31.54 | −22.94 | −0.18 | 0.56 | −28.94 | 91.77 | −2.42 | 7.68 | |
| 1992–2010 | −31.31 | −22.77 | −2.09 | 6.68 | −24.45 | 78.10 | −4.76 | 15.21 | |
| Tou-Long region | 1983–2000 | −17.74 | −29.36 | −9.28 | 52.34 | −4.50 | 25.37 | −3.95 | 22.29 |
| 2001–2010 | −29.55 | −48.93 | −5.36 | 18.14 | −10.52 | 35.60 | −13.67 | 46.26 | |
| 1983–2010 | −21.96 | −36.35 | −7.88 | 35.90 | −6.65 | 30.29 | −7.42 | 33.82 | |
| Long-Hua region | 1990–2000 | −73.21 | −38.33 | −53.23 | 72.71 | −9.22 | 12.59 | −10.76 | 14.70 |
| 2001–2010 | −71.17 | −37.26 | −21.96 | 30.86 | −16.48 | 23.16 | −32.73 | 45.98 | |
| 1990–2010 | −72.24 | −37.82 | −38.34 | 53.07 | −12.68 | 17.55 | −21.22 | 29.38 | |
Table 6.
Contribution of the variation of flood-season precipitation percentage in four regions of the YRB.
Table 6.
Contribution of the variation of flood-season precipitation percentage in four regions of the YRB.
| Sub Basin | Period I | Period II | Human-Affected Period | |||
|---|---|---|---|---|---|---|
| ΔR | % | ΔR | % | ΔR | % | |
| Source region | −10.04 | 22.08 | −8.72 | 21.60 | −9.45 | 21.88 |
| Tang-Tou region | 0.70 | −2.11 | −4.00 | 12.44 | −2.32 | 7.36 |
| Tou-Long region | −1.87 | 12.61 | −2.50 | 8.56 | −2.01 | 10.28 |
| Long-Hua region | −13.40 | 16.86 | −14.92 | 20.04 | −14.81 | 18.24 |
Table 7.
Sensitivity of streamflow to various elements in four regions.
| Sub-District | P | T | γ | |||
|---|---|---|---|---|---|---|
| Period I | Period II | Period I | Period II | Period I | Period II | |
| Source region | 1.73 | 2.09 | −0.01 | −0.02 | 0.63 | 0.78 |
| Tang-Tou region | 0.99 | 1.06 | −0.99 | −1.07 | 0.34 | 0.36 |
| Tou-Long region | 1.09 | 1.23 | −1.16 | −1.54 | 0.19 | 0.42 |
| Long-Hua region | 1.64 | 1.88 | −1.12 | −1.15 | 0.37 | 0.80 |
Table 8.
Implementation of different soil and water conservation in the Tou-Long region in 1997, 2000, 2003, and 2006 (unit: km2).
Table 8.
Implementation of different soil and water conservation in the Tou-Long region in 1997, 2000, 2003, and 2006 (unit: km2).
| Year | Terraced Area | Dammed Land | Forest Land | Grassland | Hillsides Closed for Erosion Control | Total |
|---|---|---|---|---|---|---|
| 1997 | 19,977.25 | 968.77 | 27,176.62 | 6939.60 | 2601.75 | 55,062.24 |
| 2000 | 23,291.18 | 1085.55 | 36,920.30 | 8929.06 | 3346.84 | 70,226.09 |
| 2003 | 26,166.33 | 1213.42 | 49,011.68 | 11,738.26 | 5528.36 | 88,129.69 |
| 2006 | 28,540.36 | 1310.26 | 58,613.53 | 14,072.64 | 8380.18 | 102,536.79 |
© 2018 by the authors. Licensee MDPI, Basel, Switzerland. This article is an open access article distributed under the terms and conditions of the Creative Commons Attribution (CC BY) license (http://creativecommons.org/licenses/by/4.0/).
Share and Cite
MDPI and ACS Style
Wu, J.; Wang, Z.; Dong, Z.; Tang, Q.; Lv, X.; Dong, G. Analysis of Natural Streamflow Variation and Its Influential Factors on the Yellow River from 1957 to 2010. Water 2018, 10, 1155. https://doi.org/10.3390/w10091155
AMA Style
Wu J, Wang Z, Dong Z, Tang Q, Lv X, Dong G. Analysis of Natural Streamflow Variation and Its Influential Factors on the Yellow River from 1957 to 2010. Water. 2018; 10(9):1155. https://doi.org/10.3390/w10091155
Chicago/Turabian StyleWu, Jie, Zhihui Wang, Zengchuan Dong, Qiuhong Tang, Xizhi Lv, and Guotao Dong. 2018. "Analysis of Natural Streamflow Variation and Its Influential Factors on the Yellow River from 1957 to 2010" Water 10, no. 9: 1155. https://doi.org/10.3390/w10091155
Note that from the first issue of 2016, this journal uses article numbers instead of page numbers. See further details here.