Article

The Functioning of a Water Body Within a Fluvio-Lacustrine System as an Effect of Excessive Nitrogen Loading—The Case of Lake Symsar and its Drainage Area (Northeastern Poland)

by
Angela Kuriata-Potasznik
Department of Water Resources, Climatology and Environmental Management, University of Warmia and Mazury in Olsztyn, Plac Łódzki 2, 10-719 Olsztyn, Poland
Water 2018, 10(9), 1163; https://doi.org/10.3390/w10091163
Submission received: 31 July 2018 / Revised: 15 August 2018 / Accepted: 27 August 2018 / Published: 30 August 2018
(This article belongs to the Special Issue Freshwater Quality as a Driver of Aquatic Ecosystem Health)

Abstract

:
Generally, in water ecosystems, it is assumed that rivers play a transport role. In turn, lakes have accumulation properties. However, in fluvio-lacustrine systems, each water body located on a river track can disrupt naturally occurring processes. One such process is the nitrogen cycle. An analysis of the nitrogen cycle, at both the global and local levels, is of extreme significance in view of the progressive degradation of aquatic ecosystems. In this study, we attempted to show that the specific properties of reservoirs located in river–lake systems contribute to an adequate reaction of these reservoirs to situations involving an excessive pollution load. Despite the intensive exchange of water in lakes, they were mainly shown to have an accumulation function. In particular, in those located in the lower part of the system, the total nitrogen load transported outside the example reservoir decreased by 4.3%. The role of these reservoirs depends on the morphometric, hydrologic, and meteorological conditions. The actual loading of the water body was shown to be more than double the permitted critical loading. The creation of conditions similar to those occurring in river–lake systems by, for example, delaying the outflow of water, may favor the protection of surface water from the last element of the system, because this limits the transport of pollutants. This study of the functioning and evolution of lakes’ fluvio-lacustrine systems, including the balance of the nutrient load, enables the prediction of the aquatic ecosystem’s responses in the future and their changes.

1. Introduction

The global nitrogen cycle is disturbed by humans [1]. The recognition of the circulation of this element is very important, as nitrogen reaching the land eventually penetrates into waters through the surface and underground runoff [2]. The nitrogen cycle in water is primarily determined by the biogeochemical processes occurring there [3]. The recognition of the local nitrogen cycle in surface waters also appears to be very important for water protection, particularly in fluvio-lacustrine systems. Nitrogen is one of the main nutrients responsible for the eutrophication process. One-third of the average inflow of water to the Baltic Sea originates from Poland [4], with approximately 25% nitrogen and 40% phosphorus reaching the sea via the fluvial route. In the area of Northern Poland, the route of almost every river runs through lakes [4].
Nitrogen mainly penetrates into surface waters through surface runoff from the drainage area, inter alia, and originates from diffuse or point sources which introduce nutrient loads from wastewater [2,5]. The intensity of supply from area-wide sources is determined by meteorological conditions, the type of soils covering the drainage area, and the uses and layout of the land [2,5,6]. Depending on the prevailing conditions, numerous processes occur in water which affect the transformation of nitrogen and its deposition on the bottom. The main processes of nitrogen transformation in surface waters include nitrification and denitrification processes [7]. Anaerobic bacteria are involved in denitrification by producing a gas in the form of nitrogen oxide or nitrogen dioxide by converting nitrate nitrogen into nitrite nitrogen. In its gaseous form, it is removed from aquatic ecosystems and released into the atmosphere [8]. During the nitrification process, the ammonia nitrogen form becomes more available to plants thanks to the participation of nitrifying bacteria and aerobic conditions [9]. The generated products may be transported, deposited on the bottom, assimilated by macrophytes, or resuspended on the bottom [10]. These processes occur with various intensities depending on the characteristics of the surface water. No deposition occurs in places where the water movement is intense, as is the case in rivers. In such cases, the transport function is dominant. In turn, when the water flow slows down in water bodies, either sedimentation processes take place or the components are suspended within the water depth [1]. A key role is played by the hyporheic zone, within which nitrification and denitrification processes occur through the continuous exchange and mixing of the components of surface water and underground water [11].
In fluvio-lacustrine systems in which the continuous exchange of substances takes place, depending on the length of a particular system and the function it serves, changes occur completely differently. The roles of each water body located on the river route are different and are determined by the position of the water body within the system and its location in the area, as well as by hydrological and morphometric conditions, the climate, and primarily, by the volume of the nutrient supply (loading) [11,12,13].
The lakes of Northeastern Poland enable the limitation of the transport of pollutants via rivers to the Baltic Sea. By converting the load, they can reduce or increase it, depending on the volume of loading [4]. According to Hillbricht-Ilkowska and Kostrzewska-Szlakowska [14], fluvio-lacustrine systems are perceived as systems of alternate lake and river sections connected to one another by the continuous exchange of components. As a whole, it is a more effective aquatic ecosystem than its constituent elements.
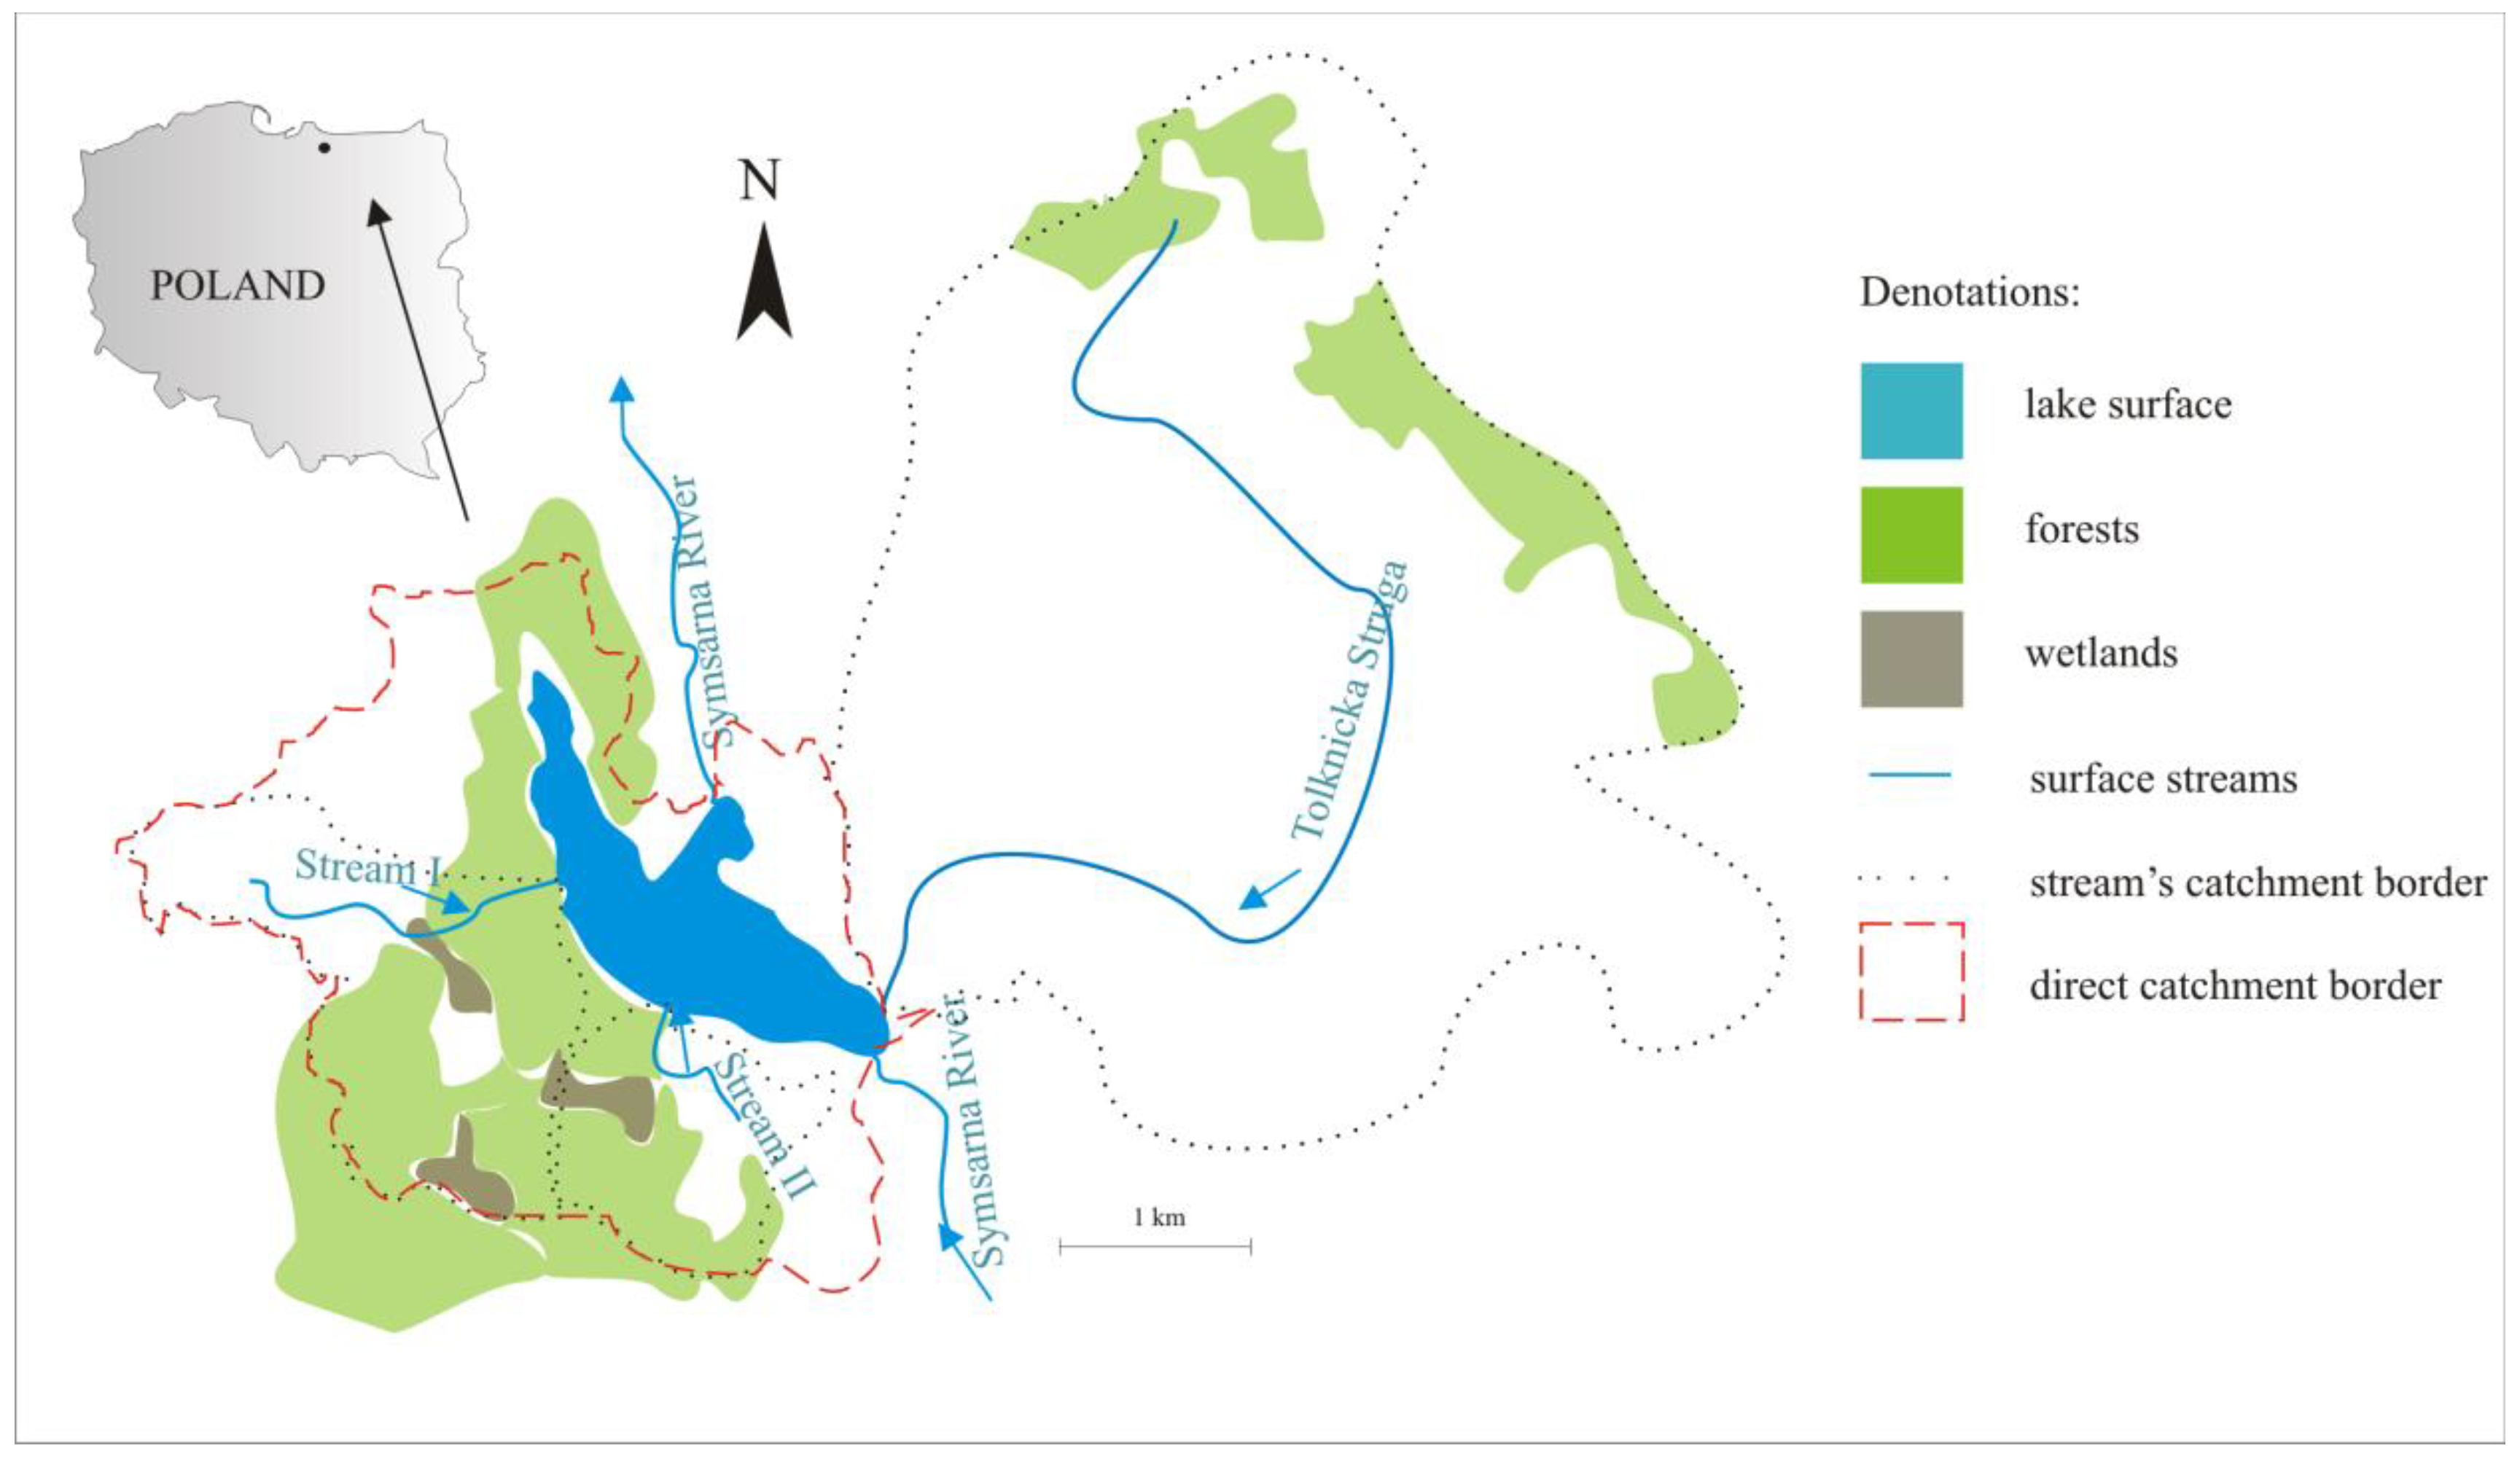
The aim of the study presented in this paper is to respond to the question about the role of lakes as elements of a fluvio-lacustrine system in limiting the transport of nitrogen from their catchment areas.

2. Materials and Methods

2.1. Characteristics of the Object under Study

Lake Symsar is the last hydrographic element of a fluvio-lacustrine system consisting of a chain of four water bodies along the Symsarna River. The Symsarna River and Lake Symsar are located in the Olsztyn Lakeland (in Northeastern Poland). The Symsarna River is a watercourse of the third order which enters the Łyna River at the town of Lidzbark Warmiński. It collects water from a catchment area of 129.1 km2 and supplies Lake Symsar (water table area of 1.35 km2, a maximum depth of 9.1 m, and an average depth of 4.9 m) from the south, with 305 × 106 m3 water per year. Moreover, Lake Symsar is fed by three minor watercourses with both agricultural and forest-and-agricultural catchments (Figure 1). A drainage ditch known as Tolknicka Struga with an agriculturally used catchment (19.3 km2) feeds the lake from the east. This watercourse is supplied with domestic wastewater from a residential area in the village of Klutajny (until July 2014, the wastewater was only mechanically treated, and since July 2014, it has been both mechanically and biologically treated). Two smaller watercourses outflowing from forest-and-agricultural areas flow into the lake from the west: Stream I which has a catchment area of 2.8 km2 and Stream II which has a catchment area of 1.41 km2. The Symsarna River, which has a catchment basin area that is 100 times as big as the area covered by Lake Symsar, is dominated by agriculture. The direct drainage area of the lake (with an area of 2.2 km2) is characterised by distinct land relief, with height differences of up to 30 m that were inherited after the Baltic glaciation (ca. 10 Ka years ago). In the vicinity of Lake Symsar, the dominant geological formations mainly include glaciofluvial sands and gravels to the west of the lake (inter alia near the catchment basin of Stream I, and near the Symsarna River outlet from the lake, Figure 2).
The entire fluvio-lacustrine system is incised between morainic hills along a glacial channel. In spite of the dominance of agricultural and forest areas in the lake drainage area, it is worth noticing that the lake is of special interest to tourists due to its natural and cultural value.
To the north-west of the lake, and within the majority of the Tolknicka Struga catchment basin, boulder clays are found. In turn, the catchment basin of Stream II, and partially, the upper part of the Tolknicka Struga catchment basin, are characterised by the occurrence of sands with the addition of gravel and boulder clay (Figure 2). To the west of the water body, mainly proper brown soils and leached brown soils with medium permeability formed from loamy sands and dusts are found. Near the Symsarna River tributary and the Tolknicka Struga outlet to the lake, soils with very low permeability occur. To the east of the water body, near the Symsarna River outlet and near Stream II, sandy soils and leached brown soils formed from loamy sands and dusts are present. In the immediate drainage area of the lake, hummocky drifts as forms of glacial accumulation erosion are dominant, while in the catchment basin of the Symsarna River, near Lake Luterskie and Blanki, end moraine ramparts are found [15].

2.2. Methodology of Research

The study was carried out from November 2012 to October 2014, i.e., in hydrological years 2013 and 2014, during the growing season (from April to October) and outside the growing season (from November to March). The meteorological conditions in this period are described in detail in a publication by Kuriata-Potasznik and Szymczyk [16].
During the period concerned, representative samples of surface water were collected on a monthly basis. The sites of collection were in the lake (middle), in the bay of the lake (out of the track of the Symsarna River), in the inflow of the Symsarna River to the lake, in the outflow of the Symsarna River from the lake, in the Tolknicka Struga drainage ditch (mixed with wastewaters), and in Stream I and Stream II. Samples were taken from a depth of about 1 m below the surface of the water in 5 dm3 polyethylene containers, and after stabilisation, were transported to the laboratory of the Department of Water Resources, Climatology and Environmental Management at the University of Warmia and Mazury in Olsztyn, Poland. The following analyses were carried out:
AnalysesMethodology
Nitrate nitrogen (NO2)colorimetric method with sulfanilic acid
Nitrate nitrogen (NO3)colorimetric method with phenyl-sulfanilic acid
Ammonia nitrogen (NH4)Nessler method
Kjeldahl nitrogen (Nkjeldahl)Kjeldahl method
The concentration of mineral nitrogen (TIN) was calculated as the total of nitrate and nitrite nitrogen and ammonia nitrogen. The concentration of organic nitrogen (TON) was calculated as the difference between Kjeldahl nitrogen and ammonia nitrogen. In turn, the total nitrogen (TN) concentration was calculated as the sum of mineral and organic nitrogen.
In addition, measurements of physical indicators, i.e., conductivity (µS·cm−1), total dissolved substances (TDS, mg·dm−3), salinity (mg·dm−3), oxygen levels (mg·dm−3), and pH, were carried out using a YSI 556 multiprobe system directly in the field.
During water sampling, measurements of the water flow were carried out using an electromagnetic flow velocity sensor (Valeport, Totnes, UK). Water flow was calculated as the product of the water flow rate and the cross-sectional area of the trough of the watercourse under study. Detailed characteristics of the water flow rate and specific runoffs from the catchment unit area are presented in a publication by Potasznik and Szymczyk [17].
The load input and output to/from the Symsar lake was calculated as the product of the concentration of a particular nitrogen form and the water flow [18].
The Vollenweider model [5] assumed the occurrence of interactions between the permitted and the critical phosphorus loads, taking into account the morphometry and hydrology of the water body. The same interactions were observed by Bajkiewicz-Grabowska [19] in nitrogen loads case. This provided a basis for the OECD model. A hydrological model of loading with permitted and critical loads, in accordance with Vollenweider [5], was applied. When selecting the model, the volume of water exchange within a year, ranging from 30 to 200%, was taken into account [5]. The model for which the values of calculated loads were higher was selected:
P e r m i t t e d   l o a d ( N ) = 150 × q s ( 1 + z q s ) ,
C r i t i c a l   l o a d ( N ) = 300 × q s ( 1 + z q s ) ,
  • Permitted load (N) (mg·m−2)
  • Critical load (N) (mg·m−2)
  • qs—hydraulic load of lake: qs = Qt × Aj−1 (m3·m−2·year−1)
  • Qt—annual outflow of water from the lake (m3·year−1), Qt = Vr × 31,536,000
  • Vr—average outflow of water from the lake (m3·s−1)
  • Aj—lake’s surface area (m2)
  • Z—mean lake depth (m)

2.3. Statistical Analysis

Statistically significant differences between the nitrogen concentrations in different surface waters were calculated using a non-parametric analysis of variance, i.e., the Kruskal–Wallis test (p < 0.001) followed by the Dunn’s test as a post-hoc procedure. The correlations between the nitrogen concentration and the physical properties of the surface waters were calculated using Spearman′s rank correlation analysis. The above-mentioned analyses were carried out using the Statistica 13.1 package (StatSoft, Dell Inc., Round Rock, TX, USA).
To identify the environmental factors that contribute to the nitrogen concentration in the surface waters of the system under study, a multivariate statistical analysis, i.e., the principal component analysis (PCA) using Canoco 4.5 software [20], was applied. The principal component analysis was carried out based on the results of nitrogen concentrations in the surface waters and their physical properties (altogether twelve variables): NO2, NO3, NH4, NKjeldahl, TIN, TON, TN, salinity, TDS, electrolytic conductivity, pH, oxygen, and five environmental factors. In regard to the environmental factors, the following explanatory variables were taken into account: the location of the surface water (Symsarna River inflow, outflow, Tolknicka Struga, Stream I, Stream II, lake water, lake bay water), season (divided into the growing season and the non-growing season), monthly sum of precipitation, average monthly air temperature, and average monthly water flow of streams.

3. Results

The highest total nitrogen concentration in the surface water was observed in the water of the drainage ditch (the Tolknicka Struga); the average value in the period under study was 5.22 mg·dm−3 (Table 1). In the waters of other watercourses during the growing season, organic nitrogen was dominant. It was observed in high concentrations in the waters of Forest Stream II; they were 85.0% higher than the concentrations in the waters of other watercourses (Table 1).
The results of the Kruskal–Wallis test revealed a statistically significant difference between the nitrogen concentration between the various researched surface waters (Table 1). In regard to mineral nitrogen, a highly statistically significant difference between the groups of variables was demonstrated in the nitrogen concentrations in all tributaries under study (p < 0.001), similar to in the case of total nitrogen. The results of Dunn’s test indicate that the significant differences in nitrogen concentration were noted between the water of Tolknicka Struga and the waters of the Symsarna River flowing into the lake, the Symsarna River outflow, the bay, Stream I, and the lake itself (p < 0.001 in all cases). The waters of that watercourse were characterised by concentrations 7.5 times higher than the waters of other watercourses in the period under study. In other surface waters, the concentration ranged from 0.32 to 0.62 mg·dm−3. In regard to organic nitrogen, statistically significant differences (p < 0.01) were observed for the water of the Tolknicka Struga watercourse and Forest Stream I. In the water of Stream I, the concentration of that form was more than three times lower than in other surface waters and five times lower than in the water of Tolknicka Struga, due the fact that a forest is located in the catchment area of these streams. As for the total nitrogen concentration, the results of the Dunn’s test also showed a statistically significant difference between the concentration in the water of Tolknicka Struga and in the other watercourses. This concentration was three times higher than in other surface waters, due the fact that inadequately cleaned wastewater has been introduced into this stream. In the waters of the Symsarna River flowing into the lake, the mean total nitrogen concentration was 1.63 mg·dm−3 in 2013 and 1.61 mg·dm−3 in 2014 (Table 1). At the outflow of the lake, the Symsarna River showed an increase in TN concentration by a mean of 9.8%, mainly due to the increase in the organic N form (by 7.1%).
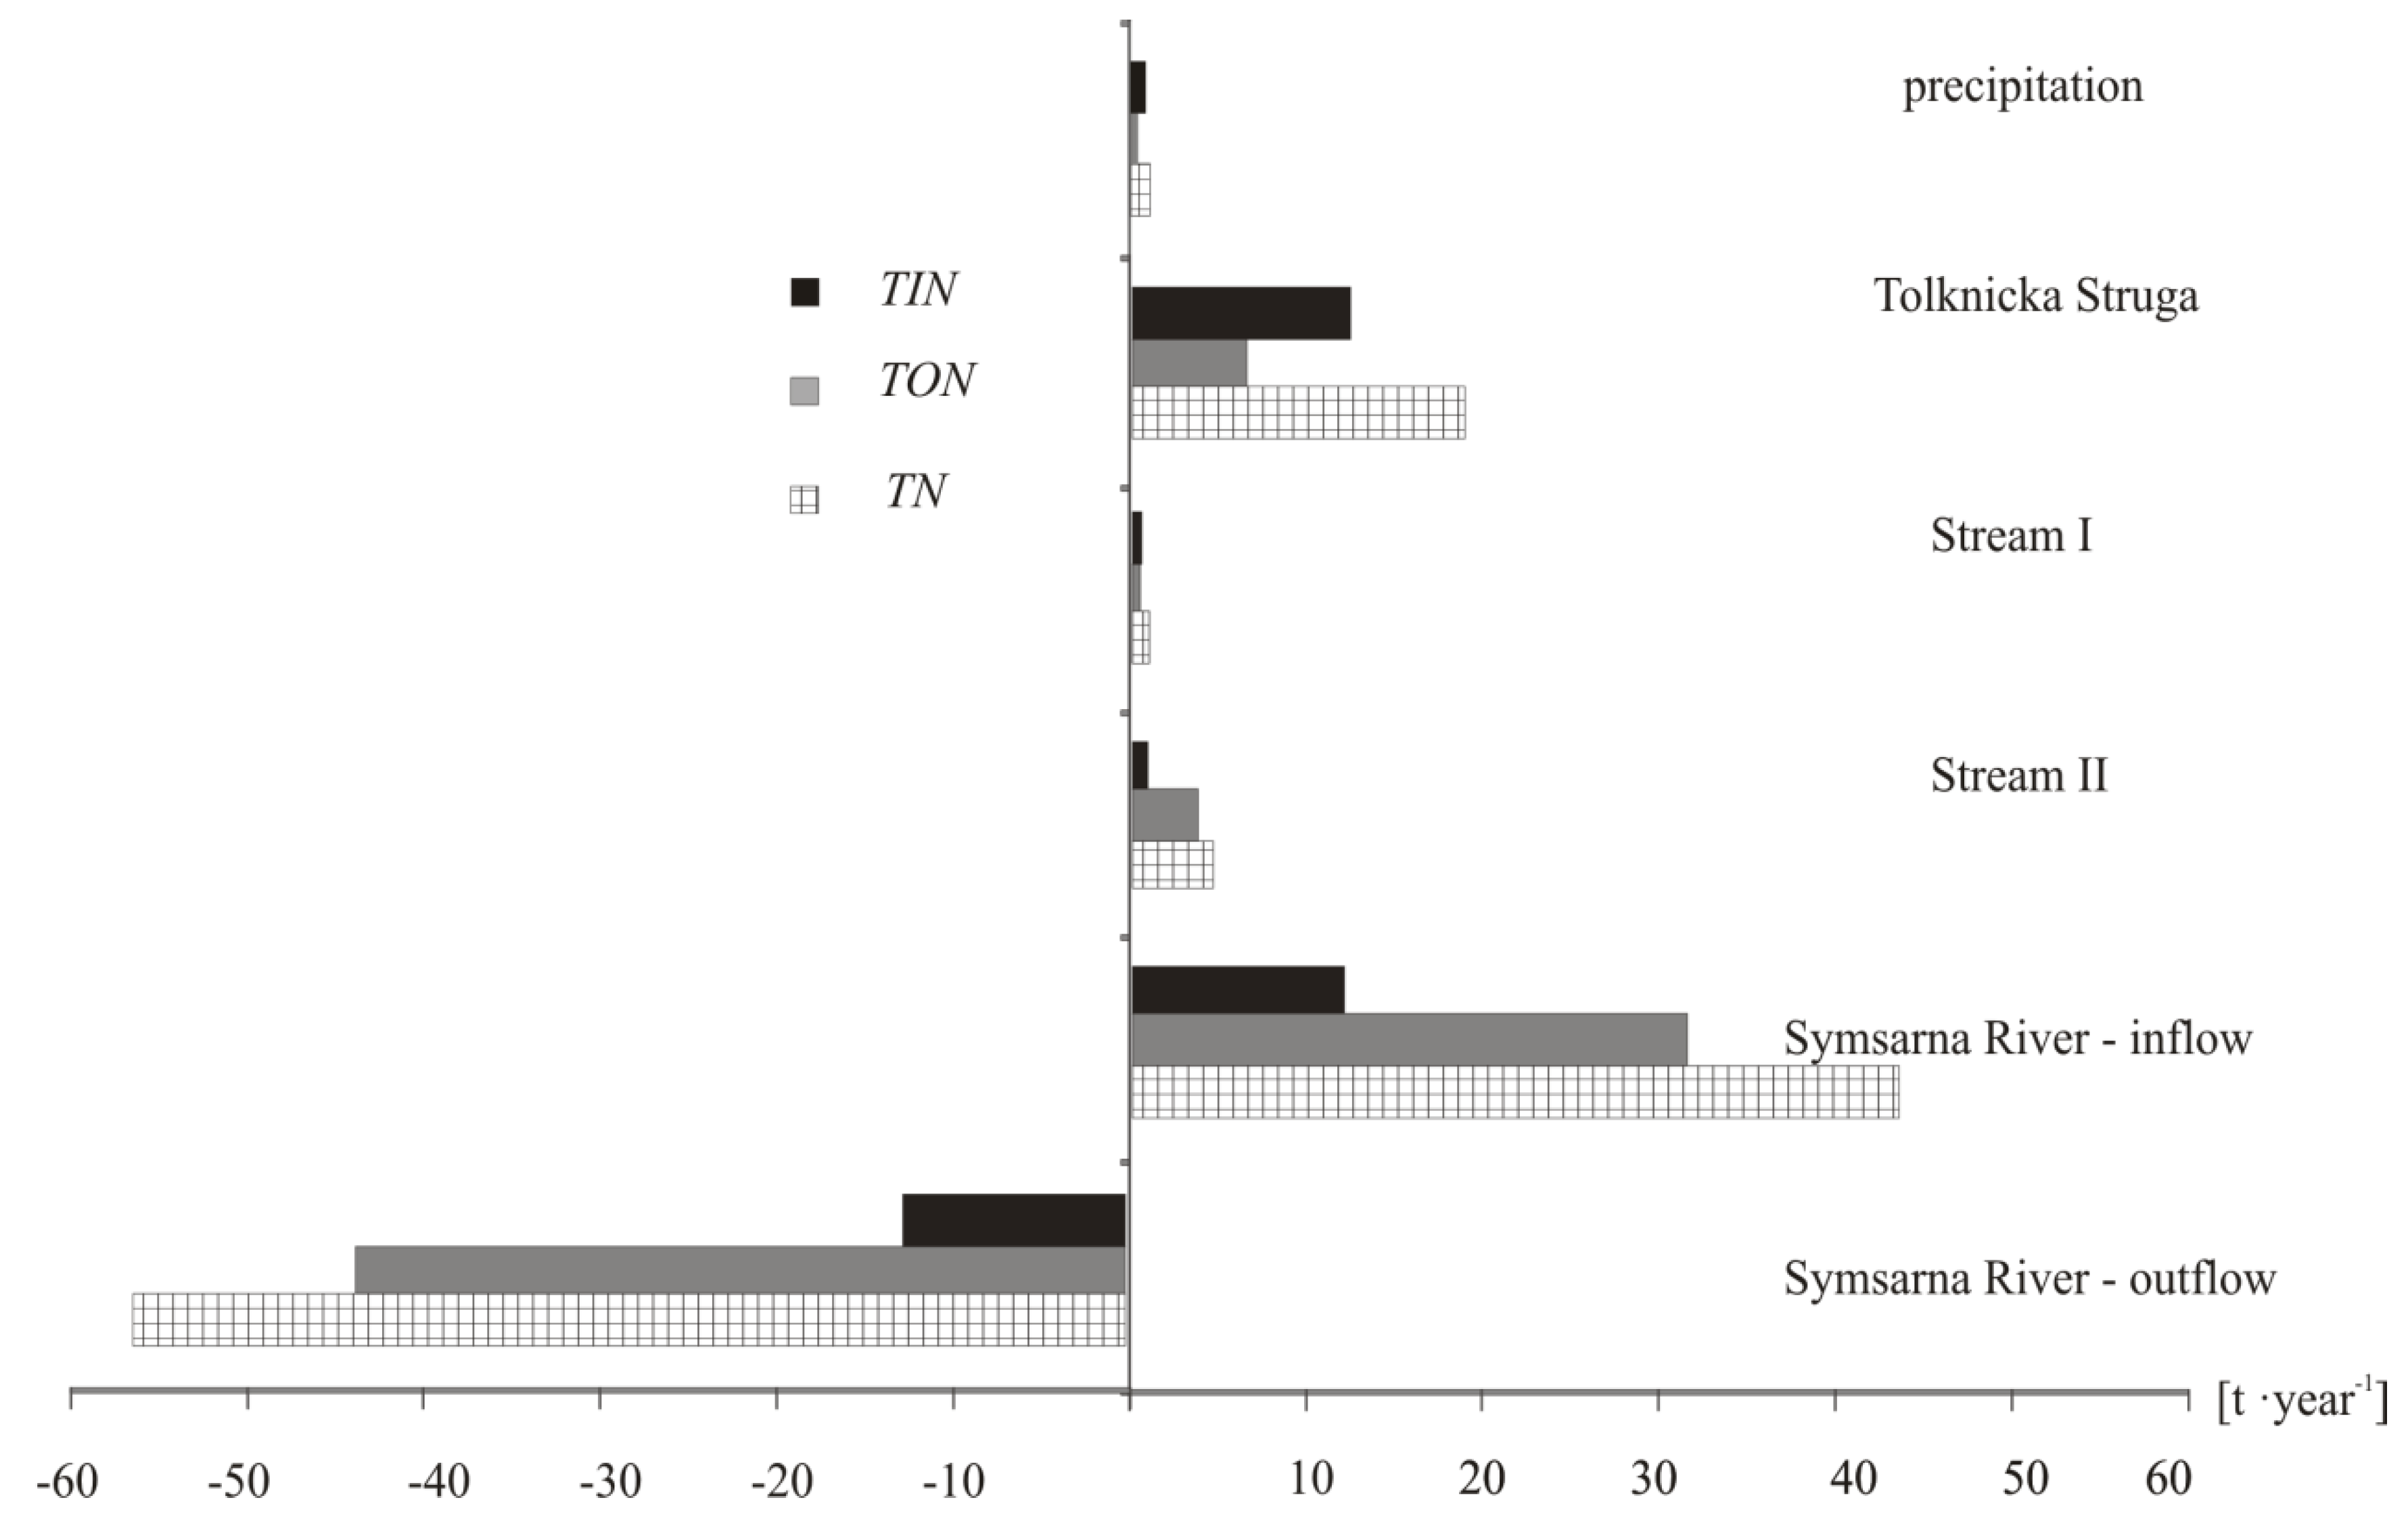
On average, 60.4 t·year−1 of TN was introduced to Lake Symsar (through surface inflows and atmospheric precipitation) and 57.9 t·year−1 flowed out (only in the Symsarna River). This means that the difference in the total nitrogen load, amounting to 2.5 t·year−1, remained in the water body in a form suspended within the water depths, deposited on the bottom, or assimilated by macrophytes. Mainly organic nitrogen was introduced into the water body (42.0 t·year−1 flows into it), of which the precipitation accounted for less than 1% of the total loading volume. However, it was not deposited in the water body, which is indicated by the greater load of this form flowing out of the Symsarna River (more by 1.2 tonnes more than the introduced volume, i.e., 2.8% of the total introduced load, Figure 3). The mineral nitrogen load accounted for 43.5% of the total load introduced into the water body (of which the precipitation accounted for 2.3% of the total introduced load).
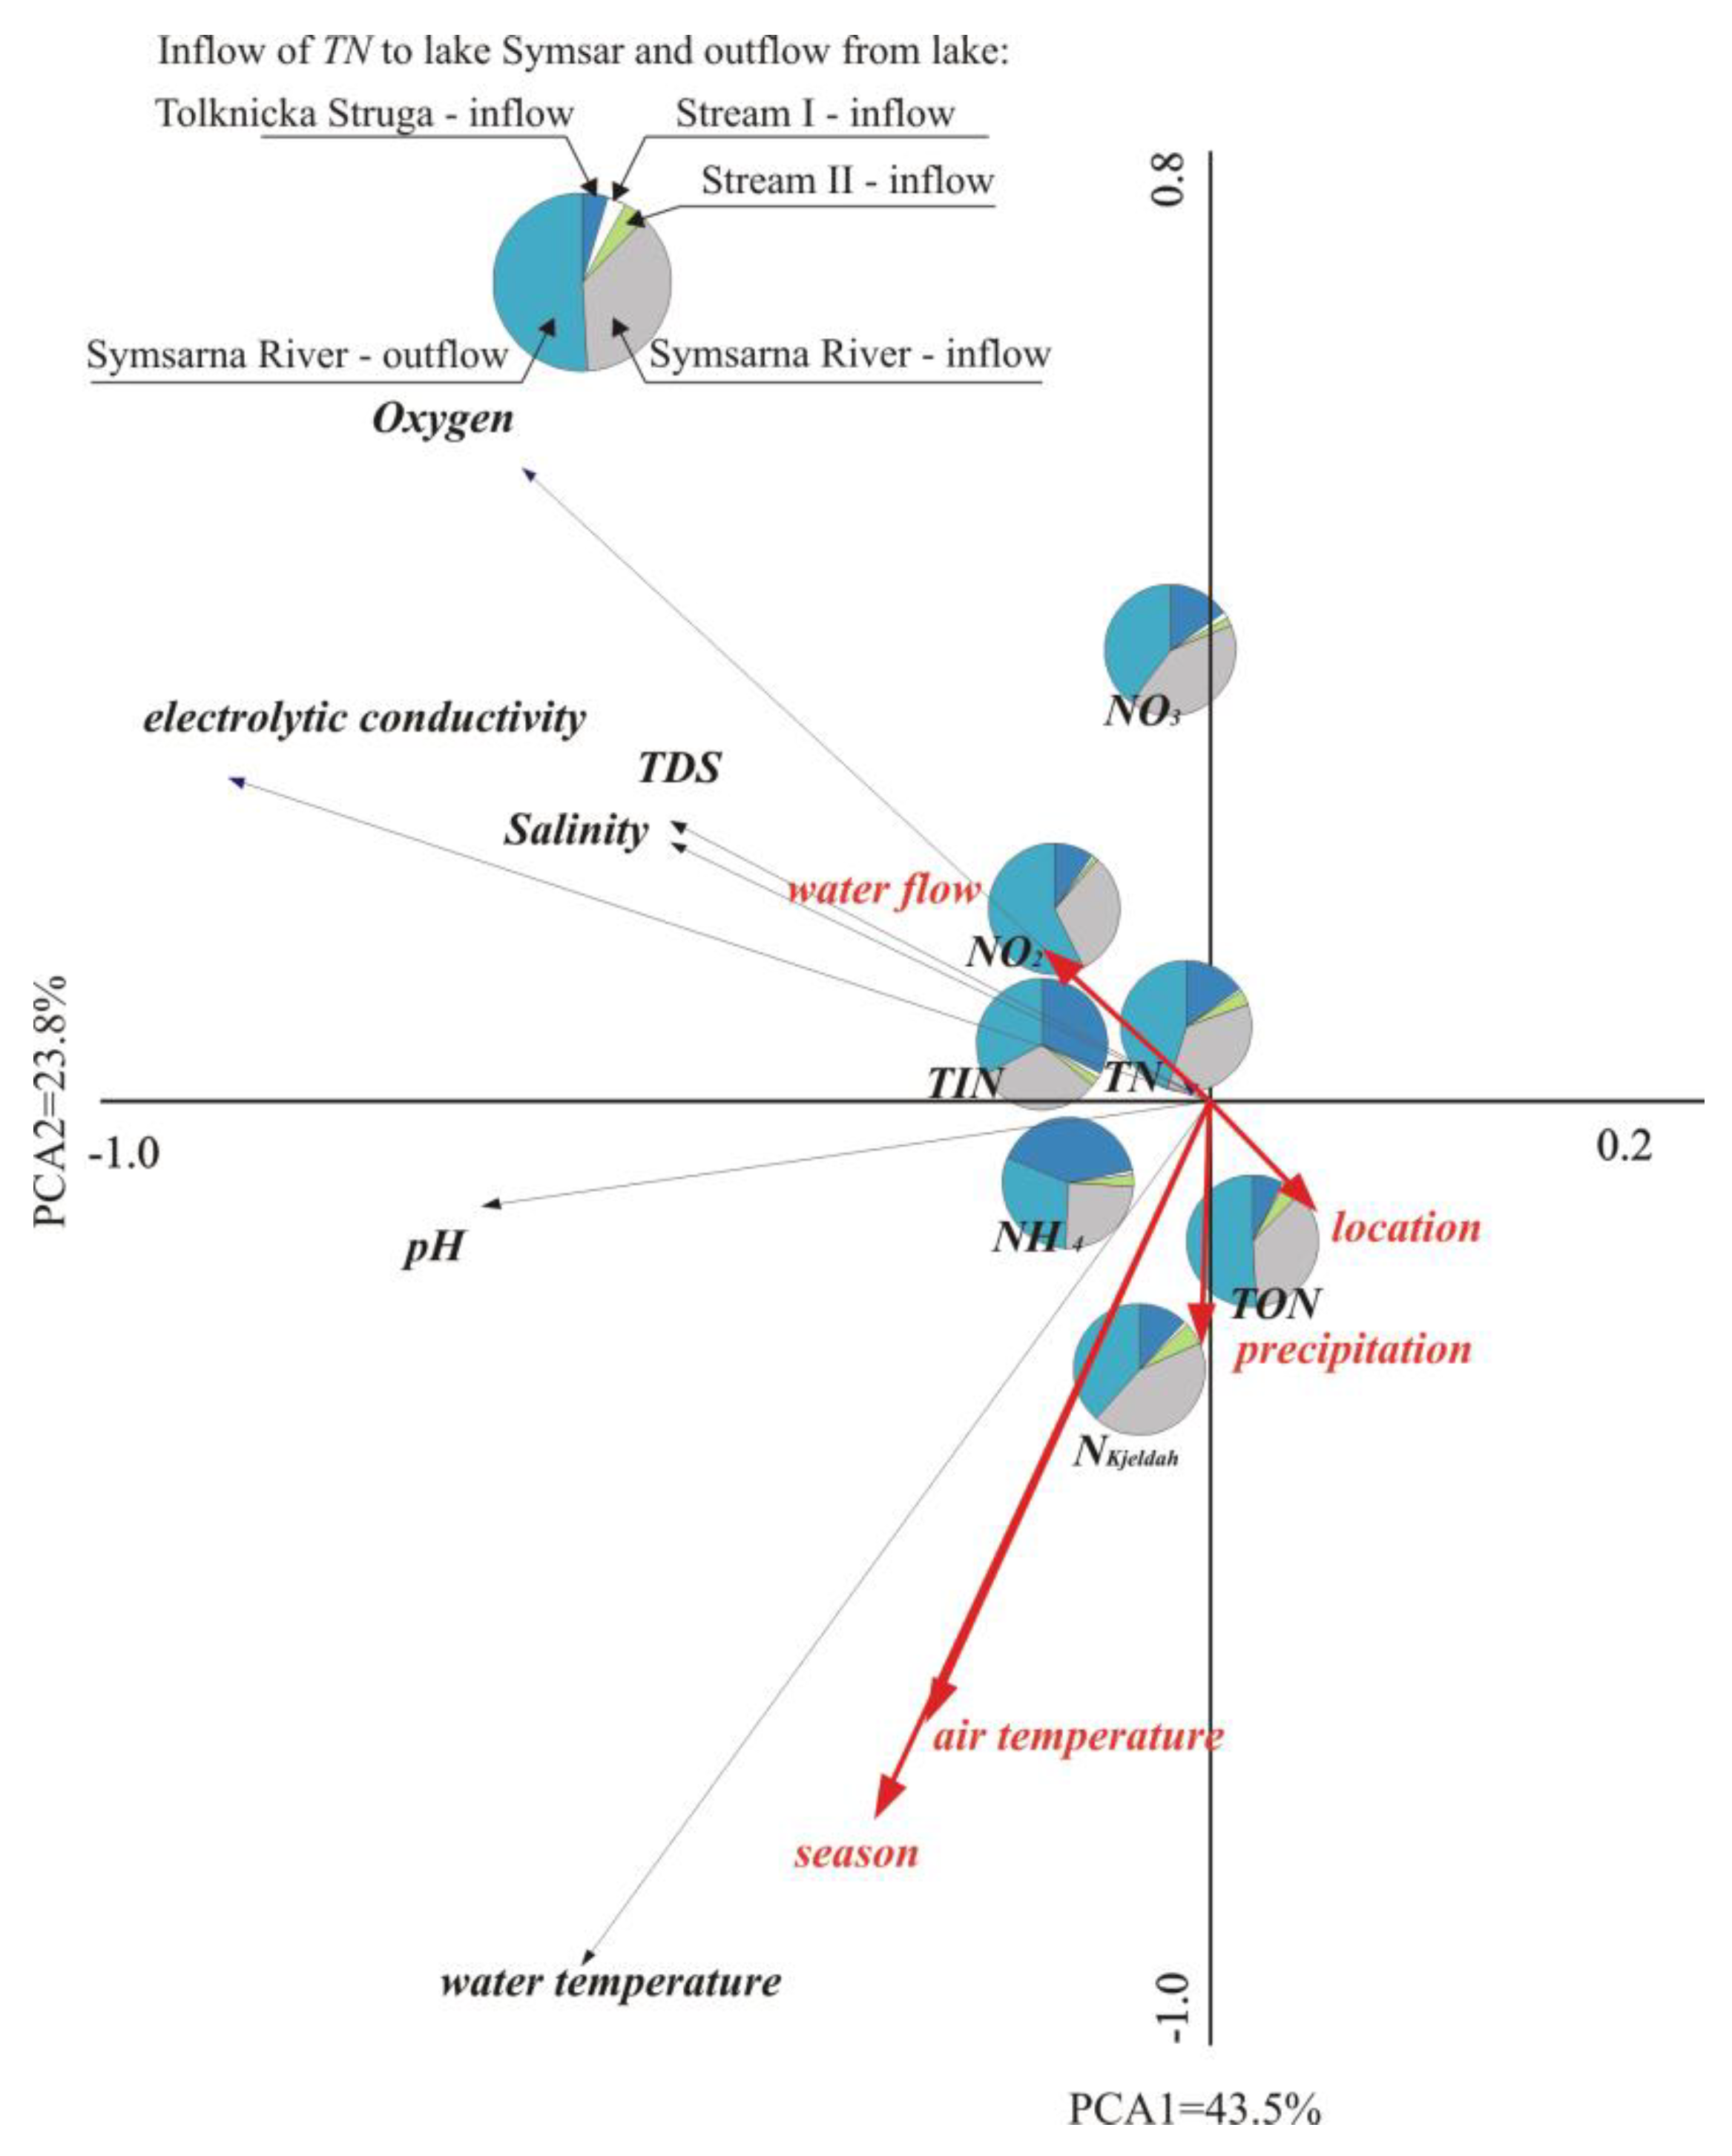
The two analysed PCA axes explain 67.3% of the variability in the nitrogen concentration and physical properties under study in relation to environmental factors such as the location of surface water (i.e., inflow, outflow and two sites in the reservoir), season (growing season and non-growing), monthly sum of precipitation, average monthly air temperature, and average monthly stream water flow. The first axis (PCA1) was shown to be closely correlated with the environmental data, especially with the meteorological conditions, while the second axis (PCA2) showed a relatively lower level of correlation (23.8%, Table 2).
Based on the principal component analysis (PCA), a negative correlation was observed between the concentrations of NO2, NO3, and NH4 (mineral forms) and the precipitation. The highest concentrations of mineral nitrogen were observed during rainfall shortages, and the lowest (by 2%) when the water level was higher, which resulted from the dilution of components in the surface water (Figure 4). A proportional increase in the total nitrogen concentration was observed with an increase in the monthly sum of precipitation. The highest content (by 1.2% from the average) was observed when the sum was 40–50 mm per month. Based on the results of Kuriata-Potasznik et al. [16], an analysis of particular years indicated that in 2013, the content was higher due to the higher total precipitation and higher water levels in the rivers supplying more components to the water body. Additionally, based on Spearman′s rank correlation analysis (Table 3), statistically significant correlations between these nitrogen forms in surface water and the air temperature, and also, the intensity of water flow, were observed (respectively r = −0.449 oraz r = −0.343). The highest concentrations of this form (by 1.9% compared to the average in the test period) were observed when the air temperature was lower than 0 °C, which may have resulted from the inhibition of the development of rush vegetation, and also from the assimilation of mineral nitrogen forms by these plants. In turn, a lower (by 1.7% compared to the average) concentration was recorded when the air temperature exceeded 15 °C. Higher concentrations (by 1.9%) were observed when the air temperature was 15 °C, and this was dependent on the mineralization process. A TIN concentration that was as much as 30% higher and a 53% higher TN concentration were observed when the water flow was under 2000 dm3·s−1. In the waters of the Symsarna River above and below Lake Symsar, similar concentrations of NO3 were noted (0.31–0.32 mg·dm−3). In turn, after crossing the lake, in a section of the river below the water body, an increase in concentration of NO2 by 44.1% was noted, which may indicate the occurrence of a denitrification process (the reduction of NO3 to NO2, and then to nitrogen oxides and free nitrogen [Figure 4]). In addition, a positive correlation was observed between the contents of organic nitrogen forms under study and the locations of surface waters, i.e., between inflows. This results from the differences in concentrations between the waters of Tolknicka Struga and other watercourses, which was confirmed by the Kruskal–Wallis analysis results (p < 0.001). The concentrations were higher than in waters of other streams by 65%. Based on the Spearman’s rank correlation analysis, statistically positive significant correlations between the organic nitrogen content and the air temperature and water flow were observed (respectively, r = 0.250 and r = 0.212, Table 3). With an increase in the surface water flow rate in the watercourses, the concentration of the tested organic nitrogen forms increased (by 17.3%).
The results of the Kruskal–Wallis test revealed a similar relationship and a highly statistically significant difference (p < 0.001) between the concentrations of particular nitrogen forms and the growing season. During the growing season, mineral nitrogen concentrations 1.4% higher than those outside the growing season were noted. This may have resulted from higher concentrations of nitrate nitrogen in the waters of Tolknicka Struga, particularly in the summer season, due to the inflow of wastewater from an inefficiently operating wastewater treatment plant. Moreover, a correlation was also observed between the oxygen content, electrolytic conductivity, salinity and total dissolved substances, and the intensity of water flow in streams (Table 3).
The calculated permitted loading for Lake Symsar in hydrological years 2013/2014 amounted to 11.55 grams per 1 m2 of the water body surface, while critical loading amounted to 23.10 g·m−2. The actual loading of the water body with nitrogen was almost four times greater than the permitted loading and over two times greater than the critical loading (Table 4).

4. Discussion

This study investigated the response to the question about the role of lakes as elements of fluvio-lacustrine systems in limiting the transport of nitrogen from their catchment area. Our research indicated that young lakes of fluvio-lacustrine systems, due their properties, play an accumulative role and they are natural biogeochemical barriers in the environment. The loading of the aquatic ecosystem under study resulted from the agricultural management of its drainage area, which was related to area-wide runoffs and non-organised water and wastewater management in the immediate vicinity of the water body. In the example of Lake Symsar, it was demonstrated that the loading of nitrogen from the catchment area can contribute to an excessive level of loading, even several times greater than the critical load. The research indicated a relationship between the charge of load introduced to the reservoir and its role.
Water bodies serve various functions, including transport and accumulation. These functions are determined by morphometric conditions and the volumes of nutrient loads introduced into the water body, which frequently exceed the critical values [21]. Lakes tend to accumulate substances, while rivers rather serve a transport function [22]. Huang et al. [23] stated that reservoirs located on the tracks of rivers could disrupt mutual river–lake relationships, because the lake blocks their flow. A publication by Saunders and Kalff [1] made an attempt to determine which aquatic ecosystems retain nitrogen most effectively. The summary of their results is as follows: wetlands > lakes > rivers. Nitrogen retention in wetlands is twice as high as in lakes—wetlands retain ca. 64% of the total cargo, compared to 34% in lakes and 2% in rivers [24]. It appears that the assimilation process depends on whether the retention occurs for a sufficiently long time (on a long-term basis) or only seasonally, because it later provides a basis for predicting the risk to aquatic ecosystems. The smaller the outflow is, the more opportunities there are for a nutrient to contact deposits and macrophytes where their interactions take place. Thus, the presence of aquatic plants, as well as the layout and morphology of a water body, prolong the retention time, while macrophytes provide good conditions for the sedimentation and denitrification process [1]. The water retention time in the reservoir is a very important factor, because it affects the nitrogen dynamics and removal process; thus, it shapes the role of the river–lake system. Lake productivity is dependent on the inorganic and organic biogeochemical nitrogen cycle. A slight imbalance, like that caused by excessive loading, could cause drastic changes, leading to degradation [25,26]. According to Tong et al. [27], the water retention time in lake and river systems affects the concentration of nitrogen in the water. This relationship is inversely proportional: the longer the residence time, the smaller the increase in the total nitrogen concentration in the water. This dependence is explained by these authors as beginning due to the influence of the lake’s bottom sediments which act as a trap. In addition, in the studies of the mentioned authors, [27] showed that the concentration of total nitrogen decreased in the waters of most of the flow reservoirs whose half-life was less than 20 years. Therefore, for lakes of river–lake systems whose residence time is below one year, this biogen should be quickly removed from the reservoir. In the case of Lake Symsar, the residence time was only 66 days [16], and despite this, the lake’s degradation progressed. One square meter of the lake′s surface contained 46.9 g of nitrogen. Lake Poyang was shown to have a slightly longer (about only 23 days longer) period of water retention. According to the authors [28], the duration of this period depends on the flow of the incoming river, and the inflow from the catchment is less important, although the total catchment of the Chinese lake is over 1000 times larger than the Symsar Lake catchment. The Babięty Małe and Tejsowe Lakes belonging to the river–lake system of the Babant River are characterized by water retention times of 97 and 26 days, respectively. This system, like the Symsarna River and Lake Symsar system, has an accumulation function in the case of nitrogen [29]. The authors also indicated a significant relationship between seasonal variation in nitrogen concentration and the respective hydrological properties of the studied systems of the lakes. They found that the surface of the reservoir should not affect the increase in nitrogen concentration in the water. However, their location already has meaning. Low lake locations were characterized by a greater susceptibility to seasonal variation in nutrient concentrations, as they are often located in regions where they are exposed to anthropogenic factors [27]. In the case of the studied lake, the variability could have resulted not only from the locations of recreational facilities near the shoreline, but also from the location of the reservoir as the last in the track of the tested river–lake system. This is because the river flowing through the reservoirs on its track can accumulate, and also matter can be picked up from the bottom and transported to the last reservoir. In this study, after crossing the lake, an increase of 44.1% was also observed in the concentration of NO2, which may indicate the occurrence of the denitrification process (the reduction of NO3 to NO2, and finally, to free nitrogen). An important factor in the formation of nutrient variability in water is the depth and volume of water due to the dilution of components in larger volumes of water [27].
This paper indicates that, in addition to horizontal exchange in the temperate climate zone, meteorological conditions also significantly influence the nitrogen content in fluvio-lacustrine systems. As examples, the influences of air temperature, flow rate, and precipitation were tested. The research showed that in the lakes of river–lake systems, the impact of precipitation loading has an intermediate meaning, although the loading introduced to lakes as elements of a system with precipitation constituted less than 1%. However, the results of the PCA indicated that the nitrogen content in water was correlated with the precipitation. It is expected that an increase in the monthly rainfall would result in an increased total nitrogen concentration, but not because the component is supplied in this way. Rather, because intense precipitation results in an increase in the water level and the river flow [30], and it also results in the leaching of components from the catchment area [31]. The low water states in the lake and in the stream bed are the cause of the accumulation of nitrate nitrogen in water [32]. Hillbricht-Ilkowska and Kostrzewska-Szlakowska [14] concluded that at low water levels, the concentrations of nitrate nitrogen are diluted along the river course. Sinsha et al. [32] predicted that an increase in precipitation would increase the nitrogen load. The increase in air temperature also had an impact on the presence of organic nitrogen in water, but this was not as important as other environmental factors. In general, it can be concluded that as the temperature increases, the concentration of nitrogen in water decreases. The concentrations of nitrogen in the waters of lakes in river–lake systems in the vegetation season were lower, and the mineral form of nitrogen was predominant in most tested streams. The exception was water of streams to which nutrients were flowing in wastewater—this water was shown to contain three-fold higher concentrations than other waters. Some forms of nitrogen can be emitted and assimilated in water and are dependent on differences in TN loading. In a study by Kneis et al. [33], the greatest nitrogen losses in water were observed in the spring when the vegetation started to grow, which was explained by the domination of diatoms in the spring and early summer. In a natural aquatic environment during a period of increased growth of living organisms, i.e., during spring and summer, the mineral form will be captured by these organisms and assimilated in their tissues. The changes in nitrogen concentration in research by Buhvestova et al. [34] had sinusoidal characteristics, which were related to the intense flow—high concentrations in summer and low concentrations in winter, when they were more diluted due to the higher water level. Hence, an increase in the organic form should have been observed, as was the case for surface waters of the tributaries of the water body under study. However, the load was mainly in the form of ammonia nitrogen, which was introduced to the water of the watercourse from an inefficiently operating wastewater treatment plant servicing a residential community. This may have caused the excessive mineral nitrogen load. The research by Hillbricht-Ilkowska and Kostrzewska-Szlakowska [22] showed that the increase in phosphorus in a river was the result of an increase in coastal erosion—especially when this process was observed during spring thaw. The total phosphorus concentration in the outlet also demonstrated that the presence of macrophytes in the water body promotes the uptake of nutrients, thereby reducing their forms, which indicates that a fluvio-lacustrine system may be a nutrient trap which reduces transport and eliminates pollutants from the system [35].
The main source of nitrogen in the lakes of the fluvio-lacustrine system is horizontal exchange, namely, the loading of surface waters flowing into the water body, with the nitrogen load originating from wastewater and area-wide runoffs from agricultural and recreational areas. The load was mainly introduced in the main river waters, which accounted for approximately 64% of the total load (43.4 tonnes), but also in the waters of Tolknicka Struga (27.8%, 18.8 tonnes), which is supplied with wastewater. Research by Buhvestova et al. [34] also confirmed that the main source of nitrogen in lakes of fluvio-lacustrine systems is horizontal exchange. Estonian rivers exported approximately 4–8 kg TN·ha−1·year−1 to the Lake Peipsu. The amount exported to the lake per 1 ha area of reservoir was up to 50 times higher. When the load introduced into a water body is small, nutrients are released from deposits through the process of internal supply. Although the lakes of the Babant River accumulate nitrogen, phosphorus is transported outside the system, which the authors explained by the internal enrichment of this component [29]. In catchments dominated by anthropogenic activity, nitrogen in the ammonium form dominates; its source is mainly wastewater [36]. In fluvio-lacustrine systems, it is very important to predict the system’s response to increased nutrient loading [1]. Therefore, a response to loading that exceeds the permitted load by four-fold and the hazard load by two-fold can cause the degradation of the last lake in the fluvio-lacustrine system, like this example lake. As for the lake’s surface, the load significantly exceeded the value of 10 g TN per 1 m2 of the lake surface. It appears that the functions of water bodies within a fluvio-lacustrine system may result from the difference between the incoming and outgoing loads. When the load introduced into a water body is greater than that flowing out, nutrients may be deposited in bottom deposits. This is contributed to by the morphometric conditions of the water bodies, inter alia, shallow depths. Bogdanowicz [37] is of the opinion that hydrological and morphometric conditions affect the volume of the load transported by littoral rivers, so the accumulation could be correlated with the water flow rate [4,38]. This author came to a similar statement in earlier studies [17], namely, that the nitrogen mainly accumulates in deposits located on the track of a river flowing across a lake—especially in the littoral zone. It is determined by the volume of water inflow and runoff; therefore, it is actually determined by meteorological conditions. The contact zone between the lake and the tributary is a barrier in which the incoming matter is accumulated and transformed. The volume of the actual load significantly exceeds the volume of a critical load, based on which Lake Symsar can be included in the third risk category [18], as evidenced by the positive balance of phosphorus, calcium, and magnesium in the studies of Potasznik et al. [39] and Potasznik and Szymczyk [40]. An actual load of over 1 g also classifies the water body as being under risk, and the water body under study exceeded 7 g per 1 m3 of the lake volume [18].
Therefore, it was demonstrated that the water body serves an accumulation role, contributing to the limitation of the removal of components outside the drainage area; unfortunately, as a consequence, rapid eutrophication of the water body occurs, which is indicated by the volume exceeding the critical load. In the lake tested in this research, 2.5 t·year−1 total nitrogen was intercepted, at various water depths, in bottom sediments, or in macrophytes. This lake, similarly to those investigated by Czerniawski et al. [41] (Lake Dominikowo), is a sedimentary basin for organic matter and plays a very important role in the self-cleaning of water flowing through the system. The lake studied by this author is also preceded by two deeper reservoirs. In the outflow of the Drawa River behind the lake, the concentrations were shown to be only slightly elevated. Similarly, in the case of Lake Symsar, the concentration in the outflow increased by just 14%. Previous research [39] noted a reduction in the organic and mineral forms of phosphorus during the crossing of the lake as a result of the assimilation by aquatic vegetation and plankton—the concentration below the lake was 27.8% lower. After crossing the lake, a 1.3% decrease in the concentration of mineral nitrogen was also observed.
The elimination of a load introduced with wastewater through the organisation of water and wastewater management would result in a negative load value, as a greater load would be removed from the water body. The role of the water body would fundamentally change from accumulation to transport. At higher loadings, the excessive load is deposited on the bottom, which is promoted by morphometric, hydrological, and meteorological conditions.

5. Conclusions

In this work, we attempted to show that the specific properties of reservoirs located in river–lake systems contribute to adequate reactions of these reservoirs to situations of an excessive pollution load. In this research, it was shown that the young post-glacial reservoirs of river–lake systems are characterized by fairly rapid water exchange, but nevertheless fulfil the accumulation function. The role of the lakes depends on the morphometric conditions, the location of the water body in the system, or the meteorological conditions. The latter exert an indirect influence because they influence the hydrological conditions of the system; among other factors, intensive rainfall regulates the flow rate or water level. A relationship was demonstrated between the volume of a load introduced to a water body and its role—the volume of a load introduced to a water body is inversely proportional to the volume of the load released from its bottom. The last water body of the fluvio-lacustrine system was characterised by an actual loading more than two times greater than that indicated by the calculated critical loading. The loading of the aquatic ecosystem under study resulted from the agricultural management of its drainage area, which was related to area-wide runoffs and non-organised water and wastewater management in the immediate vicinity of the water body. After the elimination of the load introduced with treated domestic wastewater, the role of the water body could change, as the transport function would then be dominant, and the load would be removed from the water body. Since the accumulation role of a lake as an element of a fluvio-lacustrine system limits the removal of loads outside the ecosystem, the water body of the system plays a role as a natural biogeochemical barrier—unfortunately, this is accompanied by the degradation of the water body itself. Conscious actions aimed at creating conditions similar to those occurring in river and lake systems may favor the protection of surface water before the last element of the system, because they allow the transport of pollutants to be stopped. What is more, all activities aimed at delaying the outflow of surface waters seem to be reasonable, favoring their retention. Research on the functioning and evolution of lakes in fluvio-lacustrine systems, including the balance of nutrient loads, enables the prediction of future aquatic ecosystem responses and their changes, and allows us to learn about the direction of climate change using modeling tools.

Author Contributions

Author developed the concept of the study, field study design including data collection, performer data analysis and hydrochemical analysis, provided interpretation of data and verified laboratory database, wrote the manuscript and provided funding for editorial support.

Funding

This study was financially supported by the National Scientific Center, Poland, Grant No. 2015/19/N/ST10/01532.

Conflicts of Interest

The author declare no conflict of interest.

References

  1. Saunders, D.I.; Kalff, J. Nitrogen retention in wetlands, lakes and rivers. Hydrobiologia 2001, 443, 205–212. [Google Scholar] [CrossRef]
  2. Kleimeier, C.; Liu, H.; Rezanezhad, F.; Lennartz, B. Nitrate Attenuation in Degraded Peat, Soil-Based Constructed Wetlands. Water 2018, 10, 355. [Google Scholar] [CrossRef]
  3. Lefebvre, S.; Marmonier, P.; Peiry, J.L. Nitrogen Dynamics in rural streams: differences between geomorphologic units. Ann. Limnol. Int. J. Lim. 2006, 42, 43–52. [Google Scholar] [CrossRef]
  4. Jańczak, J.; Niemirycz, E. The role of lakes in inflow of water and biogenic substances in the polish part of the southern Baltic Sea. Oceanol. Hydrobiol. Stud. 2011, 40, 116–123. [Google Scholar] [CrossRef] [Green Version]
  5. Vollenweider, R.A. Advances in Defining Critical Loading Levels for Phosphorus in Lake Eutrophication; Memorie dell’Istituto Italiano di Idrobiologia, Dott. Marco de Marchi Verbania Pallanza: Verbania, Italy, 1976. [Google Scholar]
  6. Wang, L.; Flanagan, D.C.; Wang, Z.; Cherkauer, K.A. Climate Change Impacts on Nutrient Losses of two Watersheds in the Great Lakes Region. Water 2018, 10, 442. [Google Scholar] [CrossRef]
  7. Syn, X.; Bernard-Jannin, L.; Grusson, Y.; Sauvage, S.; Arnold, J.; Srinnasan, R.; Perez, J.M.S. Using SWAT-LUD Model to Estimate the Ifluence Water Exchange and Shallow Aquifer Denitrification on Water and Nitrate Flux. Water 2018, 10, 528. [Google Scholar] [CrossRef]
  8. Knowles, R. Denitrification. Microbiol. Rev. 1982, 46, 43–70. [Google Scholar] [PubMed]
  9. Leoni, B.; Patelli, M.; Soler, V.; Nava, V. Ammonium Transformation in 14 Lakes along a Trophic Gradient. Water 2018, 10, 265. [Google Scholar] [CrossRef]
  10. Uuemaa, E.; Palliser, C.C.; Hughes, A.O.; Tanner, C.C. Natural Headwater Wetlands for Reducing Agricultural Nitrogen Loads. Water 2018, 10, 287. [Google Scholar] [CrossRef]
  11. Li, X.; Huo, Z.; Xu, B. Optimal Allocation Method of Irrigation Water from River and Lake by concidering the Field Water Cycle Process. Water 2017, 9, 911. [Google Scholar] [CrossRef]
  12. Ladwig, R.L.; Futusato, E.; Kirillin, G.; Hinkelmann, R.; Hupfer, M. Climate Change Demands Adoptive Management of Urban Lakes: Model-Based Assessment of Management Scenarios for Lake Tegel (Berlin, Germany). Water 2018, 10, 186. [Google Scholar] [CrossRef]
  13. Alifujiang, Y.; Abuduwaili, J.; Ma, L.; Samat, A.; Groll, M. System Dynamics Modelling of Water Level Variations of Lake. Issyk-Kul, Kyrgyzstan. Water 2017, 9, 989. [Google Scholar] [CrossRef]
  14. Hillbricht-Ilkowska, A.; Kostrzewska-Szlakowska, I. Ocena ładunku i stanu zagrożenia jezior Rzeki Krutyni (Pojezierze Mazurskie) oraz zależność pomiędzy ładunkiem a stężeniem fosforu w jeziorach. In Funkcjonowanie Systemów Rzeczno-Jeziornych w Krajobrazie Pojeziernym: Rzeka Krutynia (Pojezierze Mazurskie); Instytut Ekologi PAN: Dziekanów Leśny, Polska, 1996; ISBN 83-87089-02-8. [Google Scholar]
  15. Stachy, J. Atlas Hydrograficzny Polski. Zestawienie Liczbowo-Opisowe Part 1; IMGW: Warszawa, Polska, 1983. [Google Scholar]
  16. Kuriata-Potasznik, A.B.; Szymczyk, S. Variability of the water availability in a river lake system—A case study of Lake Symsar. J. Water Land Dev. 2016, 31, 87–96. [Google Scholar] [CrossRef]
  17. Potasznik, A.; Szymczyk, S. Does inflow of water river shape the nutrient content of lake sediments? J. Elementol. 2016, 21, 471–484. [Google Scholar] [CrossRef]
  18. Glińska-Lewczuk, K. Effect of land use and lake presence on chemical diversity of the Lyna River system. Pol. J. Environ. Stud. 2006, 15, 259–269. [Google Scholar]
  19. Bajkiewicz-Grabowska, E. Obieg Materii w Systemach Rzeczno-Jeziornych; Uniwersytet Warszawski, Wydział Geografii i Studiów Regionalnych: Warszawa, Polska, 2002. [Google Scholar]
  20. Ter Braak, C.J.F.; Smilauer, P. CANOCO Reference Manual and CanoDraw for Windows User’s Guide: Software for Canonical Community Ordination (version 4.5); Microcomputer Power: Ithaca, NY, USA, 2002. [Google Scholar]
  21. Foy, R.H.; Givvan, J.R. An Evaluation of Nitrogen Sources and Input to Tidal Waters in Northern Ireland. Environment and Heritoga Service; Department of the Environment: Befort, UK, 2004. [Google Scholar]
  22. Hillbricht-Ilkowska, A.; Kostrzewska-Szlakowska, I. Zmienność Stężenia Wybranych Związków Chemicznych Oraz Retencja Fosforu i Azotu w Układzie Rzeczno-Jeziornym Rzeki Krutyni (Pojezierze Mazurskie); Instytut Ekologi PAN: Dziekanów Leśny, Polska, 1996; ISBN 83-87089-02-8. [Google Scholar]
  23. Huang, F.; Wu, Y.; Qien, B.; Guo, L.; Zhao, D.; Ren, L.; Xie, Z. An environment al flow assessment of a River’s bloking effect on a Lake In a River-lake system:aplication In the Yantze-Poyang system. Environ. Monit. Assess. 2018, 190, 453. [Google Scholar] [CrossRef] [PubMed]
  24. Ilnicki, P. Emissions of nitrogen and phosphorus into rivers from agricultural land–selected controversial issues/Ładunki azotu i fosforu wprowadzane do rzek z terenów rolniczych–wybrane dyskusyjne problemy. J. Water Land Dev. 2014, 23, 31–40. [Google Scholar] [CrossRef]
  25. Wetzel, R. Periphyton of Freshwater Ecosystems; Junk BY Published: Hague, The Netherlands, 1983. [Google Scholar]
  26. Bernat, M.J.; Dodds, W.K. Nitrogen retention, removal and saturation in lotic ecosystems. Ecosystems 2005, 8, 44–45. [Google Scholar] [CrossRef]
  27. Tong, Y.; Li, J.; Qi, M.; Zhang, X.; Wang, M.; Liu, X.; Zhang, W.; Wang, X.; Liu, Y.; Lin, Y. Impacts of water residence time on nitrogen budget of lakes and reservoirs. Sci. Total Environ. 2019, 646, 75–83. [Google Scholar] [CrossRef] [PubMed]
  28. Li, Y.; Yao, J. Estimation of transport trajectory and residence time in large river–lake systems: application to Poyang Lake (China) using a combined model approach. Water 2015, 7, 5203–5223. [Google Scholar] [CrossRef]
  29. Kufel, L. Analiza Przemian i Retencji Związków Azotu i Fosforu w Małym Układzie Rzezcno-Jeziornym. In Funkcjonowanie Systemów Rzeczno-Jeziornych w Krajobrazie Pojeziernym: Rzeka Krutynia (Pojezierze Mazurskie); Instytut Ekologi PAN: Dziekanów Leśny, Polska, 1996; ISBN 83-87089-02-8. [Google Scholar]
  30. Marszałek, H.; Górniak, D. Changes in water chemistry along the newly formed High Arctic fluvial–lacustrine system of the Brattegg Valley (SW Spitsbergen, Svalbard). Environ. Earth Sci. 2017, 76, 449. [Google Scholar] [CrossRef]
  31. Glińska-Lewczuk, K.; Gołaś, I.; Koc, J.; Gotkowska-Płachta, A.; Harnisz, M.; Rochwerger, A. The impact of urban areas on the water quality gradient along a lowland river. Environ. Monit. Assess. 2016, 188, 624. [Google Scholar] [CrossRef] [PubMed]
  32. Sinsha, E.; Michalak, A.M.; Balaji, V. Eutrophication will increase during the 21st century as a result of precipitation changes. Science 2017, 357, 405–408. [Google Scholar] [CrossRef] [PubMed]
  33. Kneis, D.; Kroesche, R.; Bronstert, A. Analysis and simulation of nutrient retention and management for a lowland River-lake system. Hydrobiol. Earth Syst. Sci. 2006, 10, 575–588. [Google Scholar] [CrossRef]
  34. Buhvestova, O.; Kangur, K.; Haldna, M.; Möls, T. Nitrogen and phosphorus in Estonian rivers discharging into Lake Peipsi: estimation of loads and seasonal and spatial distribution of concentrations. Est. J. Ecol. 2011, 60, 18. [Google Scholar] [CrossRef]
  35. Kuriata-Potasznik, A.; Szymczyk, S.; Pilejczyk, D. Effect of bottom sediments on the nutrient and metal concentration in macrophytes of river-lake systems. Ann. Limnol. Int. J. Lim. 2018, 34, 1. [Google Scholar] [CrossRef]
  36. Zhang, L.; Shao, S.; Liu, C.; Xu, T.; Fan, C. Forms of Nutrients In Rivers Flowing into Lake Chaohu: A Comparision between Urban and Rural Rivers. Water 2015, 7, 4523–4536. [Google Scholar] [CrossRef]
  37. Bogdanowicz, R. Hydrological Factors Influencing Transport of Selected Nitrogen and Phosphorus Compounds from the Odra River, the Vistula River and Polish Coastal Rivers to the Baltic Sea; Wydawnictwo Uniwersytetu Gdańskiego: Gdańsk, Poland, 2004. [Google Scholar]
  38. Cymes, I.; Glińska-Lewczuk, K.; Szymczyk, S.; Sidoruk, M.; Potasznik, A. Distribution and potential risk assessment of heavy metals and arsenic in sediments of a dam reservoir: A case study of the Łoje Retention Reservoir, NE Poland. J. Elementol. 2017, 22, 843–856. [Google Scholar] [CrossRef]
  39. Potasznik, A.; Szymczyk, S.; Sidoruk, M.; Świtajska, I. Role of Lake Symsar in the reduction of phosphorus concentration in surface runoff from agricultural lands. J. Water Land Dev. 2014, 2, 1–6. [Google Scholar] [CrossRef]
  40. Potasznik, A.; Szymczyk, S. Magnesium and calcium concentrations in the surface water and bottom deposits of a river-lake system. J. Elementol. 2015, 20, 677–692. [Google Scholar] [CrossRef]
  41. Czerniawski, R.; Domagała, J.; Sługocki, Ł.; Pilecka-Rapacz, M. The effect of environmentally different lakes on the changes of physicochemical variables in the rivers of the Drawieński National Park. Teka Kom. Ochr. Kszt. Środ. Przyr. 2014, 11, 22–35. [Google Scholar]
Figure 1. The use of the immediate drainage area and catchment basins of the Lake Symsar tributaries.
Water 10 01163 g001
Figure 2. The distribution of geological formations and soils in the immediate drainage area of Lake Symsar and in the catchment basins of its tributaries.
Water 10 01163 g002
Figure 3. The input and output loads (by surface inflow/outflow and precipitation) of mineral nitrogen (TIN), organic nitrogen (TON), and total nitrogen (TN) to/from Symsar Lake.
Water 10 01163 g003
Figure 4. Ordination diagram of the principal component analysis (PCA) to identify the impacts of environmental factors on the nutrient content and physical parameters. The pie chart denotes the share of different forms of nitrogen according to the given factors.
Water 10 01163 g004
Table 1. Concentrations of mineral, organic, and total nitrogen in the surface waters of the Lake Symsar drainage area (results of the Kruskal–Wallis test and the post-hoc test. a, b and c represent differences in groups at the following levels of significance: a:p < 0.001, b:p < 0.01, c:p < 0.001 and p < 0.01, TS—Tolknicka Struga, SI—Stream I, SII—Stream II, SR-i—Symsarna River inflow, SR-o—Symsarna River outflow, SD—standard deviation).
Hydrolo-
Gical Year
TS ± SDSI ± SDSII ± SDSR-i ± SDSR-o ± SDBay ± SDLake ± SD
Mineral Nitrogen20133.49 ± 108.720.55 ± 0.500.55 ± 0.690.55 ± 4.700.42 ± 0.980.32 ± 0.550.36 ± 0.71p < 0.001
20144.37 ± 2.620.52 ± 0.070.69 ± 2.700.32 ± 0.270.44 ± 0.360.34 ± 0.390.29 ± 0.27
Mean3.93 ± 2.87 a0.54 ± 0.16 a0.62 ± 2.08 b0.43 ± 0.49 c0.43 ± 0.33 a0.33 ± 0.32 c0.32 ± 0.26 c
Mineral Nitrogen20131.54 ± 14.180.59 ± 2.782.41 ± 5.461.10 ± 1.291.32 ± 2.451.20 ± 2.771.17 ± 1.65p < 0.01
20143.15 ± 2.520.39 ± 0.310.91 ± 0.761.24 ± 2.551.52 ± 0.351.82 ± 0.671.65 ± 0.55
Mean2.34 ± 2.14 a0.49 ± 0.431.66 ± 1.26 a1.17 ± 0.451.42 ± 0.431.51 ± 0.681.41 ± 0.48
Total Nitrogen20135.03 ± 106.001.14 ± 4.482.97 ± 5.791.65 ± 7.671.74 ± 1.771.54 ± 1.651.57 ± 4.13p < 0.001
20147.53 ± 4.080.90 ± 0.351.59 ± 3.191.56 ± 0.471.93 ± 0.472.14 ± 0.511.94 ± 0.64
Mean5.22 ± 3.73 a1.02 ± 0.52 c2.28 ± 2.57 b1.61 ± 0.66 a1.84 ± 0.66 a1.84 ± 0.52 a1.75 ± 0.75 a
Table 2. Results of the ordination diagram of the PCA.
Axes1234Total Variance
Eigenvalues0.4350.2380.1380.0741.000
Species–environment correlations0.3990.7240.3560.189
Cumulative Percentage Ariance
of species data43.567.381.188.5
of species–environment relationships31.187.295.196.2
Sum of all eigenvalues 1.000
Sum of all canonical eigenvalues 0.222
Table 3. Results of the Spearman’s rank correlation. Results are statistically significant at p < 0.05.
Environmental FactorsAir TemperaturePrecipitationWater FlowNO2NO3NH4NkjeldahlTIN
Air temperature 0.879 −0.391−0.568−0.1910.176−0.449
Precipitation −0.286−0.431−0.537 0.238−0.290
Water flow −0.234 −0.343
Environmental factorsTONTNElctrolytic conductivityWater temperatureTDSSalinityOxygen
Air temperature0.250 0.848−0.209−0.201
Precipitation 0.784−0.176−0.176
Water flow0.212 0.195
Table 4. Loading with the permitted load, critical load, and actual nitrogen load according to a hydrological model proposed by Vollenweider [5] per 1 m2 of the lake surface area and 1 m3 of the lake volume.
Loading per 1 m2 of the Lake Surface Area
Loading2013 [g·m−2]2014 [g·m−2]Average2013/2014 [g·m−2]
Permitted load11.9011.3311.55
Critical load23.8022.6623.10
Actual load64.9828.7746.87
Load per 1 m3 of the Lake Volume
Loading2013 [g·m−3]2014 [g·m−3]Average2013/2014 [g·m−3]
Permitted load2.422.302.35
Critical load4.844.614.7
Actual load12.537.8510.19

