Experimental Investigations of Interactions between Sand Wave Movements, Flow Structure, and Individual Aquatic Plants in Natural Rivers: A Case Study of Potamogeton Pectinatus L.


Abstract
:1. Introduction
2. Materials and Methods
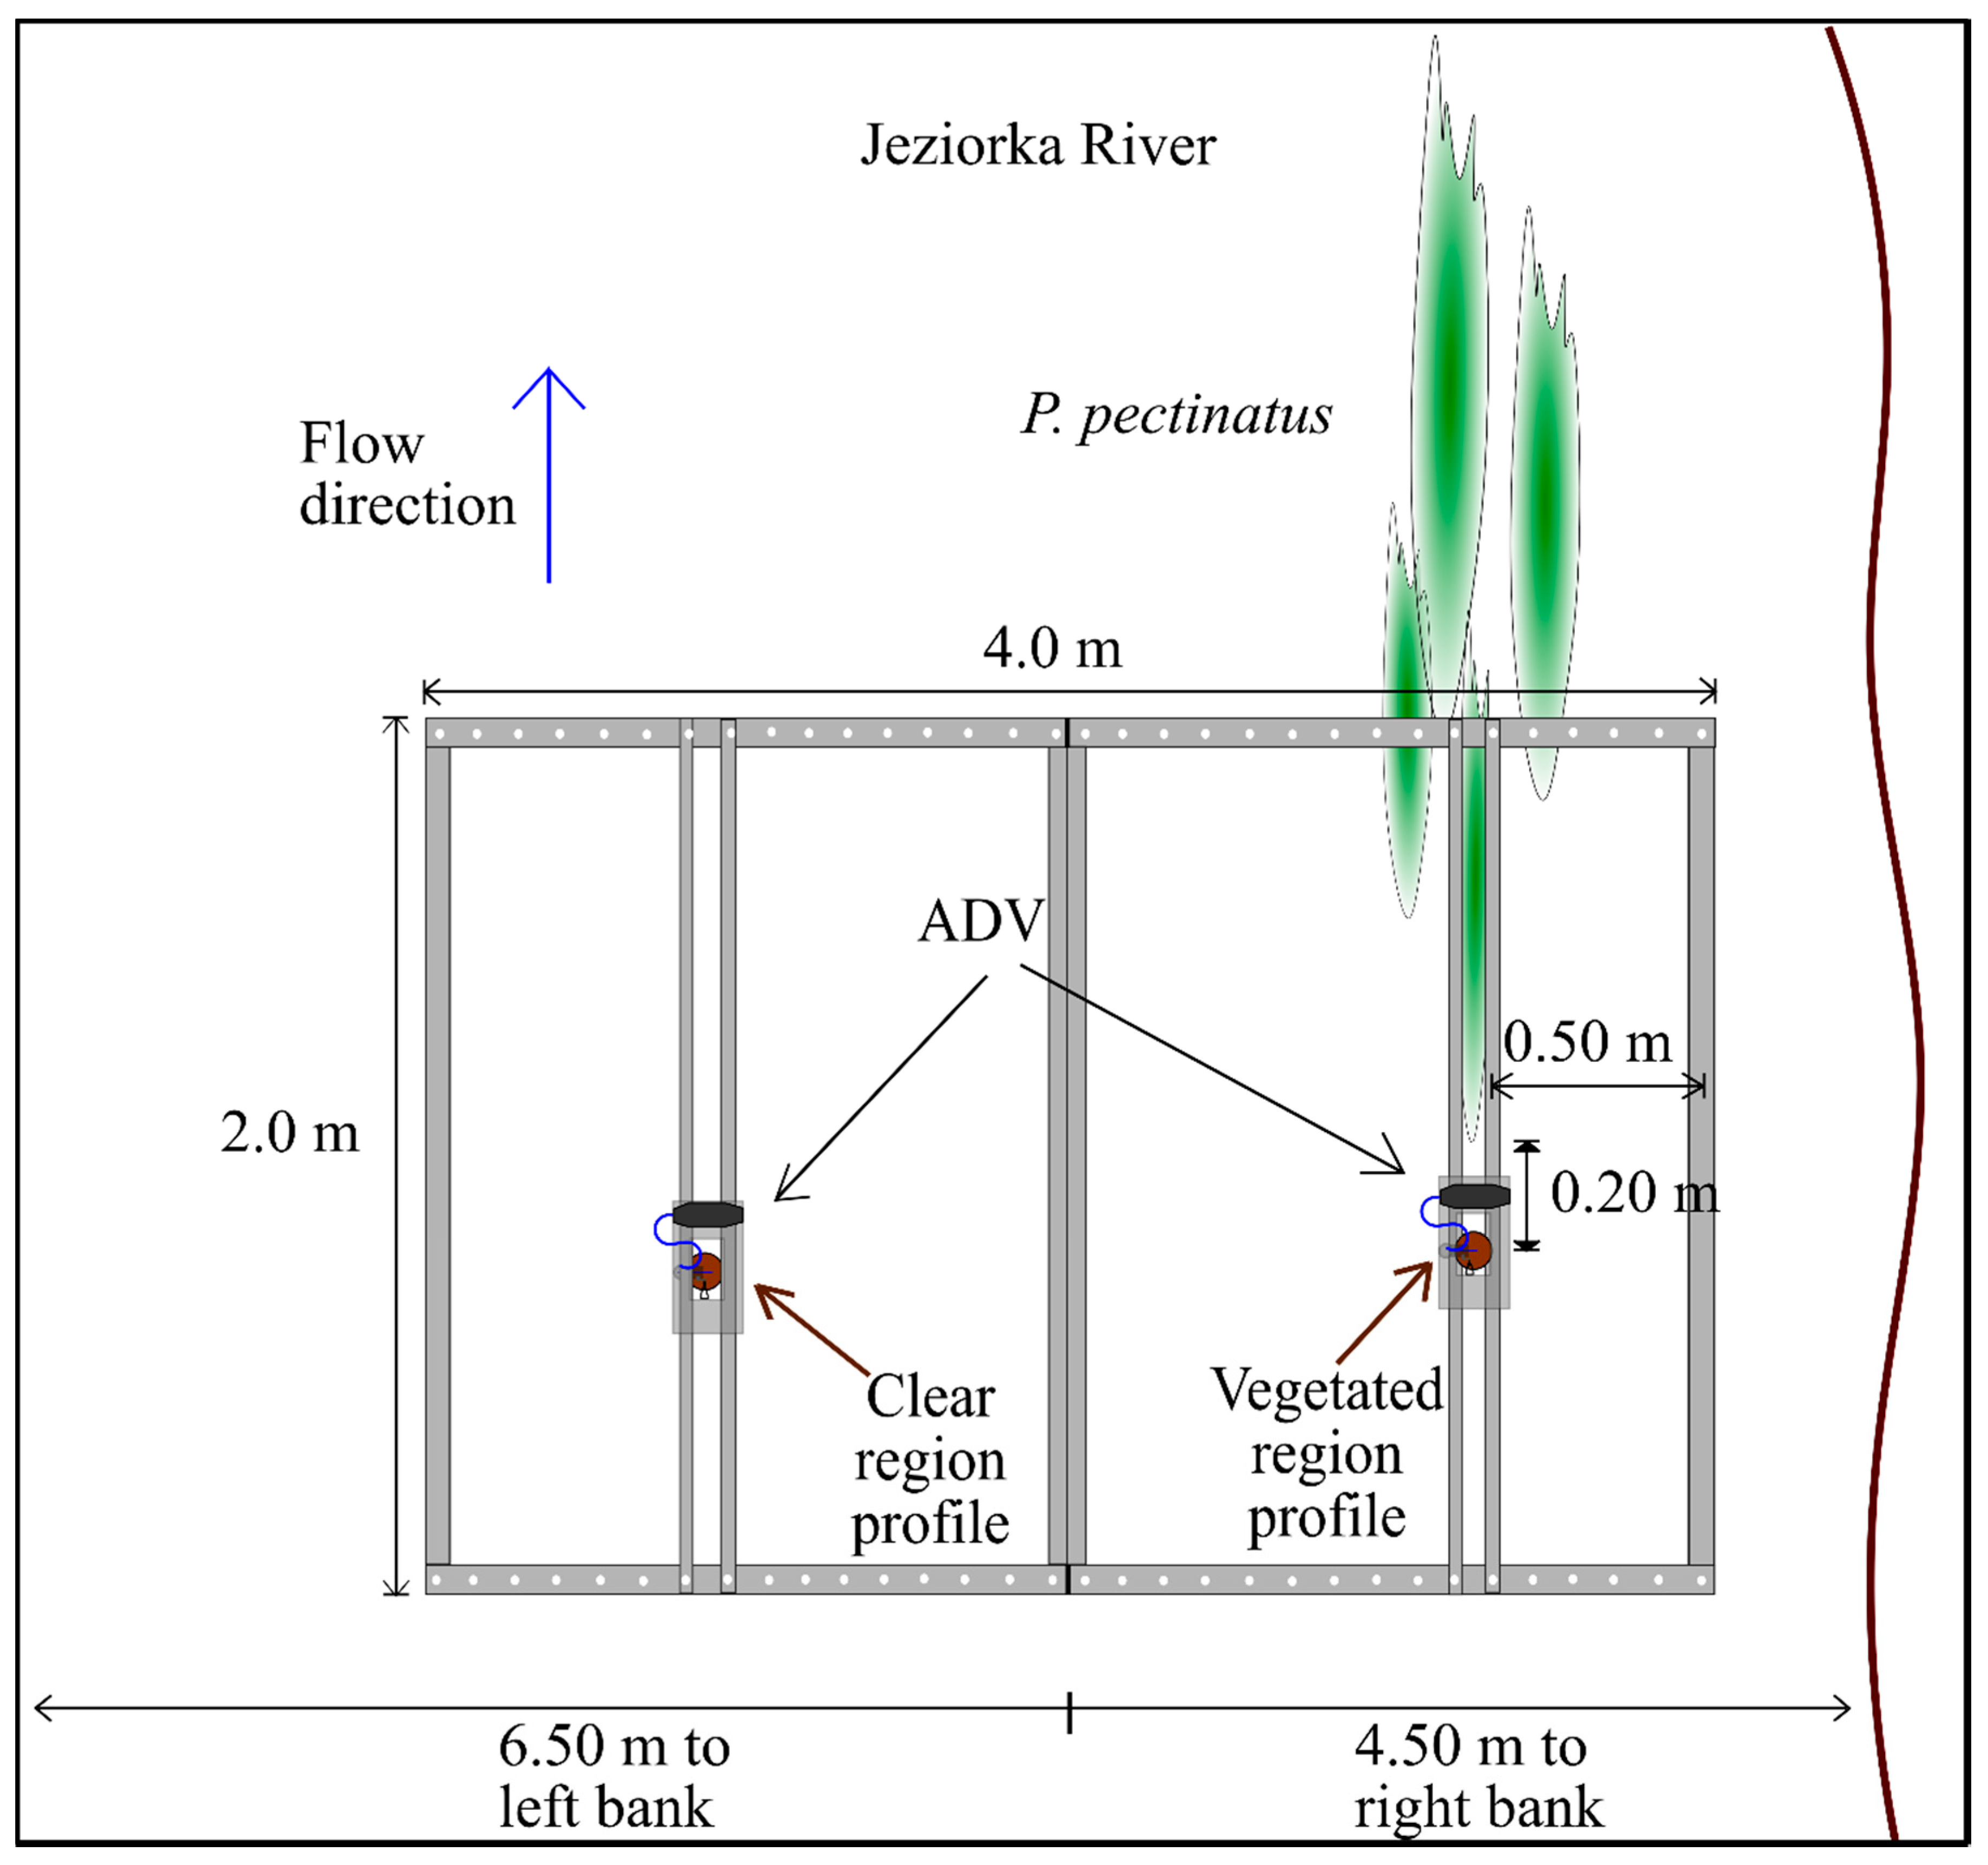
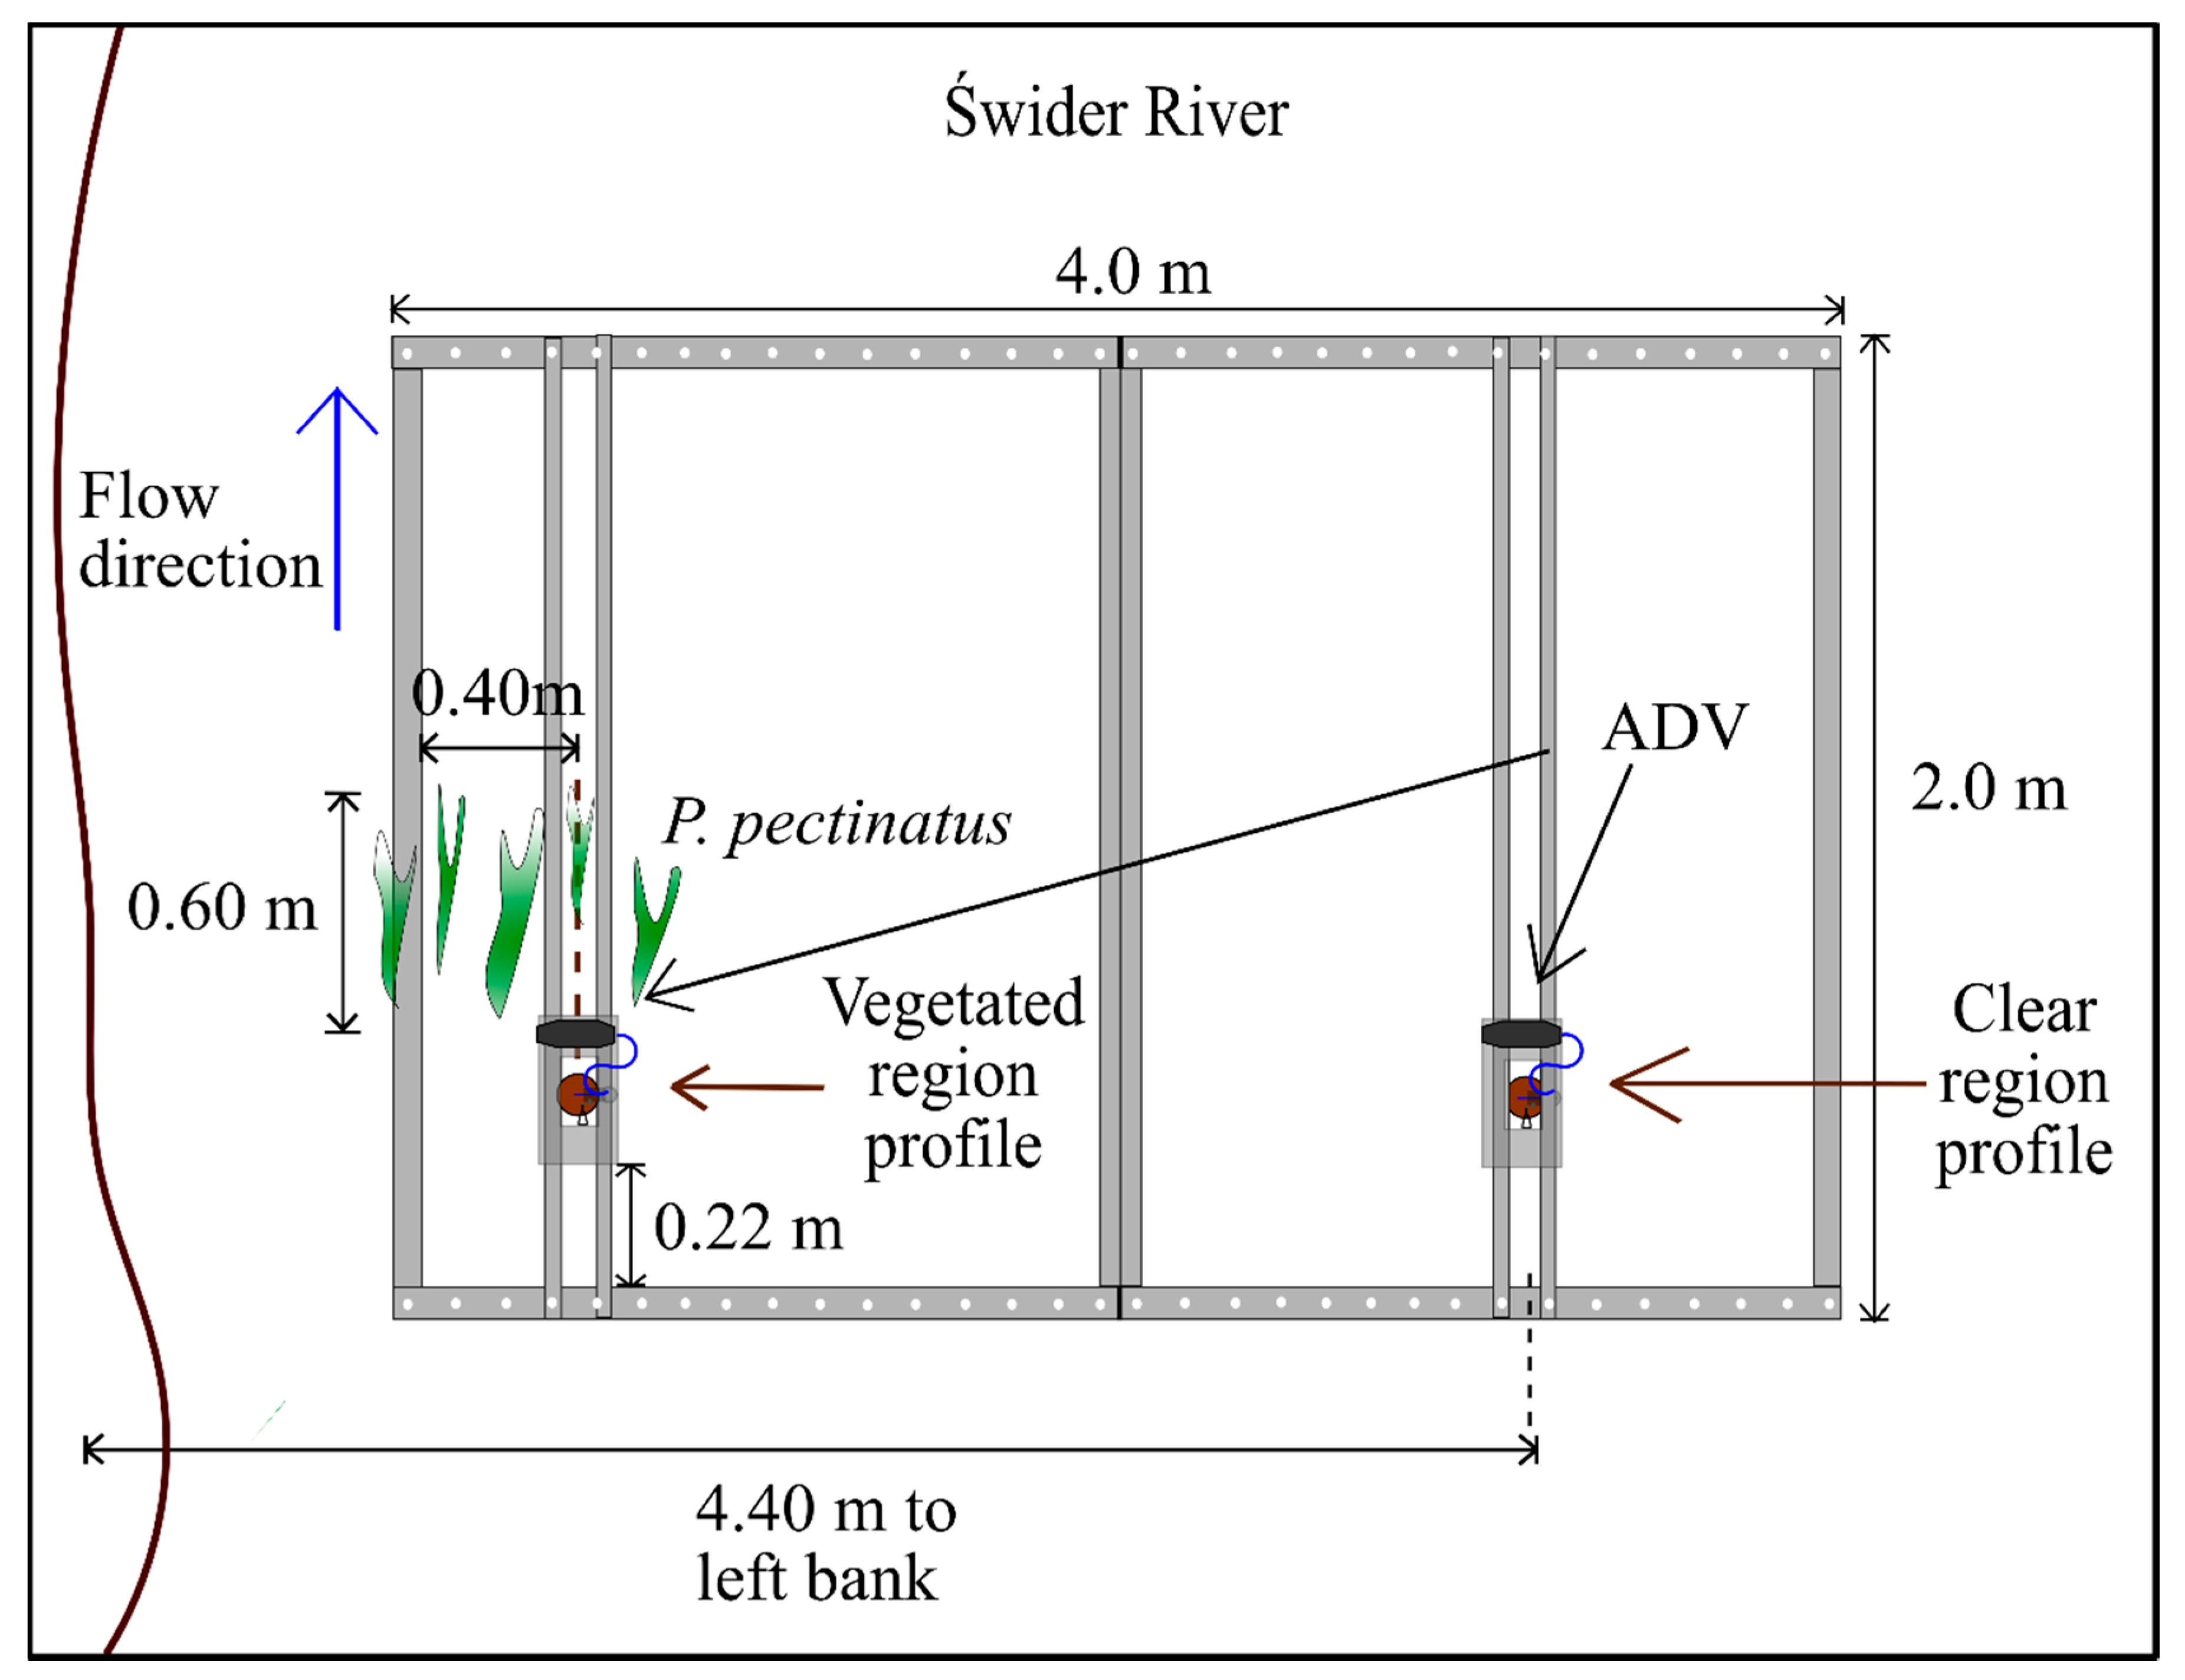
2.1. Equipment
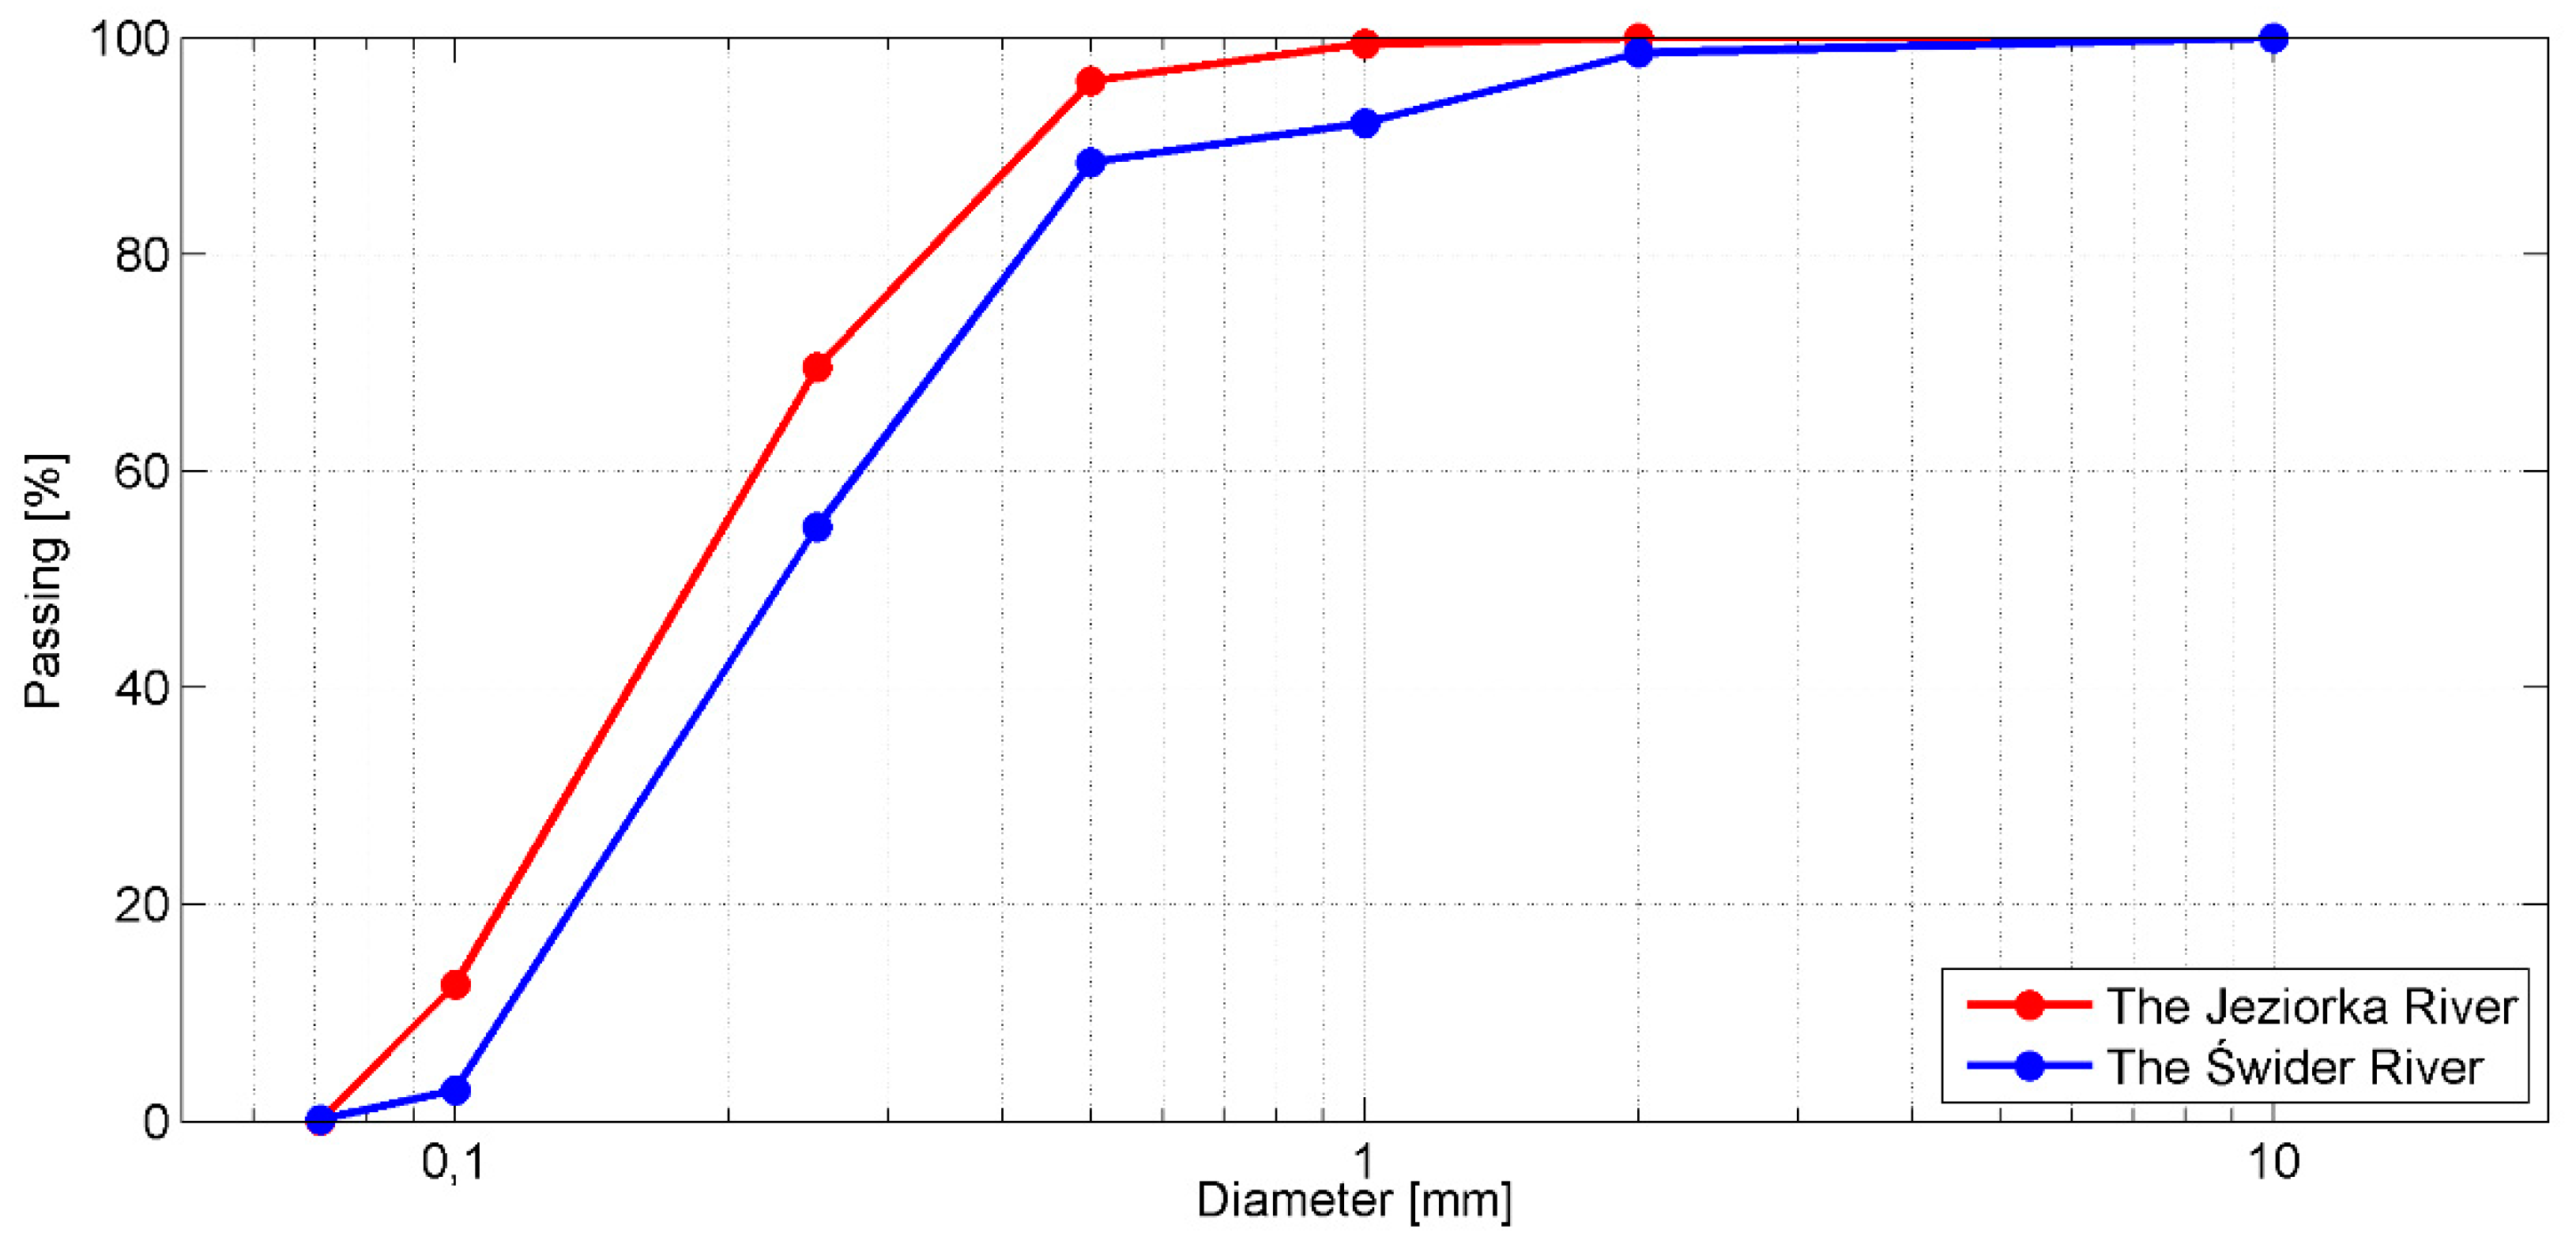
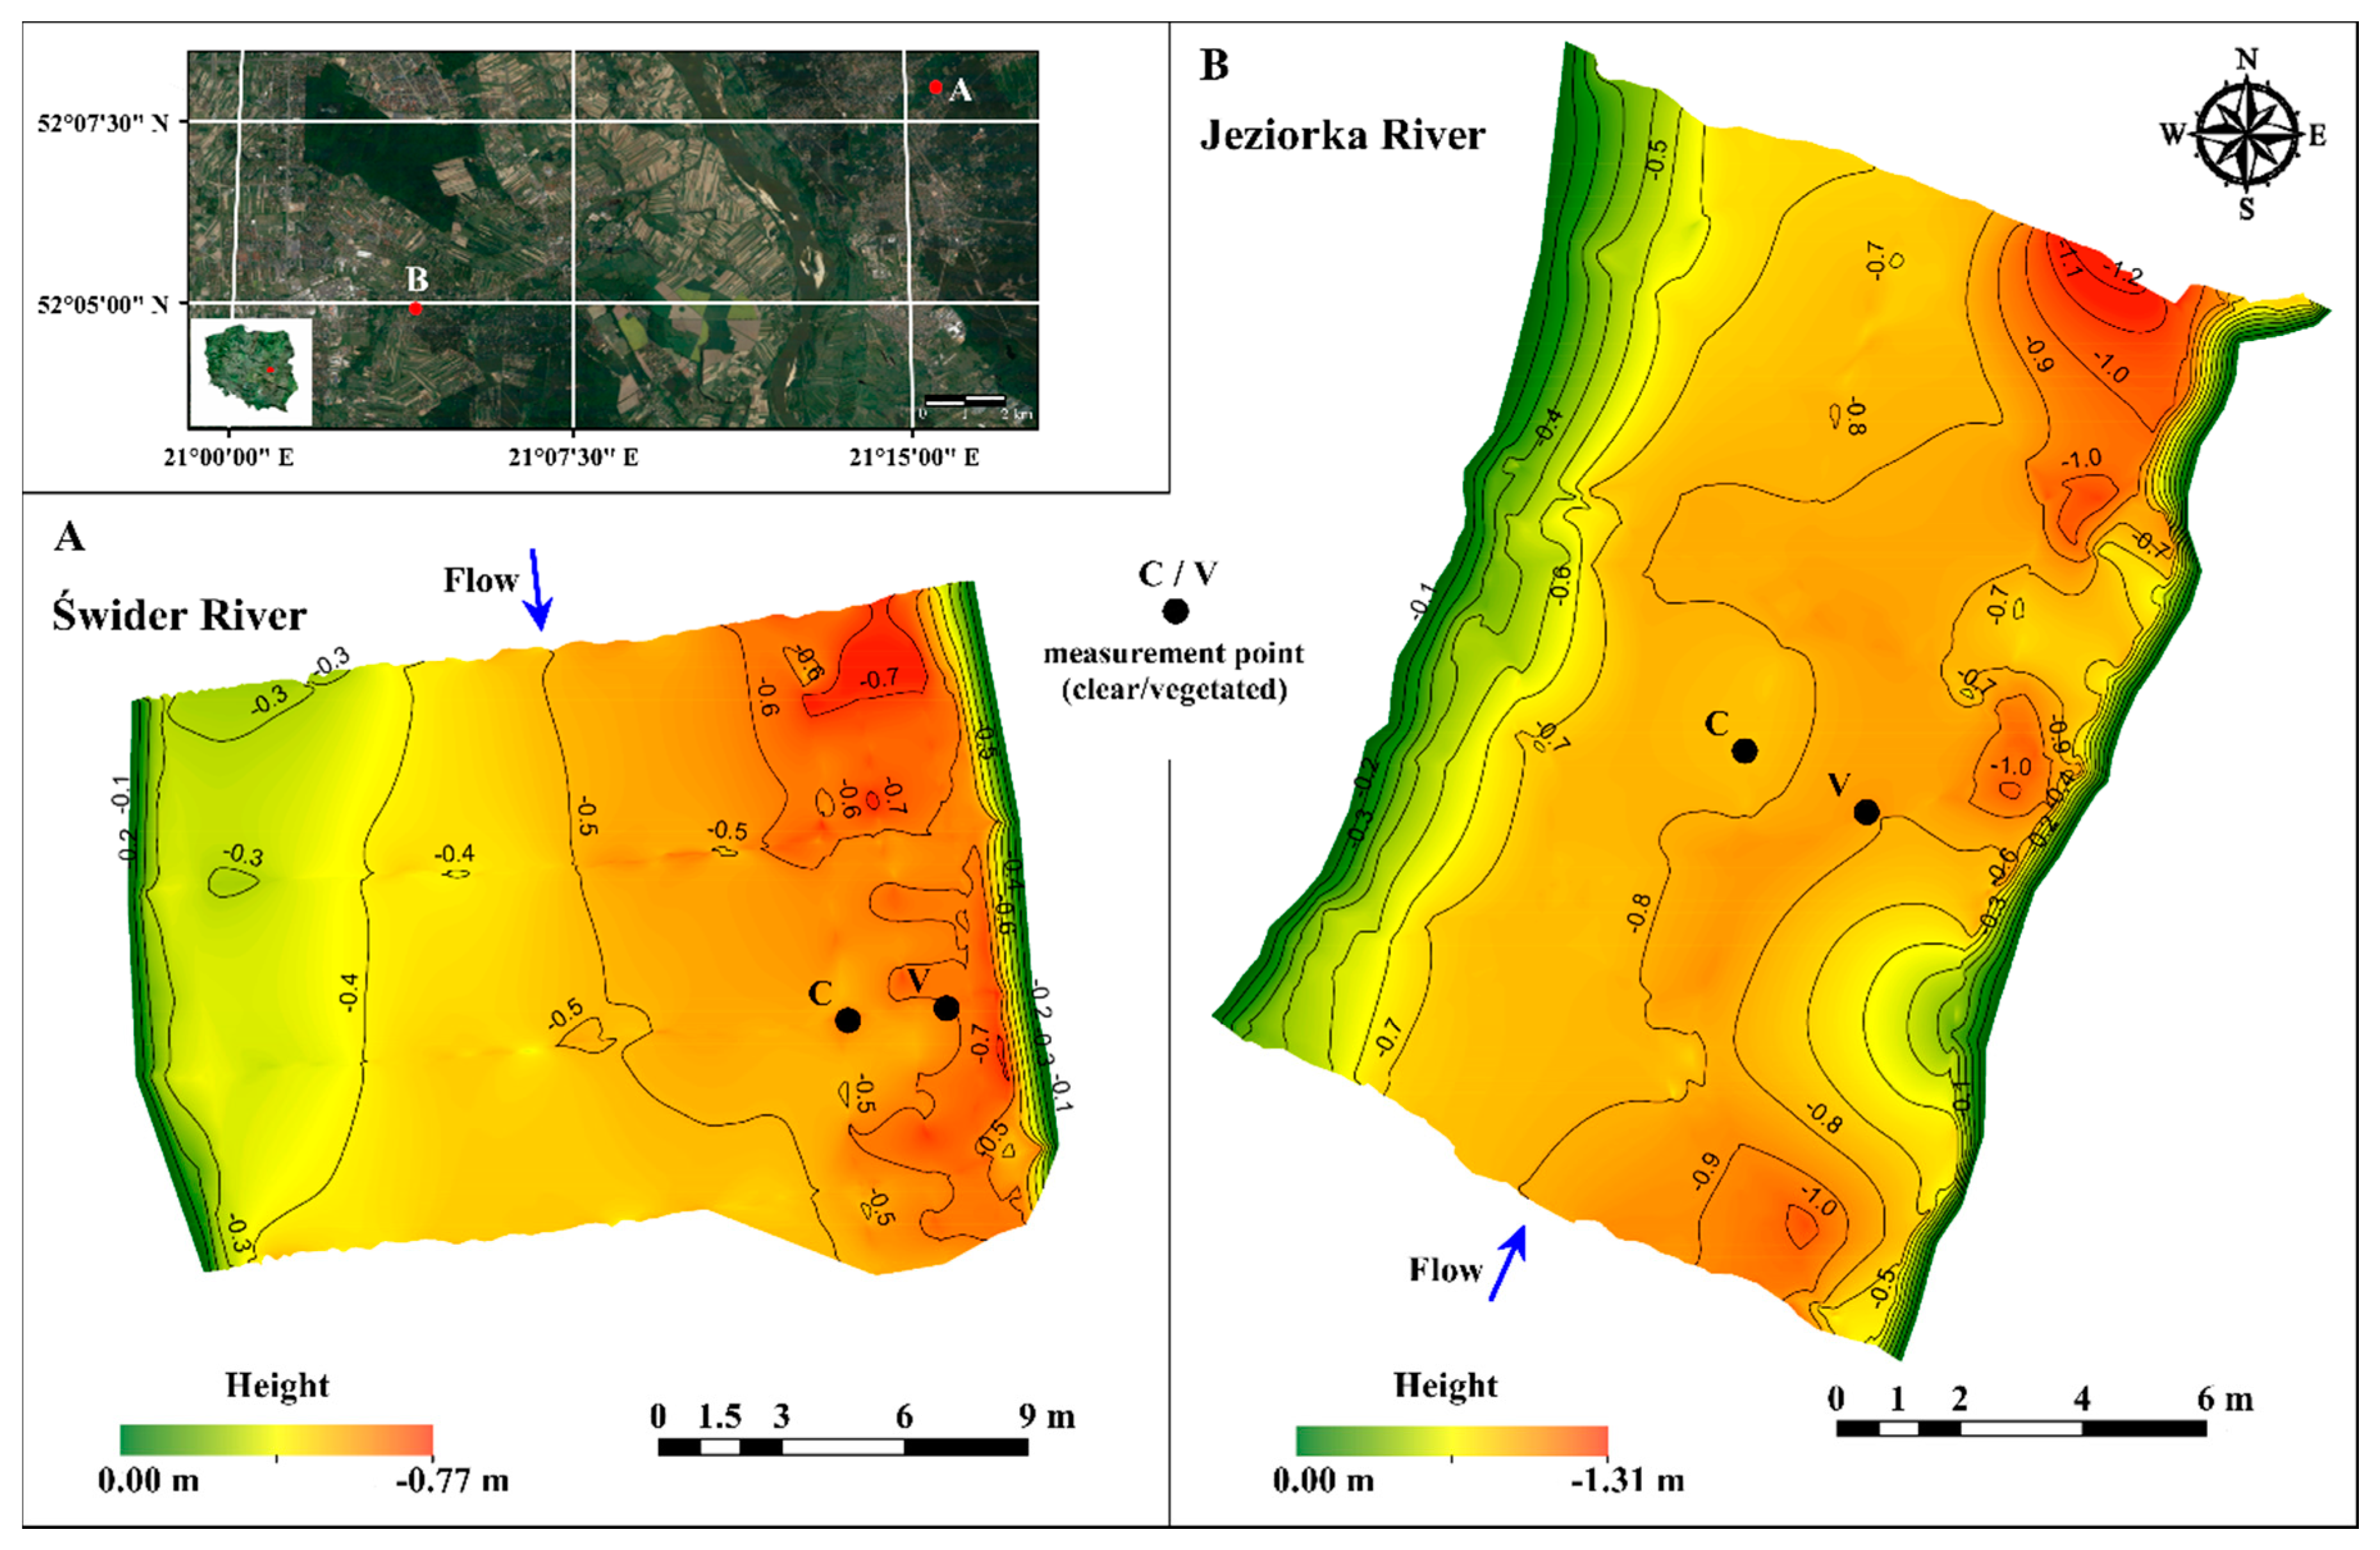
2.2. Study Sites
2.3. Plant Characterization
2.4. Measurements of Biomechanical Traits
2.5. Data Processing
3. Results
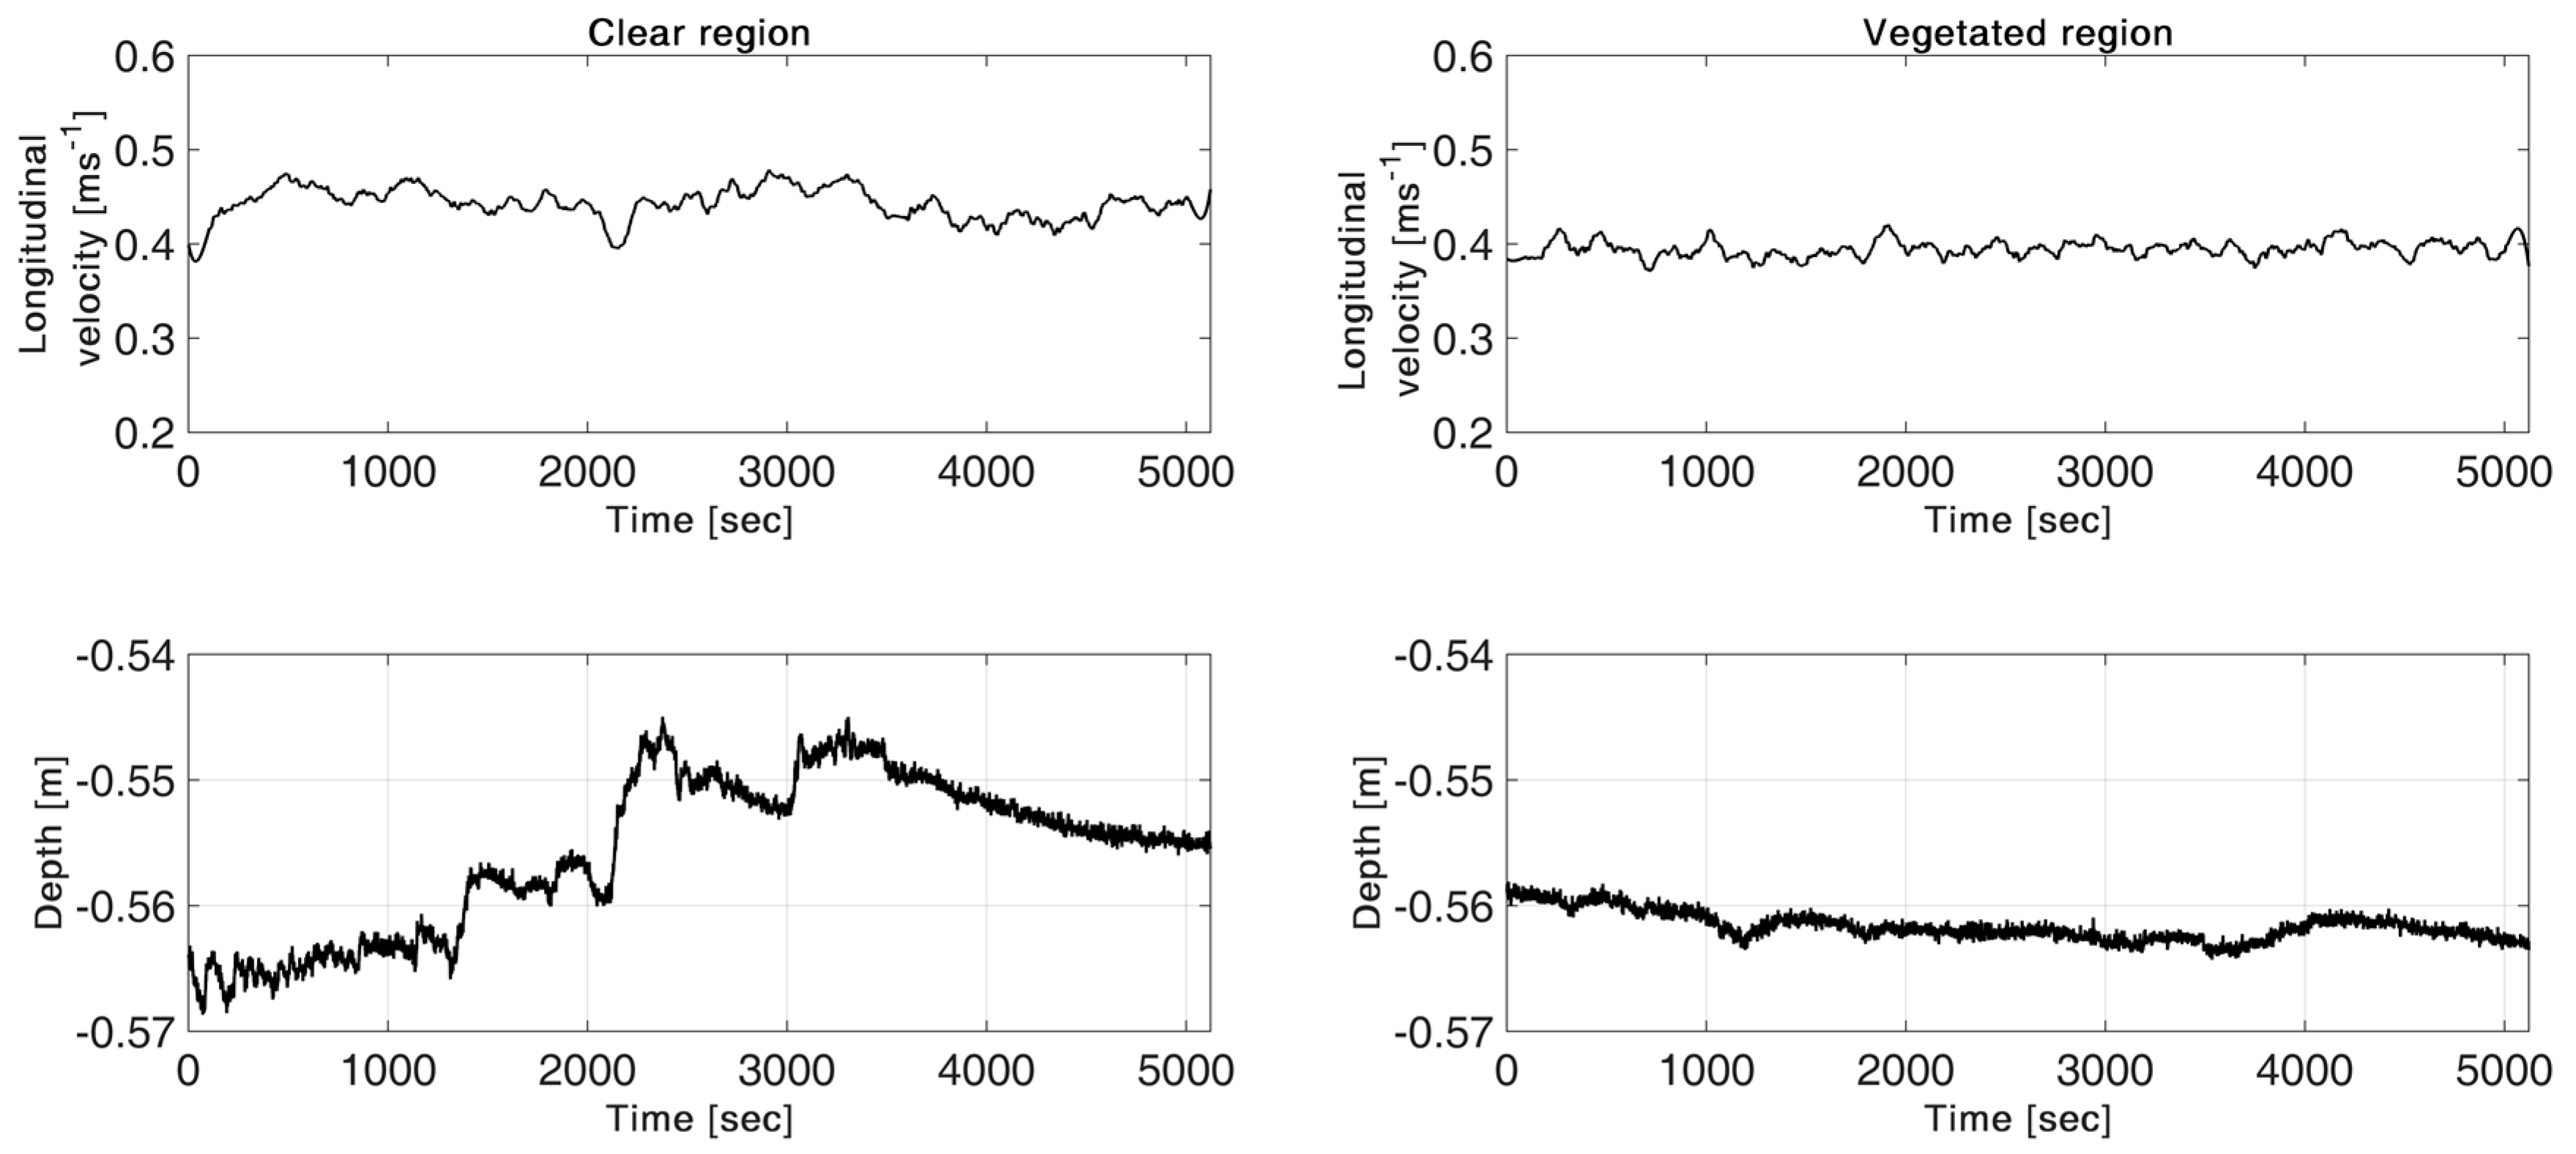
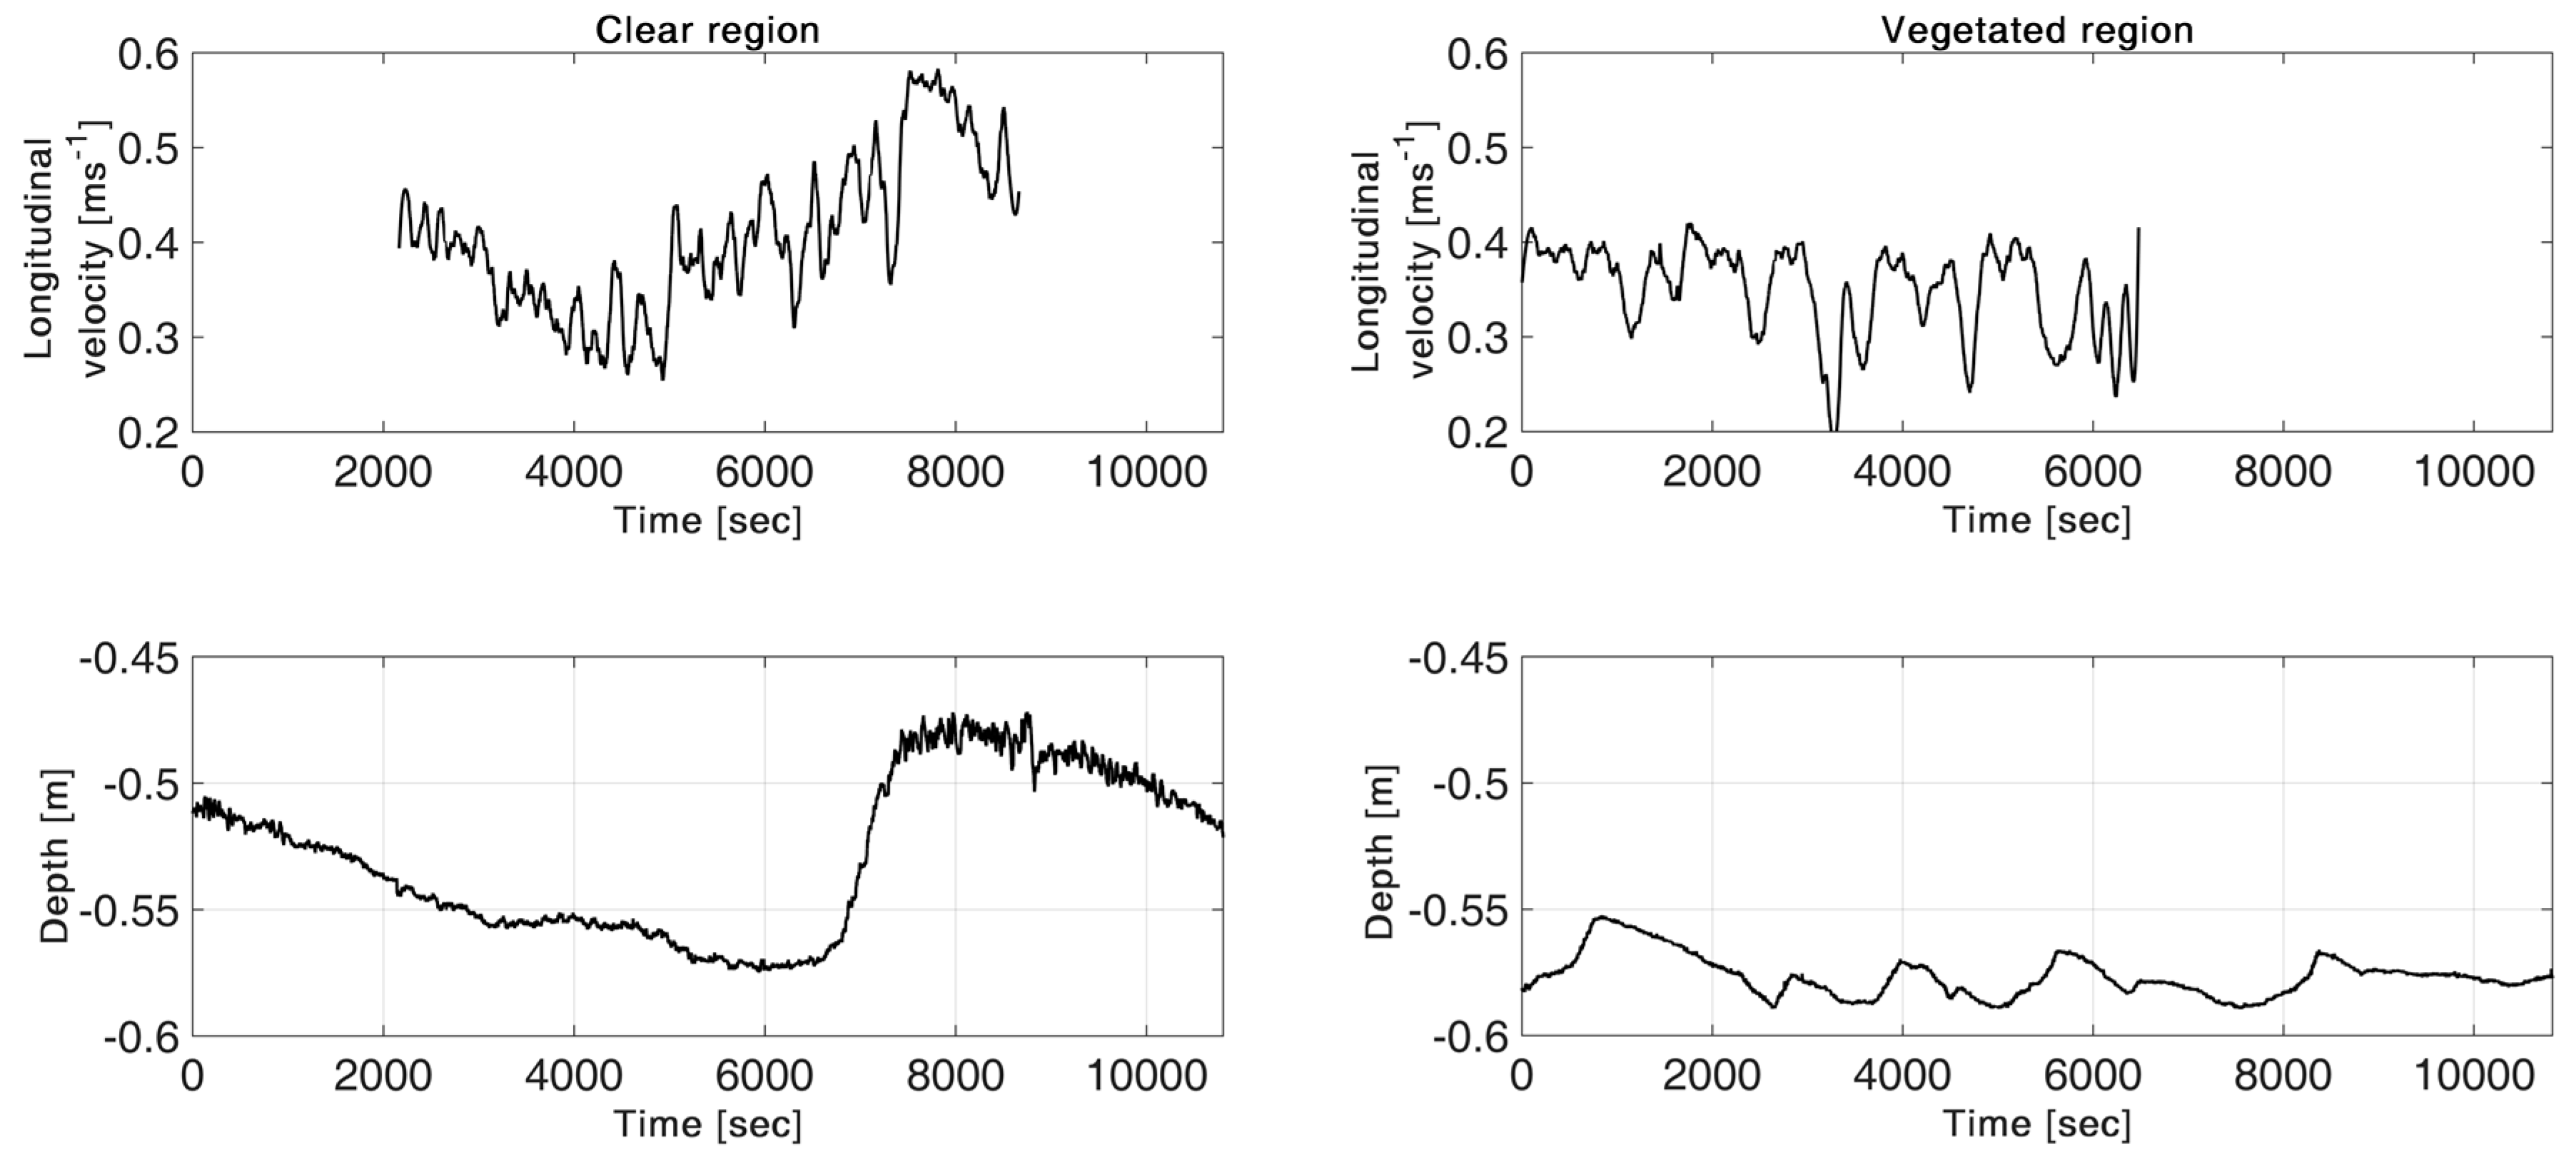
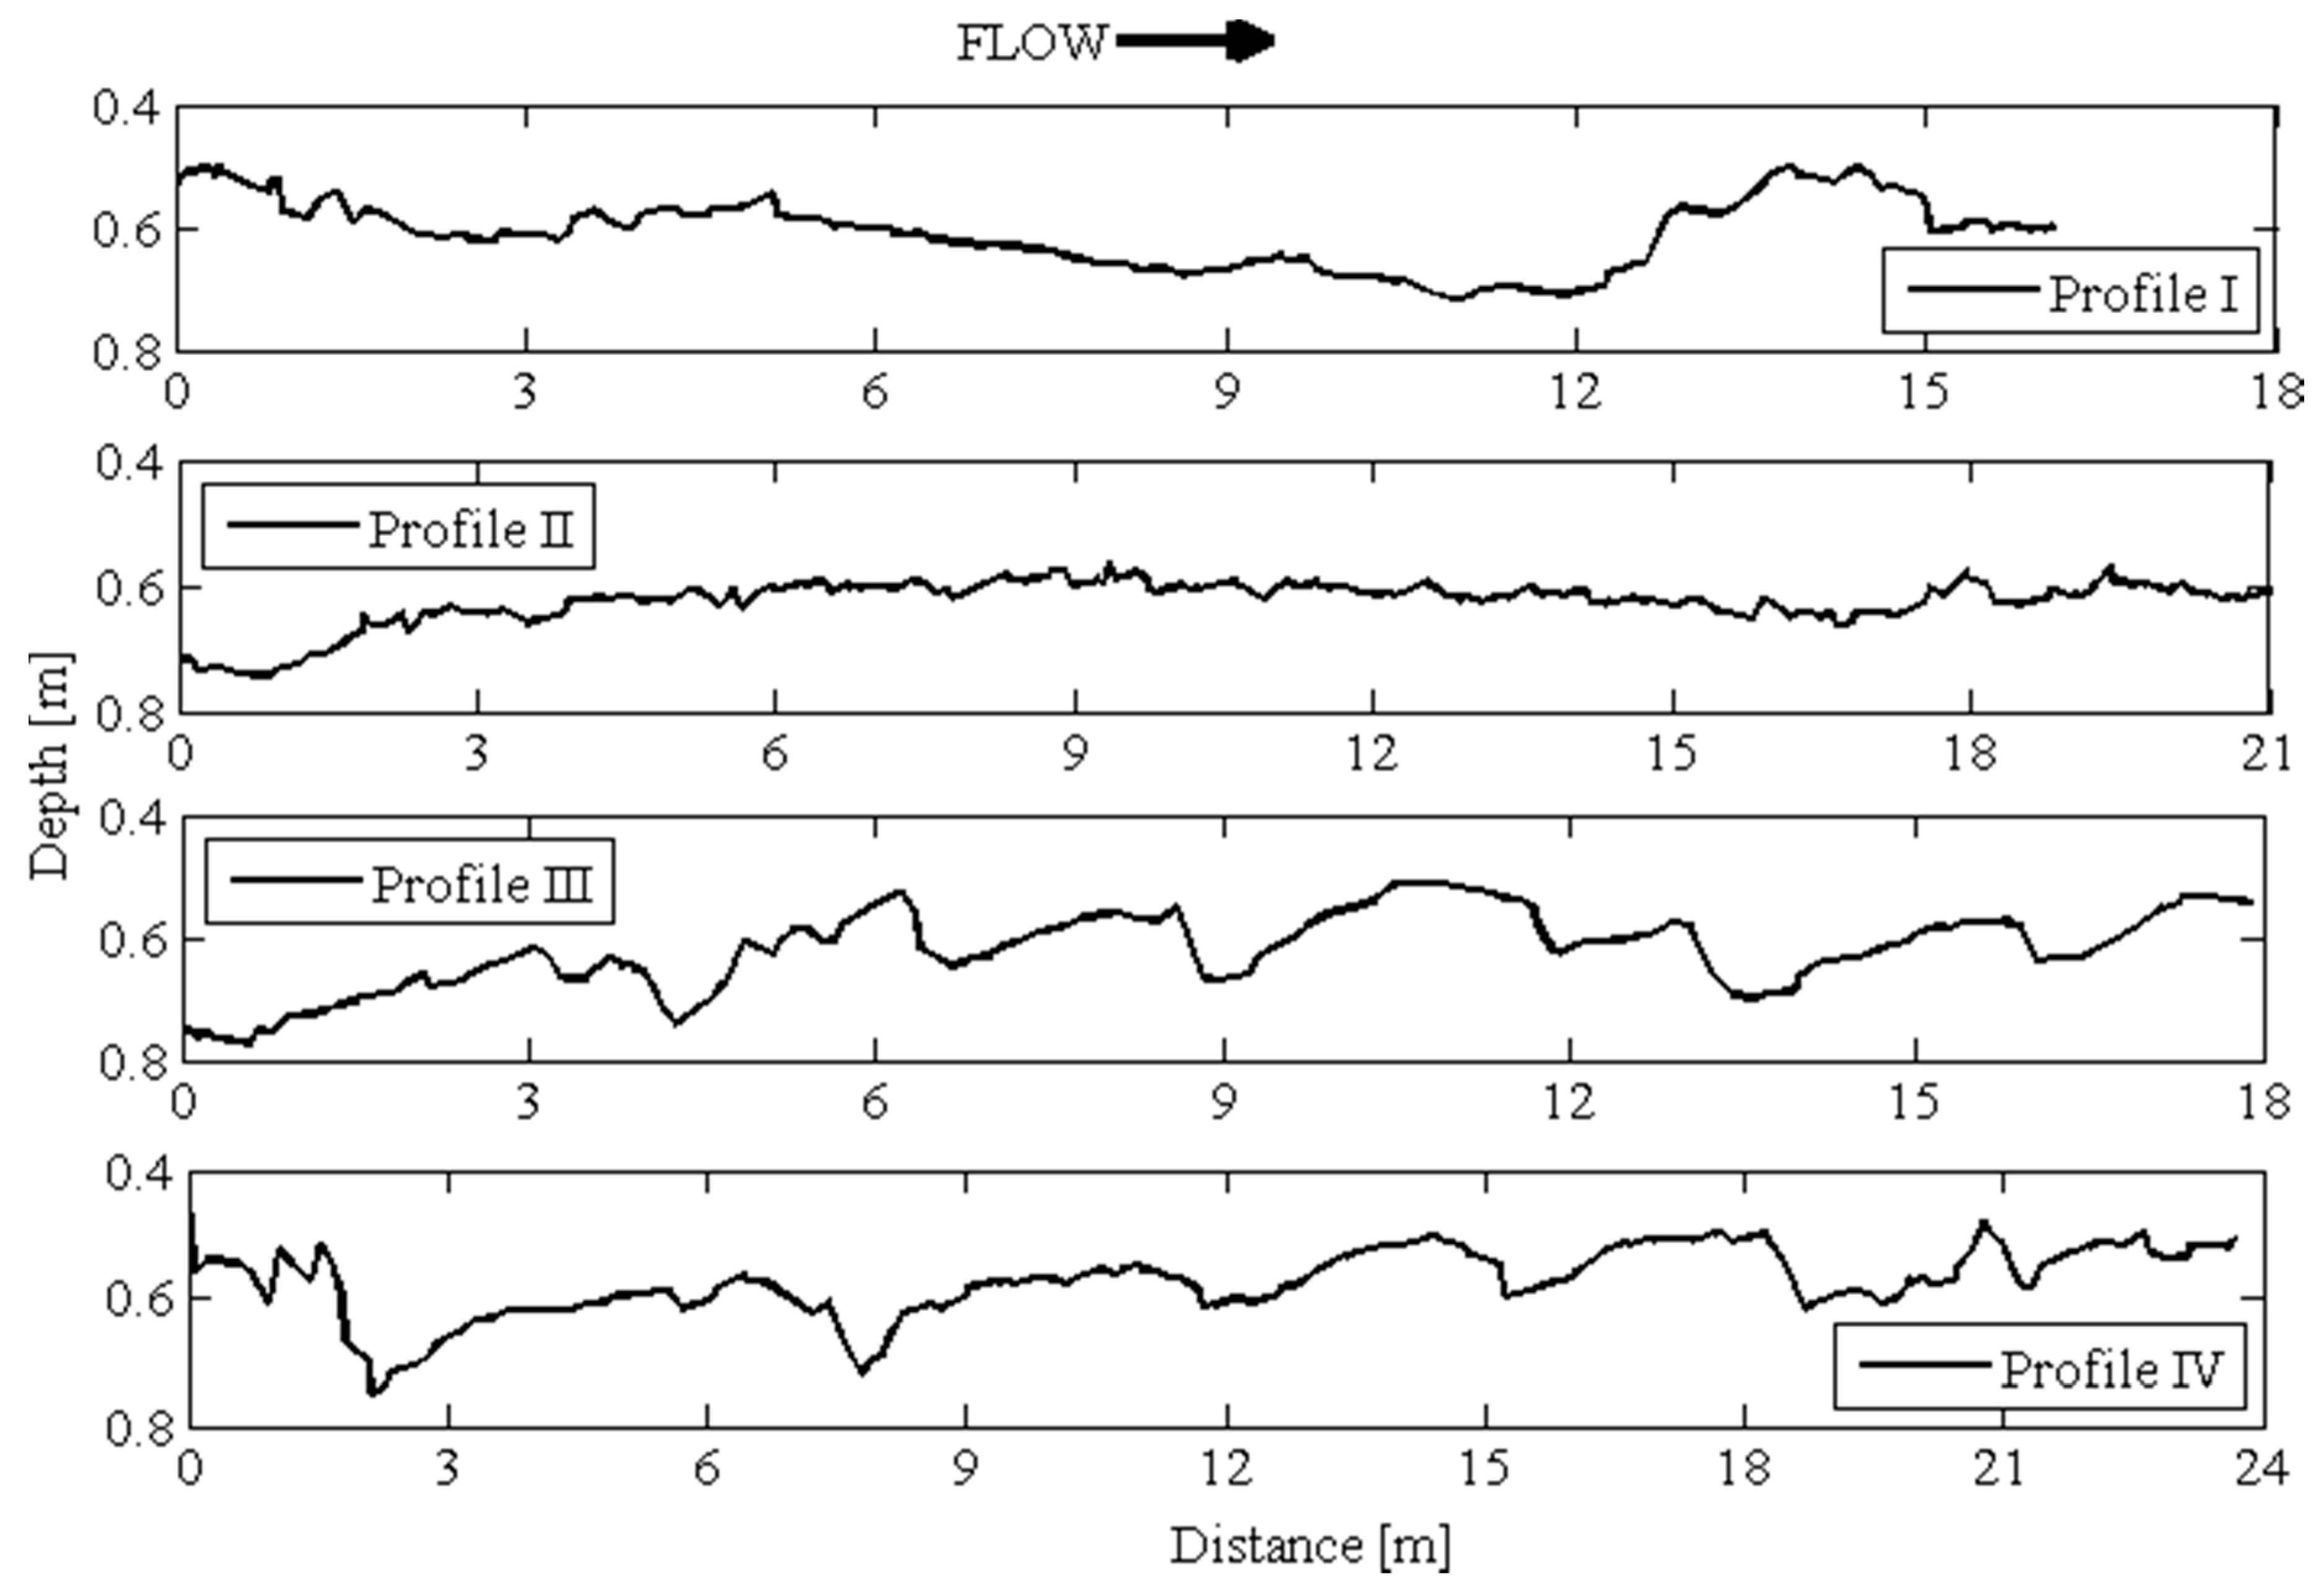
3.1. Bed Elevation Long-Duration Behavior and Bed Morphology
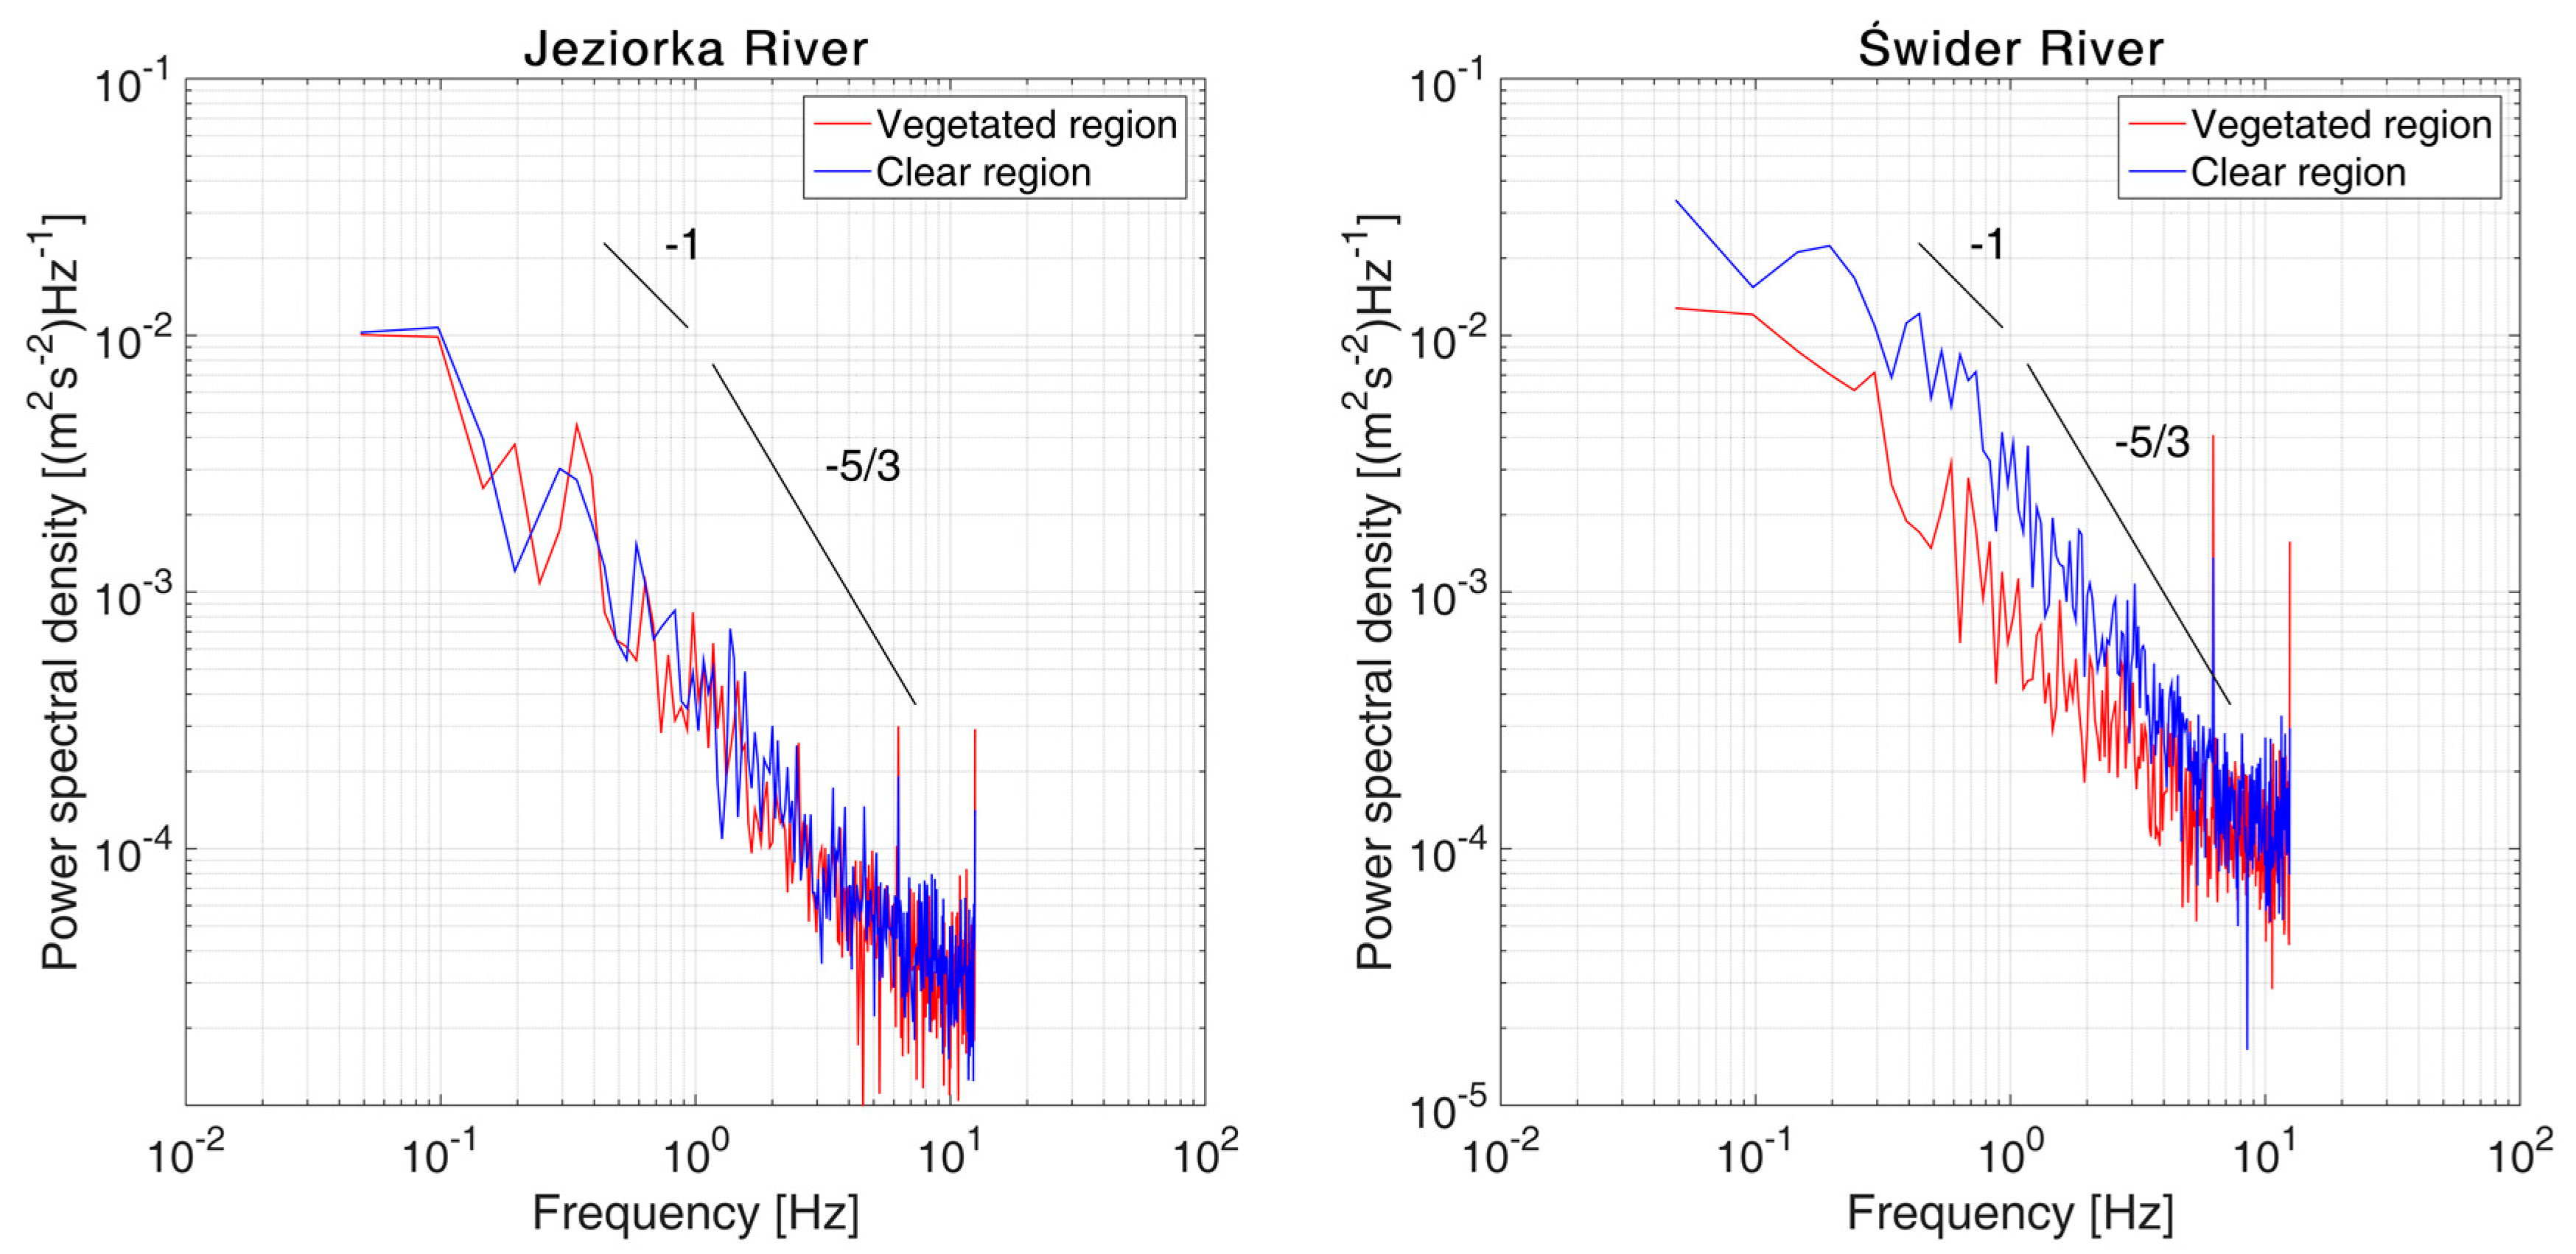
3.2. Velocity Long-Duration Behavior
3.3. Velocity Profiles in the Proximity of P. pectinatus
3.4. Biomechanical Measurements
4. Discussion
5. Conclusions
- The aquatic plant P. pectinatus grew in a larger quantity in the river with the lower Reynolds number, tending to be located in a pool section of a channel, where smaller ripples occurred. This finding suggests an emerging pattern in which flow conditions and bed morphology are connected with the occurrence of the studied hydrophyte.
- The bed forms measured in the Świder River tended to exhibit increased height and length with increased distance from the vegetated region close to the bank. These forms were also more developed than those in the Jeziorka River, which is characterized by finer sediment and faster but steadier flow, with lower turbulent kinetic energy and a lower Froude number.
- Major differences were identified in the plants’ morphology and biomechanics: Older individuals from the faster-flowing Świder River were thicker, shorter, and stiffer than their younger counterparts from the Jeziorka River, which were more prone to bending. These traits may have resulted from the aquatic macrophytes’ adjustment to the habitat conditions.
- Strips of short individual P. pectinatus plants within a mobile bed in the Świder River did not seem to detectably affect passing sand ripples. Turbulence statistics suggest a much steadier flow than that in the clear area.
- The single hydrophyte from the Jeziorka River did not affect the velocities measured downstream; only elevated TKE was visible in the wake of the plant.
- The mean velocity in front of the plants was approximately 12% and 16% lower than in the clear regions in the Świder River and Jeziorka River, respectively. Therefore, bed conditions such as small sandbars and wood debris trapping organic material could have made major contributions to the creation of a habitat suitable for plants to grow.
Author Contributions
Funding
Acknowledgments
Conflicts of Interest
References
- Aberle, J.; Järvelä, J. Hydrodynamics of vegetated channels. In Rivers—Physical, Fluvial and Environmental Processes; Rowiński, P., Radecki-Pawlik, A., Eds.; Springer International Publishing: Cham, Switzerland, 2015; pp. 519–541. ISBN 978-3-319-17718-2. [Google Scholar]
- Ormerod, S.J.; Rundle, S.D.; Lloyd, E.C.; Douglas, A.A. The influence of riparian management on the habitat structure and macroinvertebrate communities of upland streams draining plantation forests. J. Appl. Ecol. 1993, 13–24. [Google Scholar] [CrossRef]
- McKenney, R.; Jacobson, R.B.; Wertheimer, R.C. Woody vegetation and channel morphogenesis in low-gradient, gravel-bed streams in the Ozark Plateaus, Missouri and Arkansas. Geomorphology 1995, 13, 175–198. [Google Scholar] [CrossRef]
- Simon, A.; Collison, A.J. Quantifying the mechanical and hydrologic effects of riparian vegetation on streambank stability. Earth Surf. Process. Landf. 2002, 27, 527–546. [Google Scholar] [CrossRef]
- Nikora, V. Hydrodynamics of aquatic ecosystems: An interface between ecology, biomechanics and environmental fluid mechanics. River Res. Appl. 2010, 26, 367–384. [Google Scholar] [CrossRef]
- Folkard, A.M. Vegetated flows in their environmental context: A review. Proc. Inst. Civ. Eng. Eng. Comput. Mech. 2011, 164, 3–24. [Google Scholar] [CrossRef]
- Nepf, H.M. Hydrodynamics of vegetated channels. J. Hydraul. Res. 2012, 50, 262–279. [Google Scholar] [CrossRef] [Green Version]
- Yager, E.M.; Schmeeckle, M.W. The influence of vegetation on turbulence and bed load transport. J. Geophys. Res. Earth Surf. 2013, 118, 1585–1601. [Google Scholar] [CrossRef] [Green Version]
- O’Hare, M.T.; Mountford, J.O.; Maroto, J.; Gunn, I.D.M. Plant traits relevant to fluvial geomorphology and hydrological interactions. River Res. Appl. 2016, 32, 179–189. [Google Scholar] [CrossRef]
- Reid, M.A.; Thoms, M.C. Surface flow types, near-bed hydraulics and the distribution of stream macroinvertebrates. Biogeosciences 2008, 5, 1175–1204. [Google Scholar] [CrossRef]
- Osterkamp, W.R.; Hupp, C.R.; Stoffel, M. The interactions between vegetation and erosion: New directions for research at the interface of ecology and geomorphology. Earth Surf. Process. Landf. 2012, 37, 23–36. [Google Scholar] [CrossRef]
- James, C.S.; Jordanova, A.A.; Nicolson, C.R. Flume experiments and modelling of flow-sediment-vegetation interactions. In Structure, Function and Management Implications of Fluvial Sedimentary Systems; Proceedings of the Symposium on the Structure, Function and Management Implications of Fluvial Sedimentary Systems, Alice Springs, Australia, 2–6 September 2002; Dyer, F.J., Thoms, M.C., Olley, J.M., Eds.; International Association of Hydrological Sciences, Publication, Institute of Hydrology: Wallingford, UK, 2002; Volume 276, pp. 3–9. [Google Scholar]
- Rominger, J.T.; Lightbody, A.F.; Nepf, H.M. Effects of added vegetation on sand bar stability and stream hydrodynamics. J. Hydraul. Eng. 2010, 136, 994–1002. [Google Scholar] [CrossRef]
- Liu, C.; Hu, Z.; Lei, J.; Nepf, H. Vortex Structure and Sediment Deposition in the Wake behind a Finite Patch of Model Submerged Vegetation. J. Hydraul. Eng. 2017, 144, 04017065. [Google Scholar] [CrossRef]
- Bouma, T.J.; van Duren, L.A.; Temmerman, S.; Claverie, T.; Blanco-Garcia, A.; Ysebaert, T.; Herman, P.M.J. Spatial flow and sedimentation patterns within patches of epibenthic structures: Combining field, flume and modelling experiments. Cont. Shelf Res. 2007, 27, 1020–1045. [Google Scholar] [CrossRef]
- Schnauder, I.; Sukhodolov, A.N. Flow in a tightly curving meander bend: Effects of seasonal changes in aquatic macrophyte cover. Earth Surf. Process. Landf. 2012, 37, 1142–1157. [Google Scholar] [CrossRef]
- Cavedon, V. Effects of Rigid Stems on Sediment Transport. Ph.D. Dissertation, University of Trento, Trento, Italy, 2012. [Google Scholar]
- Cassan, L.; Belaud, G.; Baume, J.P.; Dejean, C.; Moulin, F. Velocity profiles in a real vegetated channel. Environ. Fluid Mech. 2015, 15, 1263–1279. [Google Scholar] [CrossRef]
- Gurnell, A.M.; Grabowski, R.C. Vegetation–Hydrogeomorphology Interactions in a Low-Energy, Human-Impacted River. River Res. Appl. 2016, 32, 202–215. [Google Scholar] [CrossRef]
- O’Hare, J.M.; O’Hare, M.T.; Gurnell, A.M.; Scarlett, P.M.; Liffen, T.; McDonald, C. Influence of an ecosystem engineer, the emergent macrophyte Sparganium erectum, on seed trapping in lowland rivers and consequences for landform colonisation. Freshw. Biol. 2012, 57, 104–115. [Google Scholar] [CrossRef]
- Sand-Jensen, K. Drag forces on common plant species in temperate streams: Consequences of morphology, velocity and biomass. Hydrobiologia 2008, 610, 307–319. [Google Scholar] [CrossRef]
- Ghisalberti, M.; Nepf, H. Shallow flows over a permeable medium: The hydrodynamics of submerged aquatic canopies. Transp. Porous Media 2009, 78, 309–326. [Google Scholar] [CrossRef]
- Nikora, N.; Nikora, V.; O’Donoghue, T. Velocity profiles in vegetated open-channel flows: Combined effects of multiple mechanisms. J. Hydraul. Eng. 2013, 139, 1021–1032. [Google Scholar] [CrossRef]
- Naden, P.; Rameshwaran, P.; Mountford, O.; Robertson, C. The influence of macrophyte growth, typical of eutrophic conditions, on river flow velocities and turbulence production. Hydrol. Process. 2006, 20, 3915–3938. [Google Scholar] [CrossRef]
- Sukhodolov, A.N. Field-based research in fluvial hydraulics: Potential, paradigms and challenges. J. Hydraul. Res. 2015, 53, 1–19. [Google Scholar] [CrossRef]
- Nikora, V.; Goring, D. Flow turbulence over fixed and weakly mobile gravel beds. J. Hydraul. Eng. 2000, 126, 679–690. [Google Scholar] [CrossRef]
- Sukhodolov, A.N.; Fedele, J.J.; Rhoads, B.L. Structure of flow over alluvial bedforms: An experiment on linking field and laboratory methods. Earth Surf. Process. Landf. 2006, 31, 1292–1310. [Google Scholar] [CrossRef]
- Chanson, H. Acoustic Doppler velocimetry (ADV) in the field and in laboratory: Practical experiences. In Proceedings of the International Meeting on Measurements and Hydraulics of Sewers IMMHS’08, Summer School GEMCEA/LCPC, Bouguenais, France, 19–21 August 2008; Larrarte, F., Chanson, H., Eds.; Department of Civil Engineering, The University of Queensland: Brisban, Australia, 2008; pp. 49–66. [Google Scholar]
- Yagci, O.; Kabdasli, M.S. The impact of single natural vegetation elements on flow characteristics. Hydrol. Process. 2008, 22, 4310–4321. [Google Scholar] [CrossRef]
- Thomas, R.E.; McLelland, S.J. The impact of macroalgae on mean and turbulent flow fields. J. Hydrodyn. 2015, 27, 427–435. [Google Scholar] [CrossRef] [Green Version]
- Przyborowski, Ł.; Łoboda, A.M.; Karpiński, M.; Bialik, R.J. Characteristics of flow around aquatic plants in natural conditions: Experimental setup, challenges and difficulties. In Free Surface Flows and Transport Processes; Kalinowska, M.B., Mrokowska, M.M., Rowiński, P.M., Eds.; Springer International Publishing: Cham, Switzerland, 2018; pp. 347–361. ISBN 978-3-319-70914-7. [Google Scholar]
- Thomas, R.E.; Schindfessel, L.; McLelland, S.J.; Creëlle, S.; De Mulder, T. Bias in mean velocities and noise in variances and covariances measured using a multistatic acoustic profiler: The Nortek Vectrino Profiler. Meas. Sci. Technol. 2017, 28. [Google Scholar] [CrossRef]
- Nikora, V.I.; Sukhodolov, A.N.; Rowiński, P.M. Statistical sand wave dynamics in one-directional water flows. J. Fluid Mech. 1997, 351, 17–39. [Google Scholar] [CrossRef]
- Coleman, S.E.; Nikora, V.I. Fluvial dunes: Initiation, characterization, flow structure. Earth Surf. Process. Landf. 2011, 36, 39–57. [Google Scholar] [CrossRef]
- Kłosowski, S.; Kłosowski, G. Aquatic and Marsh Plants; MULTICO: Warsaw, Poland, 2007; ISBN 9788377633557. (In Polish) [Google Scholar]
- Łoboda, A.M.; Przyborowski, Ł.; Karpiński, M.; Bialik, R.J.; Nikora, V.I. Biomechanical properties of aquatic plants: The effect of test conditions. Limnol. Oceanogr. Methods. 2018, 16, 222–236. [Google Scholar] [CrossRef]
- Niklas, K.J. Plant Biomechanics. In An Engineering Approach to Plant Form and Function; University of Chicago Press: Chicago, IL, USA, 1992; ISBN 0-226-58641-6. [Google Scholar]
- ASTM D790-03. Standard Test Methods for Flexural Properties of Unreinforced and Reinforced Plastics and Electrical Insulating Materials; ASTM International: West Conshohocken, PA, USA, 2003. [Google Scholar]
- MacVicar, B.; Dilling, S.; Lacey, J. Multi-instrument turbulence toolbox (MITT): Open-source MATLAB algorithms for the analysis of high-frequency flow velocity time series datasets. Comput. Geosci. 2014, 73, 88–98. [Google Scholar] [CrossRef]
- Brand, A.; Noss, C.; Dinkiel, C.; Holzner, M. High-resolution measurements of turbulent flow close to the sediment-water interface using bistatic acoustic profiler. J. Atmos. Ocean. Technol. 2016, 33, 769–788. [Google Scholar] [CrossRef]
- Koca, K.; Noss, C.; Anlanger, C.; Brand, A.; Lorke, A. Performance of the Vectrino Profiler at the sediment-water interface. J. Hydraul. Res. 2017, 55, 573–581. [Google Scholar] [CrossRef]
- Goring, D.G.; Nikora, V.I. Despiking Acoustic Doppler Velocimeter data. J. Hydraul. Eng. 2002, 128, 117–126. [Google Scholar] [CrossRef]
- Wahl, T.L. Discussion of ‘Despiking acoustic Doppler velocimeter data’ by Derek G. Goring and Vladimir I. Nikora. J. Hydraul. Eng. 2003, 126, 484–487. [Google Scholar] [CrossRef]
- Parsheh, M.; Sotiropoulos, F.; Porte-Agel, F. Estimation of Power Spectra of Acoustic-Doppler Velocimetry Data Contaminated with Intermittent Spikes. J. Hydraul. Eng. ASCE 2010, 136, 368–378. [Google Scholar] [CrossRef]
- Voulgaris, G.; Trowbridge, J.H. Evaluation of the acoustic Doppler velocimeter (ADV) for turbulence measurements. J. Atmos. Ocean. Tech. 1998, 15, 272–289. [Google Scholar] [CrossRef]
- Hurther, D.; Lemmin, U. A correction method for turbulence measurements with a 3D acoustic Doppler velocity profiler. J. Atmos. Ocean. Tech. 2001, 18, 446–458. [Google Scholar] [CrossRef]
- Welch, P.D. The use of fast Fourier transform for the estimation of power spectra: A method based on time averaging over short, modified periodograms. IEEE Trans. Acoust. Electr. 1967, 15, 70–73. [Google Scholar] [CrossRef]
- Tuijnder, A.P.; Ribberink, J.S.; Hulscher, S.J. An experimental study into the geometry of supply-limited dunes. Sedimentology 2009, 56, 1713–1727. [Google Scholar] [CrossRef] [Green Version]
- Bialik, R.; Karpiński, M.; Rajwa, A.; Luks, B.; Rowiński, P. Bedform characteristics in natural and regulated channels: A comparative field study on the Wilga River, Poland. Acta Geophys. 2014, 62, 1413–1434. [Google Scholar] [CrossRef]
- Nezu, I.; Nakagawa, H. Turbulence in Open-Channel Flows, 1st ed.; CRC Press: Boca Raton, FL, USA, 1993; ISBN 9054101180. [Google Scholar]
- Nikora, V. Origin of the “−1” spectral law in wall-bounded turbulence. Phys. Rev. Lett. 1999, 83, 734. [Google Scholar] [CrossRef]
- Gurnell, A.; Goodson, J.; Thompson, K.; Clifford, N.; Armitage, P. The river-bed: A dynamic store for plant propagules? Earth Surf. Process. Landf. 2007, 32, 1257–1272. [Google Scholar] [CrossRef]
- Chambers, P.A.; Prepas, E.E.; Hamilton, H.R.; Bothwell, M.L. Current velocity and its effect on aquatic macrophytes in flowing waters. Ecol. Appl. 1991, 1, 249–257. [Google Scholar] [CrossRef] [PubMed]
- Kemp, J.L.; Harper, D.M.; Crosa, G.A. The habitat-scale ecohydraulics of rivers. Ecol. Eng. 2000, 16, 17–29. [Google Scholar] [CrossRef]
- Carling, P.A. An appraisal of the velocity-reversal hypothesis for stable pool-riffle sequences in the River Severn, England. Earth Surf. Process. Landf. 1991, 16, 19–31. [Google Scholar] [CrossRef]
- Wilkinson, S.N.; Keller, R.J.; Rutherfurd, I.D. Phase-shifts in shear stress as an explanation for the maintenance of pool–riffle sequences. Earth Surf. Process. Landf. 2004, 29, 737–753. [Google Scholar] [CrossRef]
- Tinkler, K.J. Pools, riffles, and meanders. Geol. Soc. Am. Bull. 1970, 81, 547–552. [Google Scholar] [CrossRef]
- Church, M. Bed material transport and the morphology of alluvial river channels. Annu. Rev. Earth Planet. Sci. 2006, 34, 325–354. [Google Scholar] [CrossRef]
- Najafabadi, E.F.; Afzalimehr, H.; Rowiński, P.M. Flow structure through a fluvial pool-riffle sequence–Case study. J. Hydro-Environ. Res. 2018, 19, 1–15. [Google Scholar] [CrossRef]
- Schneider, R.L.; Sharitz, R.R. Hydrochory and Regeneration in A Bald Cypress-Water Tupelo Swamp Forest. Ecology 1998, 69, 1055–1063. [Google Scholar] [CrossRef]
- Västilä, K.; Järvelä, J. Characterizing natural riparian vegetation for modeling of flow and suspended sediment transport. J. Soils Sediments 2017, 17, 1–17. [Google Scholar] [CrossRef]
- Liu, D.; Valyrakis, M.; Williams, R. Flow Hydrodynamics across Open Channel Flows with Riparian Zones: Implications for Riverbank Stability. Water 2018, 9, 720. [Google Scholar] [CrossRef]
- Green, J.C. Modelling flow resistance in vegetated streams: Review and development of new theory. Hydrol. Process. 2005, 19, 1245–1259. [Google Scholar] [CrossRef]
- Aberle, J.; Coleman, S.; Nikora, V. Bed load transport by bed form migration. Acta Geophys. 2012, 60, 1720–1743. [Google Scholar] [CrossRef]
- Venditti, J.G.; Bauer, B.O. Turbulent flow over a dune: Green River, Colorado. Earth Surf. Process. Landf. 2005, 30, 289–304. [Google Scholar] [CrossRef]
- Kostaschuk, R. A field study of turbulence and sediment dynamics over subaqueous dunes with flow separation. Sedimentology 2000, 47, 519–531. [Google Scholar] [CrossRef]
- Singh, A.; Porté-Agel, F.; Foufoula-Georgiou, E. On the influence of gravel bed dynamics on velocity power spectra. Water Resour. Res. 2010, 46. [Google Scholar] [CrossRef] [Green Version]
- Łoboda, A.M.; Bialik, R.J.; Karpiński, M.; Przyborowski, Ł. Two simultaneously occurring Potamogeton species: Similarities and differences in seasonal changes of biomechanical properties. Pol. J. Environ. Stud. 2019, 28, 1–17. [Google Scholar] [CrossRef]
- Puijalon, S.; Bouma, T.J.; Douady, C.J.; van Groenendael, J.; Anten, N.P.; Martel, E.; Bornette, G. Plant resistance to mechanical stress: Evidence of an avoidance–tolerance trade-off. New Phytol. 2011, 191, 1141–1149. [Google Scholar] [CrossRef] [PubMed]
- Biggs, H.; Nikora, V.N.; Papadopoulos, K.; Vettori, D.; Gibbins, C.; Kucher, M. Flow-vegetation interactions: A field study of ranunculus penicillatus at the large patch scale. In Proceedings of the 11th International Symposium on Ecohydraulics, Melbourne, Australia, 7–12 February 2016. [Google Scholar]
- Nepf, H.M. Flow and transport in regions with aquatic vegetation. Annu. Rev. Fluid Mech. 2012, 44, 123–142. [Google Scholar] [CrossRef]
- Siniscalchi, F.; Nikora, V. Dynamic reconfiguration of aquatic plants and its interrelations with upstream turbulence and drag forces. J. Hydraul. Res. 2013, 51, 46–55. [Google Scholar] [CrossRef]
- Chen, Y.C.; Kao, S.P. Velocity distribution in open channels with submerged aquatic plant. Hydrol. Process. 2011, 25, 2009–2017. [Google Scholar] [CrossRef]
- Sukhodolova, T.A.; Sukhodolov, A.N. Vegetated mixing layer around a finite-size patch of submerged plants: 1. Theory and field experiments. Water Resour. Res. 2012, 48. [Google Scholar] [CrossRef] [Green Version]


| Mean U (m∙s−1) | Discharge Q (m3∙s−1) | Mean H (m) | Width (m) | Reynolds Number (U∙H∙ν−1) | Froude Number (U∙(H∙g)−0.5) | |
|---|---|---|---|---|---|---|
| Jeziorka R. | 0.30 | 2.01 | 0.6 | 11 | 1.58 × 10⁵ | 0.123 |
| Świder R. | 0.51 | 4.26 | 0.46 | 18 | 1.88 × 10⁵ | 0.24 |
| Location | Mean L (cm) | Mean H (cm) | SD L (cm) | SD H (cm) | Mean Time τ (s) | Celerity (ms−1 × 10³) | Theoretical Celerity (ms−1 × 10³) |
|---|---|---|---|---|---|---|---|
| Profile II | 127.1 | 3.2 | 36.0 | 2.2 | 1338 | 0.949 | 0.112 |
| Profile III | 257.5 | 12.8 | 67.9 | 5.2 | – | – | – |
| Profile IV | 345.8 | 13.2 | 138.5 | 4.0 | 10.400 | 0.332 | 0.041 |
| Location | Mean Velocity ± SD (cm∙s−1) | Turbulence Intensity (Normalized) | Turbulent Kinetic Energy (m2∙s−2) | |||||
|---|---|---|---|---|---|---|---|---|
| U | V | W | ||||||
| Świder R. | Vegetated | 34.95 ± 9.61 | −4.52 ± 5.90 | 0.52 ± 4.25 | 0.2115 | 0.0437 | 0.1000 | 0.0032 |
| Clear | 40.56 ± 15.14 | −5.81 ±10.05 | −5.56 ± 8.41 | 0.2851 | 0.0628 | 0.1972 | 0.0102 | |
| Jeziorka R. | Vegetated | 39.46 ± 6.18 | 8.05 ± 4.90 | −0.62 ± 3.53 | 0.1521 | 0.1186 | 0.0885 | 0.0035 |
| Clear | 44.25 ± 6.21 | 3.28 ± 4.81 | −2.95 ± 3.66 | 0.1345 | 0.1011 | 0.0816 | 0.0034 | |
| Location | Reynolds Stresses (kg∙m−1∙s−2) | ||||||
|---|---|---|---|---|---|---|---|
| Normal Stresses | Tangential Stresses | ||||||
| Świder R. | Vegetated | −5.46 | 0.23 | −1.22 | −0.27 | 0.91 | 0.28 |
| Clear | −13.37 | −0.65 | −6.40 | 1.72 | 5.68 | −0.93 | |
| Jeziorka R. | Vegetated | −3.60 | −2.19 | −1.22 | 0.67 | 0.75 | −0.03 |
| Clear | −3.54 | −2.00 | −1.30 | −0.04 | 0.81 | −0.13 | |
| Parameter | Jeziorka River | Świder River | |||
|---|---|---|---|---|---|
| 5 July | 1 October | ||||
| 20 Samples | 22 Samples | ||||
| Mean ± SD | Median | Mean ± SD | Median | ||
| Diameter | (mm) | 0.99 ± 0.17 | 0.99 | 1.14 ± 0.31 | 1.01 |
| Maximum force | (N) | 0.022 ± 0.007 | 0.020 | 0.024 ± 0.017 | 0.020 |
| Maximum stress | (MPa) | 0.030 ± 0.013 | 0.025 | 0.023 ± 0.010 | 0.023 |
| Flexural strain | (%) | 4.38 ± 1.02 | 4.27 | 4.52 ± 1.73 | 4.33 |
| Max. deflection | (mm) | 16.14 ± 1.55 | 16.13 | 14.57 ± 2.97 | 15.62 |
| Sec. m. of area | (mm4) | 0.057 ± 0.049 | 0.046 | 0.131 ± 0.209 | 0.051 |
| Flexural rigidity | (N·mm2) | 7.82 ± 4.22 | 6.22 | 16.09 ± 5.27 | 16.07 |
| Flexural modulus | (MPa) | 175.20 ± 91.49 | 159.80 | 280.39 ± 188.84 | 271.75 |
| Parameter | Jeziorka River | Świder River | |||
|---|---|---|---|---|---|
| 5 July | 1 October | ||||
| 20 Samples | 19 Samples | ||||
| Mean ± SD | Median | Mean ± SD | Median | ||
| Diameter | (mm) | 0.98 ± 0.12 | 1.00 | 1.33 ± 0.35 | 1.28 |
| Breaking force | (N) | 3.32 ± 0.63 | 3.45 | 2.34 ± 0.77 | 2.22 |
| Breaking stress | (MPa) | 4.56 ± 1.30 | 4.63 | 1.91 ± 0.95 | 1.62 |
| Breaking strain | (%) | 12.33 ± 3.42 | 13.18 | 9.08 ± 2.17 | 8.84 |
| Young’s modulus | (MPa) | 104.50 ± 35.19 | 104.00 | 38.17 ± 26.01 | 35.83 |
© 2018 by the authors. Licensee MDPI, Basel, Switzerland. This article is an open access article distributed under the terms and conditions of the Creative Commons Attribution (CC BY) license (http://creativecommons.org/licenses/by/4.0/).
Share and Cite
Przyborowski, Ł.; Łoboda, A.M.; Bialik, R.J. Experimental Investigations of Interactions between Sand Wave Movements, Flow Structure, and Individual Aquatic Plants in Natural Rivers: A Case Study of Potamogeton Pectinatus L. Water 2018, 10, 1166. https://doi.org/10.3390/w10091166
Przyborowski Ł, Łoboda AM, Bialik RJ. Experimental Investigations of Interactions between Sand Wave Movements, Flow Structure, and Individual Aquatic Plants in Natural Rivers: A Case Study of Potamogeton Pectinatus L. Water. 2018; 10(9):1166. https://doi.org/10.3390/w10091166
Chicago/Turabian StylePrzyborowski, Łukasz, Anna Maria Łoboda, and Robert Józef Bialik. 2018. "Experimental Investigations of Interactions between Sand Wave Movements, Flow Structure, and Individual Aquatic Plants in Natural Rivers: A Case Study of Potamogeton Pectinatus L." Water 10, no. 9: 1166. https://doi.org/10.3390/w10091166