Evaluation of Water-Storage and Water-Saving Potential for Paddy Fields in Gaoyou, China
by
 ,
,
Chuanjuan Wang
1,2, 
Shaoli Wang
1,2,*,
Haorui Chen
1,2,3,
Jiandong Wang
1,2,
Yuan Tao
1,2 and
Jing Liu
1,2 1
State Key Laboratory of Simulation and Regulation of Water Cycle in River Basin, China Institute of Water Resources and Hydropower Research, Beijing 100048, China
2
National Center of Efficient Irrigation Engineering and Technology Research, China Institute of Water Resources and Hydropower Research, Beijing 100048, China
3
Changjiang River Scientific Research Institute of Changjiang Water Resources Commission, Wuhan 430079, China
*
Author to whom correspondence should be addressed.
Water 2018, 10(9), 1176; https://doi.org/10.3390/w10091176
Submission received: 30 July 2018
/
Revised: 24 August 2018
/
Accepted: 27 August 2018
/
Published: 2 September 2018
(This article belongs to the Section Water Use and Scarcity)
Abstract
:In China, the stress on agricultural water resources is becoming increasingly severe. In response, a range of water-saving irrigation (WSI) policies and practices have been promoted to improve irrigation efficiency. In this study, a water-balance model in paddy fields was calibrated and validated using a 2-year field experimental dataset collected from an irrigated area in Gaoyou, China, in 2014–2015. The model was used to assess the effects of WSI practices and provides options for implementing water-price reforms. Results show that paddy fields effectively retain rainfall with utilization rates greater than 70% for both shallow wet irrigation (SWI) and shallow humidity-regulated irrigation (SHRI) scenarios. The estimated average water-saving rates from 1960 to 2015 using SWI and SHRI are 33.7% and 43%, respectively, which represent considerable reductions in water consumption. The benefits of WSI practices combined with water management policies are also evident. For example, conversion of irrigation water to industrial water yields a 3-year average water fee of 205.2 yuan/ha using SWI and 20.6 yuan/ha using SHRI, considerably reducing farmers’ financial burden for agricultural water supplies. In conclusion, we recommend the adoption of SWI and SHRI practices in southern China as a means of partially alleviating China’s water-shortage problem.
1. Introduction
Agriculture is the largest consumer of water worldwide, accounting for 72% of water use globally and 87% in developing countries [1,2]. In China, the utilization coefficient of irrigation water is approximately 0.542, which is lower than that of developed countries, which is typically 0.7–0.8 [3]. Also, there is a serious shortage of agricultural water resources in China, which will reach 90 billion m3 by 2030 [4,5]. Globally, an estimated 34%–43% of irrigation water is used for rice cultivation [6]. In China, this percentage is approximately 70% [7,8]. It is even higher in southern China, where over 90% of irrigation water is used in rice cultivation [9]. Conversely, there is also a great potential to save a considerable amount of water during paddy-rice production. This potential can be effectively realized through two strategies, namely the adoption of water-saving irrigation (WSI) practices and the optimization of water management systems by encouraging the reuse of agricultural water, the rational pricing of irrigation water and the implementation of appropriate regulations with respect to water rights and water markets [10,11,12].
Water-saving irrigation practices can dramatically reduce water consumption. For example, Sujono [13] posited that semi-dry cultivation (SDC) and alternate wetting and drying (AWD) could reduce irrigation water use by 38.5% and 55.4% respectively compared with traditional irrigation practices. In China, a wide range of WSI practices, including AWD and controlled irrigation have been promoted to achieve water savings of 10%–30% over traditional irrigation methods [2,14,15,16].
Numerous water-balance models have been used to estimate the amount of water saved during paddy-rice production under different irrigation management scenarios. For example, Kim et al. [17] developed a daily water-balance model to simulate the daily ponding depth of surface water in paddy fields, with results suggesting that more rainwater is stored when plants are seeded directly as opposed to transplantation. Sujono [13] also showed that WSI practices can greatly influence the amount of rainfall stored by paddy fields. For example, the semi-dry cultivation technique, which was the most effective practice examined in their study, was able to retain a maximum of 55.7% of the total rainfall amount.
Water-management policies also have an important influence on the effectiveness of WSI practices. For example, agricultural water pricing is a useful tool for reducing water consumption. Nevertheless, due to the government subsidy, the water prices used for agriculture is lower than water supply cost, leading to problems including waste of water resources, insufficient collection of funds for necessary maintenance and environmental water pollution [18]. A rational agricultural water price can reward water-saving behavior, punish the wasteful use of water and improve awareness about water conservation among local water users [19]. Additionally, water-rights markets have been shown to be important means of regulating water use. For example, a study in the western United States showed that the redistribution of a small amount of surface water can lead to the economic optimization of irrigation districts [20]. In South Africa, Pingali and Rosegrant [21] concluded that the allocation of water rights to farmers would lead to more efficient water use during grape cultivation. Agricultural water price reforms not only allow for more flexible and efficient use of water resources but also stimulate the implementation of water-saving technologies. In China, localized reforms of agricultural water prices have been developed, evolving from a system of unpaid water resources to a uniform charge by area and most recently to a ladder water price [22]. However, water-rights transactions have not been implemented on a large scale [19,23,24].
Climate change increases pressure on human beings and ecosystem in recent years, which lead to a series of extreme events, such as more frequent and intense flood disasters, droughts and cyclones [25]. Rising temperatures and decreasing precipitation increase the water stress on crops and thus threaten food security. While the decline of yield is expected to lower photosynthesis ability and more requirement of water. With the challenges of climate change on food security and water cycle, the appropriate adoption is proposed. Babel et al. [26] evaluated potential management practices which can mitigated the decrease in crop yields under future climatic conditions, such as proper nutrient management. Deb et al. [27] also pointed out that supplementary irrigation can enhances the yield under future climate relative to rainfed condition, the main reason is that irrigation enhances available water for plants, satisfy the crops evapotranspiration and thus the yield is met up to the potential. Kim et al. [28] pointed that paddy field has the important functions of flood prevention and water conservation. Because it distributed more scattered compared with dam. So, proper water resource management for rice can help to address the challenges imposed by future climate change.
In this study, different WSI and drainage-water reuse practices are evaluated and discussed against the background of the agricultural water price reforms implemented in Gaoyou. First, a daily paddy-field water-balance model is constructed and calibrated, with two years field measurement data at Gaoyou were used, after the model was developed, the water storage and water-saving of paddy during cultivation period for different WSI practices were simulated. Second, the economic benefits of implementing WSI and water-rights conversion are evaluated under premise of agricultural water price reform.
2. Materials and Methods
2.1. Description of the Study Area
The study area is located in the Zhoubeidun village in the southern section of Gaoyou City in Jiangsu Province (32°45′55″ N, 119°11′15″ E), the surface elevation of study area is 2.9 m. This region belongs to the subtropical monsoon climate zone. The annual average temperature is 15 °C. The average annual rainfall and evaporation are 1030 mm and 1060 mm, respectively. The frost-free period comprises 217 days a year. The soil in the cultivation layer is clay loam. The annual average depth of shallow groundwater is 0.5–1.2 m. The rice variety is single-season semilate rice Feng Liangyou No.1. Generally, rice is soaked in early June lasting 3–5 days, transplanted in mid-June and harvested in mid-October.
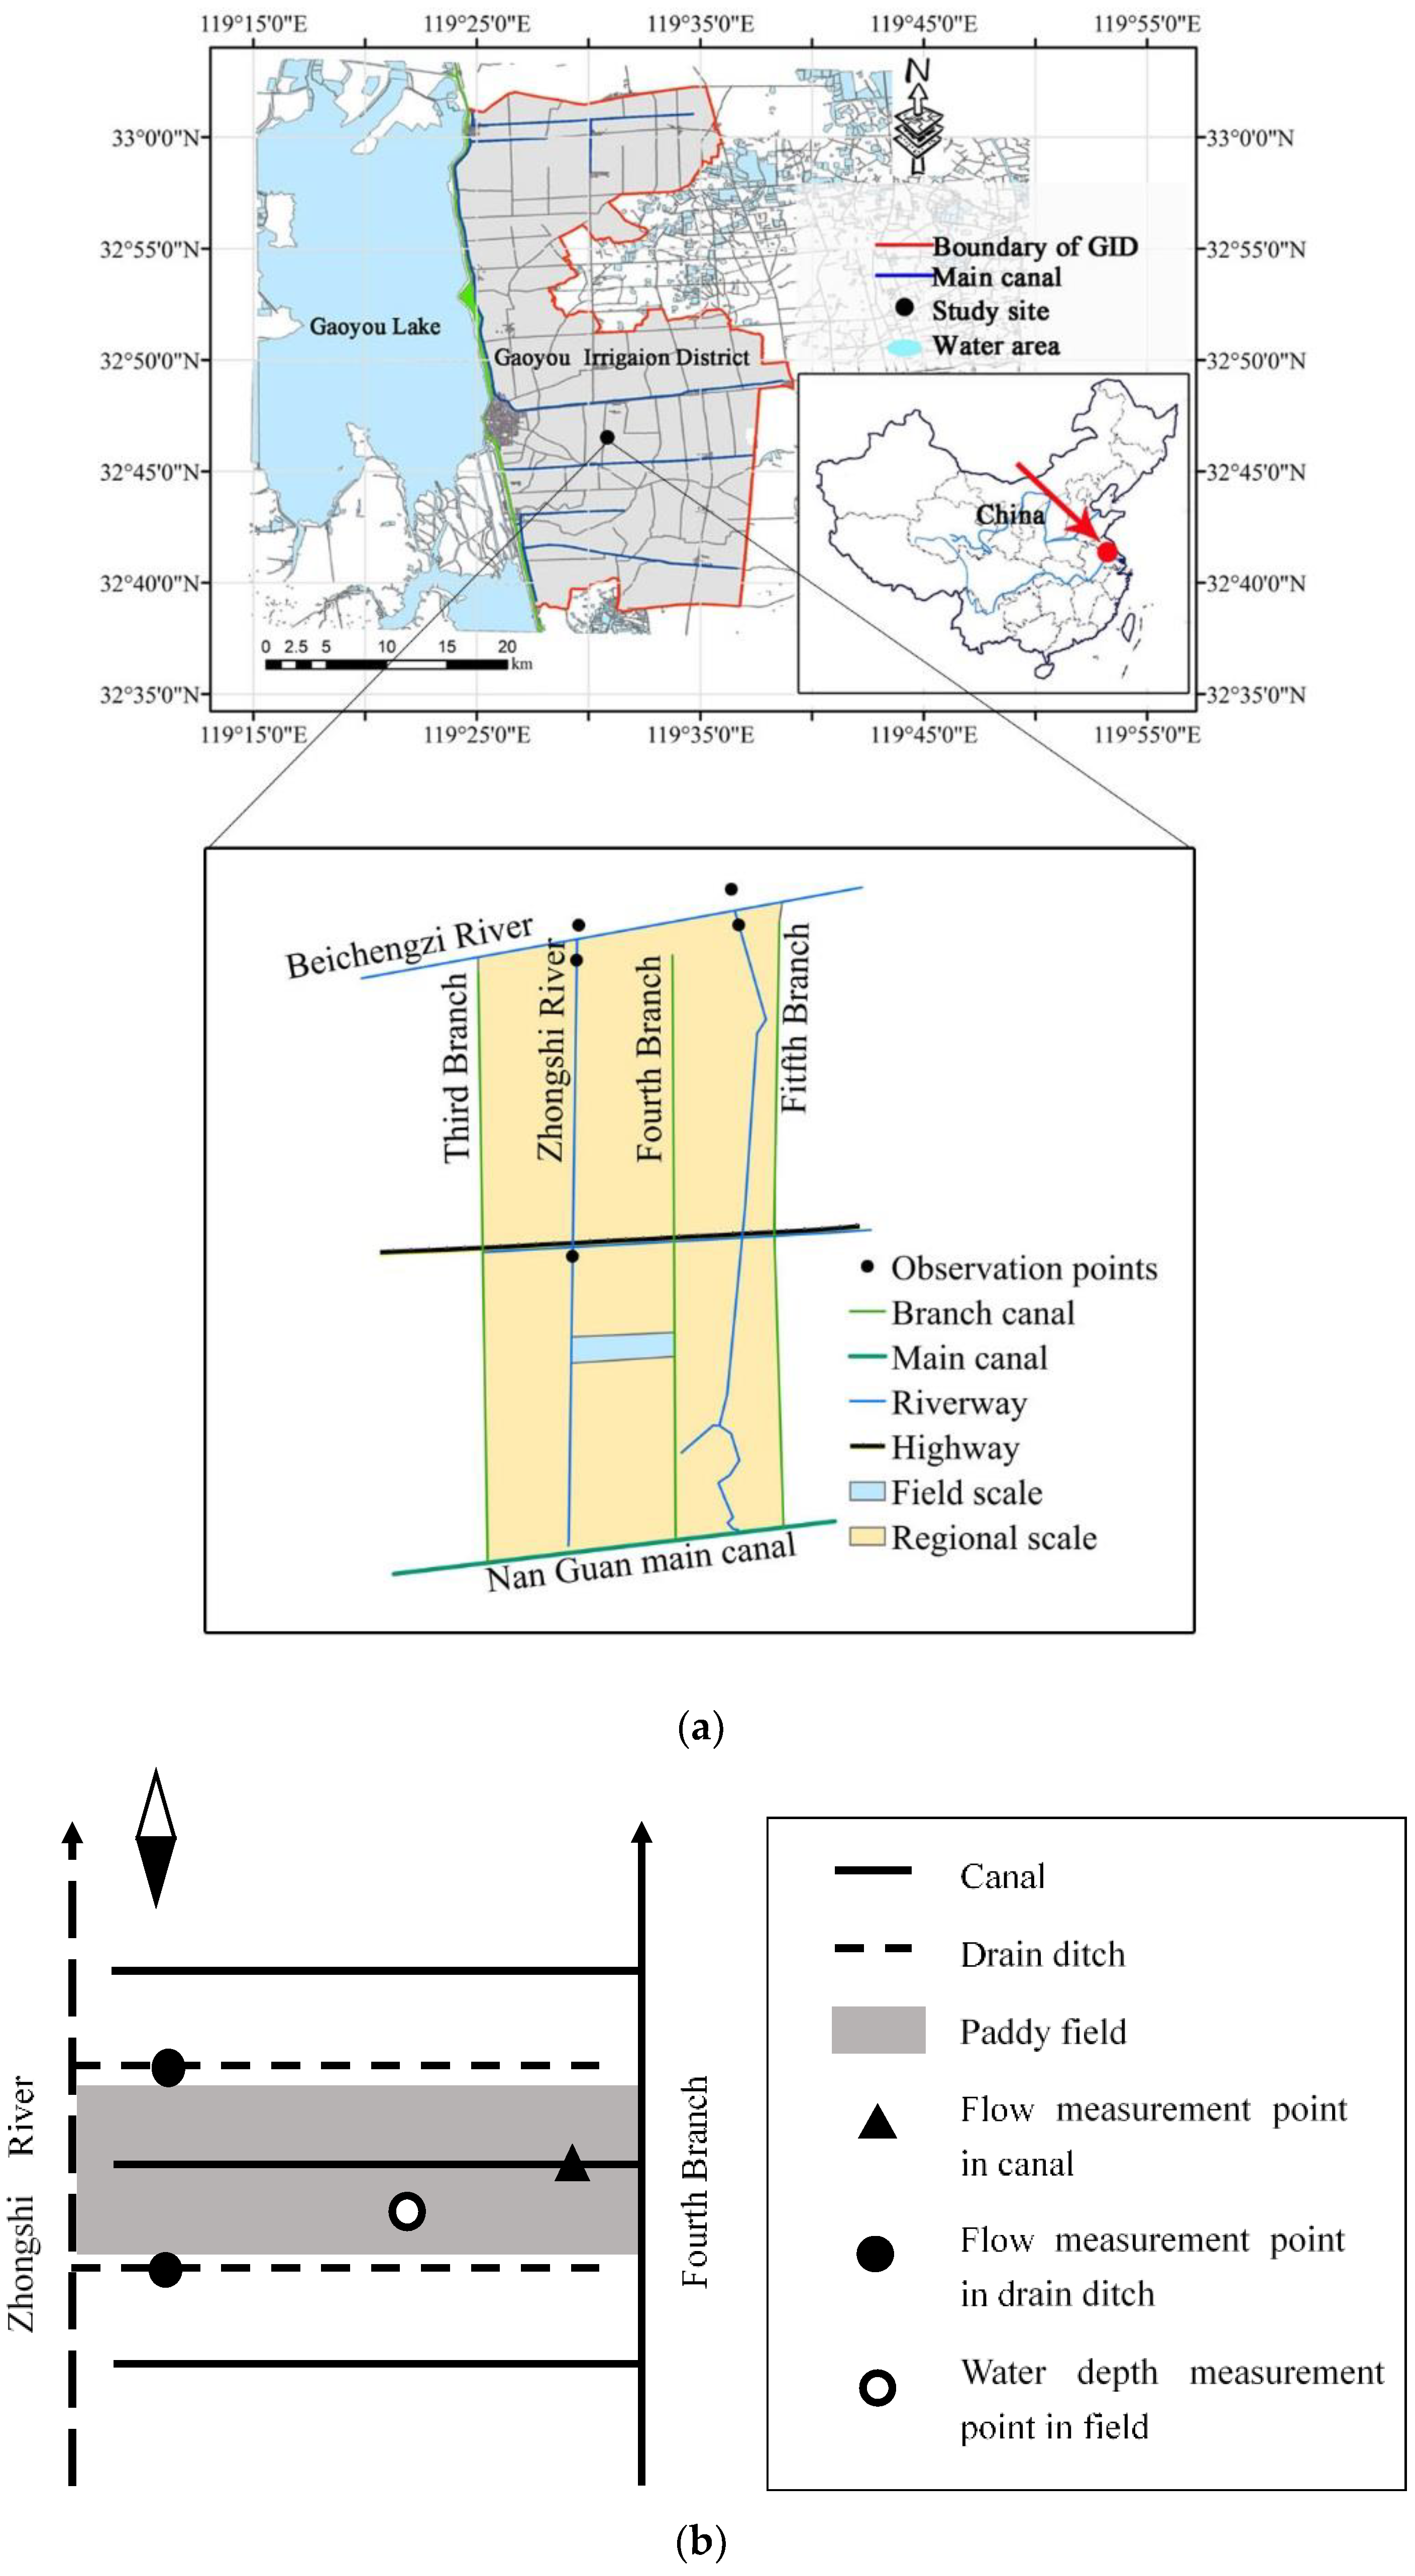
A 2-year experiment was conducted during the rice-growing season of 2014 and 2015. The experiment was divided into field and regional scales according to the controlled region (Figure 1). The field-scale study site had an area of 18.67 ha and, including the test area, a lateral canal (Gongzhuang Third Canal) and two lateral drainage ditches. The dimensions of a typical field are 30 m × 90 m. The regional-scale study site had an area of 1295.95 ha. The regional-scale area is bordered by the Third Branch Canal to the west, the Nanguan Main Canal to the south, the Beichengzi River to the north and the Fifth Branch Canal to the east. Irrigation water is pumped to the lateral canal and then onto the field. Drainage water flows through field ditches into the Zhongshi River, the Jiangma River and then finally into the Beichengzi River. The Zhongshi River, which drains an area of 828.73 ha, is 5.2 km long and 5 m wide with a discharge rate of 15 m3/s.
2.2. Observation of Water-Balance Components
2.2.1. Meteorological Data Collection
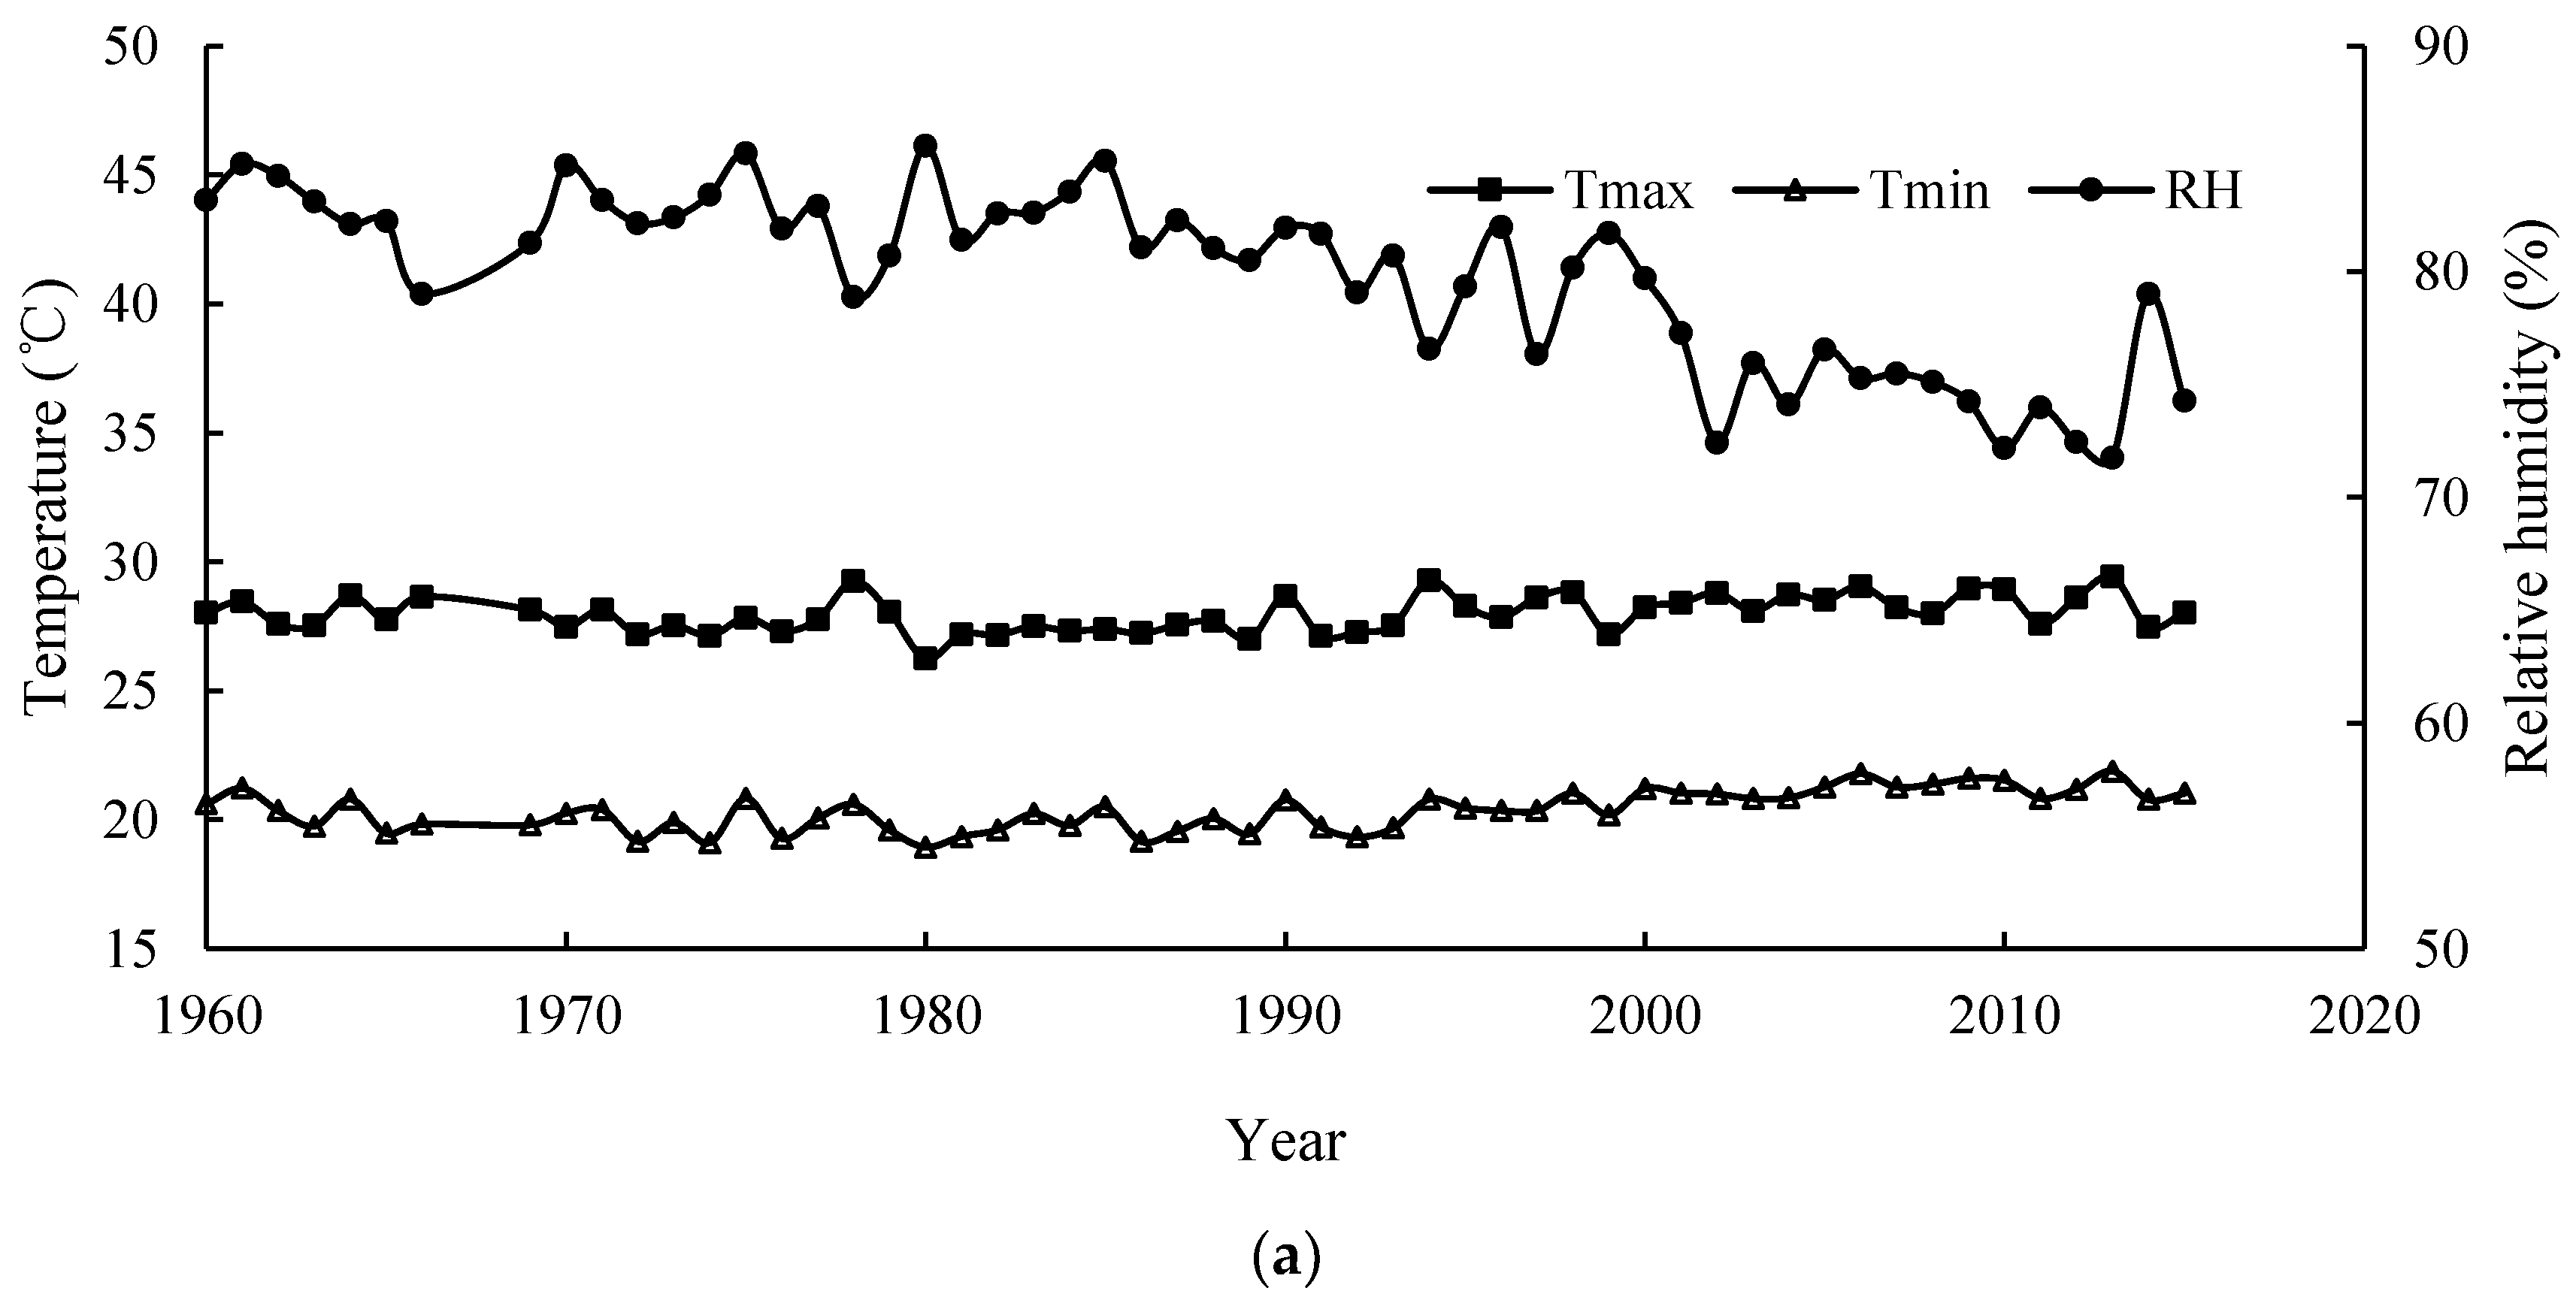
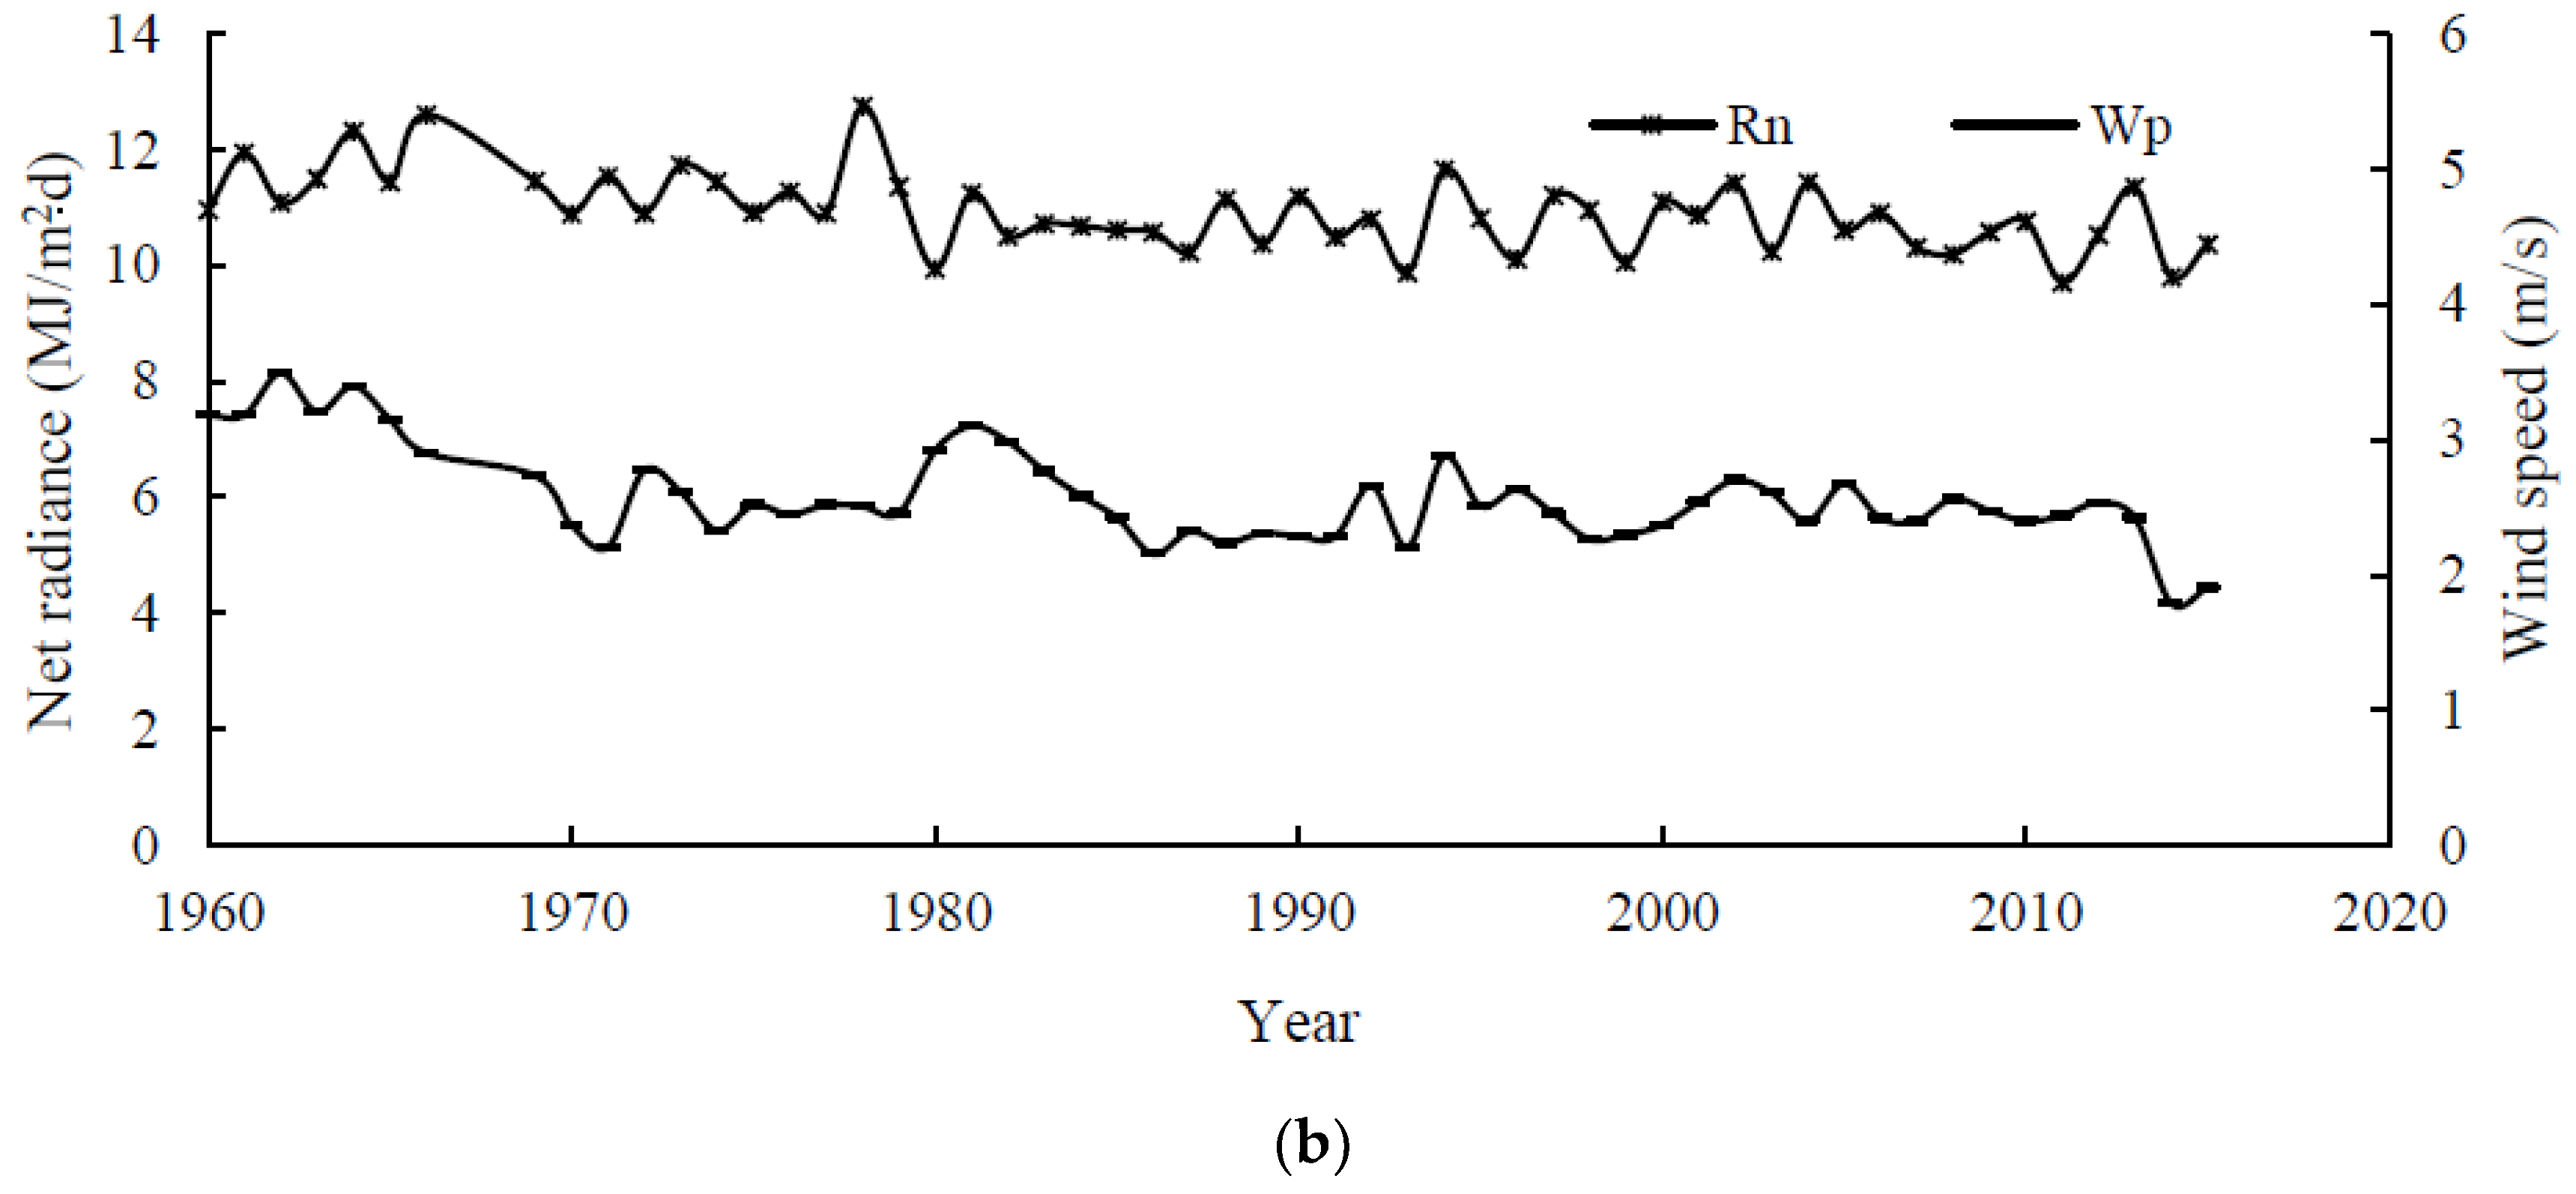
Meteorological data covering the years 1960–2015 (of which 1967 and 1968 are missing) were obtained from the Gaoyou Meteorological Station. These data mainly include hourly rainfall, daily rainfall, daily maximum temperature, daily minimum temperature, daily humidity, daily atmospheric radiation, daily wind speed and wind direction. Average daily meteorological values used in reference crop evapotranspiration (ET0) calculation from 1960 to 2015 is shown in Figure 2.
2.2.2. Irrigation Water
The water level in the canal was obtained by a combination of automatic and manual recording in 2014 and 2015. An automatic monitoring system was installed at the head of the lateral canal with the manual observation point established at the same location. Discharge of the canals was calculated using the area–velocity method. However, because of the small cross-section, the stage height and velocity of the canal were measured at a single point. A rating curve was then constructed by manually graphing flow measurements against the corresponding stage heights.
2.2.3. Drainage Water
The observation and calculation methods for the water level and discharge in the drainage ditches were the same as those used in the canals in 2014 and 2015. The water level of the Zhongshi River measured at the middle of the channel was primarily recorded by the automatic monitoring system. Discharge of the river was calculated using the area-velocity method based on measurements taken at seven lines along a single cross-section of the river.
2.3.4. Ponding Water Depth
The terrain is relatively flat in Gaoyou and three typical points of paddy fields were selected and the ponding water depth was measured with a water gauge twice a day during the observation period in 2014 and 2015.
2.3. Selection and Classification of Hydrological Years and Irrigation Modes
Different hydrological years and irrigation modes were considered in analyzing the water balance of the paddy fields. Hydrological frequency analysis was conducted using the Pearson type-III model method, with three classes of wet, normal and dry years corresponding to P ≤ 37.5%, 37.5% < P < 62.5% and P ≥ 62.5%, respectively. Traditional irrigation (TI), shallow wet irrigation (SWI) and shallow humidity-regulated irrigation (SHRI) were selected as irrigation scenarios. SWI for paddy fields is an intermittent irrigation mode that alternates between shallow water and wetting. SHRI is a combination mode of shallow water, wetting and intermittent irrigation. The ponding water depths for the different irrigation scenarios are shown in Table 1 [30]. In Table 1 Hmin and Hmax denote the lower and upper thresholds of water depth required for each rice growing stage. Hp is the depth of submergence tolerance of the paddy. The measured soil bulk density and mass saturated water content were 1.2 g/cm3 and 30%, respectively [31].
2.4. Paddy-Field Water-Balance Model
2.4.1. Introduction to the Paddy-Field Water-Balance Model
Water balance in a paddy field refers to the dynamic balancing of water inflows and outflows. The ponding depth and root zone of the paddy were selected together as the main focus for research. During the rice-growing period, the soil moisture changed as a result of water inflows and water consumption. The upper threshold (Hmax) and lower threshold (Hmin) of irrigation and depth of submergence tolerance of the paddy (Hp) were determined by the selected irrigation scenarios in Table 1. Based on the water-balance principle, the equation for daily ponding depth in a paddy field can be expressed as Formal 1 and the starting ponding depth was 20 mm.
where Ht is the ponding water depth on day t, mm; Ht−1 is the ponding water depth on day t − 1, mm; RFt is the rainfall on day t, mm; IRt is the irrigation depth on day t, mm; ETt is the crop evapotranspiration on day t, mm; DPt is the deep percolation on day t, mm; and SDt is the drainage on day t, mm.
2.4.2. Water-Balance Components
(1) Crop evapotranspiration
The reference crop evapotranspiration on day t (ET0t) was calculated using the FAO56 (Food and Agriculture Organization Irrigation and Drainage Paper No. 56) Penman–Monteith equation; the crop coefficient (Kct) is a function of the crop growth period as proposed in FAO56 [32] and shown in Figure 3 [33]. The potential evapotranspiration for the paddy field on day t (ETt) was calculated using the following formula:
where ETt is the potential evapotranspiration on day t, mm; Kct is the crop coefficient on day t and ET0t is the potential reference evapotranspiration on day t, mm; Rn is the net radiation, MJ/(m2·d); G is soil heat flux density at the soil surface, MJ/(m2·d); T is the mean temperature, °C; U2 is the wind velocity at 2-m height, m/s; es and ea are the saturated vapor pressure and actual vapor pressure, respectively, kPa; Δ is the slope on the saturated vapor pressure-temperature curve, kPa/°C; and γ is the psychrometric constant, kPa/°C. The rice growing season can be divided into four stages: the initial-, development-, middle- and terminal stages, which occur at 20, 30, 55 and 30 d respectively; Kcini, Kcmid and Kcend were 0.942, 1.488 and 0.94, respectively [34].
(2) Irrigation
The amount of irrigation water can be calculated as follows:
where Hmax and Hmin represent the upper and lower thresholds of rice irrigation water in Table 1. The other symbols have the same meanings as in previous equations.
(3) Deep percolation
When ponding occurs in the paddy field, that is, Ht ≥ 0, deep percolation is stable and can be considered a fixed value. If no ponded water exists in the paddy field, that is, Ht < 0, then deep percolation can be calculated as follows [35]:
where DP0 is the experimentally determined daily percolation when the soil moisture reaches the saturated moisture content, mm; K0 is the saturated hydraulic conductivity; α is an empirical constant that generally ranges from 50 to 250; which is adopted based on the soil type in the study area; t is the time when the soil moisture reaches the saturated state, d; and h is the soil depth of the root zone, which is taken to be 0.3 m [29]. As designated previously, Ht is the depth of ponded water in the paddy field on day, t, mm.
(4) Drainage
Drainage can be calculated as follows:
where the symbols have the same meanings as in previous equations.
(5) Storage of rainfall
where STt is the storage of rainfall on day t, mm; Hp is the depth of submergence tolerance of the paddy. The other symbols have the same meanings as in previous equations.
2.4.3. Model Implementation
The amount of paddy storage and irrigation are mainly affected by rainfall, evapotranspiration, deep percolation and irrigation method. In this study, Model inputs are meteorological data; initial ponding depth; height of wind speed measurement, mean temperature, mean relative humidity, mean wind speed, sunshine hour to simulate evapotranspiration (ETt), irrigation method to determine irrigation amount and irrigation time. The model outputs are daily ponding depth, amount of drainage, irrigation, paddy storage. The model parameters include K0 and α, used for calculation of deep percolation in Formula (5).
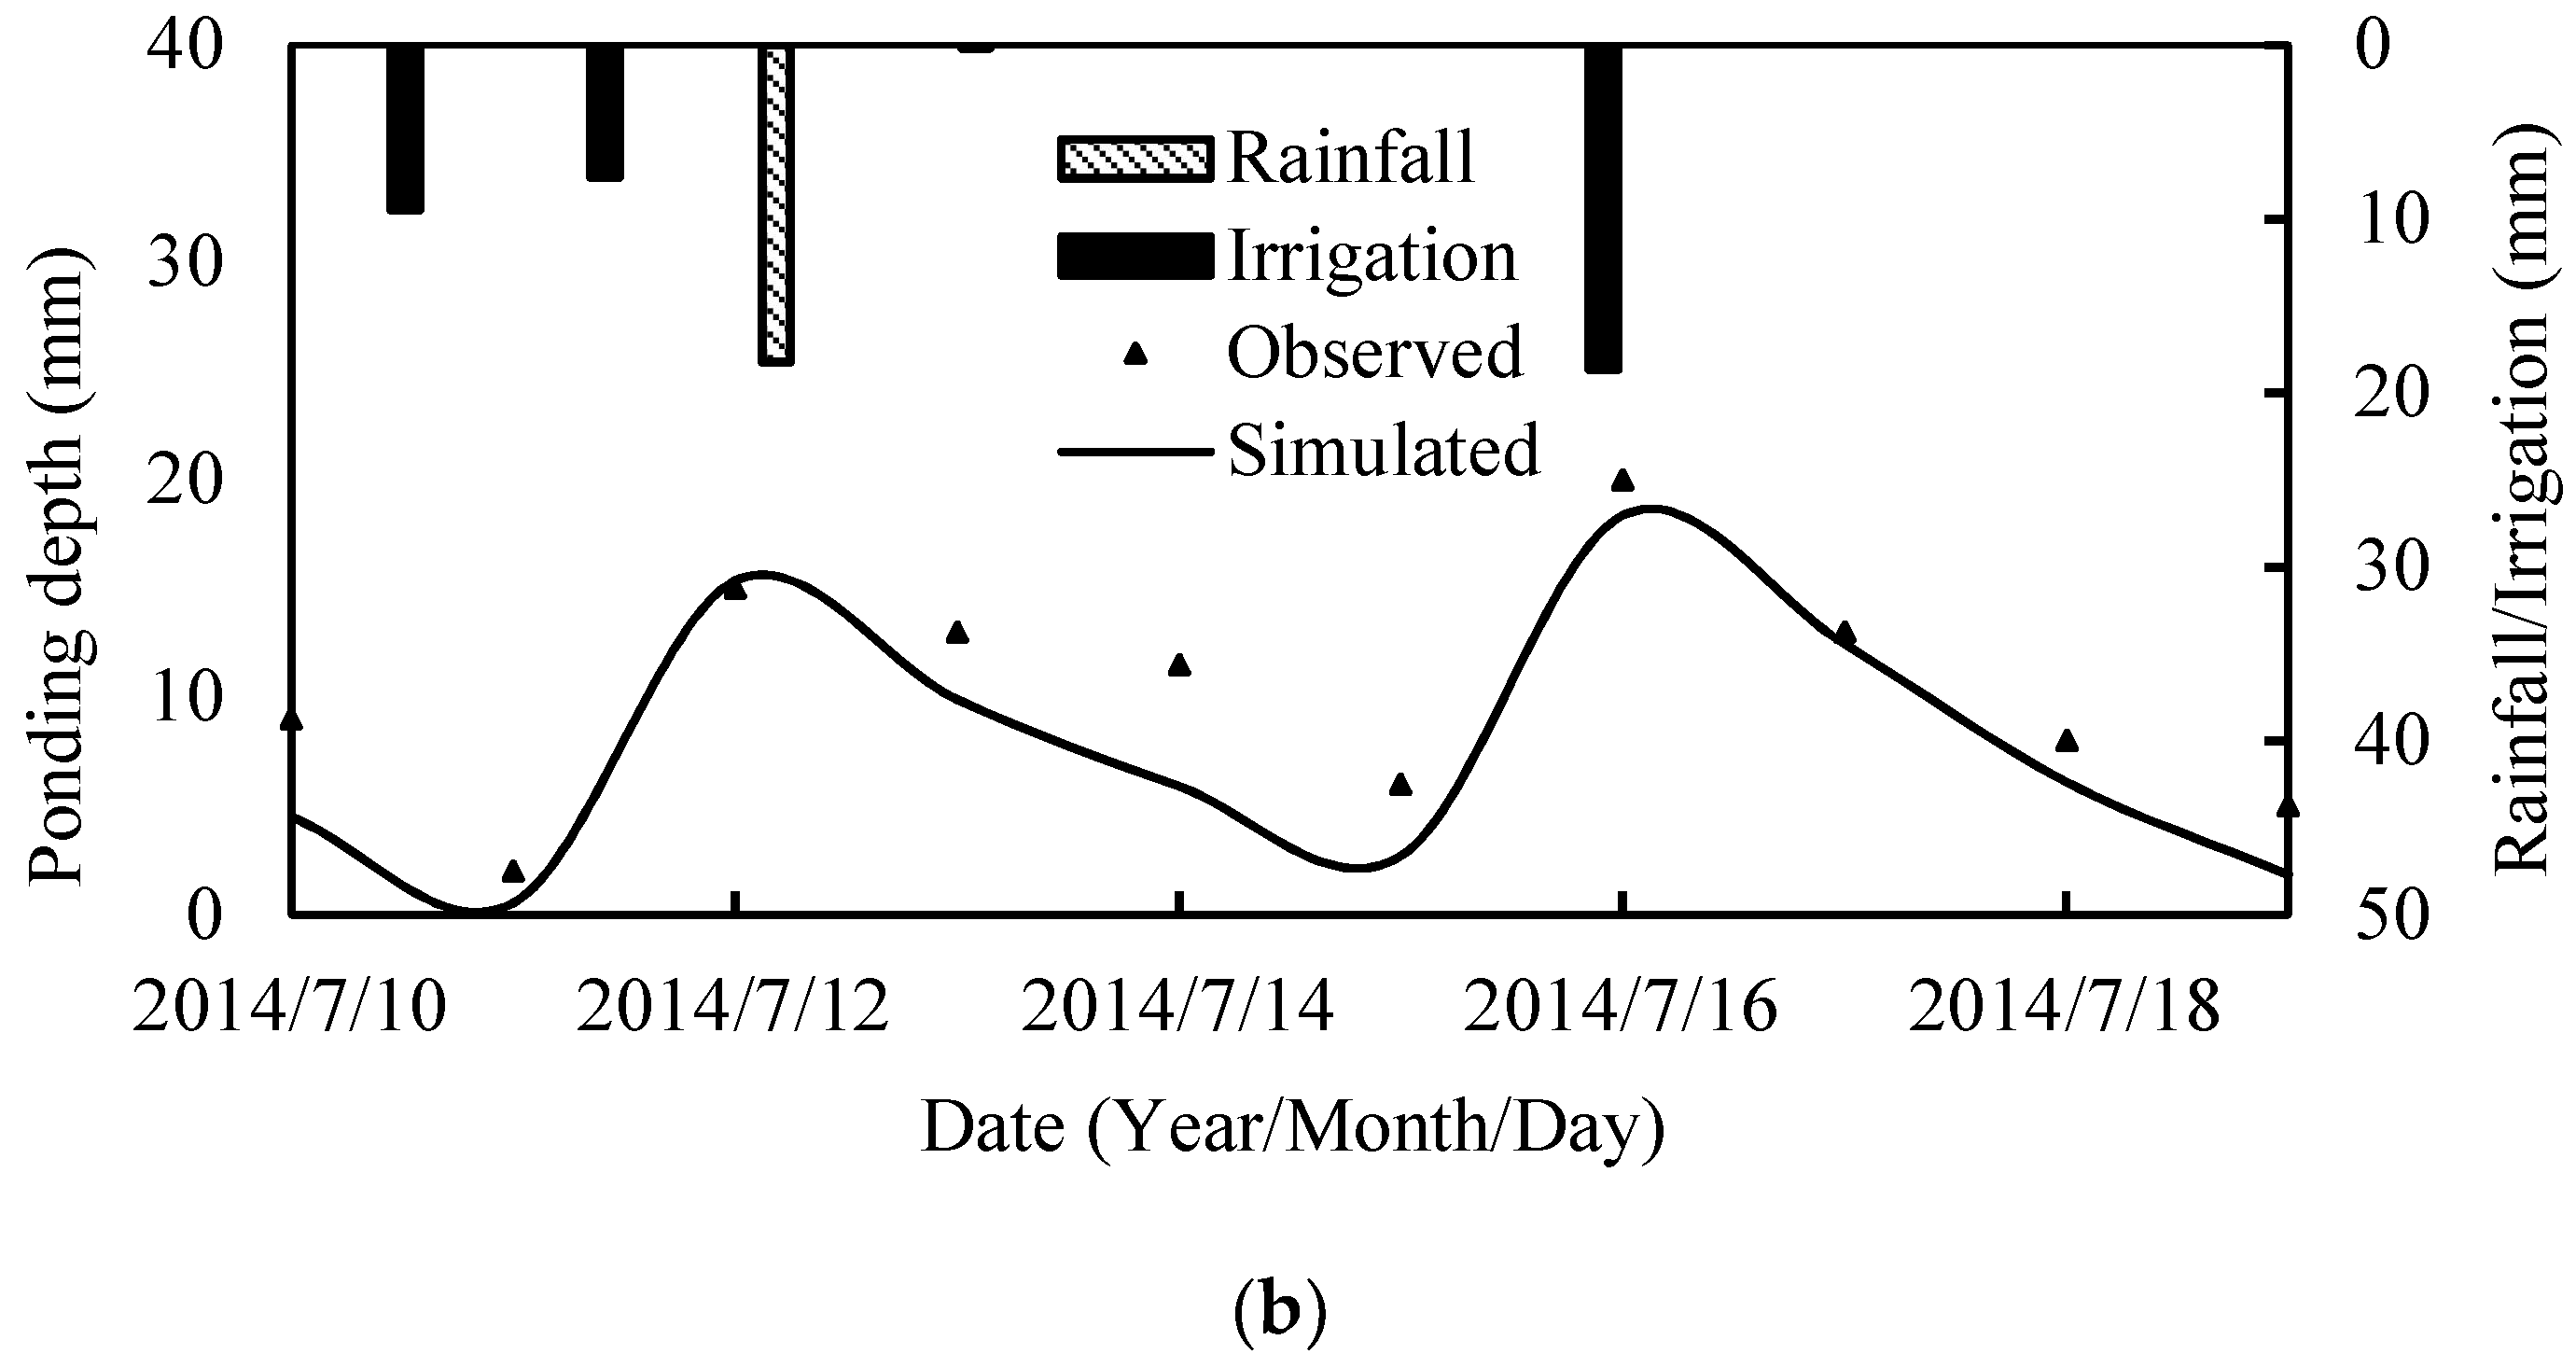
On the basis of the experimental data collected in 2014 and 2015, the model was calibrated using the measured values of water-balance components obtained in 2015 and validated using the observations obtained from 10–19 July 2014. Following this verification process, the final values of parameters K0 and α were 0.2 m/d and 180, respectively and the average percolation rate of the paddy field was calculated to be 3.7 mm/d, which is consistent with the average percolation of single-season semilate rice planted in clay loam [36].
To determine the accuracy of the model with respect to the validation data, three commonly used statistical parameters were selected: the model efficiency coefficient (NSE), the average deviation () and the average absolute deviation . These parameters are expressed as follows:
where Si is the simulated value, Oi is the observed value and is the average observed value, i is the number of the value. The value of NSE, which ranges from 0 to 1, reflects the correlation between the simulated and the observed values, reflects whether the observed values are systematically underestimated or overestimated and reflects the deviation between the simulated and the observed values.
3. Results and Discussion
3.1. Calibration of the Model with Field Measurement Data
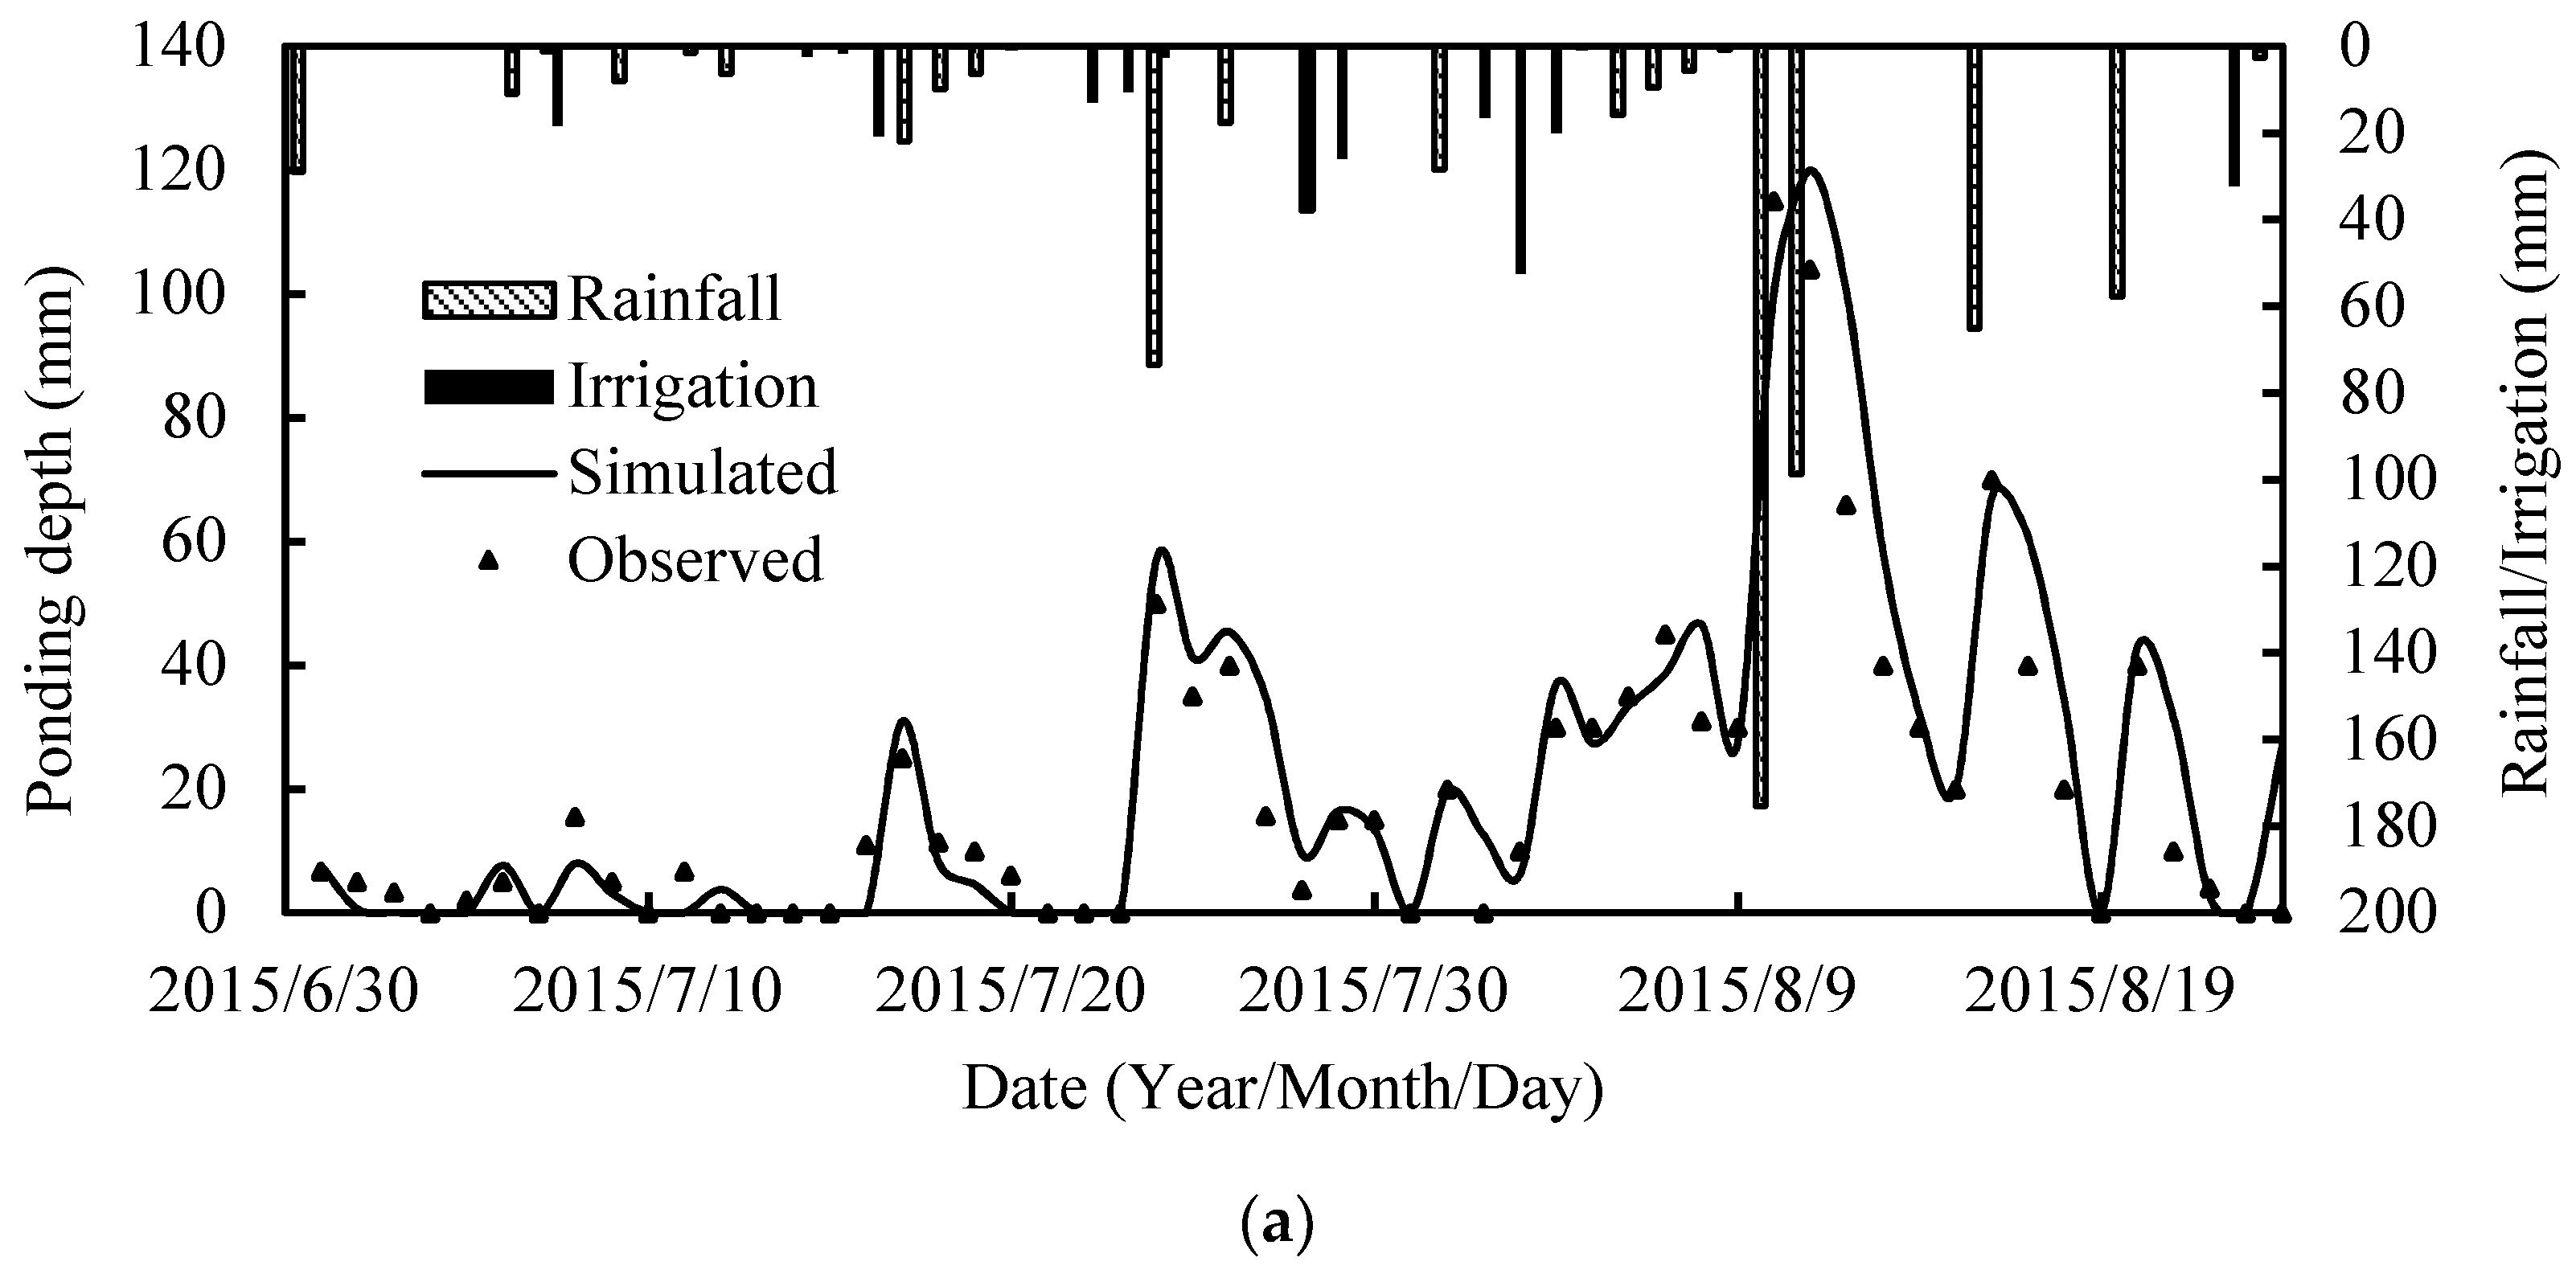
Comparisons of the observed and simulated values for 2015 and 2014 are shown in Figure 4a, 4b, respectively. As shown in Figure 4a, the simulated values of ponding water depth follow the same trend and exhibit a small deviation relative to the observed values. The correlation coefficient, NSE, is 0.84, is 0.63 mm and is 3.63 mm, indicating that the simulated data are a good fit to the observed values and that the values selected for model parameters accurately reflect the actual situation. In Figure 4b, the deviation between the simulated and the observed values for 2014 is likewise small and the trends of the simulated values are in good agreement with the observed values. The correlation coefficient, NSE, is 0.86, indicating that the model performs slightly better. Importantly, the model can be used for simulating the actual conditions of the study area.
3.2. Water Conservation in Paddy Fields
3.2.1. Rainfall Storage Amount in Paddy for Different Hydrological Years
Different hydrological years was conducted as shown in Table 2, three classes of wet, normal and dry years contain 20, 14, 20 years, respectively.
As shown in Table 3, paddy fields have a high capacity for rainfall storage with a 54-year average amount of 464.6 mm. The absolute amount of rainfall stored in paddy is correlated with total rainfall, showed a variation ranging from 372.4 mm to 563.0 mm irrespective of total rainfall from 440.5 mm to 836.4 mm. Rainfall storage amount ordered by year type is dry < normal < wet, with the rainfall storage increasing by approximately 100 mm from one type to the next. The storage ratio, which is defined as the ratio of paddy water storage by rainfall, ordered by year type is wet < normal < dry, with a difference of approximately 10% between adjacent year types.
3.2.2. Rainfall Storage Amount in Paddy for Typical Years
Two typical years in each year group were selected for further analysis. Results of these analyses are shown in Table 4. Compared with the dry year, 1973, the rainfall amount in the wet year, 1991, was nearly four times larger, irrigation was reduced by approximately 30% and rainfall storage was two times larger. These results illustrate how the capacity for water storage by paddy fields is strongly affected by the total rainfall amount. In analyzing 2 wet years, 1991 and 2015, similar amounts of irrigation and evapotranspiration occurred during the growth period of both years. However, these 2 years exhibited contrasting drainage and rainfall storage. This difference could be attributed to the continuous rainfall from 29 June 1991 to 11 July 1991, during which daily rainfall exceeded 100 mm on three occasions. Coincidentally, the rice during this period was in the early tilling stage meaning that the rice had little tolerance for flooding during this time as the maximum flooding resistance depth was only 80 mm. Thus, most of the rainfall was drained away without fully utilized. In contrast, storage ratio in 2015 was considerably higher and the volume of irrigation water was less than in 1991 because rainfall was relatively uniform during the growth season. As a result, the surface water depth could be replenished in a timely manner throughout the season.
For the normal years, 2012 and 2014, amounts of rainfall during the rice growing season were similar. However, the amount of evapotranspiration in 2012 was 147 mm higher than that in 2014. This difference is a result of the higher average temperature, longer average sunshine duration, higher wind speed and lower relative humidity in 2012 compared with 2014. The higher temperature resulted in the higher crop evapotranspiration and affected the water storage capacity of the paddy fields. As a consequence, irrigation was 210 mm greater in 2012 than in 2014.
Table 4 also shows that the irrigation amount was lowest in 2014, which is classified as a normal year in terms of rainfall. On further analysis, it is noted that the average number of rainy days in 2014 was 50 and the rainfall was frequent and uniformly distributed in August. As a result, the paddy field could maximize the use of rainfall water. In contrast, August precipitation data for 2015 indicate an intense period of rainfall that dropped 247.1 mm over 2 days. Thus, a considerable amount of water was discharged from the paddy field such that irrigation amounts for 2015 are slightly higher than those for 2014 even though total rainfall was higher in 2015. In summary, rainfall amount, rainfall duration, rainfall intensity and other meteorological factors act together in interaction with the rice growing cycle to affect the amount of irrigation and rainfall storage in paddy fields.
3.2.3. Water-Saving Effects of Different Irrigation Practices
The average values of different water-balance components calculated for different irrigation practices in hydrological years are shown in Table 5. These results clearly show that WSI scenarios are characterized by higher amounts of water storage than the TI scenario. For example, in normal years, the average storage ratio under TI, SWI and SHRI scenarios are 77.6%, 81.9% and 84.3%, respectively. The rainfall storage values were improved under the WSI scenarios, with SHRI being the most effective. The 54-year average rainfall storage for the TI scenario was calculated to be 464.6 mm of rainfall annually, whereas this value increases by 36.3 mm under the SWI scenario and 48.6 mm under the SHRI scenario. These values correspond to 5.7% and 7.6% increases in the storage ratio, respectively.
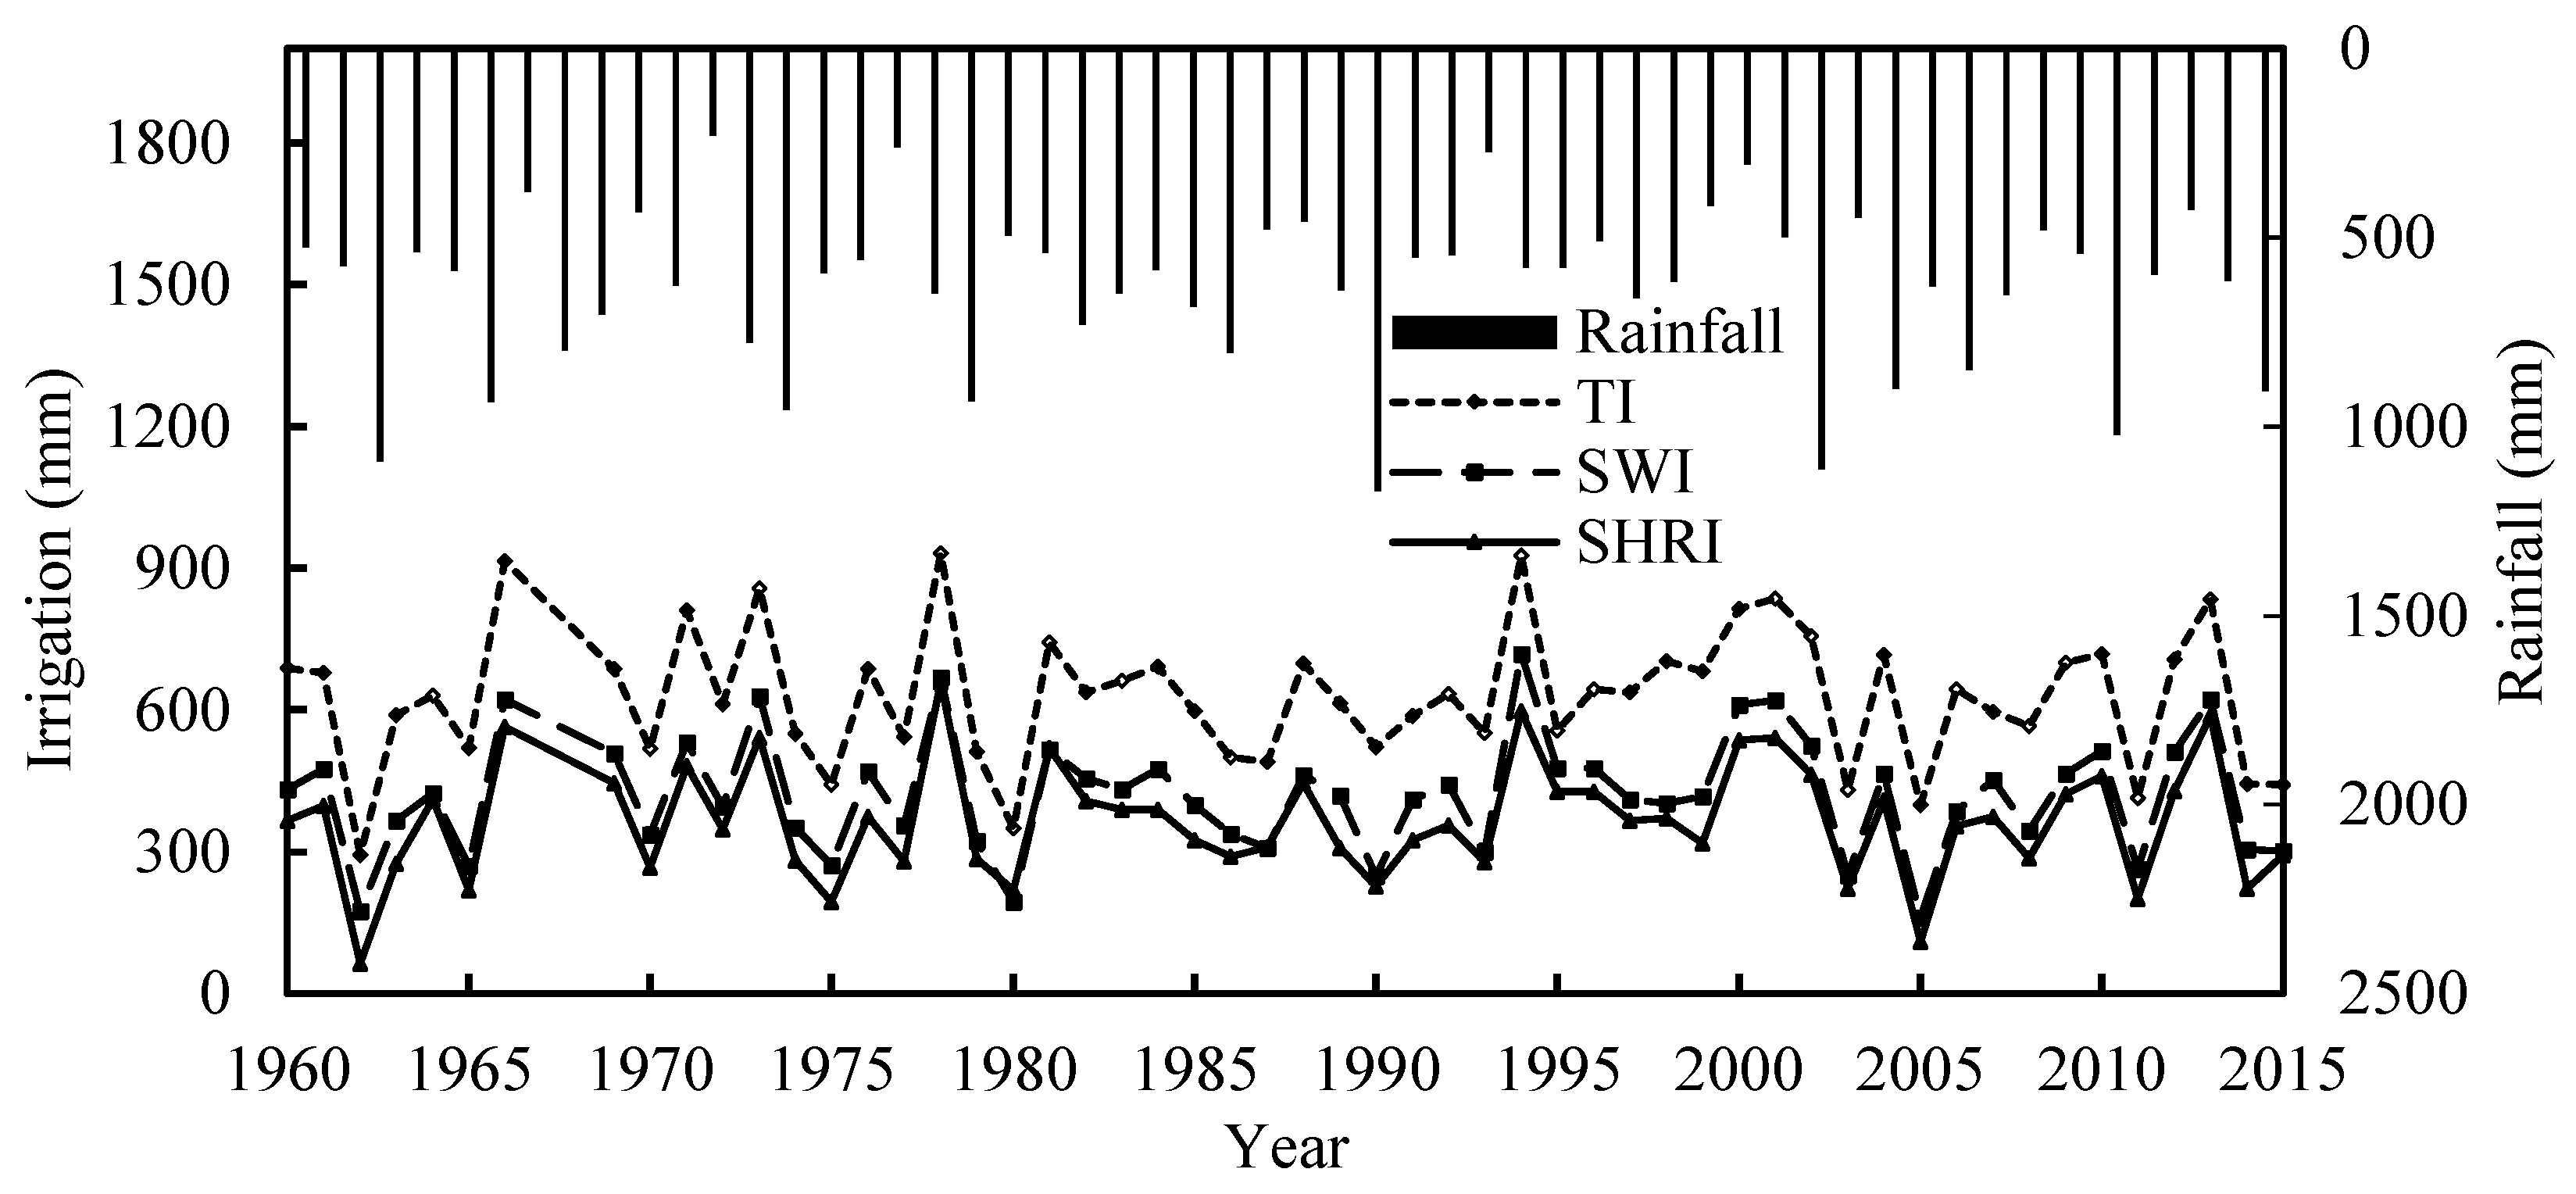
Moreover, SWI and SHRI serve to increase the storage ratio and reduce the irrigation amount in the same hydrological year, with SHRI consistently saving a greater amount of irrigation than SWI (in Table 5). The dry-year average irrigation amounts under the TI and SHRI scenarios were 755.1 mm and 462.4 mm, respectively, suggesting that SHRI could reduce irrigation amounts by 38.8% in comparison to TI. The average irrigation amount for the 54 years calculated for SHRI mode was 60 mm less than that for SWI and 270 mm less than that for TI, suggesting that SHRI has high water-saving potential.
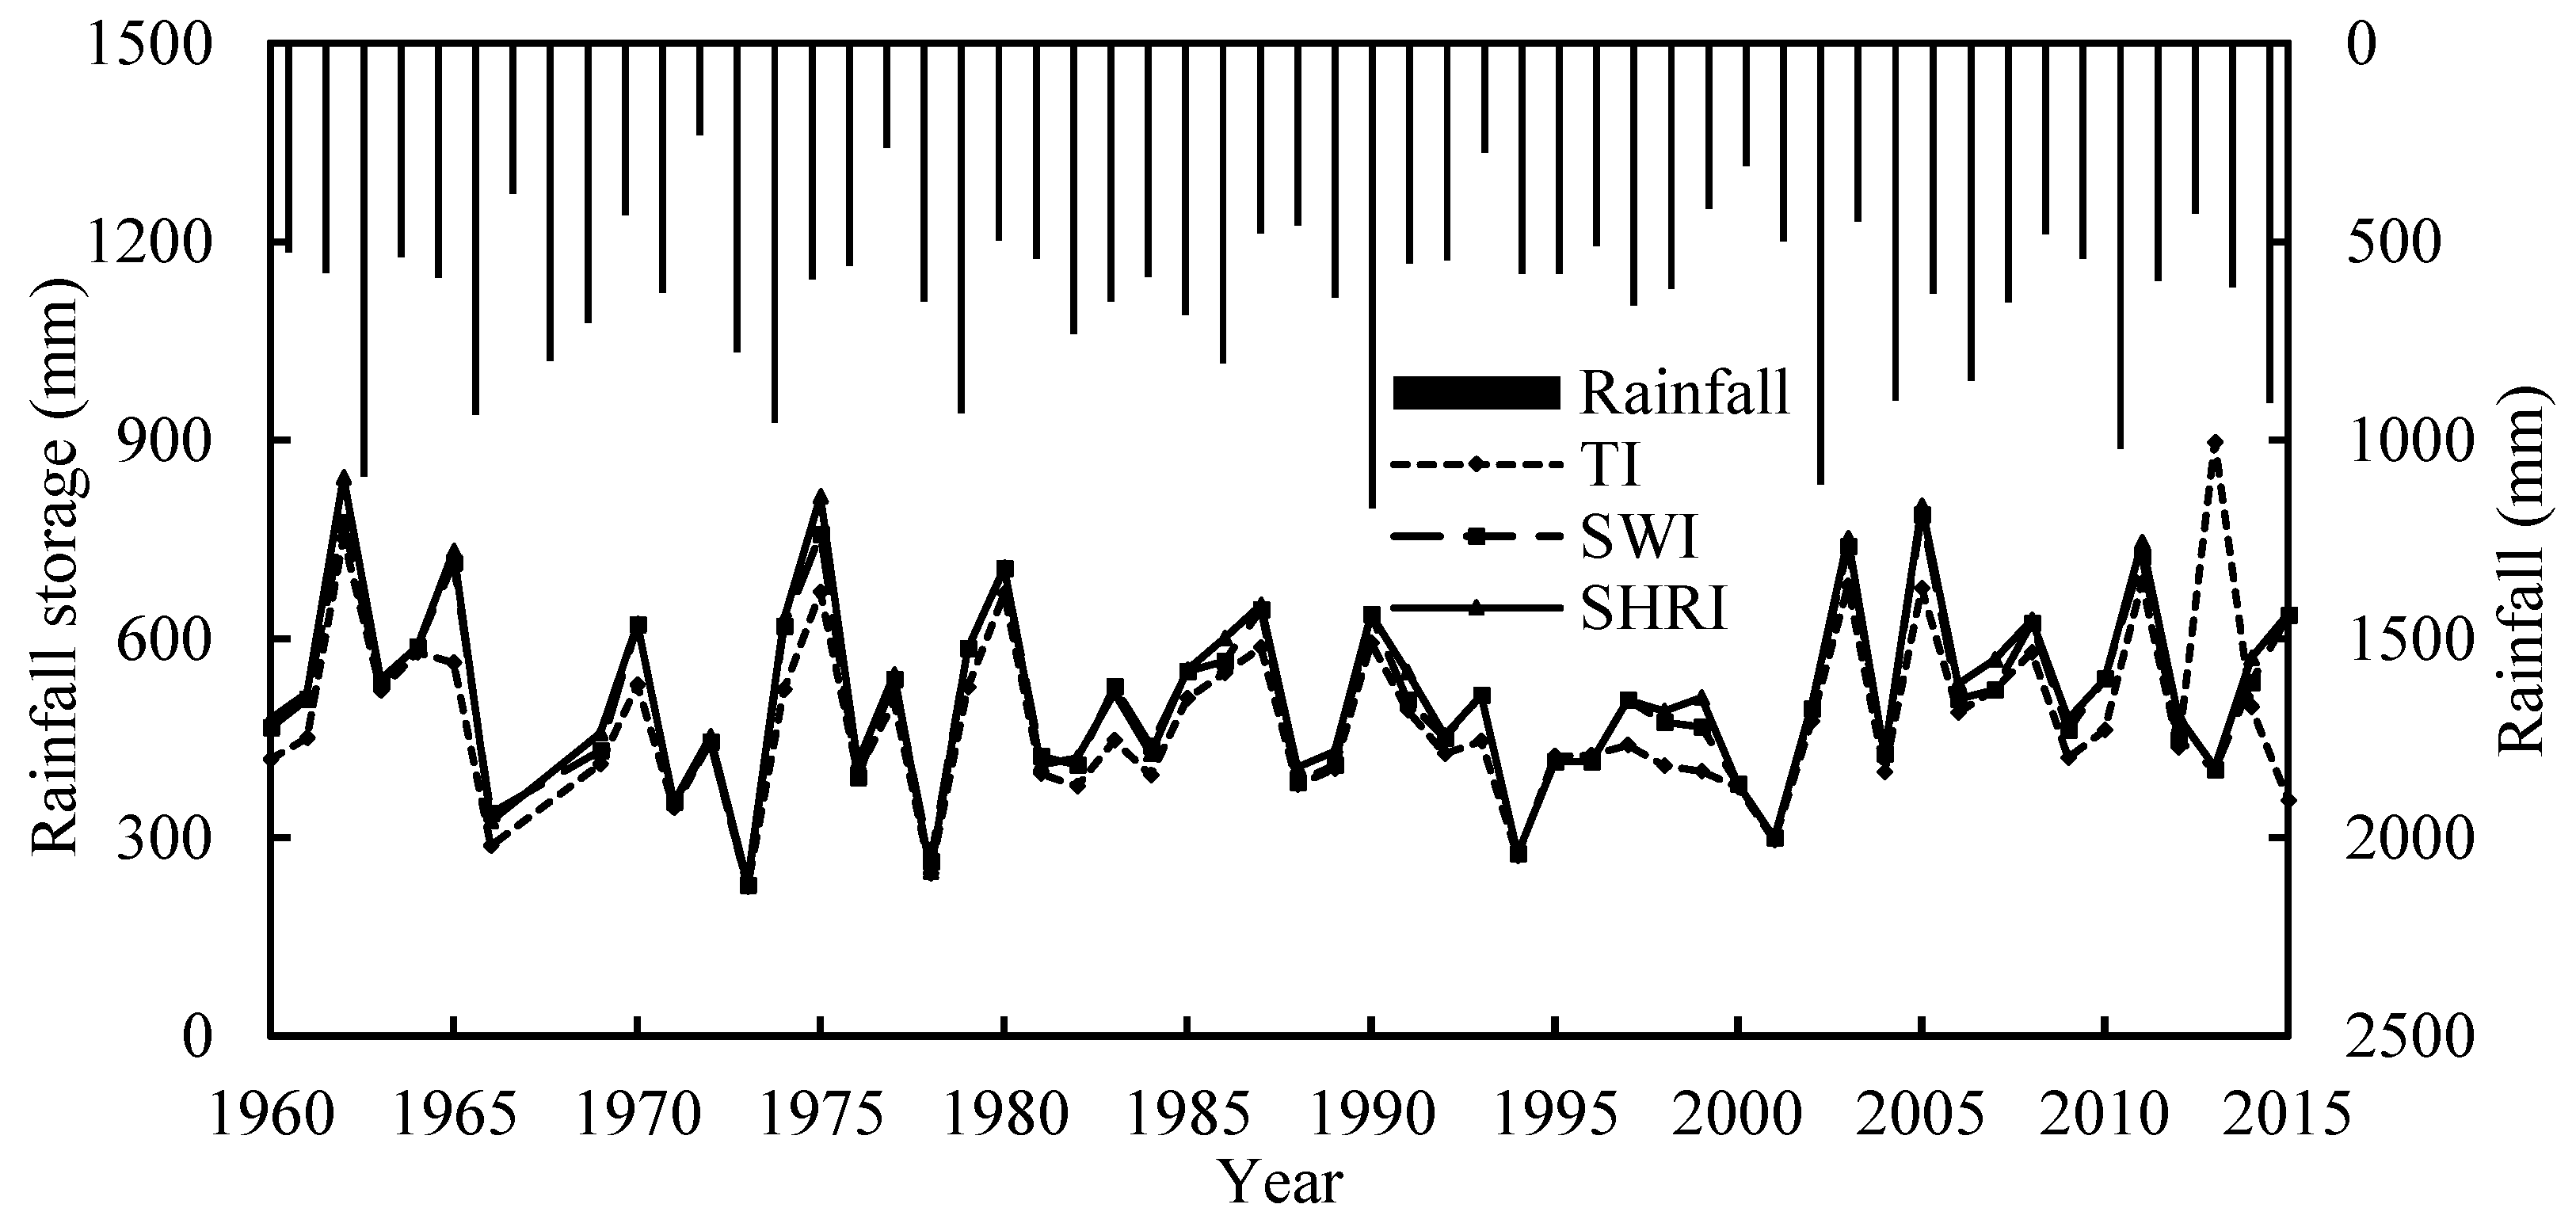
Figure 5 and Figure 6 show the rainfall storage and irrigation amounts under different irrigation scenarios. Figure 5 shows that the rainfall storage amounts under different irrigation scenarios follow the order TI < SWI < SHRI. The effects of the different irrigation scenarios on water savings are shown in Figure 6, which shows that water savings likewise follow the order TI < SWI < SHRI. This analysis shows that SHRI is the most effective practice for reducing irrigation amounts and increasing rainfall storage. Therefore, SHRI could be preferentially used in practice.
3.3. Reuse of Paddy Drainage Water
Reuse of drainage water is also an effective way to save water in paddy field production because this technique can serve to recycle nitrogen and phosphorus, reducing water eutrophication and non-point source pollution in downstream waters. At present, some farmers in the Gaoyou Irrigation District have a good understanding of drainage water reuse and they usually pump drainage water temporarily when the opportunity arises.
3.3.1. Evaluation of Reusing Drainage Water
The amount of water stored in the Zhongshi River is stabilized over time and can be operationalized for reuse. The water depths of the river during the rice growing season of 2014 and 2015 are shown in Figure 7a,b, respectively. The average, minimum and maximum water depths of the river were 1.73 m, 1.40 m and 2.63 m in 2014 and 1.93 m, 1.63 m and 3.30 m in 2015. Taking a water depth of 0.8 m to be the lower limit necessary for rice production, the potential amount of water that could be reused is approximately 27,700 m3, based on the size of the river at a depth of 1.8 m. Such an amount could potentially irrigate 92.3 ha of paddy fields with a ponding depth of 30 mm.
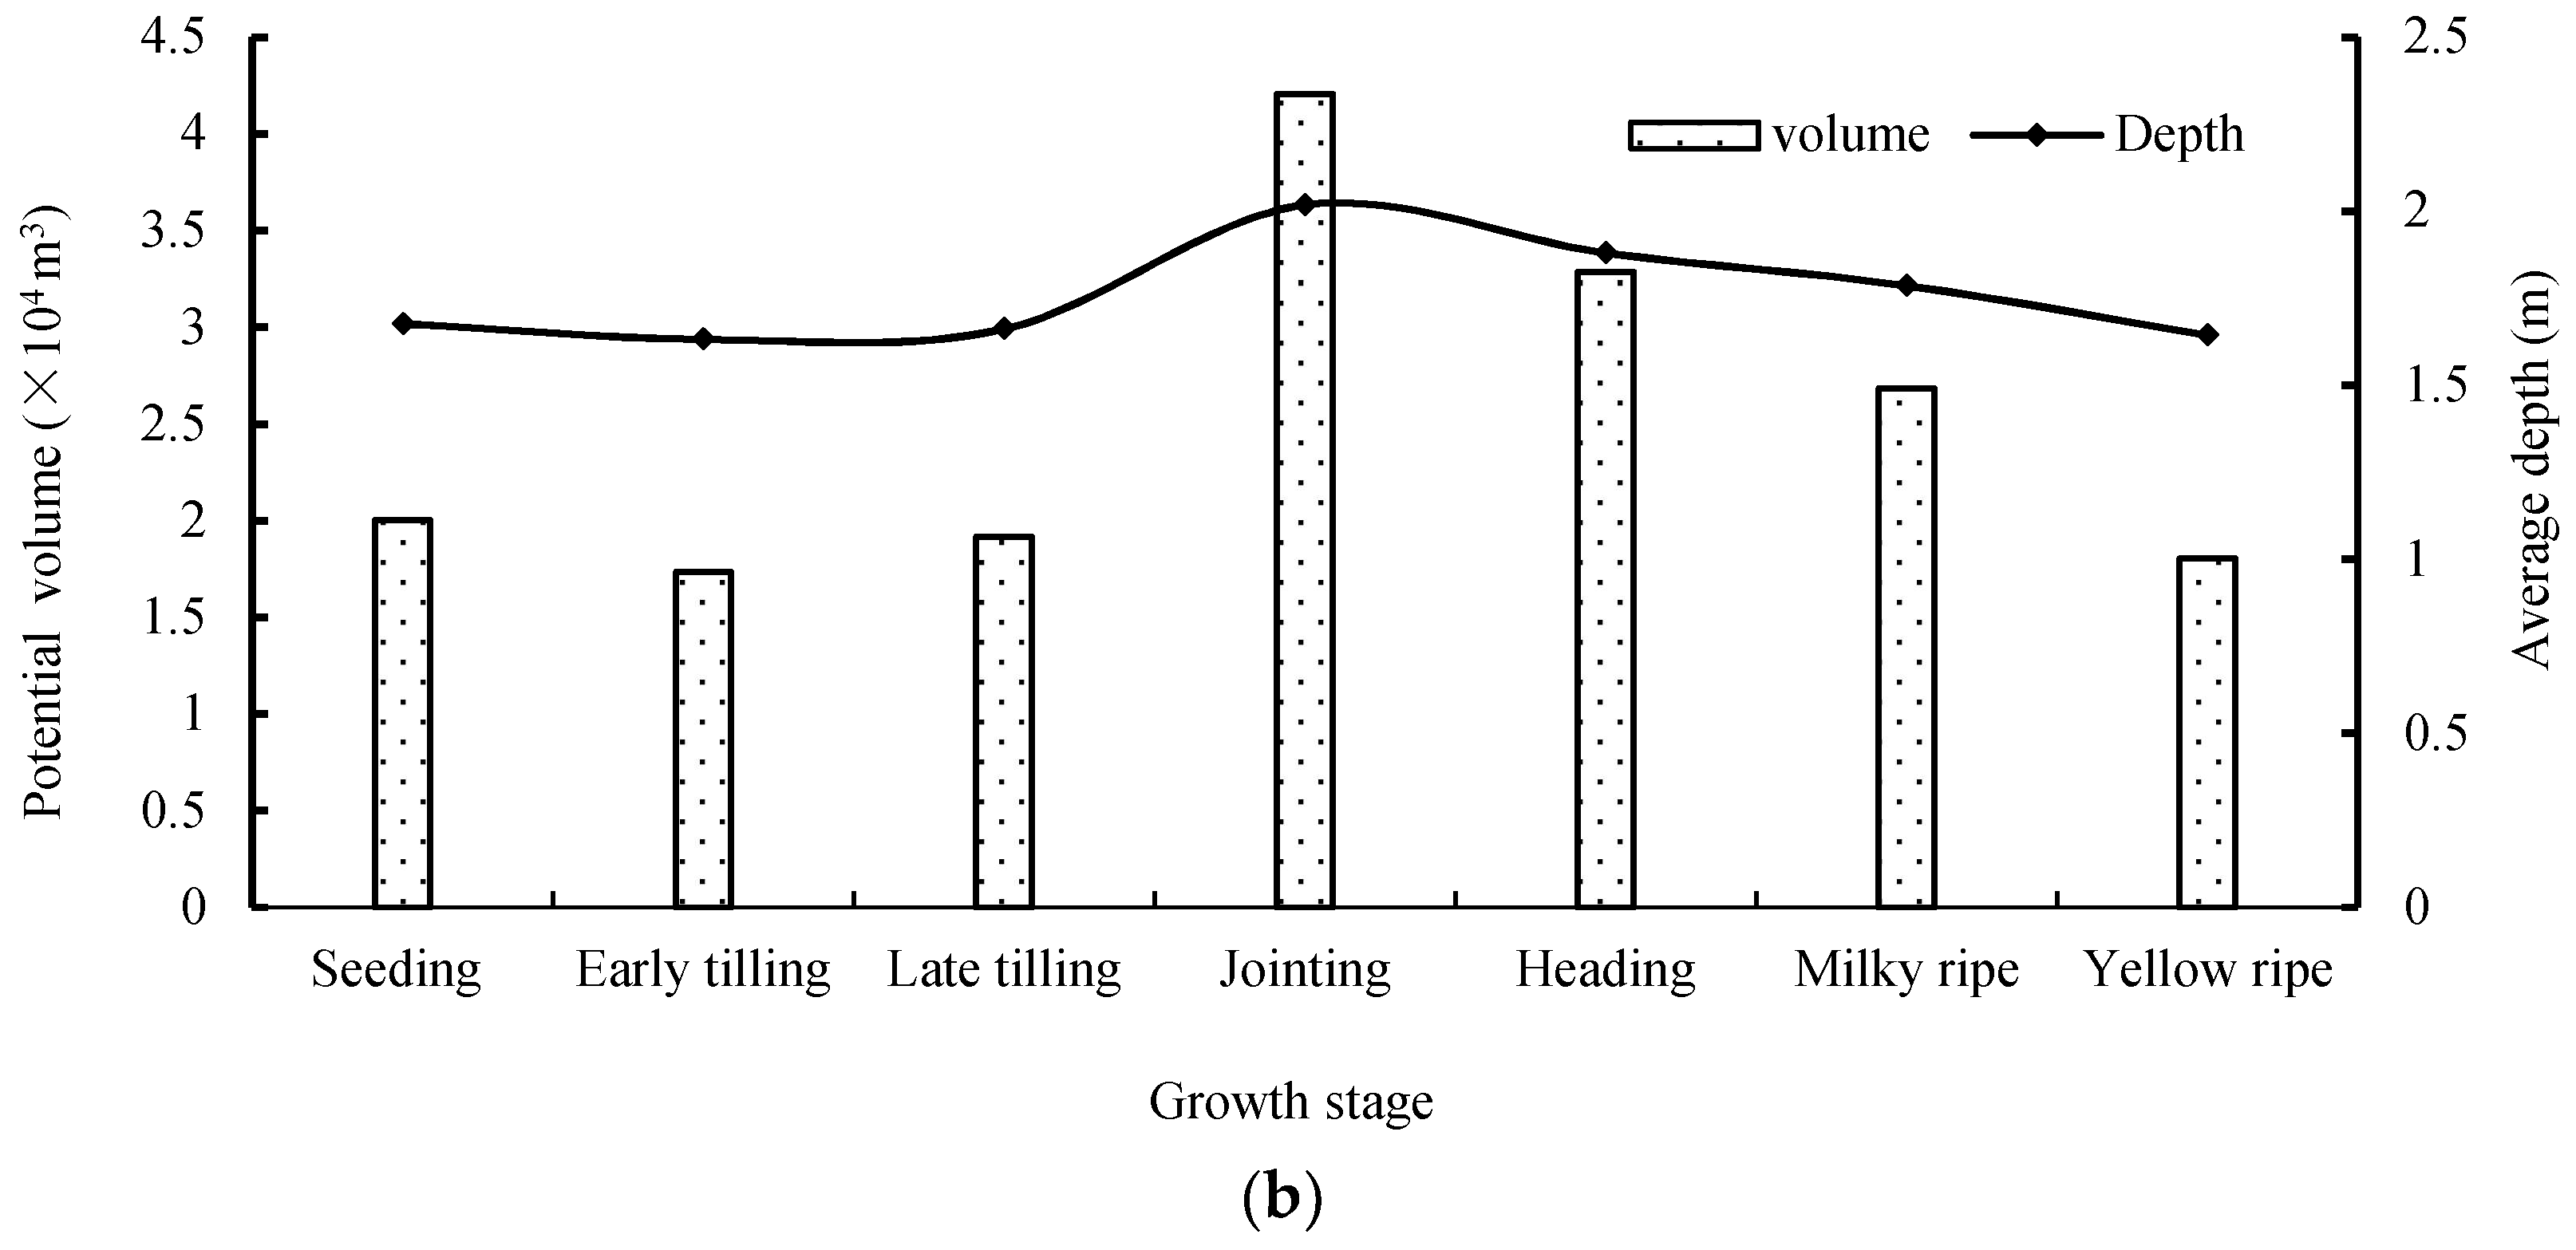
The average water depth and the estimated potential volume of recycled water at different rice growth stages for the years 2014 and 2015 are shown in Figure 8a,b. The figures show that the average water depths of the Zhongshi River during the jointing–booting stage in 2014 and 2015 were 2.02 m and 2.37 m, respectively, which were the highest in the entire growth period. In 2014, the amounts of water potentially available for reuse at the jointing–booting stage and the late tilling stage were 4.21 million m3 and 1.92 million m3, respectively; in 2015, they were 6.74 million m3 and 3.65 million m3, respectively. The jointing–booting stage is a critical period of water use for rice characterized by high transpiration and high-water requirements [37]. Taking full advantage of the potential to recycle water at the jointing–booting stage not only helps meet the demand for water at this stage but also serves to save water. For example, in 2015, the amount of water available for reuse was 67,400 m3 at the jointing–booting stage, which lasted 21 days from August 6 to August 26. During this period, rainfall was high and frequent. According to the records of irrigation collected in the field, irrigation was conducted only once on August 24 at the latter part of the jointing–booting stage. If the amount of reserved water in the river were used for irrigation, it would have been sufficient to irrigate an additional 224.7 ha of paddy fields assuming irrigation water layer of 30 mm. Such an area is approximately 1/4 of the controlled area of the Zhongshi River. Thus, recycling river water for irrigation could reduce the volume of the surface water diversion and provide flexibility in the water budget to allow for rainfall storage.
3.3.2. Potential for Drainage Water Reuse in the Gaoyou Irrigation District
According to statistics provided by the Gaoyou Water Resources Bureau, the total water diversion during the entire rice growing season was approximately 277 million m3. If the value of drainage water measured for the test field in 2015 can be extrapolated to the entire area, the estimated total drainage for the entire Gaoyou Irrigation District is 107 million m3 and the ratio of drainage to irrigation is as high as 39%. If 10%, 20% and 30% of the drainage water were reused, the resulting savings in water use would be approximately 4.17, 8.34 and 12.5 million m3, respectively, which could irrigate 591, 1180 and 1773 ha of paddy fields for the entirety of the rice growing season.
3.4. Benefits of Considering Water-Rights Conversion
The saved water mentioned in Section 3.2 can be supplied to industries or used for expanded irrigation. According to Heaney and Beare, farmers have the invisible right to save water and convert water rights without considering the influence of these activities on downstream waters [38]. In light of the economic development and water resource conditions in Gaoyou, the demand for industrial water is increasing and the potential of agricultural WSI is evident; thus, water-rights transfer in the Gaoyou Irrigation District is possible.
The water that could be potentially saved and used for water-rights transfer in Gaoyou comes in two forms, namely, water saved by using WSI practices and reused drainage water. Agricultural drainage water collected from the experimental area meets the water quality Class V standards of the Surface Water Environmental Quality Standard [29]. Thus, such water can be considered directly in the water rights system [39].
Water price reforms aim at establishing sound agricultural water-rights systems, which are beneficial for increasing the efficiency of agricultural water supplies. As mentioned in Section 1, the average agricultural water price established under recent reforms in Gaoyou is 0.102 yuan/m3. Using the experimental area as an example, the 3-year (2013–2015) average irrigation amount was 621.70 mm; thus, the irrigation volume was 6127.03 m3/ha. Consequently, the estimated water price under recent reforms is 624.95 yuan/ha, which is significantly higher than the pre-reform water price of 270 yuan/ha. However, it remains uncertain whether the adoption of water-saving irrigation practices and water-rights transfer, in addition to government subsidies, could improve the efficiency of water use and reduce water costs.
By considering the cost of water rights conversion and a reasonable return, Yang analyzed the conversion of agricultural water rights into power plant water rights in Anyang, Henan Province and calculated the price of water conversion to be 1.09 yuan/m3, which was lower than the local industrial water price of 2.03 yuan/m3 [40]. The industrial water price in Gaoyou City is 2.30 yuan/m3 [41]. Assuming that the ratios of water prices in Anyang and Gaoyou are similar, the water rights conversion price for Gaoyou is estimated to be 1.23 yuan/m3 (2.30 (1.09 ÷ 2.03)). By adopting the proportion of water conversion price used by Yang and 8% of the costs as profits [42], the actual irrigation costs considering water rights conversion under different WSI scenarios can be estimated, as shown in Table 6.
As shown in Table 6, the reuse of drainage water could save 21.1 yuan/ha under the TI scenario (i.e., if traditional irrigation methods are maintained). In comparison, the 3-year average profits of water-rights transfer under the SWI and SHRI scenarios are 212.7 yuan/ha and 254.7 yuan/ha, respectively and the final actual costs to farmers are 205.2 yuan/ha and 120.6 yuan/ha. Thus, the final cost is lower than the price before the reform and the adoption of the SWI and SHRI modes and water-rights transfer can considerably reduce farmers’ financial burden with respect to agricultural water use. Additionally, a negative value was obtained in 2014 under the SHRI mode, indicating that net profits of 48.1 yuan/ha could have been obtained in 2014 if the SHRI mode had been adopted and the water saved had been transferred. These results strongly suggest that water price reforms instituting water rights conversion can effectively encourage farmers to save water.
4. Conclusions
In this study, field experiments were conducted from 2014 to 2015 in the Gaoyou Irrigation District, located in southeastern China. Data from these experiments were used to calibrate and validate a water balance model for paddy fields that was then used to simulate the potential of SWI and SHRI practices to save water in the Gaoyou Irrigation District. The benefits of drainage water reuse, water price reform and water rights conversion under different WSI scenarios were also analyzed.
The main conclusions of this study are as follows.
- (1)
- In comparison with TI, SHRI and SWI performed better in terms of rainfall storage and water-saving effects in paddy fields. The average irrigation depths calculated for SHRI and SWI were 363 mm and 422 mm, respectively; their storage ratios were 84% and 82% and their water-saving rates were 43.1% and 33.7%. Thus, SHRI and SWI should be widely applied in practice.
- (2)
- Gaoyou has a huge potential for drainage water reuse. Approximately 27,700 m3 of water was available from the Zhongshi River during the paddy growth period in 2015. The reuse of drainage water could reduce the volume of surface water diversion and provide flexibility in the water budget to allow for rainfall storage.
- (3)
- The water fee after the reform was estimated to be 0.102 yuan/m3, which is equivalent to 624.95 yuan/ha and higher than pre-reform water price of 270 yuan/ha. Moreover, implementing WSI practices and water rights conversion could considerably reduce the final cost and the estimated 3-year average final costs for SWI and SHRI were 205.2 yuan/ha and 120.6 yuan/ha, respectively. Therefore, the agricultural water price reform could stimulate adoption of WSI practices, thus alleviating some of the stresses on water use and promoting the establishment of a water-conserving society.
Results of this study could be used to provide references for solving problems of water shortage and also provide a support tool to agricultural water price reform. The outputs show that WSI can also be used as a guideline for adaptation measures under future climate change and water scarcity.
Author Contributions
C.W., S.W. and H.C. conceived the study; C.W., Y.T. drafted the manuscript; J.L. helped analyzed the data for the research; S.W. and J.W. worked on improving and finalizing the manuscript. All authors read and approved the final manuscript.
Funding
This research was funded by CRSRI Open Research Program (Program SN: CKWV2017528/KY), the National Natural Science Foundation Program of China (No. 51779274, 51779273), IWHR Innovative team project (ID0145B602017), the National Key Research and Development Program of China (2017YFC0403205) and Basic Research Fund of China Institute of Water Resources and Hydropower Research (GG0145B502017).
Acknowledgments
The authors thank Liwen Bianji, Edanz Editing China (www.liwenbianji.cn/ac), for editing the English text of a draft of this manuscript.
Conflicts of Interest
The authors declare no conflict of interest.
References
- Fang, S.; Jia, R.; Tu, W.; Sun, Z. Assessing factors driving the change of irrigation water-use efficiency in China based on geographical features. Water 2017, 9, 759. [Google Scholar] [CrossRef]
- Moya, P.; Hong, L.; Dawe, D.; Chen, C. The impact of on-farm water saving irrigation techniques on rice productivity and profitability in Zhanghe Irrigation System, Hubei, China. Paddy Water Environ. 2004, 2, 207–215. [Google Scholar] [CrossRef]
- The Ministry of Water Resources of the People’s Republic of China. China Water Resources Bulletin; China Waterpower Press: Beijing, China, 2017. (In Chinese)
- Kang, S.; Zhang, L.; Trout, T. Improving agricultural water productivity to ensure food security under changing environments. Agric. Water Manag. 2017, 179, 1–4. [Google Scholar] [CrossRef]
- Zhao, J.; Li, M.; Guo, P.; Zhang, C.; Tan, Q. Agricultural water productivity oriented water resources allocation based on the coordination of multiple factors. Water 2017, 9, 490. [Google Scholar] [CrossRef]
- Watanabe, T.; Hosen, Y.; Agbisit, R.; Llorca, L.; Katayanagi, N.; Asakawa, S.; Kimura, M. Changes in community structure of methanogenic archaea brought about by water-saving practice in paddy field soil. Soil Biol. Biochem. 2013, 58, 235–243. [Google Scholar] [CrossRef]
- Bouman, B.A.M. A conceptual framework for the improvement of crop water productivity at different spatial scales. Agric. Syst. 2007, 93, 43–60. [Google Scholar] [CrossRef]
- Kubiszewski, I. Food and agriculture organization (FAO). Afr. Res. Bull. Econ. Financial Tech. 2011, 48, 19067A. [Google Scholar]
- Mao, Z. Water saving irrigation for rice and its effect on environment. Eng. Sci. 2002, 4, 8–16. [Google Scholar]
- Bjornlund, H. Efficient water market mechanisms to cope with water scarcity. Int. J. Water Resour. Dev. 2003, 19, 553–567. [Google Scholar] [CrossRef]
- Hung, M.F.; Chie, B.T. Residential water use: Efficiency, affordability, and price elasticity. Water Resour. Manag. 2013, 27, 275–291. [Google Scholar] [CrossRef]
- Molinos-Senante, M.; Donoso, G.; Sala-Garrido, R. Are participants in markets for water rights more efficient in the use of water than non-participants? A case study for Limarí Valley (Chile). Environ. Sci. Pollut. Res. 2016, 23, 10665–10678. [Google Scholar] [CrossRef] [PubMed]
- Sujono, J. Flood reduction function of paddy rice fields under different water saving irrigation techniques. J. Water Resour. Prot. 2010, 2, 555–559. [Google Scholar] [CrossRef]
- Belder, P.; Bouman, B.A.M.; Cabangon, R.; Lu, G.; Quilang, E.J.P.; Li, Y.; Spiertz, J.H.J.; Tuong, T.P. Effect of water-saving irrigation on rice yield and water use in typical lowland conditions in Asia. Agric. Water Manag. 2004, 65, 193–210. [Google Scholar] [CrossRef]
- Bouman, B.A.M.; Feng, L.; Tuong, T.P.; Lu, G.; Wang, H.; Feng, Y. Exploring options to grow rice using less water in Northern China using a modelling approach: II. Quantifying yield, water balance components, and water productivity. Agric. Water Manag. 2007, 88, 23–33. [Google Scholar] [CrossRef]
- Peng, S.Z.; Yang, S.H.; Xu, J.Z.; Luo, Y.F.; Hou, H.J. Nitrogen and phosphorus leaching losses from paddy fields with different water and nitrogen managements. Paddy Water Environ. 2011, 9, 333–342. [Google Scholar] [CrossRef]
- Kim, S.J.; Park, G.A.; Kwon, H.J. Evaluation of paddy water storage dynamics during flood period in South Korea. KSCE J. Civ. Eng. 2007, 11, 269–276. [Google Scholar] [CrossRef]
- Renzetti, S.; Dupont, D.P. Water Pricing in Canada: Recent Developments; Springer: Cham, Switzerland, 2015; pp. 63–81. [Google Scholar]
- Che, Y.; Shang, Z. Water Pricing in China: Impact of Socioeconomic Development; Springer: Cham, Switzerland, 2015; pp. 97–115. [Google Scholar]
- Ghimire, N.; Griffin, R.C. The Water Transfer Effects of Alternative Irrigation Institutions. Am. J. Agric. Econ. 2014, 96, 970–990. [Google Scholar] [CrossRef]
- Pingali, P.L.; Rosegrant, M.W. Agricultural commercialization and diversification: Processes and policies. Food Policy 1995, 20, 171–185. [Google Scholar] [CrossRef]
- Peiqu, Ma. Welfare effect analysis of agricultural two-part water pricing reform—Based on the investigation of the final canal system in Zhanghe Irrigated Area of Hubei Province. Water Conservancy Econ. 2007, 25, 34–37. (In Chinese) [Google Scholar]
- Shen, D.; Yu, X.; Shi, J. Introducing New Mechanisms into Water Pricing Reforms in China; Springer: Cham, Switzerland, 2015; pp. 343–358. [Google Scholar]
- Zhang, B.; Liu, Y.; Xu, D.; Zhao, N.; Lei, B.; Rosa, R.D.; Paredes, P.; Paço, T.A.; Pereira, L.S. The dual crop coefficient approach to estimate and partitioning evapotranspiration of the winter wheat–summer maize crop sequence in North China Plain. Irrig. Sci. 2013, 31, 1303–1316. [Google Scholar] [CrossRef]
- Alcamo, J.; Dronin, N.; Endejan, M.; Golubev, G.; Kirilenko, A. A new assessment of climate change impacts on food production shortfalls and water availability in Russia. Global Environ. Chang. 2007, 17, 429–444. [Google Scholar] [CrossRef]
- Babel, M.S.; Agawal, A.; Swain, D.K.; Herath, S. Evaluation of climate change impacts and adaptation measures for rice cultivation in Northeast Thailand. Clim. Res. 2011, 46, 137–146. [Google Scholar] [CrossRef] [Green Version]
- Deb, P.; Kiem, A.S.; Babel, M.S.; Chu, S.T.; Chakma, B. Evaluation of climate change impacts and adaptation strategies for maize cultivation in the Himalayan foothills of India. J. Water Clim. Chang. 2015, 6, 596–614. [Google Scholar] [CrossRef]
- Kim, T.C.; Gim, U.S.; Jin, S.K.; Kim, D.S. The multi-functionality of paddy farming in Korea. Paddy Water Environ. 2006, 4, 169–179. [Google Scholar] [CrossRef]
- Xiong, Y.; Peng, S.; Luo, Y.; Xu, J.; Yang, S. A paddy eco-ditch and wetland system to reduce non-point source pollution from rice-based production system while maintaining water use efficiency. Environ. Sci. Pollut. Res. 2015, 22, 4406–4417. [Google Scholar] [CrossRef] [PubMed]
- Huang, J. Rice water-saving irrigation and rainwater utilization. Chin. Rural Water Hydropower 2005, 7, 11–12. (In Chinese) [Google Scholar]
- Deb, P.; Debnath, P.; Denis, A.F.; Lepcha, O.T. Variability of soil physicochemical properties at different agroecological zones of Himalayan Region: Sikkim, India. Environ. Dev. Sustain. 2018. [Google Scholar] [CrossRef]
- Yadav, S.; Deb, P.; Kumar, S.; Pandey, V.; Pandey, P. Trends in major and minor meteorological variables and their influence on reference evapotranspiration for mid Himalayan Region at east Sikkim, India. J. Mt Sci. 2016, 13, 302–315. [Google Scholar] [CrossRef]
- Allen, R.G.; Pereira, L.S.; Raes, D.; Smith, M. Crop Evapotranspiration—Guidelines for Computing Crop Water Requirements—FAO Irrigation and Drainage Paper 56; FAO: Rome, Italy, 1998. [Google Scholar]
- Luo, Y.; Peng, S.; Wang, W.; Jiao, X.; Yong, S.; Bing, H. Impacts of climate change on irrigation water requirements of rice: A case study of Gaoyou Irrigation District. Eng. J. Wuhan Univ. 2009, 42, 609–613. (In Chinese) [Google Scholar]
- Hu, N.; Shao, D.; Chen, S.; Le, Z.; Nong, X.; Hu, N.; Shao, D.; Chen, S.; Le, Z.; Nong, X. Simulation and verification of water transformation of rice paddy and pond system based on system dynamics. J. Agric. Eng. Trans. Chin. Soc. Agric. Eng. 2017, 33, 130–135. (In Chinese) [Google Scholar]
- Xu, B.; Shao, D.; Tan, X.; Yang, X.; Gu, W.; Li, H. Evaluation of soil water percolation under different irrigation practices, antecedent moisture and groundwater depths in paddy fields. Agric. Water Manag. 2017, 192, 149–158. [Google Scholar] [CrossRef]
- Peng, S.Z.; Li-Kun, A.I.; Yu-Pu, H.E.; Zhang, J.G.; Yang, S.H. Effect of irrigation and drainage coupling management on rice water requirement. J. Hydraul. Eng. 2014, 45, 320–325. (In Chinese) [Google Scholar]
- Heaney, A.; Beare, S. Water trade and irrigation: Defining property rights to return flows. Aust. Commodities Forecasts Issues 2001, 8, 339–348. [Google Scholar]
- Crook, J.; Rao, Y.S. Water reclamation and reuse criteria in the U.S. Water Sci. Technol. 1996, 33, 451–462. [Google Scholar] [CrossRef]
- Yang, Y. Water Right Transfer from Agriculture to Industry—A Case Study for Anyang River; Tsinghua University: Beijing, China, 2005. (In Chinese) [Google Scholar]
- China Water Network. Available online: http://www.h2o-china.com/ (accessed on 1 September 2018).
- China Government Net. Measures for water supply price management in water conservancy projects. Available online: http://www.gov.cn/test/2005-07/04/content_11801.htm (accessed on 4 July 2005).
Figure 1.
Location of the Gaoyou Irrigation District (GID) and layout of the field-scale- and regional-scale experimental areas (partly adopted from (Xiong et al., 2015) [29]). (a) Layout of experimental area; (b) Layout of the field-scale experimental area.
Figure 1.
Location of the Gaoyou Irrigation District (GID) and layout of the field-scale- and regional-scale experimental areas (partly adopted from (Xiong et al., 2015) [29]). (a) Layout of experimental area; (b) Layout of the field-scale experimental area.

Figure 2.
Main meteorological parameters average daily values from 1960 to 2015 in Gaoyou: (a) Average daily maximum temperature, minimum temperature and humidity during growth period; (b) Average daily net radiance and wind speed during growth period.
Figure 2.
Main meteorological parameters average daily values from 1960 to 2015 in Gaoyou: (a) Average daily maximum temperature, minimum temperature and humidity during growth period; (b) Average daily net radiance and wind speed during growth period.


Figure 3.
Curve of rice crop coefficients applied to the Gaoyou study area [34].
Figure 3.
Curve of rice crop coefficients applied to the Gaoyou study area [34].

Figure 4.
Comparison of the observed and simulated daily water-ponding depths in (a) 2015 and (b) 2014.
Figure 4.
Comparison of the observed and simulated daily water-ponding depths in (a) 2015 and (b) 2014.


Figure 5.
Annual variation of rainfall storage under different irrigation scenarios.

Figure 6.
Annual variation of irrigation under different irrigation scenarios.

Figure 7.
Depths of the Zhongshi River in (a) 2014 and (b) 2015.


Figure 8.
Water depths and potential volumes of reused water from the Zhongshi River in (a) 2014 and (b) 2015.
Figure 8.
Water depths and potential volumes of reused water from the Zhongshi River in (a) 2014 and (b) 2015.


Table 1.
Thresholds for different irrigation scenarios in different stages.
| Growth Period | Dates | Hmin–Hmax–Hp (mm) | ||
|---|---|---|---|---|
| TI | SWI | SHRI | ||
| Seedling period | 11 June–23 June | 10–30–50 | 5–30–50 | 5–30–50 |
| Early tilling | 24 June–12 July | 20–50–80 | 5–30–80 | 85%θs–20–80 |
| Late tilling | 13 July–5 August | 30–60–90 | 60%θs–0–90 | 60%θs–0–90 |
| Jointing–booting | 6 August–26 August | 30–60–120 | 80%θs–40–120 | 70%θs–20–120 |
| Heading–blooming | 27 August–5 September | 10–30–100 | 75%θs–20–100 | 80%θs–20–100 |
| Milky ripe | 6 September–25 September | 10–20–60 | 75%θs–20–60 | 80%θs–20–60 |
| Yellow ripe | 26 September–15 October | Soil drying | Soil drying | Soil drying |
Note: θs represents average saturated volumetric soil moisture in the root layer.
Table 2.
Groups of wet, normal and dry years.
| Year Type | Frequency | Years | Number of Years |
|---|---|---|---|
| Wet years | P ≤ 37.5% | 1962, 1965, 1969, 1970, 1974, 1975, 1979, 1980, 1983, 1984, 1986, 1987, 1991, 1998, 2003, 2005, 2007, 2008, 2011 and 2015 | 20 |
| Normal years | 37.5% < P < 62.5% | 1961, 1964, 1972, 1976, 1977, 1985, 1990, 1992, 1995, 1996, 1999, 2006, 2012 and 2014 | 14 |
| Dry years | P ≥ 62.5% | 1960, 1963, 1966, 1971, 1973, 1978, 1981, 1982, 1988, 1989, 1993, 1994, 1997, 2000, 2001, 2002, 2004, 2009, 2010 and 2013 | 20 |
Table 3.
Average values of the water balance components: rainfall (RF), evapotranspiration (ET), drainage (SD), deep percolation (DP), irrigation (IR) and rainfall storage in different hydrological years.
Table 3.
Average values of the water balance components: rainfall (RF), evapotranspiration (ET), drainage (SD), deep percolation (DP), irrigation (IR) and rainfall storage in different hydrological years.
| Year Type | Number of Years | RF (mm) | ET (mm) | SD (mm) | DP (mm) | IR (mm) | Rainfall Storage (mm) | Storage Ratio (%) |
|---|---|---|---|---|---|---|---|---|
| Wet year | 20 | 836.4 | 626.2 | 521.8 | 284.1 | 521.5 | 563.0 | 67.3 |
| Normal year | 14 | 590.5 | 627.4 | 525.5 | 139.7 | 618.8 | 458.5 | 77.6 |
| Dry year | 20 | 440.5 | 679.7 | 521.1 | 84.0 | 755.1 | 372.4 | 84.5 |
Table 4.
Water balance components in selected years typical for each year type. RF = rainfall, ET = evapotranspiration, SD = drainage, DP = deep percolation, IR = irrigation.
Table 4.
Water balance components in selected years typical for each year type. RF = rainfall, ET = evapotranspiration, SD = drainage, DP = deep percolation, IR = irrigation.
| Year Type | Typical Years | RF (mm) | ET (mm) | IR (mm) | SD (mm) | Rainfall Storage (mm) |
|---|---|---|---|---|---|---|
| Wet years | 1991 2015 | 1170.9 905.9 | 615.8 653.8 | 555.6 529.8 | 770.8 322.3 | 451.1 583.6 |
| Normal years | 2014 2012 | 615.0 598.6 | 570.6 718.2 | 443.4 649.7 | 139.6 185.4 | 488.7 424.3 |
| Dry years | 2013 1973 | 428.5 232.4 | 794.7 642.1 | 833.5 792.7 | 93.0 15.1 | 347.8 228.7 |
Table 5.
Average values of water balance components for different irrigation modes and different hydrological years. RF = rainfall, IR = irrigation, SD = drainage.
Table 5.
Average values of water balance components for different irrigation modes and different hydrological years. RF = rainfall, IR = irrigation, SD = drainage.
| Year Type | Irrigation Modes | RF (mm) | IR (mm) | SD (mm) | Storage (mm) | Storage Ratio (%) | Water-Saving Rate (%) |
|---|---|---|---|---|---|---|---|
| Wet year | TI | 836.4 | 521.5 | 284.1 | 563.0 | 67.3 | |
| SWI | 325.7 | 221.4 | 620.6 | 74.2 | 37.6 | ||
| SHRI | 273.2 | 201.0 | 638.4 | 76.3 | 47.6 | ||
| Normal year | TI | 590.5 | 618.8 | 139.7 | 458.5 | 77.6 | |
| SWI | 416.7 | 109.4 | 483.8 | 81.9 | 32.7 | ||
| SHRI | 353.4 | 94.5 | 497.6 | 84.3 | 42.8 | ||
| Dry year | TI | 440.5 | 755.1 | 84.0 | 372.4 | 84.5 | |
| SWI | 523.2 | 50.8 | 398.4 | 90.5 | 30.7 | ||
| SHRI | 462.4 | 43.8 | 403.7 | 91.6 | 38.8 | ||
| 54-year average | TI | 622.5 | 631.8 | 169.3 | 464.6 | 76.5 | |
| SWI | 421.9 | 127.2 | 500.9 | 82.2 | 33.7 | ||
| SHRI | 363.0 | 113.1 | 513.2 | 84.1 | 43.1 |
Table 6.
Comparison of the benefits of water rights transfer under different WSI modes.
| Year | WSI Modes | Irrigation (mm) | Water Fee (yuan/ha) | Saved Water (mm) | Transfer Profits (yuan/ha) | Final Cost (yuan/ha) |
|---|---|---|---|---|---|---|
| 2015 | TI, drainage water reuse | 471.6 | 481 | 21.4 | 21.1 | 459.9 |
| TI | 471.6 | 481 | 0 | 0.0 | 481.0 | |
| SWI | 302.2 | 308.2 | 172.8 | 170.0 | 138.2 | |
| SHRI | 293.7 | 299.5 | 181.5 | 178.6 | 120.9 | |
| 2014 | TI | 496.51 | 506.4 | 0 | 0.0 | 506.4 |
| SWI | 305.1 | 311.2 | 195.3 | 192.2 | 119.0 | |
| SHRI | 222.5 | 226.9 | 279.5 | 275.0 | −48.1 | |
| 2013 | TI | 897 | 914.9 | 0 | 0.0 | 914.9 |
| SWI | 621.9 | 634.4 | 280.6 | 276.1 | 358.3 | |
| SHRI | 587.8 | 599.5 | 315.4 | 310.4 | 289.1 | |
| Three-year average | TI | 621.7 | 634.1 | 0 | 0.0 | 634.1 |
| SWI | 409.7 | 417.9 | 216.2 | 212.7 | 205.2 | |
| SHRI | 368 | 375.3 | 258.8 | 254.7 | 120.6 |
© 2018 by the authors. Licensee MDPI, Basel, Switzerland. This article is an open access article distributed under the terms and conditions of the Creative Commons Attribution (CC BY) license (http://creativecommons.org/licenses/by/4.0/).
Share and Cite
MDPI and ACS Style
Wang, C.; Wang, S.; Chen, H.; Wang, J.; Tao, Y.; Liu, J. Evaluation of Water-Storage and Water-Saving Potential for Paddy Fields in Gaoyou, China. Water 2018, 10, 1176. https://doi.org/10.3390/w10091176
AMA Style
Wang C, Wang S, Chen H, Wang J, Tao Y, Liu J. Evaluation of Water-Storage and Water-Saving Potential for Paddy Fields in Gaoyou, China. Water. 2018; 10(9):1176. https://doi.org/10.3390/w10091176
Chicago/Turabian StyleWang, Chuanjuan, Shaoli Wang, Haorui Chen, Jiandong Wang, Yuan Tao, and Jing Liu. 2018. "Evaluation of Water-Storage and Water-Saving Potential for Paddy Fields in Gaoyou, China" Water 10, no. 9: 1176. https://doi.org/10.3390/w10091176
Note that from the first issue of 2016, this journal uses article numbers instead of page numbers. See further details here.