Experiments on Turbulence Intensity and Bubble Frequency in Self-Aerated Open Channel Flows

State Key Laboratory of Hydraulics and Mountain River Engineering, Sichuan University, Chengdu 610065, China
*
Author to whom correspondence should be addressed.
Water 2018, 10(9), 1201; https://doi.org/10.3390/w10091201
Submission received: 9 August 2018
/
Revised: 30 August 2018
/
Accepted: 4 September 2018
/
Published: 6 September 2018
(This article belongs to the Section Hydraulics and Hydrodynamics)
Abstract
:Although spillways have been investigated experimentally by various researchers, only a few studies have been conducted on the comprehensive properties of a self-aerated air-water flow. In this study, new experimental data were recorded and discussed for the distribution of the air concentration, air-water velocity, turbulence intensity and bubble frequency in the completely developed regions for spillways. It was observed that both the turbulence intensity and bubble frequency increased from the bottom and subsequently decreased near the free surface. The positions of maximum air bubble frequency and turbulence intensity gradually approached air concentration to 0.50 in the self-aerated developed region. Self-similar relationships between the turbulence intensity and bubble frequency were proposed.
1. Introduction
Self-aeration is a phenomenon occurring in high-velocity open channel flows, which is attributed to the strong interactions between the turbulent flows and the atmosphere leading to a strong air-water mixing at the interface. Along the chute, the upstream flow is clear until the outer edge of the growing boundary layer reaches the free surface. Air enters into the flow when the turbulence near the free surface is large enough to overcome both the buoyancy effects and surface tension. Downstream of the inception point, the entrained air contributes significantly to an increased air-water interface area and the aeration thickness increases in the streamwise direction. Through the air-water interface, air is continuously trapped and released and the resulting air-water mixture gives a whitish appearance to the entire flow. A drastic change in the air-water flow structure is induced and the properties are directly affected by the turbulence interactions. As the air entrainment develops, the completely developed air-water phase flow becomes a result of the equilibrium between the turbulence intensity and buoyancy. The air-water flow properties, such as air concentration, velocity and flow depth, are independent of the flow direction [1,2,3]. Extensive experiments have been conducted on self-aerated flows including studies of the velocity distribution, air concentration and bubble frequency and size [4,5,6,7,8,9]. Chanson [4] focused on the air concentration distribution based on the turbulent diffusion theory for the developed region and also predicted the sizes of the entrained bubbles and provided the relationship between the air concentration and bubble frequency.
The turbulence intensity plays a significant role in an aerated flow. Several researchers [10,11,12,13] have investigated the flow structure and turbulence intensity of the unaerated flow in an open channel. Brocchini and Peregrine [14] discussed the free-surface turbulence by considering the stabilizing effect of the gravity and surface tension against the disrupting effect of the turbulent kinetic energy. Daniel et al. [15] indicated that the air-water velocity difference yielded a shear region at the free surface that could eventually trigger the aeration and they also proposed a formula for the inception point. However, there is little literature on the turbulence intensity of a self-aerated flow in open channels.
In man-made dam projects, high speed air-water two phase flows can be seen in spillways which may be equipped with various bed roughness ranging from smooth bed to macro-roughness elements such as in stepped spillways [16]. Extensive experimental studies have been conducted in the past decades uncovering key features of the air-water flows and providing design guidelines for smooth and stepped spillways [5,17,18]. The air-water flow properties of stepped spillways, such as air concentration, bubble frequency, bubble size, turbulence intensity, velocity, integral turbulent time and length scales, have been investigated systematically [19,20]. When the outer edge of boundary layer reaches the free-surface and the turbulence forces overcome both surface tension and buoyancy, the air entrainment starts at the inception point of free-surface aeration. Compared with the smooth spillways, the flow pattern of stepped spillways is much more turbulent. Felder and Pfister [16] indicated that, independent of the spillway roughness, the physical processes leading to the air entrainment were similar. Hence, in this study, the provided methods of stepped spillways were applied to investigate the turbulence level in air-water self-aerated flows.
This study aims to investigate the air-water phase properties in the completely developed region of a self-aerated flow using a hydraulic model. An understanding of the air concentration, bubble frequency and turbulence intensity in the developed region was provided. The present study investigated the scale effects concerning physical hydraulic models and identified which air-water flow properties may be affected by the scale effects in the Froude, Reynolds and Weber similitudes.
2. Hydraulics Model and Instrumentation
The experiments were conducted in a rectangular chute with a length of 23.6 m and a width of 0.20 m, which was fabricated using polymethyl methacrylate. The roughness height of the chute was 0.01 mm. Chute bottom angle α was set as 5.71° and 8.22° relative to the horizontal. A water discharge of up to 0.8 m3·−1 was supplied using a constant head system and the accuracy was measured up to ±1% for a rectangular sharp-crested weir. The flow to the chute was fed with a smooth convergent nozzle. Height of nozzle h0 was set as 0.20 m and 0.30 m. The flow velocity was set as V0 = 4–8.2 m/s. Hence, the Froude number F0 (V0/(gh0)0.5) is within the range of 3.9 to 5.9 and the Weber number W (V0/(σ/ρh0)0.5) and Reynolds number Re (V0h0/υ) are within the ranges of 250 ≤ W ≤ 490 and 6.7 × 10⁵ ≤ Re ≤ 18.1 × 10⁵, respectively, where υ was the kinematic viscosity of water, σ was the surface tension of water and ρ was the density of water (Table 1). The free surface was kept sufficiently open to the atmosphere. In this instance, x was the streamwise coordinate along the chute bottom and z was the perpendicular coordinate (Figure 1).
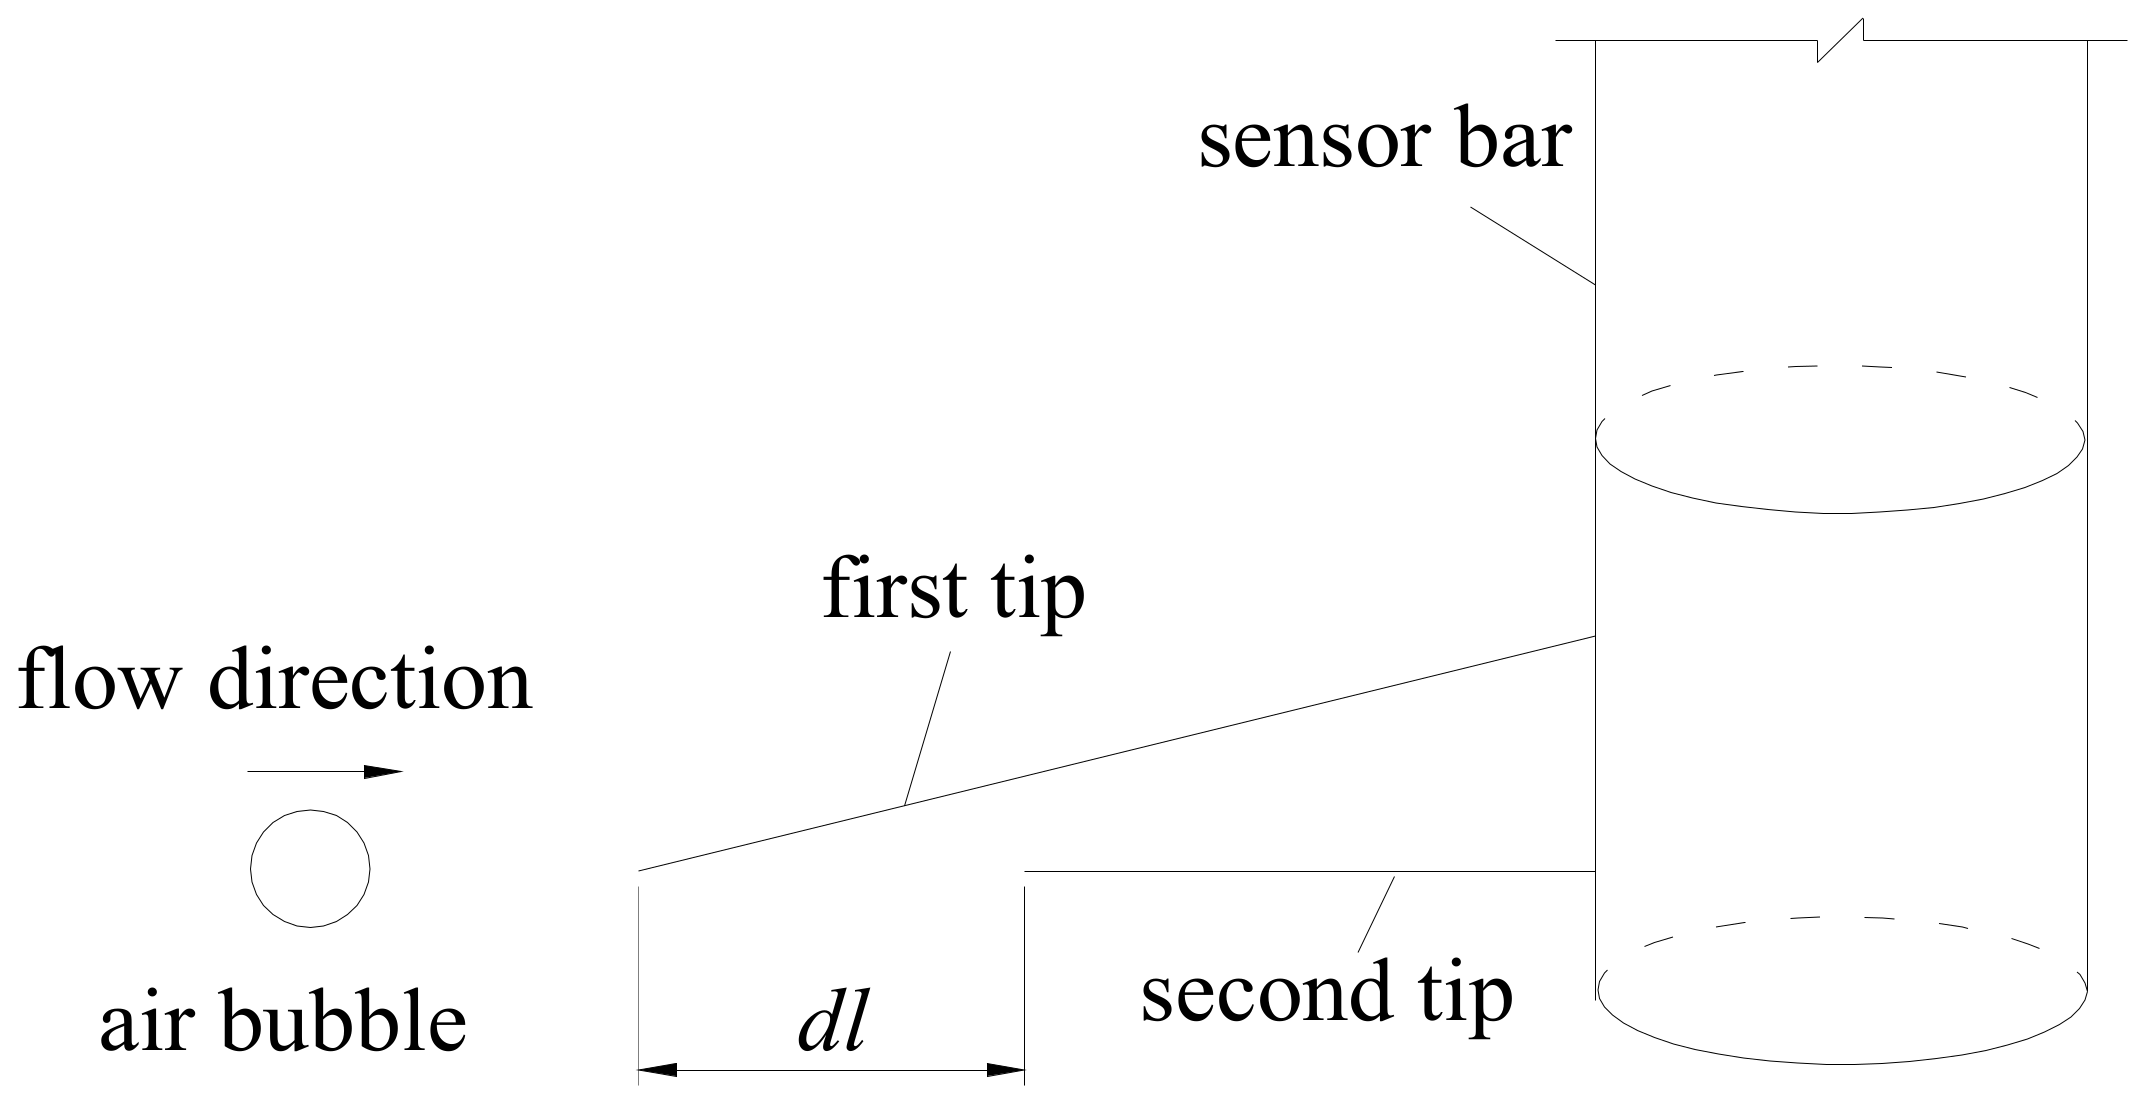
The central stream-wise air-water velocity V, air concentration C, bubble frequency f and turbulence intensity Tu were measured with a phase-detection needle probe (CQY-Z8a, Measurement Instrument, Institute of water resources and hydropower, Bengbu, China) [21,22]. The needle probe consisted of two identical tips with inner diameter 0.25 mm (Figure 2). The working principles of the conductivity probes were based on the difference in the voltage indices between the air and water phases at the platinum tip between the air and water phases [17,23]. If the measurement is completely surrounded by air phase or water phase, the flow characteristics, such as air concentration, bubble frequency and turbulence intensity can be obtained. The turbulence intensity in the flow direction only can be observed in the aerated region. The response time of this sensor was less than 10 μs. The signals from the conductivity probe were recorded at a scan rate of 100 kHz per for a 40 s scan period. The accuracy of the air concentration was ΔC/C = 3% and the bubble frequency was Δf/f = 1%. The probe was supported by a trolley system and the accuracy in the longitudinal of the probe position was less than 0.5 cm. The elevation of the probe from normal to the chute bottom was supervised with a Vernier caliper less than 0.5 mm.
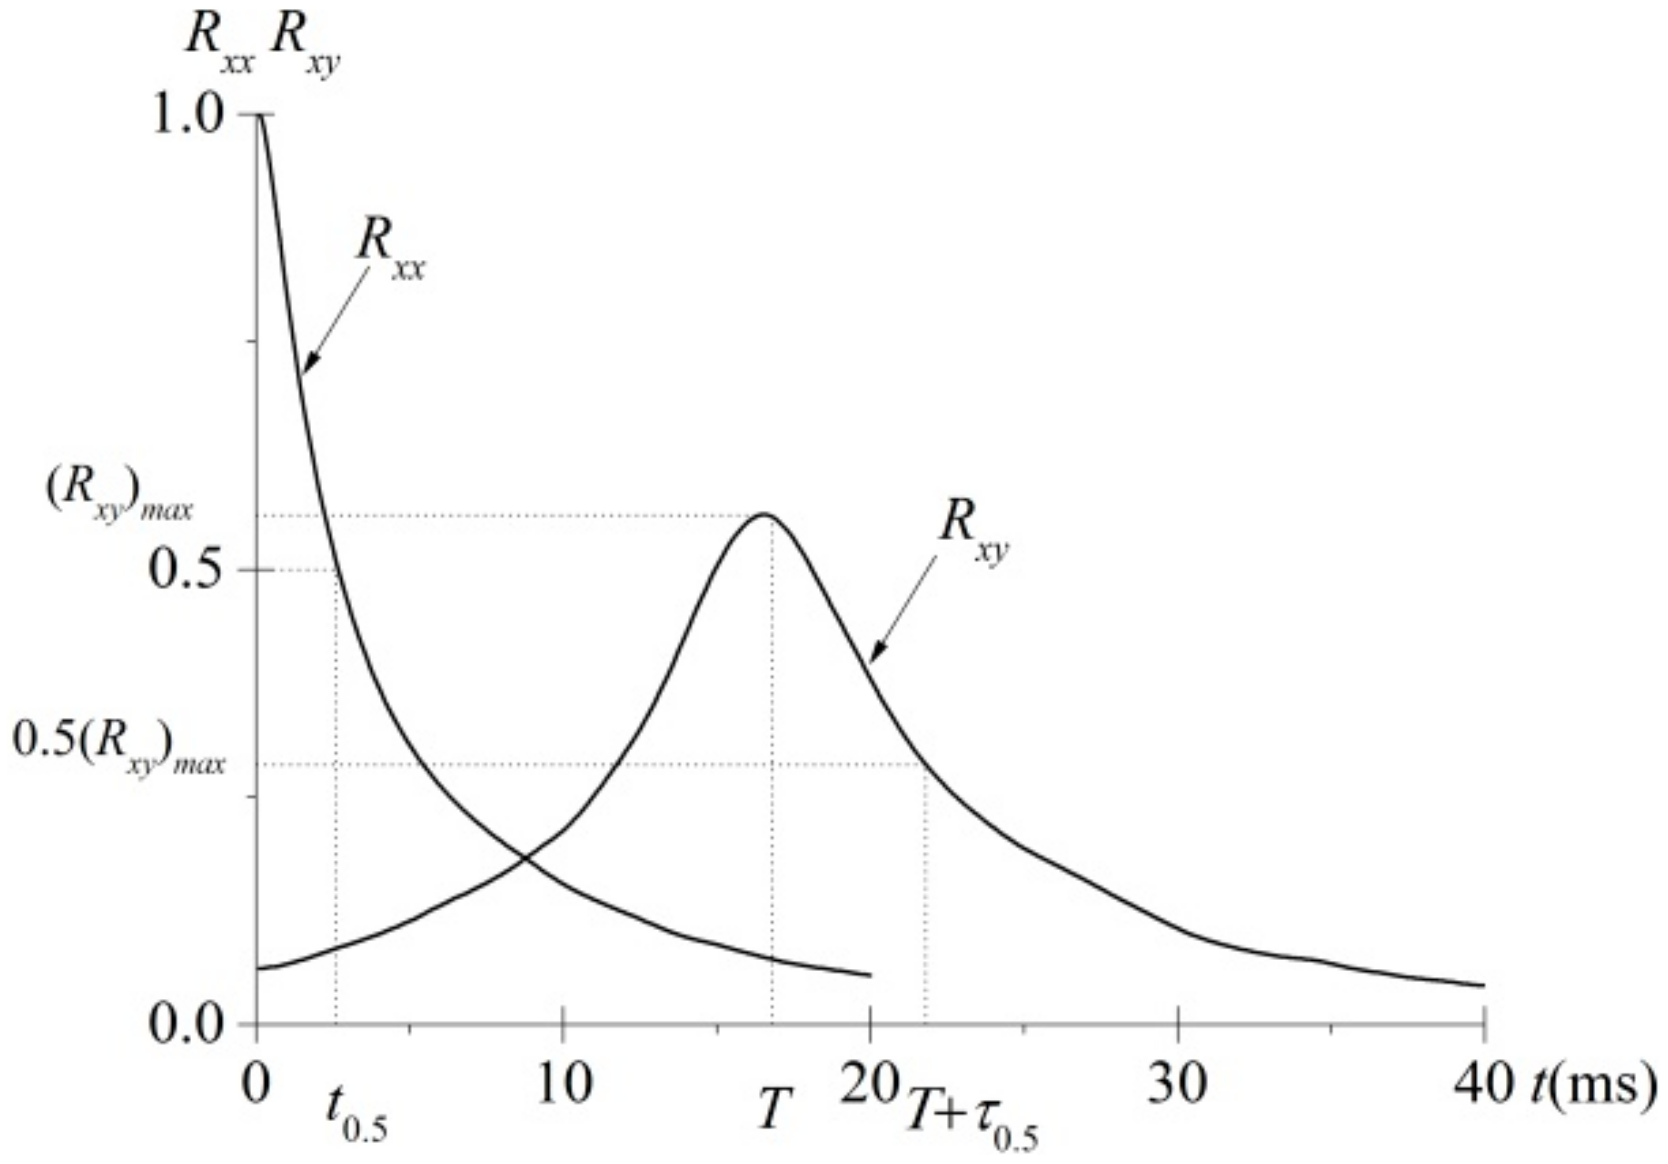
Chanson [3] and Kipphan [24] indicated that the broadening of the cross-correlation function compared with the auto-correlation function of the leading sensor may provide information regarding the turbulence intensities in an air-water flow (Figure 3). Felder and Chanson [20] proposed the following equation for the turbulence intensity:
where Tu was the turbulence intensity (Tu = u/V) in the flow direction, u was the velocity fluctuation in the flow direction, V was the mainstream velocity, τ0.5 was the time scale at which the cross–correlation function was half of its maximum value (Rxy(T + τ0.5) = 0.5Rxy(T)). t0.5 was the characteristic time at which the normalized auto-correlation function was Rxx(t0.5) = 0.5 [17]. In this paper, we only can obtain the distribution of turbulence intensity Tu in the flow direction, rather than turbulence intensity in the vertical direction.
Scale effects are usually present in the physical modeling of air-water flows because the Froude number, Weber number and Reynolds number cannot be identical to those of the prototype [25,26,27,28,29,30]. To minimize the scale effects of the bubble frequency and turbulence intensity, all the experimental tests were within the ranges of 250 ≤ W ≤ 490 and 6.7 × 10⁵ ≤ Re ≤ 18.1 × 10⁶, which were much wider than those in other investigations (Table 2).
3. Air-Water Flow Properties in Developed Region
3.1. Distributions of Air Concentration and Velocity
The typical distributions of the air concentration and velocity along the chute are presented in Figure 4. The previous studies of Wood [7] and Chanson [4] used iso-concentration line C = 0.90 as the characteristic aerated flow depth (represented as h90) for the completely developed region of the self-aerated flow. The dimensionless coordinate perpendicular to the chute bottom was defined as z/h90.
Definition:
where h90 was the depth where C = 0.90, h was the clear water depth, U was the mean velocity of cross section, qw was the water discharge per width and Cmean was the average concentration of the cross–section.
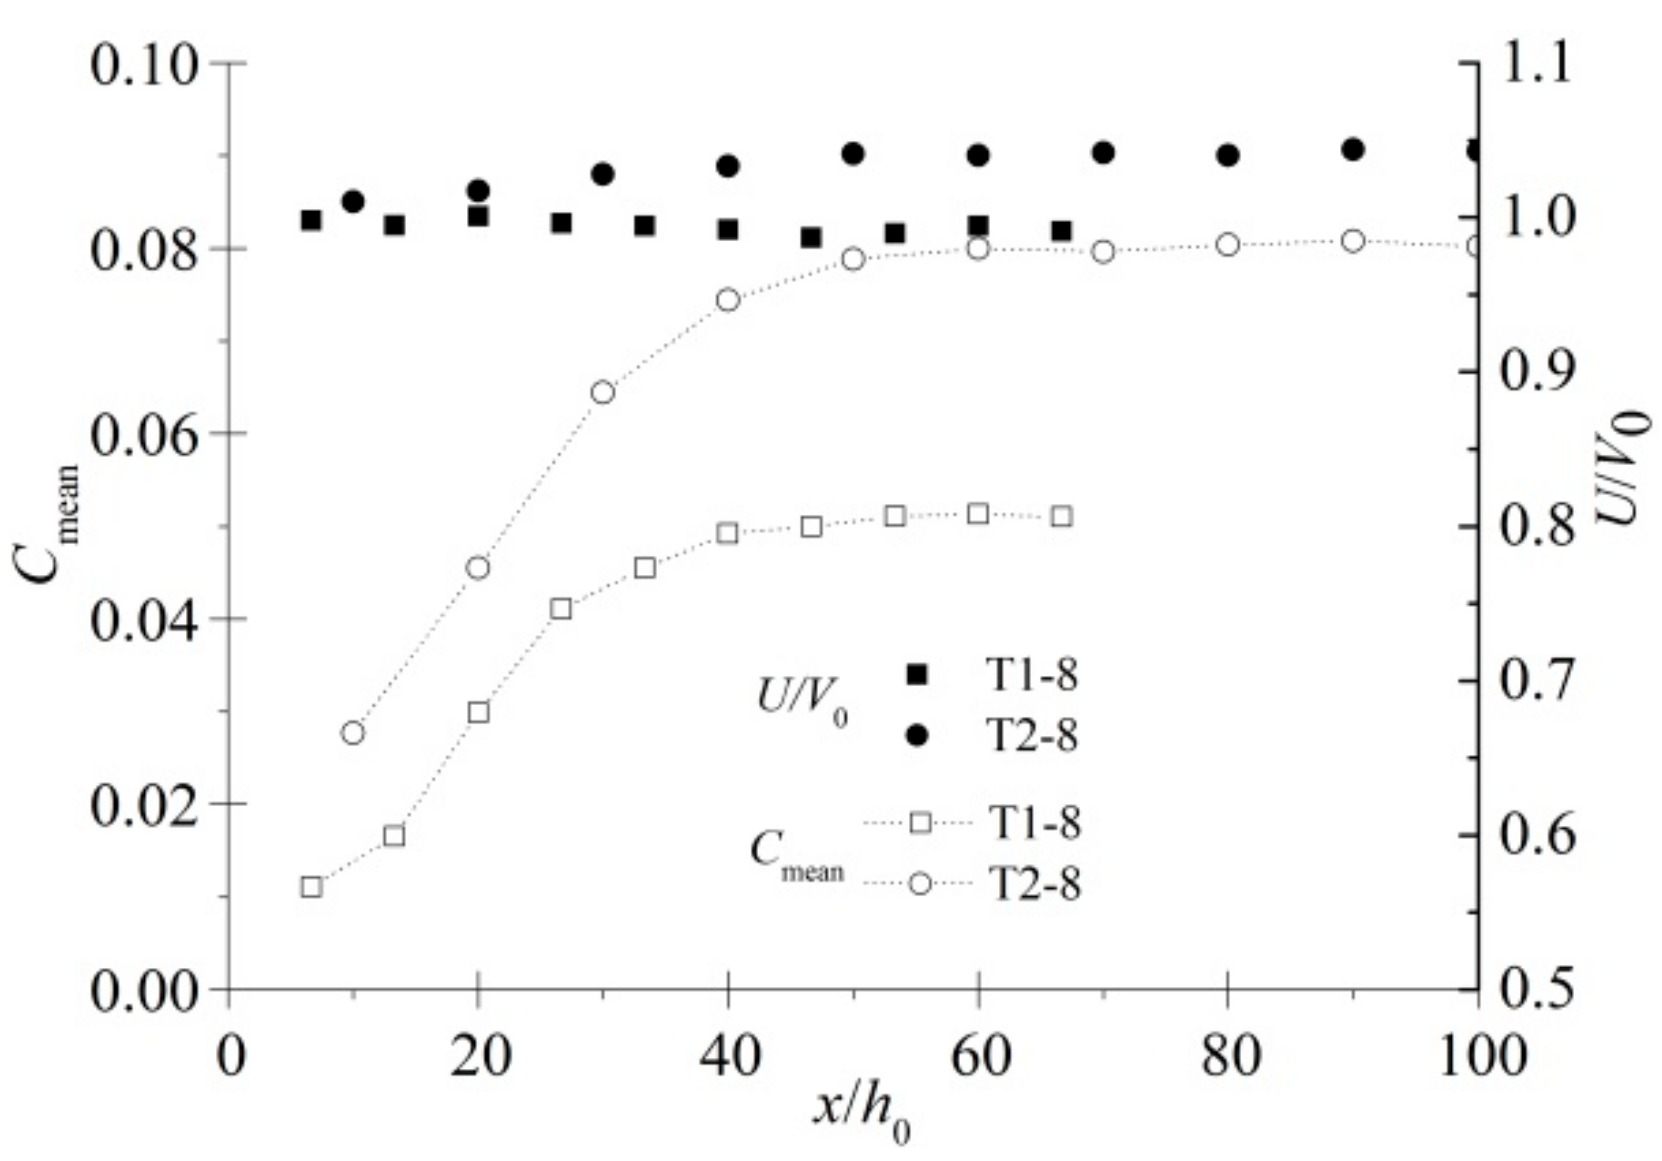
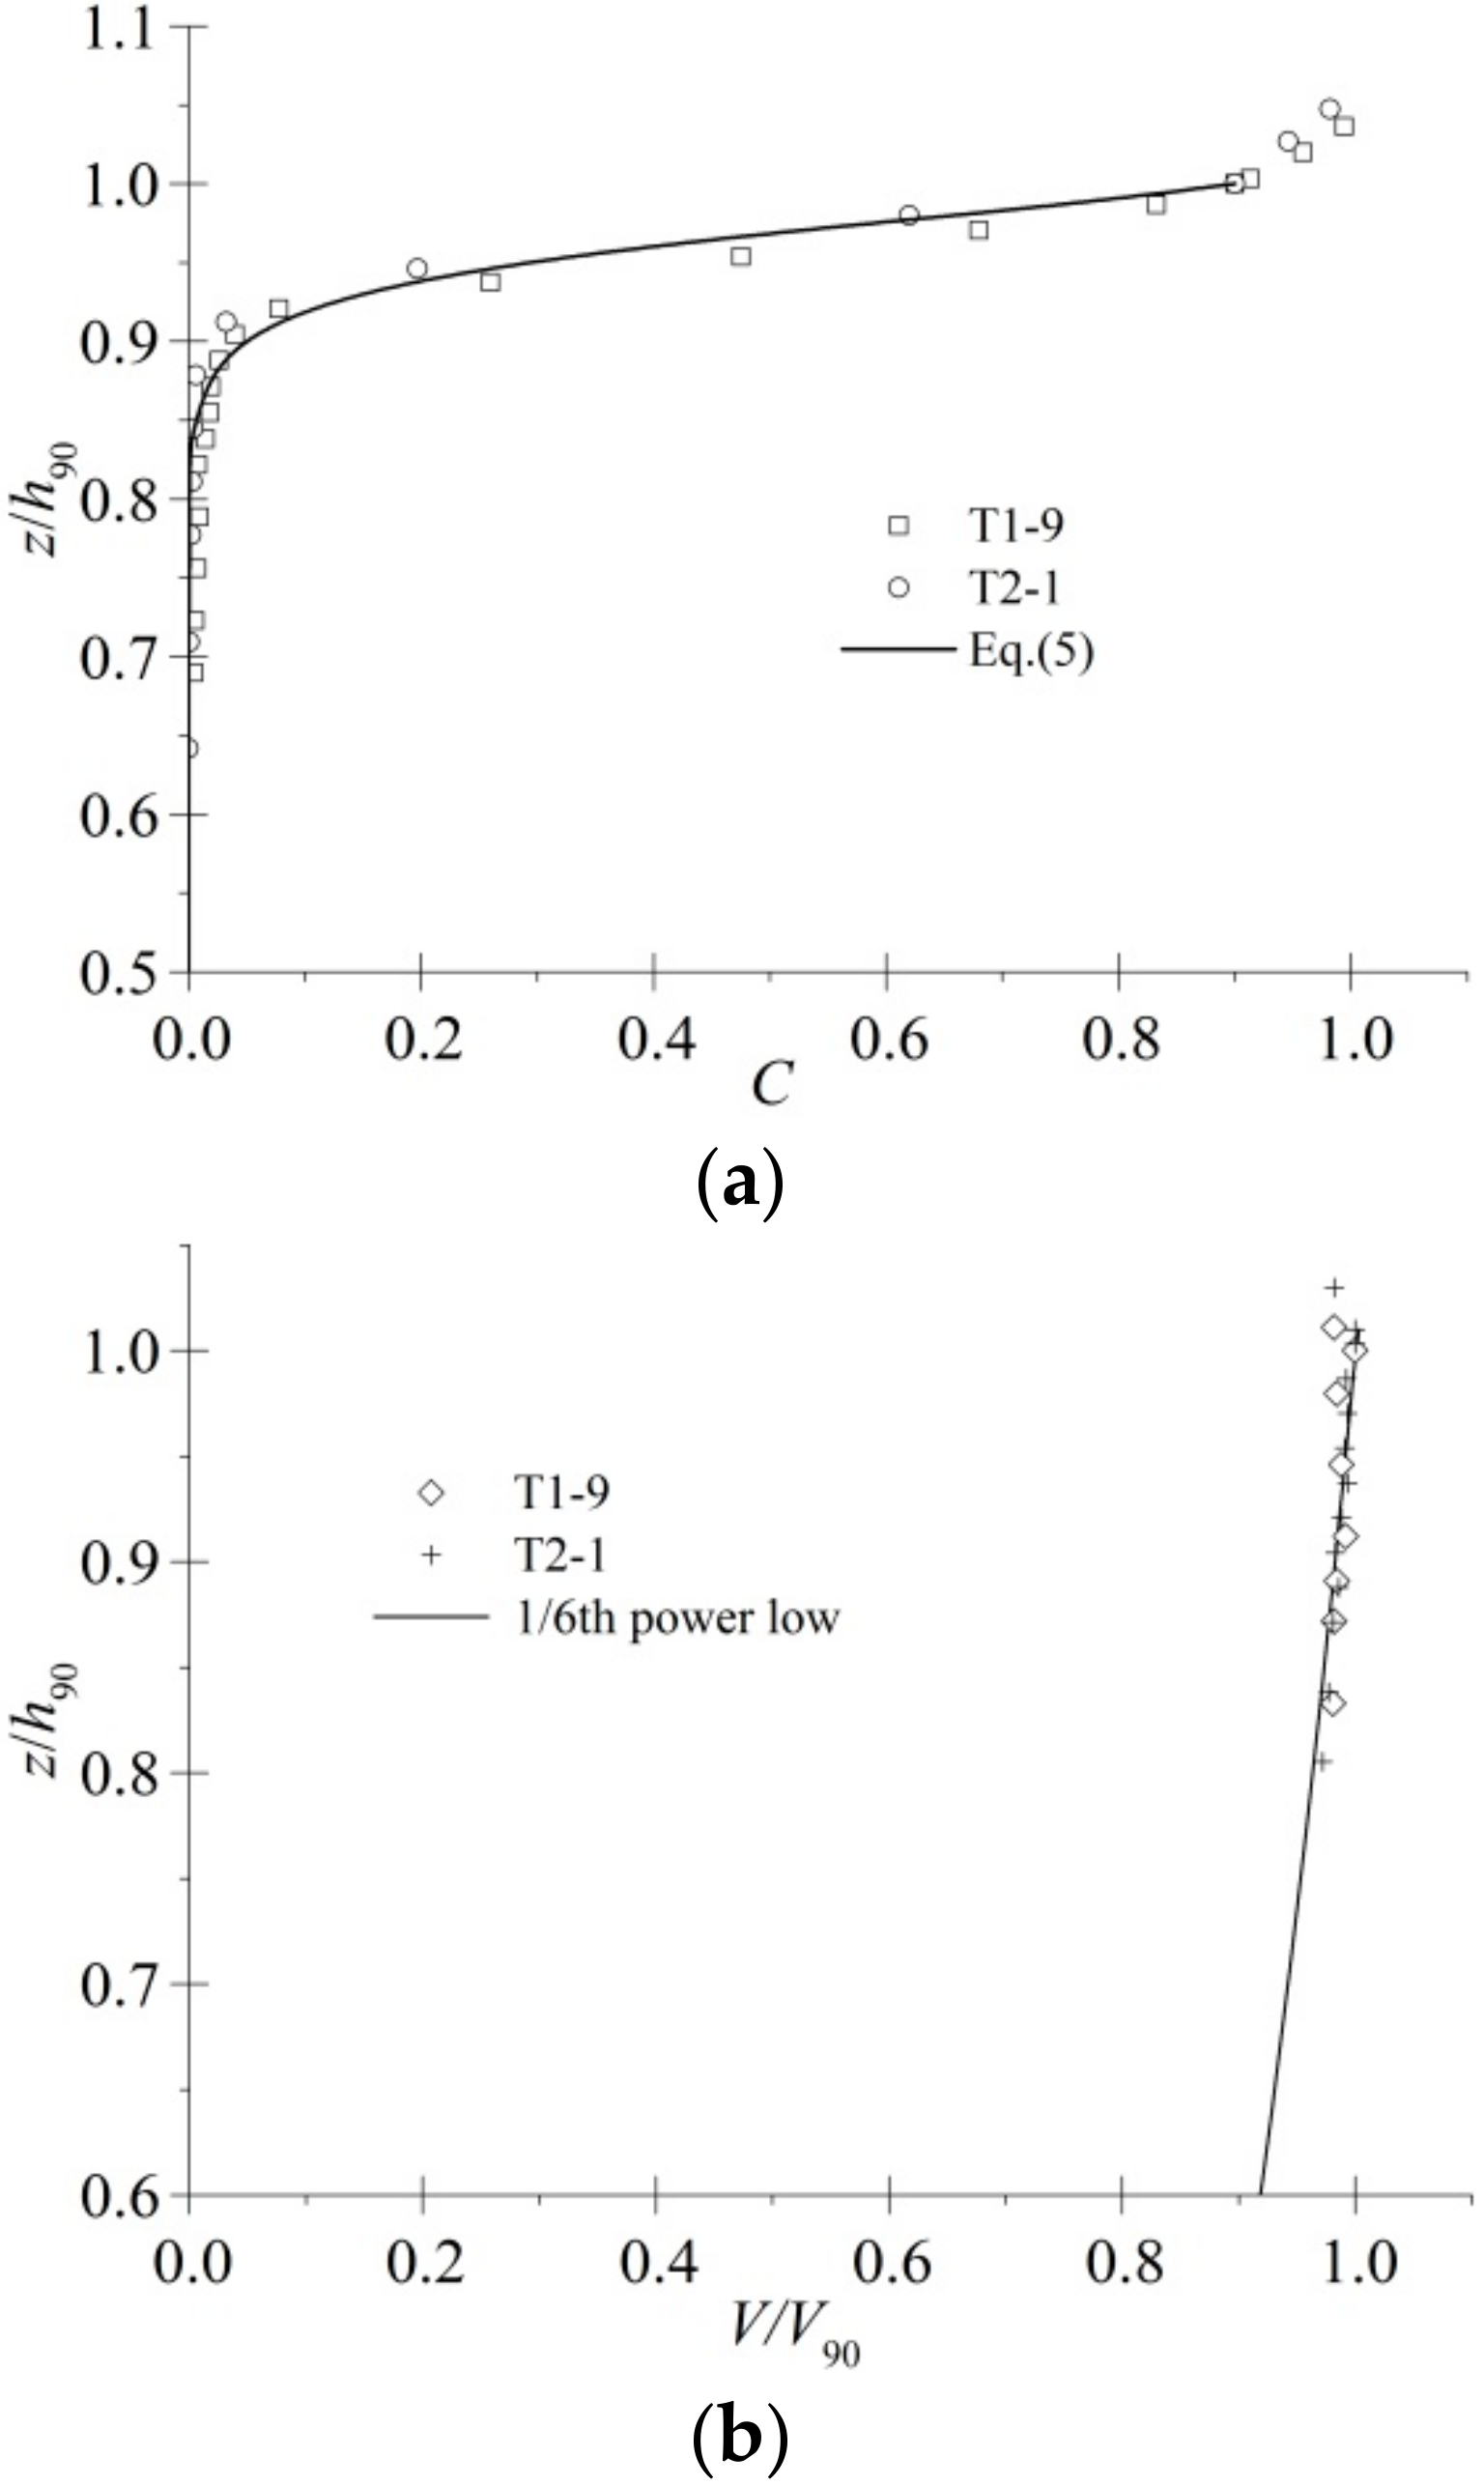
Note the following: (1) upstream of section x = 2 m, air is negligibly entrained into the flow through the upper surface and the section consists almost entirely of unaerated black water. (2) Although the air concentration shapes were almost similar, the characteristics of the aerated flow were found to vary at different locations of x ≤ 12 m along the chute. For h0 = 0.20 m, the inception point x/h0 approached to 9.0, boundary of developing/developed regions x/h0 approaches 45. For h0 = 0.30 m, the inception point x/h0 approaches 8.3, boundary of developing/developed regions x/h0 approaches 40. (3) Figure 5 shows that the mean air concentration increases slightly, with Cmean = 0.01 at x/h0 = 6.7 increasing to Cmean = 0.051 at x/h0 = 40. (4) A good agreement was also observed in terms of the dimensionless distribution of the velocity, whereas the velocity profiles followed closely a 1/6th power law [1,31]. (5) Figure 5 shows that dimensionless velocity U/V0 and depth-averaged air concentration Cmean seem to reach some asymptotic values.
In addition, various studies have investigated the air concentration in a self-aerated flow and found it to agree with the characteristic two-phase flow profiles. Chanson [33] proposed the theoretical equation for the air concentration distribution based on the turbulent diffusion theory. The velocity distribution closely followed a 1/6th power law [1,31]. Cain [1], who proposed n = 6.3 for prototype investigations and Chanson [31] for model investigations, with n = 6.0.
where D′ and K′ were dimensionless coefficients, z′ = z/h90 and tanh() was a hyperbolic tangent function.
3.2. Turbulence Intensity and Bubble Frequency
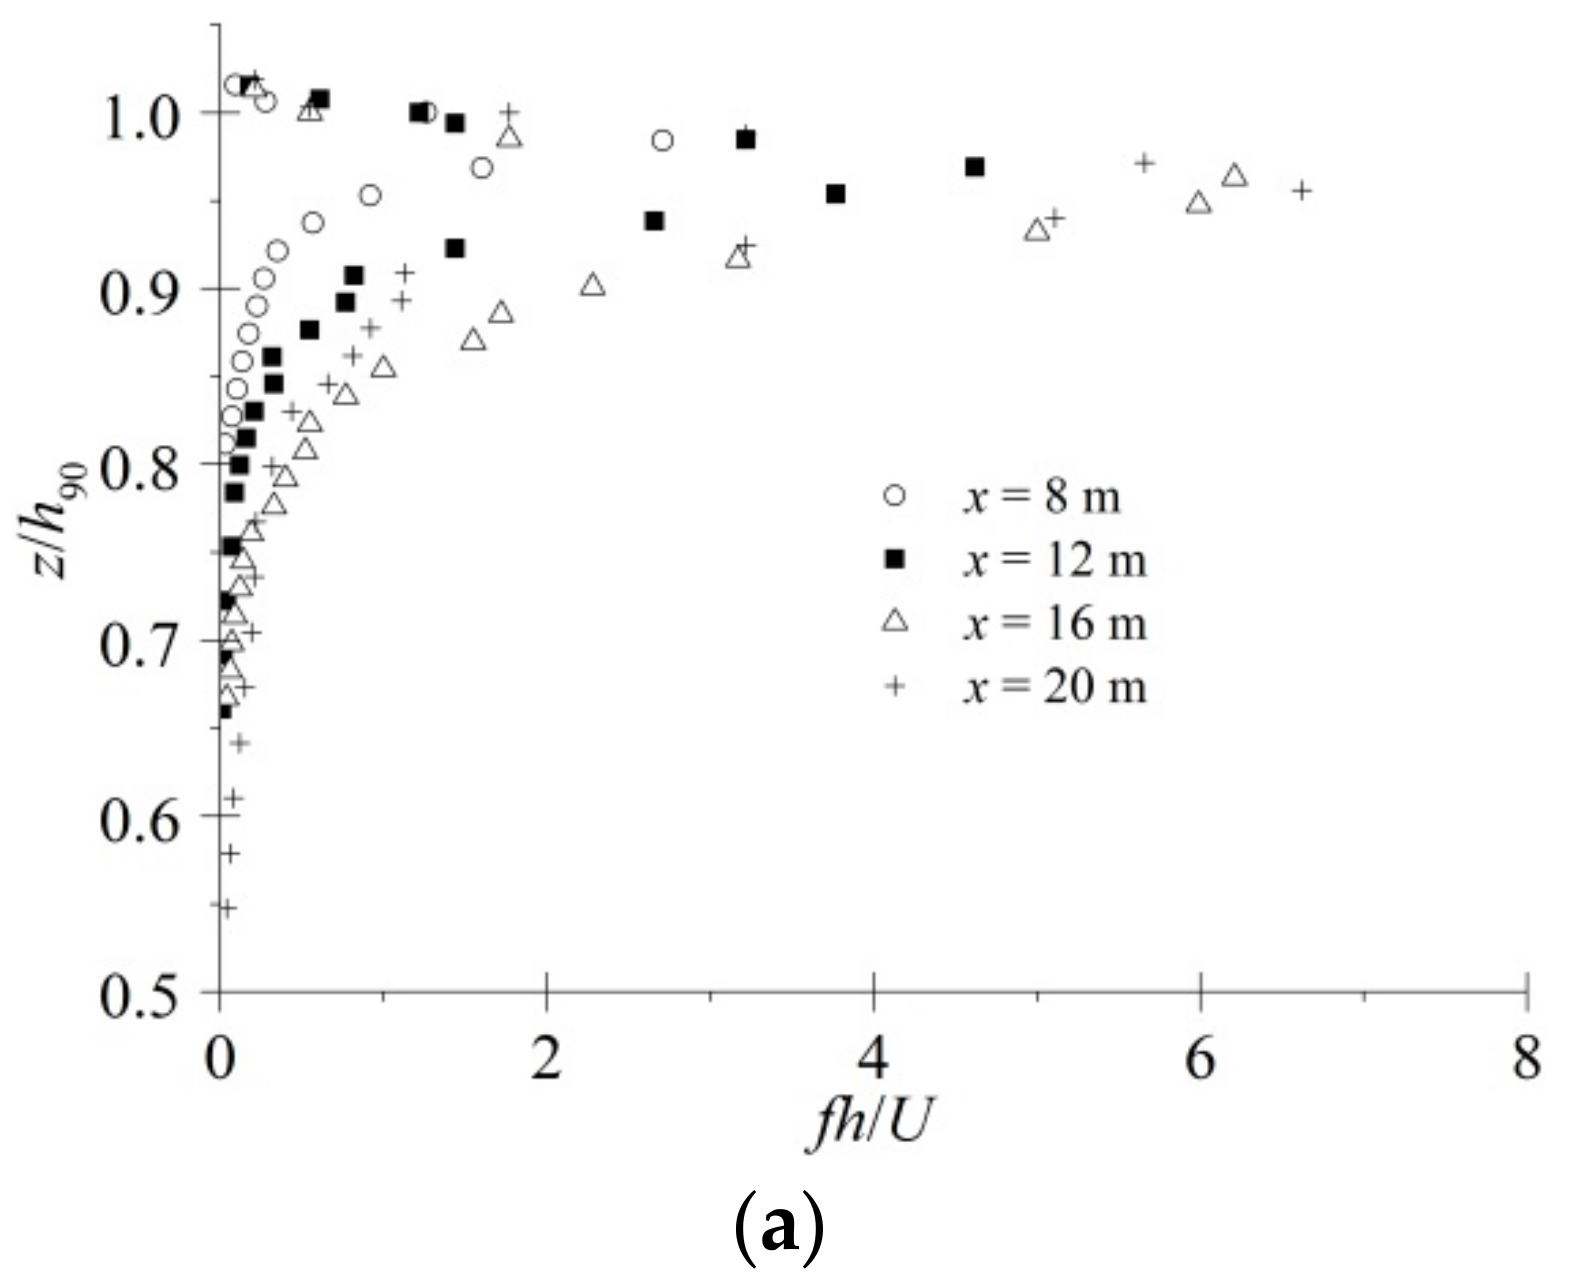
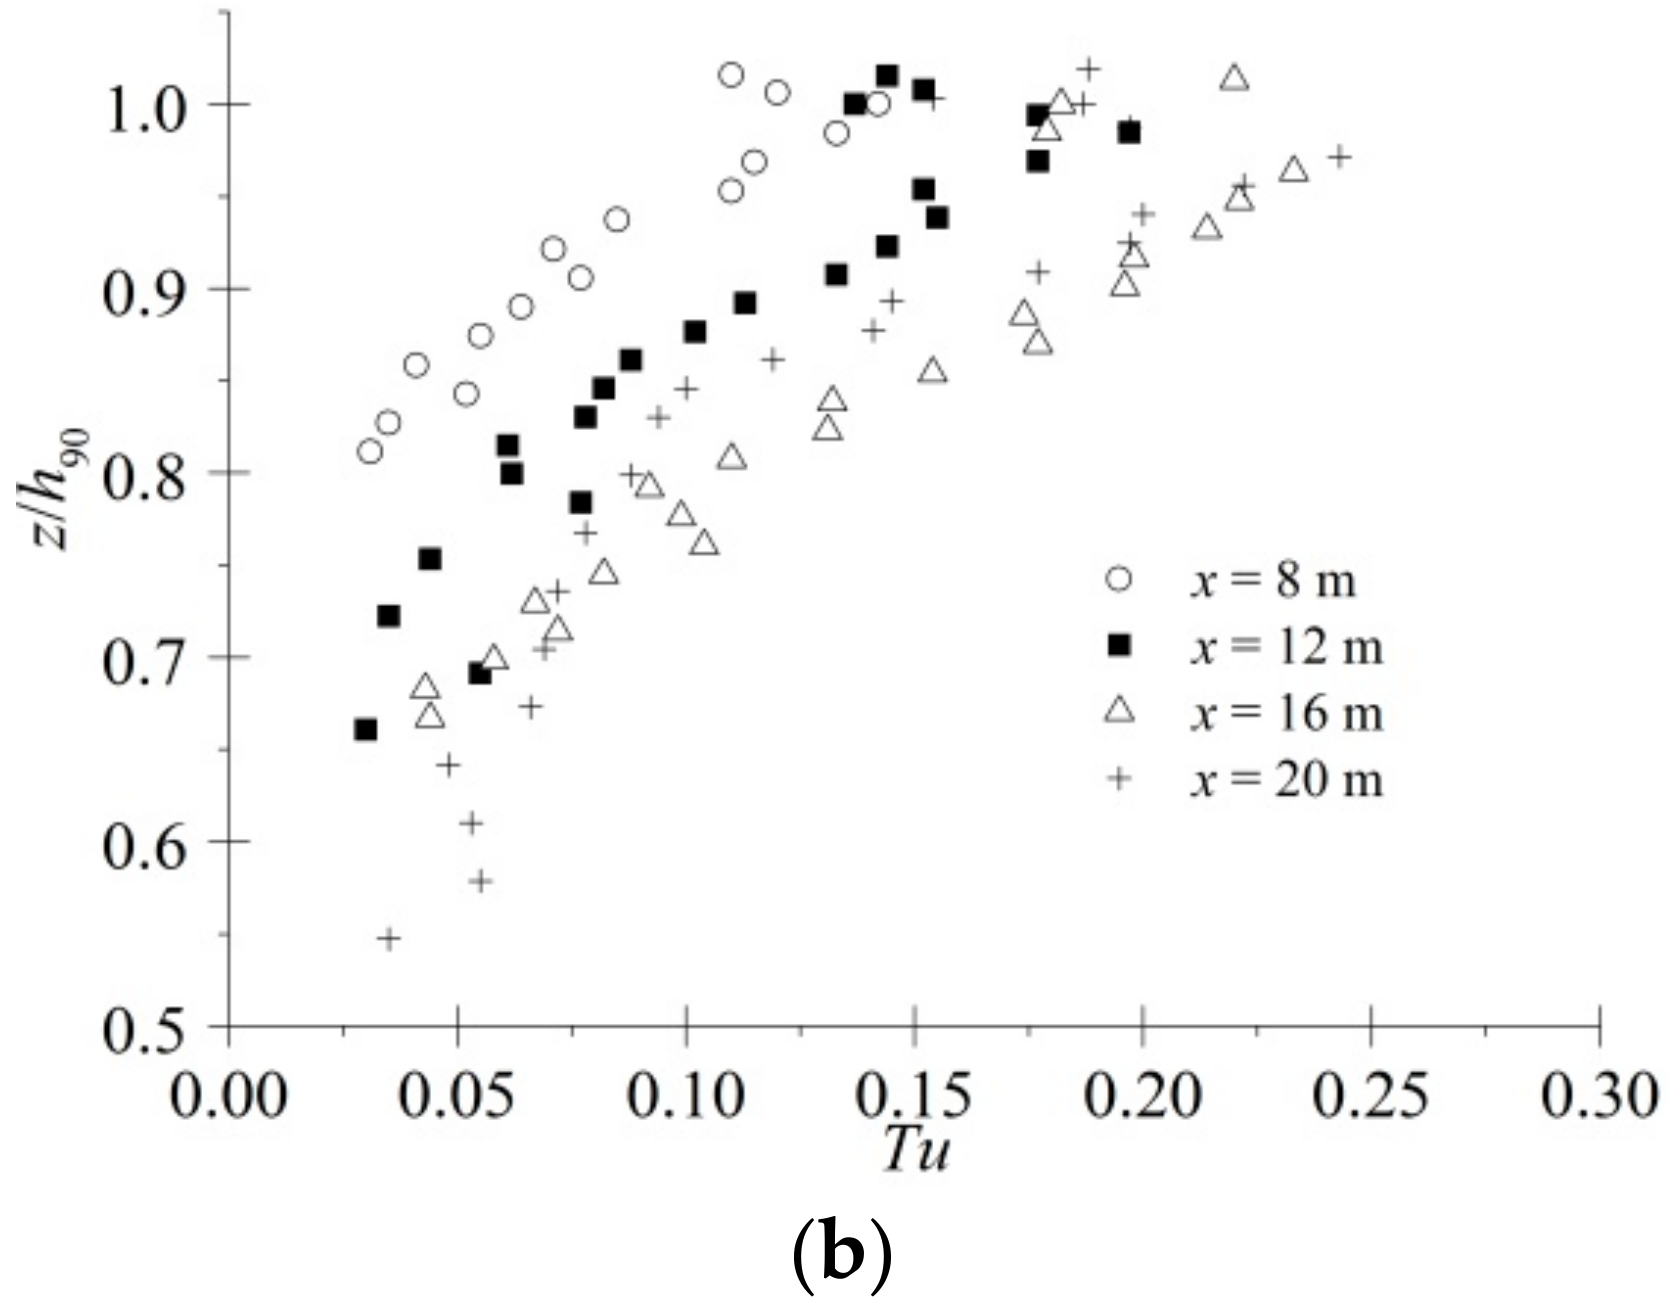
The dimensionless distributions of bubble frequency fh/U and turbulence intensity Tu are presented in Figure 6. Note the following: (1) the distributions of both the turbulence intensity and bubble frequency increased in the developing region and maintain equilibrium in the developed region. In the developed region, the shapes of the air bubble frequency and turbulence intensity were invariant. (2) The distribution of turbulence intensity Tu was similar to the air bubble frequency distribution. Dimensionless air bubble frequency fh/U increased from the bottom and then decreased near the surface. Similarly, the turbulence intensity decreased slightly near the surface. (3) In the self-aerated developed region, the typical distributions of the bubble frequency and turbulence intensity showed that the maxima of fmax and Tumax were observed in the intermediate flow region when 0.4 < C < 0.6 (Figure 6b). Finally, the distribution of Tu only consisted of the aerated zone (without the unaerated black water).
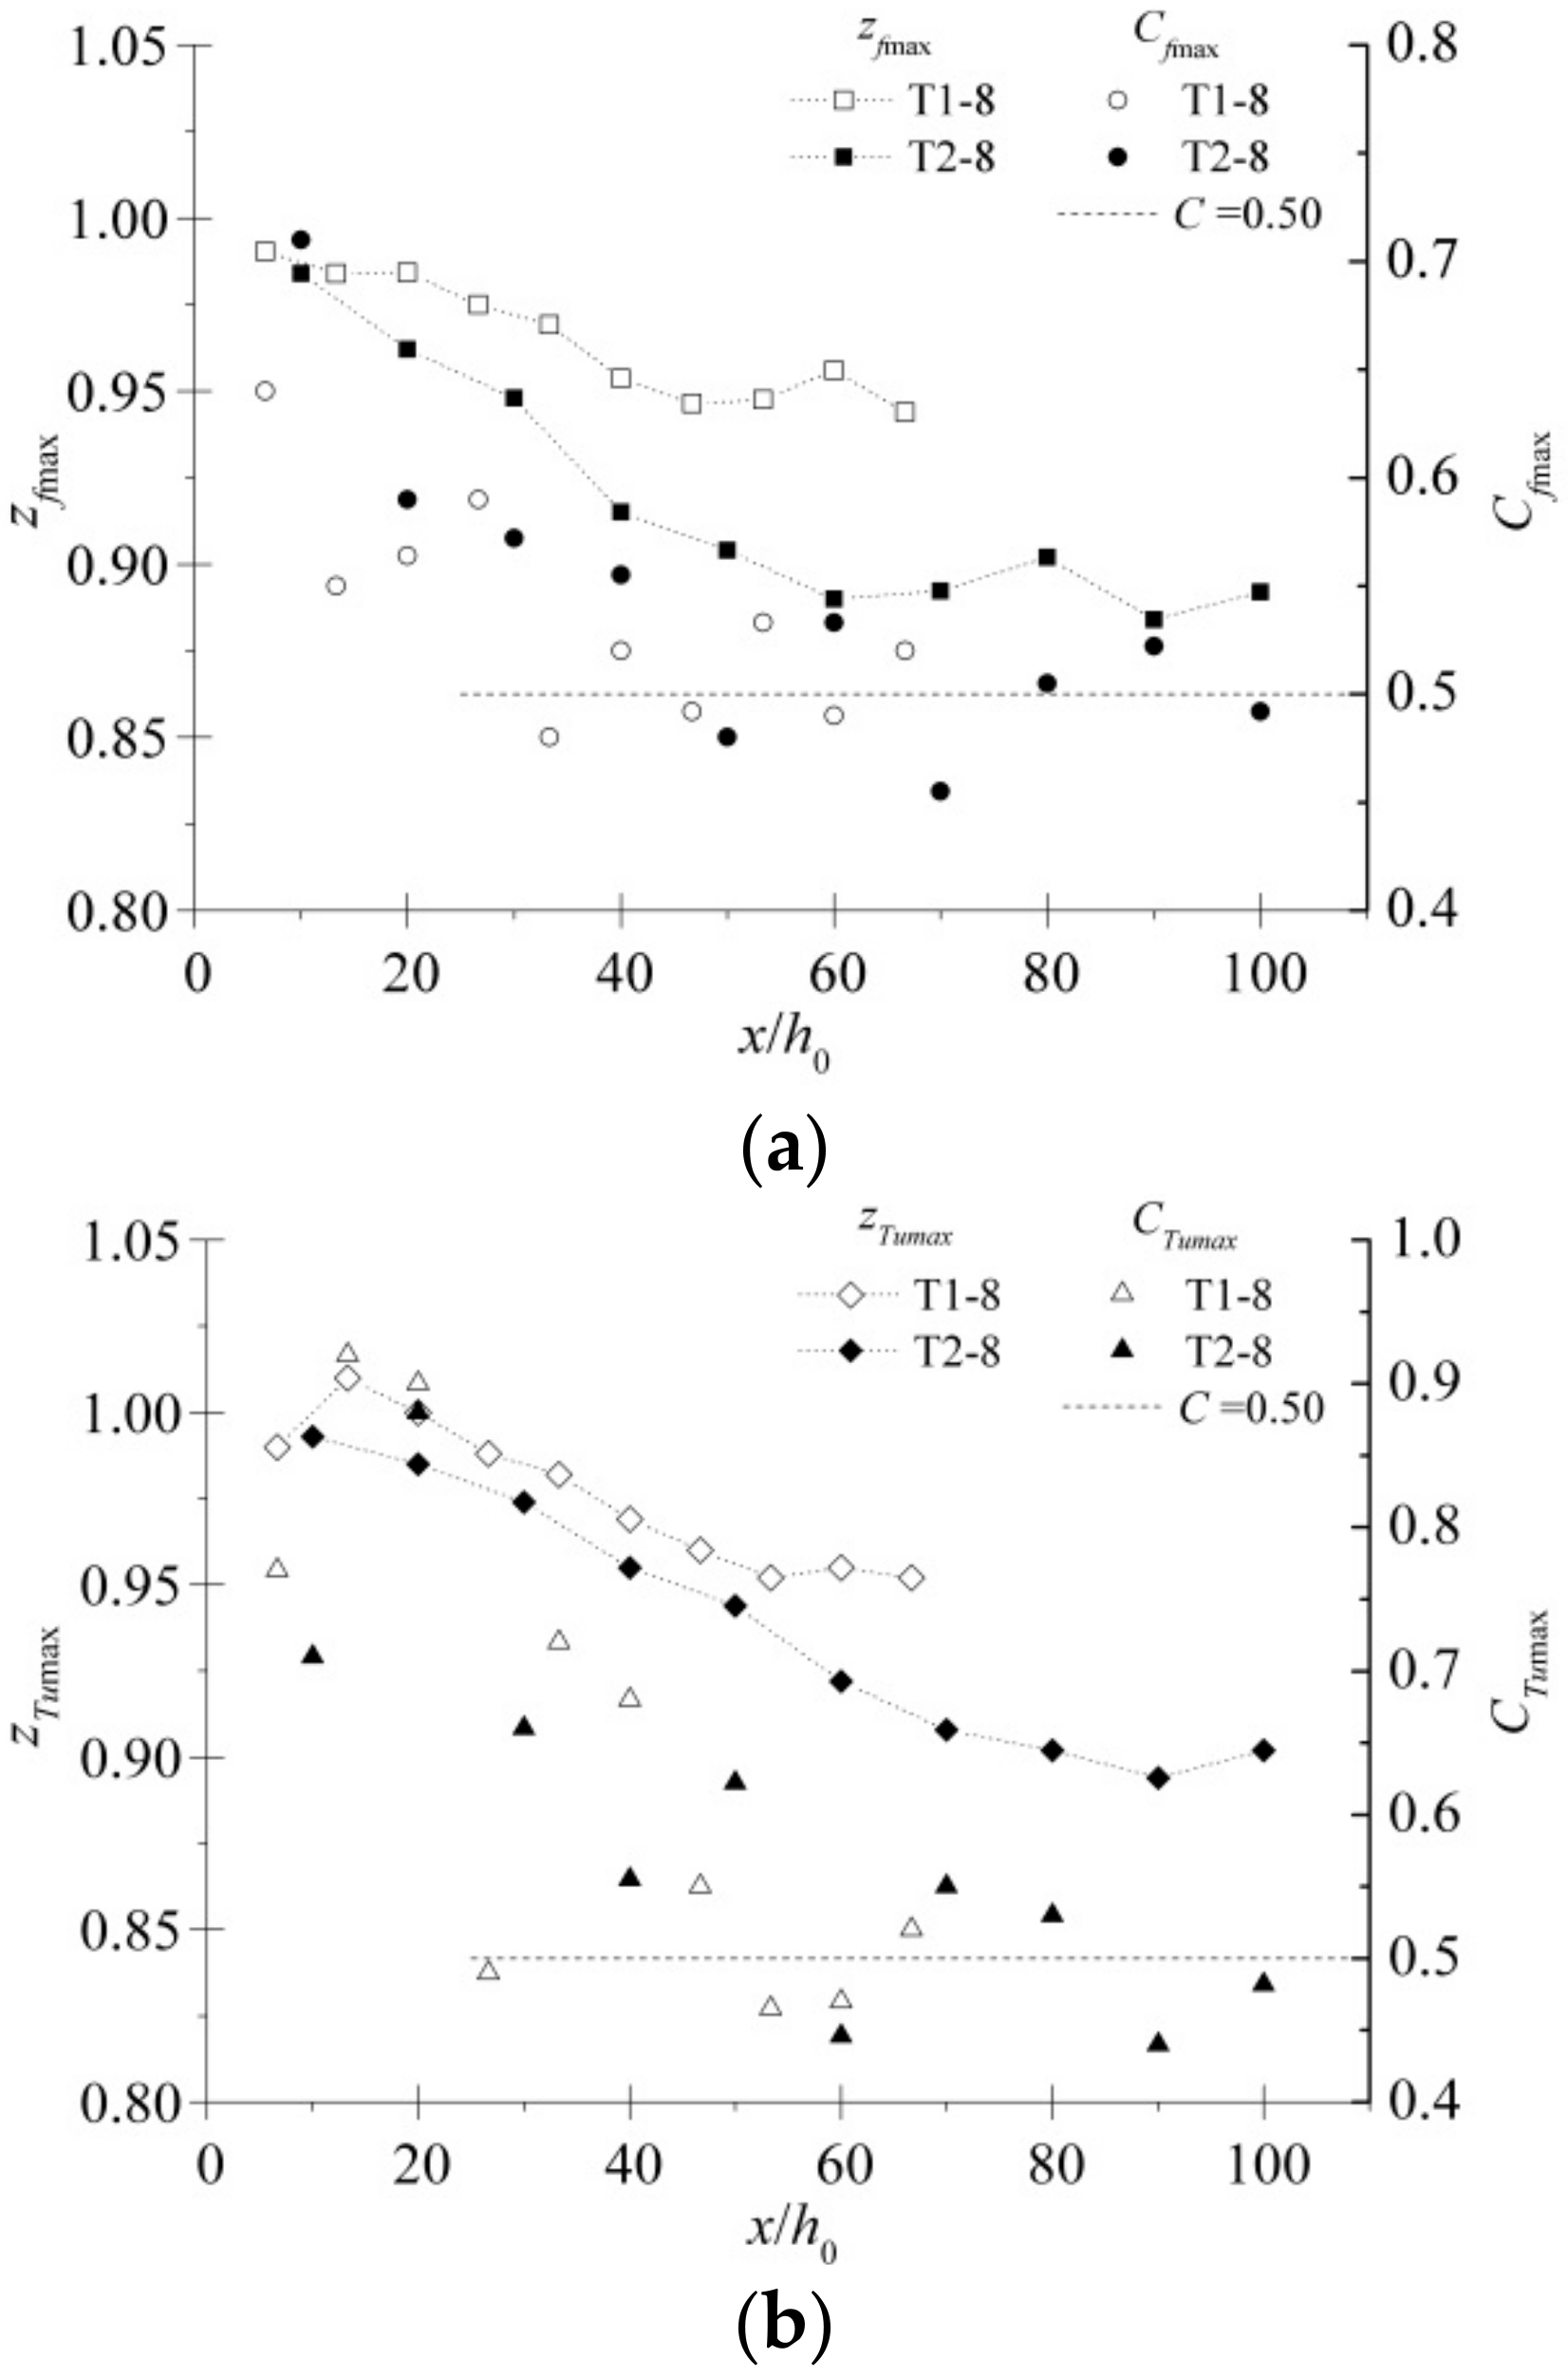
The profiles of the air bubble frequency and turbulence intensity exhibit maximum values (fmax and Tumax) at each cross-section are presented in Figure 7. Note the following: (1) with the development of self-aeration along the stream-wise, the position of the maximum air-phase frequency (zfmax) shifted to the air-water flow, as shown in Figure 7a; (2) For 0 < x/h0 < 40, the maximum bubble frequency was observed at the location where 0.50 < C < 0.80, whereas at 40 < x/h0 < 100, the maximum bubble frequency was concentrated at C = 0.50. Observation showed that the maximum bubble frequency was at the location where C = 0.50 at a cross-section in the self-aerated developed region. (3) Compared with the maximum bubble frequency, the maximum turbulence intensity displayed a similar low variation (Figure 7b). Consequently, at the air-water cross-section along the chute, the bubble frequency increased with the increasing intense turbulent fluctuation.
In this paper, we only can obtain the distribution of turbulence intensity Tu in the flow direction, rather than turbulence intensity in the vertical direction. There is no any data of turbulence intensity in the vertical direction in air-water two phase flows, such as hydraulic jumps, stepped flows and jet flows, et al. Many researchers have tried to explain the mechanism by which bubbles entrain into the flow through the free surface in an open channel. Up to now, despite there is no uniform theory, they all indicate the turbulence velocity v in the vertical direction is the most significant factor. However, basing on current research methods, the turbulence velocity v is hard to obtain in air-water two phase flows. The distribution of Tu in the flow direction may be helpful to study the dynamics of bubbles and of the free surface.
3.3. Froude, Reynolds and Weber Similitudes
The self-aerated air-water flow properties are presented in this section with the objective of focusing on the comparative analysis of the developed regions summarized in Table 1. Figure 8 shows the air concentration and velocity distributions at an identical Froude number F. The comparative results displayed that the distributions of the air concentration and velocity were more appropriately scaled with the Froude similitude.
Figure 9 shows the distributions of the turbulence intensity and bubble frequency for identical Froude number F, Reynolds number Re and Weber number W. The comparative results indicate that the turbulence intensities and bubble frequency could not be scaled with the F, Re, or W similitudes.
4. Discussion
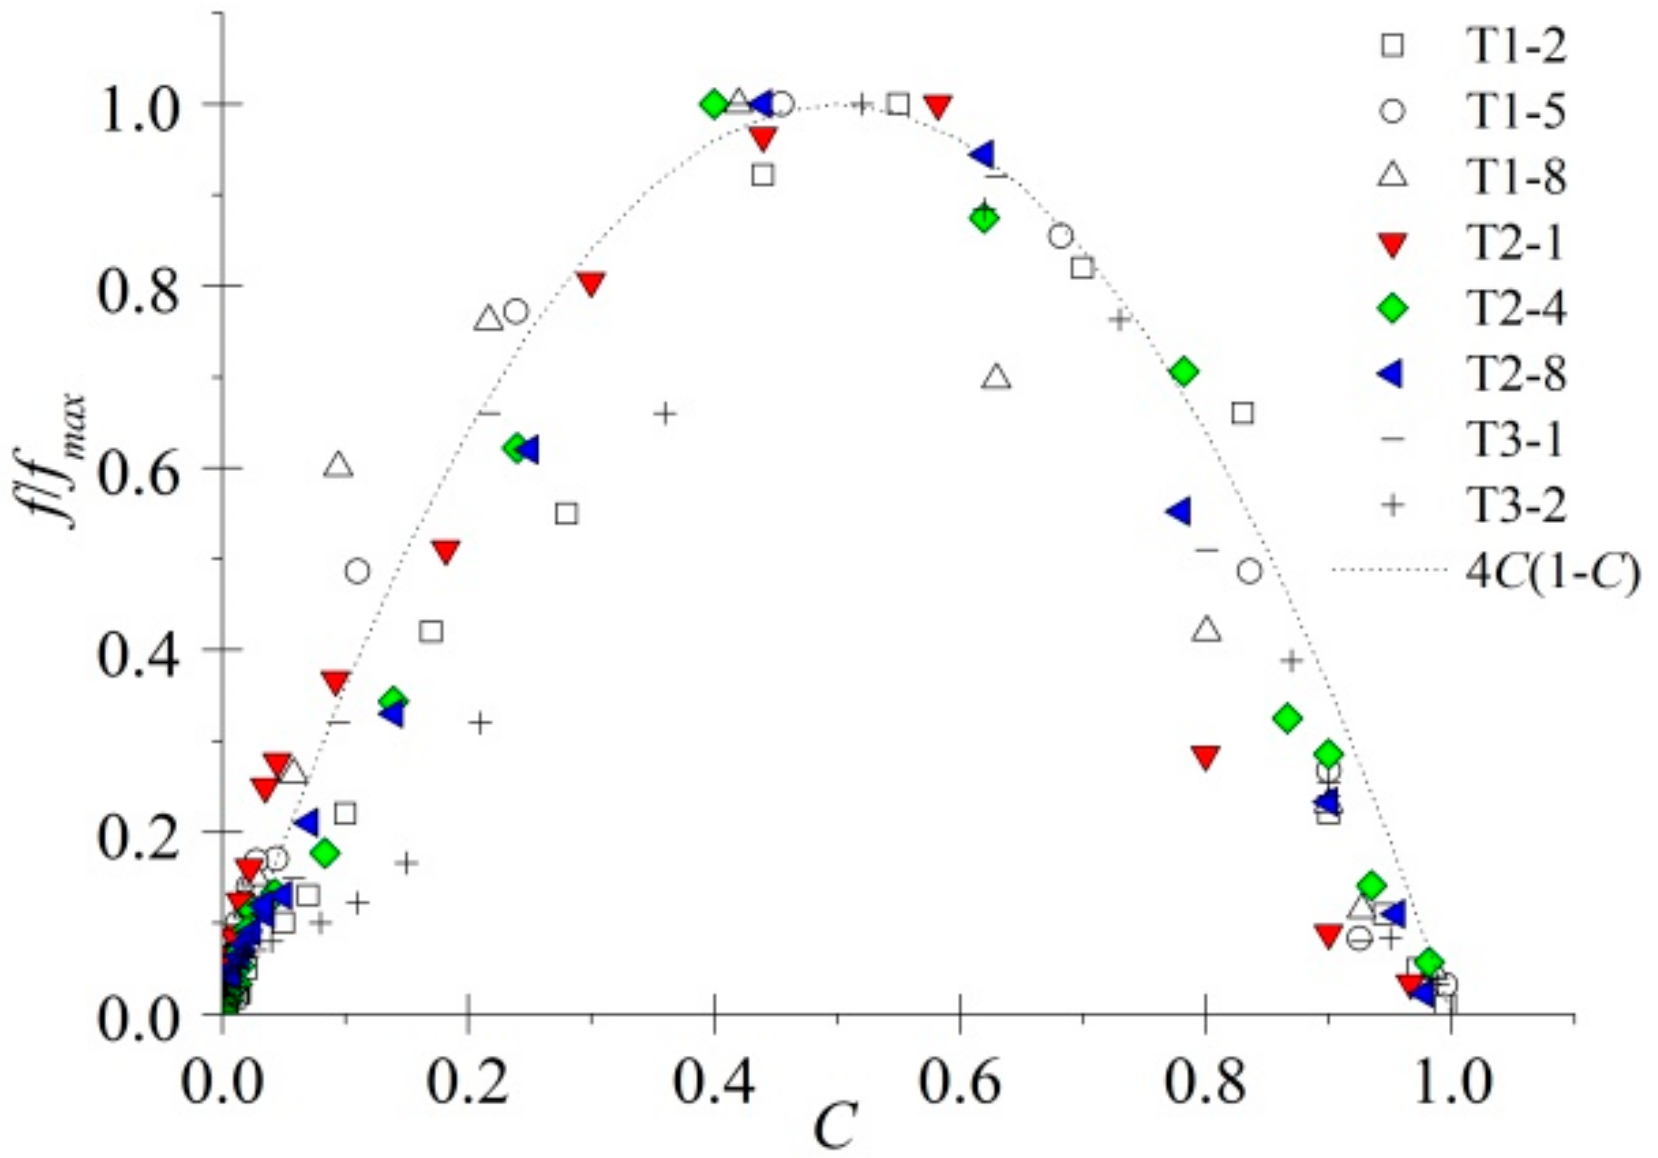
Self-similarity, which was closely linked with dynamic similarity, was a powerful tool in the research on turbulent flow and high-velocity air-water flows [34]. In the developed region of the air-water cross-section, the relationship between the air bubble frequency and air concentration was self-similar. The position of the maximum air bubble frequency caused by the air-water discontinuity gradually approached C = 0.40–0.60. The results of Cain [1] indicated that maximum bubble frequency fmax corresponded to C = 0.50 for self-aerated flows. The relationship between air concentration and bubble frequency were best fitted by a parabolic function (Figure 10).
The air bubble frequency represented the number of air-to-water and water-to-air interfaces within the air-water activity levels of the flows. Chanson [35] suggested that the turbulence controlled the mechanism of the bubble break-up and air-water interfacial properties, such as the air bubble frequency. The interaction between the entrained bubbles and turbulence structures also increased the turbulence levels [36]. In the self-aerated developed region, the typical distributions of the bubble frequency and turbulence intensity showed that the locations of fmax and Tumax were within the intermediate flow region for 0.4 < C < 0.6.
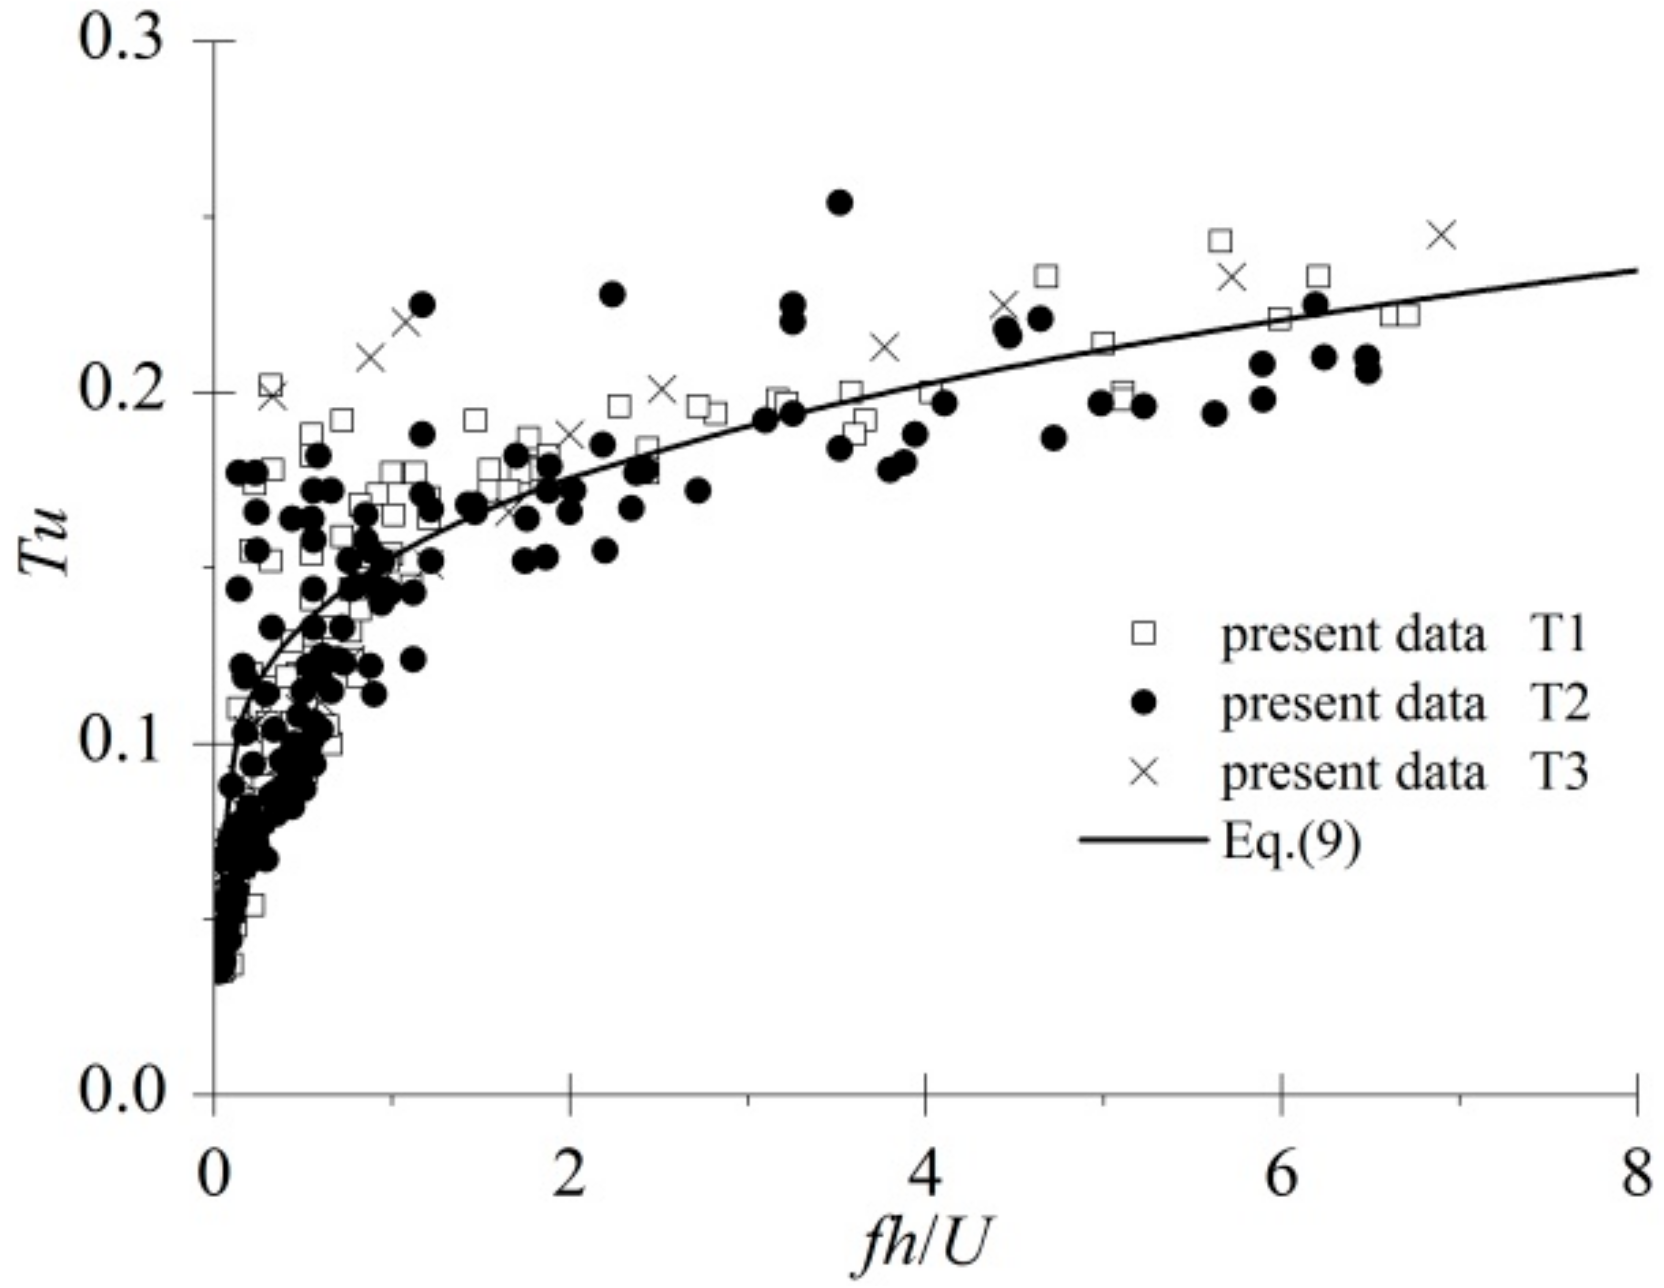
Toombes and Chanson [28] studied the two-phase high-velocity air-water flow properties on stepped spillways and proposed a function for turbulence intensity Tu and dimensionless bubble count rate fh/U:
where a, b and m were constants. Felder and Pfister [16] indicated that independent of the spillway roughness, the physical processes leading to the air entrainment were similar. Observations also indicated that the shapes of air concentration, velocity, bubble frequency and turbulence intensity were similar with stepped flows [16,28]. In order to quantify the turbulence intensity in self-aerated open channel flows with smooth bed, the provided methods of stepped spillways were applied to investigate the turbulence level. Hence, in the self-aerated developed region, the data overlapped reasonably well with the exponential trend (Figure 11):
Equation (9) reflected a monotonic increase in Tu with increasing bubble frequency. In Equation (9), the limit for fh/U = 0 was Tu = 0.033.
5. Conclusions
This study focused on high-velocity open channel flows. An accurate measurement technique utilizing conductivity probes provided a comprehensive analysis of the air-water flow properties in the developing and developed regions for the self-aerated flow, including the air-water flow parameters, turbulence intensities and bubble frequencies. In the air-water cross-section, values of both the turbulent intensity and bubble frequency increased from the bottom and subsequently decreased near the surface. The maxima of both the air bubble frequency and turbulence intensity were generally observed in the high-air concentration range in the self-aerated developing region. These maxima gradually approached the position of C = 0.50 in the self-aerated developed region.
Furthermore, the present investigation identified that the microscopic air-water flow properties of a self-aerated flow including the turbulence intensities and bubble frequencies could not be accurately scaled. The present results were limited to self-aerated flows with 5.71° ≤ α ≤ 8.22°, 4.0 ≤ F ≤ 6.1, 6.7 × 10⁵ ≤ Re ≤ 18.1 × 10⁵ and 254 ≤ W ≤ 494. This study complements the microcosmic characteristics of self-aerated flows in open channels with a smooth bed, which will be helpful for studying the dynamics of the bubbles and the free surface. However, conducting field measurements in a prototype facility remains a challenge.
Author Contributions
Conceptualization, R.B., and W.W.; Methodology, R.B. and S.L.; Software, R.B.; Validation, R.B.; Formal Analysis, R.B. and W.W.; Investigation, R.B.; Resources, S.L.; Data Curation, R.B.; Writing-Original Draft Preparation, R.B.; Writing-Review & Editing, R.B.; Visualization, R.B.; Supervision, F.Z.; Project Administration, R.B., F.Z. and S.L.; Funding Acquisition, R.B., F.Z. and S.L.
Funding
This work was supported by the National Natural Science Foundation of China (Grant No. 51709293 and Grant No. 51679157) and the Fundamental Research Funds for the Central Universities (Grant No. 20826041A4305).
Conflicts of Interest
The authors declare no conflict of interest.
References
- Cain, P. Measurements within Self-Aerated Flow on a Large Spillway. Ph.D. Thesis, University of Canterbury, Christchurch, New Zealand, April 1978. [Google Scholar]
- Pinto, N.L.S.; Neidert, S.; Ota, J. Aeration at high velocity flows–part two. Int. Water Power Dam Constr. 1982, 34, 42–44. [Google Scholar]
- Chanson, H.; Carosi, G. Turbulent Time and Length Scale Measurements in High–Velocity Open Channel Flows. Exp. Fluids 2007, 42, 385–401. [Google Scholar] [CrossRef] [Green Version]
- Chanson, H. Self-aerated flows on chutes and super ways. J. Hydraul. Eng. 1993, 119, 220–243. [Google Scholar] [CrossRef]
- Straub, L.G.; Anderson, A.G. Experiments on self-aerated flow in open channels. J. Hydraul. Div. ASCE 1958, 84, 1–35. [Google Scholar]
- Clark, N.N.; Turton, R. Chord Length Distributions Related to Bubble Size Distributions in Multiphase Flows. Int. J. Multiphase Flow 1988, 14, 413–424. [Google Scholar] [CrossRef]
- Wood, I.R. Uniform region of self-aerated flow. J. Hydraul. Eng. ASCE 1983, 109, 447–461. [Google Scholar] [CrossRef]
- Wood, I.R. Air Entrainment in Free-Surface Flow: IAHR Hydraulic Structures Design Manuals 4; A.A.Balkema: Rotterdam, The Netherlands, 1991. [Google Scholar]
- Hager, W.H. Uniform aerated chute flow. J. Hydraul. Eng. 1991, 117, 528–533. [Google Scholar] [CrossRef]
- Kumar, S.; Gupta, R.; Banerjee, S. An experimental investigation of the characteristics of free–surface turbulence in channel flow. Phys. Fluids 1998, 10, 437–456. [Google Scholar] [CrossRef]
- Smolentsev, S.; Miraghaie, R. Study of a free surface in open–channel water flows in the regime from “weak” to “strong“ turbulence. Int. Multiphase Flow 2005, 31, 921–939. [Google Scholar] [CrossRef]
- Li, F.C.; Kawaguchi, Y.; Segawa, T.; Suga, K. Simultaneous measurement of turbulent velocity field and surface wave amplitude in the initial stage of an open–channel flow by PIV. Exp. Fluids 2005, 39, 945–953. [Google Scholar] [CrossRef]
- Dong, Y.H.; Lu, X.Y.; He, F. Direct numerical simulation of stably and unstably stratified turbulent open channel flows. Acta Mech. 2005, 177, 115–136. [Google Scholar] [CrossRef]
- Brocchini, M.; Peregrine, D.H. The dynamics of strong turbulence at free surfaces. Part 1. Description. J. Fluid Mech. 2001, 449, 225–254. [Google Scholar] [CrossRef]
- Daniel, V.; Daniel, B.B. Development of the interfacial air layer in the non–aerated region of high–velocity spillway flows. Instabilities growth, entrapped air and influence on the self–aeration onset. Int. J. Multiphase Flow 2016, 84, 66–74. [Google Scholar]
- Stefan, F.; Michael, P. Comparative analyses of phase-detective intrusive probes in high-velocity air-water flows. Int. J. Multiphase Flow 2017, 90, 88–101. [Google Scholar]
- Pfister, M.; Chanson, H. Two–phase air-water flows: Scale effects in physical modelling. J. Hydrodyn. 2014, 26, 291–298. [Google Scholar] [CrossRef]
- Volkart, P. The Mechanism of Air Bubble Entrainment in Self-aerated Flow. Int. J. Multiphase Flow 1980, 6, 411–423. [Google Scholar] [CrossRef]
- Felder, S.; Chanson, H. Air-water Flow Properties in Step Cavity down a Stepped Chute. Int. J. Multiphase Flow 2011, 37, 732–745. [Google Scholar] [CrossRef] [Green Version]
- Felder, S.; Chanson, H. Phase–detection probe measurements in high–velocity free–surface flows including a discussion of key sampling parameters. Exp. Therm. Fluid Sci. 2015, 61, 66–78. [Google Scholar] [CrossRef]
- Bai, R.; Zhang, F.; Liu, S.; Wang, W. Air concentration and bubble characteristics downstream of a chute aerator. Int. J. Multiphase Flow 2016, 87, 156–166. [Google Scholar] [CrossRef]
- Bai, R.; Liu, S.; Tian, Z.; Wang, W.; Zhang, F. Experimental investigations on air-water flow properties of offset–aerator. J. Hydraul. Eng. 2018, 144, 04017059. [Google Scholar] [CrossRef]
- Chanson, H. Air-water measurements with intrusive phase–detection probes: Can we improve their interpretation? J. Hydraul. Eng. 2002, 128, 252–255. [Google Scholar] [CrossRef]
- Kipphan, H. Bestimmung von transportkenngroßen bei mehrphasenstromungen mit hilfe der korrelationsmeßtechnik. Chem. Ing. Tech. 1977, 49, 695–707. [Google Scholar] [CrossRef]
- Bombardelli, F.A.; Buscaglia, G.C.; Rehmann, C.R.; Rincón, L.E.; García, M.H. Modeling and scaling of aeration bubble plumes: A two–phase flow analysis. J. Hydraul. Res. 2016, 45, 617–630. [Google Scholar] [CrossRef]
- Heller, V. Scale effects in physical hydraulic engineering models. J. Hydraul. Res. 2011, 49, 293–306. [Google Scholar] [CrossRef]
- Tastan, K. Effects of Froude, Reynolds, and Weber numbers on an air–entraining vortex. J. Hydraul. Res. 2014, 52, 421–425. [Google Scholar] [CrossRef]
- Toombes, L.; Chanson, H. Air-water Mass Transfer on a Stepped Waterway. J. Environ. Eng. ASCE 2005, 131, 1377–1386. [Google Scholar] [CrossRef]
- Herringe, R.A.; Davis, M.R. Detection of instaneous phase changes in gas liquid mixtures. J. Phys. 1974, 7, 807–812. [Google Scholar]
- Wilhelms, S.C.; Gulliver, J.S. Bubbles and waves description of self-aerated spill–way flow. J. Hydraul. Res. 2005, 43, 522–531. [Google Scholar] [CrossRef]
- Chanson, H. Air bubble entrainment in open channels: Flow structure and bubble size distributions. Int. J. Multiphase Flow 1997, 23, 193–203. [Google Scholar] [CrossRef] [Green Version]
- Deng, J.; Wei, W.-R.; Xu, W.-L.; Tian, Z.; Zhang, F.-X. Experimental study on air–phase frequency in self-aerated flow. Water Manag. 2015, 168, 153–161. [Google Scholar] [CrossRef]
- Chanson, H. Air bubble diffusion in supercritical open channel flows. In Proceedings of the Twelfth Australasian Fluid Mechanics Conference, Sydney, Australia, December 1995. [Google Scholar]
- Chanson, H.; Chachereau, Y. Scale effects affecting two–phase flow properties in hydraulic jump with small inflow Froude Number. Exp. Therm. Fluid Sci. 2013, 45, 234–242. [Google Scholar] [CrossRef] [Green Version]
- Chanson, H. Air-water flows down stepped chutes: Turbulence and flow structure observations. Int. J. Multiphase Flow 2002, 28, 1737–1761. [Google Scholar] [CrossRef]
- Chanson, H.; Felder, S. Turbulence Measurements in Air-water Self-aerated Flows: Basic Analysis and Results. In Proceedings of the 7th International Conference on Multiphase Flow ICMF, Tampa, FL, USA, 30 May–4 June 2010. [Google Scholar]
Figure 1.
Sketch of self-aeration in the open channel flow.

Figure 2.
Sketch needle probe.

Figure 3.
Auto-correlation and cross-correlation functions (T1–8: qw = 2.29 m2/s; V = 7.51 m/s; z/h90 = 0.946; C = 0.621; f = 667).
Figure 3.
Auto-correlation and cross-correlation functions (T1–8: qw = 2.29 m2/s; V = 7.51 m/s; z/h90 = 0.946; C = 0.621; f = 667).

Figure 4.
Distributions of air concentration (a) and velocity distribution (b) along the chute. Run: T1–8.
Figure 4.
Distributions of air concentration (a) and velocity distribution (b) along the chute. Run: T1–8.

Figure 5.
Mean of concentration and velocity along the chute (Run: T1–8).

Figure 6.
Distributions of air bubble frequency (a) and turbulence intensity (b). Run: T1–8.


Figure 7.
Variation of maximum bubble frequency and turbulence intensity positions along the developing and developed regions.
Figure 7.
Variation of maximum bubble frequency and turbulence intensity positions along the developing and developed regions.

Figure 8.
Distributions of air concentration (a) and velocity (b) with identical F (F = 4.6).

Figure 9.
Distributions of turbulence intensity (a) and bubble frequency (b) with identical F, Re, W.
Figure 9.
Distributions of turbulence intensity (a) and bubble frequency (b) with identical F, Re, W.

Figure 10.
Relationship between the air bubble frequency and air concentration.

Figure 11.
Relationship between turbulence intensity and dimensionless bubble frequency.


Table 1.
Experimental flow conditions.
| Run | qw (m2/s) | h0 (m) | α (deg.) | V0 (m/s) | Re (×105) | F | W |
|---|---|---|---|---|---|---|---|
| T1–1 | 1.69 | 0.30 | 5.71 | 6.46 | 12.8 | 3.9 | 384 |
| T1–2 | 1.81 | 6.78 | 13.9 | 4.0 | 407 | ||
| T1–3 | 1.92 | 6.89 | 14.8 | 4.1 | 423 | ||
| T1–4 | 2.01 | 7.09 | 15.5 | 4.2 | 439 | ||
| T1–5 | 2.11 | 7.30 | 16.2 | 4.3 | 456 | ||
| T1–6 | 2.13 | 7.36 | 16.4 | 4.4 | 460 | ||
| T1–7 | 2.23 | 7.43 | 17.2 | 4.4 | 473 | ||
| T1–8 | 2.29 | 7.51 | 17.6 | 4.5 | 482 | ||
| T1–9 | 2.35 | 7.67 | 18.1 | 4.6 | 494 | ||
| T2–1 | 0.87 | 0.20 | 5.71 | 5.50 | 6.7 | 4.6 | 254 |
| T2–2 | 0.94 | 5.95 | 7.2 | 4.8 | 275 | ||
| T2–3 | 1.18 | 6.44 | 9.1 | 4.9 | 320 | ||
| T2–4 | 1.25 | 6.72 | 9.6 | 5.0 | 337 | ||
| T2–5 | 1.3 | 6.91 | 10.0 | 5.1 | 348 | ||
| T2–6 | 1.39 | 7.10 | 10.7 | 5.2 | 365 | ||
| T2–7 | 1.43 | 7.33 | 11.0 | 5.3 | 376 | ||
| T2–8 | 1.51 | 7.50 | 11.6 | 5.4 | 391 | ||
| T2–9 | 1.59 | 7.86 | 12.2 | 5.6 | 411 | ||
| T3–1 | 1.58 | 0.20 | 8.22 | 7.96 | 12.3 | 5.7 | 412 |
| T3–2 | 1.62 | 8.20 | 12.6 | 5.9 | 424 |
Notes: Reynolds number Re and Weber number W were defined as: Re = U × h/υ, W = (ρwU2 × h/σ)0.5.
Table 2.
Experimental investigations of self-aerated flow.
| Reference | Slope (deg.) | U (m/s) | F | Re (×105) | W | Comments |
|---|---|---|---|---|---|---|
| Cain [1] | 45 | 17.7 | 15.2 | 2.2 | 730 | Prototype (Aviemore dam) |
| 18.7 | 14.5 | 4.1 | 894 | |||
| STRAUB and LAMB [5] | 7.5–75 | 4–0 | 5.0–11.5 | 4.7–20 | 100–50 | Model |
| Chanson [31] | 4 | 3.2–5.3 | 5.5–9.9 | 1.1–1.3 | 81–109 | Model |
| Deng [32] | 13.5 | 3.5–6.35 | 4.6–8.4 | 2.1–3.8 | 97–178 | Model |
© 2018 by the author. Licensee MDPI, Basel, Switzerland. This article is an open access article distributed under the terms and conditions of the Creative Commons Attribution (CC BY) license (http://creativecommons.org/licenses/by/4.0/).
Share and Cite
MDPI and ACS Style
Bai, R.; Zhang, F.; Liu, S.; Wang, W. Experiments on Turbulence Intensity and Bubble Frequency in Self-Aerated Open Channel Flows. Water 2018, 10, 1201. https://doi.org/10.3390/w10091201
AMA Style
Bai R, Zhang F, Liu S, Wang W. Experiments on Turbulence Intensity and Bubble Frequency in Self-Aerated Open Channel Flows. Water. 2018; 10(9):1201. https://doi.org/10.3390/w10091201
Chicago/Turabian StyleBai, Ruidi, Faxing Zhang, Shanjun Liu, and Wei Wang. 2018. "Experiments on Turbulence Intensity and Bubble Frequency in Self-Aerated Open Channel Flows" Water 10, no. 9: 1201. https://doi.org/10.3390/w10091201
Note that from the first issue of 2016, this journal uses article numbers instead of page numbers. See further details here.