Improving Water Distribution Systems Robustness through Optimal Valve Installation


1
Research Center for Disaster Prevention Science and Technology, Korea University, Anamdong, Seongbukgu, Seoul 136713, Korea
2
Department of Civil Engineering, Keimyung University, 1095 Dalgubeoldae-ro, Dalseogu, Daegu 42601, Korea
3
School of Civil Engineering, Seoul National University of Science and Technology, 232 Gongneung-ro Nowongu, Seoul 01811, Korea
4
School of Civil, Environmental and Architectural Engineering, Korea University, Anamdong, Seongbukgu, Seoul 136713, Korea
*
Author to whom correspondence should be addressed.
Water 2018, 10(9), 1223; https://doi.org/10.3390/w10091223
Submission received: 2 August 2018
/
Revised: 30 August 2018
/
Accepted: 6 September 2018
/
Published: 11 September 2018
(This article belongs to the Special Issue Water Networks Management: New Perspectives)
Abstract
:This study proposes a framework for improving the robustness of water distribution systems using the optimal valve installation approach with regard to system reinforcement. To improve the robustness in valve design, this study introduces critical segment selection technique and optimal valve location determination within the concept of segment. Using the segment finding algorithm, the segment and the unintentional isolation can be identified. To select the critical segment, a multicriteria decision technique is applied by considering the hydraulic, social and economic effect. Finally, the optimal valve locations and the number of additional valves is determined by pipe failure analysis through the trade-off relationship with the number of additional valves and the maximum damage under pipe failure situations. To verify the proposed technique, the real-world water distribution systems are applied and compared with the original design.
1. Introduction
In the past, the methods for improving water distribution systems (WDSs) have focused on providing more consumers with a stable water supply. However, the importance of resilience, namely the ability to maintain a stable water supply capacity, has recently emerged, even under abnormal conditions (i.e., system failure due to the deterioration of the water supply network and rapid climate change). Bruneau et al. [1] introduced four elements associated with system resilience—robustness, redundancy, resourcefulness and rapidity (Table 1). Among these factors, robustness is the ability to maintain the required pressure during sudden changes in demand. Hashimoto et al. [2] presented indicators (i.e., reliability, resiliency and vulnerability) for evaluating the conditions of a water resource system. They anticipated that the indicators presented in their study would be useful in future water resource planning or management policies. They emphasized resilience as the degree to which the system can return to its previous normal conditions after its original function has been damaged by internal or external disturbance factors.
Lansey [3] proposed strategies to improve the four elements of resilience in a water distribution network. To improve robustness, the diameter of the pipe should be increased and an additional valve should be installed. To improve redundancy, double pipe and looped systems could be constructed. Rapidity can be improved by using algorithms to detect abnormal conditions and constructing an alternative water source and securing a recovery workforce could improve resourcefulness. Jung et al. [4] introduced a robustness-based WDSs design approach and confirmed that considering robustness improves system performance under uncertain failure conditions.
Increasing the pipe diameter or constructing additional valves can improve the robustness of WDSs. If an additional valve is installed at a suitable location, the customer can receive a more stable supply as the area where water would be shut off during the event of repairing a broken pipe or maintenance would be minimized. In this case, an area containing pipes and nodes that are isolated by closing valves is defined as a segment and the size of the segment is directly related to the range of damage that occurs during water blockages [5].
A segment can consist of only one pipe or node when there are two valves at the ends of the pipe or node. Otherwise, more neighboring valves would have to be closed to isolate a section containing broken components. In this case, the whole isolated section can be considered as a single segment. Considering the segment concept, the impact of component failure in a WDS can be estimated efficiently.
Goulter et al. [6] provided a detailed review of methods of analyzing the reliability of WDSs, including valve location analysis. Bouchart and Goulter [7] directly addressed the role of valves and provided relevant critical discussions. They observed that the demand nodes are not present in real WDSs and that the demand is continuously distributed along pipes. They presented a model for selecting a set of valve locations to minimize the demand volume deficit. They assumed that the volume deficit is only caused by a failed pipe and the impact on the rest of the network can be ignored. Therefore, to minimize the impact of the failure, valves should be placed with the shortest possible distance between them. Regarding the role of valves in WDSs, Hoff [8] addressed practical considerations related to valve maintenance, selection, storage and installation. Whittaker and Arscott [9] described the potential problems in valve identification, selection, operation, monitoring and record keeping. Skousen [10] provided a comprehensive reference for valve selection, type and sizing, and addressed the various problems associated with valves and costing. Jung et al. [11] investigated the correlation between a system availability measure quantified based on segment isolation and unmet segment demand identified considering adjacent valves and other reliability surrogate measures. Another method of using valves to improve the reliability of the WDSs is to minimize water loss by optimizing valve locations for controlling pressure [12,13].
Along these lines, Jun et al. [14] proposed an algorithm for searching the segment by considering the value of the whole system. Their segment search algorithm used three matrices for searching all segments by closing the valves. The first matrix is the node-arc matrix, which shows the relationship between the nodes and the pipe. The valve location matrix is defined using the location of the pipe. The final matrix computes the difference between two matrices and is defined as a valve deficiency matrix.
These previous studies were carried out to quantify these damages when component failures of the WDSs caused problems in normal system operation. In other words, these studies have focused on minimizing hydraulic damage by including optimal valve locations in the WDSs design process. However, the failure of WDSs causes not only hydraulic damages but also social and economic problems. Therefore, to effectively manage future water supply systems, the focus must be changed from considering only the hydraulic factor as in the past to including social and economic factors.
Therefore, this study proposes a framework for effective segment division by installing additional valves at appropriate positions for ensuring system reinforcement. To find all the segments, valve location information is used and the importance of segments is calculated considering the hydraulic, social and economic factors that can directly or indirectly indicate the degree of damage based on the segment. To calculate the segment priority, the weighted utopian approach is applied to consider multiple criteria. Finally, the optimal valve locations and the number of additional valves are determined. To determine valve locations, the candidate group is set based on the experience of the engineer, from among all the valve installable locations. In the installable location candidates, additional valves are installed and the performance is evaluated. The number of additional valves is determined simultaneously with the selection of the valve locations. To determine the number of valves, the trade-off relationship with the number of additional valves and the maximum damage under pipe failure situations is checked and the number of appropriate valves is determined by the number of marginal valves.
2. Development of Robustness-Based Optimal Valve Installation Model
Three methodologies were considered to improve WDSs robustness through optimal valve installation: (1) the segment finding algorithm, (2) the critical segment selection technique and (3) the determination of valve locations.
The segment finding algorithm can identify the segment as well as unintentional isolation. To replace the previous technique used for selecting the segments to be divided, a multicriteria decision technique that considers hydraulic, social and socio-economic criteria is used to evaluate the critical segment selection technique. In this chapter, a new valve location determination technique to ensure reinforcement, that could replace an engineer’s experience when deciding an additional valve installation location to improve the segment’s robustness, is proposed. This technique analyzes pipe and valve failures to determine the optimal valve location.
2.1. Valve Location Determination to Improve System Robustness
Regionalizing the WDSs while considering the segment concept is a core approach for constructing robust WDSs and efficient management. Therefore, more efficient and robust construction techniques are needed than the approach that uses engineers’ experience to optimize the segmentation of the WDSs.
This study proposes a framework of the optimal valve installation approach for robust water distribution network segmentation. This technique uses basic valve location information to identify all segments of the WDSs and organize pipe and node lists included within them. The importance of each segment is then quantified considering hydraulic, social and socio-economic factors and the weight of each factor is then calculated. The priority of the segment is determined by the weighted utopian approach, applying various system factors with different weights. Finally, the optimal valve position is determined considering the probability pipe and valve failure. The procedure can be detailed as follows.
Step 1: Data collection
Data that can quantify the segment’s importance (EPANET input file, location of the valve, demand data, location of important facilities, the number of water users, the type of residence) are collected.
Step 2: Segment identification
The segments in the whole WDSs are identified using the segment identification algorithm and the nodes, pipes and valves in each segment are listed.
Step 3: Weight calculation
The weights of each factor are calculated using the data collected in step 1 (data that quantify the attributes for multicriteria decision-making) and the expected damage of each segment during system failure is quantified.
Step 4: Prioritization of each segment
The weighted utopian approach is applied to determine segment priority and the highest priority segment to be divided is selected. In this case, each factor’s weight, which was calculated in step 3, is applied to each segment.
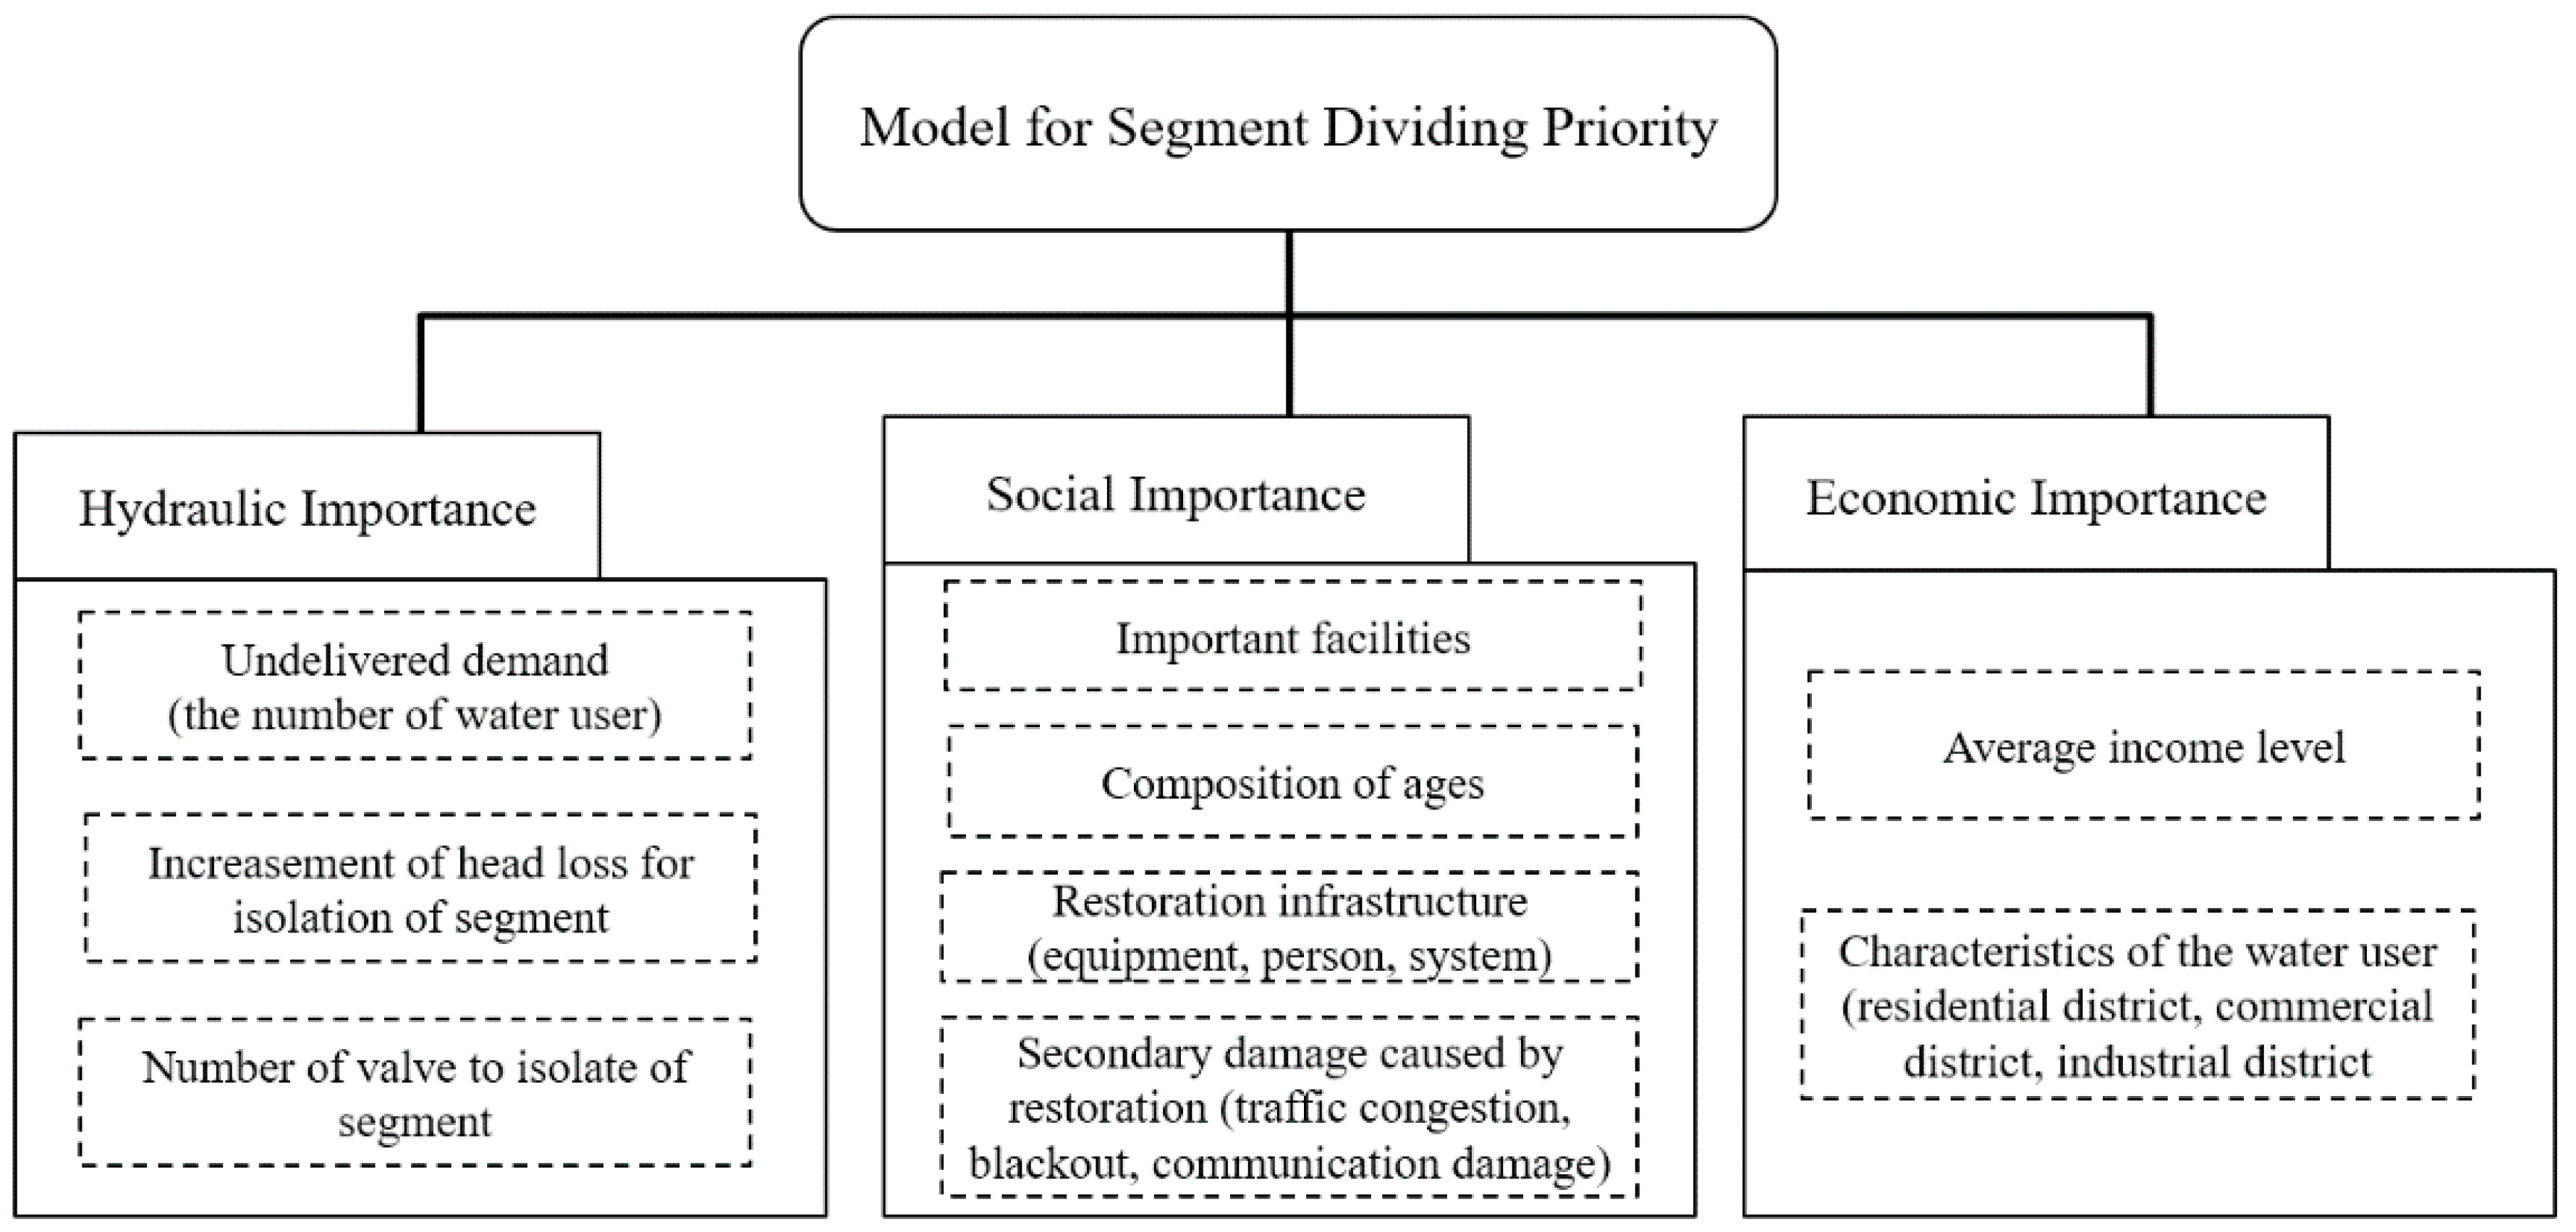
Figure 1 shows a model for determining segment priority for division. The model regards factors related to segment importance as (1) hydraulic, (2) social and (3) socio-economic importance. Before determining the weights of each factor in the model, a questionnaire survey analysis is conducted to evaluate the relative importance and the targets are experts in the WDSs field.
(1) Hydraulic importance: The WDSs are complex and interacts with various hydraulic components, such as pipes, nodes, valves and sources. It can determine priority according to the properties of the hydraulic components within the segment. In this model, three criteria are considered: undelivered demand (the number of water users), increasing head loss to isolate the segment and the number of valves required to isolate the segment.
(2) Social importance: The WDSs are inseparable from social activities and social importance factors, such as important facilities including government offices and medical facilities, composition of ages, restoration infrastructure (equipment, workforce, system) and secondary damage caused by restoration (traffic congestion, blackout, communication damage) can be criteria for judging importance.
(3) Socio-economic importance: Economic activity is closely related to water supply. In this model, we consider two factors, the average income level and the characteristics of the water user (residential, commercial and industrial districts as criteria for determining the economic importance of the segment).
Step 5: Search for optimal valve location
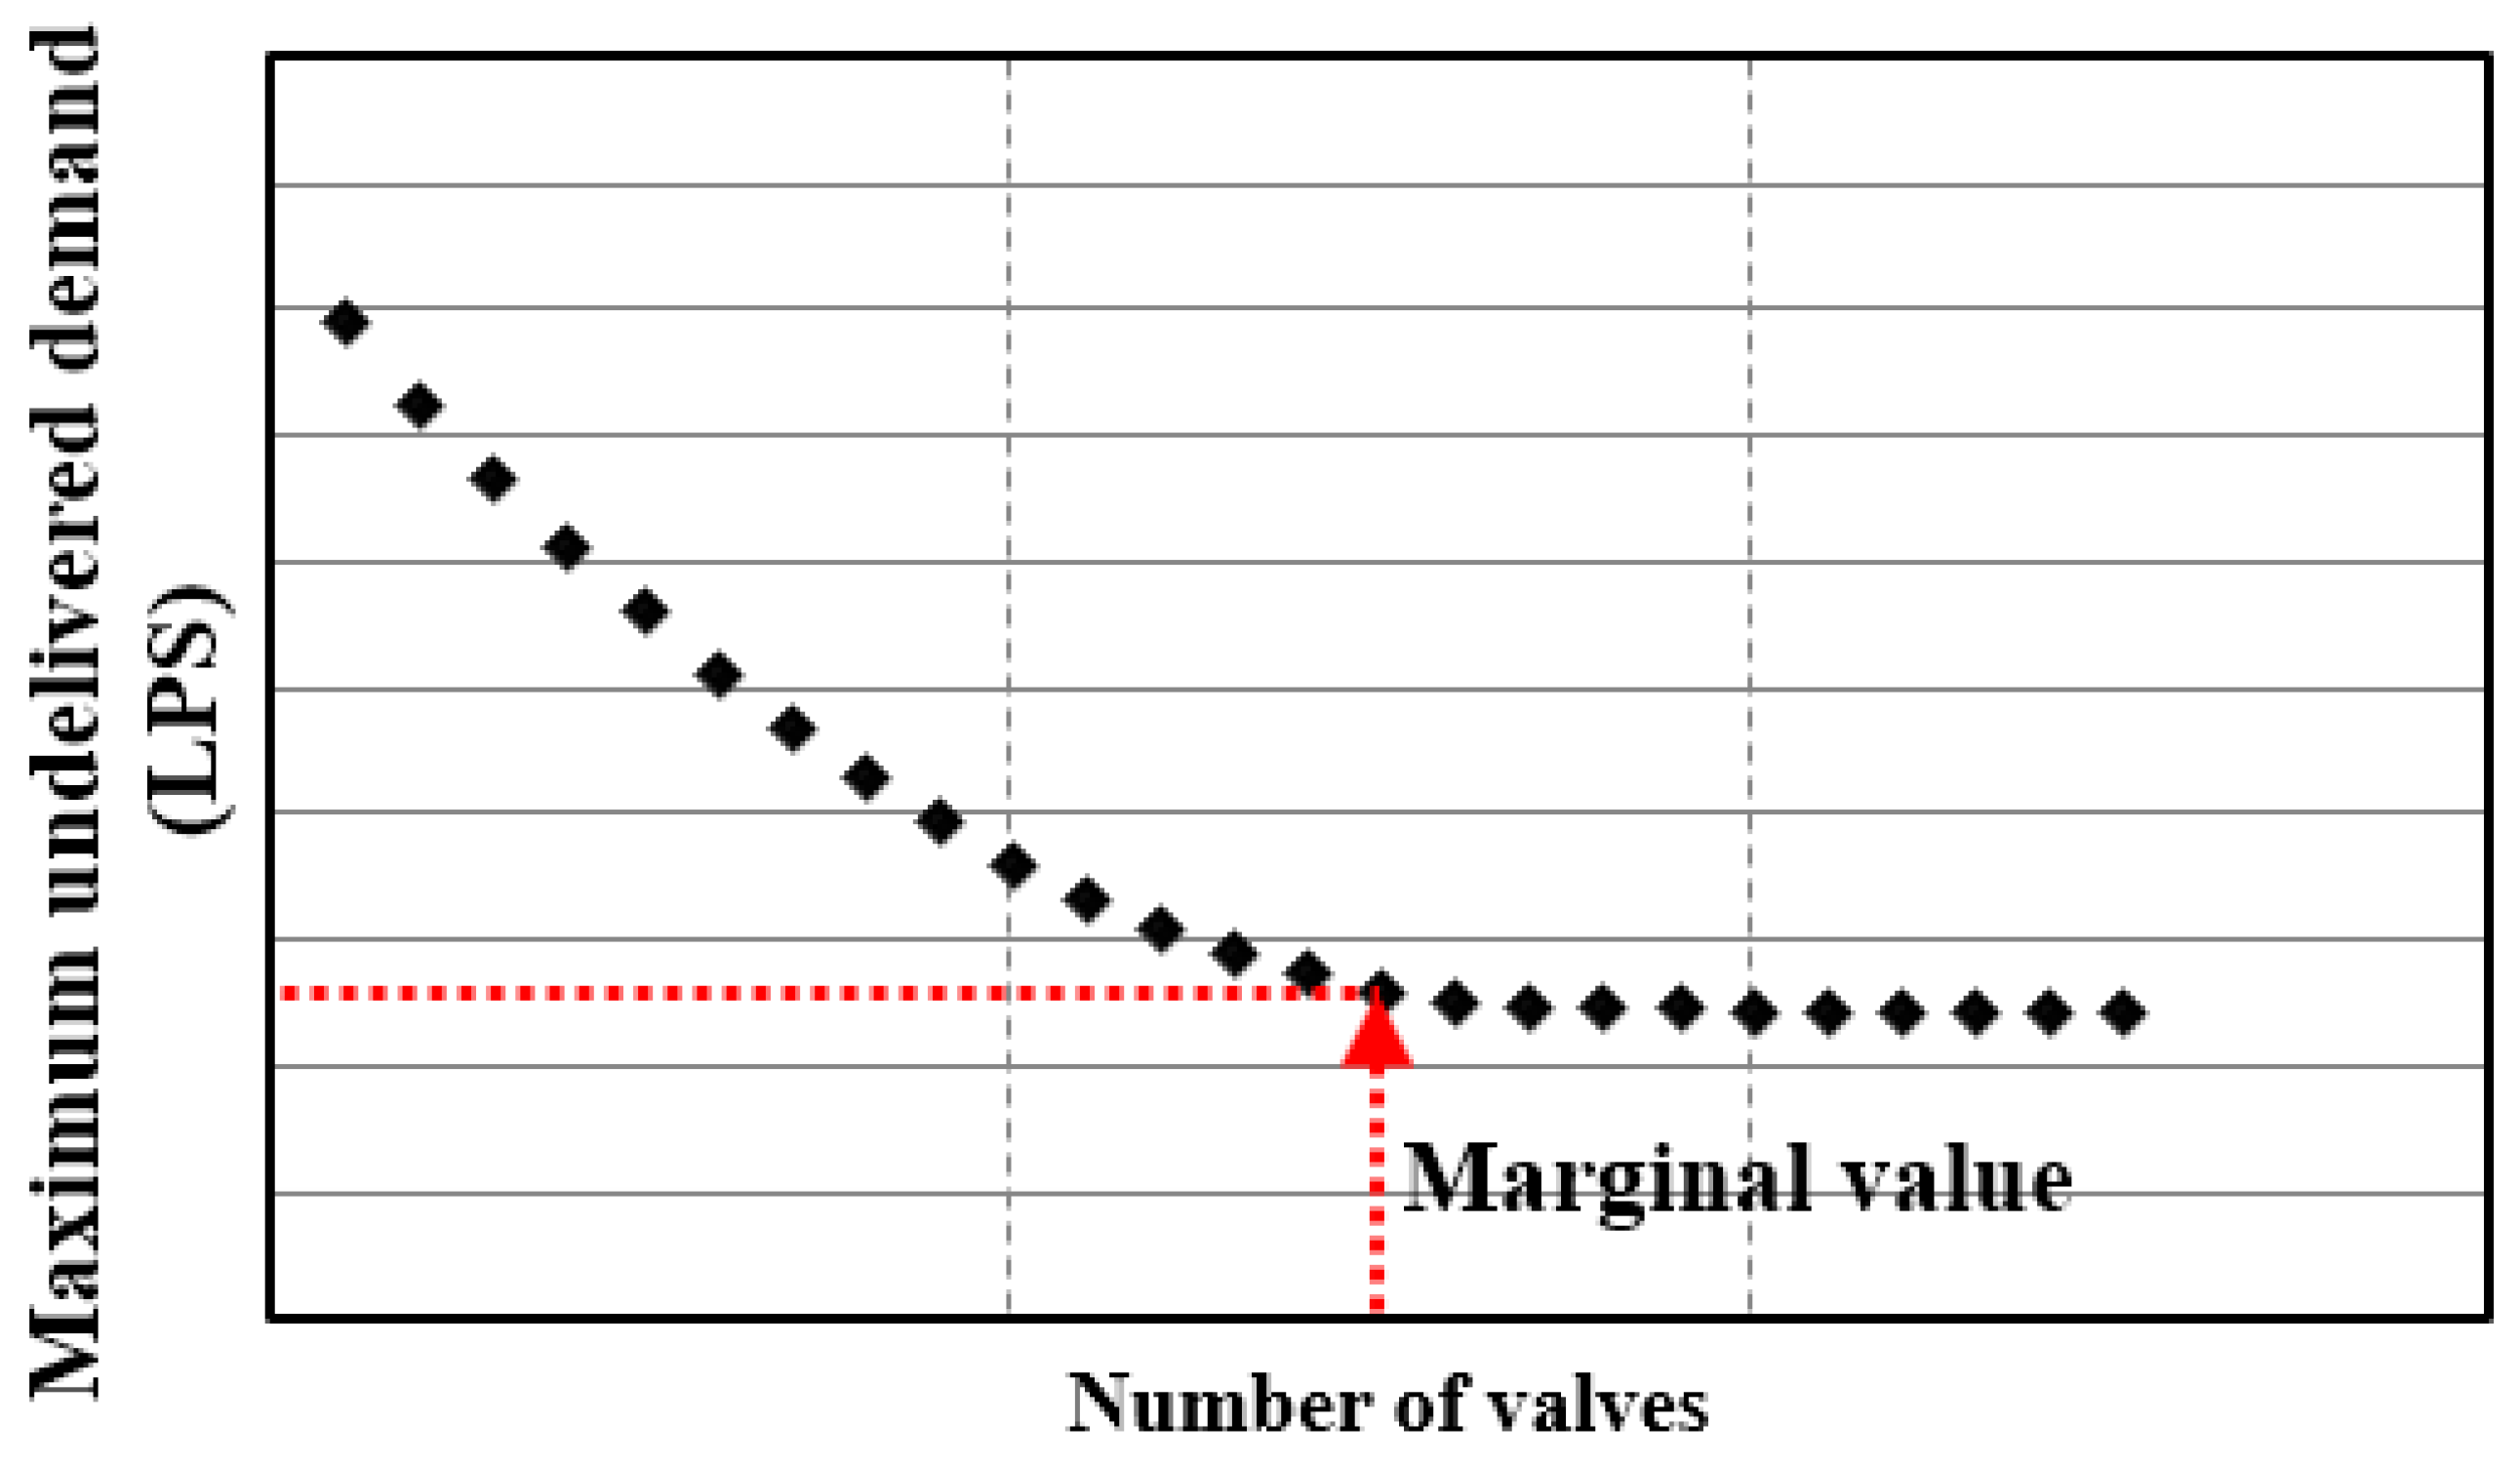
Finally, the optimal valve locations and the number of additional valves are determined. This process starts with the highest priority segment identified in Step 4. The candidate valve locations are set based on engineering knowledge from among all potential locations. In the installable location candidates, the additional valve is installed and the performance of the segmented segments (i.e., the number of water user, undelivered demand) is evaluated. The number of additional valves is determined simultaneously with the selection of the valve locations. First, the relationship between the number of additional valves and the maximum damage under pipe failure situations is determined as shown in Figure 2. Then, the proper number of additional valves is determined from a marginal effect analysis using Figure 2 that yield optimal efficiency with additional valve installation. The determined number of valves can increase or decrease depending on the additional requirements of the decision maker.
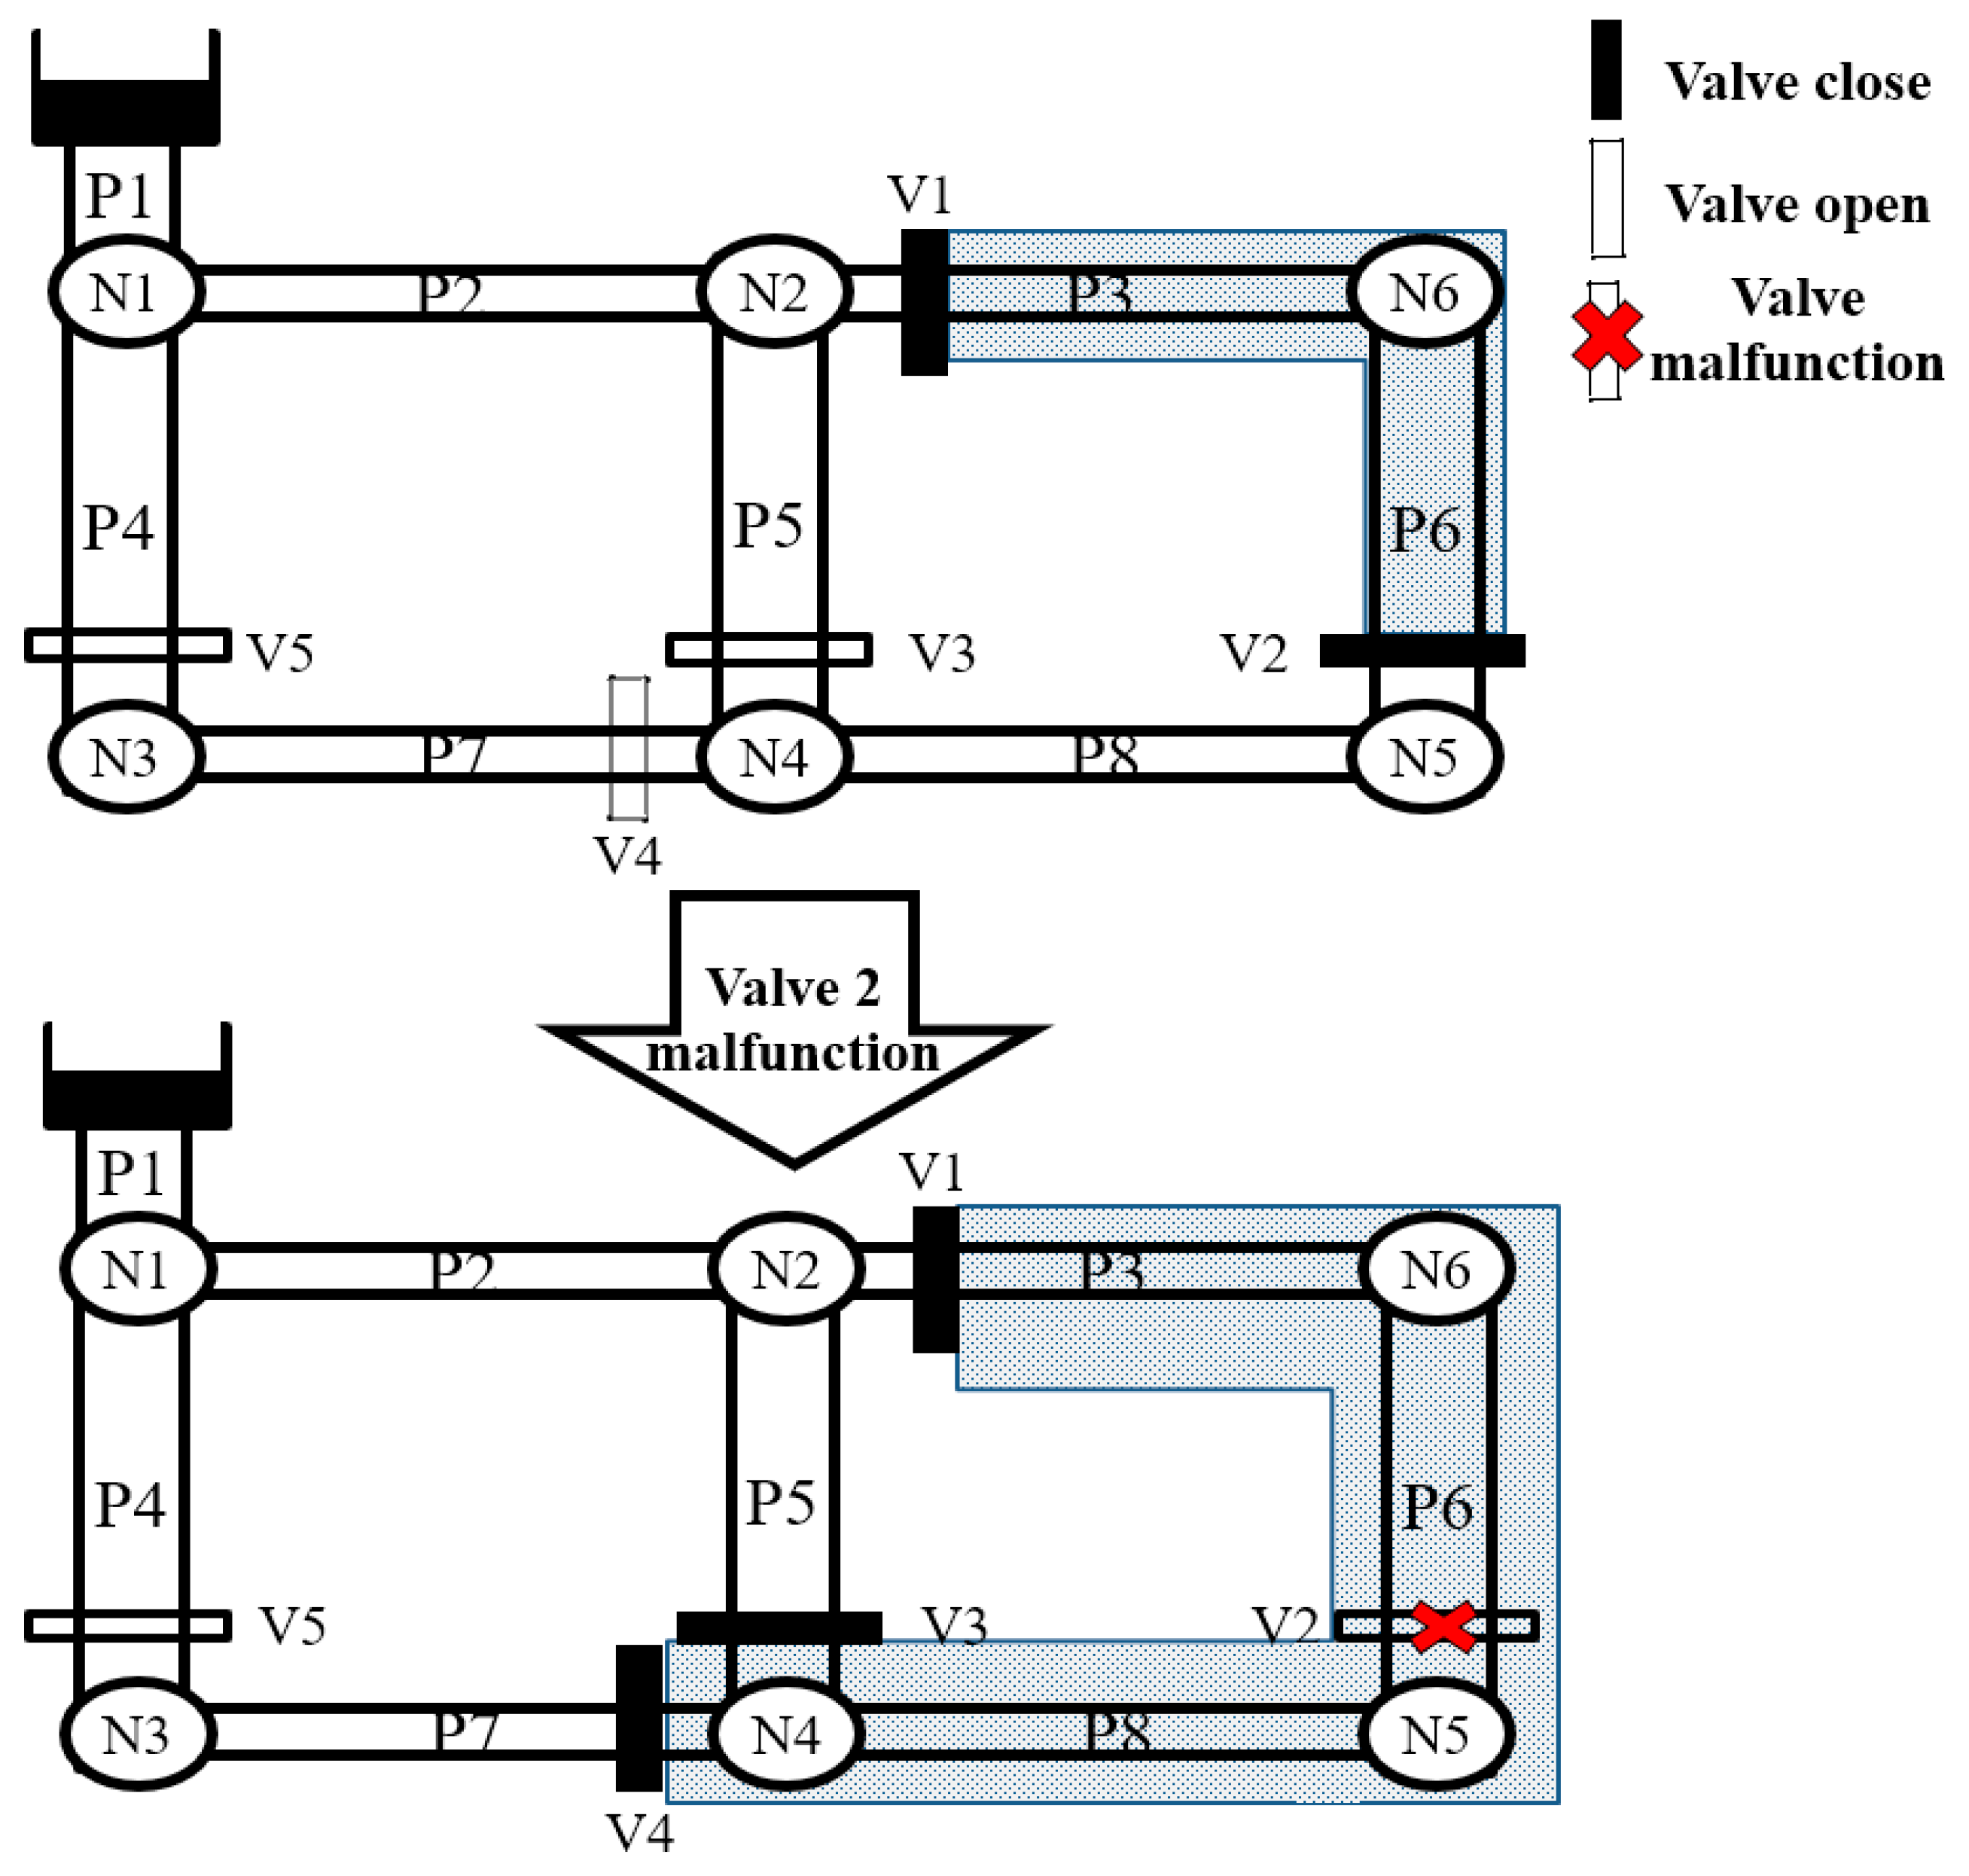
To evaluate the efficiency of the additional valve, Monte Carlo simulation is conducted considering the valve operation success ratio and pipe failure analysis. The valve operation ratio indicates the probability that a valve operates successfully when the valve is closed due to pipe failure. At that time, if a valve fails and cannot be closed, the segment will be expanded up to the neighboring valves successfully closed. For example, if pipe 6 fails, valves 1 and 2 are closed to isolate pipe 3, pipe 6 and node 6. However, if valve 2 malfunctions as indicated in Figure 3, the segment is expanded to cover pipe 3, pipe 6, pipe 8, node 4, node 5 and node 6, increasing the undelivered demand. Therefore, the valve operating rate is considered in this chapter because this factor can be used to evaluate reasonably the damage in the present WDSs.
2.2. Segment Identification Algorithm
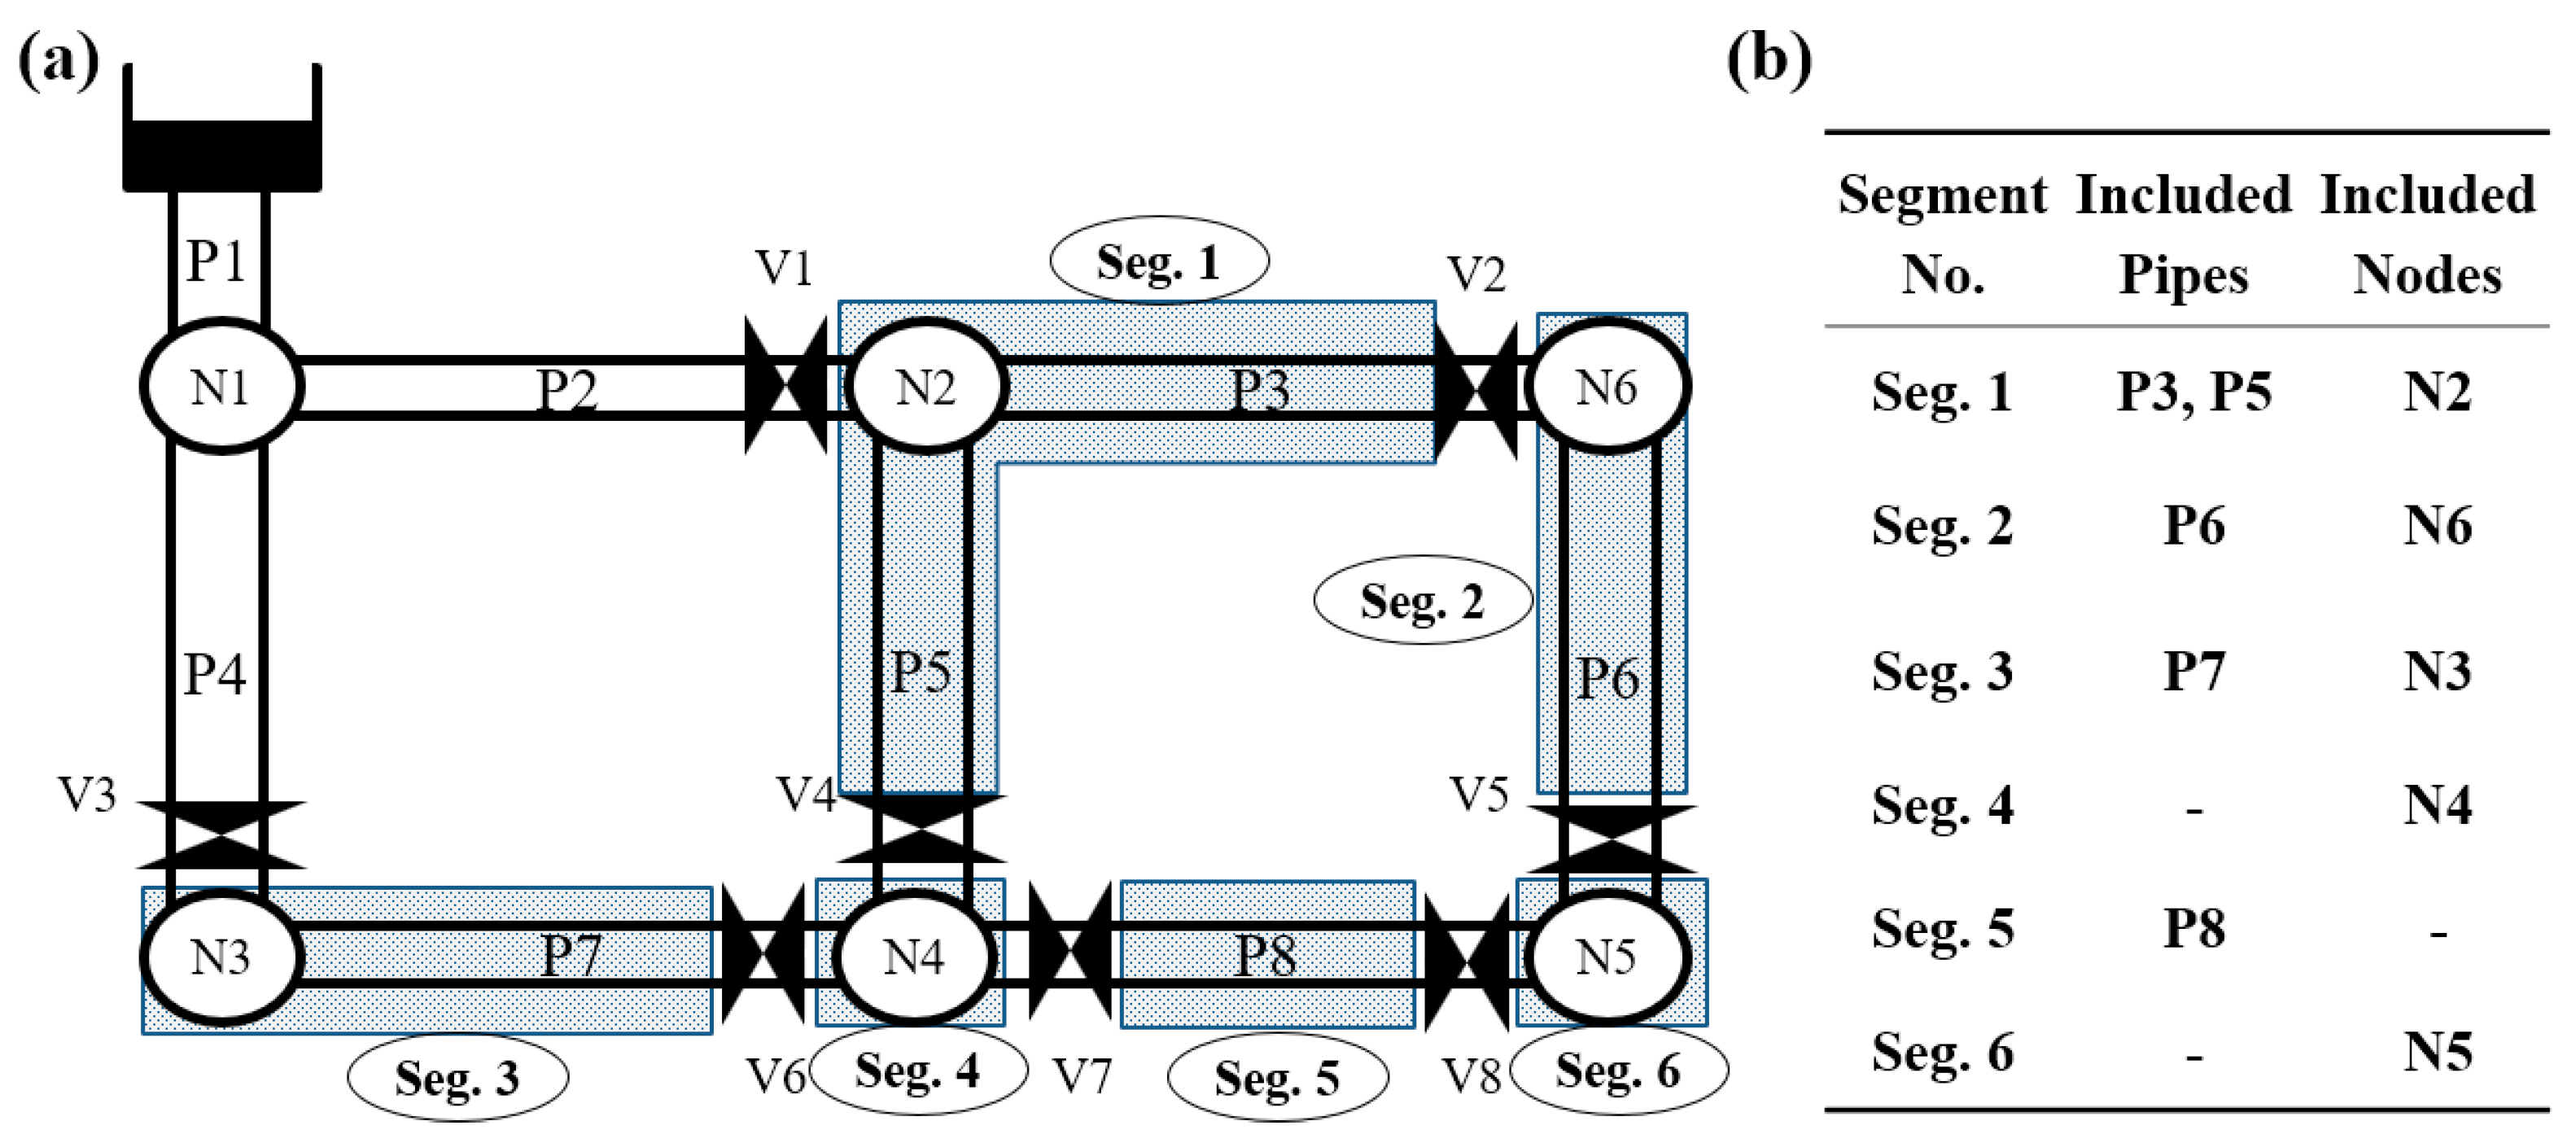
The segment finding algorithm was developed by Jun et al. [14] and introduced three matrices (i.e., the node-arc, valve location and valve deficiency matrices) to identify a segment based on valve location in WDSs. These three matrices have the same configuration, in which a row represents a node and a column represents a pipe. Figure 4 presents an example of segment identification.
Node-Arc matrix
The node-arc matrix shows the relationship between the nodes and pipes that constitute the WDSs. If there are nodes corresponding to both ends of the pipe, the value is 1; if not, the value is 0. Table 2(a) is an example of a node-arc matrix.
Valve Location Matrix
The valve location matrix indicates the position of the drain valve. If the valve is located at one end nodes of the pipe, the value is 1; if not, the value is 0. Table 2(b) is an example of a valve location matrix.
Valve Deficiency Matrix
The valve deficiency matrix is composed of the difference between the node-arc and valve location matrices and indicates points with and without installed valves. A matrix value of “1” indicates that no valve is installed at that point, while “0” indicates that there is a valve. An example of a valve deficiency matrix is presented in Table 2(c). The segment finding algorithm is based on the valve deficiency matrix and repeats row and column searches to identify all the segments of the WDSs. To understand the segment search process, the following is an explanation of the identification process of Seg. 1. First, a column search is performed on P3 in the matrix to find “1.” At this time, a value of “1” is found at point (N2, P3). A row search is then performed on N2 to find “1.” As a result of the row search, “1” is found at P5. As P5 is found on the N2 row, rather than P3, a column search is performed for P5. After the column search, “1” is not found in row P5; therefore, the search process is finished. The segment identification then shows that N2 is within Seg. 1 after the column search and P3 and P5 are included in Seg. 1 as a result of the row search. Therefore, Seg. 1 is composed of P3, P5 and N2. The segment can be found based on the pipe in a similar manner. If all columns and rows in the valve deficiency matrix are “0”, the pipe or node can be identified as an independent segment.
As a follow-up to the segment search algorithm, Jun et al. [14] proposed an optimal segment design technique for WDSs. This technique automated segment and unintentional isolation identification; it can be applied to large-scale WDSs and suggests an efficient method of segmenting one that is over-designed. However, when selecting segments to be divided, only the population is considered and the optimal valve location is selected based on the experience of the engineer, not by a mathematical algorithm.
Therefore, this study proposes a new criterion for evaluating segment importance, as well as the number of water users and a multicriteria decision technique is used to prioritize segments that should be divided.
Multicriteria decision techniques can determine the priorities of the segments that need to be divided and a new valve location determination technique is proposed that could replace the engineer’s experience when the additional valve installation location for the highest priority segment is decided.
2.3. Critical Segment Selection Technique
In the existing optimal valve location determination technique, only the number of water users is considered when selecting the segment to be divided. This makes the selection process more efficient. Moreover, the selection of the valve location for optimal segmentation is based on the experience of the engineer, rather than a quantitative approach using a mathematical algorithm.
However, as WDSs performance and behavior is closely related to social and economic activities, the segments to be reinforced should be selected considering various criteria, including social and economic aspects as well as hydraulic.
Therefore, in this section, the segment to be divided by installing more valves is determined considering several criteria, including social, socio-economic and hydraulic factors, using multicriteria decision-making techniques. The multicriteria decision-making model applied in this study is the weighted utopian approach [15] that combines a weighting method and multi-criteria decision-making.
2.3.1. Weighted Utopian Approach
Decision problems are prioritized according to comparisons between alternatives (i.e., the diversity of alternatives, the evaluation criteria of the decision maker, or the objective of the decision) and the best alternative is then selected. When considering various decision factors, most cases have a trade-off relationship. Therefore, a compromise need to be presented that meets both conflicting standards.
When making decisions, the weight of each factor cannot be the same and the most important factor in decision-making is the method by which the weight that represents the relative importance among those factors is determined. However, the utopian approach proposed by Xanthopulos et al. [16] assumed that the weight of each factor is the same; therefore, it cannot reflect realistic decision-making and risks the production of results different from reality. To overcome the limitations of the existing utopian approach, Yoo et al. [15] proposed a weighted utopian approach that combines weight determination techniques with the utopian approach. As the weighted utopian approach can simultaneously consider various weighting methods, it can not only identify a reasonable alternative but also allow flexible coping by broadening the choice of alternatives according to the situation.
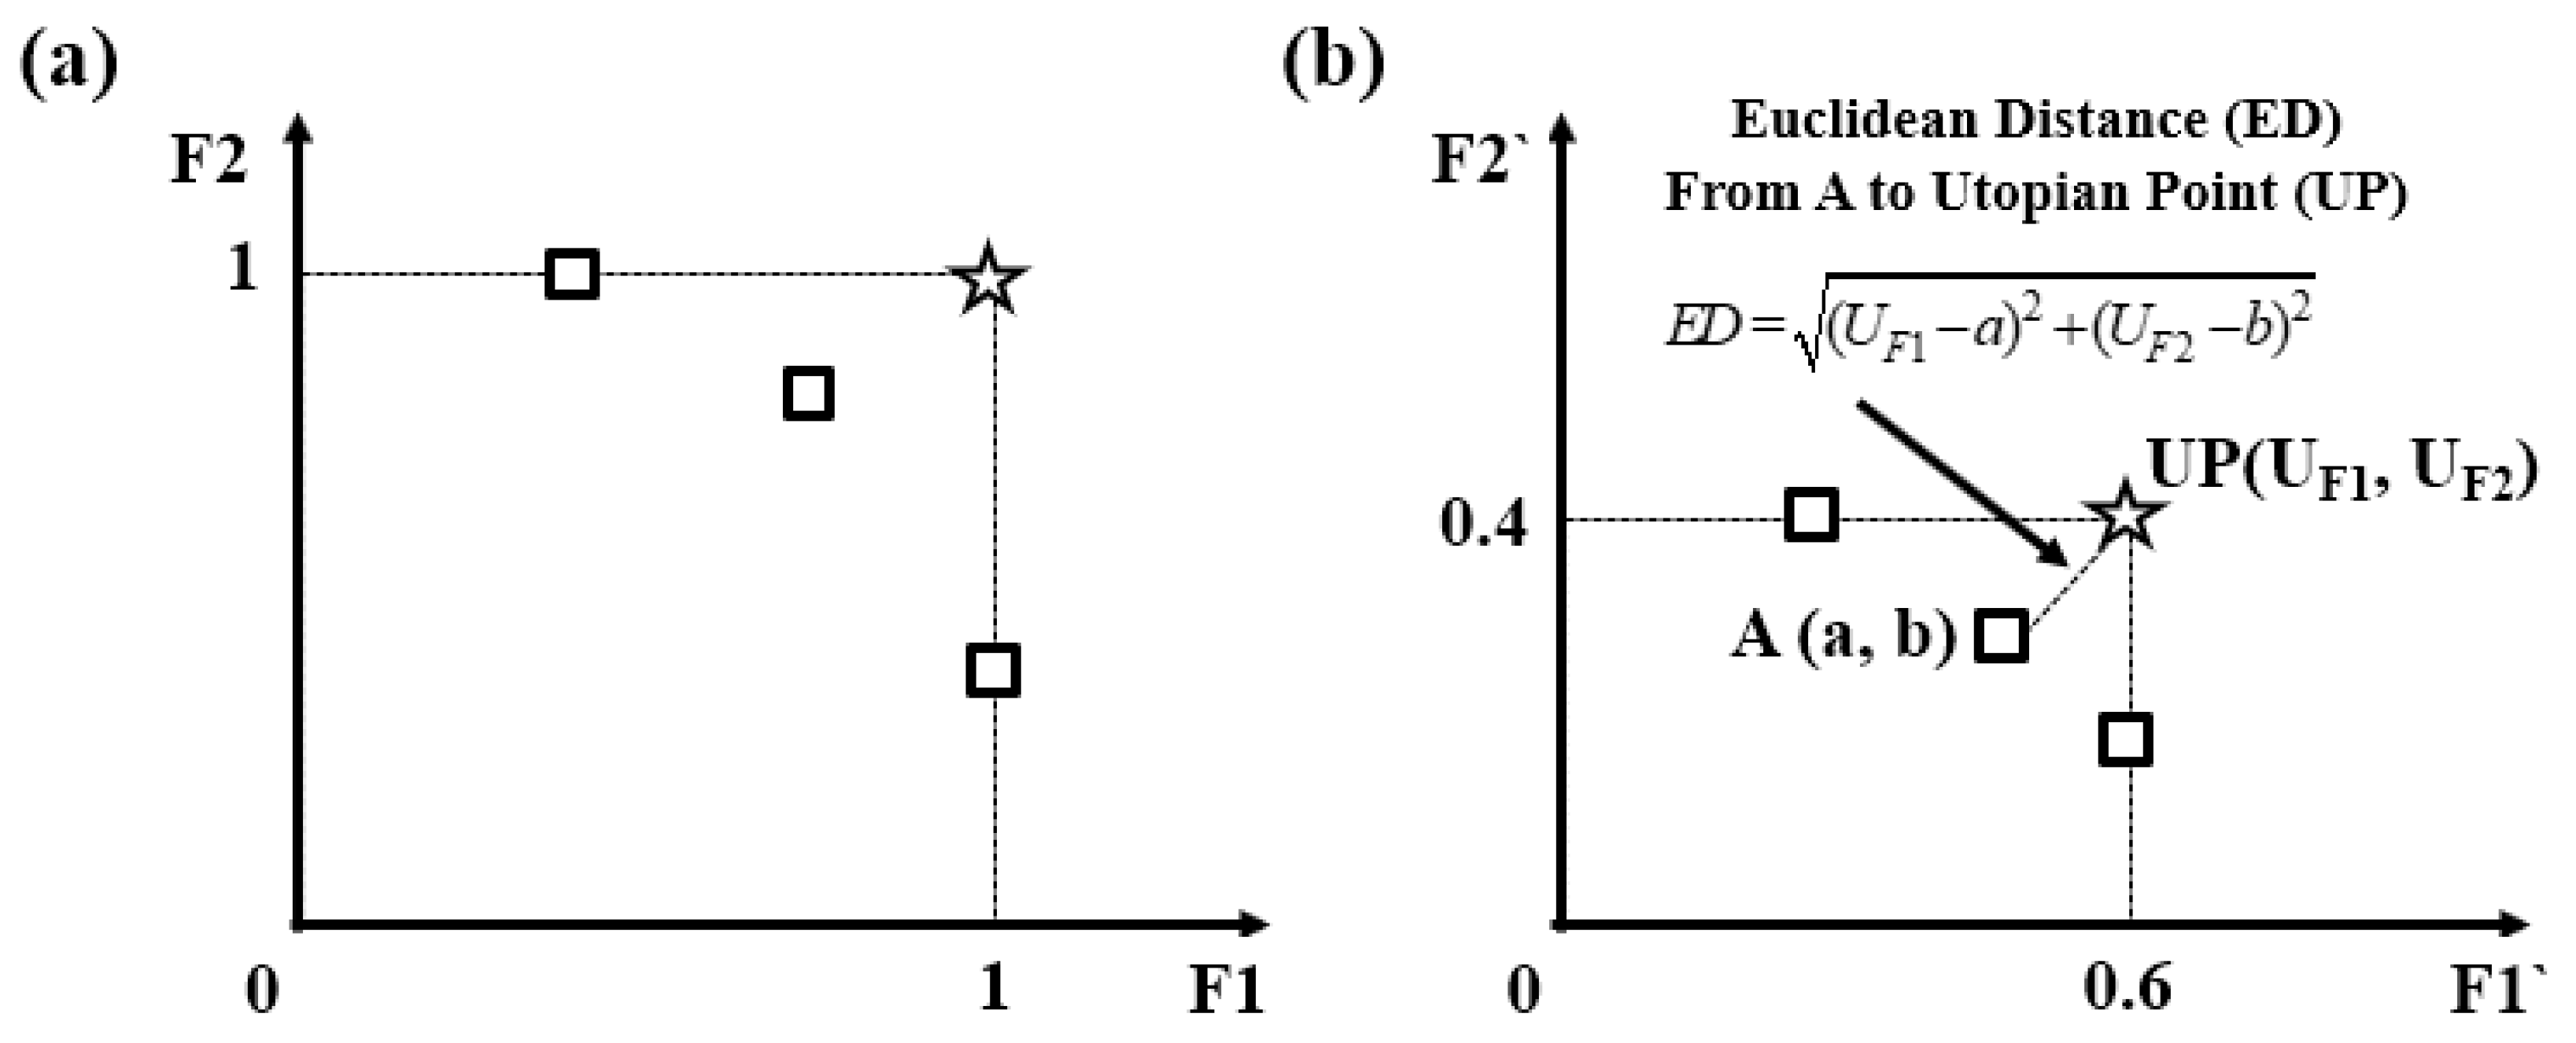
If there are two factors (F1 and F2) used for decision-making, the alternative factor can be expressed as Figure 5a by normalizing the two factors to values between 0 and 1. In this case, the weight of each factor has the same value and the coordinate of the utopian point is (1, 1). However, after calculating the weights of F1 and F2 following various weighting determination approaches, the weighted coordinate is that shown in Figure 5b. For example, when the weights of F1 and F2 are 0.6 and 0.4, respectively, the coordinates of the utopian point are (0.6, 0.4). The Euclidean distance is commonly used to determine the distance between a utopian point and an alternative and the formula to calculate it is shown in Figure 5b. The priority of the alternatives is determined in the order of the shortest Euclidean distance.
2.3.2. Determination Weight Factor Approaches
The most important task in decision-making and prioritization is the determination of each factor’s weight, which represents the relative importance of different factors.
3. Applications and Results
3.1. Study Networks
This study proposes a framework for improving WDSs robustness: Optimal valve installation. To optimally install a valve, the priority segment to be divided is determined using the weighted utopian approach that considers the weights of each factor considered in the multicriteria decision techniques. A new valve location is then determined considering pipe failure analysis and the valve operation success ratio.
To verify the proposed technique, a well-known benchmark (i.e., the Pescara network) and real-world water distribution networks (i.e., the G-city network) are studied.
Pescara network
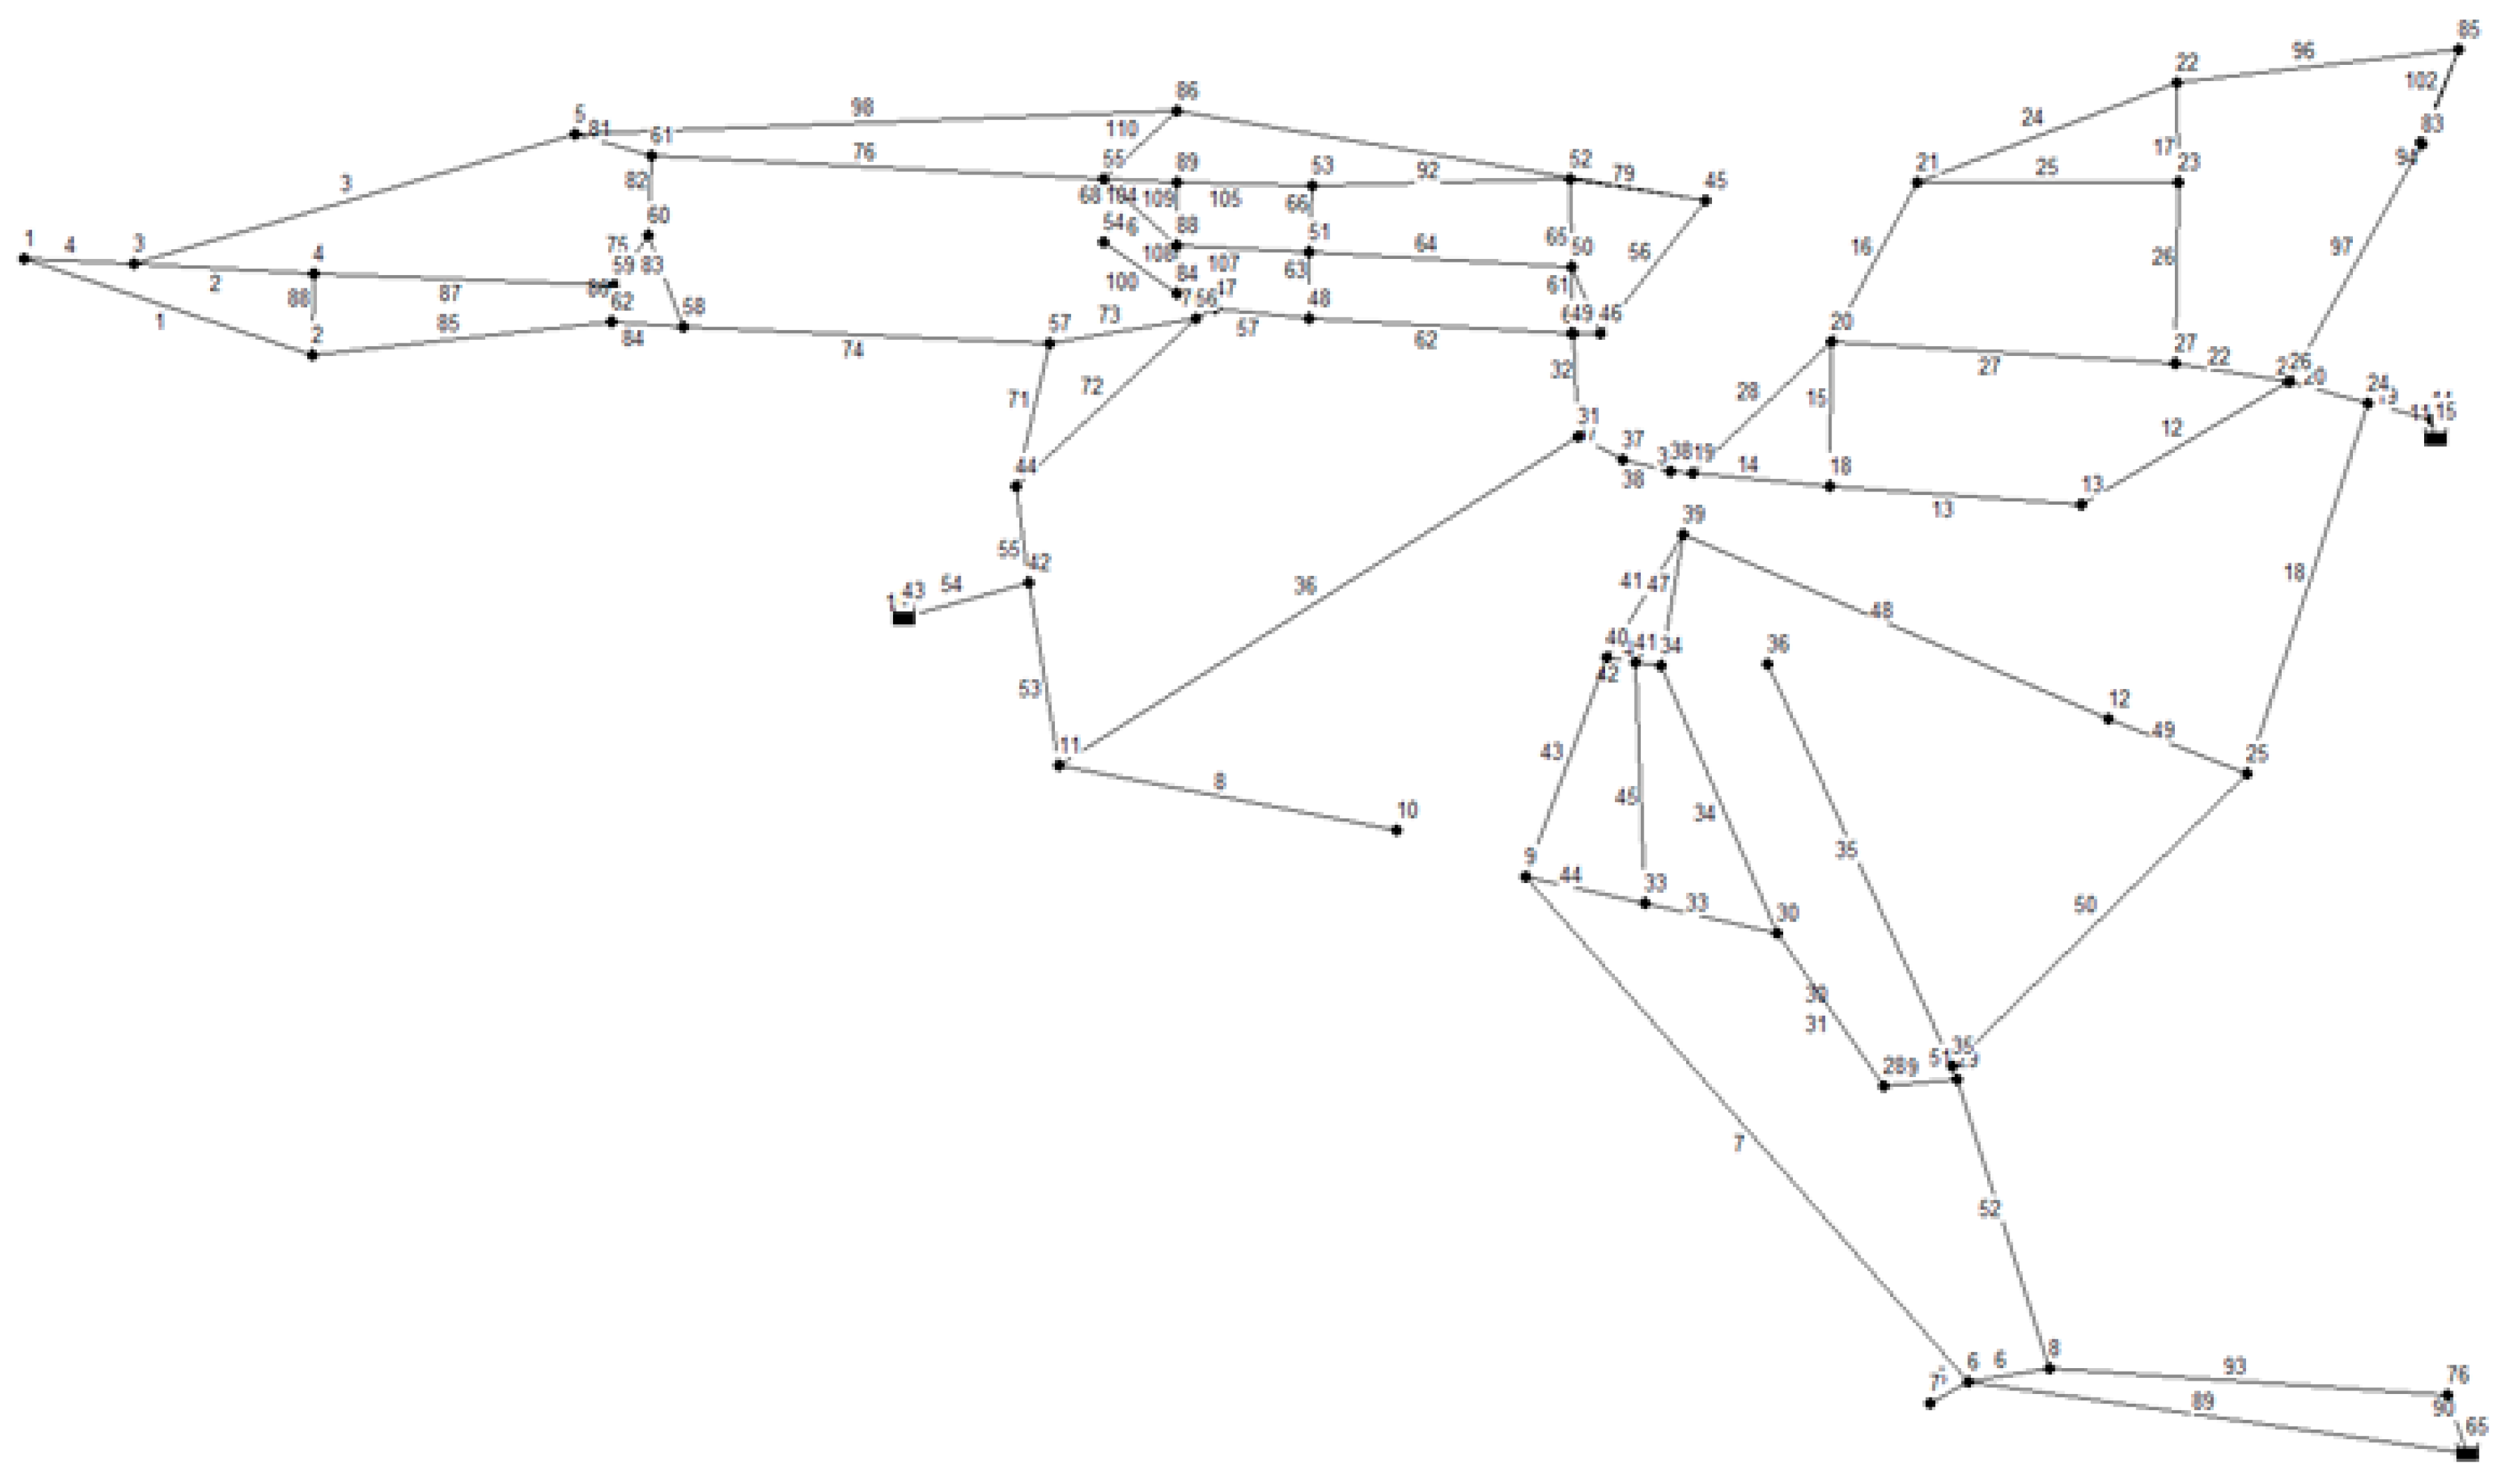
The Pescara Network was first proposed by Bragalli et al. [20]. This network consists of three reservoirs, 99 pipes, 71 nodes and 498.28 (LPS) total system demand. The network is reconstructed to apply the optimal valve installation technique proposed in this study by randomly arranging 67 valves and socially important facilities. The Pescara network’s layout is shown in Figure 6.
G-city network
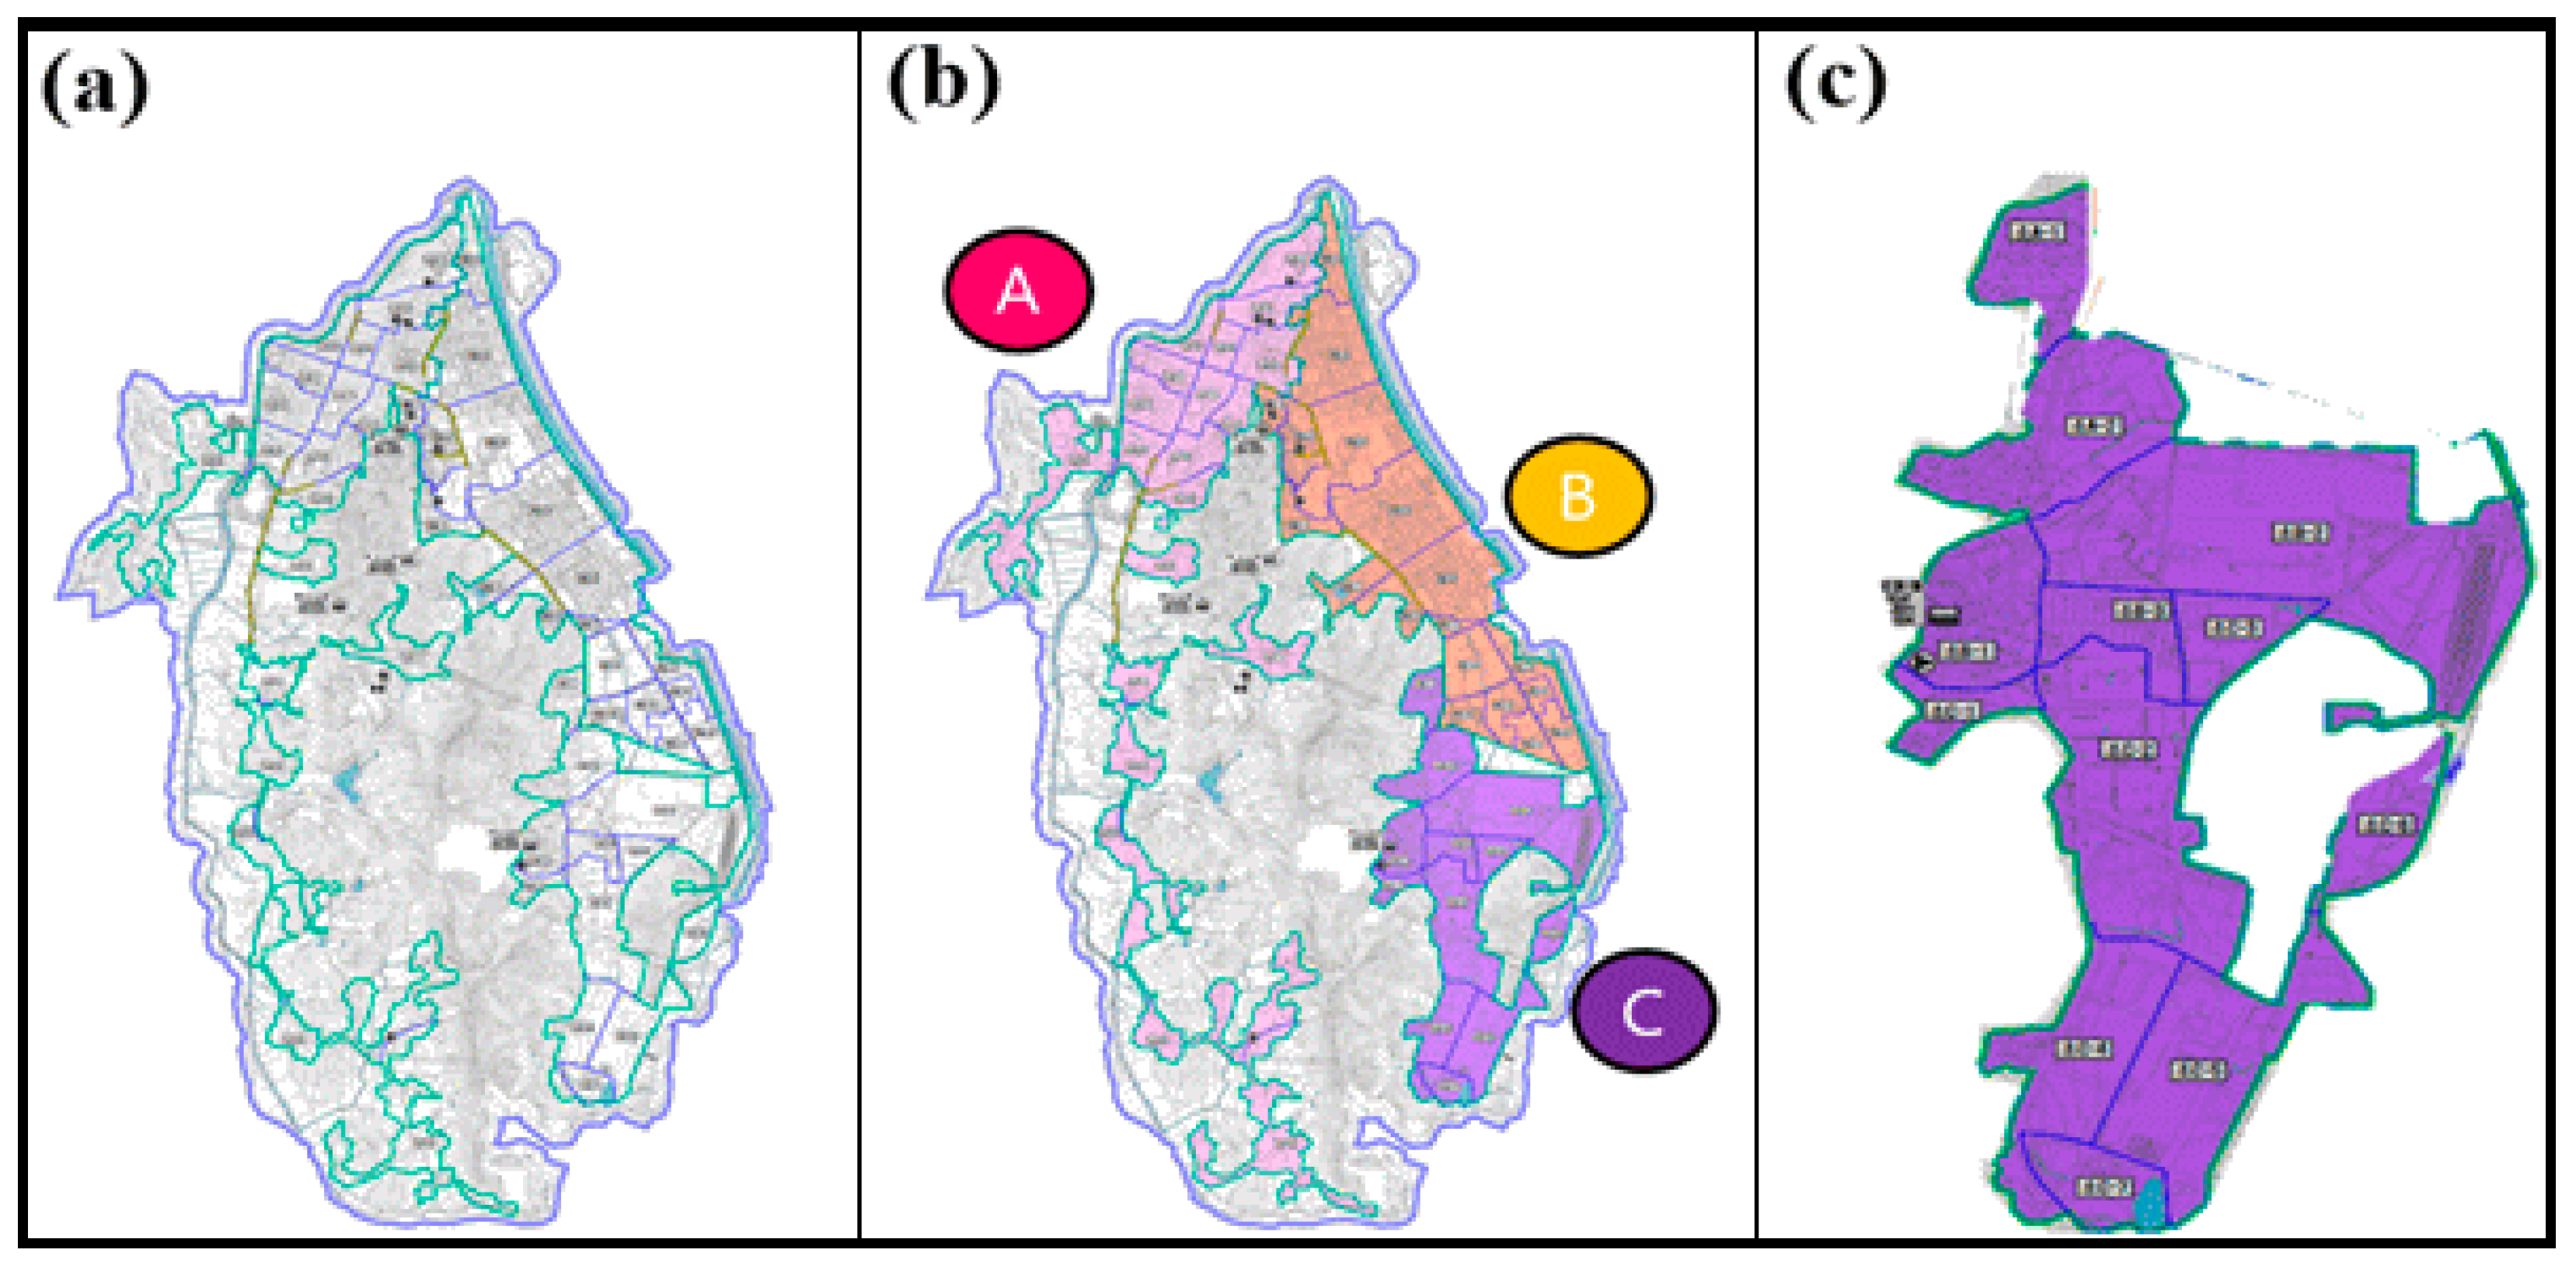
The G-city network consists of three blocks. As shown in Figure 7, A block mostly consists of housing, some apartments and a commercial district and most of the water supplied to this block is obtained from the Noon Reservoir. B block mostly contains apartments and commercial districts centering on the Haan/Chulsan Reservoir, and C block consists of housing, apartments and commercial and industrial districts supplied by the Soha Reservoir.
The proposed technique to enhance the robustness of the WDSs in this study is applied to C block to assess the technique’s application to various water use types. As shown in Figure 7c, C block consists of one reservoir, 648 pipes with a total length of 69,494.3 m and 511 nodes. Total system demand is 14,097.96 CMD and each pipe is installed from 11 commercial pipe sizes available (80, 100, 150, 200, 250, 300, 400, 500, 600, 800, 1000 mm). This block has approximately 46,900 water supply users and 531 valves. The valve construction cost is calculated using the construction costs of the WDSs function (Clark et al., [21]) as following Equation (1). The construction costs function accounts for the pipe material and installation in Table 4.
where y = the valve construction cost ($); x = the pipe diameter in inches (1 in. = 2.54 cm); and a, b and c are component specific parameter values estimated using regression analyses.
3.2. Benchmark Network: Pescara Network
First, the segment is identified based on valve location, pipe and node information. A valve deficiency matrix was generated by calculating the difference between the node-arc matrix that represents the relationship between the pipe and the node and the valve location matrix that represents the location of the valve.
Based on the three matrices, the segment identification algorithm was applied and the results are presented in Table 5. The whole network was divided into 35 segments based on randomly installed 67 valves.
After segment identification, the priority of the segments was determined using the multicriteria decision-making model to improve the robustness of the existing WDSs (i.e., the weighted utopian approach). The result of calculating weights are presented in Table 5. Using this approach, the priority of the segments that need to be divided are determined the undelivered demand and the number of important facility and Table 6 shows the priority factors (i.e., the undelivered demand and the number of important facility) in each segment.
As the weight of each criterion differs according to the approach, four approaches were used for the calculations and the final weight factor of each criterion is an average value. The final segment division priority is shown in the final column of Table 7. As the weighting approaches were different, excellence cannot be judged but the sensitivity of the weighting must be considered.
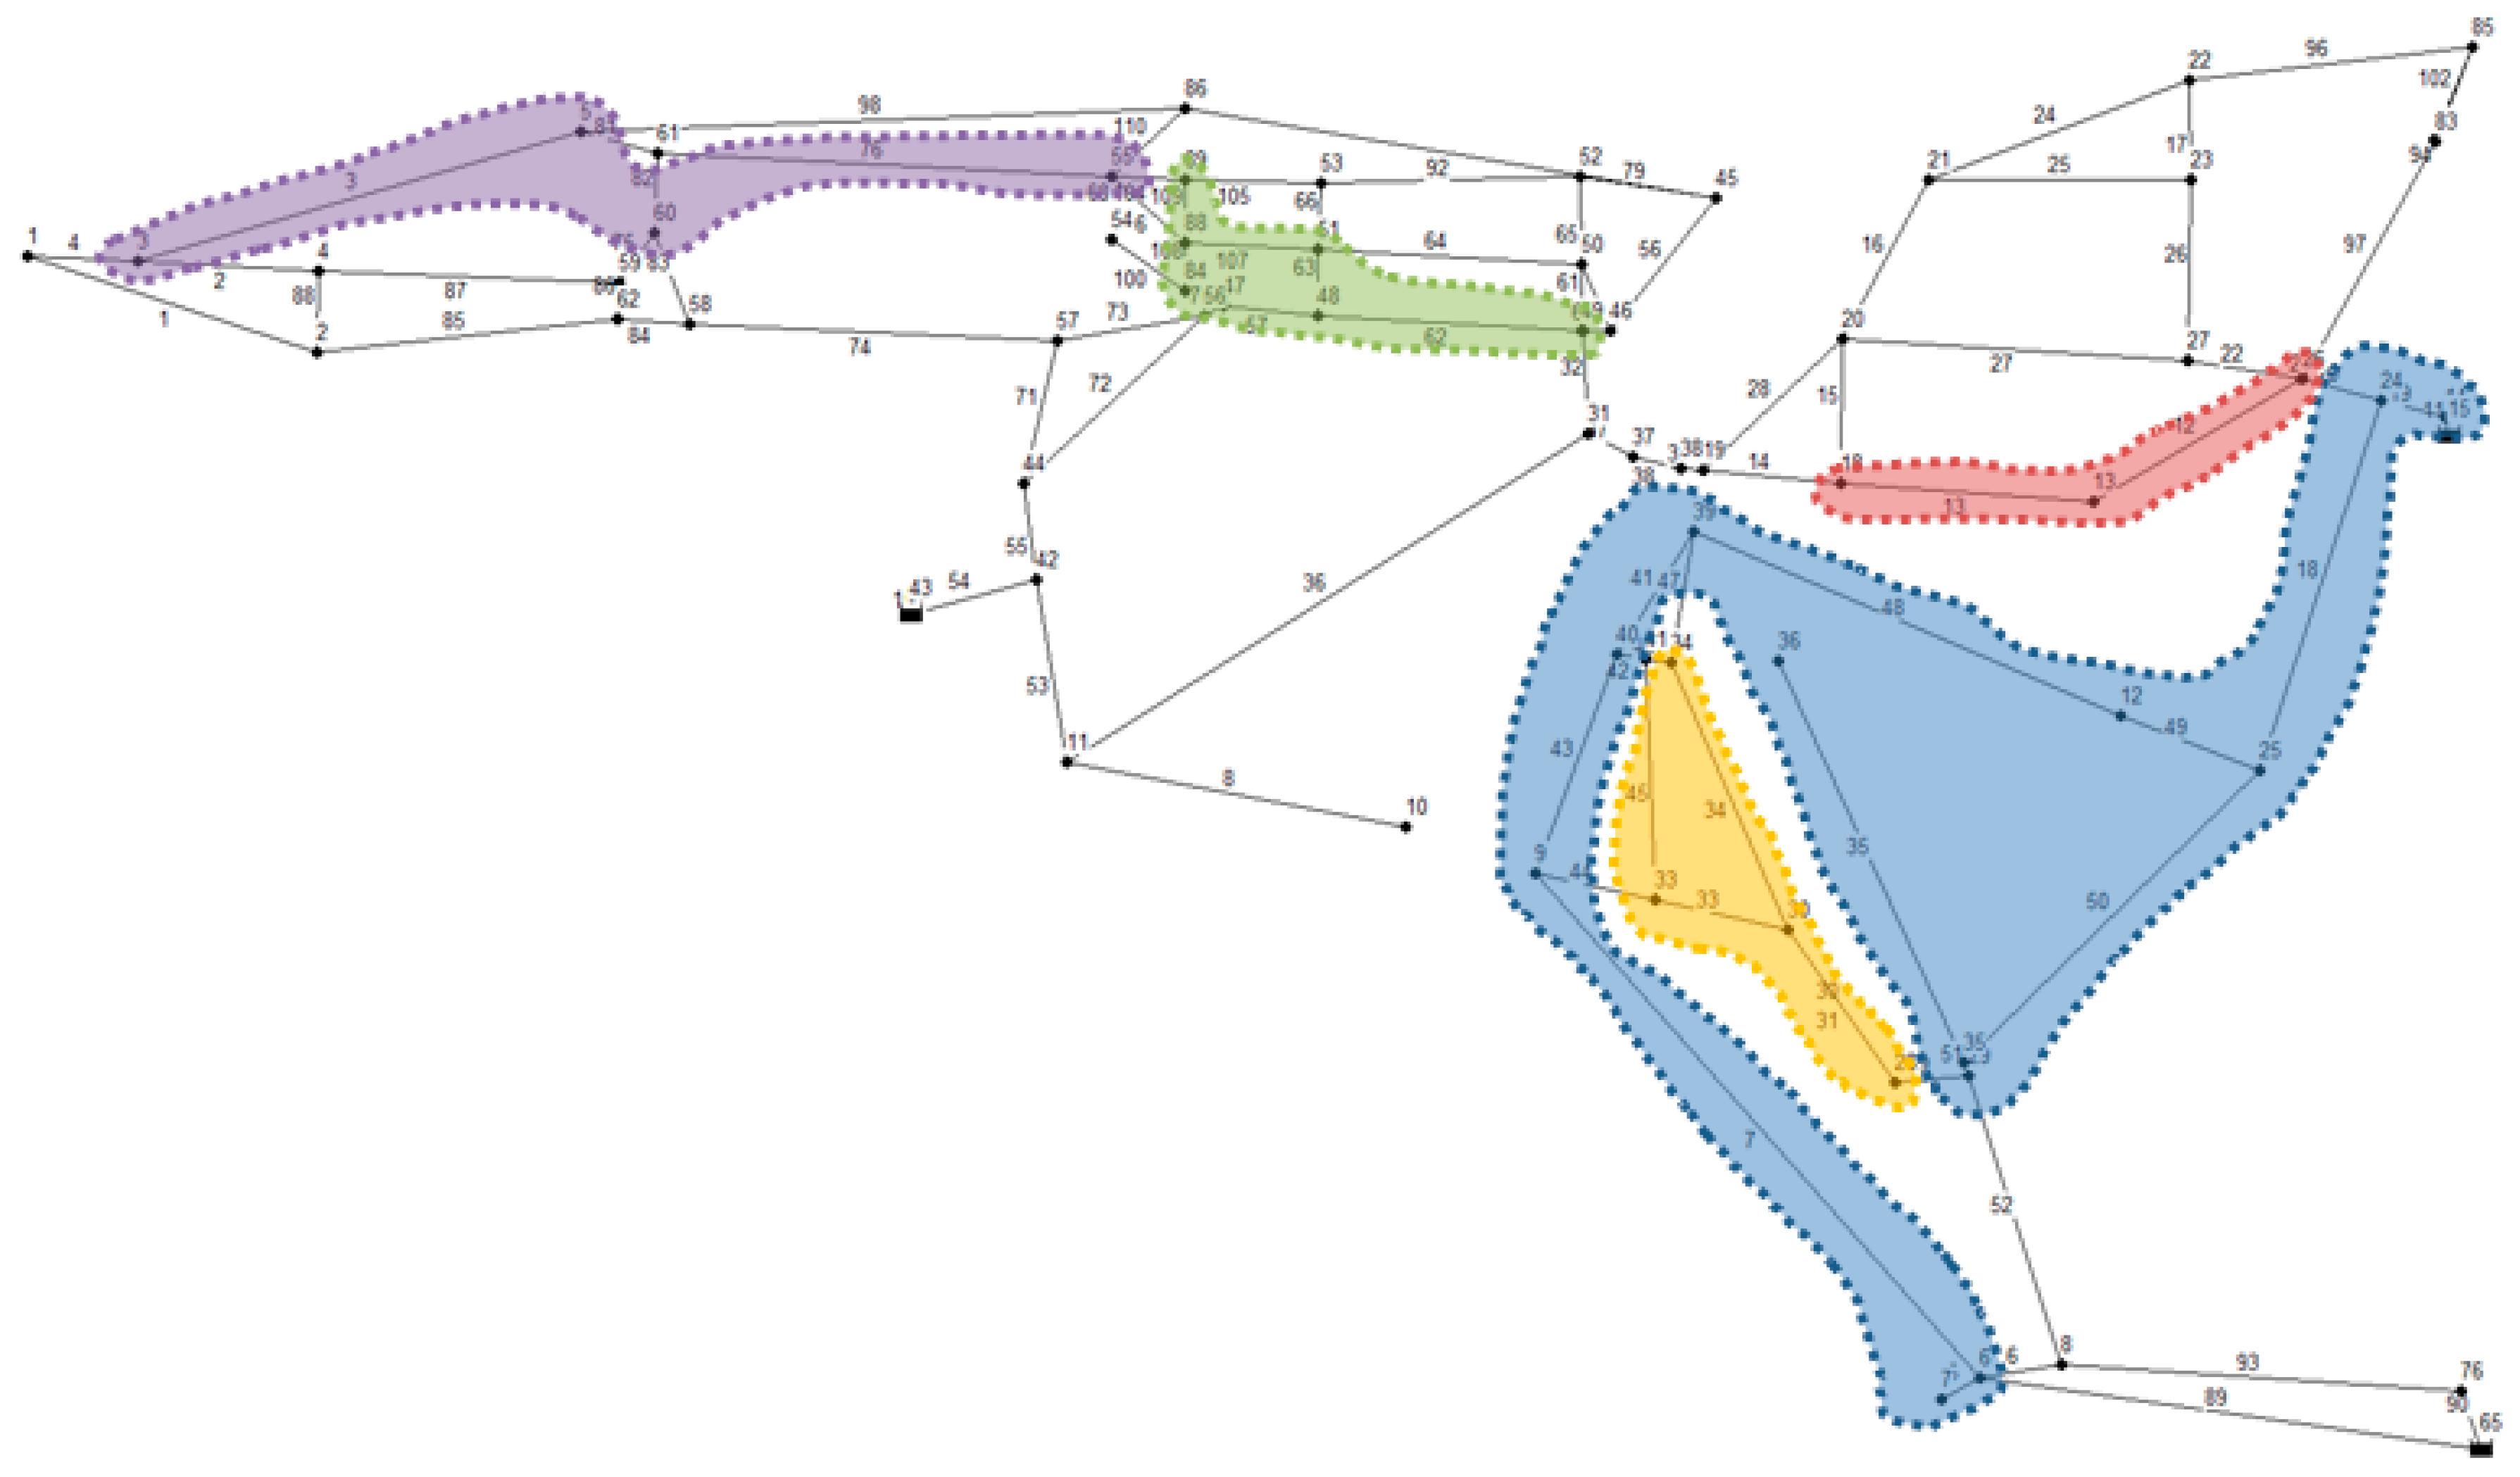
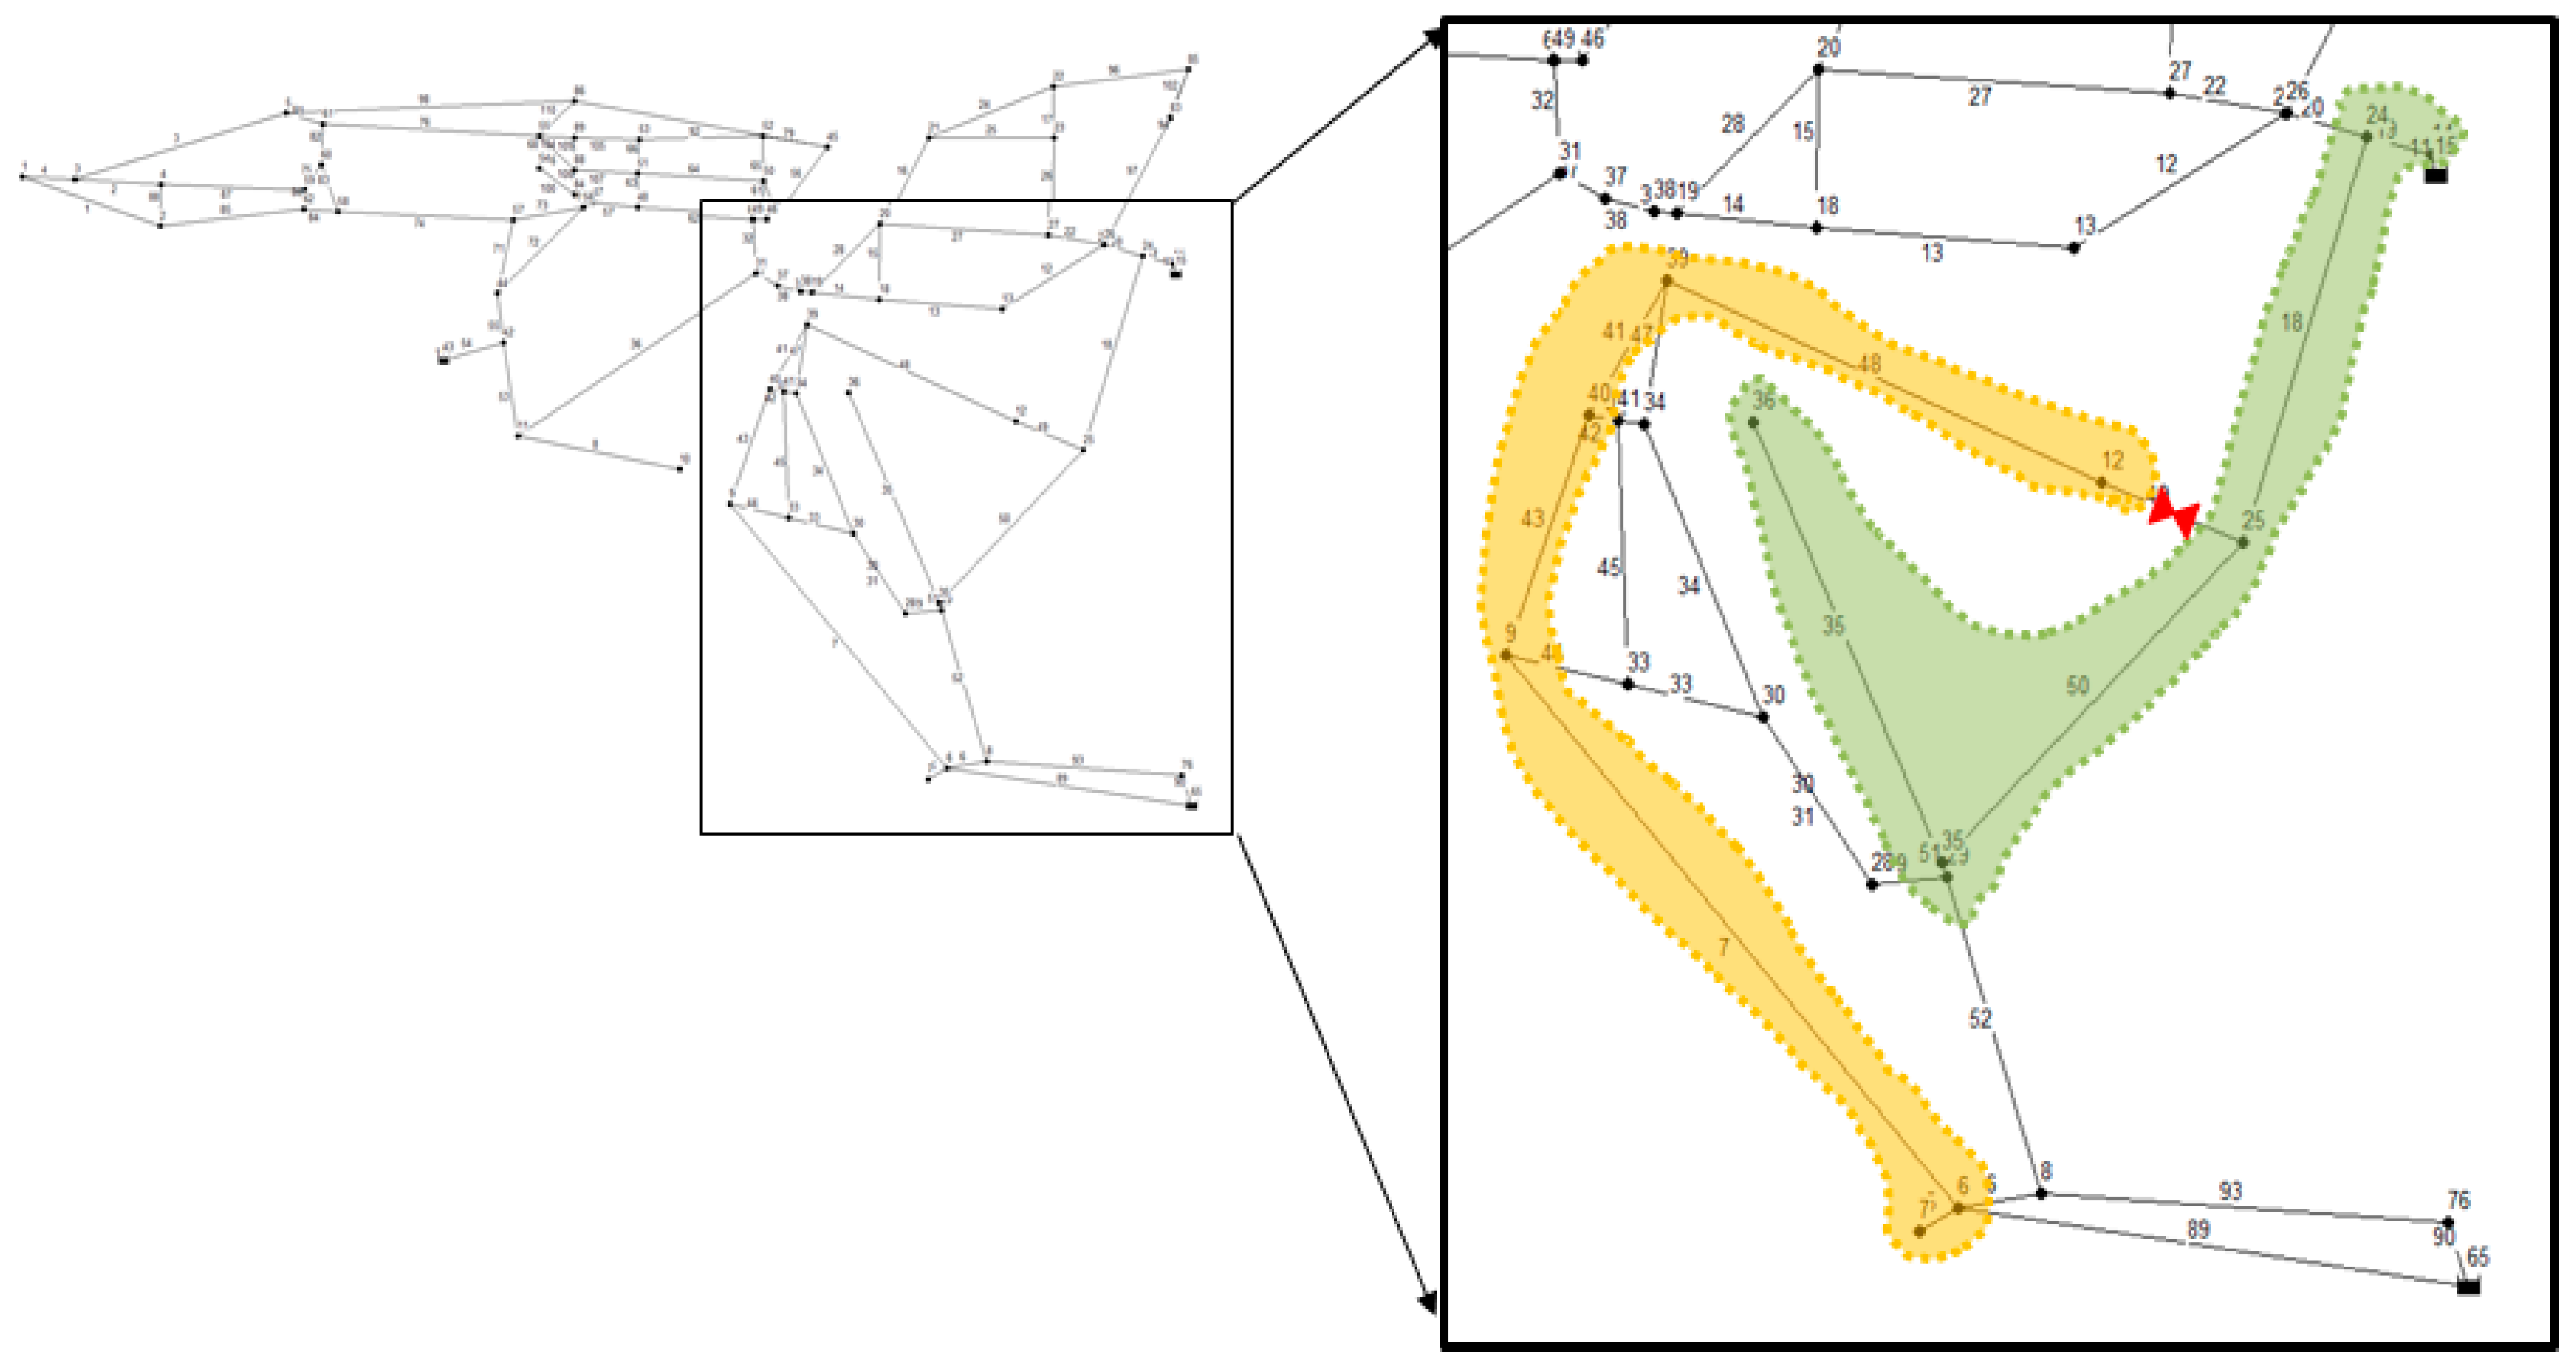
Based on the calculated segment division priority in Table 7, segment 10 ranks first. The location of segment 10 corresponds to the blue shaded area in Figure 8. It contains 12 nodes and 16 pipes. The undelivered demand for segment 10 is 91.19 LPS and this segment could cause the greatest damage among all segments if one pipe fails.
To minimize undelivered demand, segment 10 is divided into two segments if one valve is installed in the direction of node 12 of pipe 49, as shown in Figure 9. As a result, the maximum undelivered demand decreased from 91.19 to 72.1 LPS and the length-weighted average undelivered demand decreased from 35.88 to 26.11 LPS.
Similarly, one valve was installed to the five segments with the highest division priority and each segment was divided into two. The 35 segments were divided into 40 by the addition of five new valves and this segment division simultaneously decreased damage. Table 8 shows the optimal valve installation for dividing the top five segments.
From Table 9, we can confirm that with the optimal valve location approach, the damage caused by WDSs failure can be significantly mitigated even though supplemental source is not added by the efficient installation of the valve to find the critical segment causing serious damage in the pipe failure.
3.3. Real-World Network: G-City Network
The robustness improvement technique proposed in this study was verified by applying it to the previous benchmark WDSs. This chapter evaluates the influence of the optimal valve installation technology for segment division by applying it to a real-world network (i.e., G-city Network).
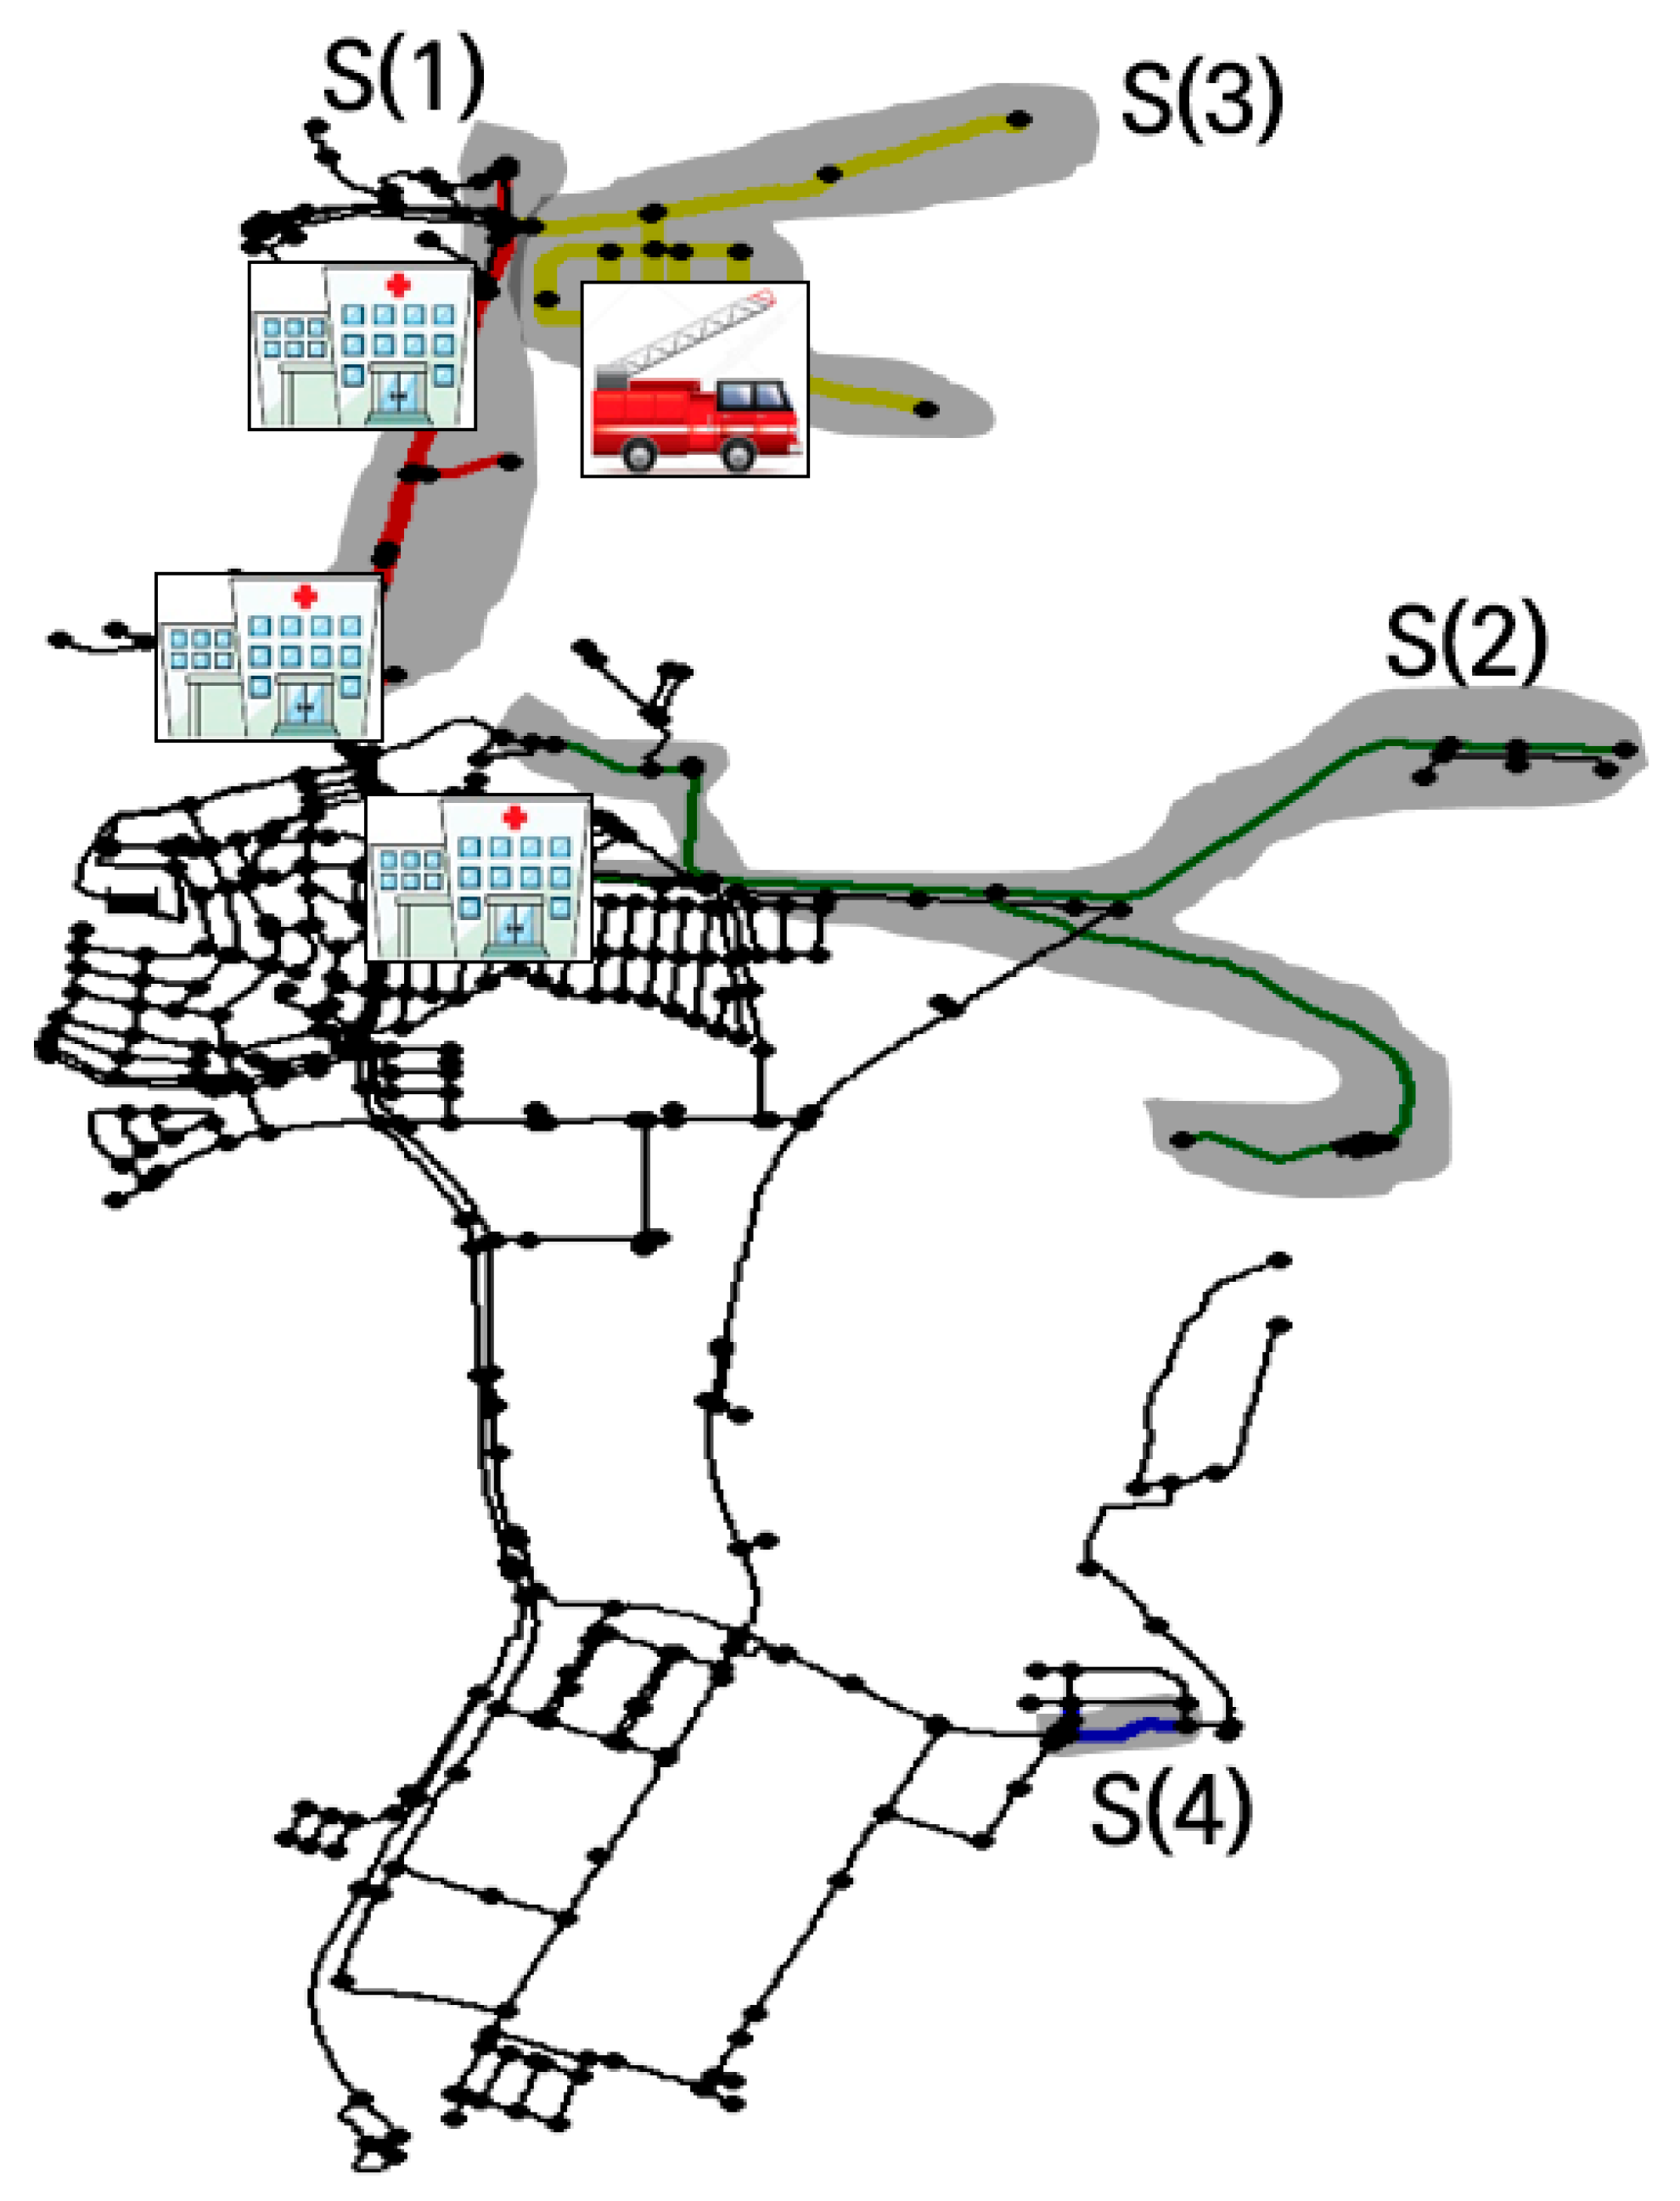
Using the information from the G-city WDSs in Section 3.1, a total of 383 segments of the entire network were identified by their valves. Unintended isolation occurred in 40 of these segments. As shown in Figure 8, four large-scale segments that affected more than 5% of the total water users during pipe breakages were identified. The results of the large-scale segment analysis are presented in Table 10. In Figure 10, there are four important facilities in this area: two hospitals, one elderly center and one fire station.
In the case of segment S(1), more than 10% of all water users could be affected by abnormal conditions, such as system failure. In addition, the segment division priority was determined considering the segment priority criteria given in Table 6. Therefore, S(1), S(2) and S(3), where the expected impact is the greatest and important facilities are located, were selected as priority areas for segment division. The design was then reinforced with additional valve installation.
Expected damage was minimized through reinforcing system design according to segment division priority. To effectively determine the position and number of additional valves, the sensitivity analysis was conducted by changing the number of valves and their installation locations.
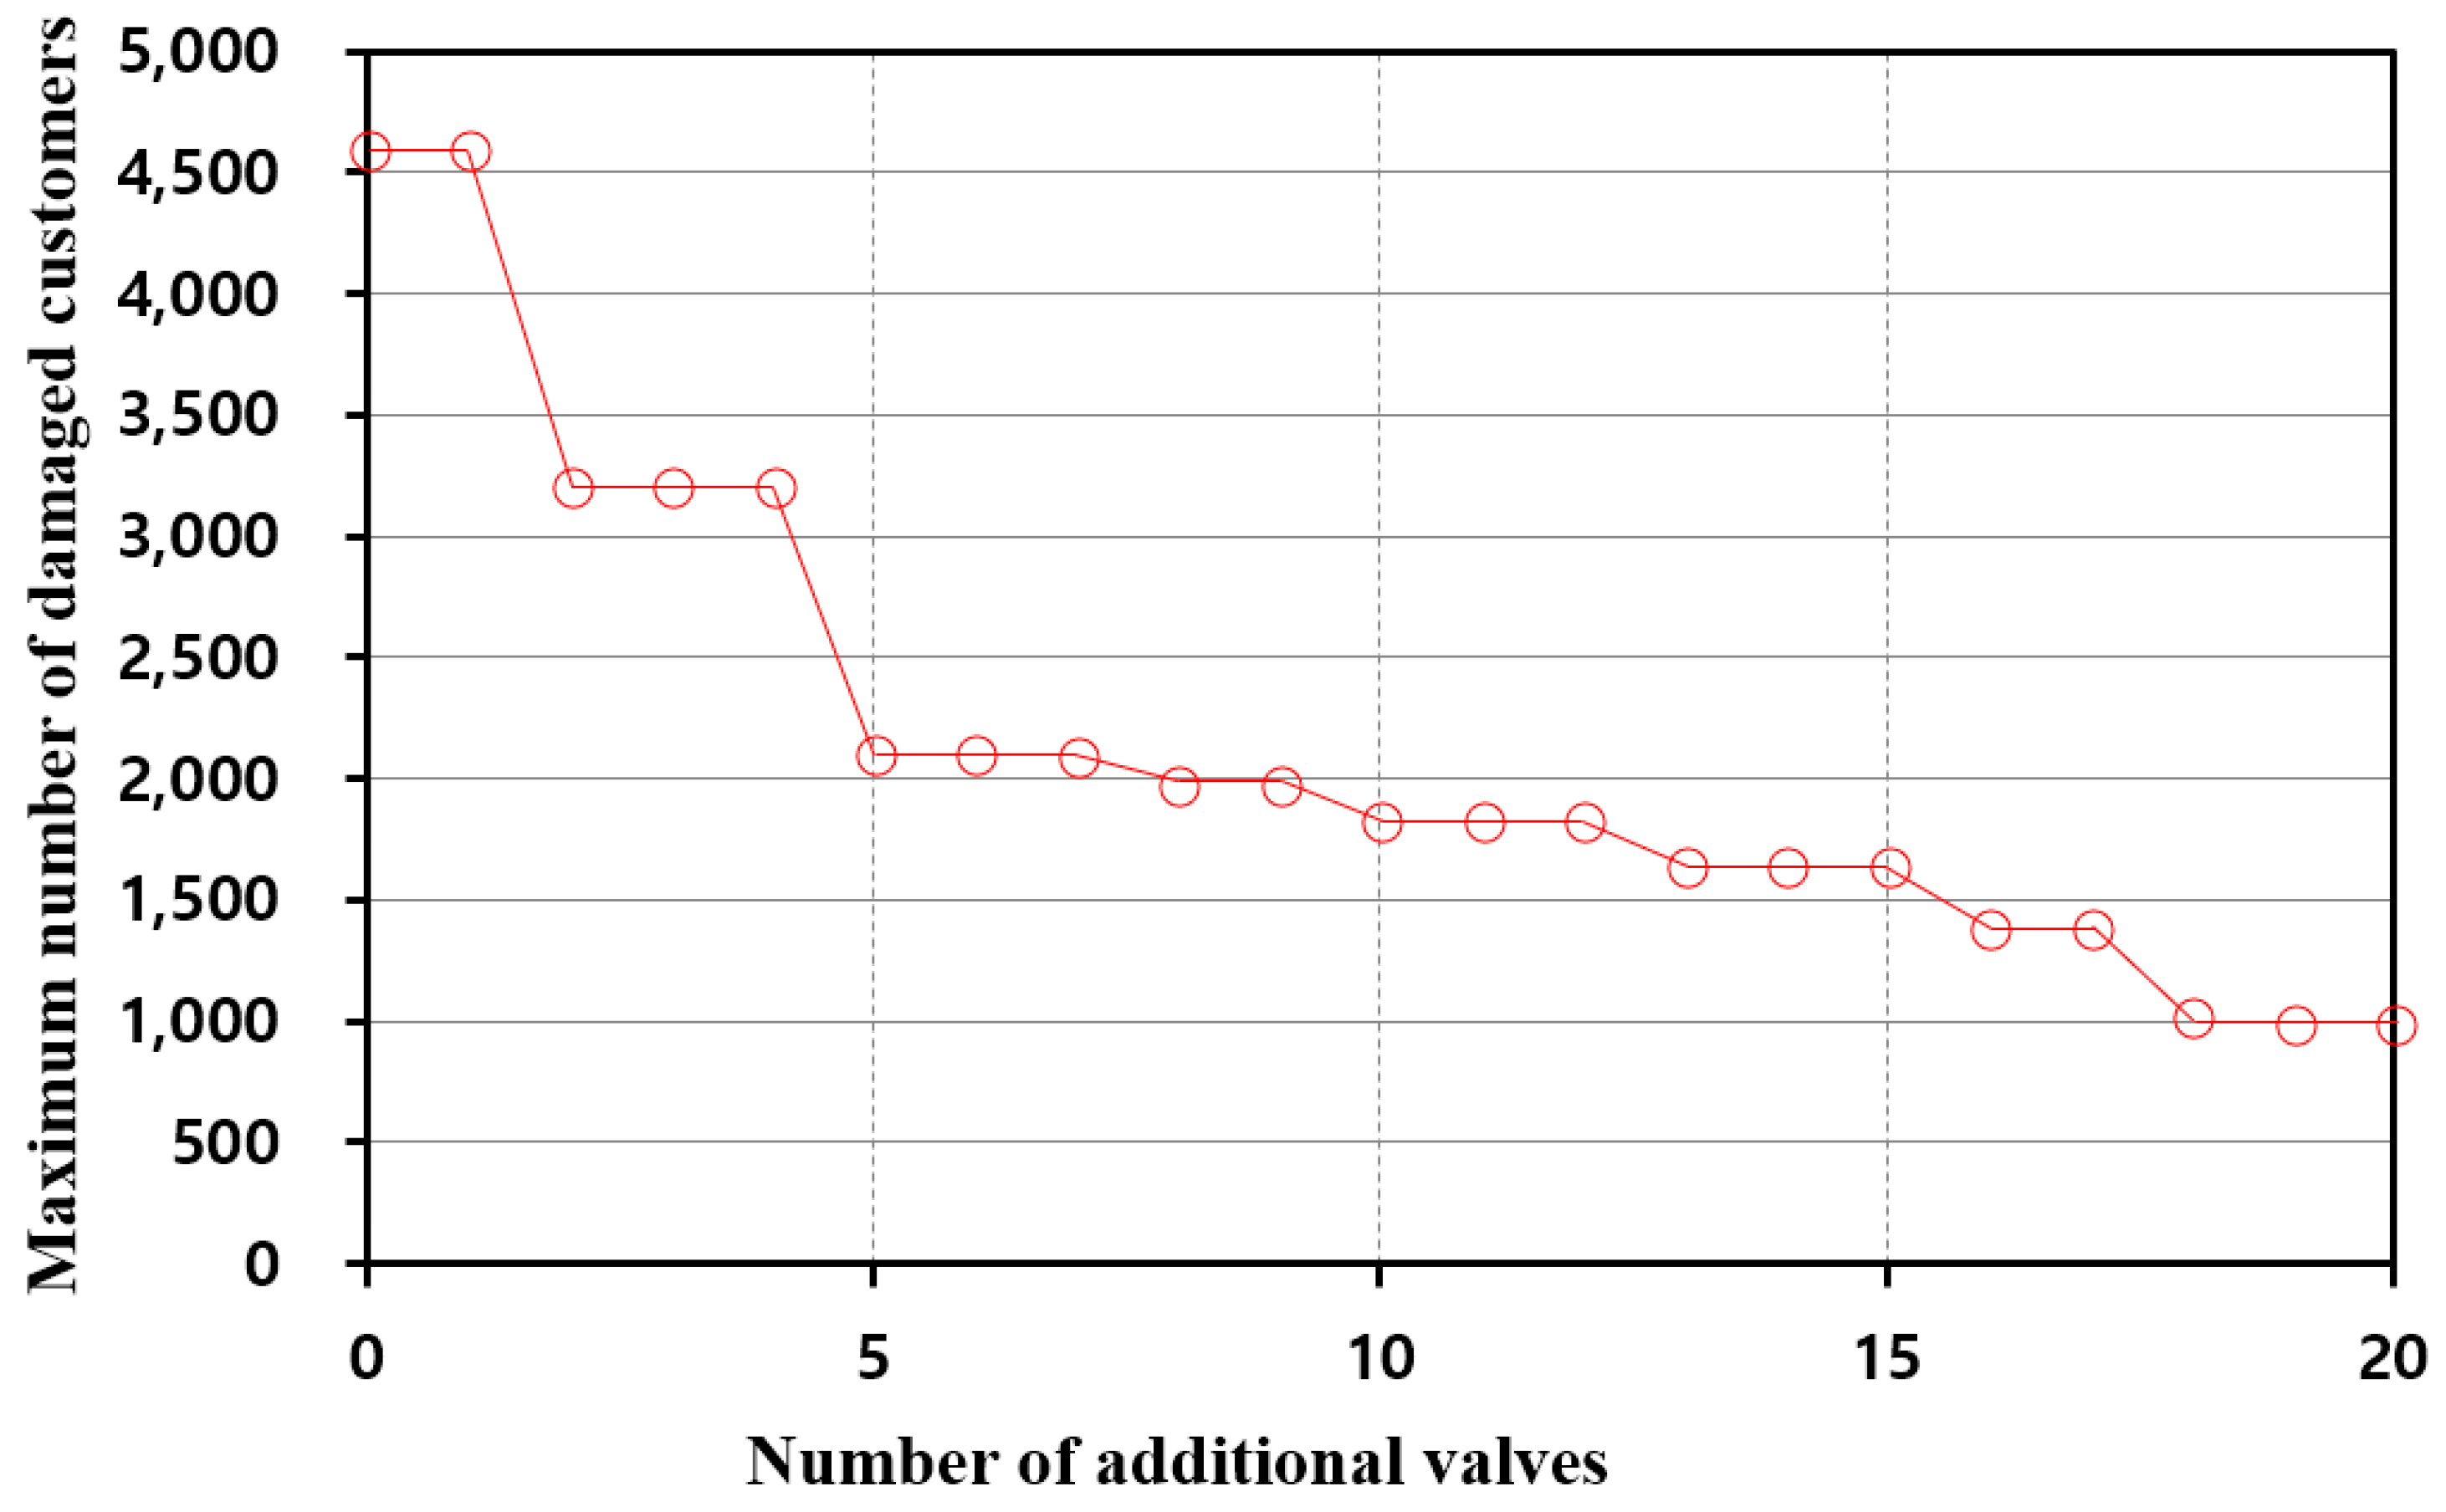
For an analysis of the valve location sensitivity, the candidate valve locations are set based on engineering knowledge from among all potential locations. In case of G-city network, 30 valve location candidates (30 locations) are selected among all possible valve installation locations (116 locations) based on engineering knowledge. Using the selected valve location candidates, the additional valve is installed sequentially and calculate the maximum number of damaged customers, according to the additional valve installation in the whole segment during pipe failure analysis. After then, the effect (the maximum number of damaged customers) of valve installation is compared for different location and determine the optimal valve location. After the first optimal valve location determination, repeat from Step 1 to find the second valve location. To verify the efficiency of the additional valve, the valve operation rate (assuming 90%) and pipe failure analysis was performed. Valves operate for maintenance in the abnormal condition, such as pipe failure. However, if the valve does not work at this time, the damaged segment will expand. Therefore, to evaluate the reasonable damage in the present WDSs, the valve operating rate was considered. To determine the number of additional valves, the relationship between the number of additional valves and the maximum number of customers affected under pipe failure situations was checked as shown in Table 11 and Figure 11. Table 11 presents the impact of valve installation with the maximum damage owing to the increasing number (≈ the valve construction cost) of valves in the 30 candidate locations. The valve construction cost is calculated using the Equation (1) and the installation condition assumes as the medium frequency in Table 4.
The number of valves was gradually increased and the damage reduction effect was evaluated. Then, the number of appropriate valves was determined from the number of marginal valve numbers in Figure 11 that yield optimal efficiency with additional valve installation. In the case of the Gwangmyung network, as the number of additional valves increases, the maximum number of affected customers was reduced and the greatest damage reduction effect could be achieved by installing eight additional valves. The eight valves are installed on the 300, 400, and 600 mm pipes. It means that installing a valve on the main pipeline is a good efficiency.
Therefore, eight additional valves were installed in the top three of the priorities of segment dividing (Segment S(1) to S(3)). As a result, the expected water user damage caused by large-scale segments decreased to less than 5%. In addition, three large-scale segments were divided into eight small segments through eight valves. Table 12 shows the result of adding eight new valves. Compared with the installation of additional valves, the maximum number of affected water users in segment S(1) was reduced from 4606 to 1986 (56.8%) by the installation of four additional valves. Likewise, S(2) and S(3) were installed three and one additional valve(s) and the expected damage decreased by 17.8 and 67.9% respectively.
4. Conclusions
This study investigated the framework of improving WDSs robustness by the installation of additional valves. For this objective, three approaches were applied, namely segment finding algorithm, critical segment selection technique and valve location determination. Using the segment finding algorithm, the segment and the unintentional isolation were identified. To select the segments to be divided, a multicriteria decision technique considering the hydraulic, social and socio-economic criteria was used as a technique for evaluating the critical segment selection technique. In this study, a questionnaire survey analysis was applied to the experts in the field of WDSs for evaluating the relative importance and among the criteria, the undelivered demand and the location of important facilities were selected for identifying the priority of the segment. To improve the segment robustness, a new valve location determination technique was proposed that could replace the engineer’s experience. This technique performed pipe and valve failure analysis and the analysis of the trade-off relationship between the number of additional valves and the maximum damage for determining optimal valve locations and number of additional pipes. To verify the results, two WDSs were applied. Simulation results of the relationship between the number of additional valves and the maximum damaged customers showed that for the G-city network, the maximum damage of water users in the segment can be reduced by more than 50% by the installation of eight additional valves. This result is because the priority of dividing segment is determined to the undelivered demand and the important facility by multi-criteria decision-making approach. In other words, if you apply different criteria for other networks, the results of valve installation that can improve robustness will be changed. For example, if the composition of ages is selected as an important criterion, the additional valves are installed around the elderly care facility and the residence for elderly people to reduce the damage of shut off the water.
In conclusion, this study verified the framework of improving WDSs robustness and using the optimal valve location approach proposed in this study, we confirmed that the damage caused by WDSs failure can be significantly mitigated, without adding any supplemental source. This study had several limitations that future research should address. A hydraulic analysis (i.e., pressure driven analysis) for additional valve installation should be performed to investigate its effect and confirm the findings of this study. In case of changing the system total demand or network isolation (e.g., the additional valve installation or segment isolation), the demand driven analysis (DDA) is not suitable. Because in the abnormal conditions, DDA model may produce unrealistic outputs such as negative pressure. Therefore, future studies will develop more realistic valve installation techniques considering the pressure driven analysis.
Author Contributions
Y.H.C. wrote the draft of the manuscript and provided this model. D.J. and H.J. carried out the survey of previous studies. Y.H.C., D.J., H.J. and J.H.K. conceived the original idea of the proposed method.
Funding
This study was funded by Korea Ministry of Environment as “Projects for Developing Eco-Innovation Technologies (2016002120004)”.
Acknowledgments
The study was supported by Korea Ministry of Environment as “Projects for Developing Eco-Innovation Technologies (2016002120004)”.
Conflicts of Interest
The authors declare no conflict of interest.
References
- Bruneau, M.; Chang, S.E.; Eguchi, R.T.; Lee, G.C.; O’Rourke, T.D.; Reinhorn, A.M.; Von Winterfeldt, D. A framework to quantitatively assess and enhance the seismicresilience of communities. Earthq. Spectra 2003, 19, 733–752. [Google Scholar] [CrossRef]
- Hashimoto, T.; Stedinger, J.R.; Loucks, D.P. Reliability, resiliency, and vulnerability criteria for water resource system performance evaluation. Water Resour. Res. 1982, 18, 14–20. [Google Scholar] [CrossRef] [Green Version]
- Lansey, K. Sustainable, robust, resilient, water distribution systems. In Proceedings of the WDSA 2012: 14th Water Distribution Systems Analysis Conference, Adelaide, Australia, 24–27 September 2012. [Google Scholar]
- Jung, D.; Kang, D.; Kim, J.H.; Lansey, K. Robustness-based design of water distribution systems. J. Water Resour. Plan. Manag. 2013, 140. [Google Scholar] [CrossRef]
- Walski, T.M. Water distribution valve topology for reliability analysis. Reliab. Eng. Syst. Saf. 1993, 42, 21–27. [Google Scholar] [CrossRef]
- Goulter, I.; Walski, T.M.; Mays, L.W.; Sekarya, A.B.A.; Bouchart, R.; Tung, Y.K. Reliability analysis for design. In Water Distribution Systems Handbook; Mays, L.W., Ed.; McGraw-Hill and American Water Works Association: New York, NY, USA, 2000. [Google Scholar]
- Bouchart, F.; Goulter, I. Reliability improvements in design of water distribution networks recognizing valve location. Water Resour. Res. 1991, 27, 3029–3040. [Google Scholar] [CrossRef]
- Hoff, J.W. Maintenance requirements of valves in distribution systems. In Proceedings of the Annual Conference Proceedings AWWA, Toronto, ON, Australia, 23–27 June 1996. [Google Scholar]
- Whittaker, A.R.; Arscott, A.W. Development of an intelligent valve key to improve identification and control of distribution system valves. In Proceeding of the Annual Conference Proceedings AWWA, Atlanta, GA, USA, 15–19 June 1997; pp. 229–237. [Google Scholar]
- Skousen, P.L. Valve Handbook; McGraw-Hill: New York, NY, USA, 1997. [Google Scholar]
- Jung, D.; Yoo, D.G.; Kang, D.; Kim, J.H. Linear model for estimating water distribution system reliability. J. Water Resour. Plan. Manag. 2016, 142. [Google Scholar] [CrossRef]
- Jowitt, P.W.; Xu, C. Optimal valve control in water-distribution networks. J. Water Resour. Plan. Manag. 1990, 116, 455–472. [Google Scholar] [CrossRef]
- Araujo, L.S.; Ramos, H.; Coelho, S.T. Pressure control for leakage minimisation in water distribution systems management. Water Resour. Manag. 2006, 20, 133–149. [Google Scholar] [CrossRef]
- Jun, H.; Loganathan, G.V.; Deb, A.K.; Grayman, W.; Snyder, J. Valve distribution and impact analysis in water distribution systems. J. Environ. Eng. 2007, 133, 790–799. [Google Scholar] [CrossRef]
- Yoo, D.G.; Kang, D.; Jun, H.; Kim, J.H. Rehabilitation priority determination of water pipes based on hydraulic importance. Water 2014, 6, 3864–3887. [Google Scholar] [CrossRef]
- Xanthopulos, Z.; Melachrinoudis, E.; Solomon, M.M. Interactive multiobjective group decision making with interval parameters. Manag. Sci. 2000, 46, 1585–1601. [Google Scholar] [CrossRef]
- Eckenrode, R.T. Weighting multiple criteria. Manag. Sci. 1965, 12, 180–192. [Google Scholar] [CrossRef]
- Knoll, A.L.; Engelberg, A. Weighting multiple objectives—The Churchman-Ackoff technique revisited. Comput. Oper. Res. 1978, 5, 165–177. [Google Scholar] [CrossRef]
- Saaty, T.L. The Analytic Hierarchy Process: Planning, Priority Setting, Resource Allocation; McGraw-Hill International Book Co.: New York, NY, USA, 1980; p. 281. [Google Scholar]
- Bragalli, C.; D’Ambrosio, C.; Lee, J.; Lodi, A.; Toth, P. On the optimal design of water distribution networks: A practical MINLP approach. Optim. Eng. 2012, 13, 219–246. [Google Scholar] [CrossRef]
- Clark, R.M.; Sivaganesan, M.; Selvakumar, A.; Sethi, V. Cost models for water supply distribution systems. J. Water Resour. Plan. Manag. 2002, 128, 312–321. [Google Scholar] [CrossRef]
Figure 1.
Model for segment division priority.

Figure 2.
Relationship between the number of additional valves and the maximum damage.

Figure 3.
Concept of valve failure impact.

Figure 4.
Example of segment identification: (a) Example network; (b) Results of segment identification.
Figure 4.
Example of segment identification: (a) Example network; (b) Results of segment identification.

Figure 5.
Concept of (a) utopian approach; (b) weighted utopian approach.

Figure 6.
Layout of the Pescara network.

Figure 7.
Layout of the G-city network: (a) map of G-city city; (b) three subnetworks; (c) selected subnetwork (C block).
Figure 7.
Layout of the G-city network: (a) map of G-city city; (b) three subnetworks; (c) selected subnetwork (C block).

Figure 8.
Five segments above the dividing priority.

Figure 9.
Result of optimal valve installation for segment division.

Figure 10.
Location of the large-scale segment and important facilities.

Figure 11.
Relationship between the number of valves and maximum number of customers affected in G-city network.
Figure 11.
Relationship between the number of valves and maximum number of customers affected in G-city network.


Table 1.
Four elements of resilience.
| Resilience Factors | Description |
| Robustness | Ability to maintain system functionality under failure event |
| Redundancy | The degree to which spare the alternative resources are secured to prevent the system from damage due to interference factors |
| Resourcefulness | The ability to detect abnormal conditions of the system by disturbance factors and to allocate resources appropriately |
| Rapidity | The ability to respond quickly to abnormal conditions |
Table 2.
Three segment-identifying matrices: (a) Node-Arc Matrix; (b) Valve Location Matrix; (c) Valve Deficiency Matrix.
Table 2.
Three segment-identifying matrices: (a) Node-Arc Matrix; (b) Valve Location Matrix; (c) Valve Deficiency Matrix.
| Pipe | 1 | 2 | 3 | 4 | 5 | 6 | 7 | 8 | |
|---|---|---|---|---|---|---|---|---|---|
| Node | |||||||||
| (a) | |||||||||
| Source | 1 | 0 | 0 | 0 | 0 | 0 | 0 | 0 | |
| 1 | 0 | 1 | 0 | 1 | 0 | 0 | 0 | 0 | |
| 2 | 0 | 1 | 1 | 0 | 1 | 0 | 0 | 0 | |
| 3 | 0 | 0 | 0 | 1 | 0 | 0 | 1 | 0 | |
| 4 | 0 | 0 | 0 | 0 | 1 | 0 | 1 | 1 | |
| 5 | 0 | 0 | 0 | 0 | 0 | 1 | 0 | 1 | |
| 6 | 0 | 0 | 1 | 0 | 0 | 1 | 0 | 0 | |
| (b) | |||||||||
| Source | 0 | 0 | 0 | 0 | 0 | 0 | 0 | 0 | |
| 1 | 0 | 0 | 0 | 0 | 0 | 0 | 0 | 0 | |
| 2 | 0 | 1 | 0 | 0 | 0 | 0 | 0 | 0 | |
| 3 | 0 | 0 | 0 | 1 | 0 | 0 | 0 | 0 | |
| 4 | 0 | 0 | 0 | 0 | 1 | 0 | 1 | 1 | |
| 5 | 0 | 0 | 0 | 0 | 0 | 1 | 0 | 1 | |
| 6 | 0 | 0 | 1 | 0 | 0 | 0 | 0 | 0 | |
| (c) | |||||||||
| Source | 1 | 0 | 0 | 0 | 0 | 0 | 0 | 0 | |
| 1 | 0 | 1 | 0 | 1 | 0 | 0 | 0 | 0 | |
| 2 | 0 | 0 | 1 | 0 | 1 | 0 | 0 | 0 | |
| 3 | 0 | 0 | 0 | 0 | 0 | 0 | 1 | 0 | |
| 4 | 0 | 0 | 0 | 0 | 0 | 0 | 0 | 0 | |
| 5 | 0 | 0 | 0 | 0 | 0 | 0 | 0 | 0 | |
| 6 | 0 | 0 | 0 | 0 | 0 | 1 | 0 | 0 | |
Table 3.
Determination weight factor approaches.
| Approaches | Description |
|---|---|
| Rating scale [15] | (3.1) |
| Churchman-Ackoff [16] | (3.2) |
| Eigenvector [17] | (3.3) |
| Rank order centroid weights [18] | (3.4) |
Note. ωj = weighting factor of the j-th attribute, j = attribute (j = 1, 2, …, n), n = number of attributes, k = respondent (k = 1, 2, …, l), l = number of respondents, rjk = rating of respondent k, J = rank of the importance of the j-th attribute, A = positive pairwise comparison reciprocal matrix, λmax = maximum eigenvalue of A.
Table 4.
Valve construction cost parameters based on Clark et al. [21].
Table 4.
Valve construction cost parameters based on Clark et al. [21].
| Frequency of Installation | Pipe Diameter | Parameters | R2 | ||
|---|---|---|---|---|---|
| a | b | c | |||
| Low a | 10.16–91.44 cm (4–36 in.) | 4.4 | 0.48 | 0.62 | 0.99 |
| Medium a | 10.16–91.44 cm (4–36 in.) | 9.8 | 0.02 | 1.8 | 0.58 |
| High a | 10.16–91.44 cm (4–36 in.) | 18.3 | 0.081 | 1.8 | 0.90 |
| Low b | 30.48–182.88 cm (12–72 in.) | 5.4 | 0.0 | 0.0 | 0.99 |
| Medium b | 30.48–182.88 cm (12–72 in.) | 15.7 | 0.0 | 0.0 | 0.99 |
| High b | 30.48–182.88 cm (12–72 in.) | 32.7 | 0.001 | 2.7 | 0.81 |
Note. a Ductile iron fittings, b Steel fittings.
Table 5.
Criteria of segment priority.
| The Weight Factor Approaches | Rating | Churchman-Ackoff | Eigenvector | Rank Order Centroid Weights | |
|---|---|---|---|---|---|
| The Criteria of Segment Priority | |||||
| Hydraulic Importance | Undelivered demand (the number of water users) | 0.225 | 0.250 | 0.521 | 0.250 |
| Incensement of head loss for isolation of segment | 0.141 | 0.146 | 0.112 | 0.146 | |
| Number of valves to isolate of segment | 0.096 | 0.104 | 0.081 | 0.104 | |
| Social Importance | Important facilities | 0.119 | 0.117 | 0.085 | 0.117 |
| Composition of ages | 0.035 | 0.066 | 0.017 | 0.066 | |
| Restoration infrastructure (equipment, person, system) | 0.079 | 0.029 | 0.013 | 0.029 | |
| Socio-economic Importance | Average income level | 0.086 | 0.080 | 0.028 | 0.080 |
| Characteristics of the water user (residential district, commercial district, industrial district) | 0.086 | 0.087 | 0.024 | 0.087 |
Table 6.
Segment identification result of Pescara network.
| Segment No. | Node No. | Pipe No. | Undelivered Demand (LPS) | Important Facility |
|---|---|---|---|---|
| 1 | - | 15 | 0 | 0 |
| 2 | - | 25 | 0 | 0 |
| 3 | - | 29 | 0 | 0 |
| 4 | - | 48 | 0 | 0 |
| 5 | - | 60 | 0 | 0 |
| 6 | - | 61 | 0 | 0 |
| 7 | - | 79 | 0 | 0 |
| 8 | 1, 2, 59 | 1, 77, 78 | 29.88 | 0 |
| 9 | 4 | 80 | 8.5 | 0 |
| 10 | 6, 7, 9, 12, 14, 22, 23, 27, 33, 34, 37, 38 | 5, 7, 9, 16, 17, 26, 32, 37, 39, 40, 43, 44, 45, 46, 47, 81 | 91.19 | 0 |
| 11 | 8 | 6 | 33.6 | 0 |
| 12 | 10, 11 | 8, 33 | 46.17 | 0 |
| 13 | 13, 15, 16, 24 | 10, 11, 13, 18, 19, 88 | 18.07 | 0 |
| 14 | 17 | 12, 36 | 4.81 | 0 |
| 15 | 18, 19 | 14, 22 | 37.98 | 0 |
| 16 | 20, 61, 62, 64 | 21, 85, 86, 87, 91 | 10.79 | 1 |
| 17 | 21 | 23 | 2.17 | 0 |
| 18 | 25 | 20, 24 | 5.32 | 1 |
| 19 | 26, 28, 31, 32, 39 | 27, 28, 30, 31, 38, 41, 42 | 18.41 | 1 |
| 20 | 30, 43, 47 | 52, 54, 55, 56, 57 | 19.26 | 1 |
| 21 | 35 | 34 | 12.64 | 1 |
| 22 | 36 | 35 | 12.64 | 1 |
| 23 | 40, 41 | 49, 51, 65 | 12.13 | 1 |
| 24 | 42 | 72, | 6.21 | 1 |
| 25 | 44, 53, 54 | 64, 66, 67 | 12.33 | 1 |
| 26 | 45, 46, 48, 63, 67, 68 | 53, 58, 59, 62, 95, 96, 97, 98 | 24.35 | 1 |
| 27 | 49, 50 | 71, 94 | 8.98 | 0 |
| 28 | 51 | 90 | 0 | 1 |
| 29 | 3, 5, 52, 62 | 2, 3, 4, 63, 73, 83, 89, 93, 99 | 31.92 | 2 |
| 30 | 56, 57 | 69, 74 | 6.02 | 2 |
| 31 | 58 | 70 | 5.14 | 1 |
| 32 | 60 | 84 | 0 | 0 |
| 33 | 70 | 50 | 0 | 0 |
| 34 | 29 | 68, 75, 76, 82, 92 | 6.4 | 0 |
| 35 | 66 | 92 | 25 | 0 |
Table 7.
Priority of segment division.
| Segment No. | Undelivered Demand | Important Facility | Priority |
|---|---|---|---|
| 1 | 0 | 0 | 27 |
| 2 | 0 | 0 | 27 |
| 3 | 0 | 0 | 27 |
| 4 | 0 | 0 | 27 |
| 5 | 0 | 0 | 27 |
| 6 | 0 | 0 | 27 |
| 7 | 0 | 0 | 27 |
| 8 | 29.88 | 0 | 6 |
| 9 | 8.5 | 0 | 18 |
| 10 | 91.19 | 0 | 1 |
| 11 | 33.6 | 0 | 4 |
| 12 | 46.17 | 0 | 2 |
| 13 | 18.07 | 0 | 11 |
| 14 | 4.81 | 0 | 24 |
| 15 | 37.98 | 0 | 3 |
| 16 | 10.79 | 1 | 16 |
| 17 | 2.17 | 0 | 25 |
| 18 | 5.32 | 1 | 22 |
| 19 | 18.41 | 1 | 10 |
| 20 | 19.26 | 1 | 9 |
| 21 | 12.64 | 1 | 12 |
| 22 | 12.64 | 1 | 12 |
| 23 | 12.13 | 1 | 15 |
| 24 | 6.21 | 1 | 20 |
| 25 | 12.33 | 1 | 14 |
| 26 | 24.35 | 1 | 8 |
| 27 | 8.98 | 0 | 17 |
| 28 | 0 | 1 | 26 |
| 29 | 31.92 | 2 | 5 |
| 30 | 6.02 | 2 | 19 |
| 31 | 5.14 | 1 | 23 |
| 32 | 0 | 0 | 27 |
| 33 | 0 | 0 | 27 |
| 34 | 6.4 | 0 | 21 |
| 35 | 25 | 0 | 7 |
Table 8.
Result of optimal valve installation after top five segment divisions.
| Segment No. | Node No. | Pipe No. | Undelivered Demand (LPS) |
|---|---|---|---|
| 1 | - | 15 | 0 |
| 2 | - | 25 | 0 |
| 3 | - | 29 | 0 |
| 4 | - | 48 | 0 |
| 5 | - | 60 | 0 |
| 6 | - | 61 | 0 |
| 7 | - | 79 | 0 |
| 8 | 1, 2, 59 | 1, 77, 78 | 29.88 |
| 9 | 4 | 80 | 8.5 |
| 10 | 6, 7, 9, 12, 14, 22, 23 | 5, 7, 9, 16, 17, 26, 32, 37 | 29.52 |
| 11 | 27 | 39 | 33 |
| 12 | 33 | 40, 43 | 8.79 |
| 13 | 34, 37, 38 | 44, 45, 46, 47, 81 | 19.88 |
| 14 | 8 | 6 | 33.6 |
| 15 | 10 | 8 | 16.4 |
| 16 | 11 | 33 | 29.77 |
| 17 | 13, 15, 16, 24 | 10, 11, 13, 18, 19, 88 | 18.07 |
| 18 | 17 | 12, 36 | 4.81 |
| 19 | 18 | 14 | 21.04 |
| 20 | 19 | 22 | 16.94 |
| 21 | 20, 61, 62, 64 | 21, 85, 86, 87, 91 | 10.79 |
| 22 | 21 | 23 | 2.17 |
| 23 | 25 | 20, 24 | 5.32 |
| 24 | 26, 28, 31, 32, 39 | 27, 28, 30, 31, 38, 41, 42 | 18.41 |
| 25 | 30, 43, 47 | 52, 54, 55, 56, 57 | 19.26 |
| 26 | 35 | 34 | 12.64 |
| 27 | 36 | 35 | 12.64 |
| 28 | 40, 41 | 49, 51, 65 | 12.13 |
| 29 | 42 | 72, | 6.21 |
| 30 | 44, 53, 54 | 64, 66, 67 | 12.33 |
| 31 | 45, 46, 48, 63, 67, 68 | 53, 58, 59, 62, 95, 96, 97, 98 | 24.35 |
| 32 | 49, 50 | 71, 94 | 8.98 |
| 33 | 51 | 90 | 0 |
| 34 | 3, 5, 52, 62 | 2, 3, 4, 63, 73, 83, 89, 93, 99 | 31.92 |
| 35 | 56, 57 | 69, 74 | 6.02 |
| 36 | 58 | 70 | 5.14 |
| 37 | 60 | 84 | 0 |
| 38 | 70 | 50 | 0 |
| 39 | 29 | 68, 75, 76, 82, 92 | 6.4 |
| 40 | 66 | 92 | 25 |
Table 9.
Comparison of the results between original design and improved design.
| Comparison Criteria | Original Design | Improved Design |
|---|---|---|
| The number of segments | 35 | 40 |
| Maximum undelivered demand (LPS) | 91.19 | 33.60 |
| Length weighted average undelivered demand (LPS) | 35.88 | 18.44 |
Table 10.
Analysis results for large-scale segments.
| Segment ID | S(1) | S(2) | S(3) | S(4) |
|---|---|---|---|---|
| # Direct Customers | 2103 | 2588 | 632 | 226 |
| # UI Customers | 2503 | 622 | 1374 | 1765 |
| # Total Customers | 4606 | 3210 | 2006 | 2001 |
| # Valves | 17 | 7 | 2 | 5 |
| # Pipes | 33 | 17 | 8 | 6 |
| # UI Pipes | 53 | 9 | 17 | 15 |
| # Total Pipes | 86 | 26 | 25 | 21 |
Table 11.
Effect of damage reduction by increasing the number of additional valves in G-city network.
Table 11.
Effect of damage reduction by increasing the number of additional valves in G-city network.
| # Total Additional Valve | Maximum Damaged Customers | Valve Construction Cost ($) | # Additional Valve | Maximum Damaged Customers | ||||
|---|---|---|---|---|---|---|---|---|
| S(1) | S(2) | S(3) | S(1) | S(2) | S(3) | |||
| 0 | 4606 | 0 | 4606 | 3210 | 2006 | |||
| 1 | 4606 | 15.7 | 1 | 4606 | 3210 | 1649 | ||
| 2 | 3210 | 31.4 | 2 | 3008 | 3210 | 2006 | ||
| 3 | 3210 | 47.1 | 2 | 1 | 3008 | 3210 | 1649 | |
| 4 | 3210 | 62.8 | 3 | 1 | 2103 | 3210 | 1649 | |
| 5 | 2113 | 78.5 | 3 | 2 | 2103 | 2113 | 2006 | |
| 6 | 2103 | 94.2 | 3 | 3 | 2103 | 1029 | 2006 | |
| 7 | 2103 | 109.9 | 3 | 3 | 1 | 2103 | 1029 | 1649 |
| 8 | 1986 | 125.6 | 4 | 3 | 1 | 1986 | 1029 | 1649 |
| 9 | 1986 | 141.3 | 4 | 3 | 2 | 1986 | 1029 | 1649 |
| 10 | 1831 | 157.0 | 6 | 3 | 1 | 1831 | 1029 | 1649 |
| 11 | 1831 | 172.7 | 6 | 3 | 2 | 1831 | 1029 | 1531 |
| 12 | 1831 | 188.4 | 6 | 3 | 2 | 1831 | 1029 | 1531 |
| 13 | 1649 | 204.1 | 9 | 3 | 1 | 1392 | 1029 | 1649 |
| 14 | 1649 | 219.8 | 9 | 4 | 1 | 1392 | 983 | 1649 |
| 15 | 1649 | 235.5 | 9 | 5 | 1 | 1392 | 891 | 1649 |
| 16 | 1392 | 251.2 | 9 | 3 | 4 | 1392 | 1029 | 1001 |
| 17 | 1392 | 266.9 | 10 | 3 | 4 | 1392 | 1029 | 1001 |
| 18 | 1029 | 282.6 | 11 | 3 | 4 | 975 | 1029 | 1001 |
| 19 | 1001 | 298.3 | 11 | 4 | 4 | 975 | 983 | 1001 |
| 20 | 1001 | 314.0 | 11 | 5 | 4 | 975 | 891 | 1001 |
Table 12.
Comparison number of affected water users in the reinforcement design.
| Segment ID | Original Design | Improved Design | # Additional Valve |
|---|---|---|---|
| S(1) | 4606 | 1986 | 4 |
| S(1) | 3210 | 1029 | 3 |
| S(2) | 2006 | 1649 | 1 |
© 2018 by the authors. Licensee MDPI, Basel, Switzerland. This article is an open access article distributed under the terms and conditions of the Creative Commons Attribution (CC BY) license (http://creativecommons.org/licenses/by/4.0/).
Share and Cite
MDPI and ACS Style
Choi, Y.H.; Jung, D.; Jun, H.; Kim, J.H. Improving Water Distribution Systems Robustness through Optimal Valve Installation. Water 2018, 10, 1223. https://doi.org/10.3390/w10091223
AMA Style
Choi YH, Jung D, Jun H, Kim JH. Improving Water Distribution Systems Robustness through Optimal Valve Installation. Water. 2018; 10(9):1223. https://doi.org/10.3390/w10091223
Chicago/Turabian StyleChoi, Young Hwan, Donghwi Jung, Hwandon Jun, and Joong Hoon Kim. 2018. "Improving Water Distribution Systems Robustness through Optimal Valve Installation" Water 10, no. 9: 1223. https://doi.org/10.3390/w10091223
Note that from the first issue of 2016, this journal uses article numbers instead of page numbers. See further details here.