Evaluation of the Non-Darcy Effect of Water Inrush from Karst Collapse Columns by Means of a Nonlinear Flow Model


1
State Key Laboratory of Eco-hydraulics in Northwest Arid Region, Xi’an University of Technology, Xi’an 710048, China
2
Institute of Geotechnical Engineering, Shaanxi Provincial Key Laboratory of Loess Mechanics and Engineering, Xi’an University of Technology, Xi’an 710048, China
3
School of Resources and Safety Engineering, China University of Mining and Technology, Beijing 100083, China
4
State Key Laboratory for Geomechanics and Deep Underground Engineering, China University of Mining and Technology, Xuzhou 221116, China
*
Author to whom correspondence should be addressed.
Water 2018, 10(9), 1234; https://doi.org/10.3390/w10091234
Submission received: 17 August 2018
/
Revised: 9 September 2018
/
Accepted: 11 September 2018
/
Published: 13 September 2018
(This article belongs to the Section Hydraulics and Hydrodynamics)
Abstract
:Karst collapse columns (KCCs) are naturally formed geological structures that are widely observed in North China. Given their influence on normal mining operations and the progress of mining work, collapse columns pose a hidden danger in coal mining under the influence of manual mining. By communicating often with the aquifer, the water inrush from KCCs poses a serious threat to construction projects. This paper adopts three flow field models, namely, Darcy aquifer laminar flow, Forchheimer flow, and Navier–Stokes turbulent flow, based on the changes in the water inrush flow pattern in the aquifer and laneway, and uses COMSOL Multiphysics software to produce the numerical solutions of these models. As the water inrush flow velocity increases, the Forchheimer flow shows the effect of additional force (inertial resistance) on flow in KCCs, in addition to the effect of viscous resistance. After the joint action of viscous resistance and inertial resistance, the inertial resistance ultimately dominates and gradually changes the water inrush from the KCCs to fluid seepage. Forchheimer flow can comprehensively reflect the nonlinear flow process in the broken rock mass of KCCs, demonstrate the dynamic process from the Darcy aquifer to the final tunnel turbulence layer, and quantitatively show the changes in the flow patterns of the water inrush from KCCs.
1. Introduction
Karst collapse columns (KCCs) are naturally formed geological structures in North China that have often developed in Ordovician limestone [1]. These structures can be easily connected to the natural aquifer below the water-separating band to form an unblocked pipeline. However, under the action of coal seam mining, the fluid in the aquifer flows into the collapse column and leads to a water inrush disaster. Moreover, the water inrush in collapse columns cannot be easily predicted and prevented due to its concealment. Water inrush disasters seriously threaten underground excavation practices. On the one hand, the concealment of the collapse column affects the progression of normal excavation and mining work. On the other hand, the collapse column may present a hidden danger in coal mining under the influence of manual mining [2,3,4,5]. In sum, water inrush accidents caused by underground mining can bring heavy casualties and economic losses to construction enterprises.
Water inrush disasters in China have submerged more than 200 mines in the entire country and have resulted in tens of billions of yuan in economic losses [6]. These disasters can also cause irreparable damage to the water resources and surrounding environments of construction areas. Although the latest advancements in science and technology and the development of new means of production have greatly improved the equipment, techniques, machineries, and technologies for tunnel excavation, water inrush disasters still occur frequently. The water inrush disasters in China that are caused by collapse columns in mines not only bring major casualties and economic losses but also waste plenty of valuable groundwater resources that are widely utilized in the country because of their many advantages, which include their wide distribution, excellent water quality, ease of purification, strong storage capacity, and guaranteed high water supply. However, groundwater resources have a below average distribution. Specifically, many arid and semi-arid regions and cities in North China consider groundwater a key resource or even their only source of water [7,8]. Survey data show that the annual average water drainage volume of mines in North China reaches 108 m3 orders of magnitude. However, their actual water utilization rate is less than 20% because of their water scarcity and the high water wastage resulting from water inrush disasters [6]. Accordingly, these two factors have become major problems related to groundwater utilization in China.
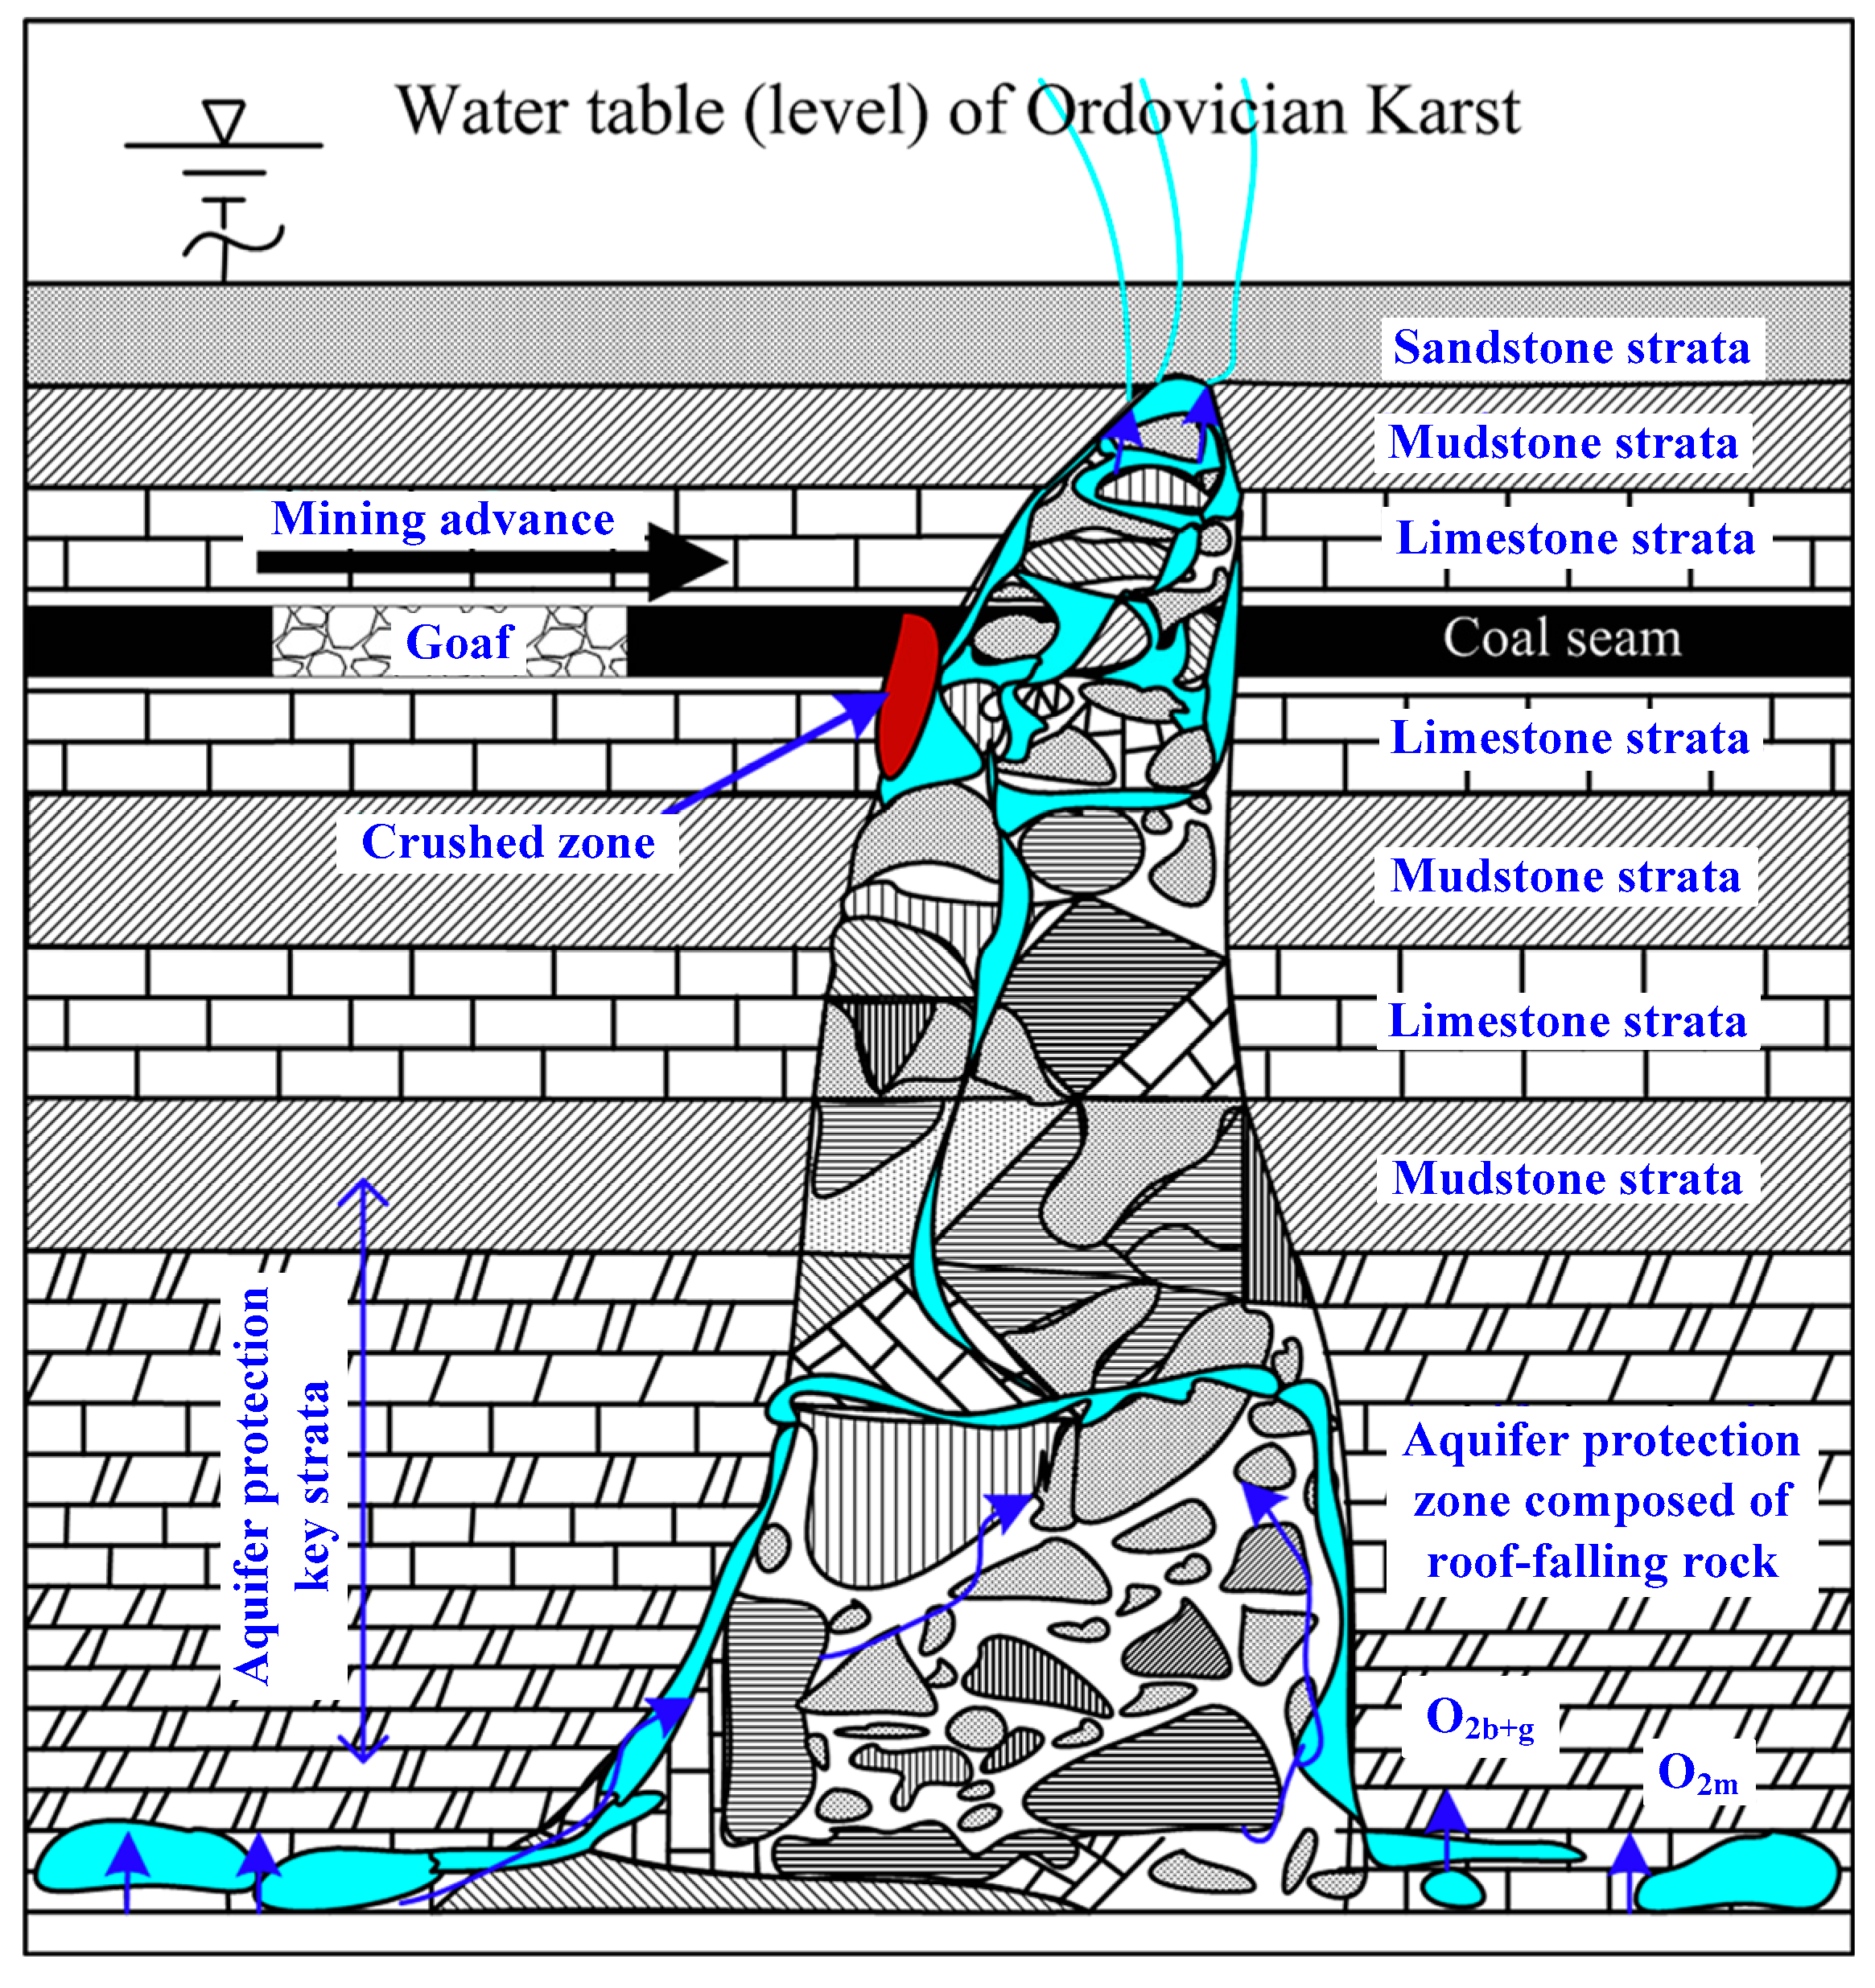
Karst, which is developed and distributed in limestone stratum, is formed by the long-term corrosion of running underground water. Ancient karst caves developed in limestone and continue to expand along with the corrosion of groundwater. Some of these caves even collapse due to the long-term effect of geological tectonic force and the upper cover rock. When the coal-bearing strata overlaying the upper part of these caves also collapse, the coal seam is destroyed. Shaped as a circular or irregular elliptical cylinders, these strata have been referred to as collapse columns, as shown in Figure 1 [9]. When artificial mining connects the aquifer, the collapse column, and mining face laneway with one another, and when the aquifer has large water reserves and a high bearing pressure, the mine water will overcome resistance and enter the main body of the collapse column and even the laneway, thereby causing a water inrush disaster.
In the early 20th century, foreign countries began to examine the water-resisting layer of the floor and found that a thicker water-resisting layer reduced the frequency of water inrush [10]. During mining, a part of natural low-permeability rock (coal) stratum is normally retained without excavation as the water-resisting layer to prevent water inrush from aquifer to working face. These findings highlight a close relationship between the water-resisting layer and water inrush. Besides, scholars examined the role of the relative water-resisting layer and devised the failure mechanism of the floor [11,12,13]. However, the hydrogeological conditions of deposits in China are far inferior to those abroad [14]. In this case, studies abroad are relatively simple and provide relatively limited technical solutions that cannot address all types of geological issues. Water inrush disasters associated with mine excavation are considered serious technical problems in China that restrict mine production safety. The water inrush from the collapse column during mine excavation cannot be effectively predicted. In response to these concerns, scholars from China [15,16,17,18] have proposed some water inrush criteria and theories, which have positively contributed to the prevention and control of water inrush from the coal floor. For example, the seepage mutation and nonlinear flow model was proposed based on the understanding that there exists a seepage mutation in the process of water inrush and the relationship between velocity and pressure of water in fractured rock mass shows obvious nonlinear characteristic [19]. For the water inrush preferred plane theory, it is considered that water inrush first occurs on the section of rock mass which is the weakest and most prone to structural failure, that is, the water inrush preferred plane [20]. Besides, the water inrush coefficient (the ratio of aquifer water pressure to water barrier thickness) is used to analyze and evaluate the risk degree of water inrush. According to the water inrush critical index method, the risk of water inrush is greatly increased when water inrush coefficient exceeds the critical value [21]. The down three zones theory is normally used to analyzed the water inrush process. In this theory, three zones can be divided from the bottom of coal seam to the top of aquifer, i.e., the floor water conduction zone, the protection zone, and the confined water conduction zone [22]. The retained rock stratum with high strength is simplified as a rectangular thin plate, and the mechanical model of the key layer of the water-resisting floor is established on the basis of water-resisting layer theory [23]. For the rock–water stress relationship theory, it is considered that the water inrush process is a fluid–solid coupling process, and the water inrush from coal floor is the result of the failure of surrounding rock caused by the interaction of stress field and seepage field [24].
Water inrush from the collapse column is not a separate process. Influenced by deformation, extrusion, weathering, erosion, and other natural factors resulting from long-term geological and hydrological effects, the collapse column is formed through the vertical and horizontal cutting of the whole frame, which is contained in a natural crushing column in a special geological environment. The fragments of the surrounding rock, the fine filler particles in the column, and the abundant amount of natural groundwater interact with and influence one another [25]. On the one hand, the collapse column is unevenly filled with different-sized chippings. These chippings will move under the influence of groundwater, thus changing its filling degree, which in turn greatly influences the permeability of karst rock. Given the changes in the permeability of rock mass, the mechanical properties and physical state of the collapse column differ from those of ordinary rock mass. The seepage of natural groundwater and the internal structure of rocks are defined as coupling processes that interact and influence each other [26]. Therefore, the water inrush process in collapse column presents a very complex fluid–solid coupling problem. In this case, all separate factors must be taken altogether when studying the water inrush process. Given that the factors in the rock mass seepage process cannot be separated from one another, the interaction amongst various factors is neglected, and the mechanism of water inrush is inaccurately analyzed.
A collapse column may pass through the coal pillar and the mining face in practical construction applications. The natural groundwater breaks through the water-separating band into a collapse column through a high-speed nonlinear seepage process and this cannot be purely regarded as Darcy linear seepage. The non-Darcy effect in the collapse column, that is, the natural groundwater flowing through the broken zone, must also be considered. The Forchheimer equation can be used to reflect the state of fluid movement in the collapse column. In sum, in the coupling operation of three flow fields, groundwater can be considered as having a Darcy laminar flow in the natural aquifer, a Forchheimer flow in the collapse column, and a laneway Navier–Stokes turbulent flow in the mining face. To qualitatively examine the influence of each factor on water inrush, this paper uses a finite element software to establish a two-dimensional (2D) plane model that reveals the changes in the fluid state, velocity, and pressure in the water inrush process by changing the permeability of the strata, the non-Darcy factor, and other parameters.
2. The Water Inrush Coupling Model of the Collapse Column
2.1. Seepage Mechanism of Underground Rock Mass
The water inrush from the collapse column does not demonstrate a single laminar flow but experiences different flow states. The Darcy laminar flow is dominated by viscous resistance, the Navier–Stokes turbulent flow is dominated by inertial resistance, and the non-Darcy Forchheimer flow is very complex and dominated by both viscous and inertial resistance [27,28]. The changes in these three flow states can be analyzed by using seepage theory of classical mechanics and by using the correlation curve between Reynolds number and Fanning friction coefficient [29].
Yang et al. [30] performed a nonlinear seepage experiment with different-sized quartz sands and found that under a single pressure gradient, the seepage law of fine particles is consistent with the law of Darcy laminar flow. However, both the flow velocity and porosity between particles increase along with the experimental particle size. In this case, the seepage law gradually shifts from the Darcy laminar flow law to the Forchheimer flow. After entering high-speed seepage, the Fanning friction coefficient gradually increases along with Reynolds number. Miao et al. [31] experimentally studied the nonlinear seepage characteristics of fractured sandstone under different porosities and suggested the seepage characteristics of fractured sandstone were closely related to grain size, load level, and pore structure, and that the no-Darcy coefficient increased with the decrease of porosity with local fluctuations. Pradip et al. [32] analyzed the relative effects of the Darcy parameter and non-Darcy parameter on the flow behavior of a convergent osmosis apparatus based on the experimental data of the convergent flow of gravel.
The transformation of a fine particle pore medium to a large pore medium does not follow a single fluid state. Rather, this state must be a dynamic process of changing the laminar flow to the turbulent flow. During water inrush, the change in the fluid state in the collapse column does not occur through a single linear seepage mechanism but rather a nonlinear high-speed seepage process.
2.2. Establishment of Each Flow Field in the Collapse Column Model
2.2.1. Darcy Laminar Flow of Aquifer
The seepage flow rate per unit time through porous media is inversely proportional to the length of seepage path, and is proportional to the cross-sectional area of water flow. This kind of flow is Darcy flow. In the aquifer below the water-separating band, a large amount of water moves in the pores and fissures of the relatively homogeneous rocks. Generally, the velocity of fluid is relatively small, whilst its resistance is mainly liquid viscous. The seepage follows a laminar flow whilst the flow state of the fluid generally meets the linear Darcy law, which can be expressed as
where denotes the permeability of the aquifer, denotes the dynamic viscous coefficient of fluid, and denotes the flow pressure in the Darcy aquifer laminar flow.
Based on the flow state and characteristics of fluid, the seepage continuity equation of the aquifer Darcy flow can be expressed as in [33]
where denotes porosity, t denotes time, denotes the source item, and denotes water density.
2.2.2. Non-Darcy Forchheimer Flow of the Collapse Column
The fluid state in the fractured zone differs from that in the aquifer. When the groundwater has a high penetration rate, the Reynolds number exceeds a certain limit and the groundwater movement begins to deviate from the Darcy law. At this time, the traditional Darcy law is no longer applicable to the complex flow state of fluid in the fractured zone. The non-Darcy effect has a great influence on the velocity of the fluid, which changes the velocity of the fluid and then affects the flow rate per unit time. The traditional Forchheimer empirical formula can then be revised as in [34,35]
where denotes the fluid velocity vector, denotes flow pressure, denotes permeability, and denotes the inertial factor that is correlated to the permeability and porosity of rocks and is computed as [33].
Under steady state conditions, the continuity equation of fluid can be described as
Substituting Equation (3) into Equation (4) yields the following equation:
According to the law of conservation of mass, the differential expression of velocity can be obtained when the element has no source term and sink term and the porosity does not change. We take the velocity term of non-Darcy flow into the continuity equation, and the rule of pressure change can be obtained by the numerical method.
2.2.3. Navier–Stokes Turbulent Flow in the Laneway
The Navier–Stokes equation is derived based on Newton’s second law. It focuses on the description of the fluid flow under conditions of its own gravity, the inertial force, and the viscous resistance. It has been widely used in pipe seepage, river seepage, and roadway ventilation. The Navier–Stokes equation is a motion equation in fluid mechanics that describes the momentum conservation of viscous and incompressible fluids. The running groundwater in the laneway has a turbulent state of fluid that can be described by using the Navier–Stokes equation. The vector form of this turbulent flow can be expressed as [36]
where denotes pressure, denotes external force and denotes the velocity at moment t.
The general continuity equation in the laneway can be expressed as:
2.2.4. Transition Boundary Conditions of the Aquifer, Collapse Column, and Laneway
The velocity and pressure of fluid continuously change as the groundwater flows from the aquifer to the laneway through the collapse column. Therefore, two conditions must be satisfied when the fluid passes through the boundary of two adjacent flow fields.
On the one hand, on the adjacent boundaries of the aquifer and collapse column, the velocity and pressure continuities must satisfy
On the other hand, on the adjacent boundaries of the collapse column and laneway, the velocity continuity and pressure continuities must satisfy
3. Seepage Model of the Karst Collapse Column
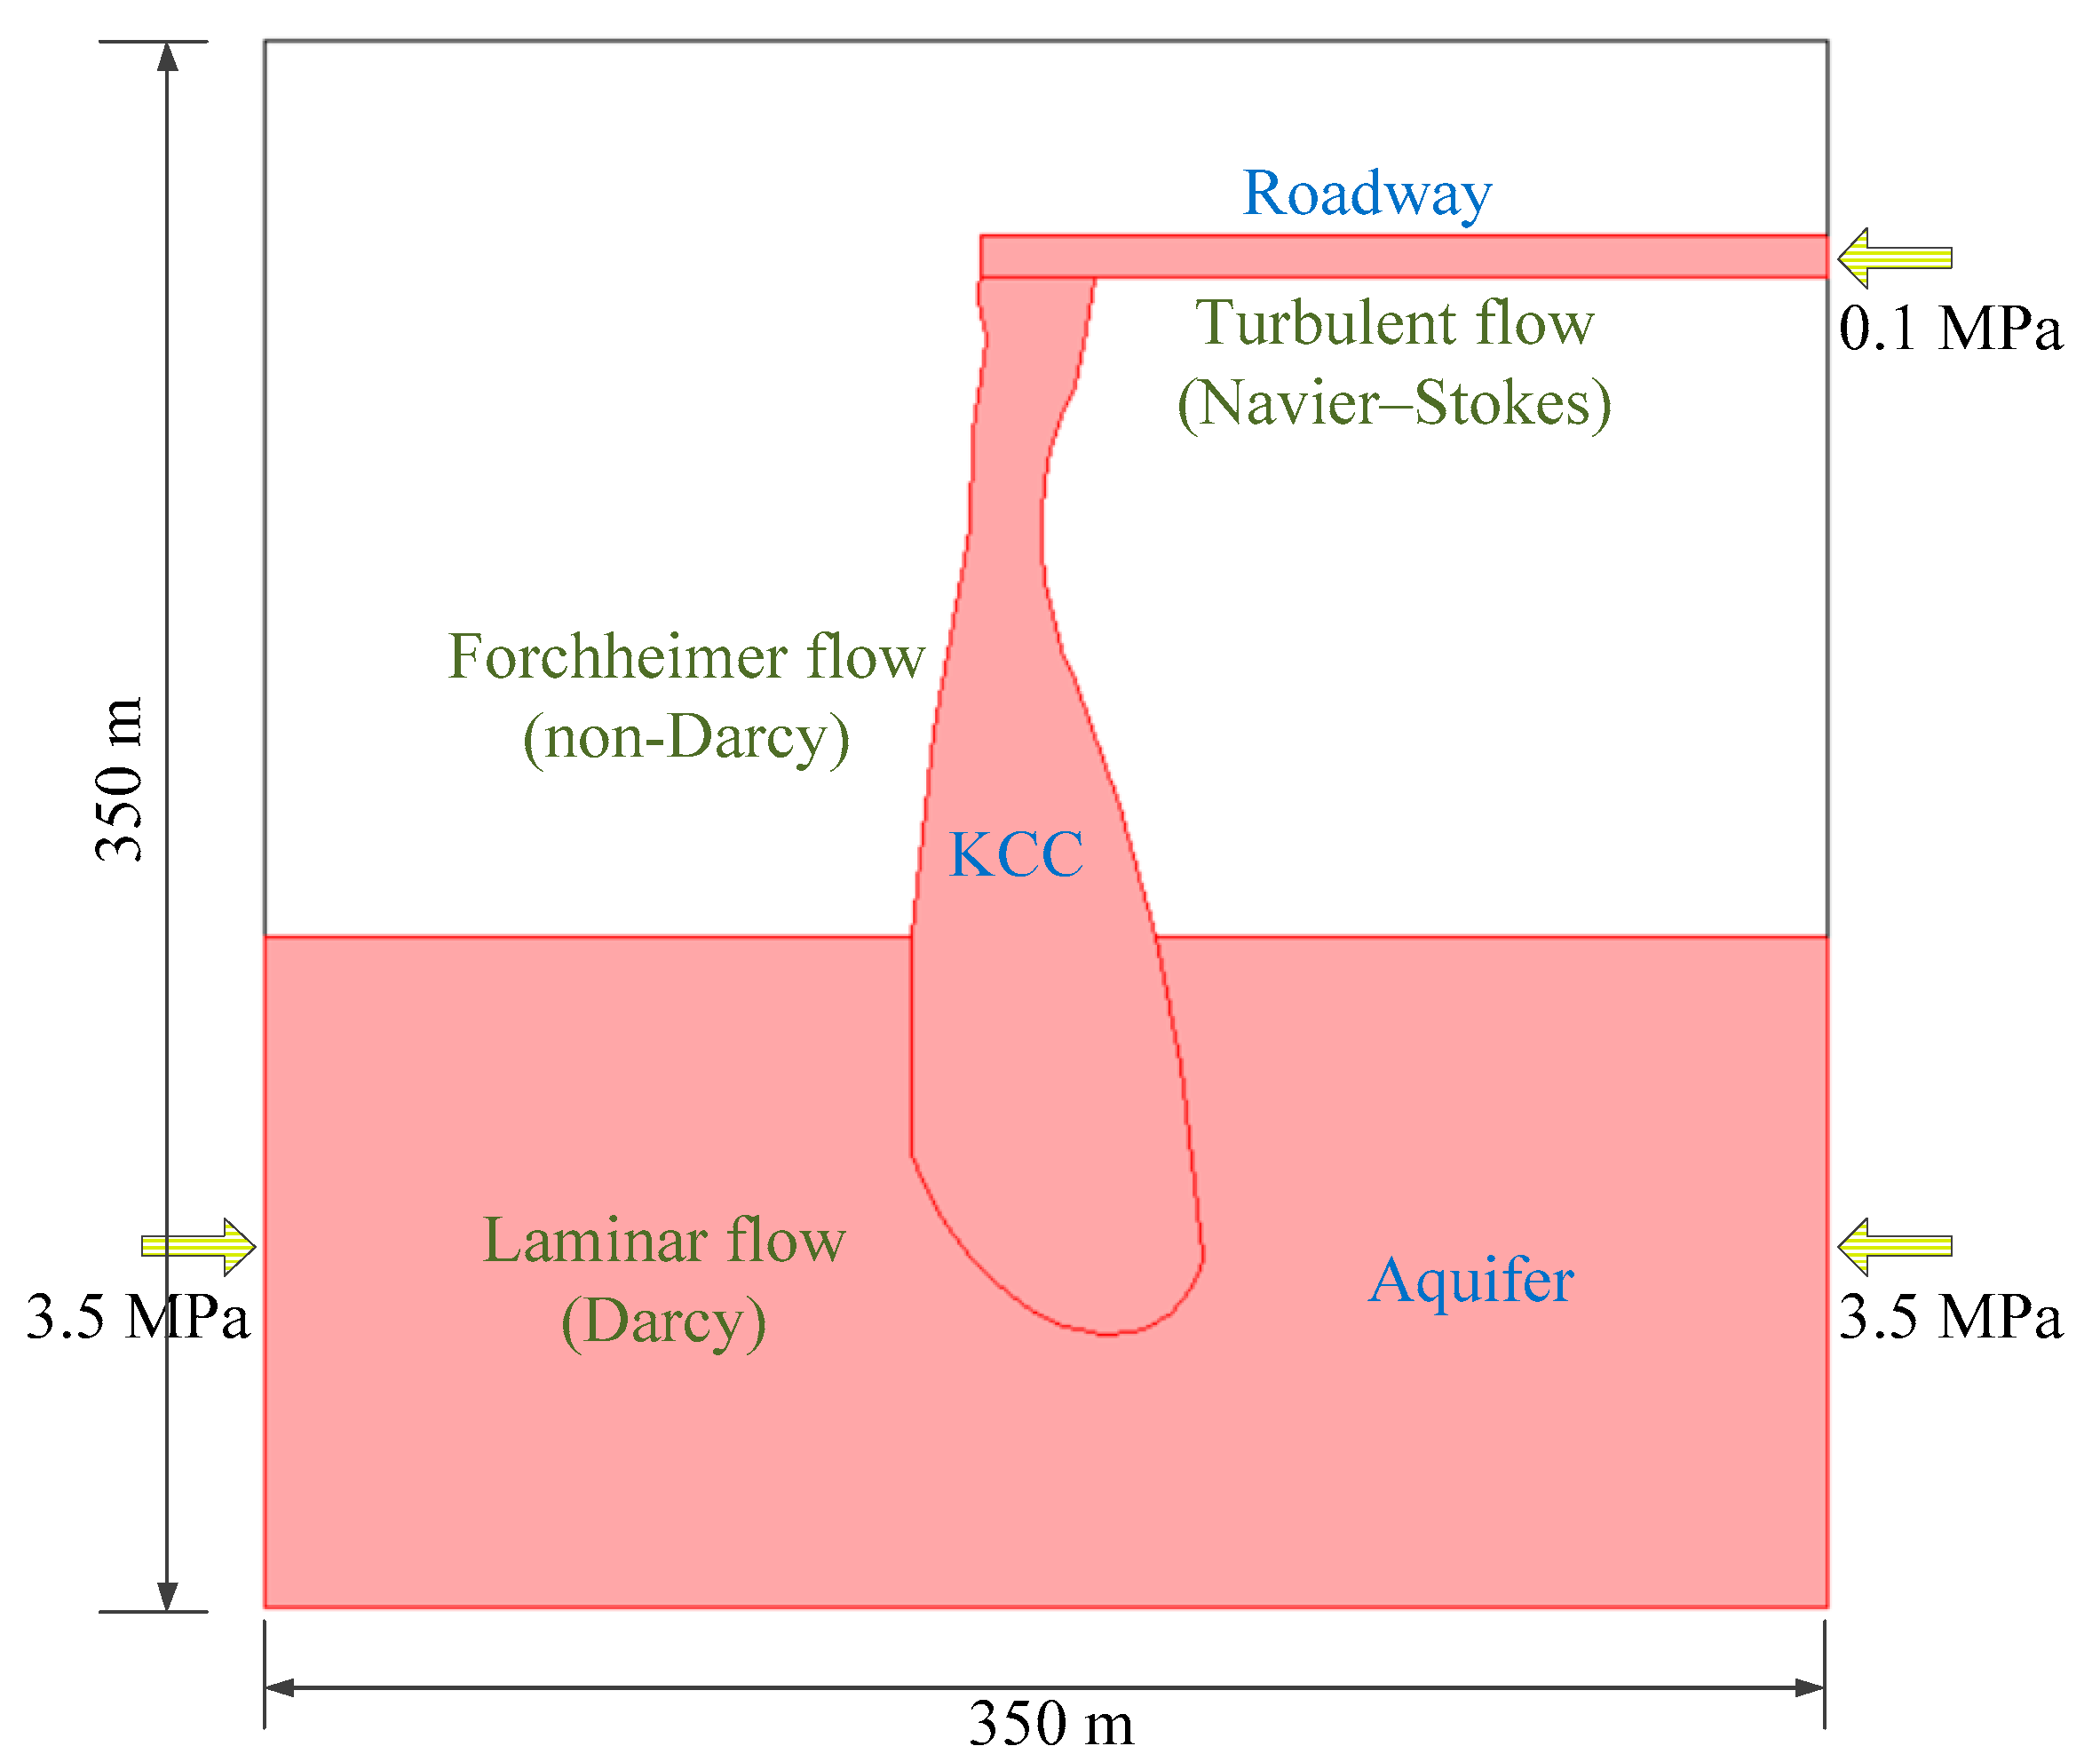
Figure 2 presents a simplified 2D water inrush numerical model that is established based on the geological characteristics of the karst collapse column (KCC), the aquifer, and the 8203 working faces of the Jin Zhuang Mine (China Datong Coal Mine Group) [37,38]. The aquifer is located at 150 m below the roadway, and the thickness of aquifer is 150 m. During excavation, the working face is connected with the karst collapse column of Ordovician limestone. Because of the good water conductivity of the collapse column, the water in the aquifer flows through the collapse column and finally flows into the roadway, causing the water inrush accident. From the observation of drill core, it was found that most of the fillers of the collapse column had been weathered and softened, and the porosity was large.
This model has a length of 350 m and thickness of 350 m. The aquifer is 145 m high, the collapse column is 295 m long and 60 m wide, and the laneway is 190 m long and 10 m wide. The boundary of the bottom aquifer is treated as the boundary of water pressure that can bear 3.5 MPa water pressure, whilst the boundary of the outlet of the upper laneway is treated as the boundary of fluid pressure, which is equal to atmospheric pressure. Although the water inrush of collapse column is a three-dimensional process, the numerical simulation regards the collapse column as a water-filled body, and ignores the collapse process of the column. We mainly study the influence of confined water pressure on the seepage characteristics. Therefore, it should be reasonable to simplify the whole process of water inrush into the 2D plane strain problem.
The bottom area of the model represents the underground aquifer, the middle area represents the collapse column area formed by rock fracture, the upper right area represents the laneway, and the rest of the model represents the rock surrounding the water-separating layer. COMSOL Multiphysics is a powerful nonlinear partial differential equation solver based on finite element method (FEM), which contains different kinds of modules, i.e., the structural mechanics module, chemical engineering module, heat transfer module, earth science module, radio frequency module, micro electro mechanical system module, and acoustics module.
After the completion of the geometric model, we choose different seepage modules in the software for the three respective regions. The Darcy aquifer laminar flow field, the Forchheimer flow in the collapse column, and the Navier–Stokes turbulent flow in the laneway are adopted to examine the evolution of water inrush from the collapse column. A continuous boundary condition is set up in the connection area of the two regions. Assuming that both the density and viscosity of the fluid are constants, the flow is a steady process. After applying the boundary conditions, three different seepage fields of the model are solved by software. The results obtained in this paper are all steady-state results. The velocity and pressure fields can be considered constant in time. The parameters of the model are derived from literature [37,38], shown in Table 1.
4. Analysis and Discussion
4.1. Features of Water Inrush from the Collapse Column
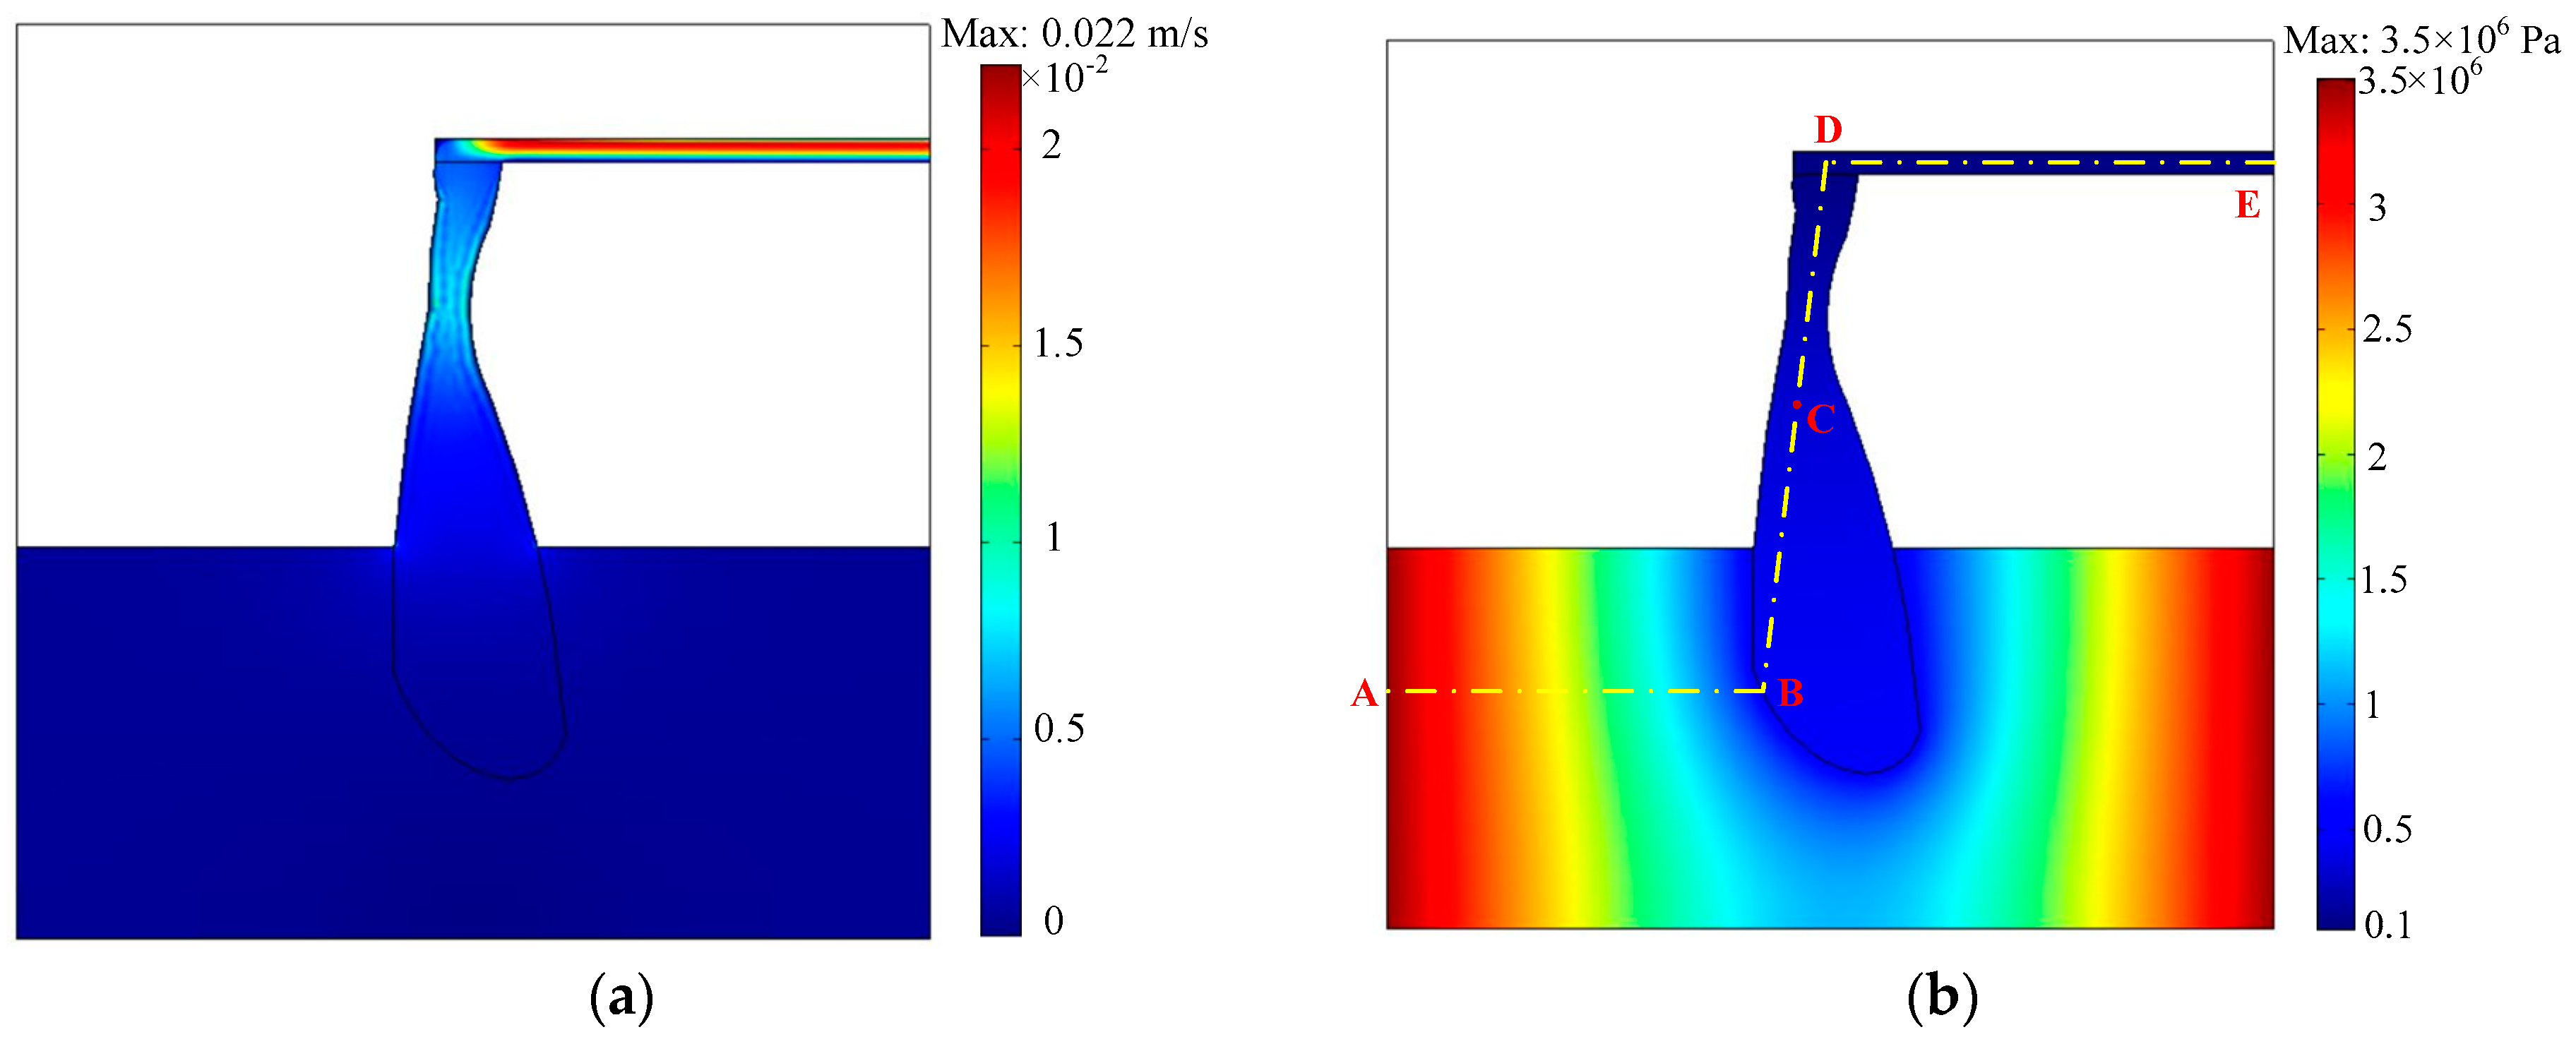
Figure 3 shows the flow velocity and pressure distribution of fluid in the water inrush process. When a water inrush disaster occurs after the laneway passes through collapse column, the confined water in the underground aquifer flows through the collapse column before flowing into the laneway of the mining face at high speed. The simulation results for the water inrush from the collapse column reveal that both velocity and pressure distribution continuously change in three basins. The large variation in the velocity gradient is mainly concentrated in the turbulence area of the laneway and the non-Darcy seepage area of the KCC. Meanwhile, the variation in pressure gradient is mainly concentrated in the Darcy area of the aquifer, thereby suggesting that the water flow reaches its maximum seepage resistance in the Darcy area. The traditional Darcy law does not meet the fluid change in the collapse column of the fractured zone. If the Darcy equation is applied in the whole area, then the nonlinear water inrush flow cannot be described. In the flow process, the fluid pressure of the collapse column gradually transforms to fluid power and the high-pressure water in the collapse column flows out. Therefore, the pressure at the boundary between the collapse column and aquifer gradually decreases. Given the relationship between the laneway and external atmospheric pressure, the pressure gradually reduces upon entering the laneway and eventually becomes equal to the external atmospheric pressure (0.1 MPa). The KCC is shaped similarly to a stopper, with its bottom area wider than its top. A narrower KCC channel corresponds to a higher fluid flow velocity and the maximum velocity is observed in the narrowest part of the channel.
4.2. Influence of the Permeability of the Collapse Column on the Seepage Process
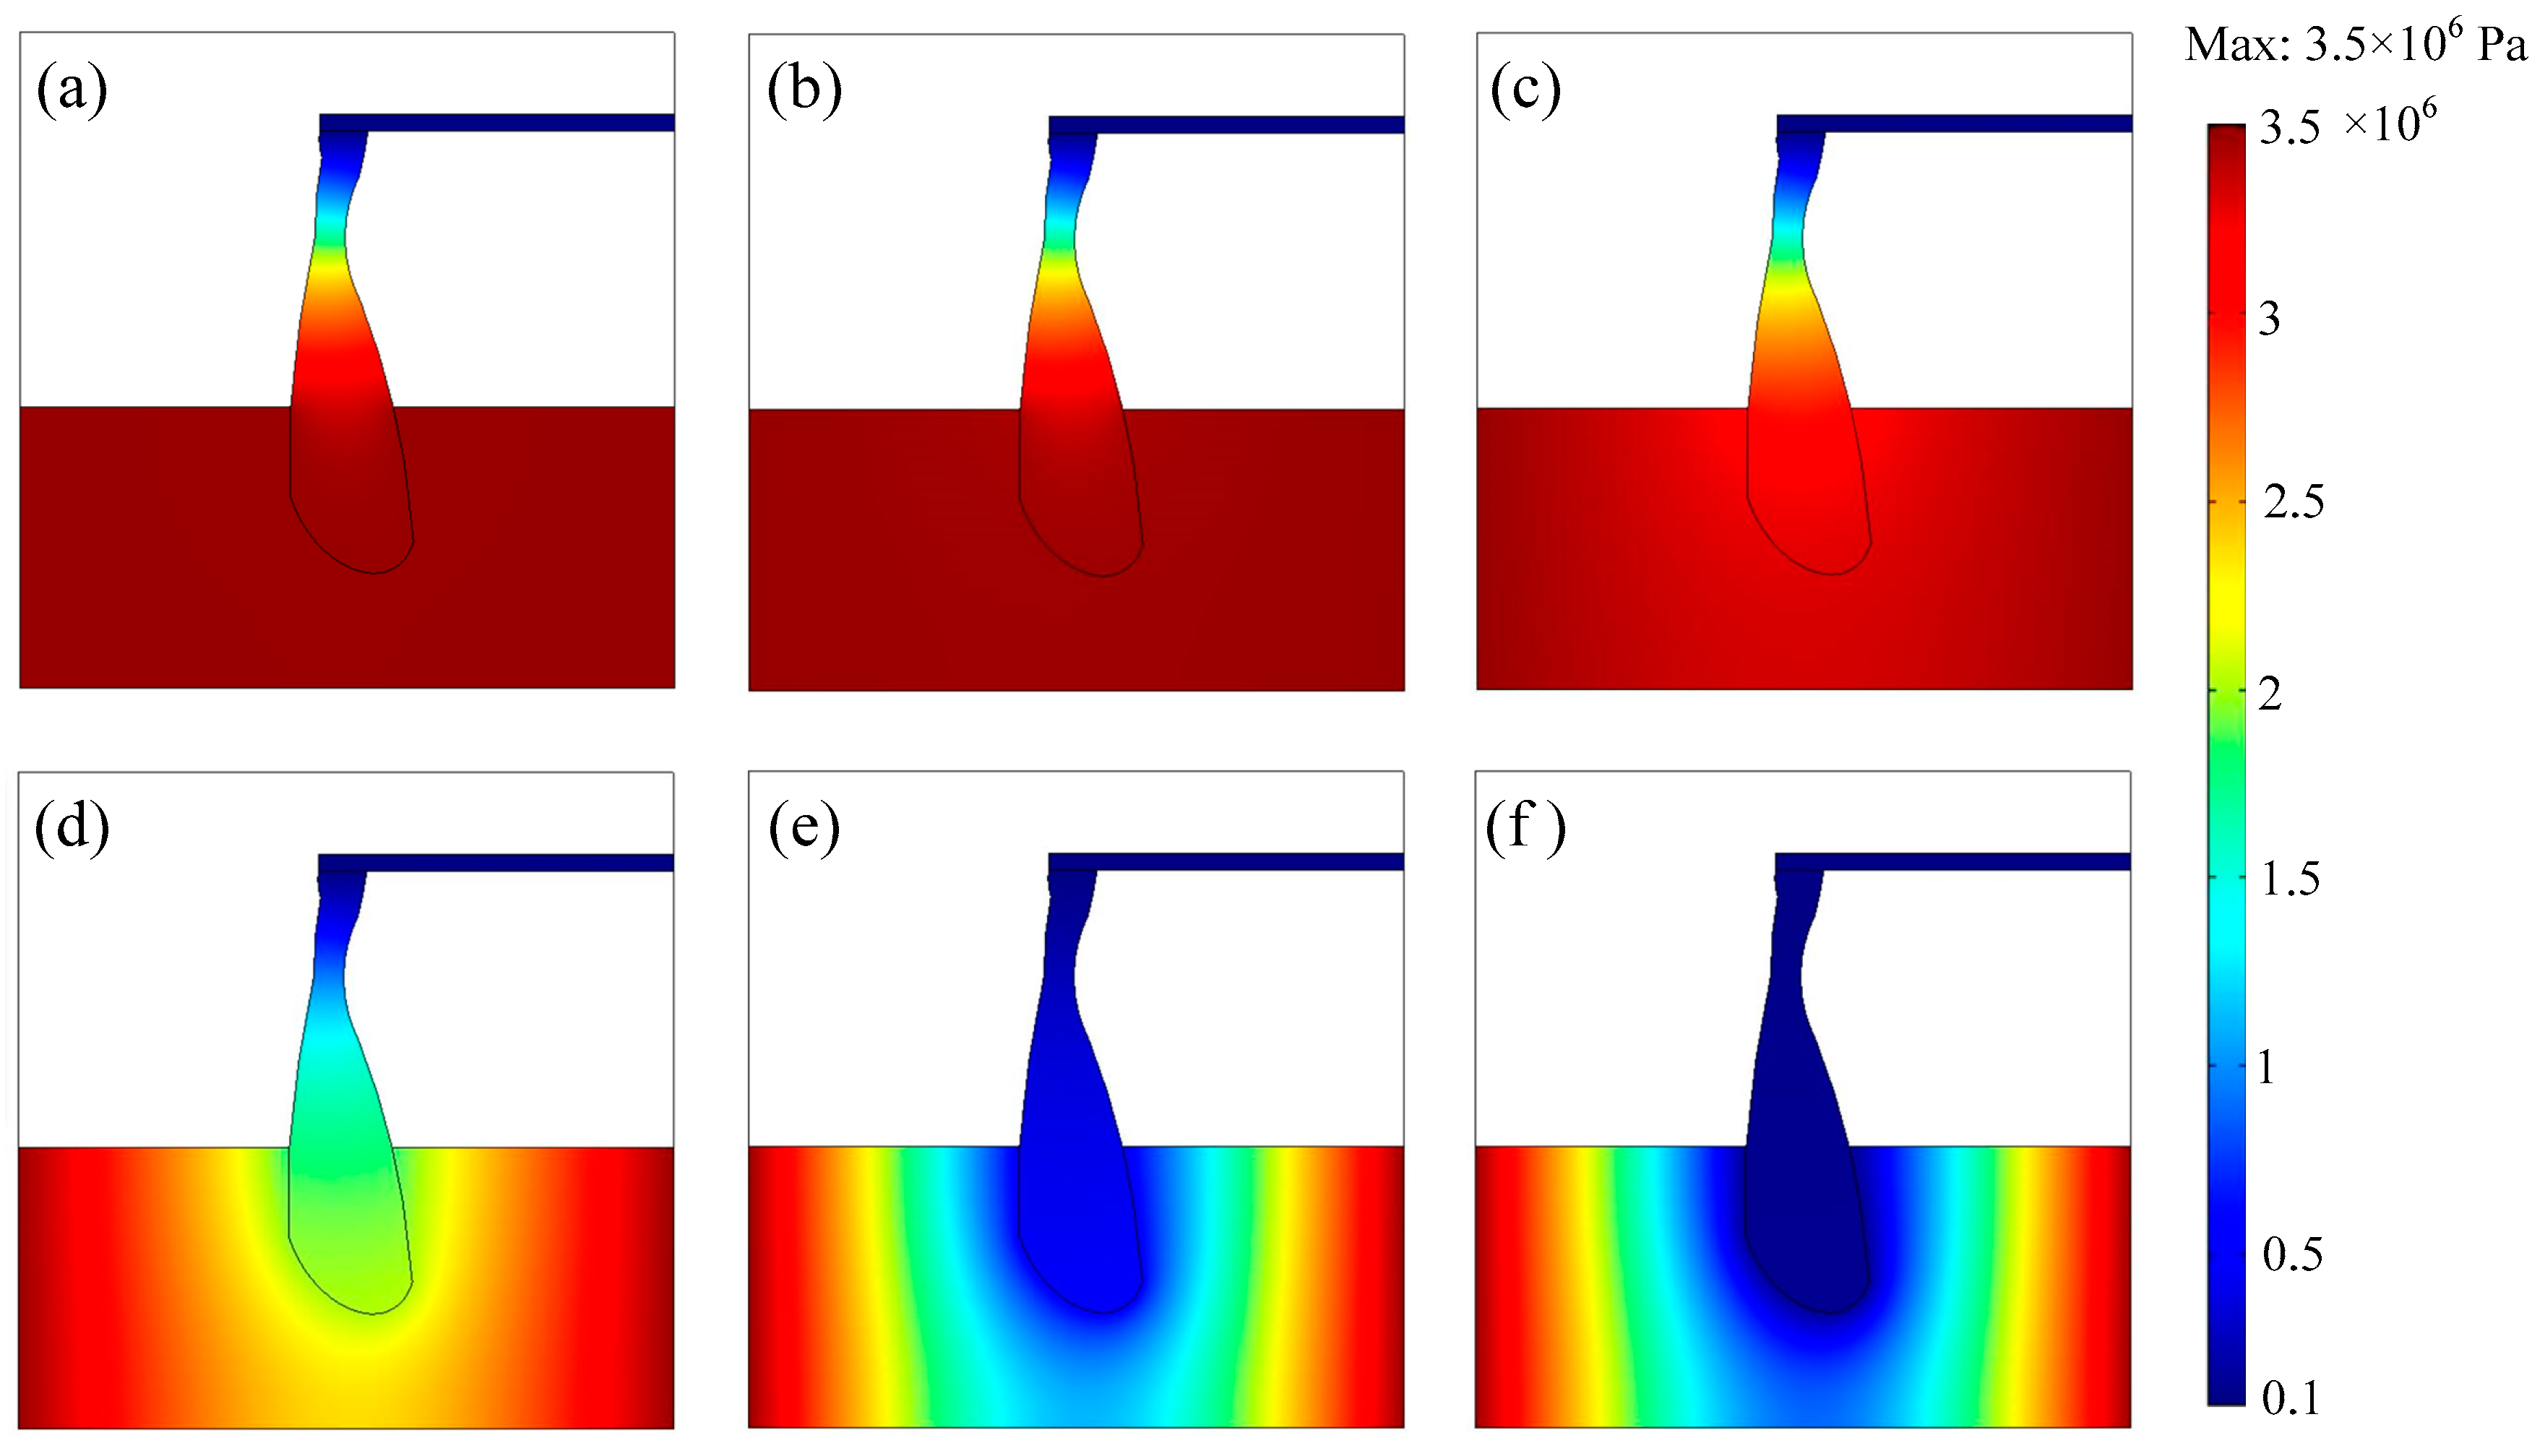
To study the increase in the permeability of the collapse column, the flow behavior of water inrush is defined as the ratio of the permeability of the collapse column kf to the permeability of aquifer kd, . In the following calculation, the column permeability kf is changed, while the permeability of the aquifer kd maintains constant (1.9 × 10⁻¹¹ m2). By changing the value of or kf, that is, the ratio of the permeability of the collapse column to that of the aquifer, the flow pressure distribution cloud chart of the Darcy–Forchheimer field is obtained as shown in Figure 4.
When the value of increases, the flow pressure in the collapse column reduces and the fluid velocity significantly changes. The collapse column that is used as an aquifer seepage is transferred to the middle of the free flow interface of the laneway, where the permeability of the collapse column plays a critical role.
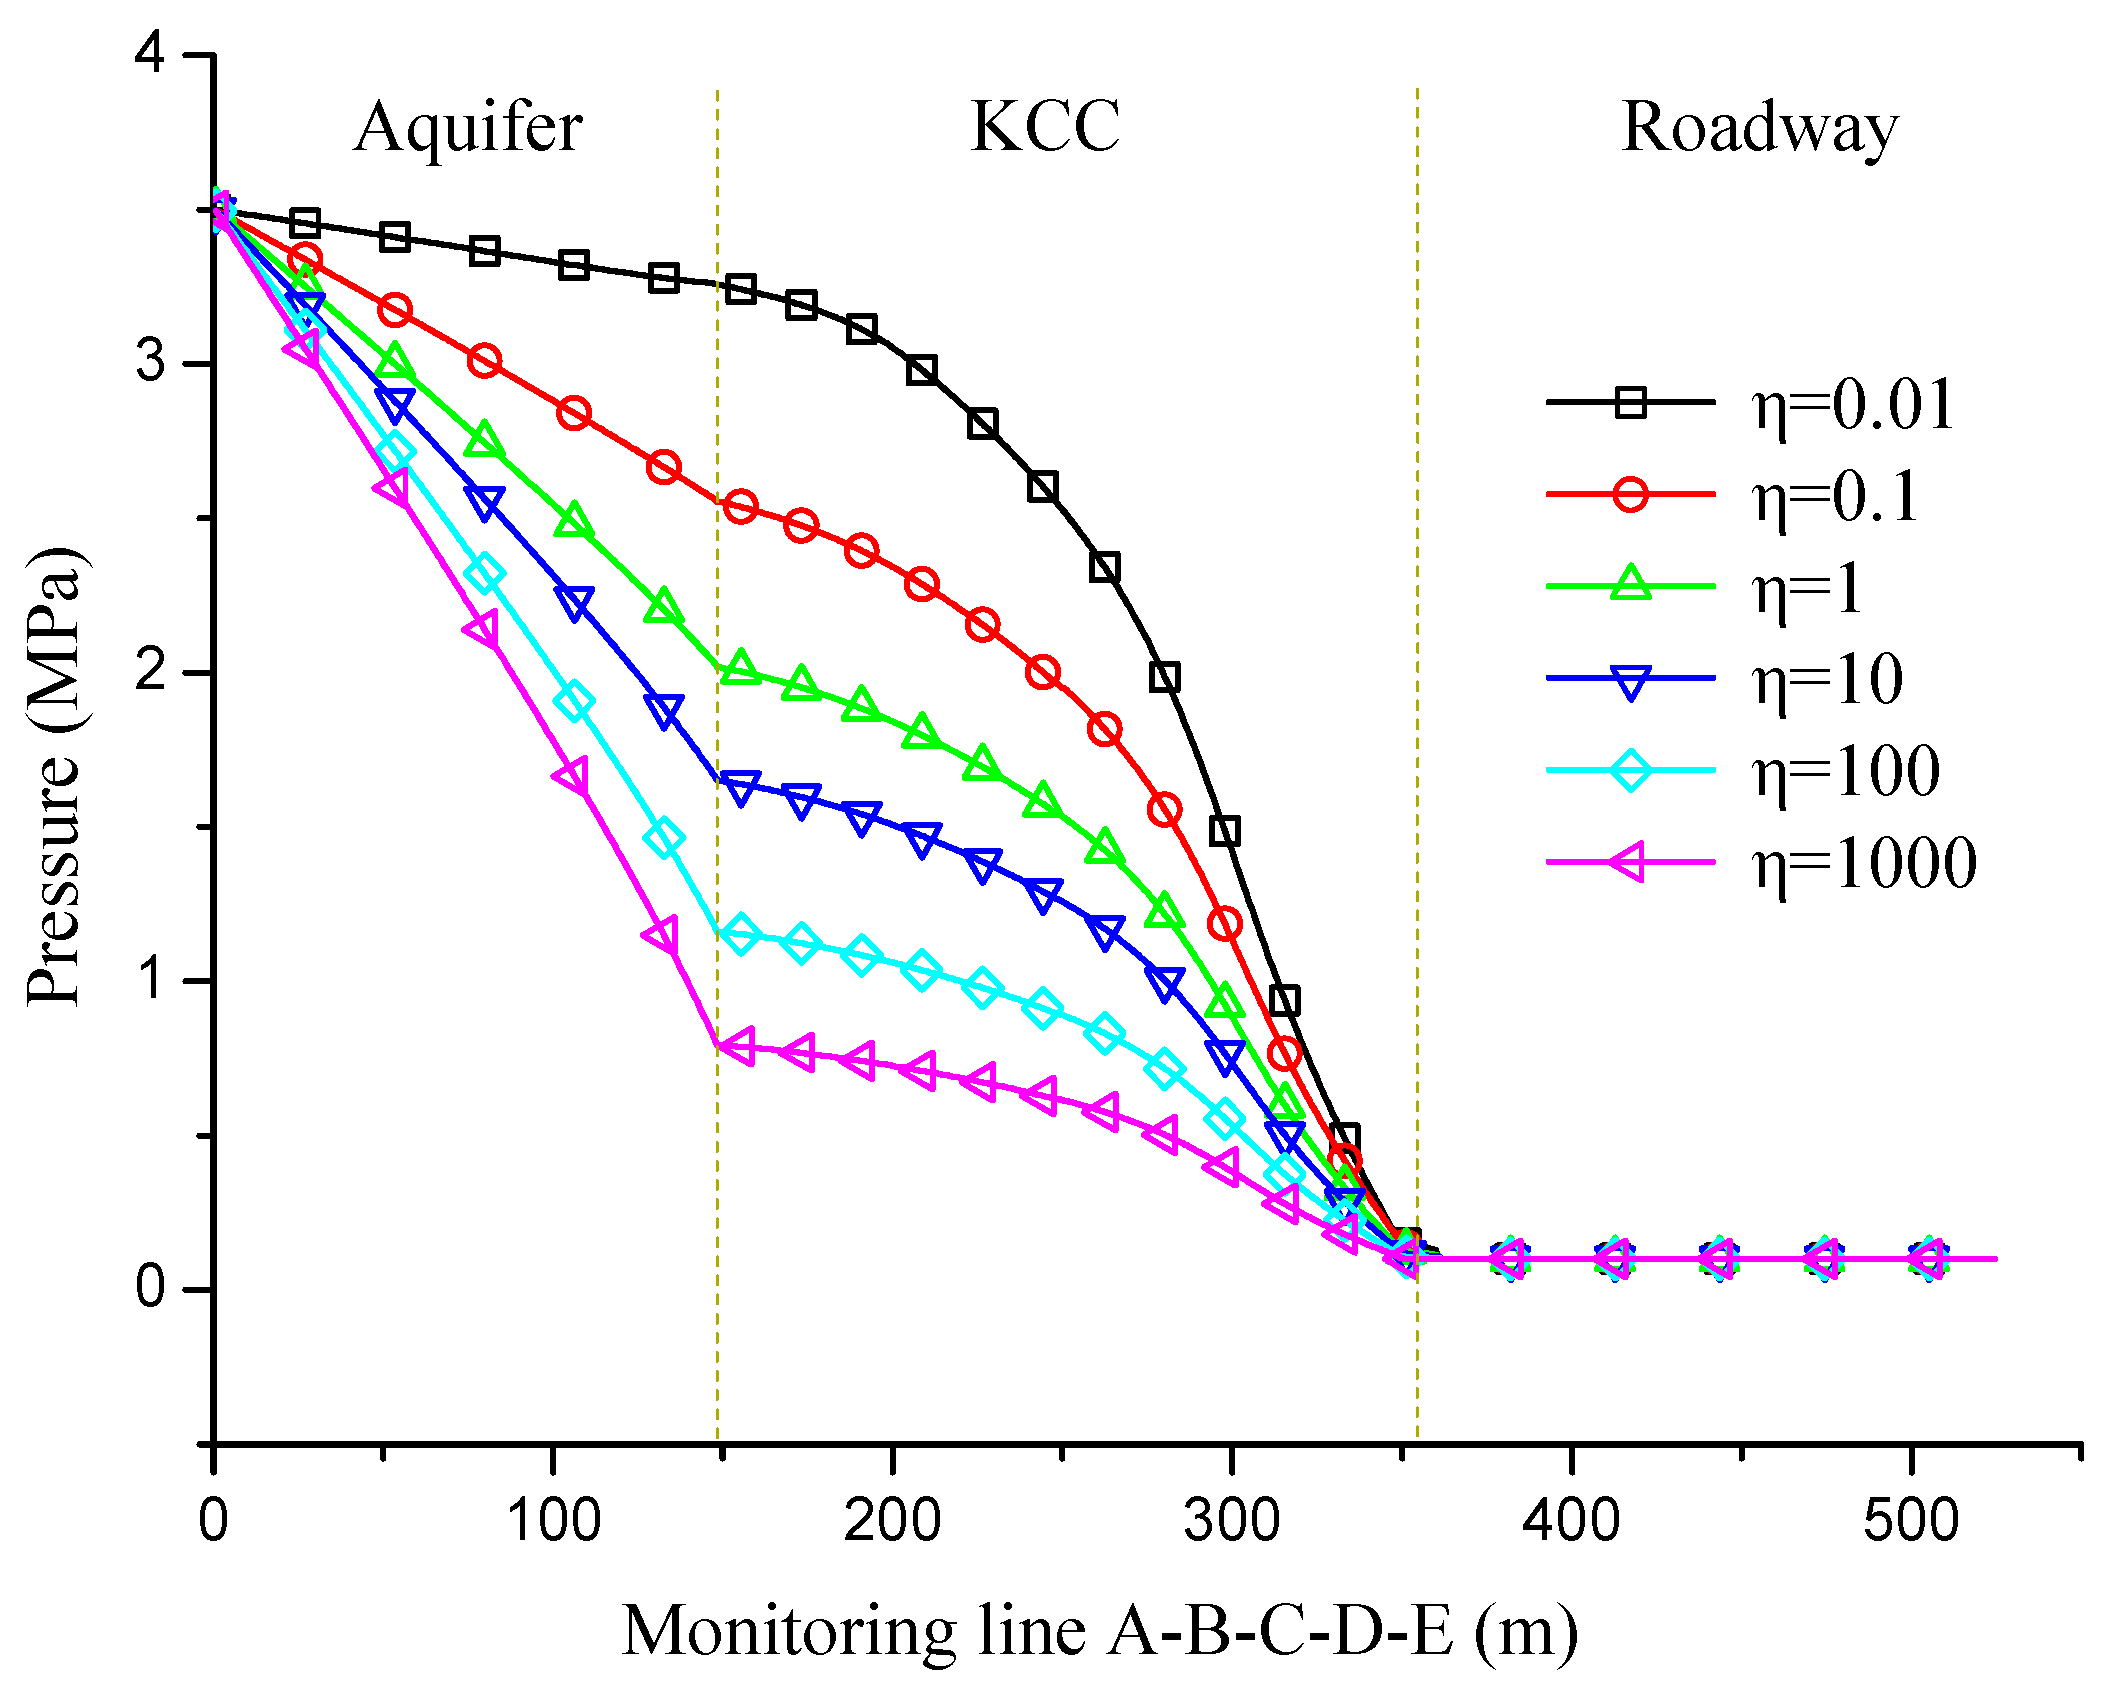
To study the water inrush from the collapse column, we select the monitoring line A-B-C-D-E (Figure 3) and analyze the pressure and velocity distribution on the detection line as shown in Figure 5 and Figure 6. The coordinates of each point are distributed as A: (0,90), B: (150,90), C: (162,205), D: (175,300) and E: (350,300). The parameters along the line A-B-C-D-E were detected at each finite element unit based on the mesh of finite element model. The number of units is much greater than that of markers in the figures to ensure the accuracy of data.
The pressure value constantly changes throughout the entire water inrush process. The initial pressure value is set to 3.5 MPa, which starts to decrease when the groundwater approaches the collapse column layer. Such a reduction can be explained by the fact that the Darcy aquifer is generally dominated by fluid pressure. At this time, the viscous resistance of fluid becomes dominant and the inertia force is ignored. The shear action of the fluid gradually changes when the groundwater enters the collapse column layer. The energy consumption cannot be ignored by the shear action, which becomes the combined action of viscous resistance and inertia force. After entering the laneway, the pressure gradually becomes stable and reaches close to 0.1 MPa atmospheric pressure.
The variation in the value of highlights the influence of permeability on pressure distribution under different working conditions. A smaller and a lower collapse column permeability correspond to a greater pressure decay of the collapse column. The pressure decrease in the aquifer becomes increasingly apparent as the column permeability increases. Meanwhile, a larger corresponds to a lower pressure value in collapse column. When = 1000, the maximum water pressure of the collapse column reduces to 0.79 MPa, which is far lower than the maximum pressure at = 0.01 (3.25 MPa). The boundary conditions of the flow fields are consistent, but the hydraulic pressure of the aquifer and collapse column is obviously different due to the changes in the permeability of the collapse column. Therefore, permeability plays an important role in pressure distribution during the water inrush process.
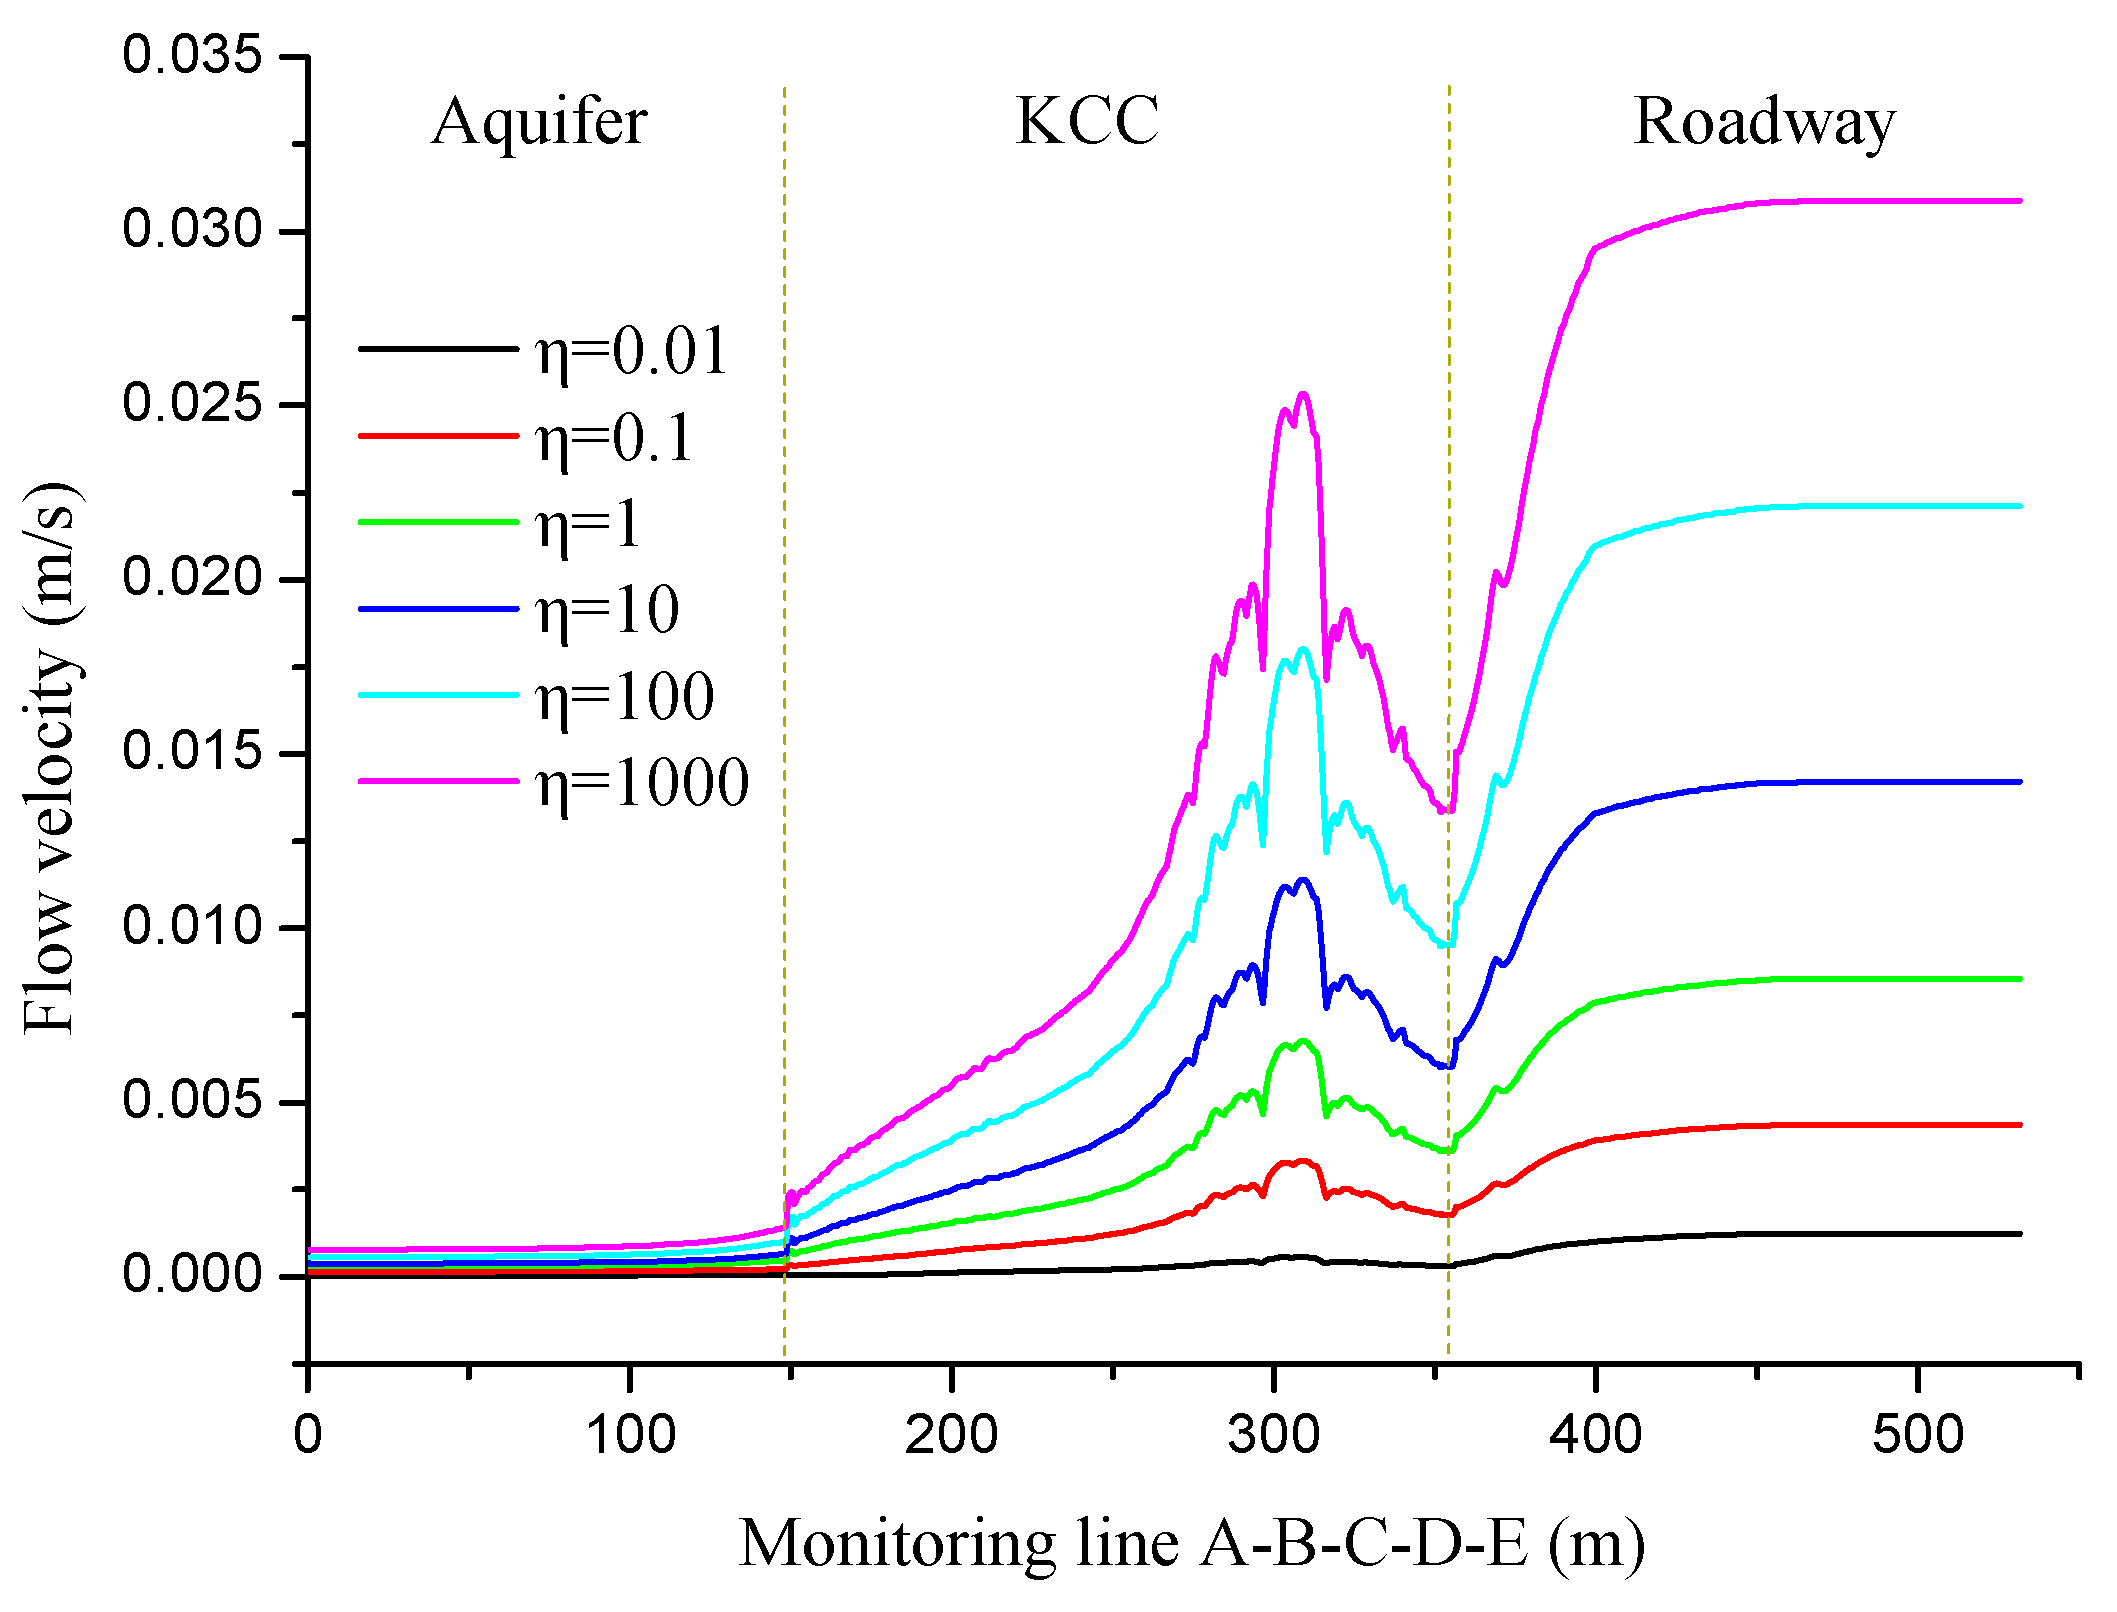
The simulation results in Figure 6 indicate a continuous variation in velocity throughout the water inrush process. The velocity in the aquifer is usually relatively smooth and consistent with the general linear seepage law. The Darcy law is also applicable in this case. After entering the collapse column, we adopt the Forchheimer equation to analyze the fluid flow. Therefore, the flow velocity of the fluid in the collapse column changes drastically. The flow velocity in the collapse column also increases by narrowing the seepage channel in the collapse column. If = 1000, then the maximum velocity in the collapse column is 0.025 m/s. After entering the laneway, the fluid velocity sharply increases and shows a non-linear trend. The difference between the three percolation models can also be seen in Figure 5 and Figure 6. There is a clear difference between fluid pressure and velocity in different regions. If only one seepage model is adopted in the whole water inrush area, a large error will be caused in the calculation results.
4.3. Non-Darcy Effect
In the case of non-Darcy flow, the loss of pressure gradient is caused by the common action of the viscous and inertial forces of fluid. The fluid in the collapse column demonstrates a high-speed nonlinear seepage instead of a simple Darcy laminar flow. Therefore, the non-Darcy effect in the water inrush process must be considered. The Forchheimer coefficient can be formulated as in [33].
Whilst the non-Darcy effect coefficient can be expressed as in [34].
where denotes the fluid density, denotes column permeability, denotes fluid flow velocity, denotes the inertial factor, denotes the dynamic viscous coefficient of fluid, and denotes the non-Darcy effect or the proportion of losses in pressure gradient caused by inertia force.
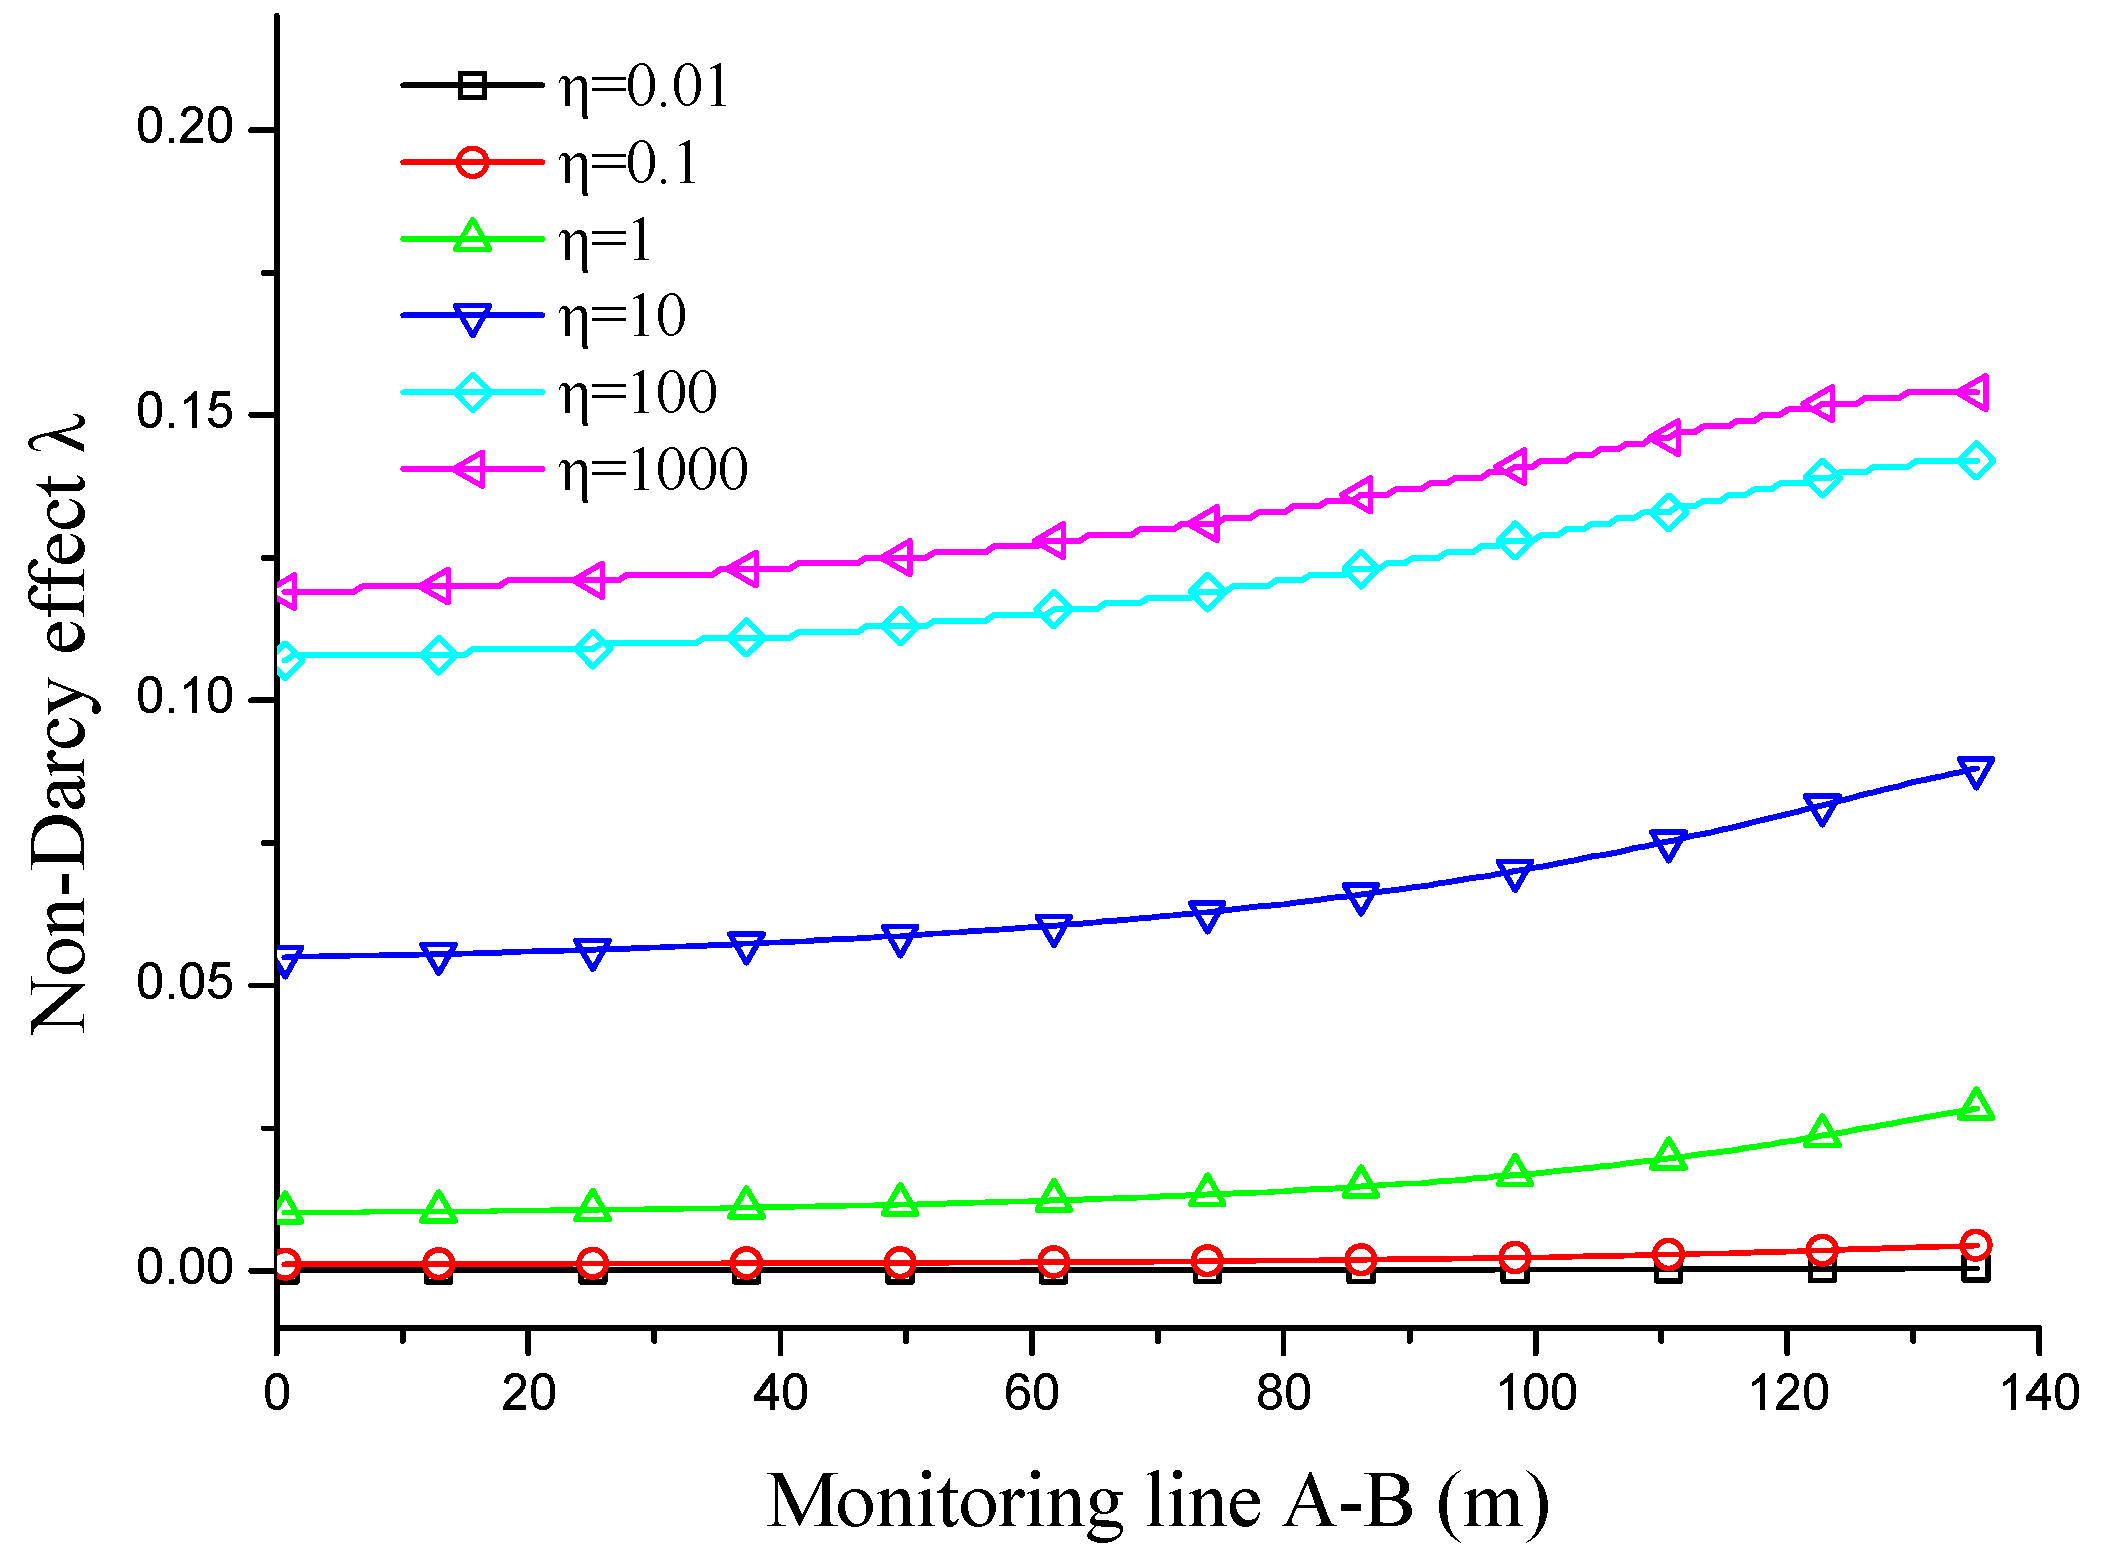
Figure 7 shows the extent of influence of the non-Darcy effect in the aquifer under the influence of the permeability of the collapse column. When constant pressure is applied on the external boundary, the higher permeability of the collapse column corresponds to a higher non-Darcy effect. When the permeability of collapse column changes, it will not only affect the velocity of fluid in collapse column, but also affect the velocity of water flow in aquifer. Because of the connectivity between aquifer and column, the higher permeability of the collapse column corresponds to the higher pressure gradient and water velocity in the aquifer, which will affect the nonlinear behavior of water flow. Therefore, the non-Darcy effect of the fluid becomes more obvious as the column permeability increases. As the permeability of the KCC continues to increase, the flow velocities in the aquifer and the KCC slightly increase. When the permeability of the collapse column is far lower than that of the aquifer, that is, < 1, the non-Darcy effect in the aquifer is very weak and can be ignored. Increasing the value of also improves the influencing degree of the non-Darcy effect. When is equal to 1000, the whole zone of aquifer in the model is almost entirely influenced by the non-Darcy effect.
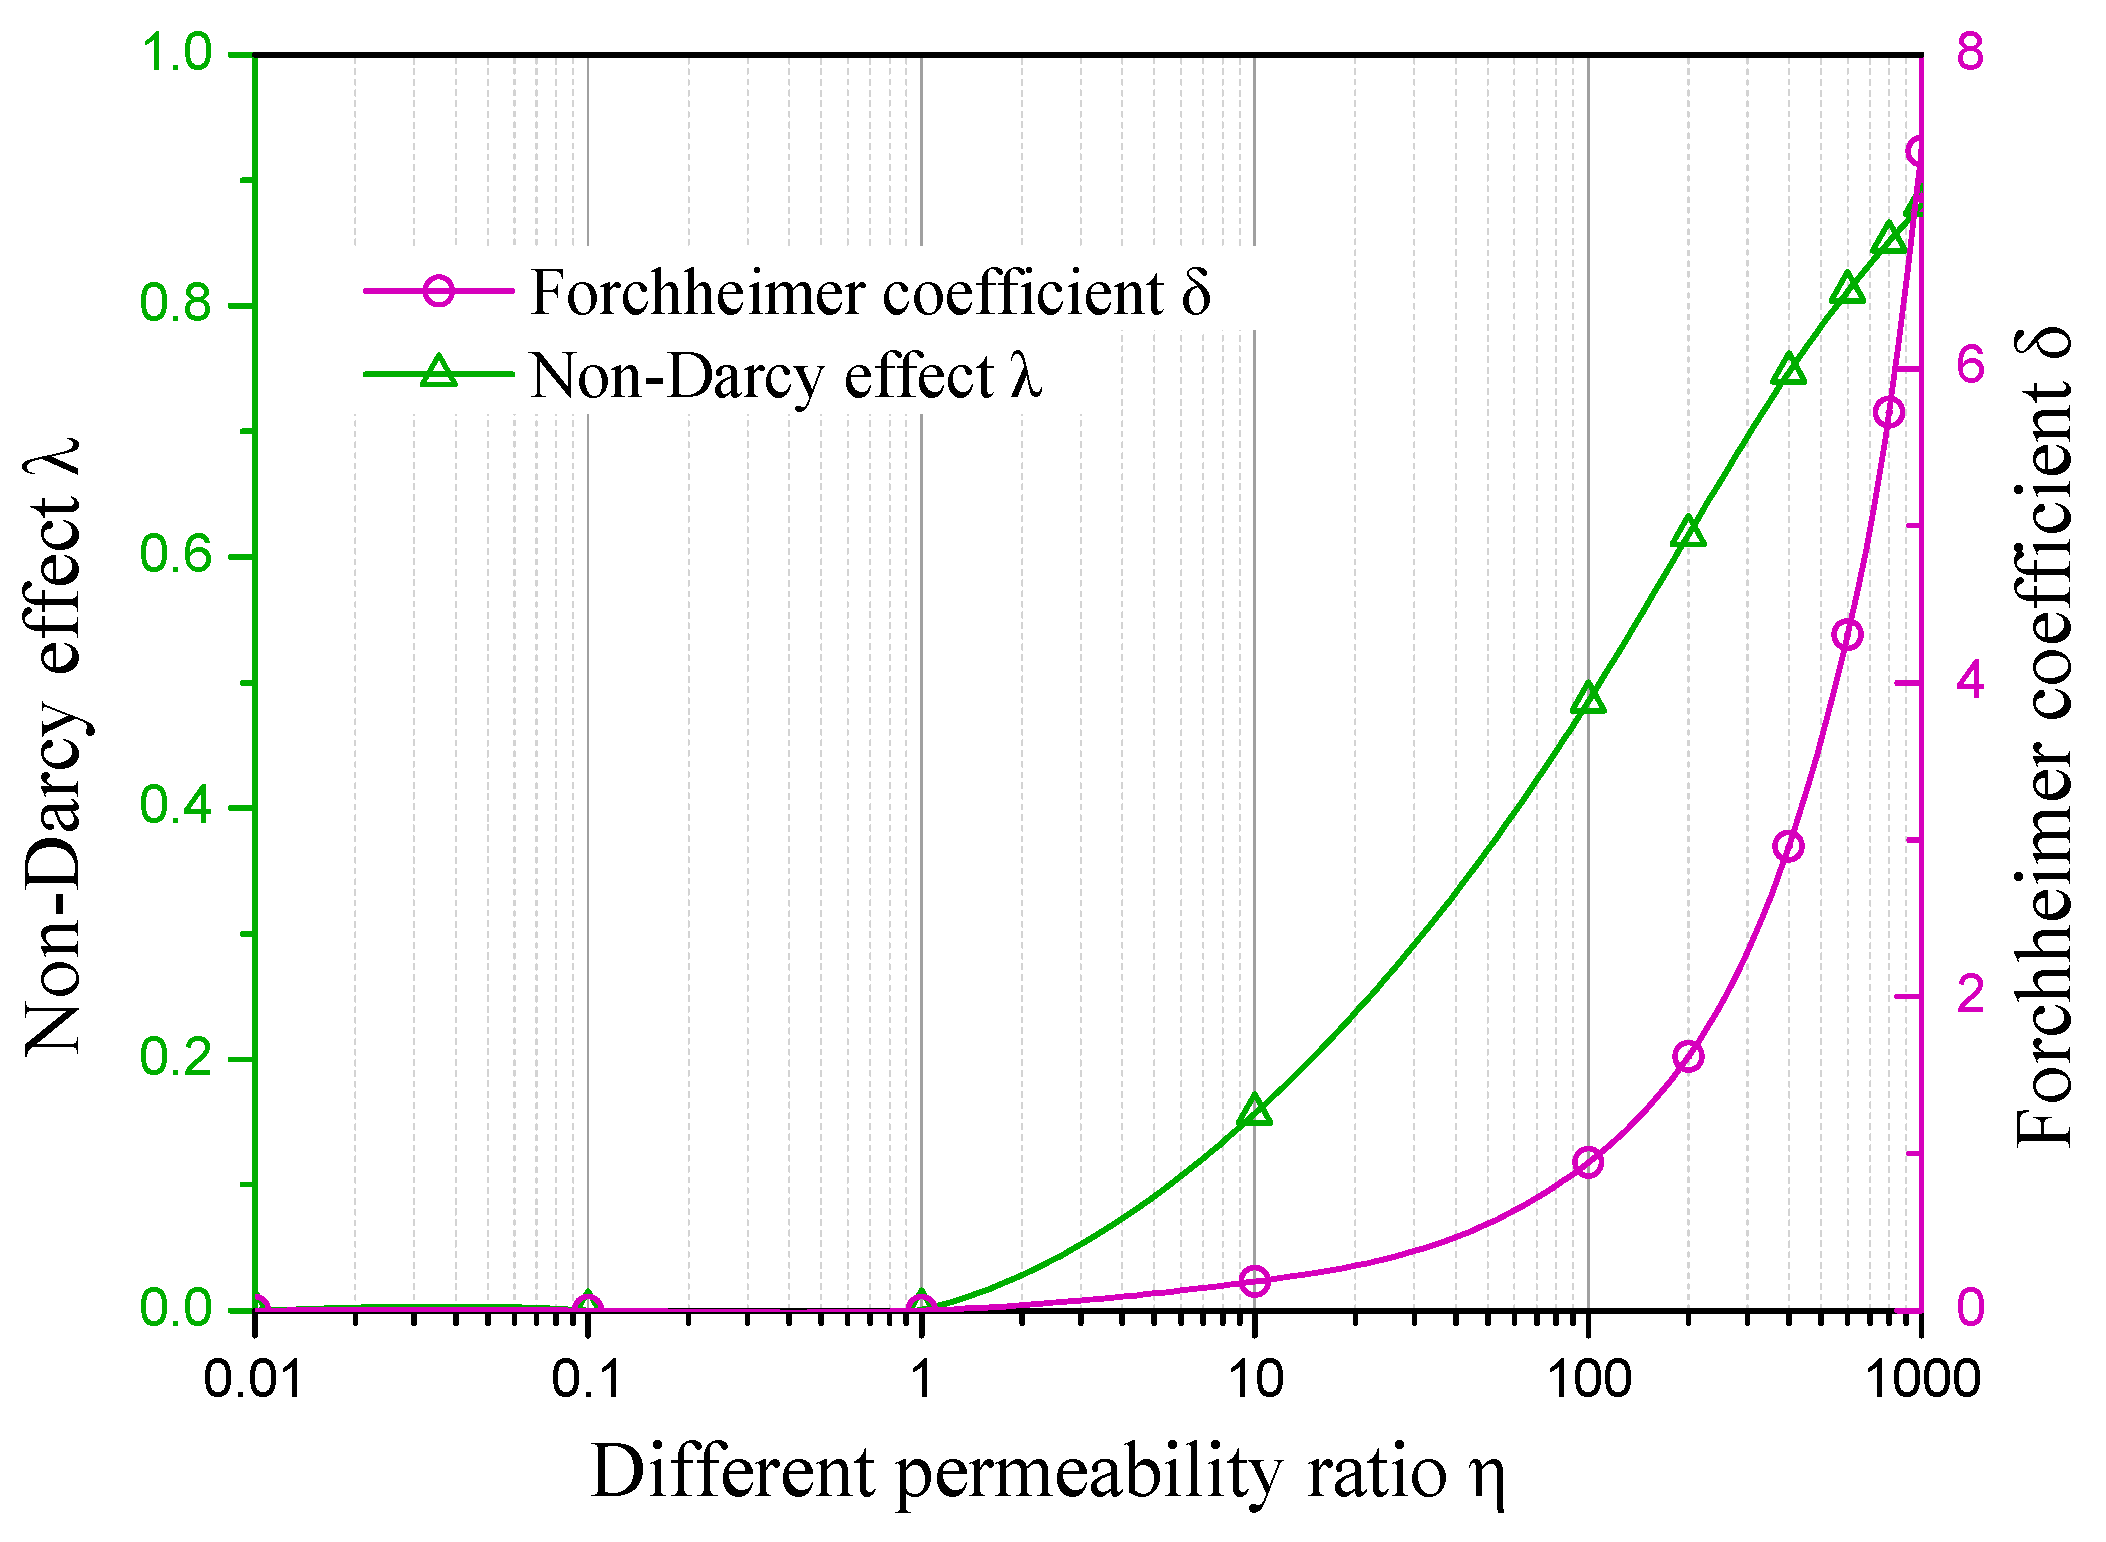
We further analyse the non-Darcy effect in the process of water inrush from the collapse column. Figure 8 shows the Forchheimer coefficients and non-Darcy effects at point C under different permeability ratios. Several flow mechanisms are presented in the Figure. Firstly, when < 1, then the non-Darcy effect is less than 0.1, that is, the non-Darcy effect and existence of inertial resistance in this case are not significant. Meanwhile, the viscous resistance in this case mainly reduces the fluid pressure. Therefore, a Darcy flow is observed. Secondly, if is greater than 1, then the numerical value of the non-Darcy effect shows a substantial increase with the increase of . The inertial resistance and viscous resistance in this case play equally important roles in pressure reduction. The non-Darcy effect cannot be ignored and becomes increasingly intense as the permeability of the collapse column increases. When is close to 400, that is, the permeability of the collapse column layer is 400 times higher than that of the aquifer, the non-Darcy effect is 0.74 and the Forchheimer coefficient is 2.95. In this case, viscous resistance produces a weak influence on the overall pressure drop that can be ignored. Afterward, the inertial resistance begins to dominate and the flow is converted into a high-speed non-Darcy flow. Therefore, the groundwater flow transitions from Darcy flow to high-speed non-Darcy flow. This non-Darcy flow is highly dependent on the permeability of the collapse column that results in groundwater inrush.
4.4. Prediction of Water Inrush Volume
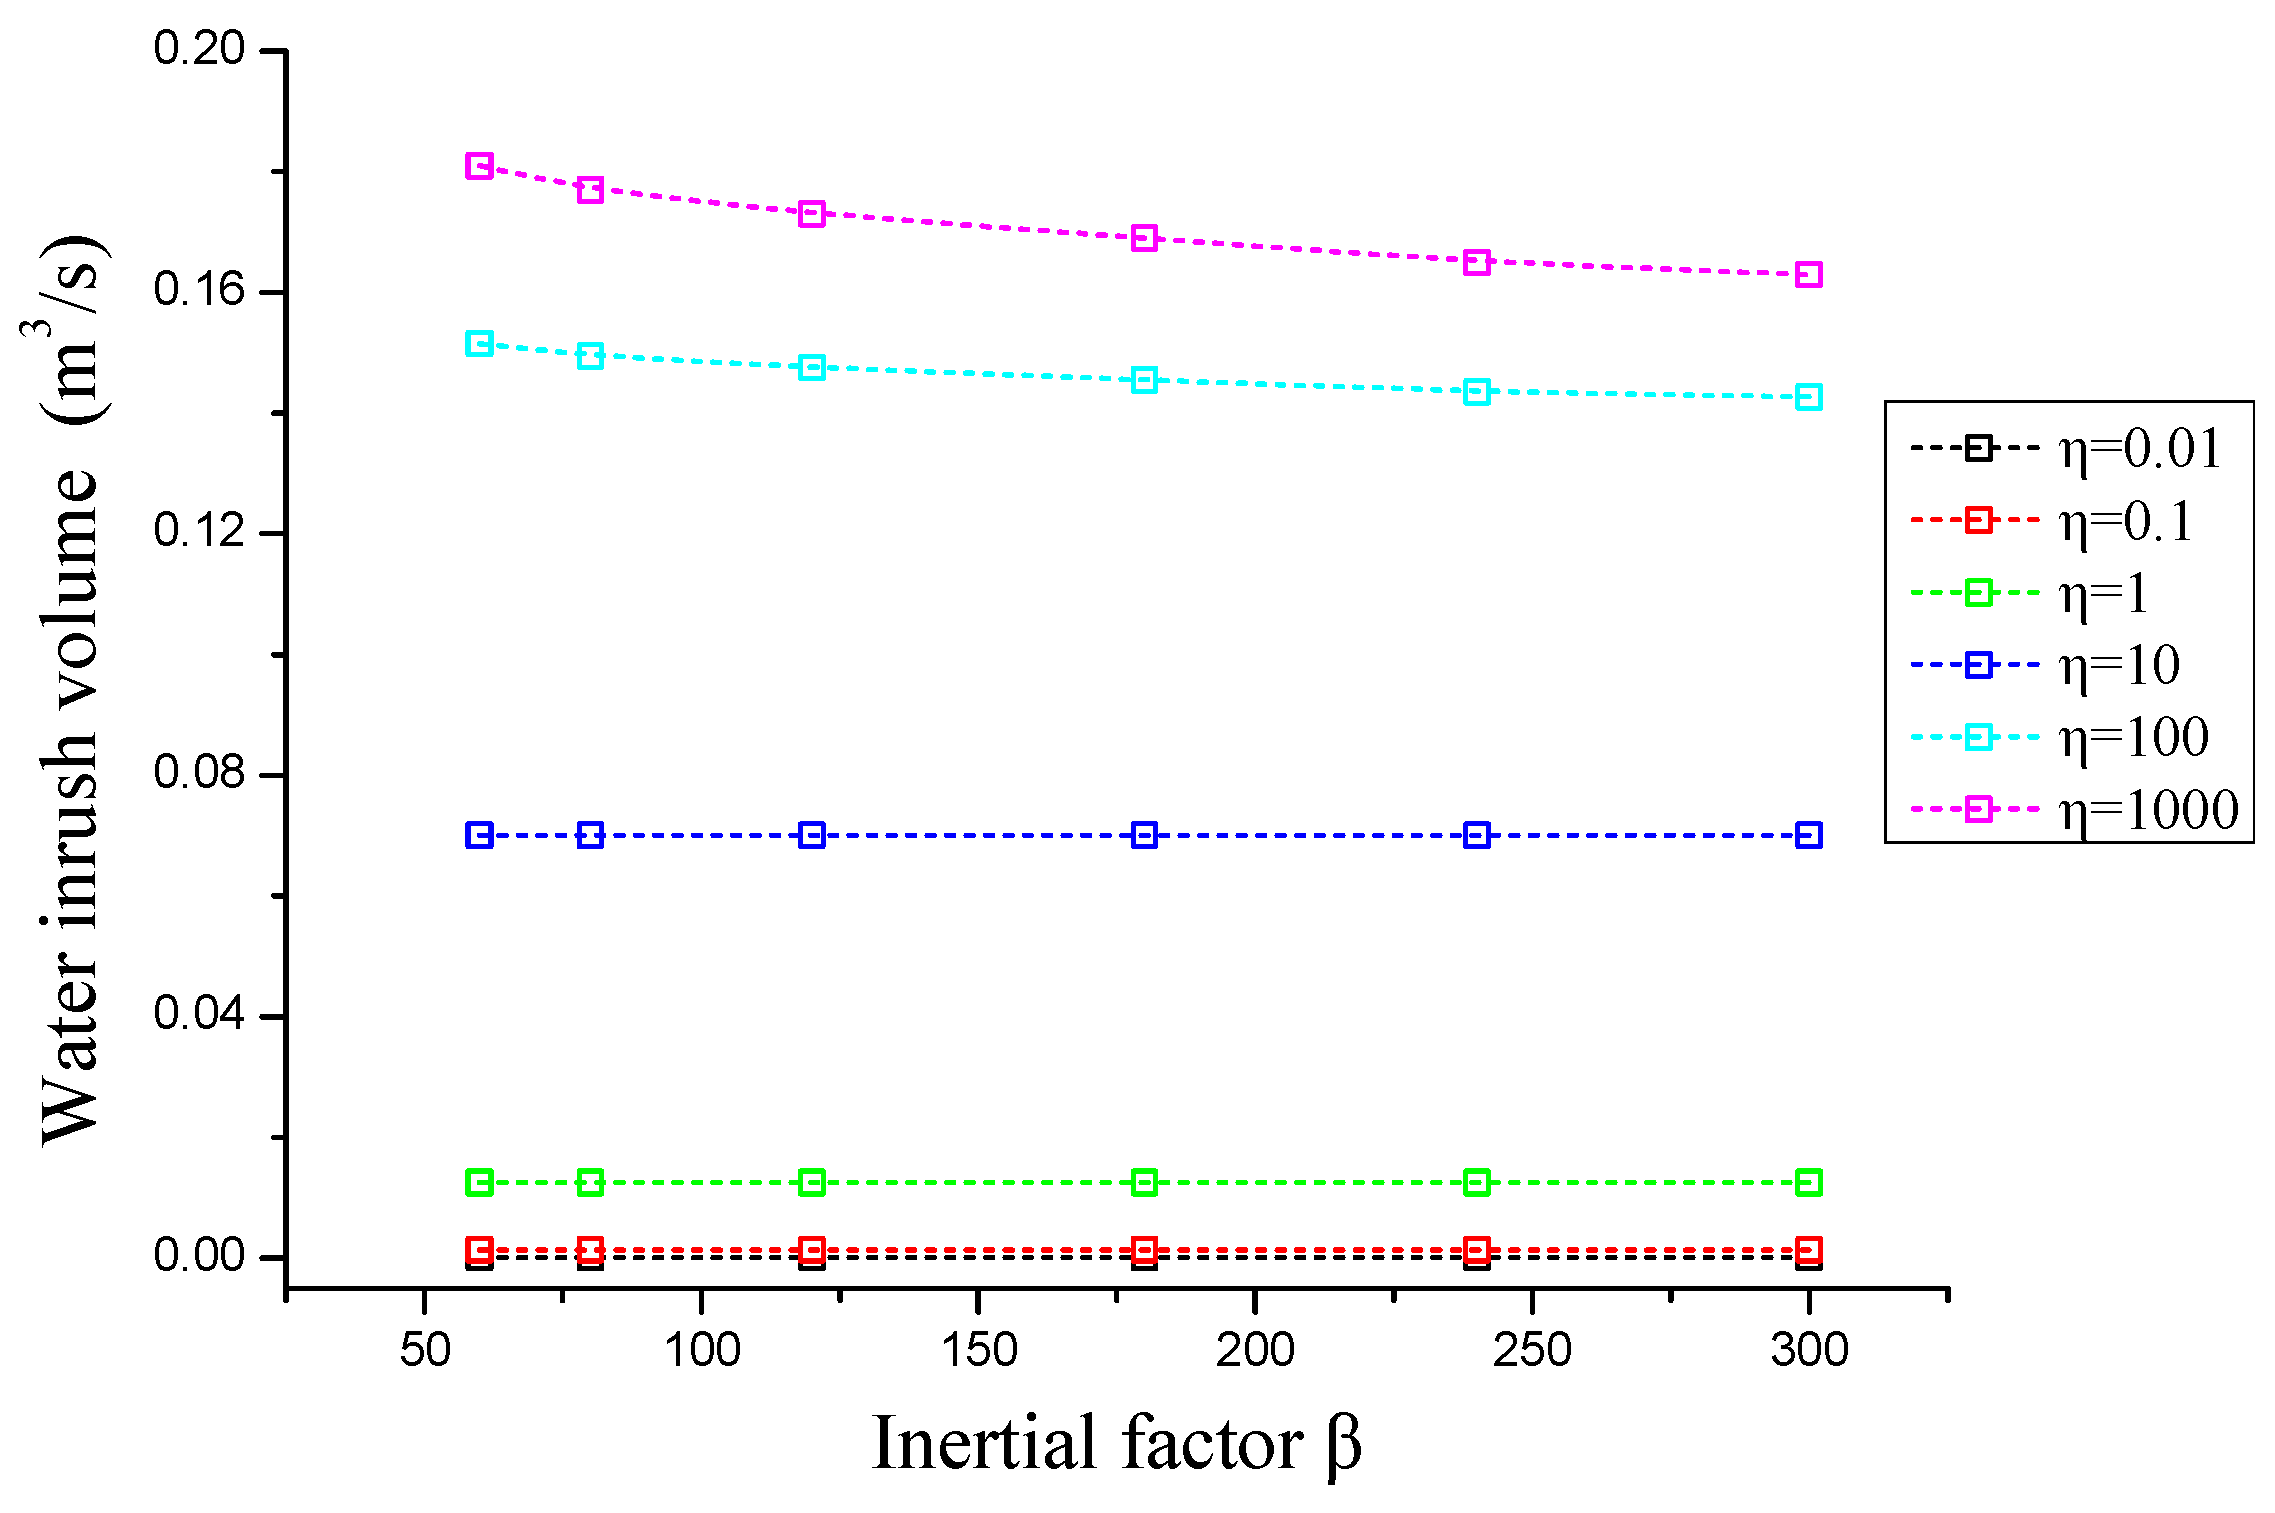
Water inrush volume is an important index for studying groundwater inrush disasters. To examine the influence of the rock mass parameters of the collapse column on water inrush volume, we describe the influence of fractured rock mass on water inrush volume by using different permeability ratios and inertial force coefficients to change the fractured rock mass of collapse column as shown in Figure 9.
The inertial factor of fractured rock mass has a slight influence on water inrush volume. When the value (or permeability) remains unchanged, the inflow amount of groundwater stays the same. However, when the inertial factor of the fractured rock mass is unchanged, an increase in will significantly change the inflow amount of groundwater or water inrush volume.
If < 0.1, that is, the permeability is very small, then the fractured rock blocks in the collapse column show a high density and low porosity. In this case, the collapse column does not play any role in water diversion but instead blocks the inflow of groundwater. Therefore, the groundwater flow rate is very low and close to zero. Meanwhile, an increase in permeability will significantly increase the inflow of groundwater. The change of water inrush volumes is significant when the value of is higher than 10.
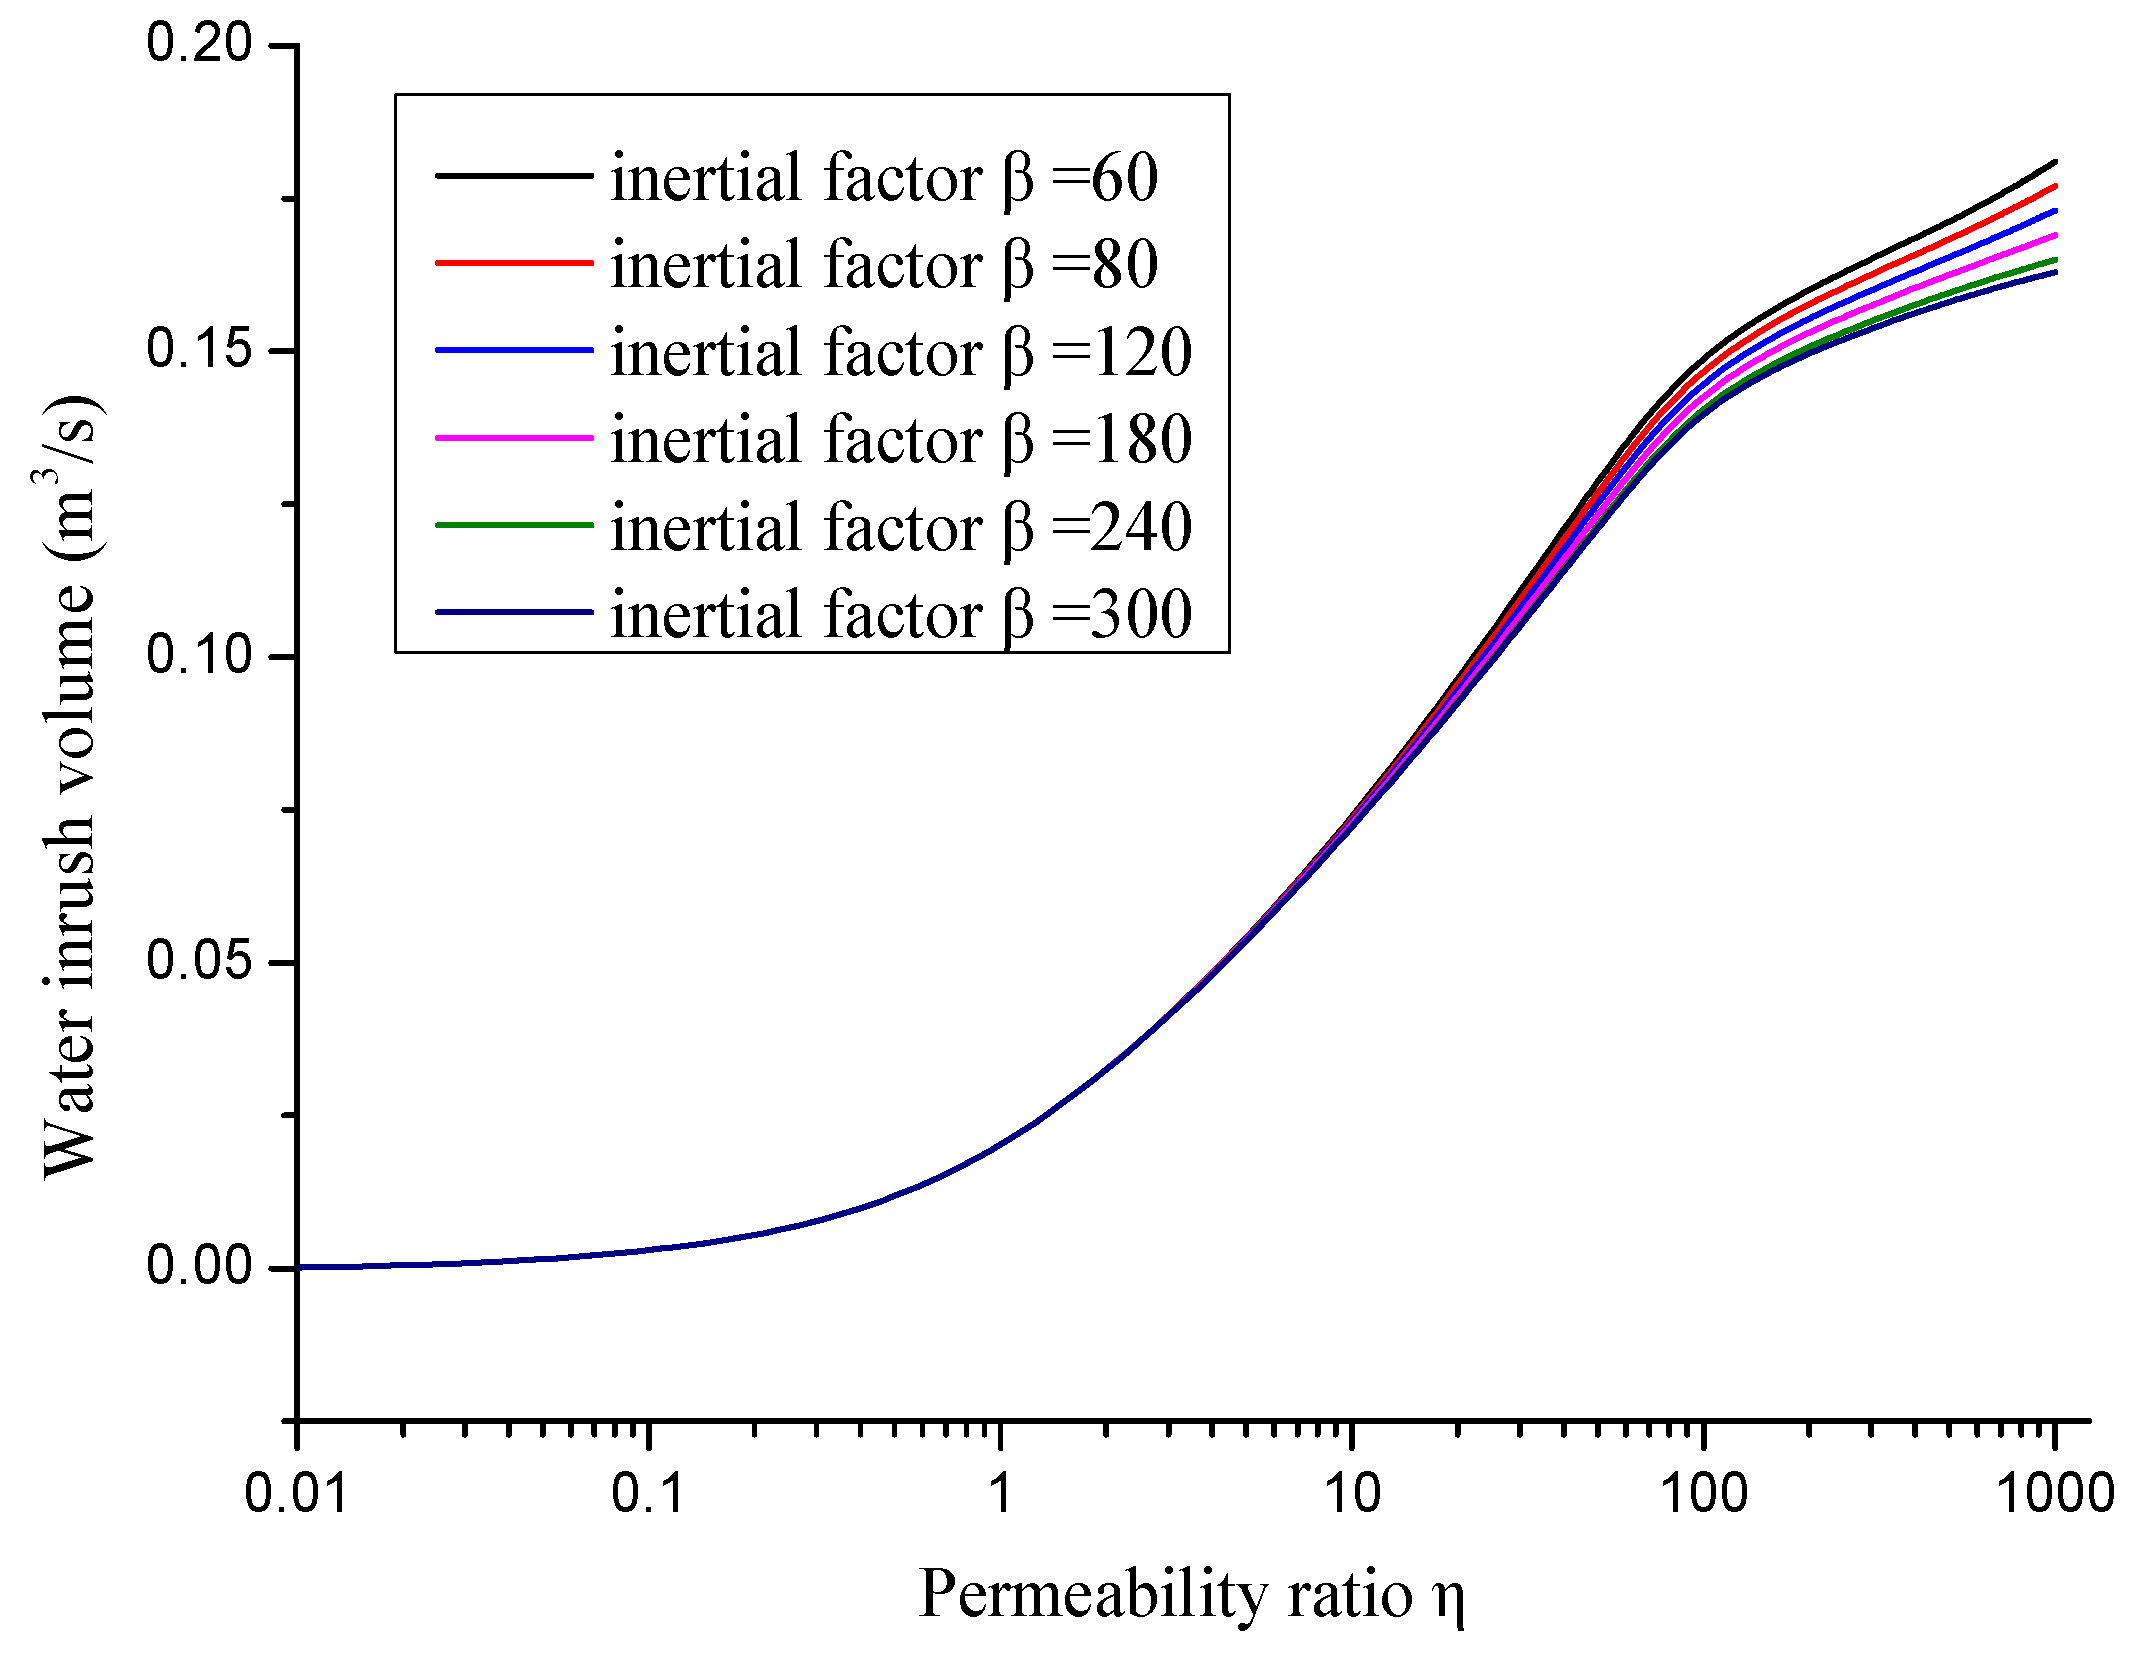
We can also measure the influence of the inertial factor on water inrush volume by changing the inertial factor as shown in Figure 10. As the value of increases, the groundwater inrush volume shows a nonlinear growth trend and the amount of water inrush increases. In other words, an increase in permeability amplifies the porosity of the collapse column, which plays an important role in increasing the water inrush volume. With a changing inertial factor , the water inrush volume changes by a bigger margin with a larger permeability. However, when the permeability ratio is small, the difference in water inrush volume is not apparent.
When > 50, the effect of inertial factor on groundwater seepage is increasing. It may be caused due to the fact that the permeability of the column area is not much different from that of the aquifer when is small. The flow velocity of the aquifer is not much different from that of the column, and the inertial resistance of the fluid in the column is not obvious. Therefore, the effect of the change of inertial factor on fluid velocity and water inrush is not obvious. When is large, it can be seen from Figure 6 that there is a big difference between the velocity of water flow in aquifer and the column. The inertial resistance of fluid in column has an obvious effect, and the increase of velocity of water flow causes the increase of inrush flow volume.
5. Conclusions
This paper establishes a nonlinear water inrush model that combines the Darcy flow field, Forchheimer flow field, and Navier–Stokes flow field to simulate the water inrush process from the collapse column and to examine those factors that influence such water inrush. The main conclusions of this paper are summarized as follows.
The water inrush from the collapse column is essentially a process of flow transition in different flow fields. The analysis results reveal that the Darcy flow field is generally distributed in the underground aquifer, the Forchheimer flow field with nonlinear high-speed seepage is observed in the collapse column of the fractured zone, and the Navier–Stokes flow field is generally located in the laneway. The inertia force of fluid is ignored and the linear laminar flow is dominant in the aquifer. As the water inrush speed increases, the Forchheimer flow in the collapse column becomes firstly dominated by viscous resistance, gradually transitions to the joint action of viscous resistance and inertial resistance, and is eventually dominated by inertial resistance. The transition of the flow state reflects the seepage of water inrush.
A non-Darcy effect is often observed in the water inrush from the collapse column. However, the existence of a non-Darcy effect does not change the water inrush volume. Instead, the change in the permeability of the collapse column shows a very apparent impact on water inrush volume. Specifically, an increase in the permeability of the collapse column corresponds to an increase in water inrush volume and significantly relieves the pressure and pressure gradient in the entire flow field.
Author Contributions
Y.X. conceived the model; T.T., L.Z., and M.H. performed the numerical simulation; Y.X. and X.D. wrote the paper; J.R. and F.L. revised the paper.
Funding
This research was funded by the National Natural Science Foundation of China (No. 51679199) and the China Postdoctoral Science Foundation (No. 2018M633549).
Acknowledgments
The authors would like to appreciate the anonymous reviewers for their constructive comments and suggestions.
Conflicts of Interest
The authors declare no conflict of interest.
References
- Li, H.; Bai, H.; Wu, J.; Ma, Z.; Ma, K.; Wu, G.; Du, Y.; He, S. A cascade disaster caused by geological and coupled hydro-mechanical factors—Water inrush mechanism from karst collapse column under confining pressure. Energies 2017, 10, 1938. [Google Scholar] [CrossRef]
- Qian, Z.; Huang, Z.; Song, J. A case study of water inrush incident through fault zone in china and the corresponding treatment measures. Arabian J. Geosci. 2018, 11, 381. [Google Scholar] [CrossRef]
- Wu, J.; Feng, M.; Yu, B.; Zhang, W.; Ni, X.; Han, G. Experimental investigation on dilatancy behavior of water-saturated sandstone. Int. J. Min. Sci. Technol. 2018, 28, 323–329. [Google Scholar] [CrossRef]
- Bukowski, P. Water hazard assessment in active shafts in upper Silesian coal basin mines. Mine Water Environ. 2011, 30, 302–311. [Google Scholar] [CrossRef]
- Ping, C.; Hua, W.; Jin, J.; Hao, R.; Fan, W. Experimental study of the fracture failure of sandstone containing hole and fissure under seepage water pressure. J. China Univ. Min. Technol. 2018, 47, 240–246. [Google Scholar]
- Ding, B. Features and prevention countermeasures of major disasters occurred in China. Coal Sci. Technol. 2017, 5, 109–114. [Google Scholar]
- Li, T.; Yang, X. Risk assessment model for water and mud inrush in deep and long tunnels based on normal grey cloud clustering method. KSCE J. Civil Eng. 2017, 22, 1991–2001. [Google Scholar] [CrossRef]
- Xue, Y.; Dang, F.; Cao, Z.; Du, F.; Liu, F.; Ren, J.; Gao, F. Numerical Analysis of Heat and Gas Transfer Characteristics during Heat Injection Processes Based on a Thermo-Hydro-Mechanical Model. Energies 2018, 11, 1722. [Google Scholar] [CrossRef]
- Ma, D.; Miao, X.; Bai, H.; Huang, J.; Pu, H.; Wu, Y.; Zhang, G.; Li, J. Effect of mining on shear sidewall groundwater inrush hazard caused by seepage instability of the penetrated karst collapse pillar. Nat. Hazards 2016, 82, 73–93. [Google Scholar] [CrossRef]
- Kremen, H.M. Hydrogeology; Soviet Union Geological Technology Press: Moscow, Russia, 1955. [Google Scholar]
- Dash, A.K.; Bhattcharjee, R.M.; Paul, P.S. Lessons learnt from Indian inundation disasters: An analysis of case studies. Int. J. Dis. Risk Reduct. 2016, 20, 93–102. [Google Scholar] [CrossRef]
- Jurado, A.; Gaspari, F.D.; Vilarrasa, V.; Bolster, D.; Sánchez-Vila, X.; Fernàndez-Garcia, D.; Tartakovsky, M. Probabilistic analysis of groundwater-related risks at subsurface excavation sites. Eng. Geol. 2012, 125, 35–44. [Google Scholar] [CrossRef]
- Bukowski, P. The water storage capacity of a carboniferous rock mass and its impact on the flooding process of mine workings in the upper Silesian coal basin. Arch. Min. Sci. 2002, 47, 385–412. [Google Scholar]
- Sun, Q.; Zhang, J.; Zhou, N.; Qi, W. Roadway backfill coal mining to preserve surface water in Western China. Mine Water Environ. 2018, 37, 366–375. [Google Scholar] [CrossRef]
- Yao, B.; Chen, Z.; Wei, J.; Bai, T.; Liu, S. 2018. Predicting Erosion-Induced Water Inrush of Karst Collapse Pillars Using Inverse Velocity Theory. Geofluids 2018, 2018, 2090584. [Google Scholar] [CrossRef]
- Xue, Y.; Cao, Z.; Du, F.; Zhu, L. The Influence of the Backfilling Roadway Driving Sequence on the Rockburst Risk of a Coal Pillar Based on an Energy Density Criterion. Sustainability 2018, 10, 2609. [Google Scholar] [CrossRef]
- Zuo, J.; Chen, Y.; Cui, F. Investigation on mechanical properties and rock burst tendency of different coal-rock combined bodies. J. China Univ. Min. Technol. 2018, 7, 81–87. [Google Scholar]
- Gao, R.; Yan, H.; Ju, F.; Mei, X.; Wang, X. Influential factors and control of water inrush in a coal seam as the main aquifer. Int. J. Min. Sci. Technol. 2018, 28, 187–193. [Google Scholar] [CrossRef]
- Cheng, Y.; Chen, Z.; Miao, X.; Mao, X. Testing study on permeability of non-Darcy flow in post-peak sandstone. Chin. J. Rock Mech. Eng. 2004, 23, 2005–2009. [Google Scholar]
- Hong, N.I.; Guo, L. Study on the mechanism of preferred plane of water hazard in coal mine. J. China Coal Soc. 2000, 25, 518–521. [Google Scholar]
- Wei, Q.; Wenping, L.I.; Zhao, C. Water inrush coefficient-unit inflow method for water inrush evaluation of coal mine floor. Chin. J. Rock Mech. Eng. 2009, 28, 2466–2474. [Google Scholar]
- Wan-Jun, L.I.; Yang, J.B. “Down 3 zones” theory and “p-h” critical curve method for floor water-bursting forecast. Coal Min. Technol. 2010, 5, 45–47. [Google Scholar]
- Jian, S.; Wang, L.G.; Hou, H.Q. Resurch on water-isolating capacity of the compound water-resisting key strata in coal seam floor. J. China Univ. Min. Technol. 2013, 42, 560–566. [Google Scholar]
- Bai, G.L.; Bing, L.; Li, S.-Z. An equivalent porous media water-rock coupling model impacted by coal mining and its application. J. China Coal Soc. 2009, 34, 461–465. [Google Scholar]
- Ji, Z.; Tian, H.; Yang, Z.; Liu, T.; Bandara, S. Mechanism of water inrush from coal seam floor based on coupling mechanism of seepage and stress. J. Intell. Fuzzy Syst. 2016, 34, 965–974. [Google Scholar] [CrossRef]
- Berkowitz, B.; Balberg, I. Percolation theory and its application to groundwater hydrology. Water Resour. Res. 1993, 29, 775–794. [Google Scholar] [CrossRef]
- Irmay, S. On the theoretical derivation of Darcy and forchheimer formulas. Trans. Am. Geophys. Union 1958, 39, 702. [Google Scholar] [CrossRef]
- Özer, B.; Dukhan, N.; Özdemir, M. Flow regimes in packed beds of spheres from pre-Darcy to turbulent. Transp. Porous Media 2014, 104, 501–520. [Google Scholar]
- Hou, X.; Shi, W.; Yang, T. A non-linear flow model for the flow behavior of water inrush induced by the karst collapse column. Rsc Adv. 2018, 8, 1656–1665. [Google Scholar] [CrossRef] [Green Version]
- Yang, X.; Yang, T.; Xu, Z.; Yang, B. Experimental Investigation of Flow Domain Division in Beds Packed with Different Sized Particles. Energies 2017, 10, 1401. [Google Scholar] [CrossRef]
- Miao, X.; Li, S.; Liu, W. Experimental study of seepage properties of broken sandstone under different porosities. Transp. Porous Media 2011, 86, 805–814. [Google Scholar] [CrossRef]
- Pradip, K.G.N.; Venkataraman, P. Non-Darcy converging flow through coarse granular media. J. Inst. Eng. Civil Eng. Div. 1995, 76, 6–11. [Google Scholar]
- Xia, T.Q.; Gao, F.; Kang, J.H.; Wang, X.X. A fully coupling coal–gas model associated with inertia and slip effects for CBM migration. Environ. Earth Sci. 2016, 75, 582. [Google Scholar] [CrossRef]
- Shi, W.; Yang, T.; Liu, H.; Yang, B. Numerical modeling of non-Darcy flow behavior of groundwater outburst through fault using the forchheimer equation. J. Hydrol. Eng. 2018, 23. [Google Scholar] [CrossRef]
- Birpinar, M.E.; Şen, Z. Forchheimer groundwater flow law type curves for leaky aquifers. J. Hydrol. Eng. 2004, 9, 51–59. [Google Scholar] [CrossRef]
- Yang, T.; Chen, S.; Zhu, W.; Meng, Z.; Gao, Y. Water inrush mechanism in mines and nonlinear flow model for fractured rocks. Chin. J. Rock Mech. Eng. 2008, 27, 1411–1416. [Google Scholar]
- Xia, Z.Y.; Jia, J.Y.; Dou, M.Y. Conglomerate’s Water-rich Regulation and Water Bursting Mechanism in Jinzhuang Coal Mine. Coal 2007, 5, 27–28. [Google Scholar]
- Zhu, W.C.; Wei, C.H.; Zhang, F.Z.; Yang, T.H. Investigation of water inrush from karst subsidence column by using a coupled hydromechanical model. Chin. J. Undergr. Space Eng. 2009, 5, 928–933. [Google Scholar]
Figure 1.
Schematic diagram of the collapse column model [9].
Figure 1.
Schematic diagram of the collapse column model [9].

Figure 2.
Diagram of the collapse column model. KCC: karst collapse column.

Figure 3.
Flow velocity (a) and water pressure (b) distribution of fluid in the water inrush process. A-B-C-D-E is the monitoring line; the coordinates are A: (0,90), B: (150,90), C: (162,205), D: (175,300), and E: (350,300).
Figure 3.
Flow velocity (a) and water pressure (b) distribution of fluid in the water inrush process. A-B-C-D-E is the monitoring line; the coordinates are A: (0,90), B: (150,90), C: (162,205), D: (175,300), and E: (350,300).

Figure 4.
Water flow pressure distribution in the aquifer and collapse column at different values. (a) = 0.01; (b) = 0.1; (c) = 1; (d) = 10; (e) = 100; (f) = 1000.
Figure 4.
Water flow pressure distribution in the aquifer and collapse column at different values. (a) = 0.01; (b) = 0.1; (c) = 1; (d) = 10; (e) = 100; (f) = 1000.

Figure 5.
Water pressure distribution in the model detection line.

Figure 6.
Flow velocity distribution on the monitoring line.

Figure 7.
Distribution of non-Darcy effect on the monitoring line at different values of .

Figure 8.
Flow behavior of non-Darcy fluid with different values of at point C in the inspection line.
Figure 8.
Flow behavior of non-Darcy fluid with different values of at point C in the inspection line.

Figure 9.
Water inrush volumes under different aquifer coefficients.

Figure 10.
Changes in water inrush volume at different permeability values.


Table 1.
Parameters of the model.
| Parameter | Value |
|---|---|
| Density | 1000 (kg/m3) |
| Viscosity | 0.001 (Pa·s) |
| Permeability of aquifer | 1.9 × 10⁻¹¹ (m2) |
| Permeability of KCC | 1.9 × 10⁻⁹ (m2) |
| Porosity of aquifer | 0.14 |
| Porosity of KCC | 0.348 |
| Water pressure P0 | 3.5 × 10⁶ (Pa) |
© 2018 by the authors. Licensee MDPI, Basel, Switzerland. This article is an open access article distributed under the terms and conditions of the Creative Commons Attribution (CC BY) license (http://creativecommons.org/licenses/by/4.0/).
Share and Cite
MDPI and ACS Style
Xue, Y.; Teng, T.; Zhu, L.; He, M.; Ren, J.; Dong, X.; Liu, F. Evaluation of the Non-Darcy Effect of Water Inrush from Karst Collapse Columns by Means of a Nonlinear Flow Model. Water 2018, 10, 1234. https://doi.org/10.3390/w10091234
AMA Style
Xue Y, Teng T, Zhu L, He M, Ren J, Dong X, Liu F. Evaluation of the Non-Darcy Effect of Water Inrush from Karst Collapse Columns by Means of a Nonlinear Flow Model. Water. 2018; 10(9):1234. https://doi.org/10.3390/w10091234
Chicago/Turabian StyleXue, Yi, Teng Teng, Lin Zhu, Mingming He, Jie Ren, Xun Dong, and Fei Liu. 2018. "Evaluation of the Non-Darcy Effect of Water Inrush from Karst Collapse Columns by Means of a Nonlinear Flow Model" Water 10, no. 9: 1234. https://doi.org/10.3390/w10091234
Note that from the first issue of 2016, this journal uses article numbers instead of page numbers. See further details here.