Article

Optimal Operation of Cascade Reservoirs for Flood Control of Multiple Areas Downstream: A Case Study in the Upper Yangtze River Basin

1
Changjiang Institute of Survey, Planning, Design and Research, Wuhan 430010, China
2
School of Hydropower and Information Engineering, Huazhong University of Science and Technology, Wuhan 430074, China
*
Author to whom correspondence should be addressed.
Water 2018, 10(9), 1250; https://doi.org/10.3390/w10091250
Submission received: 20 June 2018 / Revised: 1 September 2018 / Accepted: 11 September 2018 / Published: 14 September 2018
(This article belongs to the Special Issue Adaptive Catchment Management and Reservoir Operation)

Abstract

:
The purpose of a flood control reservoir operation is to prevent flood damage downstream of the reservoir and the safety of the reservoir itself. When a single reservoir cannot provide enough storage capacity for certain flood control points downstream, cascade reservoirs should be operated together to protect these areas from flooding. In this study, for efficient use of the reservoir storage, an optimal flood control operation model of cascade reservoirs for certain flood control points downstream was proposed. In the proposed model, the upstream reservoirs with the optimal operation strategy were considered to reduce the inflow of the reservoir downstream. For a large river basin, the flood routing and time-lag cannot be neglected. So, dynamic programming (DP) combined with the progressive optimality algorithm (POA) method, DP-POA, was proposed. Thus, the innovation of this study is to propose a two-stage optimal reservoir operation model with a DP-POA algorithm to solve the problem of optimal co-operation of cascade reservoirs for multiple flood control points downstream during the flood season. The upper Yangtze River was selected as a case study. Three reservoirs from upstream to downstream, Xiluodu, Xiangjiaba and the Three Gorges reservoirs (TGR) in the upper Yangtze River, were taken into account. Results demonstrate that the two-stage optimization algorithm has a good performance in solving the cascade reservoirs optimization problem, because the inflow of reservoir downstream and the division volumes were largely reduced. After the optimal operation of Xiluodu and Xiangjiaba reservoirs, the average reduction of flood peak for all these 13 typical flood hydrographs (TFHs) is 13.6%. Meanwhile, the cascade reservoirs can also store much more storm water during a flood event, and the maximum volumes stored in those two reservoirs upstream in this study can reach 25.2 billion m3 during a flood event. Comprising the proposed method with the current operation method, results demonstrate that the flood diversion volumes at the flood control points along the river decrease significantly.

1. Introduction

For safety of lives and property from risks related to floods, proper planning of relevant applications is important for development [1,2,3,4,5,6,7,8,9,10,11,12,13]. To date, dams have become numerous and have had a profound effect on social and economic development. As of 2007, China was the world’s leader in the construction of large dams [14]. Reservoirs are often operated with a number of purposes related to environmental, economic and public services. Generally, these purposes include flood control, hydropower generation, navigation, sediment control, water supply, recreation, and fisheries, among which flood control is the most significant function for many of the reservoirs [15].
The main purpose of flood control is to prevent flood damage downstream of the reservoir and the safety of the reservoir itself. The key variables governing the operation of flood control reservoirs are the available storage capacity and the expected inflow magnitude from an incoming flood [15]. Some of the research on multi-reservoir flood control operations is for design of the reservoirs [16], in which the objective functions are the minimum of the initial investment cost and potential flood damage costs. Until now, most of the research on multi-reservoir flood control operation concerns minimizing the maximal water level for the dam itself or the releases at the downstream flood control points, such as the research carried out by Lee et al. [17], Qi et al. [18] and Chen et al. [11]. The other aspect for multi-reservoir flood control operation is to address the conflicts between flood control and conservation. A great number of research works on dynamic control flood limiting water level have been carried out in recent years to balance the conflict between flood control and conservation, such as the work done by Li et al. [19], Chen et al. [20], and Zhou et al. [9,21].
Accordingly, releases are restricted by the maximum allowable non-damaging channel capacity at the downstream flood control points [15]. Sometimes the available storage capacity of one reservoir is not enough to protect the flood control points downstream. In this situation, more reservoirs are needed to work together to protect these flood control points from flooding, especially the downstream control points with great importance. Thus, a new optimal reservoir operation model, which can make efficient use of reservoir storage to protect downstream flood control points from flooding during the flood season is needed. He et al. [22] studied the flood control operation of Jinsha River cascade reservoirs combined with the Three Gorges for flood control of the Chenglingji areas downstream based on the equal water storage method, in which the optimal operation technique was not considered. The storage capacities of these reservoirs are underutilized. Zhou et al. [9] proposed a virtual reservoir approach that aggregates multi-reservoir systems into a virtual reservoir for flood control decision making. However, in their method, two reservoirs were taken as a virtual reservoir, which cannot reflect the hydraulic connection between reservoirs. Therefore, in this paper, a two-stage optimal operation of cascade reservoirs for flood control of multiple areas downstream, which considers the optimization and hydraulic connections among cascade reservoirs, was proposed.
Take three reservoirs, as shown in Figure 1, for example. A, B, and C are three reservoirs from upstream to downstream, and points 1, 2, and 3 are three flood control points downstream of the reservoirs, whose locations can also be seen in Figure 1. Points 1 and 2 are protected by Reservoirs A and B. Point 3 is protected by Reservoirs A, B and C, since Reservoir C cannot have enough capacity for flood control of Point 3. Reservoirs A and B can help Reservoir C realize the flood control by minimizing the inflow of Reservoir C. Therefore, two objective functions are needed. For Reservoirs A and B, the objective function is to minimize the inflow of Reservoir C; for Reservoir C, the objective function is to minimize the excess flood volumes diverted to the floodplain at point C.
In addition, usually the optimal flood control reservoir operation model for a large river basin does not consider the flood routing during the processes for obtaining the optimal solution. When the river basin is large, these factors cannot be ignored. Since the Muskingum method was used for flood routing [23,24,25], the delayed time is usually considered, which causes the time-lags issue during the optimal processes [10]. In this case, the number of decision variables and constraints is increased exponentially, and it is difficult for a single traditional optimization method or modern intelligence algorithm to tackle the time-lags problem [10]. In the broad area of reservoir operation, development and use of prescriptive models based on optimization techniques have been extensively used [26,27]. An adaptive optimal algorithm also should be considered for the large river basins with flood routing and time-delayed issues.
There are various studies on optimal operations of single reservoir and multi-reservoir systems for flood control in the literature [9,28,29,30]. The dynamic programming (DP) method is the most widely used optimization technique for reservoir operation. It also has been used for reservoir operation by [31,32,33,34]. DP can be used for solving problems containing discrete variables, non-convex, non-continuous, and non-differentiable objective functions. However, the “curse of dimensionality”, the phenomenon that when the number of reservoirs rises, the computation scale of DP increases exponentially, limits its application of DP. To deal with the dimensionality problems, modified DP algorithms, such as discrete differential dynamic programming (DDDP) [35,36,37], dynamic programming successive approximation (DPSA) [38,39] and the progressive optimality algorithm (POA) have been widely used for finding the optimal or near-optimal reservoir release hydrographs for flood control [40].
The POA, proposed by Howson and Sancho [41], was used to resolve the nth single reservoir operation problems, which divides the multi-stage problem into multiple two-stage sub-problems. Turgeon [42] used the principle of progressive optimality to minimize the total production cost of a multi-dimensional and multistage optimization problem. Guo et al. [43] applied the POA algorithm to solve the joint operation of the multi-reservoir systems of the Three Gorges and the Qingjiang cascade reservoirs. However, the disadvantages of the POA method are that the initial solutions have great influence on the final optimal results. In this study, a combined algorithm of DP and POA was proposed to solve the problem of flood routing and the influence of initial solutions.
The objective of this study was, therefore, to establish an optimal flood control operation model of cascade reservoirs for multiple flood control points downstream. The objective of the whole model is to minimize the flood diversion volumes at the flood control points. An adaptive combined algorithm is also proposed to solve the problem of flood routing. The upper Yangtze River, China, was selected as a case study. Three reservoirs were considered in this study.

2. Optimal Flood Control Reservoir Operation Model

A two-stage optimal reservoir operation model was proposed. Take the three reservoirs for an example, as shown in Figure 1. In the first stage, the optimal operation models of Reservoirs A and B were established, in which the objective function is to reduce the inflow of the downstream reservoir. In the second stage, the optimal operation model of Reservoir C is established, in which the objective function is to minimize the highest water level and the flood diversion volumes at flood control point 3.

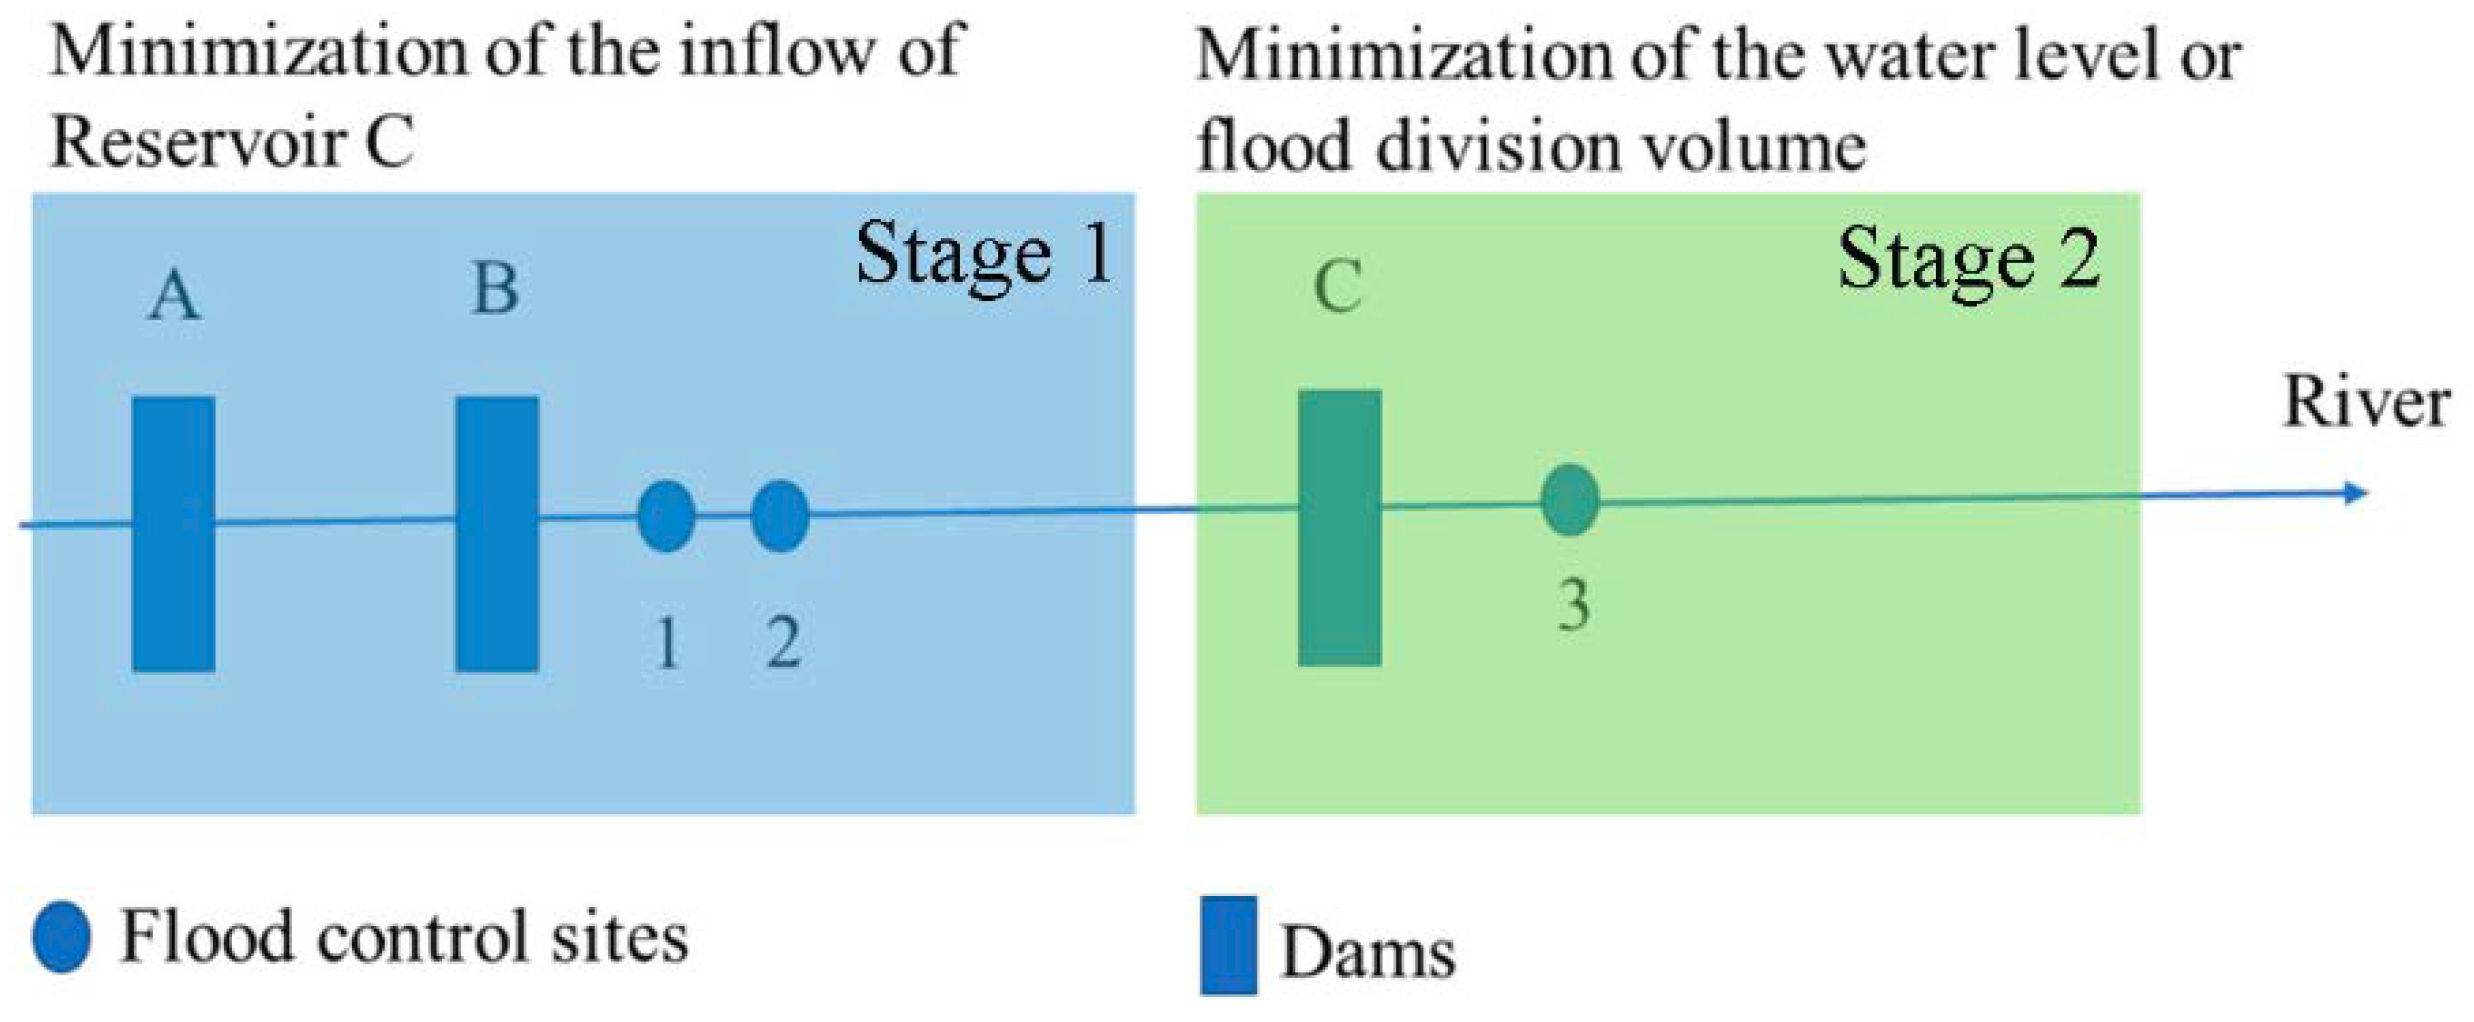
2.1. Optimal Operation in the First Stage

2.1.1. Objective Function

Take the three cascade reservoirs as an example. Reservoirs A and B are expected to store much more water during the flood season and reduce the inflow of Reservoir C as much as possible. In other words, the best situation is that the inflow of Reservoir C is as small as possible, after the utilization of the two reservoirs upstream.
Thus, the objective function of Reservoirs A and B can be defined as:
min F = min { t = 1 T [ Q ( t ) + q ( t ) ] 2 }  
where Q ( t ) is the discharge of Reservoir B considering the flood routing along the river; and q(t) is the discharge of the interval basin, which also includes the flow from other tributaries of the river.

2.1.2. Constraints for Model in the First Stage

Four constraints were considered in this study. The first one is water balance equation, which must obey during the reservoir operation process. The second one is the constraint concerning water level, which gives the allowable maximum and minimum water levels during the flood season. The third one is the discharge limit, which gives the allowable maximum and minimum discharges during the flood season. The fourth is the limit of the discharge for downstream flood control point, which protects downstream areas from flooding.
(a) Water balance equation:
V i , t = V i , t 1 + ( I i , t Q i , t ) Δ t  
where V i , t is the reservoir storage at time t for the ith reservoir; and I i , t and Q i , t are the inflow and outflow at time t for the ith reservoir, respectively.
(b) Constraint of water level:
Z i , t min Z i , t Z i , t max  
where Z i , t represents the water level of the ith reservoir at time t; Z i , t min and Z i , t max represent the minimum and maximum water level of the ith reservoir at time t, respectively.
(c) Constraint of reservoir discharge:
Q i min Q i , t Q i max ( Z t )  
where Q i , t is the discharge of the ith reservoir at time t; Q i max ( Z t ) means the maximum discharge ability corresponding to the water lever Z t at time t for the ith reservoir; and Q i min means the minimum discharge for the ith reservoir. The maximum discharge ability is related to the water level, and the reservoir discharge Q i , t cannot exceed the maximum discharge ability.
Besides Equation (4), the discharge variation between adjacent time periods should be also considered by:
| Q i , t Q i , t 1 | Δ Q i  
where Δ Q i is the allowed discharge variation between adjacent time periods for the ith reservoir.
(d) Constraint of discharge for downstream flood control points
q j , t = Q i , t + Δ q t q j max , j = 1 , 2 , 3  
where q j , t is the discharge at time t for the jth flood control point downstream; Q i , t is the discharge of the ith reservoir considering the flood routing at the jth flood control point; Δ q t is the inflow in the interval zone between the ith reservoir and the flood control point downstream; and q j max is the allowed maximum discharge for the jth flood control point downstream.

2.2. Optimal Operation in the Second Stage

2.2.1. Objective Function

Flood control reservoir operation is generally a complex problem, which needs to consider the safety of a reservoir and its upstream and downstream areas. This paper established a flood control operation model aiming to control the highest water level of Reservoir C and reduce the flood diversion magnitudes of the downstream areas. Two objective functions were considered and given as follows. When the release does not exceed the safety water level downstream, the highest water level of Reservoir C is taken as an objective function. Although those reservoirs operate together, it is possible that the water level at flood control points still exceeds the safety water level for a high return period flood (e.g., 1000-year). In this situation, the objective function is to minimize the flood diversion magnitude in the downstream areas. These two objective functions are given as follows.
(1) Minimize the highest water level to ensure the safety of the reservoir itself and its upstream areas
min F 1 = min { max Z t } , t = 1 , 2 , , T d  
where Z t is the water level at time t; and Td is the time duration for the flood control operation.
(2) Minimize the flood diversion magnitudes for downstream areas:
min F 2 = min { t = 1 T s Δ q ( t ) Δ t }  
where Δ q ( t ) is the excess water volume into the flood diversion areas around the downstream control site at time t; Δ t is the interval time; and Ts is the time duration for flood diversion, when the water level exceeds the safety water level downstream.

2.2.2. Constraints for the Model in the Second Stage

The constraints include the water balance, water level limits, reservoir discharge limits and allowable discharges for downstream flood control points. Equations for the constraints are the same as those in stage one (Section 2.1).

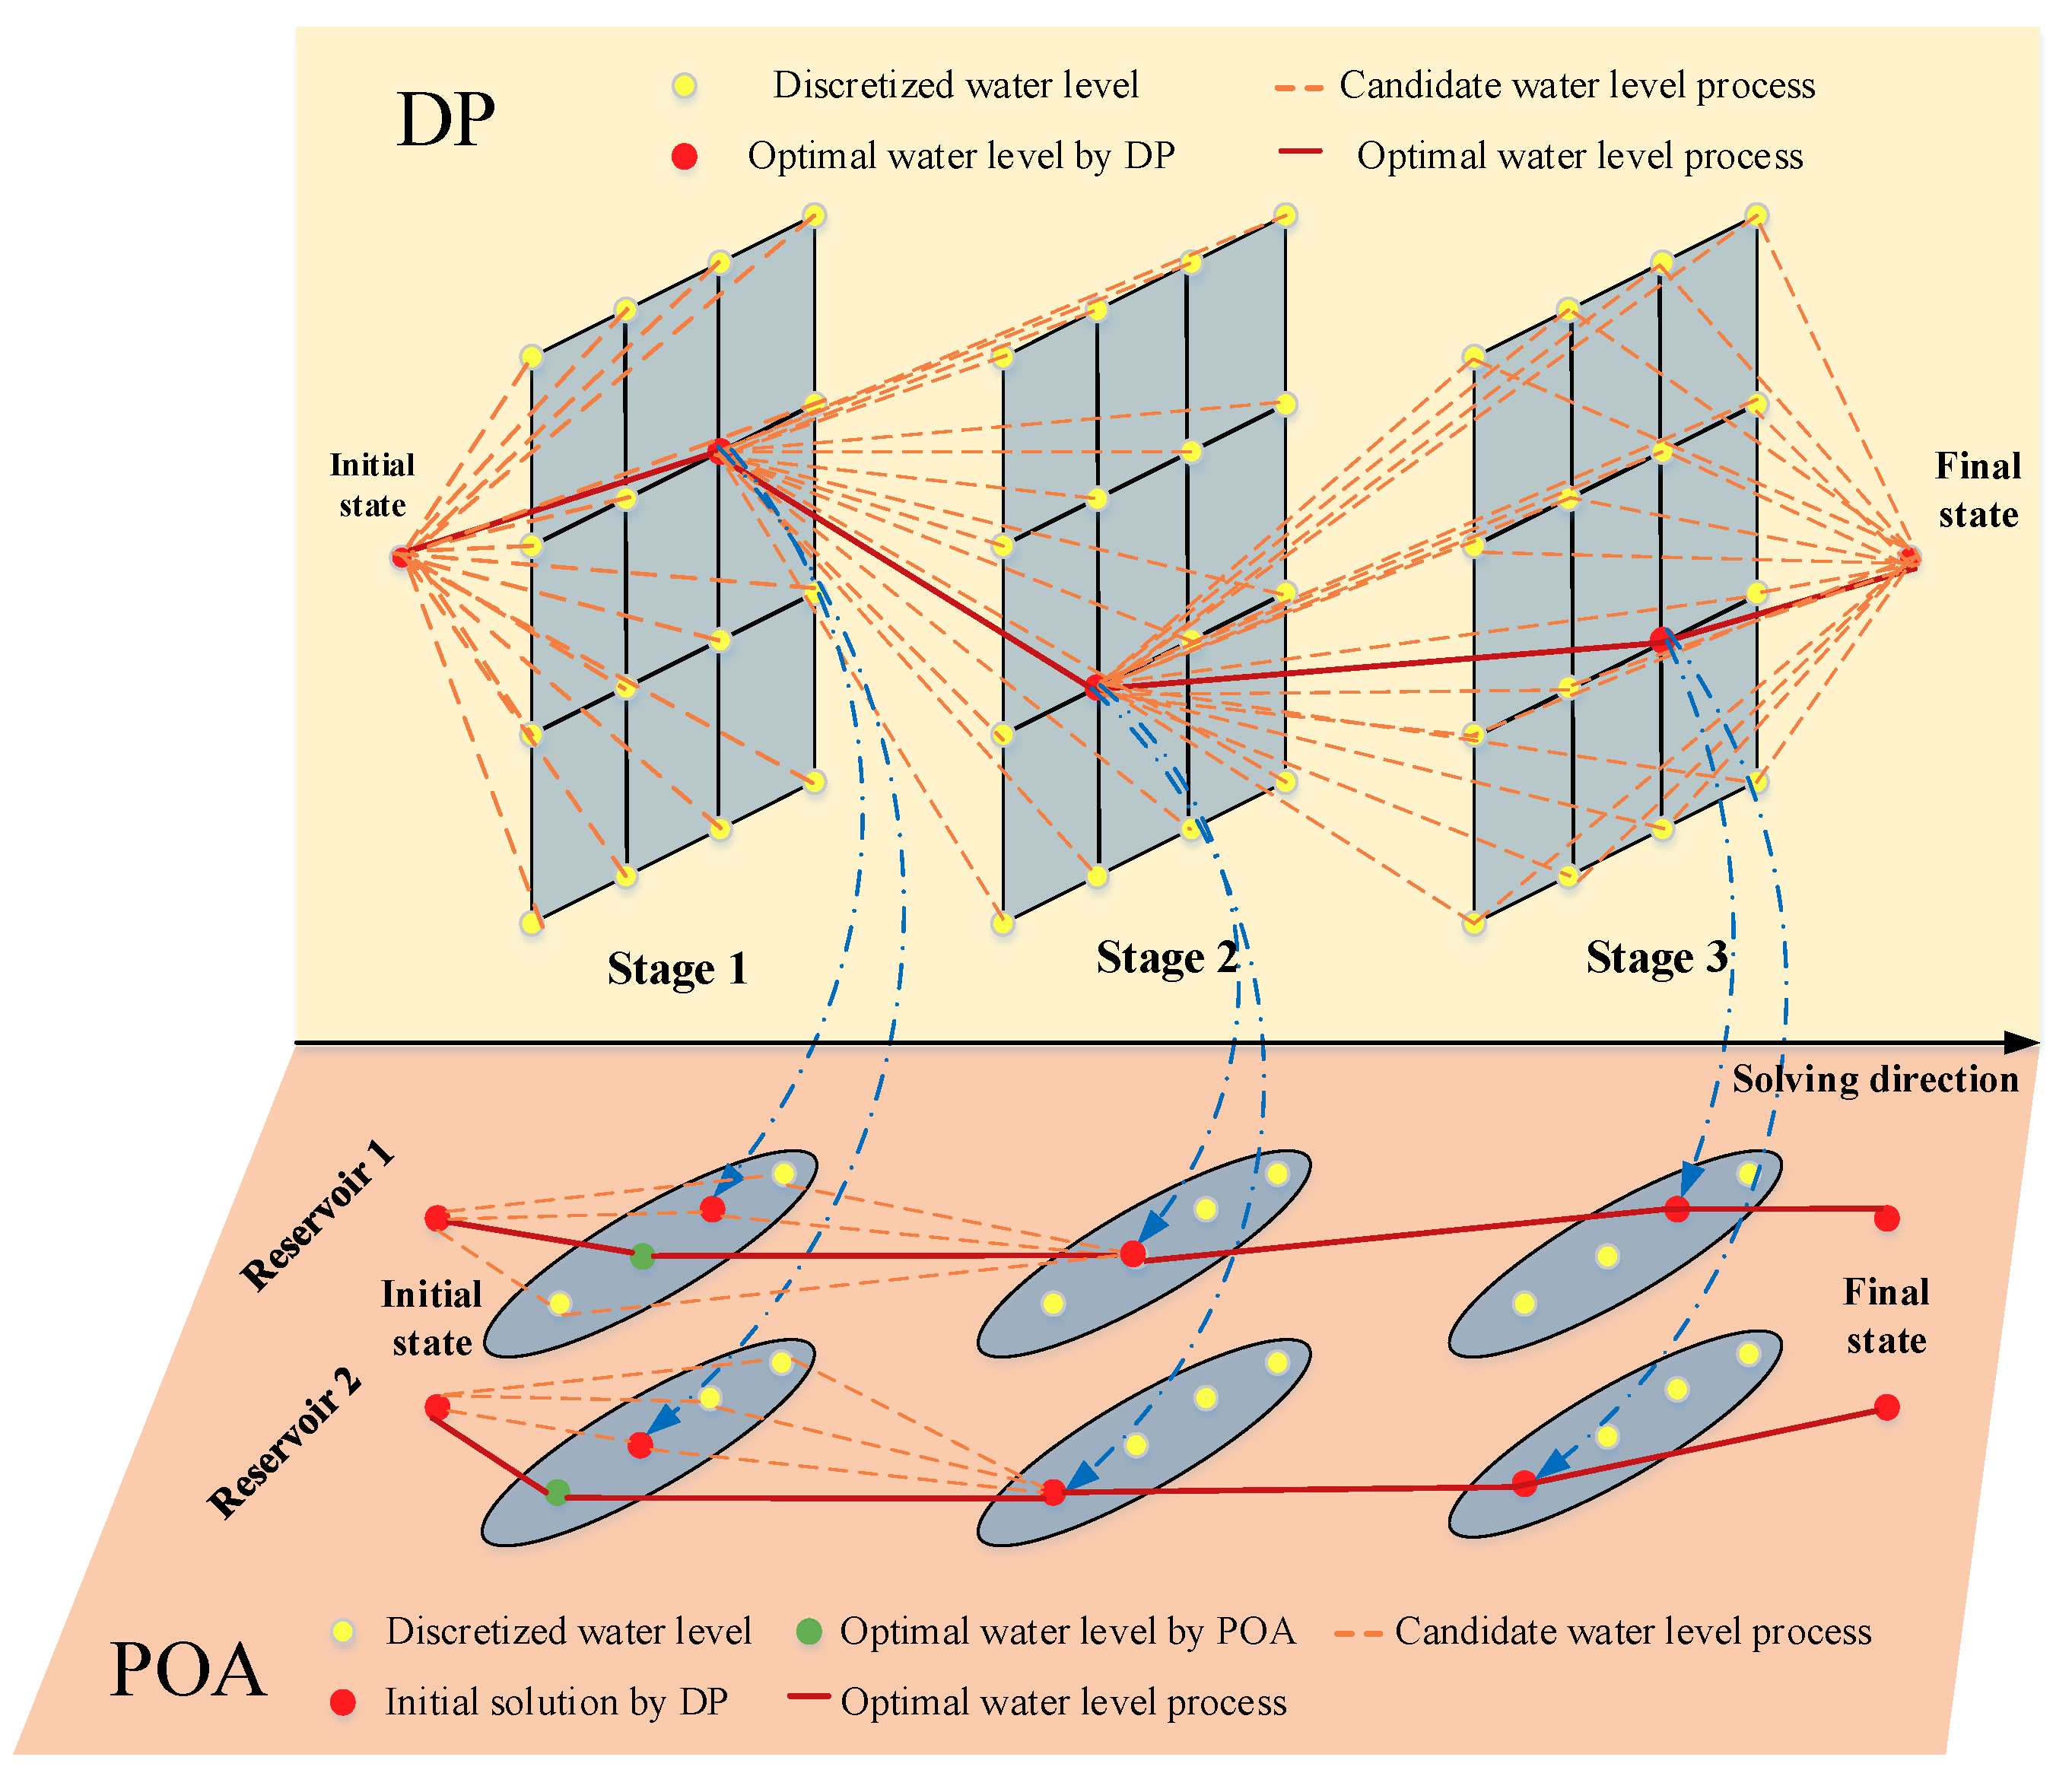
2.3. Optimization Algorithm

Considering the “curse of dimensionality”, the time-lag issue for multi-reservoir operations, and the influence of the initial solutions, the dynamic programming combined with the progressive optimality algorithm (DP-POA) method was proposed to find the optimal operation polices for multi-reservoir systems, in which the DP method was used first, and the output of the DP method was the input of the POA method. The skeleton of this algorithm is shown in Figure 2. The equations for DP and POA methods are given below.

2.3.1. Dynamic Programming (DP)

A multiple-period reservoir operation is formulated as a recursive function in DP:
max     G t ( s t ) = g t ( s t , r t ) + G t + 1 ( s t + 1 )                         s . t .       s t + q t = r t + s t + 1
where st, rt, and qt are storage, release, and inflow at period t, respectively; g t ( s t , r t ) is single-period utility function; and G t ( s t ) is the maximum cumulative utility from period t (current period) to period T (end of the operation period). Equation (9) is a generalized formula that characterizes the reservoir operations of hydropower, water supply, flood control, and so on.

2.3.2. Progressive Optimality Algorithm (POA)

POA often starts with an initial solution obtained by engineering judgment, heuristic search algorithms and other methods. In this method, the initial solution was given based on the results of the DP method. Then, POA solves all the two-stage optimization sub-problems in a serial way. For the jth sub-problem, use Equation (10) to find an improved decision vector between stages j − 1 and j + 1.
F * ( S j 1 , S j , S j + 1 ) = min S j C j { F ( S j 1 , S j ) + F ( S j , S j + 1 ) }  
where Sj is the possible water level at the jth period, Cj is the set of water level at the jth period, F ( S j 1 , S j ) is the objective water level between stages j − 1 and j, F * ( S j 1 , S j , S j + 1 ) denotes the optimal objective water level between stages j − 1 and j +1.

3. Study Area

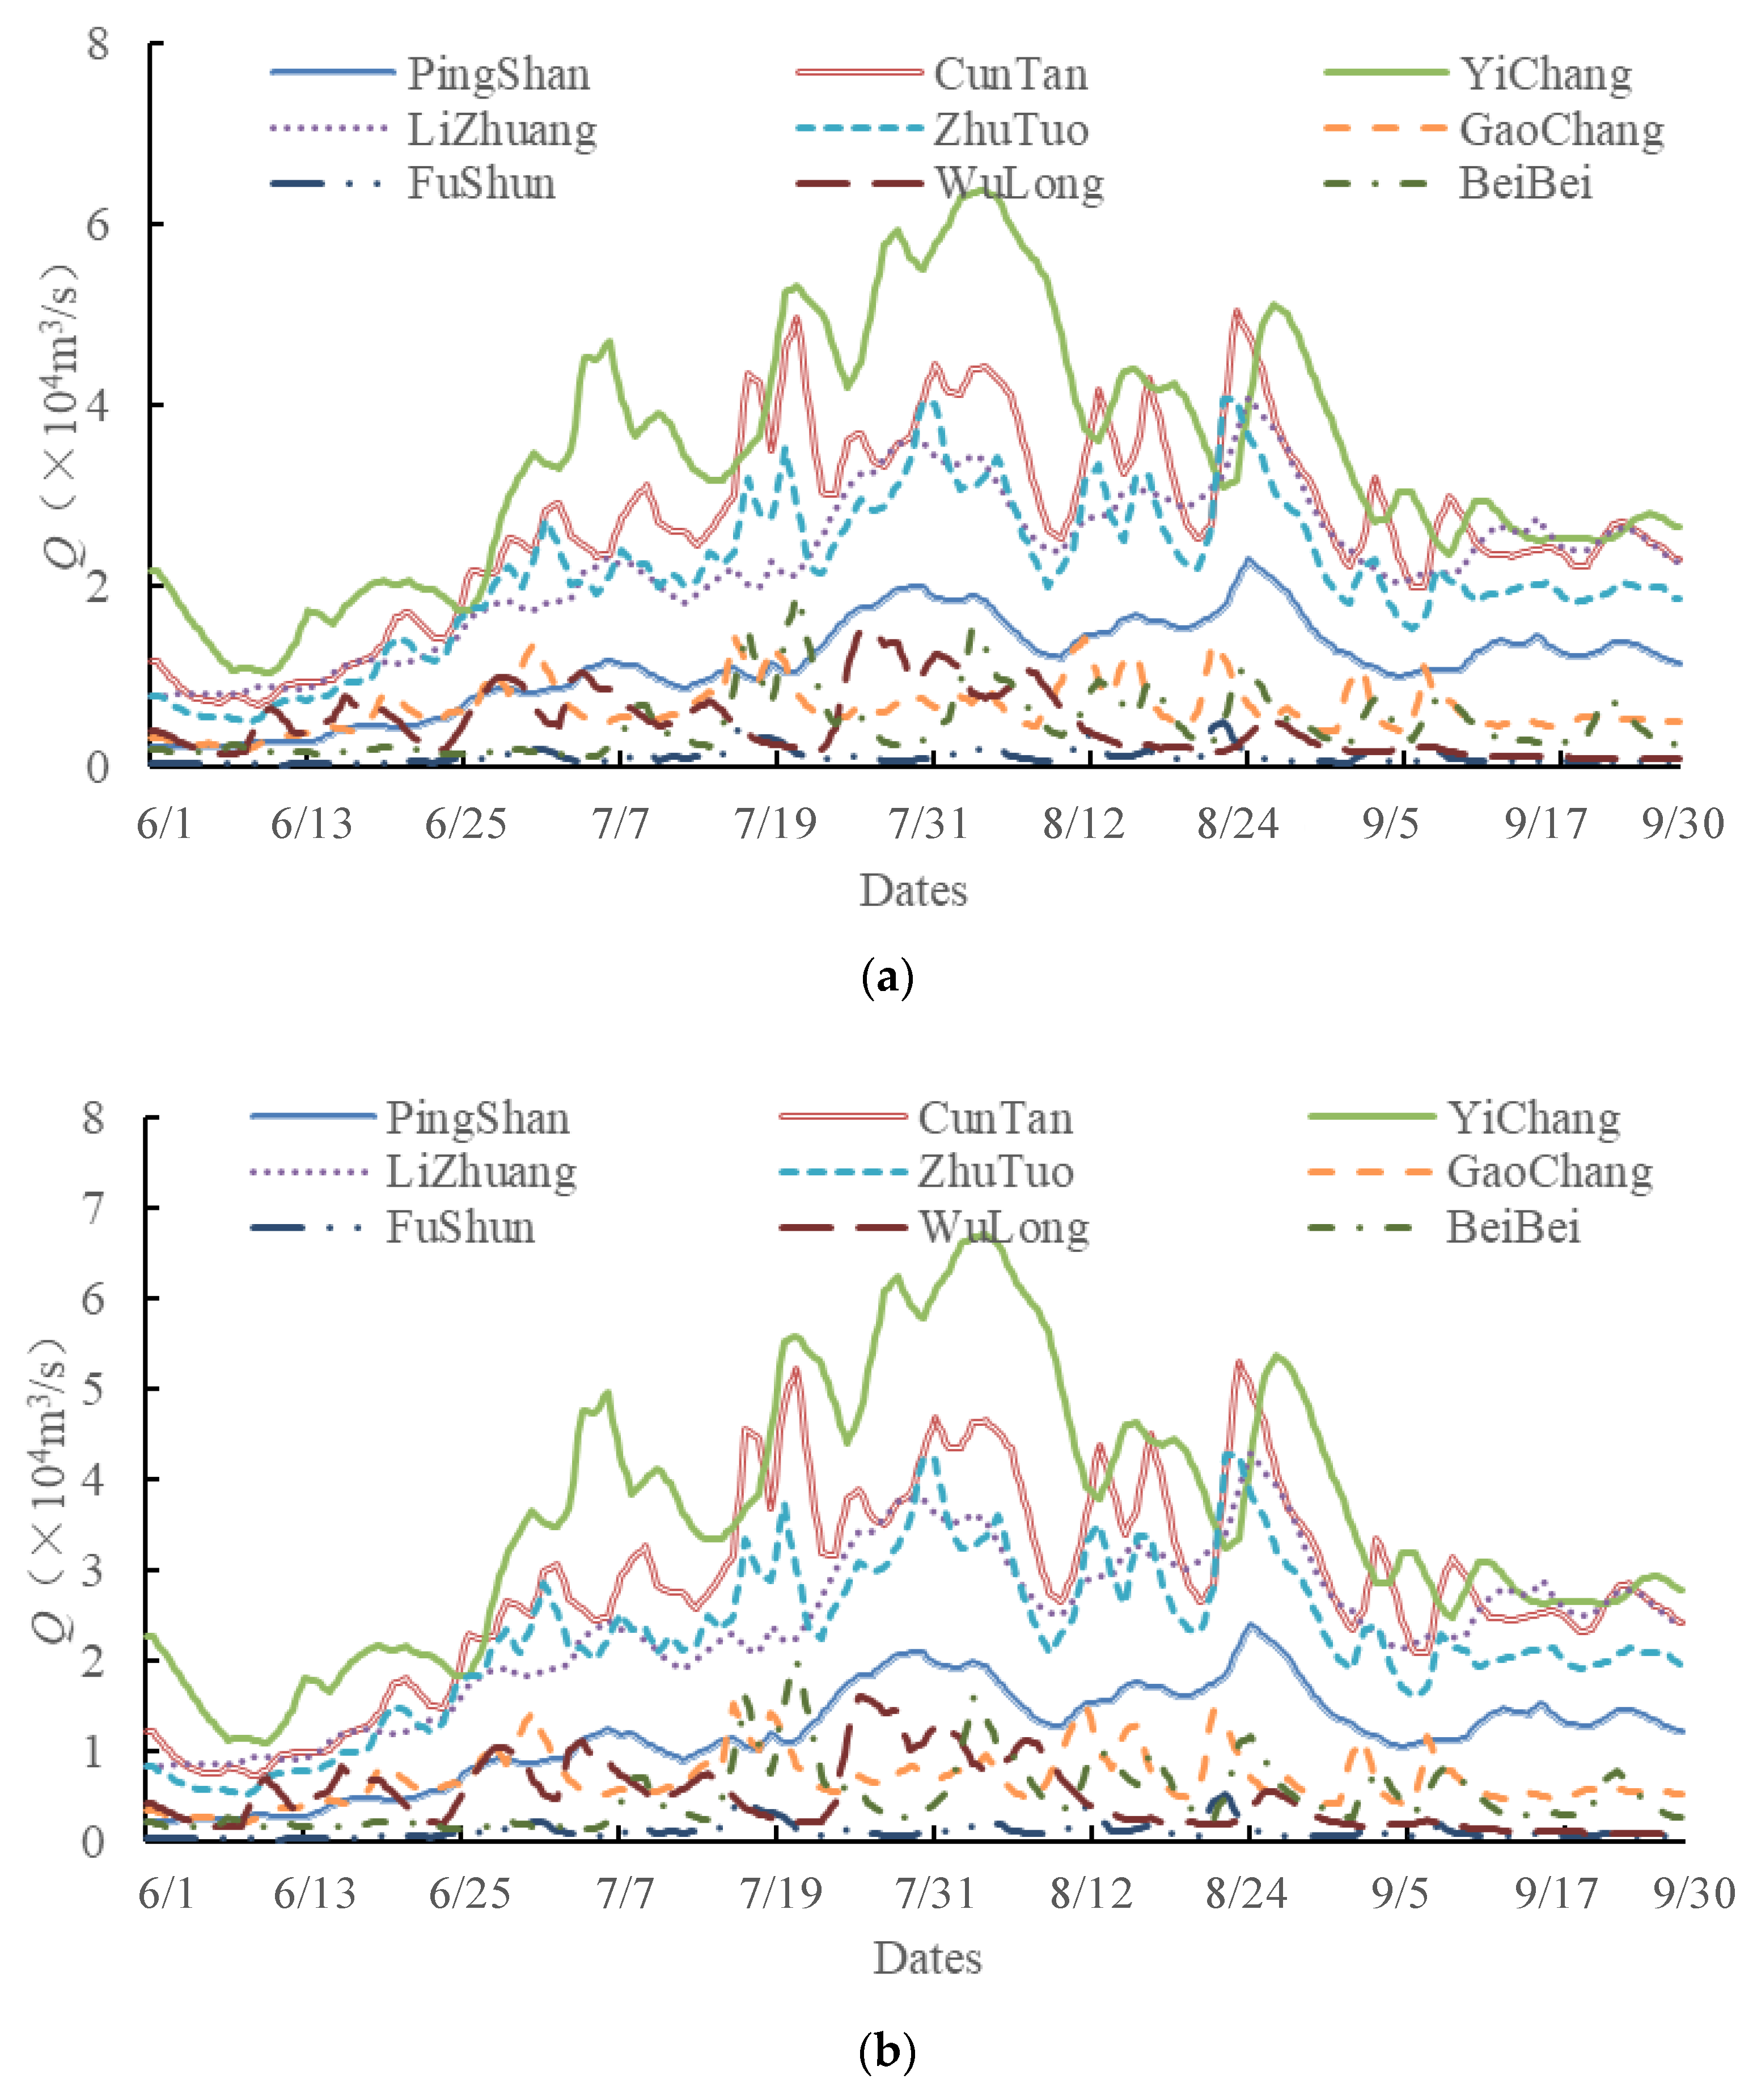
3.1. Introduction of Study Area

The upper Yangtze River is selected as a case study. The largest reservoir in China is created by the Three Gorges Dam (TGD), which stores 39.3 billion m3 of water and has a surface area of 1045 km2. The TGD is located on the Yangtze River, which is about 6300 km long and occupies 18.8% of China’s land area. The function of the TGD includes flood control, power generation and navigation and so on. Since the Yangtze River includes many devastating floods over the centuries killing thousands of people and causing millions of dollars in damage, among these functions, flood control is the most important one.
Floods in the middle and lower reaches of the Yangtze River mainly stem from the upper region of the Yichang gauging station, which is also the control site of TGD [44]. Usually the flood volume of the upper Yichang site is about 50% of the total flow volume of the Yangtze River, about 90% of the Jingjiang River reach that is part of the Yangtze River from the Zhicheng to Chenglinji gauging station and regarded as the most key area for flood prevention [44,45,46]. The Three Gorges Reservoir (TGR), which uses the available empty space of the reservoir to absorb the flood, can reduce the downstream flooding around the Jingjiang River and Dongting Lake areas and guarantee the safety of the Jingjiang River downstream when a 100-year flood occurs in TGD.
However, the flood control capacity of TGR with a capacity of 22.2 billion m3 is still not enough. If a flood event throughout the Yangtze River Basin is to occur, the TGD cannot hold back floods downstream of the dam (such as the 1954 flood that killed 30,000 people outright and more through starvation and disease). Thus, more reservoirs located upstream are needed to help TGD reduce the flood. The Xiluodu and Xiajiaba are two dams built in the Jinsha River, which is part of the Yangtze River upstream as shown in Figure 3.
The Xiluodu dam, located on the upper reach of the Yangtze River between Yunnan and Sichuan Provinces, is the third tallest arch dam in the world and a key component of the Jinsha River Project. It is also the second largest dam in China, next only to the TGD in terms of size, construction cost and generating capacity. The overall elevation of the dam crest is 600 m, with the concrete double-curvature arch being 285.5 m high and 700 m long. The reservoir capacity is about 12.7 billion m3 with 4.7 billion m3 for flood control. The Xiangjiaba dam is located downstream of the Xiluodu dam, which is only 157 km far from it. It is a large gravity dam on the Jinsha River. The flood control capacity is 0.9 billion m3. The total flood control capacity of both of the two dams are nearly 5.6 billion m3. The characteristics of the three dams are summarized in Table 1.
Five flood control areas considered in this study from upstream to downstream are Yinbin, Luzhou, Chongqing, Jingjiang and Chenglingji. The Xiluodu and Xiangjiaba reservoirs need to protect the cities Yibin and Luzhou from flooding, when the flood with a 20-year return period occurs, and protect the city Chongqing from flooding, when the 50-year return period flood occurs. The Xiluodu, Xiangjiaba and TGR operate together to protect the Jingjiang area from flooding, when a 100-year flood event occurs. The design standard for the TGR is 1000 years corresponding to the water level of 175 m. Therefore, the flood events with 50-year, 100-year and 1000-year return periods were considered in this study. Three major cities from upstream to downstream (Yibin, Luzhou, and Chongqing) are located along the Yangtze River. Among these cities, Chongqing is the most populous Chinese municipality, and also the largest directly controlled municipality in China, and comprises 26 districts, eight counties, and four autonomous counties. Yibin and Luzhou are two prefecture-level cities in the south-eastern part of Sichuan province, China. Yibin is located at the junctions of the Min River and Yangtze Rivers. Luzhou, situated at the confluence of the Tuo River and the Yangtze River, and is an important port on the Yangtze River. According to the 2015 census, these three major cities have a total population of about 41 million.
In recent years, the economy of the region around the Jingjiang River reach has continued to develop. Concretely, the current agricultural acreage area and aquatic area are 37,000 and 6500 square hectometers, respectively, while fixed assets in the district are valued at 9 billion yuan, and gross domestic product is 8.7 billion yuan. This area has become an important grain, cotton, and aquaculture base in China. Therefore, once a catastrophic flood occurred, the affected population is very large, and the economic losses are extremely high. Another flood control points is Chenglingji station which is the outlet of the Dongting Lake. There are many retention basins around the Chenglingji station, which is home to a lot of people. According to the Chinese flood control regulations, as the backbone of flood management measures for the mid-downstream Yangtze River Basin, the Three Gorges Reservoir provides enormous benefits to flood control for the Yangtze River. The operation of TGR has improved the flood control capacity of the Jingjiang River Reach downstream from 20-year to 100-year, and prevents devastating damage through combining the use of retention basins for the case of floods of 100–1000 years’ frequency. Additionally, it also reduces the possibility of using retention basins near the Chenglingji area to ensure the safety of life and property.

3.2. Data of Study Area

The Xiluodu and Xiajiaba reservoirs can provide certain flood capacity to store the flood occurring in the upper Yangtze River, especially the flood in the Jinsha River. However, under the condition of preventing the downstream cities—Yibin, Luzhou and Chongqing—from flooding as shown in Figure 3, how to use the two reservoirs rationally and effectively to reduce the inflow of TGR is a challenging task. In addition, besides those two reservoirs, how to use the flood capacity of TGR to realize the flood control of the Jingjiang River downstream effectively is another important task. Thus, since the flood control problems are much more complicated for cascade reservoirs with multiple flood control points, judicious operation methods during a flood event are needed.
The gauging station used in this study is shown in Figure 3 as well. From Xiangjiaba to Yichang, there are four main tributaries, namely Min, Tuo, Jialing, and Wu Rivers. The control sites for Min, Tuo, Jiangling, and Wu Rivers are Gaochang, Fushun, Beibei, and Wulong, respectively. The Yangtze River upper than Yibin is also named the Jinsha River, and the Yangtze River from Yibin to Yichang is also named the Chuan River because these areas belonged to Sichuang Province before. There are three flood control points located on the Chuang River reach, namely Yibin City, Luzhou City and Chongqing City; and there are two flood control points located downstream of the TGD, namely Jingjiang and Chenglingji areas. The Xiluodu and Xiangjiaba dams were employed to protect the cities of Yibin, Luzhou, and Chongqing from flooding. The TGD combined with the two dams operated together to guarantee the safety of the Jingjiang and Chenglingji areas.
Since the Xiluodu and Xiangjiaba dams are on the Jinsha River, the characteristics of the flood in the Jinsha River were discussed. The runoff in the Jinsha River Basin mainly concentrate in the period of June to October, which can account for 80% of the total annual runoff in the upper Jinsha River and 75% in the lower Jinisha River. The mean runoff and its percentage for each month at the Pingshan gauging station in the Jinsha River are given in Table 2. It is indicated from Table 2 that the river flow in July, August and September accounting for 54.0% of the total amount of the annual flow, and in June to November accounting for 81.2%.

4. Application

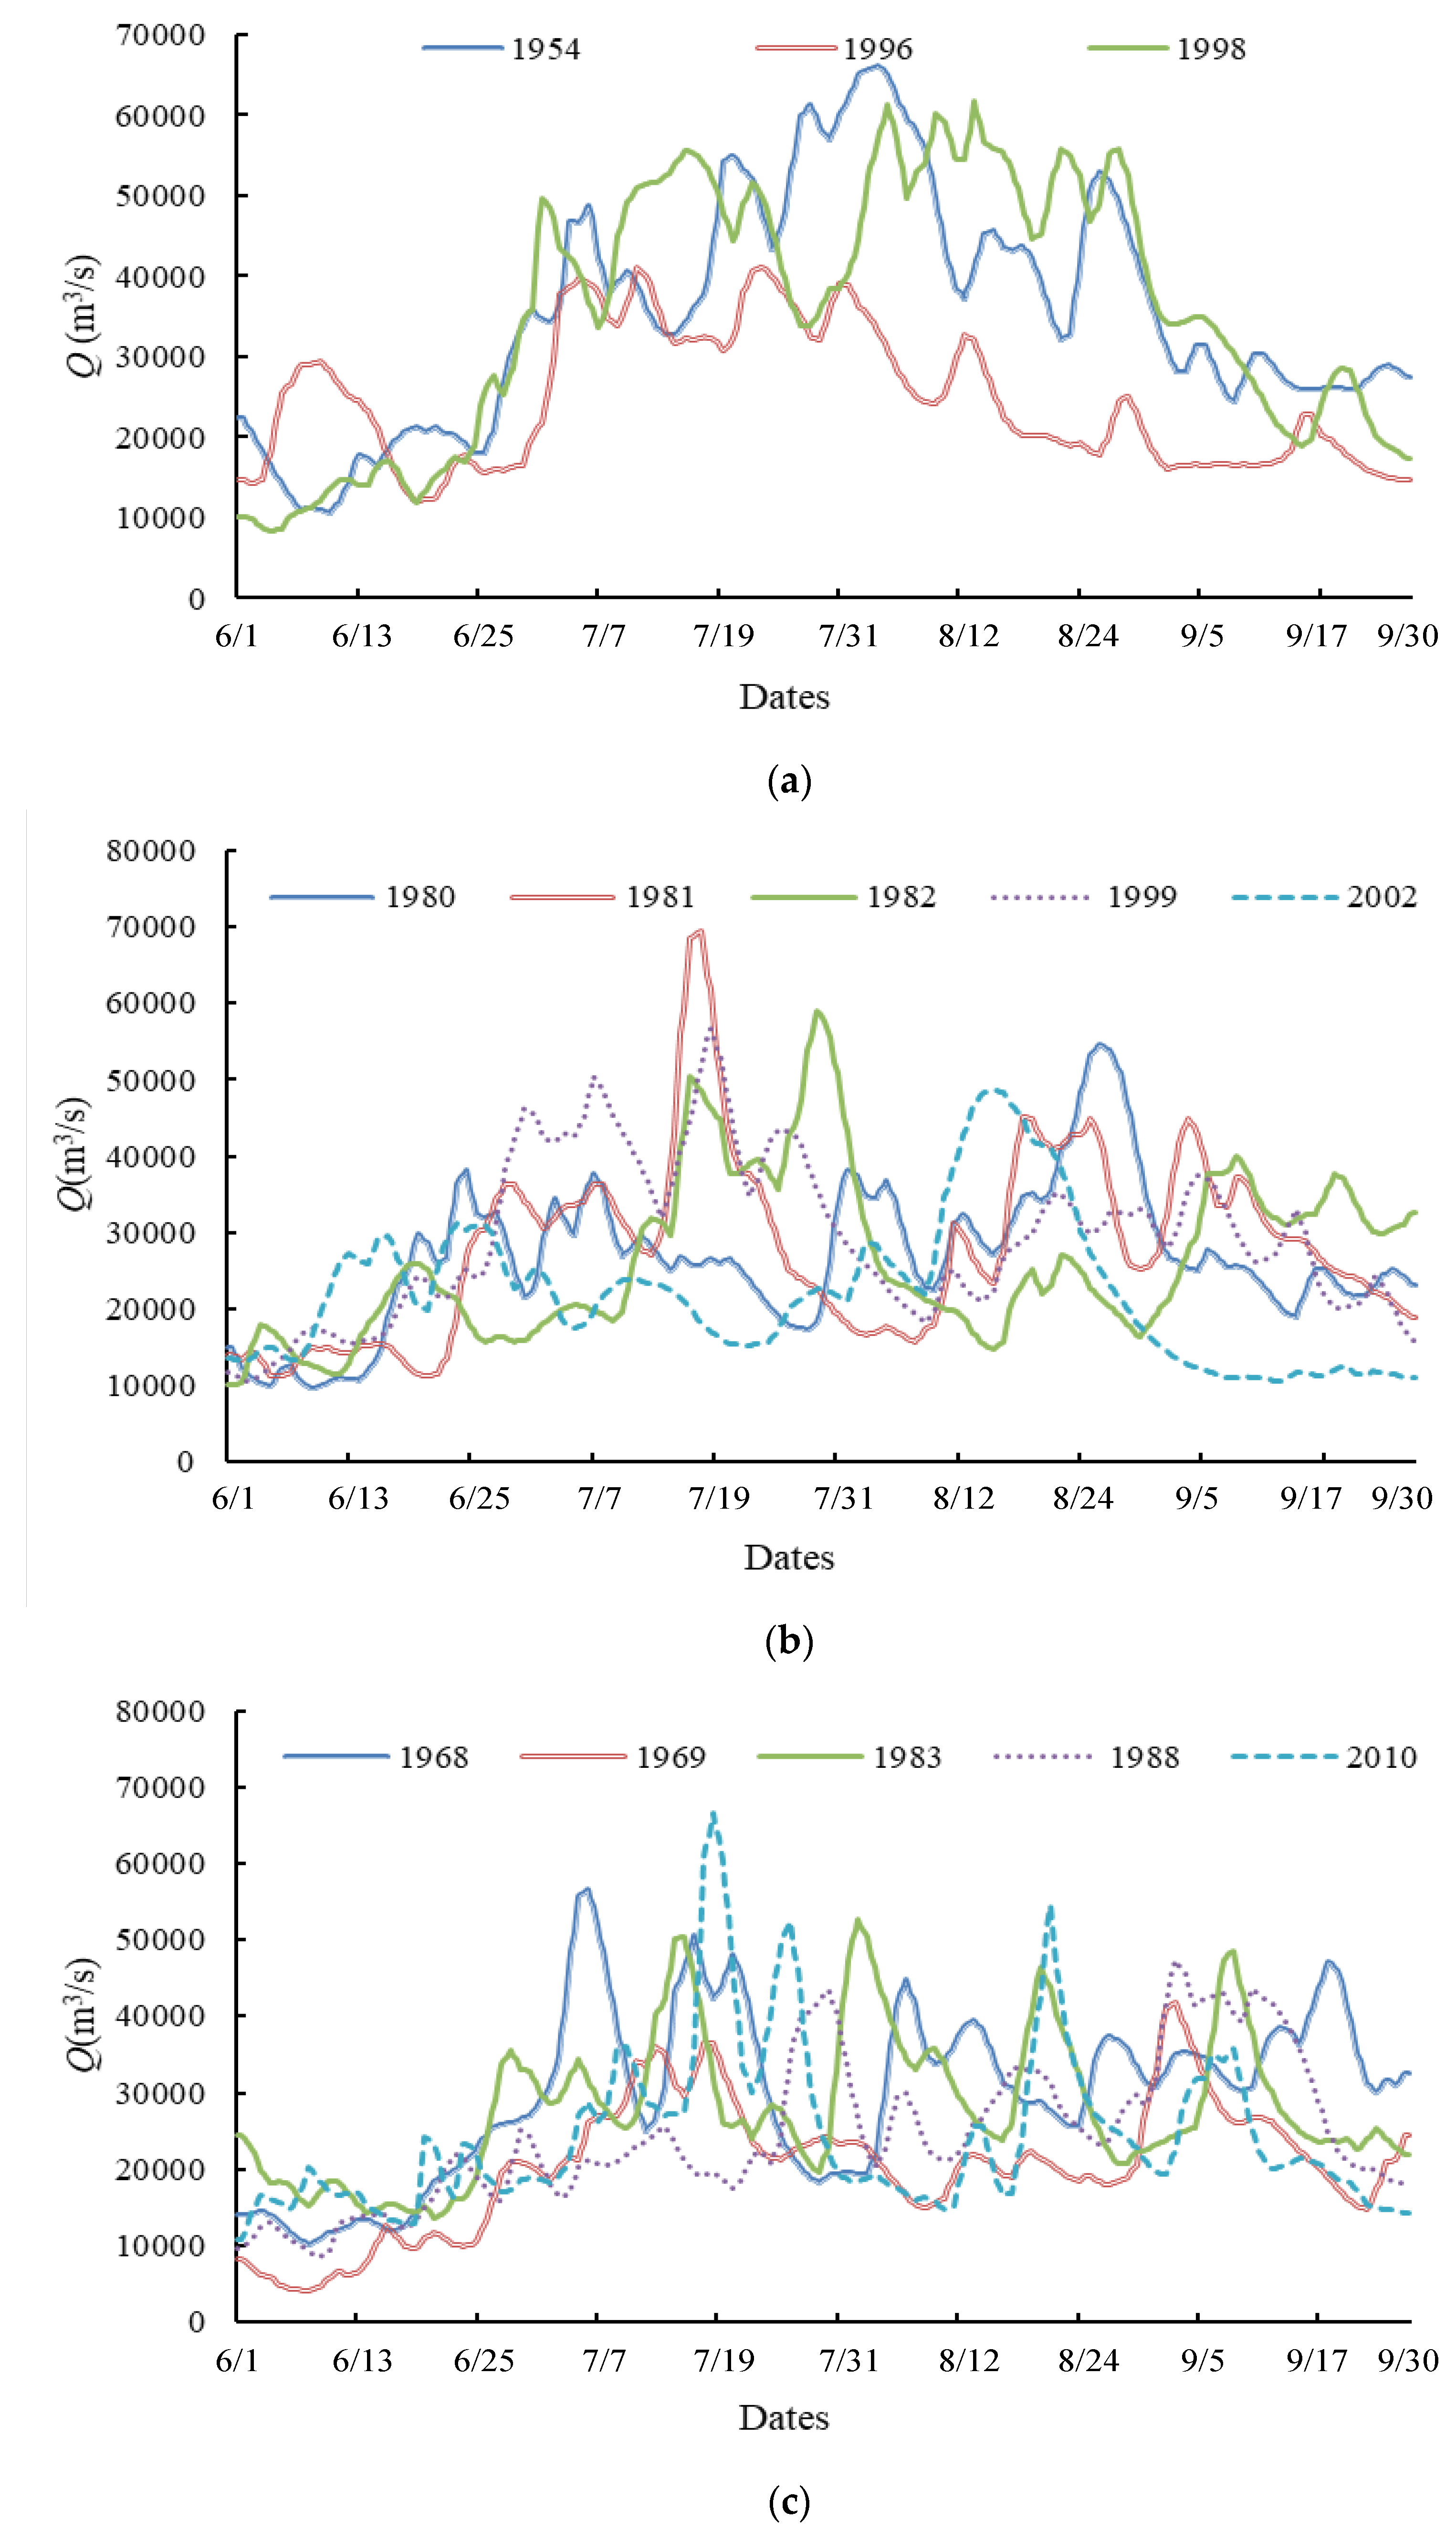
4.1. Design Flood Hydrographs

During the flood control reservoir operation, usually the extreme or large flood events were considered. Therefore, the input of the model is the T-year design flood hydrograph. One of the methods to derive the design flood hydrographs (DFH) is the typical flood hydrograph (TFH) method which has been widely used by practitioners [47,48]. The DFH can be obtained according to the following steps.
Step 1: The annual maximum (AM) sampling method was used in this study, and the AM peak or n-day volumes data were derived.
Step 2: The Pearson type three distribution was used to fit the AM data sets. The design flood peak or volumes for certain return periods, such as 50 years, 100 years and 1000 years, were obtained.
Step 3: The typical flood hydrographs (TFH) were determined. Usually, the observed flood hydrograph with highest peak or largest volume was selected as a TFH [49].
Step 4: The DFH was constructed by multiplying each discharge ordinate of the TFH by an amplifier [12,13]. Certain amplitude method was used to make the flood peak or volumes of TFH equaling to the design values. In this study, only the volume amplitude method was considered, in accordance with the practical situation. Assume that the T-year design and observed n-day flood volumes are W d T and W O respectively, and the amplifier with return period T is defined as kT, k T = W d T / W O . The TFH was transformed to DFH by multiplying the parameter kT. However, some other attributes, such as duration, were also considered for derivation of DFHs in some research works (e.g., Serinaldi and Grimaldi [50]; Vandenberghe et al. [51]; Gräler et al. [52]; Brunner et al. [53]), which were not considered in this study. The design flood hydrographs (DHFs) for the whole season can be obtained finally.
The floods in the years 1954, 1968, 1969, 1980, 1981, 1982, 1983, 1988, 1996, 1998, 1999, 2002 and 2010 were selected as TFHs in this study. Since the summer rainfall in the 1980s and 1990s is much higher than in the previous decades, eight flood hydrographs were selected during these periods [54]. The 1954 and 1998 floods are two serious flood events that happened in the past 100 years, which should be selected for flood control analysis. In the years of 1968 and 2002, the Wu River, which is a main tributary of the upper Yangtze river, experienced a severe flood [55]. Thus, the flood hydrographs of these two years were selected. In the year of 1969, extreme flood events happen simultaneously on the three main tributaries: the Jinsha, Min, and Tuo Rivers. In the year of 2010, the entire Yangtze River basin suffered from tremendous flooding, which led to the number of affected people as about 1.4 billion, and the direct economic loss of 197.6 billion Chinese yuan. According to the shape of these flood hydrographs, they can be divided into 3 types, namely the long duration type, single flood peak type and multiple flood peak type, which contain all the potential characteristics of flood events occurring in the upper Yangtze River Basin. The floods of 1954, 1996 and 1998 show long duration, which lasted for more than one month. For example, the 1954 and 1998 China floods lasted from middle of June to the beginning of September. There is only one main flood peak in the years of 1980, 1981, 1982, 1999 and 2002. In addition, there are multiple flood peaks in the years of 1968, 1969, 1983, 1988 and 2010. All the selected THFs are shown in Figure 4.
The duration of the flood hydrograph plays a key role in determination of the DFH. In this study, the hydrograph lasts for the whole flood season (1 June to 30 September) [56,57,58]. All typical flood hydrographs mentioned above were used to derive the DFHs. The volume amplitude method, namely the 30-day volume amplifier, was selected in this study to obtain the DFHs, in accordance with practical use. In other words, the 30-day volume amplifier was employed for amplifying the hydrograph of the whole flood season. Considering the length of the paper, only the design flood hydrographs based on the TFH of 1954 were shown in Figure 5.

4.2. Optimal Reservoir Operation Results

4.2.1. Operation Results of the Xiluodu and Xiangjiaba Reservoirs

The Xiluodu and Xiangjiaba Dams were used to reduce the inflow of TGR, which is also an effective method to alleviate the flood control burden of the Jingjiang and Chenglingji areas. A two-stage optimization algorithm was employed to solve the optimization model of the Xiluodu and Xiangjiaba cascade reservoirs, because of the “curse of dimensionality” and time-lag issue for multi-reservoir systems. First, the DP method was used to obtain the optimal solution set. Second, the output of the DP method was the input of the POA method, which avoids the influence of initial solutions on the optimal solutions. The years of 1954, 1968, 1969, 1980, 1981, 1982, 1983, 1988, 1996, 1998, 1999, 2002, and 2010 were selected as TFHs. The real-time water level and discharge at each time period were calculated by the flood hydrograph routing method.
Operation results of each DFH are given in Table 3, in which the inflow values of TGR and the flood stored in the Xiluodu and Xiangjiaba Dams are shown. The flood reductions are also given in Table 3.
As shown in Table 3, the Xiluodu and Xiangjiaba cascade reservoirs can obviously reduce the the inflow of TGR. For the 1000-year design flood, amplified based on the TFH of 1998, the maximum inflow of the Three Gorges decreased from 109,705.2 m3/s to 92,570.6 m3/s. The flood peak was reduced by 17,134.6 m3/s and its corresponding reducing rate was 15.6%. The average reduction of flood peak for all these 13 TFHs can reach 13.6%. Therefore, the decrease of the peak inflow can relieve the flood control burdens of TGD. Additionally, the cascade reservoirs can also store much more water during a flood event, and the maximum volumes stored in those two reservoirs upstream in this study can reach 252.1 × 10⁸ m3. It also can be seen from Table 3 that the two-stage optimization algorithm has a good performance in solving the cascade reservoirs optimization model. Furthermore, when the POA method was used in the second stage, the model shows higher efficiency. More water was stored in the two reservoirs, and the inflow of TGR was further reduced. For instance, the maximum inflow of the 100-year design flood based on 1998 TFH reduced to 59,905.7 m3/s in the first stage, and to 57,890.4 m3/s in the second stage.
Figure 6 presents the 1000-year design flood hydrographs of 1954, and the inflow of TGR after the reservoir operation. The inflows regulated by the cascade reservoirs are much flatter with smaller peak values, which means that the inflow is easier to control.

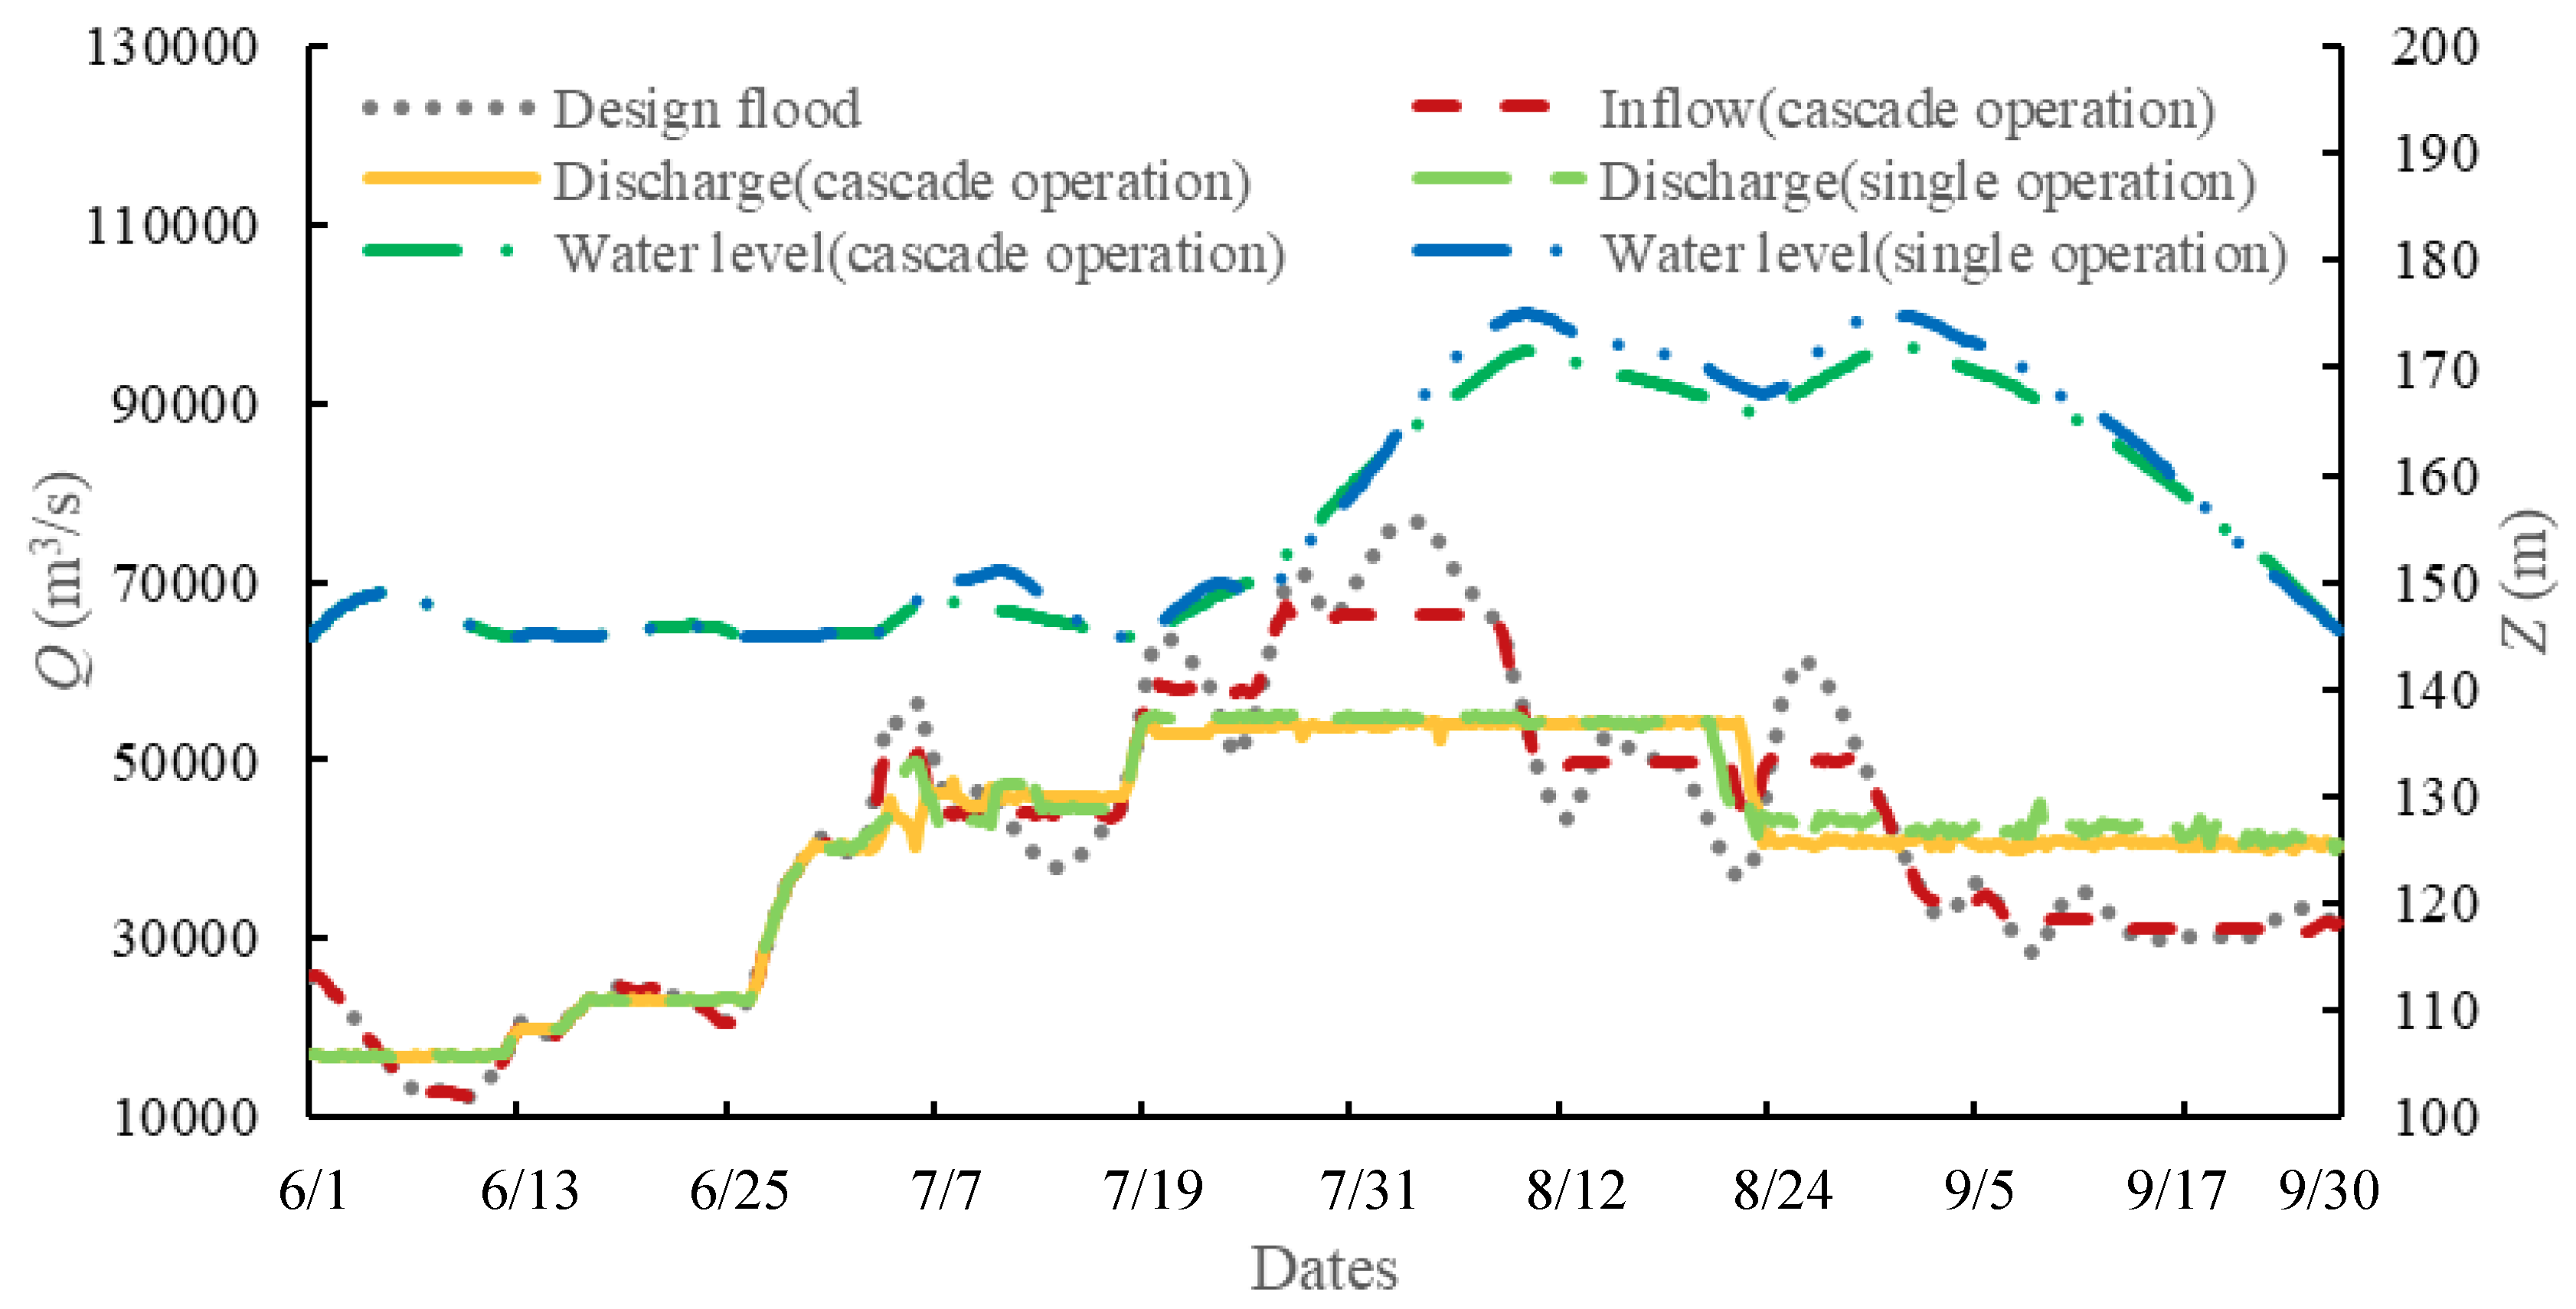
4.2.2. Operation Results of the Three Gorges Reservoir

Considering the flood control in the middle and lower reaches of the Yangtze River, this paper compared two operation methods, namely single reservoir operation model (TGR) and the cascade operation model (Xiluodu, Xiangjiaba and TGR).
Table 4 and Table 5 present the flood diversion volumes of each DFH at the Jingjiang and Chenglingji flood control points, respectively, when different operation models were used. As shown in Table 4, the flood in the Jingjiang area does not need to be diverged for all 50-year DFHs. That means both the single and cascade models can ensure the water level of the Jingjiang area not exceeding the safety water level, when a 50-year flood event occurs. For 100-year DHFs, the single model can protect the Jingjiang areas from flooding for most of DFHs, except for the year of 1968, which means that when a single reservoir is used, the 100-year flood control standard for the Jingjiang area cannot always be guaranteed. When the cascade model used, there is no need to diverse the flood volumes and the safety of this areas can be ensured for the flood events with the 100-year return period. Generally, the differences between single reservoir operation model and the cascade models are not so obvious for the 50-year and 100-year DFHs. But for the 1000-year DFHs, it is clear from Table 4 that the flood diversion volumes obtained by the cascade operation model are less than those by the single reservoir model. For example, for the 1000-year design flood amplified based on the TFH of 1988, the flood diversion at the Jingjiang flood control point is 20.1 billion m3 calculated by the single operation model, but reduced to zero when the Xiluodu and Xiangjiaba reservoirs were taken into accounts. It can be seen from Table 5 that the volumes decrease significantly when the cascade reservoir models are used. Table 4 and Table 5 show that the cascade optimal operation model works better than single operation model in reducing the flood diversion volumes in the Jingjiang and Chenglingji areas.
Table 6 gives the highest water level of TGR of each TFH with different return periods, for the flood control of the Jingjiang area, and Table 7 for the flood control of both the Jiangjiang and Chenglingji areas. Table 6 and Table 7 illustrate that the highest water level of TGR generally is lower, when the cascade optimal operation model was considered instead of the single operation model. For the cascade optimal operation model considering the Jingjiang flood control point only, the highest water level nearly reached 170 m for the 1000-year DFH amplified by three TFHs. For a 100-year design flood, the maximum highest water level was 164.1 m, and the minimum was only 150.8 m. These results indicate that when the cascade optimal operation model is in use, the safety of TGR can be ensured, but the reservoir’s flood control capacity is underutilized only considering the Jingjiang flood control area. Furthermore, as shown in Table 7, when both the Jingjiang and Chenglingji flood control points were taken into account, the highest water level of TGR rises obviously, which proves that the flood control capacity of TGR is further utilized. Thus, both the Jingjiang and Chenglingji flood control areas can be protected in a practical flood control operation.
Figure 7 presents the discharge and water level hydrographs of TGR calculated by single and cascade optimal operation models, considering the flood control in the Chenglingji area, for the 1000-year design flood of the year 1954. This figure demonstrates that results obtained by the cascade optimal operation model is generally better than that obtained by single operation, since the peak value is much smaller and the discharge curve is much flatter. Especially, the highest water level of TGR was also lower.

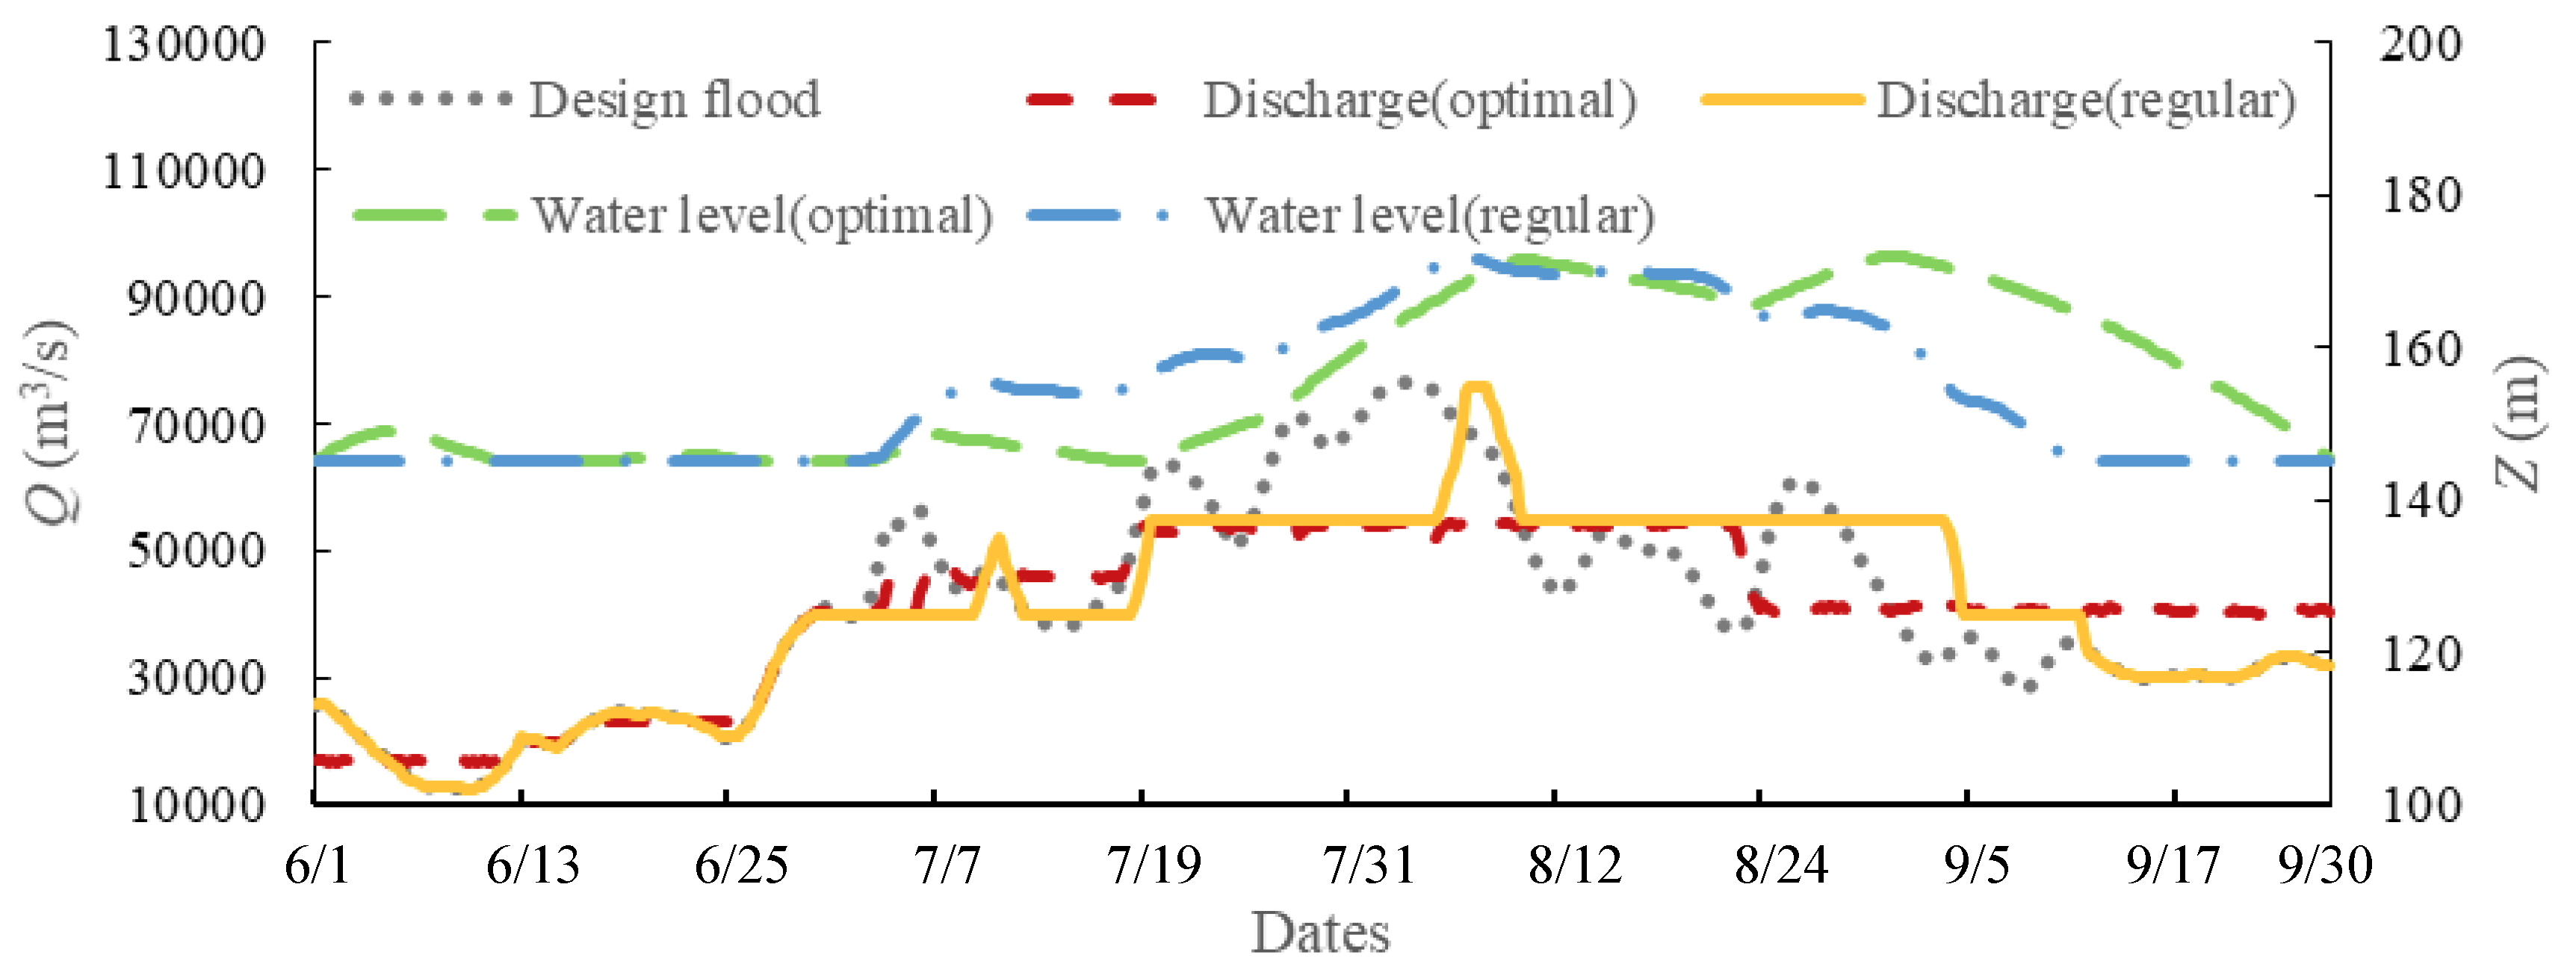
4.3. Comparisons with the Current Operation Rules of Xiluodu, Xiangjiaba and TGD in the Flood Season

To testify the feasibility of the cascade optimal operation model, this paper also compares the optimal operation model with current operation method of these three dams, where the TFHs in use are the same as those mentioned in Section 4.1 in this paper.
The flood diversion volumes at the Jingjiang and Chenglingji flood control points were calculated by the optimal and current operation models, since the objective of the reservoir operation is to minimize the flood diversion volumes at the control points. As shown in Table 8 and Table 9, compared with the current operation model, the flood diversion volumes calculated by the optimal operation rules decrease significantly. From this point of view, the optimal model, which has the smaller flood diversion volumes, performs better than the current operation model. For the 50-year and 100-year design flood, when both of the two methods are used, the safety of the Jingjiang area can be ensured. But for the 1000-year DFHs the cascade optimal operation method has a better performance than the current used model, obviously. For instance, for the 1000-year design flood based on the TFH of 1999, the flood diversion volumes in the Jingjiang area obtained by the current operation method are 13.8 billion m3 (considering the Jingjiang flood control point only) and 18.2 billion m3 (considering the Jingjiang and Chenglingji flood control points); while they are the optimal operation models used, these diversion values can be reduced to 8.9 billion m3 for both of the flood control points. This improvement is much more significant for the Chenglingji area. Generally, the cascade optimal operation model can be with less flood diversion volumes than the current operation model for all DFHs with different return periods. Hence, it can be concluded that the cascade optimal operation model can improve the flood control capacity in the middle and lower reaches of the Yangtze River, compared with the current operation model. All the results obtained by the two models do not consider the uncertainties in flood control reservoir operation, which can be discussed in future research.
Figure 8 displays the 1000-year design inflow flood hydrograph of 1954, in which one hydrograph is operated by the current operation model and the other by the Xiluodu and Xiangjiaba cascade optimal operation model. Figure 9 shows the discharge and water level curves of TGR obtained respectively by current and cascade optimal operation models considering the flood control of the Chenglingji area. It is obvious that when using the cascade optimal operation model, both the inflow and discharge hydrographs of TGR are flatter and have smaller peak values than those obtained by the current model. For example, the maximum discharge value of 1980 DHF with the return period 1000 years reduces from 76,000 m3/s to 54,995 m3/s, which can ensure the safety of the Jingjiang River reach. These results also indicate that the capacities of the Xiluodu and Xiangjiaba reservoirs were further utilized when the cascade optimal operation model was used, which alleviates the flood control burdens of TGR.
In order to further testify the reliability of the model, the historical observations, including the flood hydrographs of the years 1954, 1968, and 1998, were considered in this section and taken as the inputs of the current and optimal models. The highest water level of TGR routed by the proposed and current models are shown in Table 10, which indicates that the highest water level of TGR generally is lower based on the optimal model.
According to the comparisons given in Table 10, it can be seen that the cascade optimal operation model can produce superior results to the current operation model. Therefore, the flood control capacity of the middle and lower reaches of the Yangtze river can be enhanced. The cascade optimal operation model built in this paper worked well in a multi-reservoir flood control operation system, and can be considered in practical application.

5. Conclusions and Discussions

This study established optimal flood control operation models of cascade reservoirs for flood control of multiple points downstream. The current multi-reservoir flood control co-operation models mainly concern minimizing the maximal water level for the dam itself or the releases at the downstream flood control points, or balancing the conflict between the flood control and conservation during the flood season. In this study, a two-stage optimal operation model of cascade reservoirs was proposed to ensure the safety of multiple downstream areas, in which the objective functions are to minimize the inflow of the reservoir C downstream in the first stage and the water level or flood diversion volume in the second stage. For a large river basin, the river reach is very long, the time-lag issue and Muskingum flood routing along the river cannot be neglected. A DP-POA optimal algorithm was proposed in this study for the establishment of the optimal model to avoid the curse of dimensionality and influence of initial solutions. The upper Yangtze River was selected as a case study. The flood capacity of TGR cannot hold back floods downstream, when extreme flooding occurred throughout the whole upper Yangtze River Basin. Therefore, more reservoirs are needed to help TGR realize the purpose of flood control. The two reservoirs, Xiluodu and Xiangjiaba located in the Jinsha River Basin, were considered in this study to reduce the inflow of TGR. The main conclusions of this paper are summarized as follows.
(1) The first innovation of this paper is the proposed two-stage optimal operation model with different objective functions. In the first stage, the optimal operation model of Reservoirs A and B was established to reduce the inflow of the downstream reservoir. In the second stage, the optimal operation model of the reservoir downstream was established to minimize the highest water level and the flood diversion volumes at flood control points. The second innovation of this paper is the proposed DP-POA algorithm, which can solve the curse of dimensionality and influence initial solutions effectively. The results of Figure 6 and Figure 7 indicate that optimal reservoir operation processes can be obtained. The Muskingum flood routing method combined with the time delay makes the operation’s results much more objective. The two-stage optimization algorithm has a good performance in solving the cascade reservoirs optimization model. When the POA method was used in the second stage, the model shows higher efficiency as more water is stored in the two reservoirs and the inflow of the reservoir downstream is further reduced.
(2) Based on the proposed model, the Xiluodu and Xiangjiaba Reservoirs can effectively reduce the peak inflow and volumes of TGR. After the optimal reservoir operation of Xiluodu and Xiangjiaba, the average reduction of flood peaks for all these 13 TFHs are 13.6%. Meanwhile, the cascade reservoirs can also store much more water during a flood event, and the maximum volumes stored in those two reservoirs upstream in this study can reach 25.2 billion m3 during a flood event.
(3) The cascade optimal operation model works better than the single operation model. The highest water level of TGR is generally lower when the cascade optimal operation model is considered instead of the single operation model. For the 1000-year DFHs, it is obvious that the flood diversion volumes obtained by the cascade operation model are less than those by the single reservoir model. After the optimal operation of cascade reservoirs, the peak value is much smaller and the discharge curve is much flatter, which is beneficial for the flood control of the middle and lower reaches of the Yangtze River.
(4) Compared with the current operation rules, the cascade optimal operation model can produce a superior result to the current operation model. For the 50-year and 100-year design floods, when both of the two methods were used, the safety of the Jingjiang area can be ensured. But for the 1000-year DFHs, the cascade optimal operation method has a better performance than the current one obviously. For the 1000-year design flood amplified based on the TFH of 1999, the diversion values can decline to 8.9 billion m3 for both of the Jingjiang and Chengliangji flood control points, when the cascade optimal operation model was used.
This paper only discussed the downstream flood control points that are protected by cascade reservoirs upstream. The proposed work can give some guidance for real-time flood management. Flood control reservoir operation rules can be developed based on the optimal results. In future, more reservoirs, including cascade reservoirs and parallel reservoirs, will be considered, and a more efficient algorithm will be proposed. Furthermore, the main purpose of this paper is to discuss the protection of the flood control areas downstream based on the multi-reservoir systems. The overtopping risk of the dam is not discussed in the paper.
In addition, many uncertainties also present in this complex problem have an influence on the flood control reservoir operation. Shi et al. [59], Zhang et al. [60] and Chen et al. [61] indicated that the most important uncertainty factor that affects the flood control reservoir operation was the flood forecast error. The predicted flow is the input of the flood control reservoir operation model, which has a great influence on the operation results. Besides flood forecast errors, Li et al. [19] and Huang et al. [62] demonstrated that the uncertainties in flood hydrograph shape also had a significant influence on the highest water level and maximum discharge. Besides these, Chen et al. [63] indicated that the uncertainties in the discharge capacity curve and water level-storage curve also influenced reservoir operation greatly. Onyutha and Willems [4] assessed the uncertainties in estimation of flood quantiles and/or hydrographs, especially of very high return periods which is useful for various types of risk-based water management applications related to floods. These uncertainties were not considered in this deterministic modelling, because of the burden of the optimal calculation. Stochastic frameworks, which can work better for these uncertainty problems, will be studied in the future research.

Author Contributions

C.Z. proposed the ideas of this paper and guided the writing and calculation work; L.C. designed the experiments and wrote most parts of the paper; N.S. prepared the manuscript and made some corrections; Y.D. and J.Z. made some corrections; G.Z., L.D., G.L. and X.Y. together did the calculation work and draw the figures.

Funding

This research was funded by the National Key R&D Program of China, grant number [2017YFC0405900, 2016YFC0402210, 2016YFC0402205]; the National Natural Science Foundation of China, grant number [51679094]; and the project with the title of “impact of flood control multi-reservoir co-operation in the upper Yangtze River Basin on the Three Gorges Reservoir and its corresponding risk analysis”. The APC was funded by the National Key R&D Program of China, grant number [2017YFC0405900].

Acknowledgments

This research was founded by the National Key R&D Program of China, grant number [2017YFC0405900, 2016YFC0402210; 2016YFC0402205]; the National Natural Science Foundation of China, grant number [51679094]; and the project with the title of “impact of flood control multi-reservoir co-operation in the upper Yangtze River Basin on the Three Gorges Reservoir and its corresponding risk analysis”.

Conflicts of Interest

The authors declare no conflict of interest.

References

  1. Webster, T.; Mcguigan, K.; Collins, K.; Macdonald, C. Integrated river and coastal hydrodynamic flood risk mapping of the lahave river estuary and town of Bridgewater, Nova Scotia, Canada. Water 2014, 6, 517–546. [Google Scholar] [CrossRef]
  2. Schnebele, E.; Cervone, G.; Kumar, S.; Waters, N. Real time estimation of the calgary floods using limited remote sensing data. Water 2014, 6, 381–398. [Google Scholar] [CrossRef]
  3. Morita, M. Flood risk impact factor for comparatively evaluating the main causes that contribute to flood risk in urban drainage areas. Water 2015, 6, 253–270. [Google Scholar] [CrossRef]
  4. Onyutha, C.; Willems, P. Uncertainties in flow-duration-frequency relationships of high and low flow extremes in lake victoria basin. Water 2013, 5, 1561–1579. [Google Scholar] [CrossRef]
  5. Assani, A.; Landry, R.; Labrèche, M.; Frenette, J.J.; Gratton, D. Temporal variability of monthly daily extreme water levels in the st. Lawrence river at the sorel station from 1912 to 2010. Water 2014, 6, 196–212. [Google Scholar] [CrossRef]
  6. Joo, J.; Lee, J.; Kim, J.H.; Jun, H.; Jo, D. Inter-event time definition setting procedure for urban drainage systems. Water 2013, 6, 45–58. [Google Scholar] [CrossRef]
  7. Keast, D.; Ellison, J. Magnitude frequency analysis of small floods using the annual and partial series. Water 2013, 5, 1816–1829. [Google Scholar] [CrossRef]
  8. Box, P.; Thomalla, F.; van den Honert, R. Flood risk in australia: Whose responsibility is it, anyway? Water 2013, 5, 1580–1597. [Google Scholar] [CrossRef]
  9. Zhou, Y.L.; Guo, S.L.; Chang, F.J.; Liu, P.; Chen, A.B. Methodology that improves water utilization and hydropower generation without increasing flood risk in mega cascade reservoirs. Energy 2018, 143, 785–796. [Google Scholar] [CrossRef]
  10. Zhang, W.; Liu, P.; Chen, X.; Wang, L.; Ai, X.; Feng, M.; Liu, D.; Liu, Y. Optimal operation of multi-reservoir systems considering time-lags of flood routing. Water Resour. Manag. 2016, 30, 523–540. [Google Scholar] [CrossRef]
  11. Chen, C.; Yuan, Y.; Yuan, X. An improved nsga-iii algorithm for reservoir flood control operation. Water Resour. Manag. 2017, 31, 4469–4483. [Google Scholar] [CrossRef]
  12. Chen, L.; Singh, V.; Huang, K. Bayesian technique for the selection of probability distributions for frequency analyses of hydrometeorological extremes. Entropy 2018, 20, 117. [Google Scholar] [CrossRef]
  13. Chen, L.; Singh, V.P. Entropy-based derivation of generalized distributions for hydrometeorological frequency analysis. J. Hydrol. 2018, 557, 699–712. [Google Scholar] [CrossRef]
  14. Narasaiah, M.L. Microcredit and Agricultural Development; Discovery Publish House: New Delhi, India, 2007. [Google Scholar]
  15. Liu, X.; Chen, L.; Zhu, Y.; Singh, V.P.; Qu, G.; Guo, X. Multi-objective reservoir operation during flood season considering spillway optimization. J. Hydrol. 2017, 552, 554–563. [Google Scholar] [CrossRef]
  16. Yazdi, J.; Neyshabouri, S.A.A.S. Optimal design of flood-control multi-reservoir system on a watershed scale. Nat. Hazards 2012, 63, 629–646. [Google Scholar] [CrossRef]
  17. Lee, S.Y.; Hamlet, A.F.; Fitzgerald, C.J.; Burges, S.J. Optimized flood control in the columbia river basin for a global warming scenario. J. Water Resour. Plan. Manag. ASCE 2009, 135, 440–450. [Google Scholar] [CrossRef]
  18. Qi, Y.; Yu, J.; Li, X.; Wei, Y.; Miao, Q. Reservoir flood control operation using multi-objective evolutionary algorithm with decomposition and preferences. Appl. Soft Comput. 2017, 50, 21–33. [Google Scholar] [CrossRef]
  19. Li, X.; Guo, S.; Liu, P.; Chen, G. Dynamic control of flood limited water level for reservoir operation by considering inflow uncertainty. J. Hydrol. 2010, 391, 126–134. [Google Scholar] [CrossRef]
  20. Chen, J.; Guo, S.; Li, Y.; Liu, P.; Zhou, Y. Joint operation and dynamic control of flood limiting water levels for cascade reservoirs. Water Resour. Manag. 2013, 27, 749–763. [Google Scholar] [CrossRef]
  21. Zhou, Y.; Guo, S.; Liu, P.; Xu, C. Joint operation and dynamic control of flood limiting water levels for mixed cascade reservoir systems. J. Hydrol. 2014, 519, 248–257. [Google Scholar] [CrossRef]
  22. He, X.; Zhang, L.; Liu, L. Study on flood control operation of jinsha river cascade reservoirs combined with the three gorges along the yangtze river. Mater. Sci. Eng. 2017, 199, 012032. [Google Scholar]
  23. Sahoo, B. Field application of the multilinear muskingum discharge routing method. Water Resour. Manag. 2013, 27, 1193–1205. [Google Scholar] [CrossRef]
  24. Khan, M.H. Muskingum flood routing model for multiple tributaries. Water Resour. Res. 1993, 29, 1057–1062. [Google Scholar] [CrossRef]
  25. Gill, M.A. Flood routing by the muskingum method. J. Hydrol. 1978, 36, 353–363. [Google Scholar] [CrossRef]
  26. Yeh, W.W.G. Reservoir management and operations models: A state-of-the-art review. Water Resour. Res. 1985, 21, 1797–1818. [Google Scholar] [CrossRef]
  27. Choudhury, P. Reservoir flood control operation model incorporating multiple uncontrolled water flows. Lakes Reserv. Res. Manag. 2010, 15, 153–163. [Google Scholar] [CrossRef]
  28. Hall, W.A.; Butcher, W.S.; Esogbue, A. Optimization of the operation of a multiple-purpose reservoir by dynamic programming. Water Resour. Res. 1968, 4, 471–477. [Google Scholar] [CrossRef]
  29. Loucks, D.P.; Sigvaldason, O.T. Multiple-Reservoir Operation in North America; American Society of Civil Engineers (ASCE): Reston, VA, USA, 1982; pp. 711–728. [Google Scholar]
  30. Labadie, J.W. Optimal operation of multireservoir systems: State-of-the-art review. J. Water Resour. Plan. Manag. 2004, 130, 93–111. [Google Scholar] [CrossRef]
  31. Butcher, W.S. Stochastic dynamic programming for optimum reservoir operation. Water Resour. Bull. 1971, 7, 115–123. [Google Scholar] [CrossRef]
  32. Yeh, W.W.G.; Becker, L.; Chu, W.-S. Real-time hourly reservoir operation. J. Water Resour. Plan. Manag. Div. Am. Soc. Civ. Eng. 1979, 105, 187–203. [Google Scholar]
  33. Yakowitz, S. Dynamic programming applications in water resources. Water Resour. Res. 1982, 18, 673–696. [Google Scholar] [CrossRef]
  34. Kelman, J.; Stedinger, J.R.; Cooper, L.A.; Hsu, E.; Sun-Quan, Y. Sampling stochastic dynamic programming applied to reservoir operation. Water Resour. Res. 1990, 26, 447–454. [Google Scholar] [CrossRef]
  35. Heidari, M.; Chow, V.T.; Kokotović, P.V.; Meredith, D.D. Discrete differential dynamic programing approach to water resources systems optimization. Water Resour. Res. 1971, 7, 273–282. [Google Scholar] [CrossRef]
  36. Chow, V.T.; Cortes-Rivera, G. Application of DDDP in Water Resources Planning; University of Illinois at Urbana-Champaign. Water Resources Center: Saint Paul, MN, USA, 1974. [Google Scholar]
  37. Cheng, C.T.; Wang, S.; Chau, K.W.; Wu, X.Y. Parallel discrete differential dynamic programming for multireservoir operation. Environ. Model. Softw. 2014, 57, 152–164. [Google Scholar] [CrossRef] [Green Version]
  38. Larson, R.E.; Korsak, A.J. A Dynamic Programming Successive Approximations Technique with Convergence Proofs; Pergamon Press, Inc.: Oxford, UK, 1970; pp. 245–252. [Google Scholar]
  39. Erkmen, I.; Karatas, B. Short-term hydrothermal coordination by using multi-pass dynamic programming with successive approximation. In Proceedings of the Mediterranean Electrotechnical Conference (MELECON ’94), Antalya, Turkey, 12–14 April 1994; Volume 923, pp. 925–928. [Google Scholar]
  40. Liu, P.; Cai, X.M.; Guo, S.L. Deriving multiple near-optimal solutions to deterministic reservoir operation problems. Water Resour. Res. 2011, 47, 20. [Google Scholar] [CrossRef]
  41. Howson, H.R.; Sancho, N.G.F. A new algorithm for the solution of multi-state dynamic programming problems. Math. Program. 1975, 8, 114–116. [Google Scholar] [CrossRef]
  42. Turgeon, A. Optimal short-term hydro scheduling from the principle of progressive optimality. Water Resour. Res. 1981, 17, 481–486. [Google Scholar] [CrossRef]
  43. Guo, S.L.; Chen, J.H.; Li, Y.; Liu, P.; Li, T.Y. Joint operation of the multi-reservoir system of the three gorges and the qingjiang cascade reservoirs. Energies 2011, 4, 1036–1050. [Google Scholar] [CrossRef]
  44. Chen, L.; Singh, V.P.; Guo, S.L.; Hao, Z.C.; Li, T.Y. Flood coincidence risk analysis using multivariate copula functions. J. Hydrol. Eng. 2012, 17, 742–755. [Google Scholar] [CrossRef]
  45. Chen, L.; Ye, L.; Singh, V.; Asce, F.; Zhou, J.; Guo, S. Determination of input for artificial neural networks for flood forecasting using the copula entropy method. J. Hydrol. Eng. 2014, 19, 217–226. [Google Scholar] [CrossRef]
  46. Chen, L.; Singh, V.P.; Guo, S.; Zhou, J.; Zhang, J. Copula-based method for multisite monthly and daily streamflow simulation. J. Hydrol. 2015, 528, 369–384. [Google Scholar] [CrossRef]
  47. Nezhikhovsky, R.A. Channel Network of the Basin and Runoff Formation; Hydrometeorological Publishing: Leningrad, Russia, 1971. [Google Scholar]
  48. Yue, S.; Ouarda, T.B.M.J.; Bobée, B.; Legendre, P.; Bruneau, P. Approach for describing statistical properties of flood hydrograph. J. Hydrol. Eng. 2002, 7, 147–153. [Google Scholar] [CrossRef]
  49. Chen, L.; Guo, S.L.; Yan, B.W.; Liu, P.; Fang, B. A new seasonal design flood method based on bivariate joint distribution of flood magnitude and date of occurrence. Hydrol. Sci. J. 2010, 55, 1264–1280. [Google Scholar] [CrossRef] [Green Version]
  50. Serinaldi, F.; Grimaldi, S. Synthetic design hydrographs based on distribution functions with finite support. J. Hydrol. Eng. 2011, 16, 434–446. [Google Scholar] [CrossRef]
  51. Vandenberghe, S.; Berg, M.J.; Gräler, B.; Petroselli, A.; Grimaldi, S.; De Baets, B.; Verhoest, N.E.C. Joint return periods in hydrology: A critical and practical review focusing on synthetic design hydrograph estimation. Hydrol. Earth Syst. Sci. Discuss. 2012, 9, 6781–6828. [Google Scholar] [CrossRef]
  52. Graeler, B.; van den Berg, M.J.; Vandenberghe, S.; Petroselli, A.; Grimaldi, S.; De Baets, B.; Verhoest, N.E.C. Multivariate return periods in hydrology: A critical and practical review focusing on synthetic design hydrograph estimation. Hydrol. Earth Syst. Sci. 2013, 17, 1281–1296. [Google Scholar] [CrossRef] [Green Version]
  53. Brunner, M.I.; Viviroli, D.; Sikorska, A.E.; Vannier, O.; Favre, A.C.; Seibert, J. Flood type specific construction of synthetic design hydrographs. Water Resour. Res. 2017, 53, 1390–1406. [Google Scholar] [CrossRef] [Green Version]
  54. GONG. Flooding 1990s along the yangtze river, has it concern of global warming? J. Geogr. Sci. 2001, 11, 43–52. [Google Scholar] [CrossRef]
  55. Wang, L.N.; Chen, X.H.; Shao, Q.X.; Li, Y. Flood indicators and their clustering features in wujiang river, south china. Ecol. Eng. 2015, 76, 66–74. [Google Scholar] [CrossRef]
  56. Huang, K.; Lu, C.; Zhou, J.; Zhang, J.; Singh, V.P. Flood hydrograph coincidence analysis for mainstream and its tributaries. J. Hydrol. 2018, 565, 341–353. [Google Scholar] [CrossRef]
  57. Chen, L.; Singh, V.P.; Guo, S.; Zhou, J.; Zhang, J.; Liu, P. An objective method for partitioning the entire flood season into multiple sub-seasons. J. Hydrol. 2015, 528, 621–630. [Google Scholar] [CrossRef]
  58. Chen, L.; Singh, V.P.; Guo, S.L.; Fang, B.; Liu, P. A new method for identification of flood seasons using directional statistics. Hydrol. Sci. J. 2013, 58, 28–40. [Google Scholar] [CrossRef] [Green Version]
  59. Shi, H.; Li, T.; Liu, R.; Chen, J.; Li, J.; Zhang, A.; Wang, G. A service-oriented architecture for ensemble flood forecast from numerical weather prediction. J. Hydrol. 2015, 527, 933–942. [Google Scholar] [CrossRef] [Green Version]
  60. Zhang, J.; Chen, L.; Singh, V.P.; Cao, W.; Wang, D. Erratum to: Determination of the distribution of flood forecasting error. Nat. Hazards 2015, 75, 2065. [Google Scholar] [CrossRef]
  61. Chen, L.; Singh, V.P.; Lu, W.; Zhang, J.; Zhou, J.; Guo, S. Streamflow forecast uncertainty evolution and its effect on real-time reservoir operation. J. Hydrol. 2016, 540, 712–726. [Google Scholar] [CrossRef]
  62. Huang, K.; Chen, L.; Wang, Q.; Dai, L.; Zhou, J.; Singh, V.P.; Huang, M.; Zhang, J. Risk analysis of flood control reservoir operation considering multiple uncertainties. J. Hydrol. 2018. [Google Scholar] [CrossRef]
  63. Chen, J.; Zhong, P.A.; Zhao, Y.F. Research on a layered coupling optimal operation model of the three gorges and gezhouba cascade hydropower stations. Energy Convers. Manag. 2014, 86, 756–763. [Google Scholar] [CrossRef]
Figure 1. Diagram of dams and flood control points.
Water 10 01250 g001
Figure 2. The skeleton of the dynamic programming combined with progressive optimality (DP-POA) algorithm.
Water 10 01250 g002
Figure 3. Locations of the dams, flood control points and gauging stations in the Yangtze River Basin. (a) The upper Yangtze River Basin; (b) skeleton of the upper Yangtze River Basin.
Water 10 01250 g003
Figure 4. All the typical flood hydrographs (THFs) used in this study. (a) Observed flood hydrographs of the years 1954, 1996, and 1998; (b) observed flood hydrographs of the years 1980, 1981, 1982, 1999 and 2002; (c) observed flood hydrographs of the years 1968, 1969, 1983, 1988 and 2010.
Water 10 01250 g004
Figure 5. The 50-year, 100-year and 1000-year design flood hydrographs based on the typical flood hydrograph of 1954. (a) 50-year; (b) 100-year; (c) 1000-year.
Water 10 01250 g005aWater 10 01250 g005b
Figure 6. Design flood hydrograph of the year 1954, inflow of TGR and water levels of the Xiluodu and Xiangjiaba Dams.
Water 10 01250 g006
Figure 7. Discharge and water level hydrographs of TGR obtained by single and cascade optimal operation models for the 1954 DFH.
Water 10 01250 g007
Figure 8. Inflow of TGR obtained by the two operation models for the 1000-year DHF amplified by the 1954 TFH.
Water 10 01250 g008
Figure 9. Discharge and water level hydrographs of Three Gorges Reservoir (TGR) obtained by regular and optimal operation models.
Water 10 01250 g009
Table 1. Characteristics of the Xiluodu, Xiangjiaba and Three Gorges Dam (TGD).
DamDrainage Area
(104 km2)
Normal Water Level
(m)
Flood Control Water Level
(m)
Dead Water Level
(m)
Regulating Storage Capacity
(Billion m3)
Flood Control Reservoir Capacity
(Billion m3)
Xiluodu45.46005605406.54.7
Xiangjiaba45.93803703700.90.9
TGD10017514514516.52.2
Table 2. Runoff and its percentage for each month at the Pingshan gauging station.
MonthsJan.Feb.Mar.Apr.MayJun.Jul.Aug.Sept.Oct.Nov.Dec.
Runoff (m3/s)166014201350154023205080958010,20010,000654034502180
Volume (108 m3)44.534.736.239.862.113225727426017589.558.3
Percentage (%)3.042.382.472.724.259.0017.518.717.812.06.123.99
Table 3. Operation results of the Xiluodu–Xiangjiaba cascade reservoirs.
TFH 1Return Periods
(Year)
Inflow of the Three Gorges (m³/s)Flood Stored in the Xiluodu and Xiangjiaba Reservoirs (108 m³)
Natural RunoffStage 1Flood ReductionStage 2Flood ReductionStage 1Stage 2Comparisons
19545076,67667,500.349175.6667,284.74215.60144.28159.3715.08
10067,025.458,388.078637.3258,147.99240.08138.16152.2214.06
100063,720.455,267.938452.4754,993.17274.75133.9148.014.1
19685096,39084,091.6212,298.3784,091.00.57240.2252.111.9
10083,91674,102.29813.7774,101.30.92234.2243.59.3
100079,833.670,840.28993.470,839.80.35231.6239.98.3
19695092,59977,086.315,512.676,456.3630.1160.0174.314.3
10080,908.964,984.715,924.164,588.8395.9150.9162.711.8
100076,928.461,000.515,927.960,846.7153.7147.6158.611.0
19805091,18279,087.612,094.3878,731.4356.17163.8175.711.9
10079,661.466,305.0113,356.3966,116.25188.75167.32179.1311.8
100075,730.263,189.112,541.0463,160.129.03165.79176.6310.8
198150111,20096,768.6514,431.3596,689.9378.71177.64188.7911.1
10097,091.588,907.638183.888,408.22499.4151.5161.029.4
100092,921.581,542.7811,378.7281,504.3938.38156.96165.878.9
19825092,04079,071.0812,968.9279,030.0841162.40174.8812.48
10080,41769,906.4110,510.569,889.2517.16149.2163.1113.9
100076,52366,847.619675.3966,832.9614.64143.3157.414.06
5095,73287,083.958648.0587,083.90.05182.1195.113.0
198310082,58274,997.297584.774,997.290167.09186.4219.3
100078,479.270,371.118108.0870,371.10188.91206.817.89
5080,10669,897.810,208.1768,171.51726.338155.74169.5613.8
198810069,772.859,948.759824.0559,915.7233.03144.4156.4912.04
100066,36057,210.639149.3757,210.630142.0153.211.2
5078,50169,472.829028.1869,058.74414.1153.67181.9328.25
199610068,554.860,624.357930.460,622.611.74140.67174.734.02
100065,184.657,982.897201.757,982.760.13136.29170.2433.9
50109,705.292,571.217,133.992,570.60.6192.3201.28.8
199810067,438.159,905.77532.357,890.42015.3159.4176.617.2
100064,16856,802.37365.654,815.21987.0157.7174.316.6
5090,15373,305.416,847.573,306.6-1.1180.9197.616.7
199910078,642.964,300.614,342.664,143.8156.4168.5185.016.4
100074,787.361,446.013,341.261,318.9127.1164.1181.517.4
5081,64870,413.211,234.769,874.5538.7127.5136.59.0
200210071,344.860,551.910,792.860,001.7550.2117.2124.57.3
100067,845.657,273.210,572.356,824.3448.8113.5120.77.2
50109,705.299,823.49881.899,823.00.39190.3201.811.4
201010096,407.688,551.27856.388,550.70.52176.4189.312.9
100091,088.5684,048.37040.284,047.90.5167.5179.712.2
1 TFH: typical flood hydrograph.
Table 4. Flood diversion volumes of each design flood hydrograph (DFH) at the Jingjiang flood control point (billion m3).
TFHReturn Periods
(Year)
Without OperationsFor the Jingjiang AreaFor the Chenglingji Area
Single Cascade Single Cascade
1954504.80000
1008.40000
100023.70000
19685017.00000
10024.04.204.20
100056.533.937.956.437.9
19695012.60000
10017.70000
100037.517.312.217.212.2
1980508.50000
10011.10000
100024.80000
19815014.00000
10018.50000
100038.10000
1982508.30000
10011.30000
100026.017.8016.90
5019.00000
198310025.50000
100055.255.239.655.139.7
505.90000
198810010.50000
100026.720.1020.10
509.70000
199610015.90000
100042.118.913.418.913.4
506.00000
199810012.90000
100029.40000
509.40000
199910015.20000
100037.514.38.914.38.9
506.80000
20021009.80000
100020.00000
5013.40000
201010017.20000
100029.40000
Table 5. Flood diversion volumes of each design flood hydrograph (DFH) at the Chenglingji flood control point (billion m3).
TFHReturn Periods
(Year)
Without OperationsFor the Jingjiang AreaFor the Chenglingji Area
Single CascadeSingleCascade
19545031.235.426.49.64.0
10037.145.336.619.313.7
100054.374.270.159.854.2
19685059.973.563.864.559.0
10069.888.480.879.778.4
100093.9111.1101.793.9102.1
19695037.750.038.833.228.3
10045.261.750.550.545.6
100070.888.887.388.987.4
19805028.735.726.012.16.6
10036.246.135.923.518.0
100061.683.974.277.271.6
19815039.849.438.820.514.4
10046.359.148.235.830.3
100068.398.091.289.984.4
19825028.935.125.614.83.7
10035.543.234.324.613.6
100051.767.961.956.452.5
5047.664.452.552.446.9
198310055.578.969.972.566.9
100083.083.092.282.891.7
5030.534.425.417.812.4
198810034.441.133.630.324.8
100048.254.162.852.462.6
5047.657.151.532.526.9
199610054.068.063.943.738.1
100068.789.488.863.163.0
5055.561.254.137.532.0
199810062.073.768.151.946.4
100041.561.553.039.333.7
5043.552.241.124.719.1
199910050.662.352.942.637.1
100071.789.688.982.682.5
5018.222.919.41.60.0
200210020.827.124.05.60.1
100032.043.140.519.814.6
5023.232.123.13.00.0
201010027.939.329.39.03.3
100041.561.552.739.333.7
Table 6. The highest water level of Three Gorges Reservoir considering the flood control for the Jingjiang area (m).
TFH195419811998
Return Periods (Year)100010050100010050100010050
Single mode 175.0159.3153.9174.4166.1163.9174.7160.7153.4
Cascade mode169.3150.8145.0169.4164.1156.4169.8152.4145.3
Comparison5.78.58.95.02.07.54.98.38.1
Table 7. The highest water levelof Three Gorges Reservoir considering the flood control for the Jingjiang and Chenglingji areas (m).
TFH195419811998
Return Periods (Year)100010050100010050100010050
Single mode 175175175175175175175175175
Cascade mode171.9175175170.8172.0173.0172.3175175
Comparison3.1004.23.02.02.700
Table 8. Flood diversion volumes of some design flood hydrographs at the Jingjiang flood control point (billion m3).
TFHReturn Periods
(Year)
Without OperationsFor the Jingjiang AreaFor both the Jingjiang and Chenglingji Areas
CurrentOptimalCurrentOptimal
1954504.80000
1008.40000
100023.7005.70
1980508.50000
10011.10000
100024.8004.10
19815014.00000
10018.50000
100038.1005.20
509.70000
199610015.90000
100042.118.713.422.8133.8
509.40000
199910015.20000
100037.513.88.918.28.9
506.80000
20021009.80000
100020.0002.80
Table 9. Flood diversion volumes of some design flood hydrographs at the Chenglingji flood control point (billion m3).
TFHReturn Periods
(Year)
Without OperationsFor the Jingjiang AreaFor both the Jingjiang and Chenglingji Areas
CurrentOptimal CurrentOptimal
19545031.235.526.426.84.0
10037.145.236.636.213.7
100054.375.170.165.354.2
19805028.735.726.021.16.6
10036.246.235.932.718.0
100061.684.274.269.571.6
19815039.850.738.838.214.4
10046.360.448.248.230.3
100068.399.291.286.484.4
5047.657.151.549.826.9
199610054.068.663.959.938.1
100068.789.888.874.063.0
5043.551.941.141.519.1
199910050.662.652.952.437.1
100071.790.488.979.482.5
5018.223.719.417.80
200210020.828.324.020.70.1
100032.044.840.532.314.6
Table 10. The highest water level of TGR by two models (m).
TFH195419681998
Cascade regular operation model157.3145.3147.9
Cascade optimal operation model148.8145145.2
Comparisons8.50.32.7

