Article

Evaporation from (Blue-)Green Roofs: Assessing the Benefits of a Storage and Capillary Irrigation System Based on Measurements and Modeling

by
Dirk Gijsbert Cirkel
1,*,†,
Bernard R. Voortman
2,†,
Thijs Van Veen
3 and
Ruud P. Bartholomeus
1,4
1
KWR Watercycle Research Institute, Groningenhaven 7, 3433 PE Nieuwegein, The Netherlands
2
Moisture Matters, Von Weberstraat 6, 3533 ED Utrecht, The Netherlands
3
Utrecht University, Heidelberglaan 8, 3584 CS Utrecht, The Netherlands
4
Wageningen University, Soil Physics and Land Management group, Droevendaalsesteeg 4, 6708 PB Wageningen, The Netherlands
*
Author to whom correspondence should be addressed.
These authors contributed equally to this work.
Water 2018, 10(9), 1253; https://doi.org/10.3390/w10091253
Submission received: 12 July 2018 / Revised: 27 August 2018 / Accepted: 11 September 2018 / Published: 14 September 2018
(This article belongs to the Special Issue Hydrological Performance of Green Roofs)

Abstract

:
Worldwide cities are facing increasing temperatures due to climate change and increasing urban density. Green roofs are promoted as a climate adaptation measure to lower air temperatures and improve comfort in urban areas, especially during intensive dry and warm spells. However, there is much debate on the effectiveness of this measure, because of a lack of fundamental knowledge about evaporation from different green roof systems. In this study, we investigate the water and energy balance of different roof types on a rooftop in Amsterdam, the Netherlands. Based on lysimeter measurements and modeling, we compared the water and energy balance of a conventional green roof with blue-green roofs equipped with a novel storage and capillary irrigation system. The roofs were covered either with Sedum or by grasses and herbs. Our measurements and modeling showed that conventional green roof systems (i.e., a Sedum cover and a few centimeters of substrate) have a low evaporation rate and due to a rapid decline in available moisture, a minor cooling effect. Roofs equipped with a storage and capillary irrigation system showed a remarkably large evaporation rate for Sedum species behaving as C3 plants during hot, dry periods. Covered with grasses and herbs, the evaporation rate was even larger. Precipitation storage and capillary irrigation strongly reduced the number of days with dry-out events. Implementing these systems therefore could lead to better cooling efficiencies in cities.

1. Introduction

Climate change and ongoing urbanization will result in both an increase of the urban heat island (UHI) effect [1,2] and flooding [3]. The UHI effect is known as the phenomenon where the urban temperature is higher than the surrounding rural environment, due to the modification of land surfaces (i.e., application of energy absorbing surfaces such as asphalt and concrete on roofs and pavements, and changes in reflection and absorption due to the geometry of buildup areas). These surfaces generate an excess of heat due to a lack of evaporation. The extent of the temperature difference between the surfaces varies in time and space as a result of meteorological and surface characteristics of the urban area [1]. An increase in the UHI effect results in a higher ratio of mortality and/or illness, because of heat stress and higher energy demands for cooling [4,5,6,7]. Aerosol emissions play a role in exacerbating or mitigating the UHI effects and related health impacts, e.g., recent substantial reductions in aerosol concentrations in the southeast of the US resulted in increased surface temperatures [8].
Urban flooding is caused by a combination of heavy rainfall events, and the limited capacity of sewer systems, resulting in nuisance and serious water pollution problems. The high stress on the sewer system is caused by a decreasing area of permeable ground in cities, limiting the infiltration of rainwater [3] in combination with more frequent heavy rainfall events [9,10,11] in some regions of the world, such as the Netherlands.
There are several options to decrease the UHI effect and peak flows in sewer systems. One of these options is to reserve more space for permeable green areas in a city. Permeable green areas decrease storm runoff by intercepting, retaining, and evaporating rainwater [12,13]. Space on the surface level however, is scarce in many cities. Given the large area of unused space at the rooftop level, greening roofs might be a promising solution, presenting a relatively high potential for heat islands and storm water runoff mitigation [14,15,16,17]. Alternatively, white and/or reflective roofs, often referred to as ‘cool roofs’ may also provide efficient mitigation of atmospheric heating by increasing surface albedo and decreasing net radiation [14,18]. Several studies compared the UHI mitigation potential of green and cool roofs [2,18,19,20]. Overall, these studies concluded that cool roofs with an albedo ≥0.7 provide a greater benefit in terms of UHI mitigation than conventional extensive green roofs. However, these studies also concluded that water availability plays an important role in the cooling behavior of the vegetation on a green roof. Santamouris [2] argue that for very well irrigated vegetated roofs, the UHI mitigation potential can become equal to that of cool roofs during peak temperature periods. Accordingly, the effectiveness of green roofs is, besides local climatic conditions such as solar radiation, wind and humidity [21], highly dependent on the water availability for evaporation. We hypothesize that the storage of precipitation water and capillary irrigation with this water is an effective measure to increase evaporation, and thus UHI mitigation potential. In line with [22], we define the evaporation of a vegetated surface (E) as the sum of three fluxes: transpiration (Et), soil evaporation (Es), and evaporation of intercepted water (Ei). Et and Es occur at a potential rate when the availability of water is not limiting. Potential evaporation Ep reduces to the actual Ea when the water availability is limiting. Increasing the evaporation (E) to its potential rate increases the latent heat flux (LE) which results in a decrease of the sensible heat flux (H). However, many conventional green roofs have shallow soils, limiting water retention and water availability for evaporation, and thus leading to a minor cooling effect, especially during long dry spells.
The water storage required to meet the potential evaporation, and therefore to reach the most optimal cooling effect, depends on the evaporation rate of the vegetation and local climatic conditions. The measured data of actual evaporation (Ea) of the green roof vegetation is however, very scarce and it is partly limited to greenhouse experiments and environmental chamber setups [23,24]. Coutts et al. [18] measured Ea using a portable closed-chamber, but only on four sunny days. More elaborate measurements were performed by [25], who measured the actual evaporation continuously over a one year period with a weighing lysimeter on an extensive green roof in New York. Sims et al. [26] used weighing lysimeters to investigate the effect of different climatic conditions on retention and evaporation. Also more elaborate are the dynamic chamber measurements of [27], who measured Ea on two locations in New York. This study also provides an overview of the average estimated Ep (five cases), and the measured and estimated Ea (10 cases) under temperate climate conditions in the US, Europe, and New Zealand. In this overview, average Ea ranges between 0.9 and 3 mm/day depending on local conditions. Another overview is given by [28] for relatively cold and wet regions in Northern Europe.
In this contribution, we investigate the effect of water availability on Ea and the distribution of energy between the latent heat flux (LE) and the sensible heat flux (H) in a rooftop environment in Amsterdam, the Netherlands. We compared the water and energy balance of conventional green roofs and (blue-)green roofs equipped with a novel water storage and a passive capillary irrigation system. We measured Ea on-site using sensitive custom build weighing lysimeters integrated in the green roof over one year. We used a hydrological model validated on the field data to assess the effects of meteorological variations on Ea and the performance of the different roof systems. We provide quantitative insights and practical modeling procedures to assess the success of different roof types in evaporating and storing rainwater and potentially cooling the air.

2. Materials and Methods
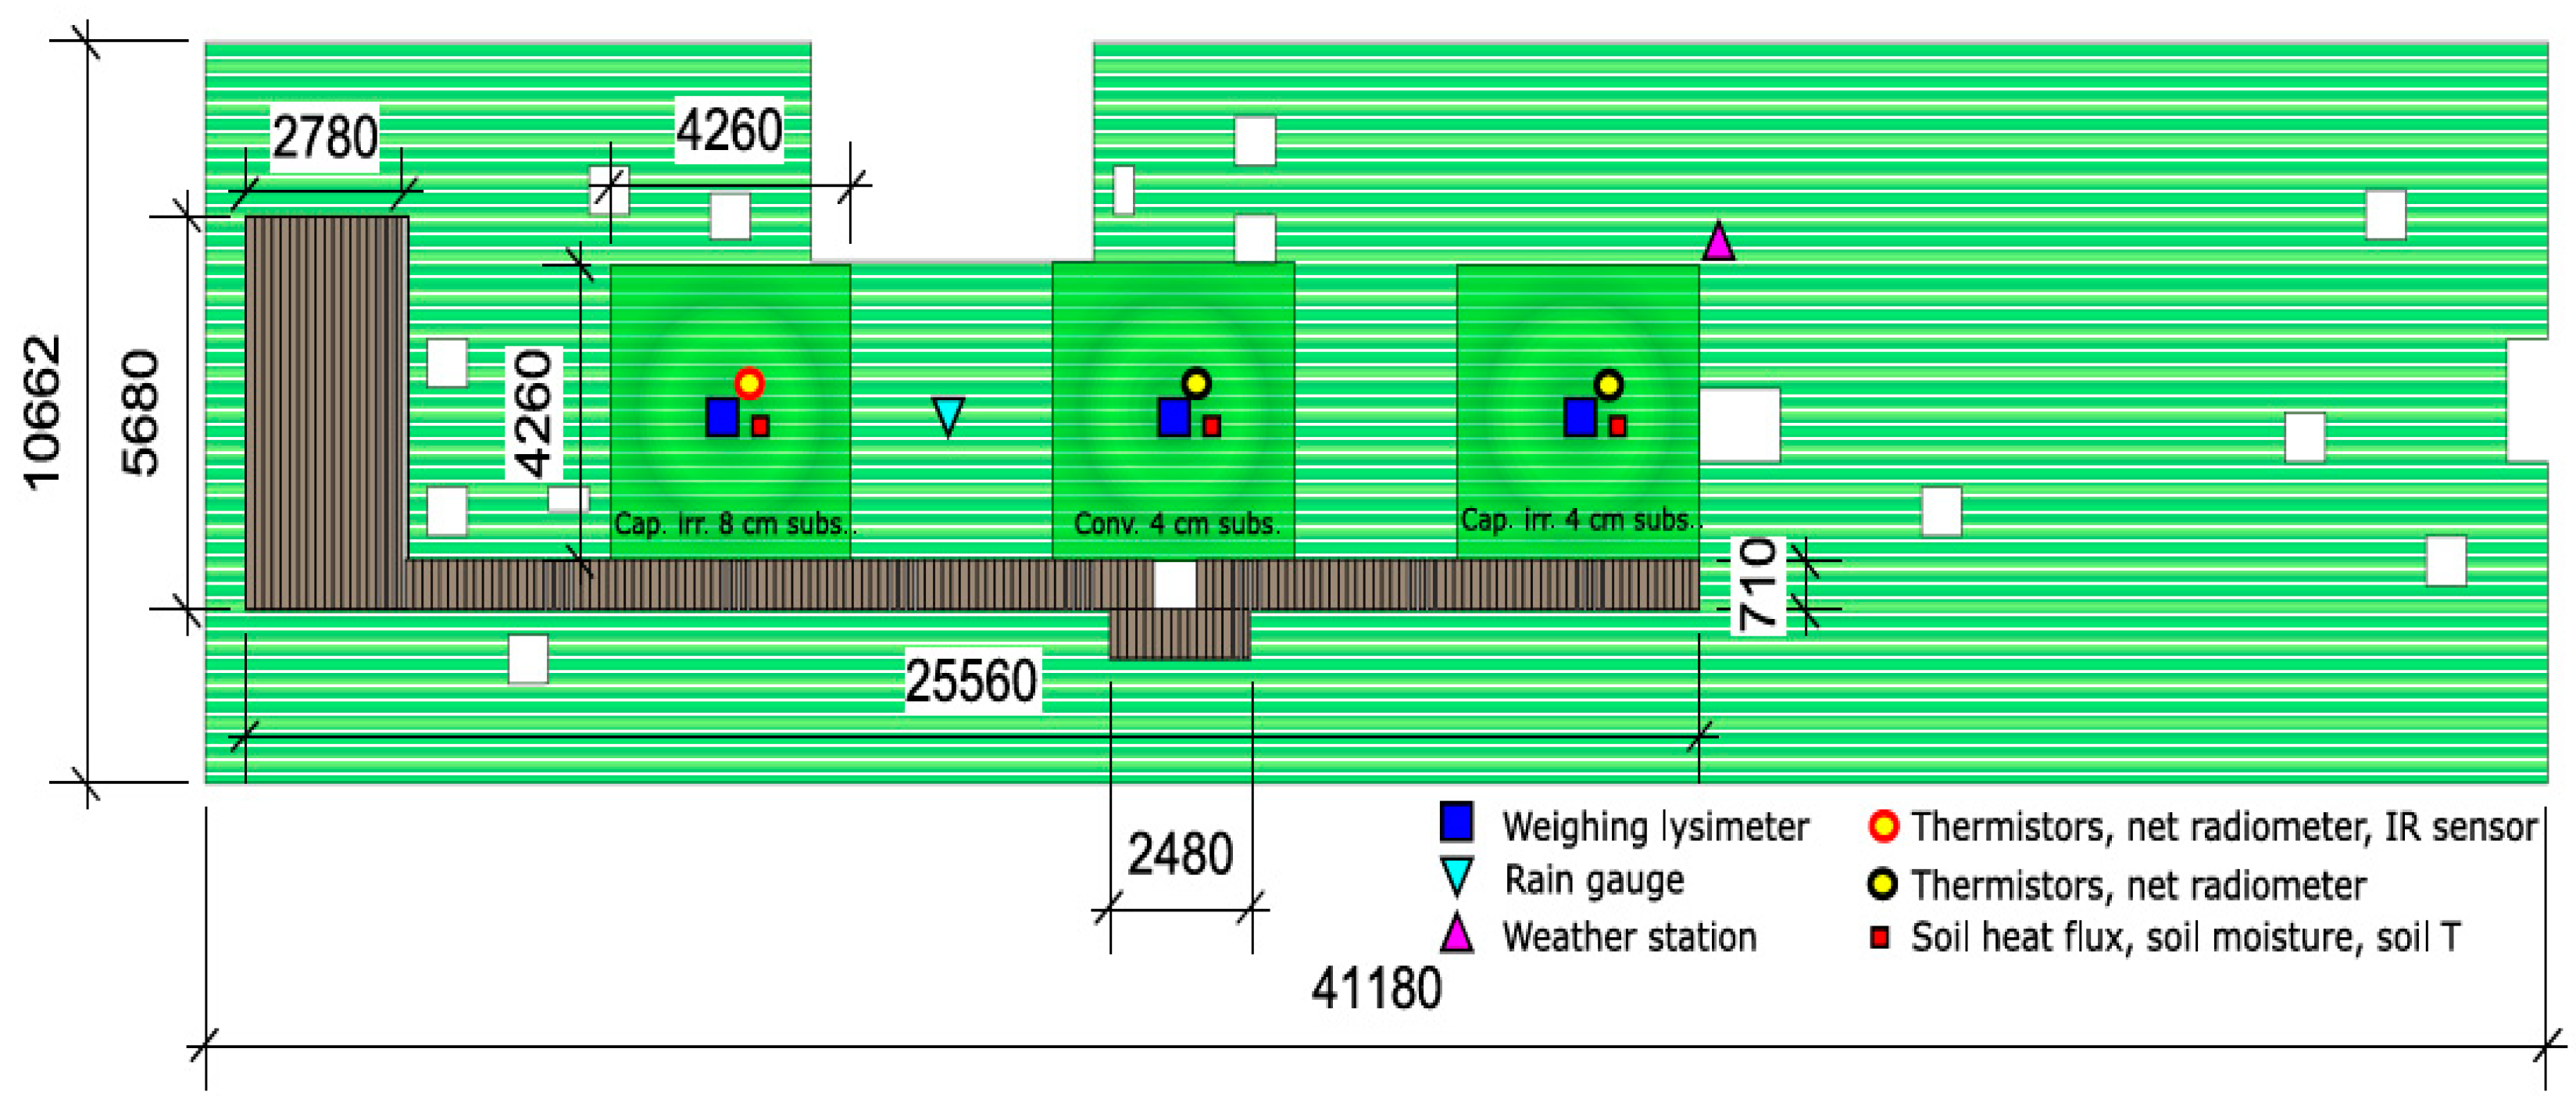
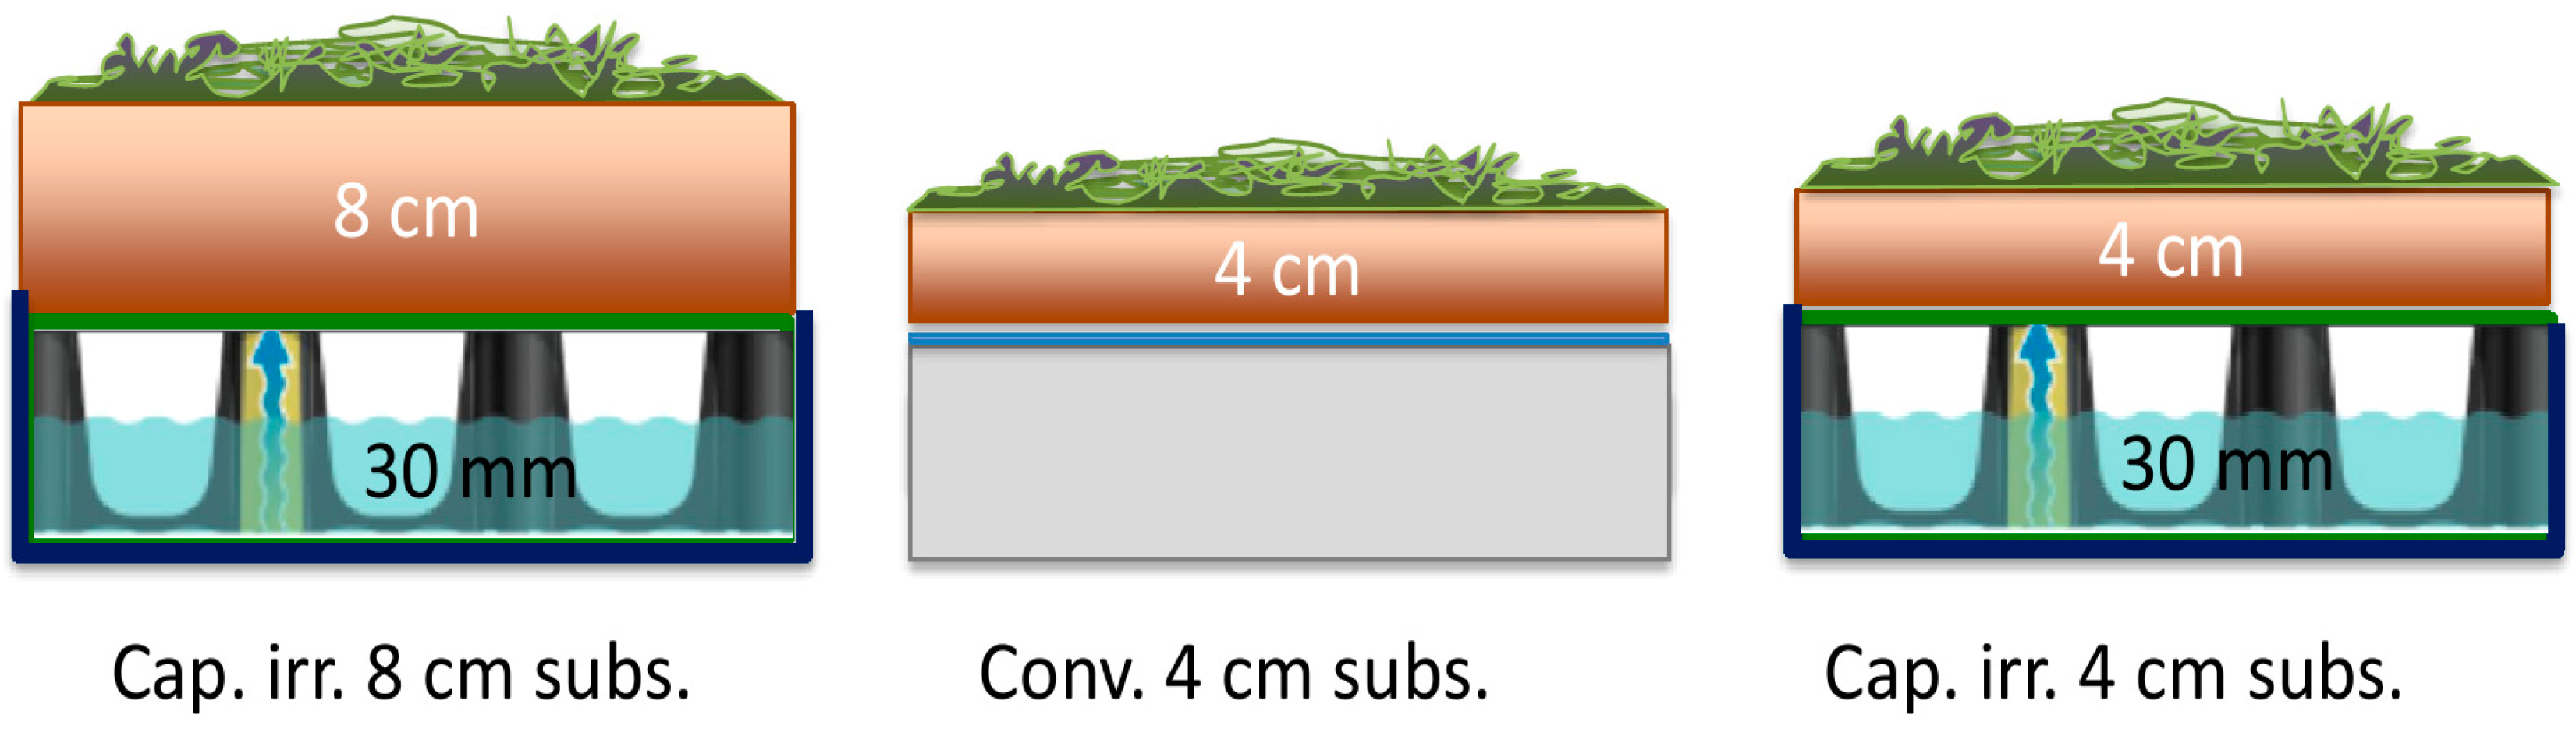
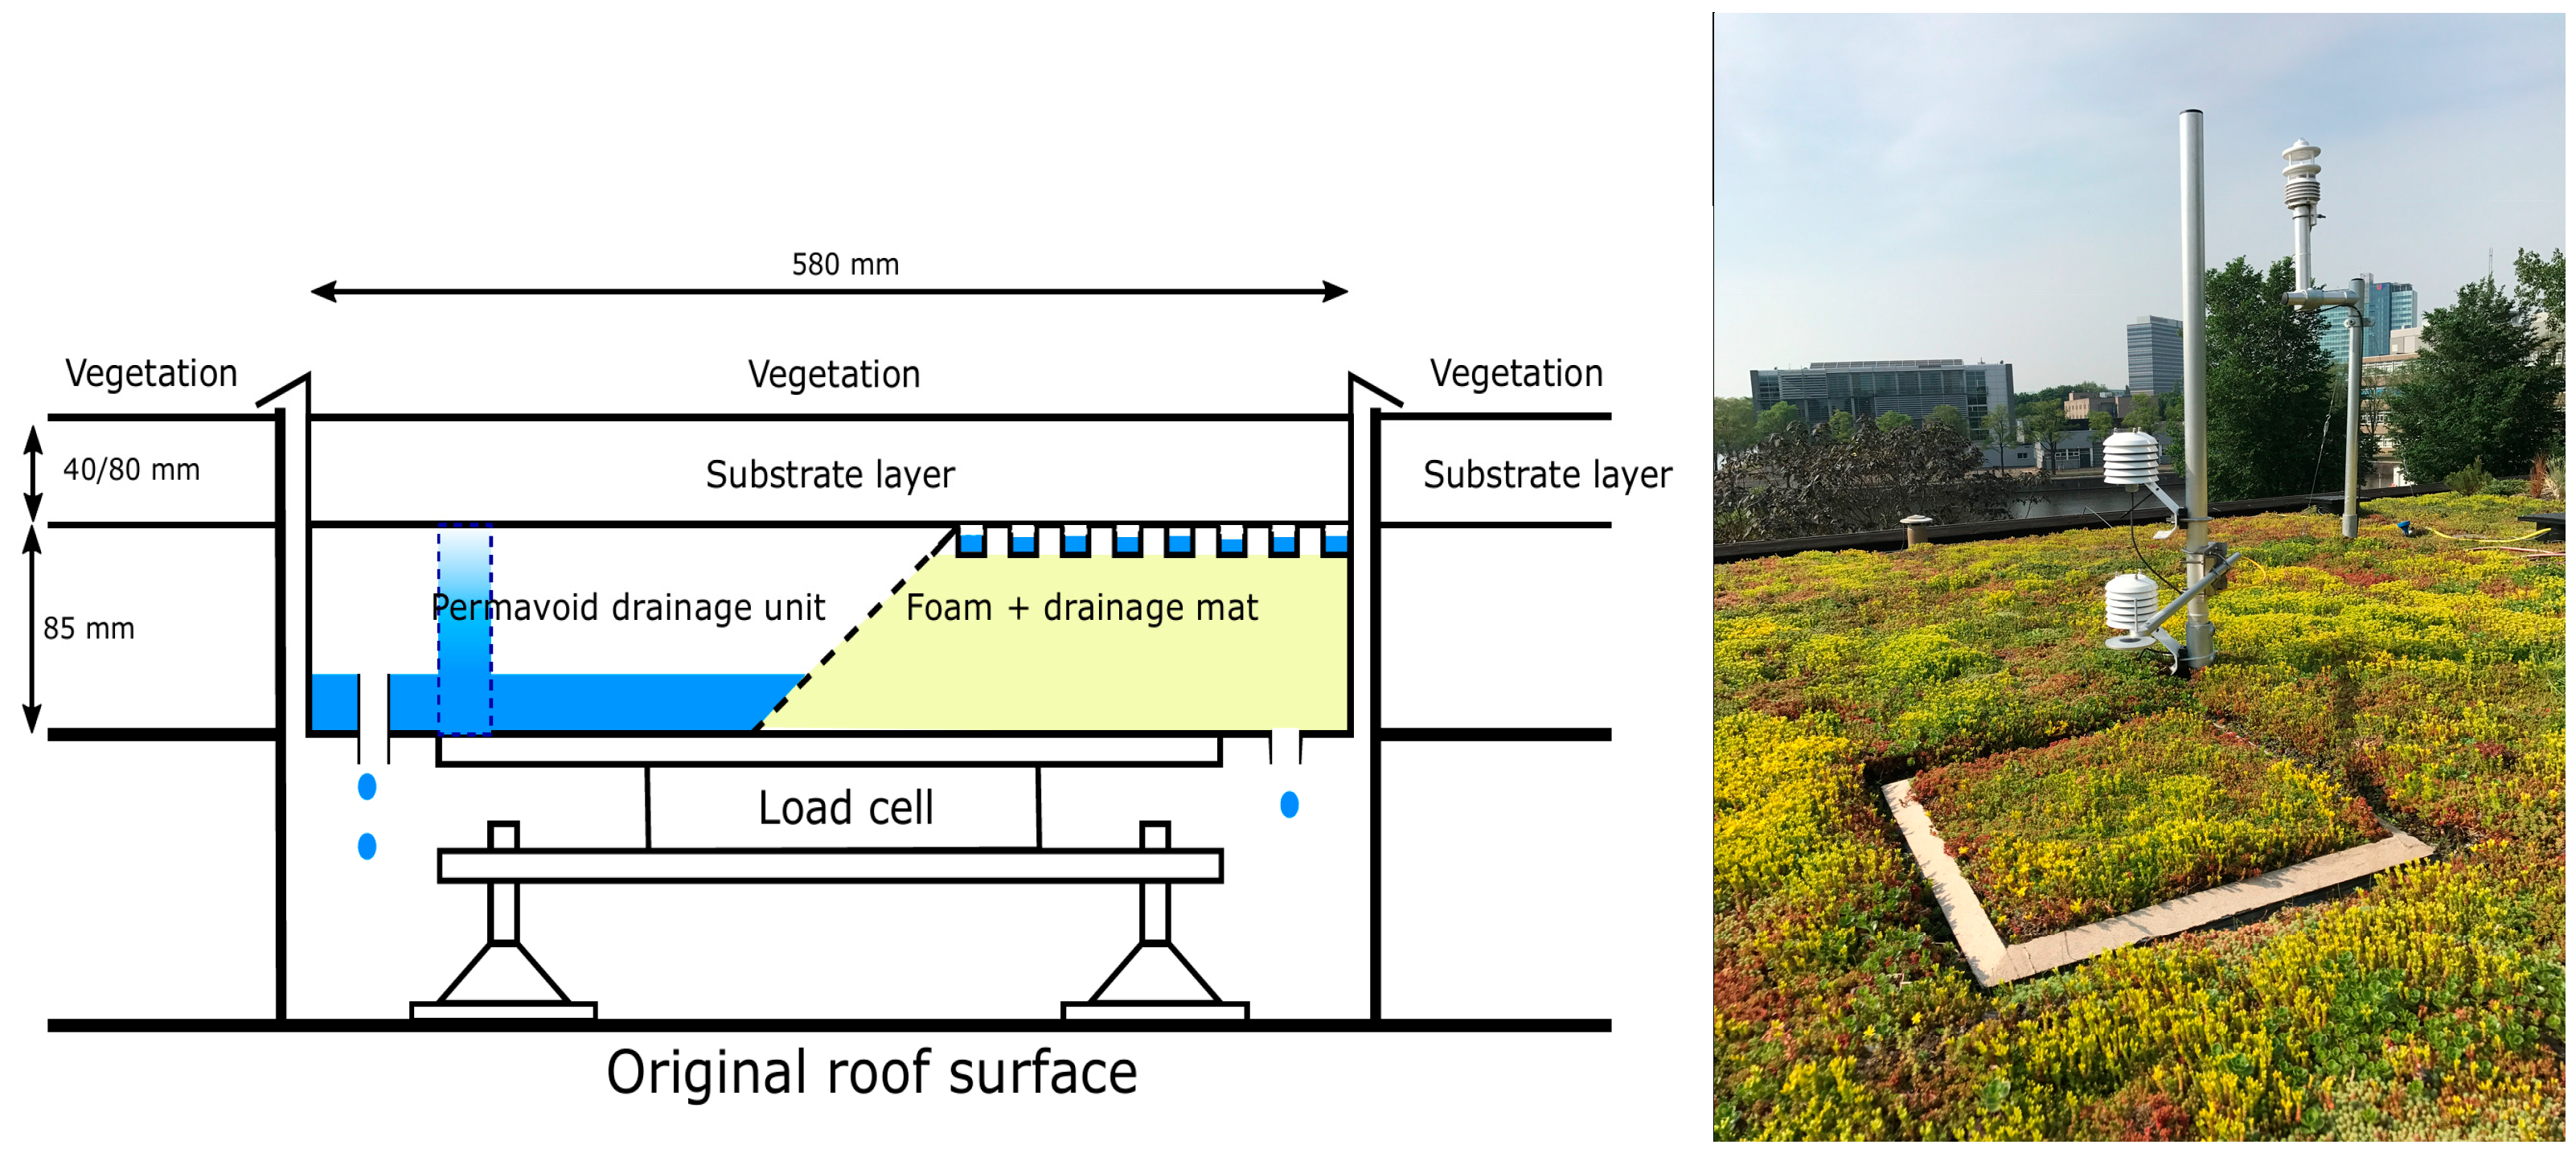
2.1. General Setup

A field campaign started in April 2017 to measure the evaporation rate and energy fluxes of three different plots (4.26 × 4.26 m) on a two-story, ca., 9 m high rooftop (Figure 1) in Amsterdam, the Netherlands (52.37° latitude, 4.92° longitude). The climate of the research site is temperate maritime, with an average precipitation of 852 mm/year and an average Makkink reference crop evapotranspiration [29] of 593 mm/year (period 1988 until 2017, from the climate station Schiphol, located 11 km from the research site). We designed one plot as a conventional extensive green roof, i.e., equipped with a 25 mm thick drainage mat and a 4 cm substrate layer. The other plots were equipped with a Permavoid storage and capillary irrigation system [30] (Figure 2); one was covered with a 4 cm thick substrate layer and the other with a 8 cm thick substrate layer. All three plots were raised by 17 cm compared to the surrounding roof to accommodate weighing lysimeters (Figure 3) and increase structural strength of the roof to be able to accommodate the 8 cm substrate layer. The maximum storage level in a Permavoid unit was 80 mm. However, based on a calculated maximum allowable static load of 90 kg m−2, a storage level of only 30 mm could be allowed on this specific roof. When this storage level was exceeded, water was discharged to the sewer system. Stored water was available for passive irrigation via capillary cones, consisting of hydrophilic rockwool fiber. These cones were placed inside tubes within the Permavoid units, and they supplied the root zone with water by capillary forces. The substrate consisted of a mixture of shale, pumice, lava rock, crushed bricks, clay, and compost. The substrate has a porosity of 64% and a bulk density of 970 kg m−3 [31].
The initial vegetation present on the green roof consisted of blankets with a mixture of sedum species from the company Sempergreen, containing Sedum sexengulare, Sedum hispanicum, Sedum floriferum, Sedum hybridum, Sedum kamschaticum, and different varieties of Sedum acre, Sedum album, and Sedum spurium. After placement of the sedum mix blankets, 40 plant species native to Europe (Table A1) were sown on the sedum carpet/substrate to increase the biodiversity and to give insight in the change in plant species distribution over time. Initially, we manually irrigated the plots and the surrounding roof to promote germination. Therefore, only field data from 25 May 2017 until 16 May 2018 was used in the final analysis to limit our analysis to periods without disturbances by manual irrigation. For the plots with capillary irrigation, a herb and grass cover was developed between 25 May and 1 August 2017.
We used our field data to parameterize the Penman–Monteith equation, to calculate Ep and to perform hydrological model simulations of Ea based on the actual availability of water. The Penman-Monteith equation is given by:
E p = Δ ( R n G ) + ρ a c p ( e s e a ) / r a ( Δ + γ ( 1 + r s r a ) ) λ ρ w  
where Ep is the potential evaporation (mms−1), ∆ is the slope of saturation vapor pressure vs the temperature curve (kPa·°C−1), Rn is the net radiation (MJ m−2 d−1), G is the soil heat flux (MJ m−2 d−1), ρa is the air density (kg m−3), cp is the specific heat of moist air (J·kg−1 °C−1), es is the saturation vapor pressure of the air (kPa), ea is the actual vapour pressure of the air (kPa) (i.e., esea represents the vapor pressure deficit of the air), ra is the aerodynamic resistance to turbulent heat and vapor transfer (s·m−1), rs is the surface resistance (s·m−1), γ is the psychrometric constant (kPa·°C−1), λ is the latent heat of vaporization (J·kg−1), and ρw is the density of liquid water (kg·m−3).
First, simulations of Ea with a hydrological model were validated against the field measurements of Ea. Second, the validated model was used to simulate the long-term effects of different roof setups on evaporation using climate data of the meteorological station “Schiphol”, located 11 km from the experimental site. In this final analysis, six roof setups were simulated by combining two vegetation covers and three types roof constructions: Sedum or grasses/herbs cover with a conventional buildup, capillary irrigation with 30 mm of water storage (like in the experimental site), and capillary irrigation with 80 mm of water storage (i.e., the maximum storage capacity of the Permavoid unit). Simulations with a Sedum cover were performed with a substrate thickness of 4 cm, and the simulations with a grass/herb cover with a substrate thickness of 8 cm.

2.2. Hydrometeorological Measurements

Each of the three research plots was equipped with sensors to measure the actual evaporation Ea, the net radiation Rn, the soil heat flux G, the soil moisture θ and the soil temperature Tsoil. Other meteorological variables such as wind speed and wind direction, relative humidity RH, ambient air temperature Ta, air pressure, and incoming shortwave radiation (Rs) were measured with an all-in-one weather station (WS501-UMB, LUFFT) at 1.5 m above the surface, positioned close to the capillary irrigated plot with 4 cm substrate (Figure 1). Precipitation (P) was measured with a rain gauge (ARG100, Campbell Scientific Inc., Loughborough, United Kingdom) positioned between the first two plots (Figure 1). Measurements were collected at 30 s intervals, aggregated to 5 min values, and logged on a datalogger (CR1000, Campbell Scientific Inc.). The net radiation was measured with net radiometers (NR-Lite2, Kipp & Zonen B.V., Delft, the Netherlands) installed at a height of 22 cm above the vegetation surface, to limit the dominant field of view to the research plots. Self-calibrating heat flux plates (HFP01SC, Hukseflux B.V., Delft, the Netherlands) were installed at the bottom of the substrate (i.e., at 4 or 8 cm depths) near the net radiometers. Besides each soil heat flux plate, a soil moisture and soil temperature sensor (5TE, Meter group, München, Germany) was installed at 3 cm depth. Procedures to calculate the soil heat flux G at the surface were followed according to the Campbell Scientific Inc. (2014) HFP01SC instruction manual. For accuracy and precision of the sensors, we refer to the individual manuals of the sensors, which are accessible on the web. Within each research plot, a weighing lysimeter was installed, sunken into the raised green roof surface of the plots. The lysimeters (Figure 3) consisted of a square stainless-steel bucket of 58 × 58 cm placed on a weighing unit. The structure of the drainage layer, geotextiles, substrate, and vegetation inside the lysimeter buckets was identical to that of the surrounding plots. In line with this, the drainage conditions and water storage in the buckets was kept identical to that of the surrounding plots. We covered the rim of the lysimeter, covering the gap between the lysimeter and the surrounding roof, with a thin layer of cork to the limit reflection of sunlight and down welling longwave radiation onto the net radiometer. The lysimeters were weighted with temperature compensated single point load cells (Utilcell 190i, max 120 kg, Utilcell, Barcelona, Spain). To increase measurement precision, we installed digitizers (Flintec LDU 68.1, Flintec, Hudson, NY, USA) to process and digitize the load cell signals without interference by the datalogger. In this setup, a measurement resolution of 12 g was achieved, i.e., 0.04 mm equivalent water depth, which is adequate for measuring Ea [32,33]. On 25 July, the lysimeter with capillary irrigation and 4 cm substrate was disturbed in a burglary attempt. After this event, the proper functioning of the load cell was validated and the lysimeter was back in operation on 2 August. The lysimeter data was processed with the AWAT filter [34]. Because of the limited amount of space below the lysimeter, we were unable to easily measure the drainage from the lysimeter. Therefore, evaporation could only be determined during days without drainage, i.e., at moments when the lysimeter weight was lower than its maximum.

2.3. Parameterization of the Penman–Monteith Equation

To parameterize the Penman–Monteith equation, we needed procedures to calculate Rn, G, and ra, and a value for rs for Sedum, and for a grass and herb cover. Models to estimate Rn especially have trouble with deriving accurate numbers for the net longwave radiation [32,35]. Therefore, simple linear regression models between incoming shortwave radiation and net radiation often perform better than more complex models that derive subcomponents of the radiation balance explicitly [36]. We measured Rn and G in the research plots, which allowed us to derive similar linear regression models. The three different research plots appeared to differ marginally in Rn. We therefore used the average regression coefficients of the three plots for both vegetation covers Sedum and grasses/herbs (Figure A2). On daily time steps, G was often negligible, i.e., near zero because the soil was warming during the day and cooling during the night. G appeared to be less than 2.5% of the net radiation on daily time steps and it was therefore neglected in the rest of the analysis (Figure A1).
The aerodynamic resistance under neutral stability conditions can be estimated by [37]:
r a = ln ( z m d z om ) ln ( z h d z oh ) k 2 u z  
where zm is the height of wind measurements (m), zh is the height of humidity measurements (m), d is the zero plane displacement height (m), zom is the roughness length governing momentum transfer (m), zoh is the roughness length governing transfer of heat and vapor (m), k is the von Karman’s constant (0.41 (-)) and uz is the wind speed at height zm (ms−1). For grass, empirical equations were developed to estimate d, zom, and zoh [38]:
d = 2 3 V  
z om = 0.123   V  
z oh = 0.1   z om  
where V is the vegetation height. We used the same empirical equations for Sedum and grass/herbs with a vegetation height of 8 cm and 30 cm, respectively.
The surface resistance (rs) of Sedum was back-calculated by substituting the measured data for Rn, G, and Ea from the conventional green roof research plot into Equation (1) under non-stressed conditions (i.e., when Ep = Ea). In line with [32], non-stressed days were filtered out by selecting only data from two consecutive days after at least 5 mm of rain. We selected the conventional green roof research plot for this exercise because no grasses or herbs germinated, and the plot had a constant Sedum cover during the entire experiment. We used a slightly different procedure to derive rs for grasses/herbs. We used the Sedum rs resulting from above procedure and linearly decreased the Sedum rs until 1 August 2017 (i.e., over 67 days) to the rs value of a full grass/herb cover, since a full grass/herb cover developed during this time period and remained more or less constant afterwards. We calibrated the rs of the full grass/herb cover by fitting the measured Ea on the modeled Ea (the model to estimate Ea is explained in the next section). Calibration was performed manually by decreasing the grass/herb rs in steps of 10 sm−1. We derived the final grass/herb rs only from the capillary irrigated research plot with an 8 cm thick substrate layer. This because the other plot had excessively high evaporation values at certain days (which would lead to an unrealistic rs value of 10 sm−1) which we suspect are caused by an input of dry warm air from a building air vent next to the research plot.
Similar to rs, we linearly interpolated the vegetation height between 8 cm and 30 cm during the development phase of the grasses and herbs.

2.4. Model Simulation of Ea

Actual evaporation was simulated with a so-called simple bucket model [39] (Figure 4). A bucket model is a reservoir that fills by rain and empties by evaporation. If the bucket is almost empty, limited evaporation occurs, i.e., with a lower rate than the potential rate (Ep), to mimic the closure of leaf stomata and self-mulching effects on soil evaporation. The concept of a bucket model compares well with the processes on a green roof, which only spills water if the system is entirely saturated. The model has two parameters: the root constant (RC) and the permanent wilting point (PWP). PWP is the maximum available water for plants, i.e., the total depth of the bucket relative to the top. RC is the depth of the bucket (relative to the top) at which evaporation occurs at a potential rate. When RC is reached, Ea reduces linearly until PWP is reached. The saturation of the bucket is defined by the soil moisture deficit (SMD, i.e., the water level in the bucket relative to the surface). When the bucket is full (SWD = 0), excess water will drain (D) out of the system. Values for PWP depend on the properties of the green roof setup and were directly derived from the lysimeter measurements, since during the measurement campaign, the lysimeters were sporadically fully saturated and entirely empty (the difference between both (expressed in mm) is the maximum available water PWP). PWP was set to 23, 60, and 65 mm for the conventional roof, the capillary irrigated roof with 4 cm substrate, and the capillary irrigated roof with 8 cm substrate, respectively. RC was determined to be PWP minus 10 mm (i.e., the last 10 mm of available water was hard to evaporate), which was visually determined form the lysimeter measurements during a dry-out event.
The bucket model was used to simulate Ea of the measurement period and Ea of different roof setups for a longer time series from 1988 until 2017, using climate data of climate station “Schiphol” located 11 km from the research site (see general setup). Because the location of Schiphol is a rather exposed flat area, the measured wind speed at Schiphol was twice as large as at the experimental site during the one-year measurement period. To keep the 30-year model simulations comparable to the measurement period, we corrected the wind speed by a factor of 2.017 (Figure A3) to represent the conditions of the experimental roof (see Appendix C for details on the wind speed correction). The mean difference (MD), the root mean squared error (RMSE), the Nash–Sutcliffe efficiency (NSE), and the Pearson correlation coefficient (Pears. r) were determined to evaluate the Ea model performance during the measurement period. For the different roof setups, we present the evaporation numbers, roof runoff, and Bowen ratio’s β (the ratio between the sensible heat and latent heat) to characterize the frequency and severity of dry-out events.

3. Results

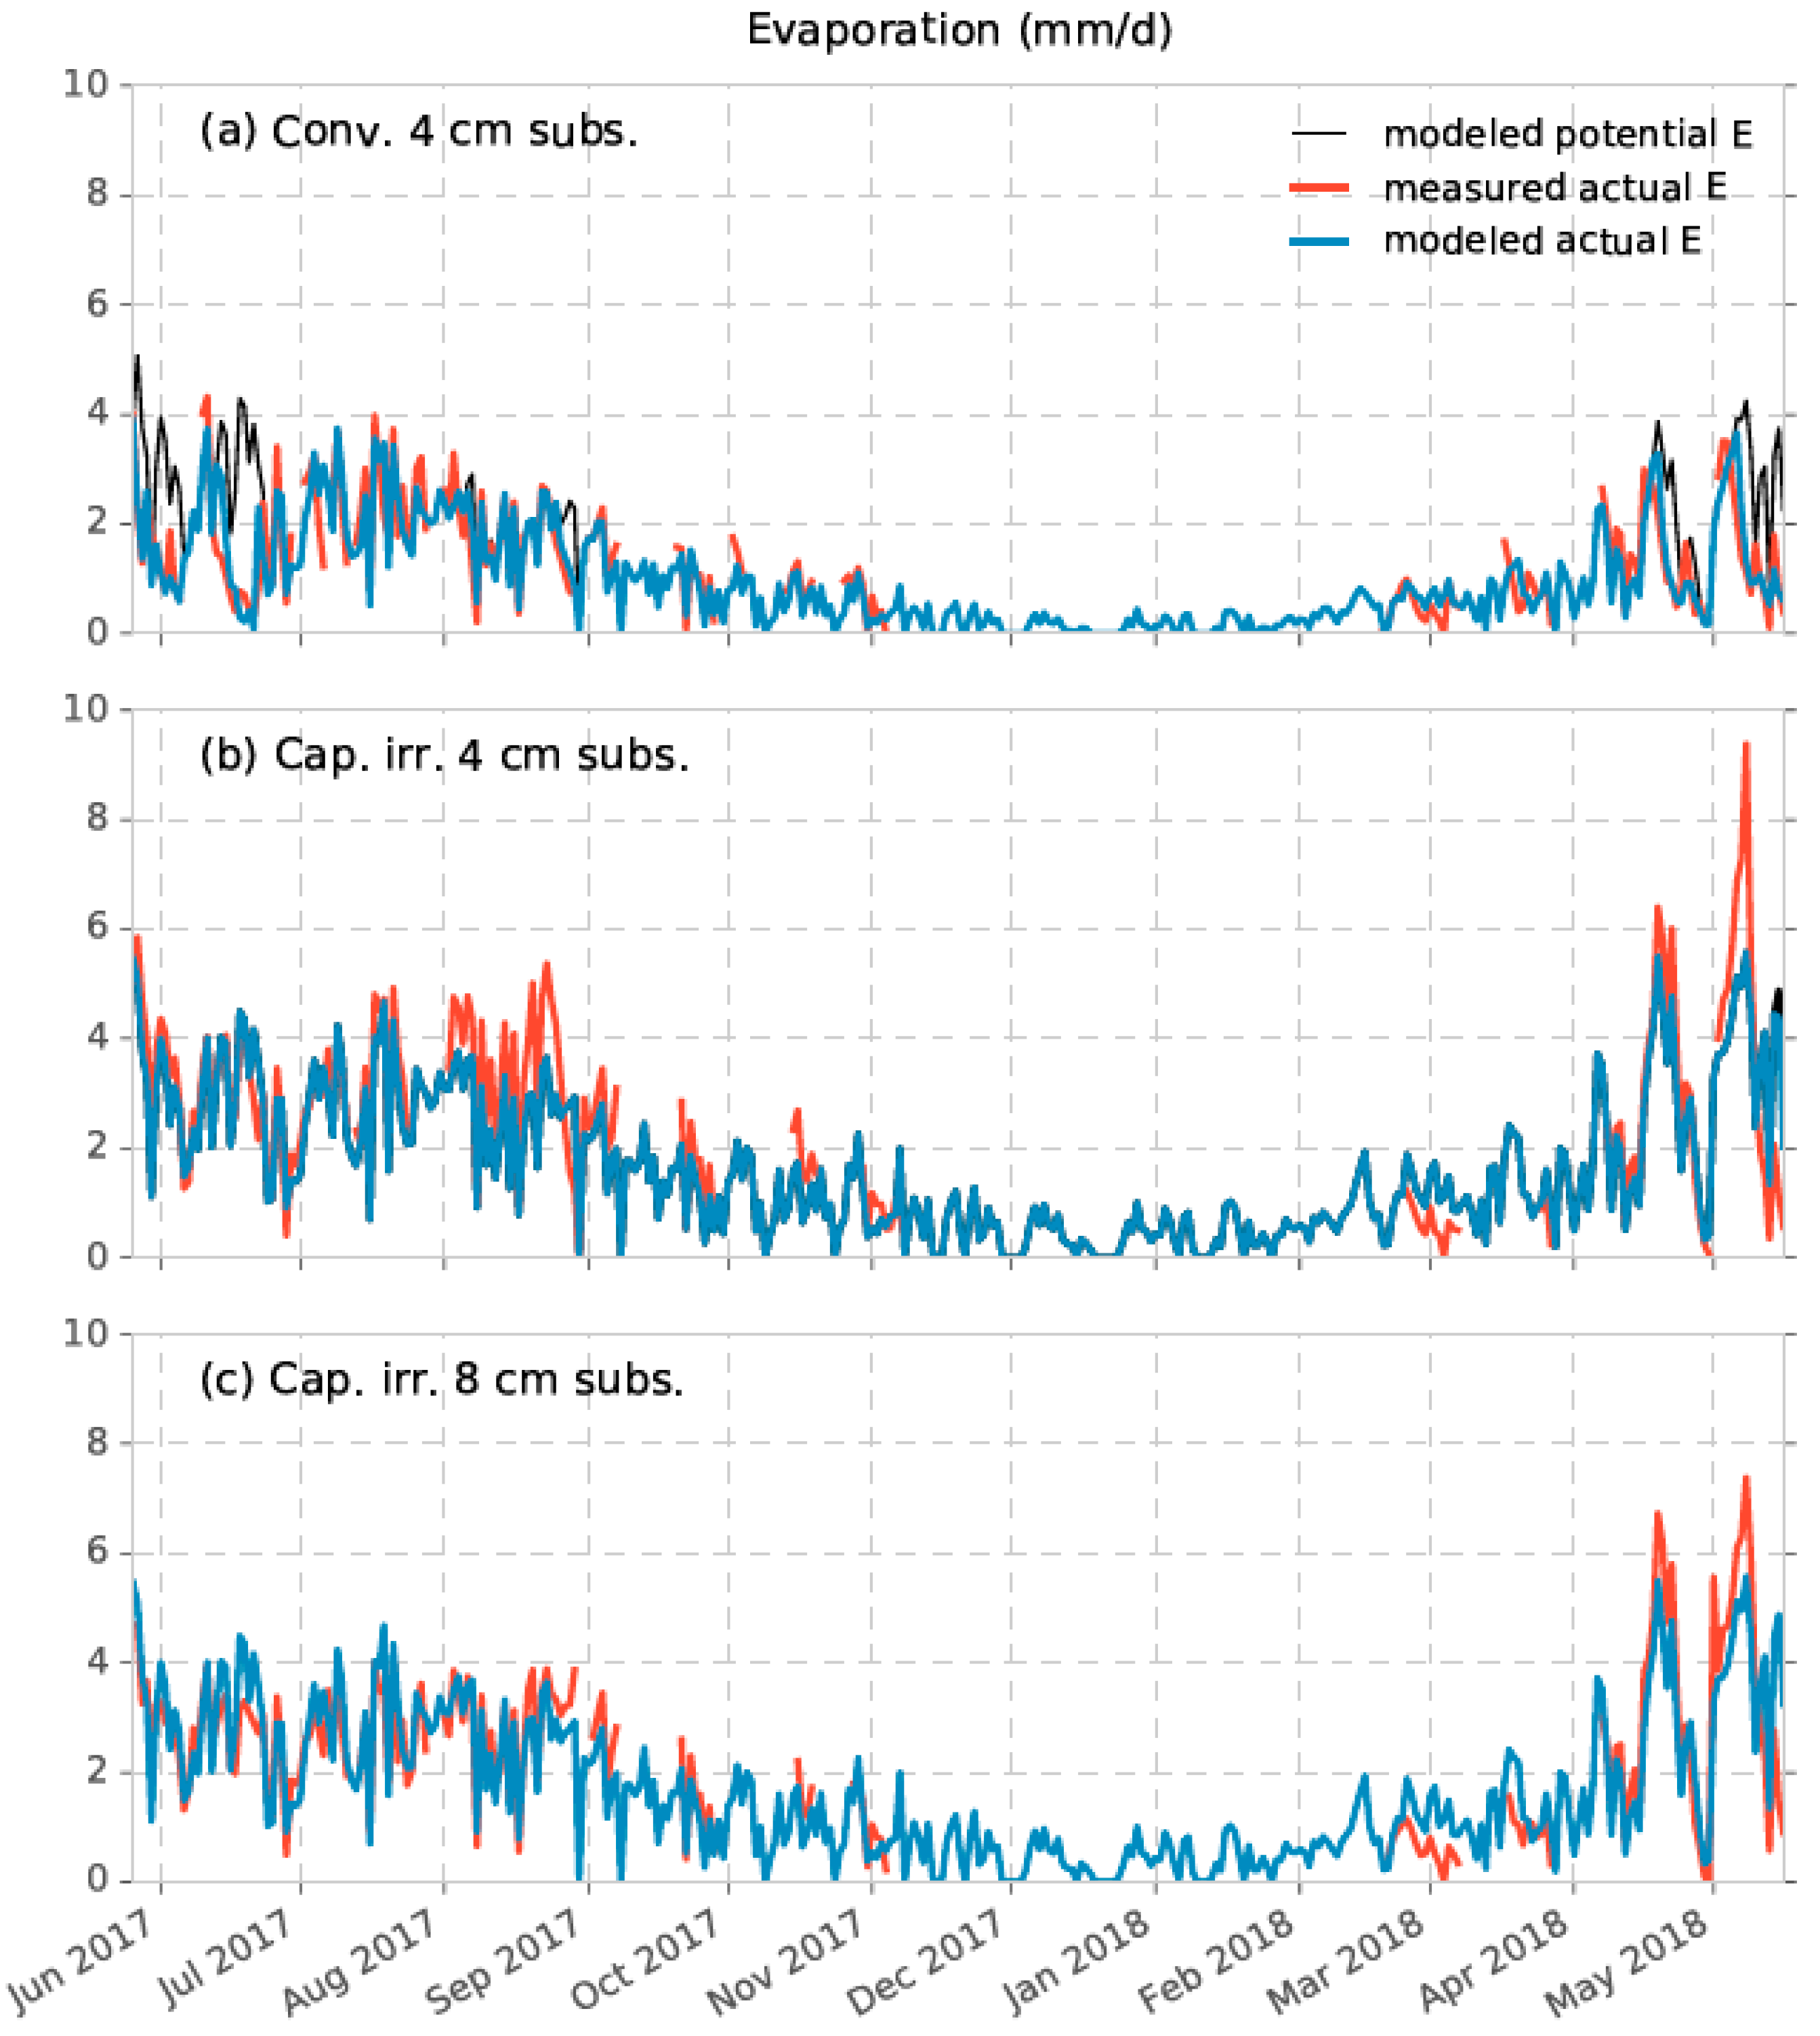
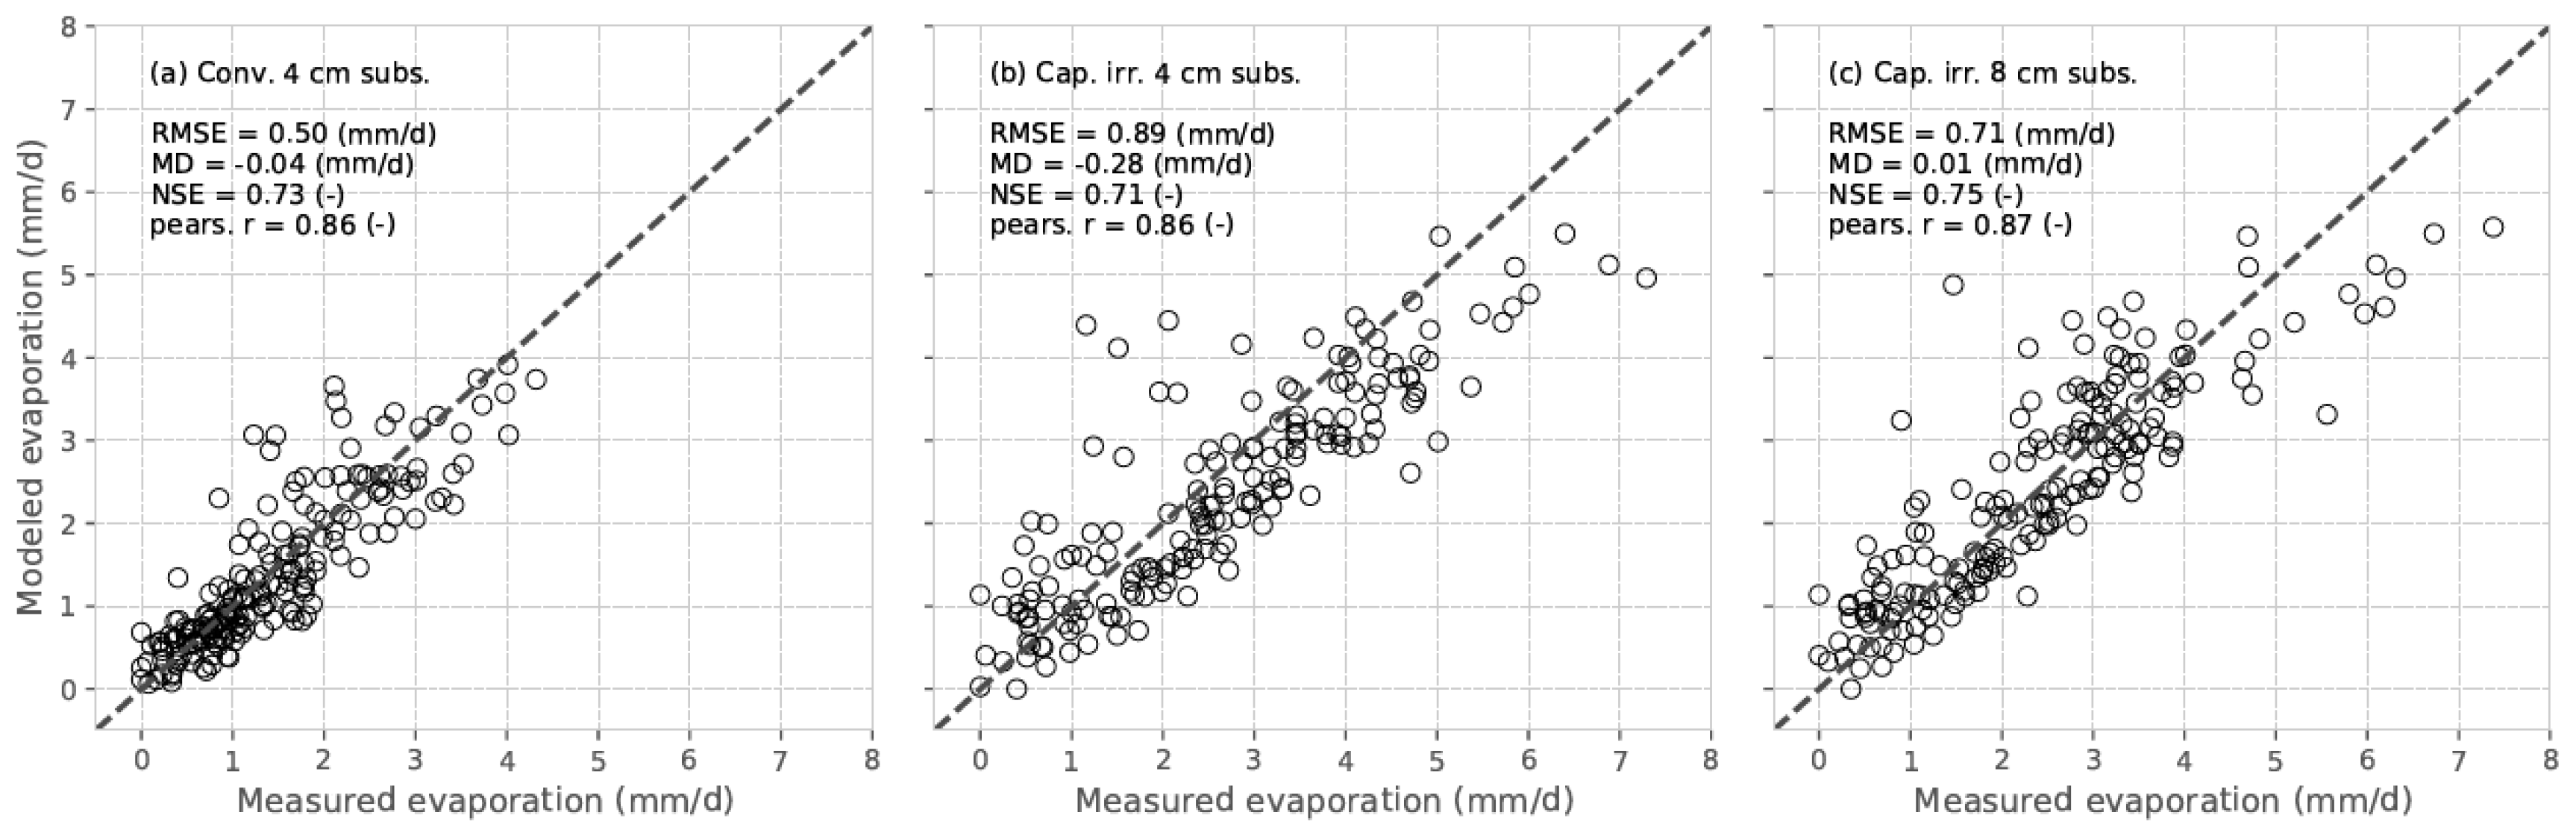
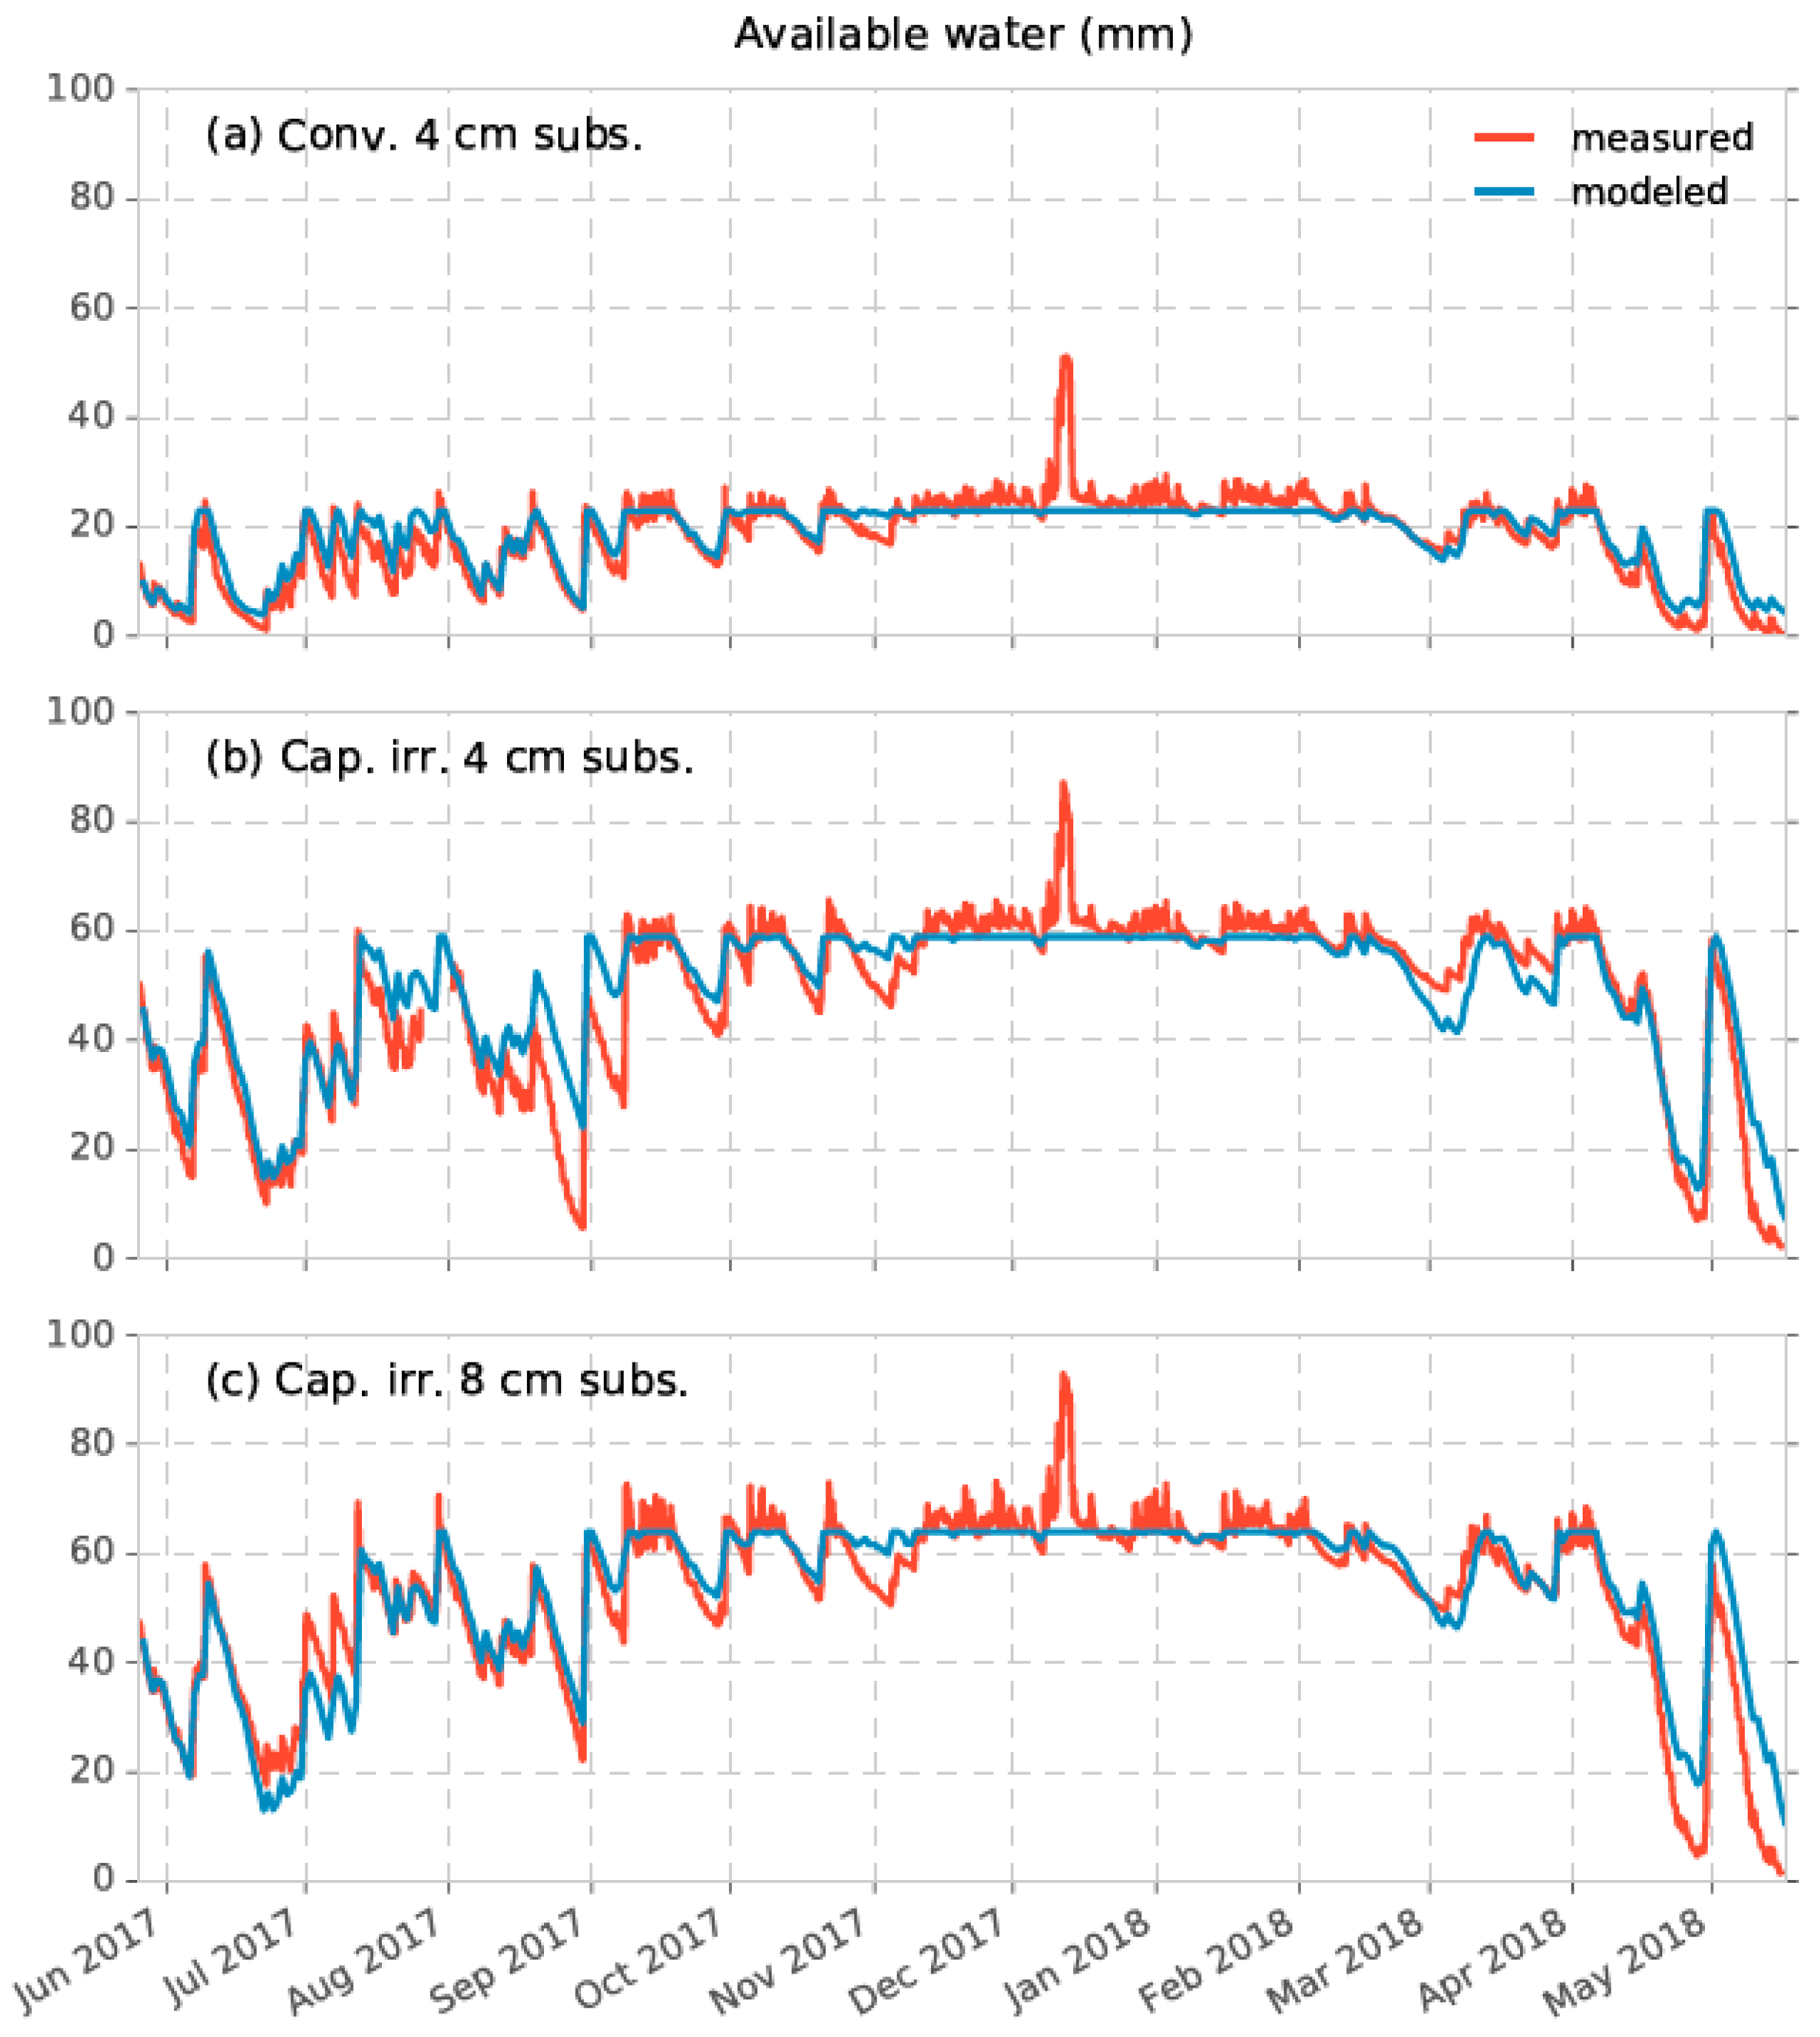
3.1. Measured vs. Modeled Evaporation

The three research plots showed distinct differences in Ea (Figure 5). The capillary-irrigated plots show evaporation fluxes of ca. 3 mm/day on average during summer, with up to well over 4 mm/day especially in late spring 2018. The Ea of the conventional plot showed prolonged periods with significant evaporation reduction during dry spells, especially during spring and early summer.
The back-calculated surface resistance was 170 sm−1 for Sedum and 60 sm−1 for the grass/herb vegetation. The latter was close to the rs of the reference crop evapotranspiration of the FAO-56 [38] for daily time steps, i.e., 70 sm−1. During periods with abundant water supply, the estimated Ep was remarkably well in line with the measured Ea for the conventional plot and the 8 cm substrate capillary-irrigated plot (Figure 5). We observed deviations for the 4 cm substrate capillary irrigated plot, with Ea exceeding Ep during hot spells in August 2017 and June 2018. As mentioned earlier, we attribute these deviations to the effect of warm building air vented directly adjacent to this plot. This warm air can be regarded as an additional energy source for evaporation, resulting in a process similar to the so-called oasis effect. This effect also resembled in the model performance of the bucket model to simulated Ea. The model performed exceptionally well for the plots further away from the vent (MD close to zero, Nash-Sutcliffe efficiencies above 0.73 and Pearson’s r above 0.86), however the plot closest to the vent has a MD of −0.28 mm, i.e., a systematical underestimation of Ea by the model (Figure 6). Besides actual evaporation, the available water simulated by the bucket model compared well with the measured available moisture in the lysimeters (Figure 7).

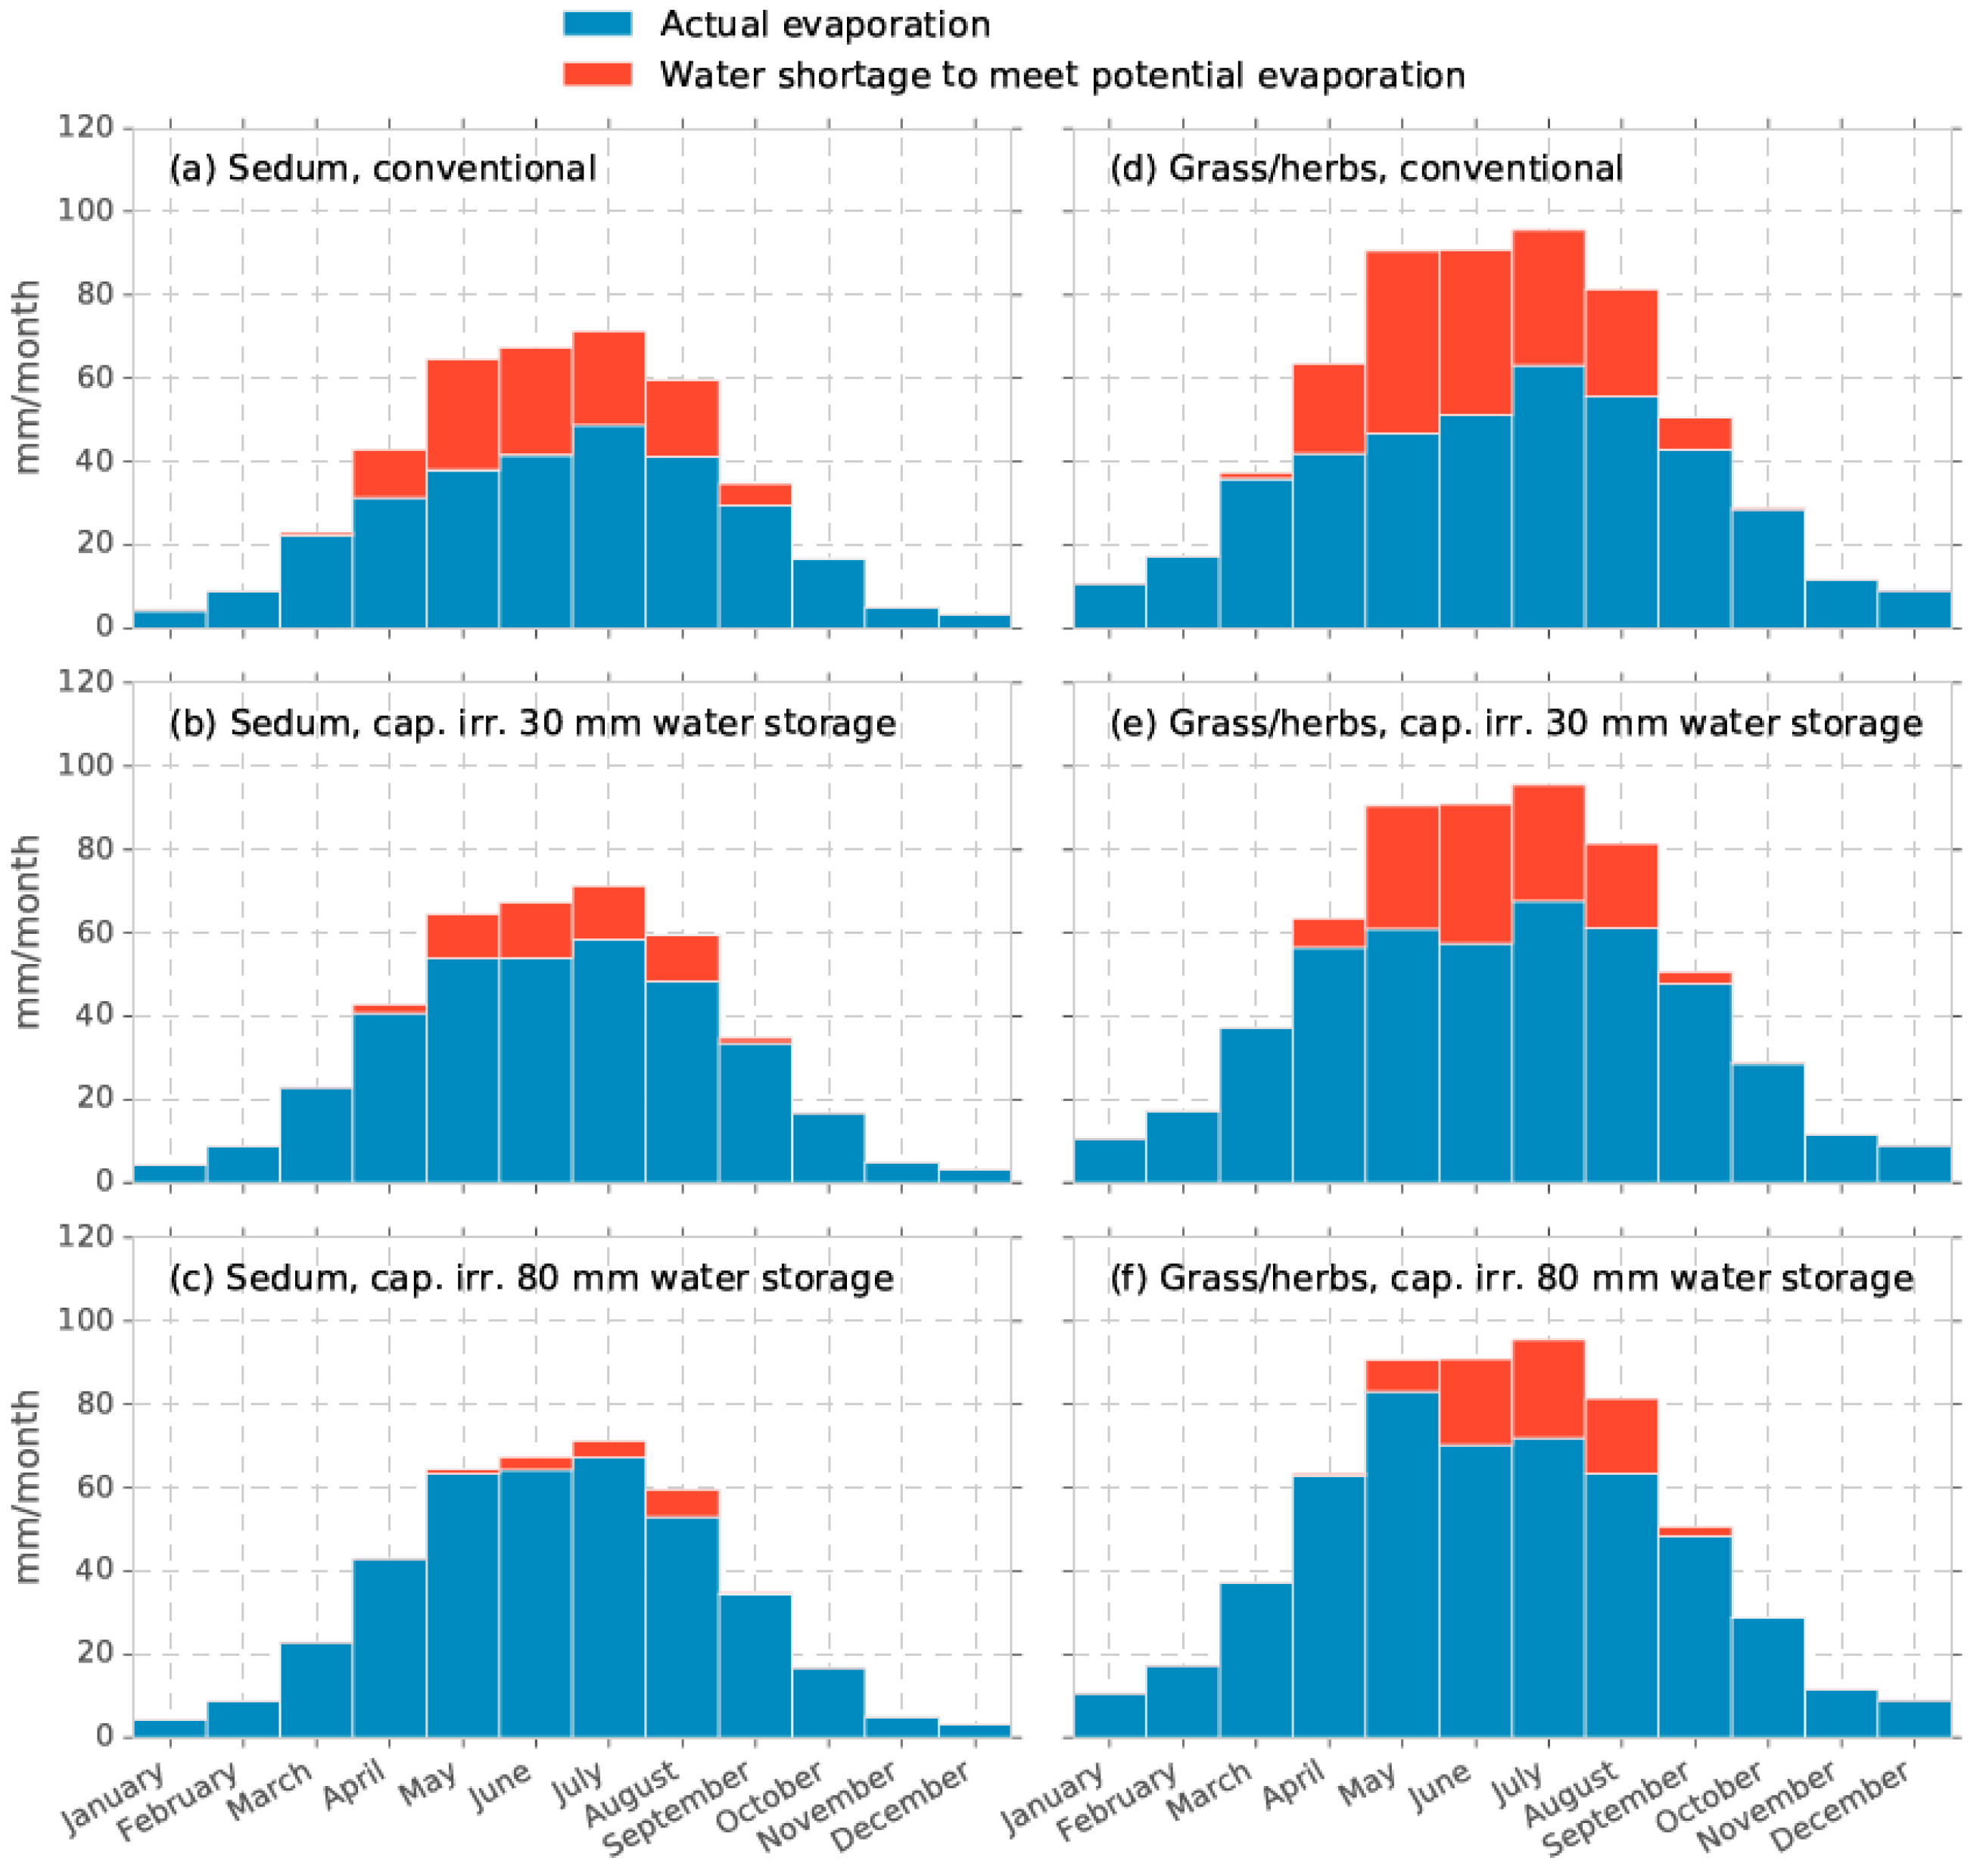
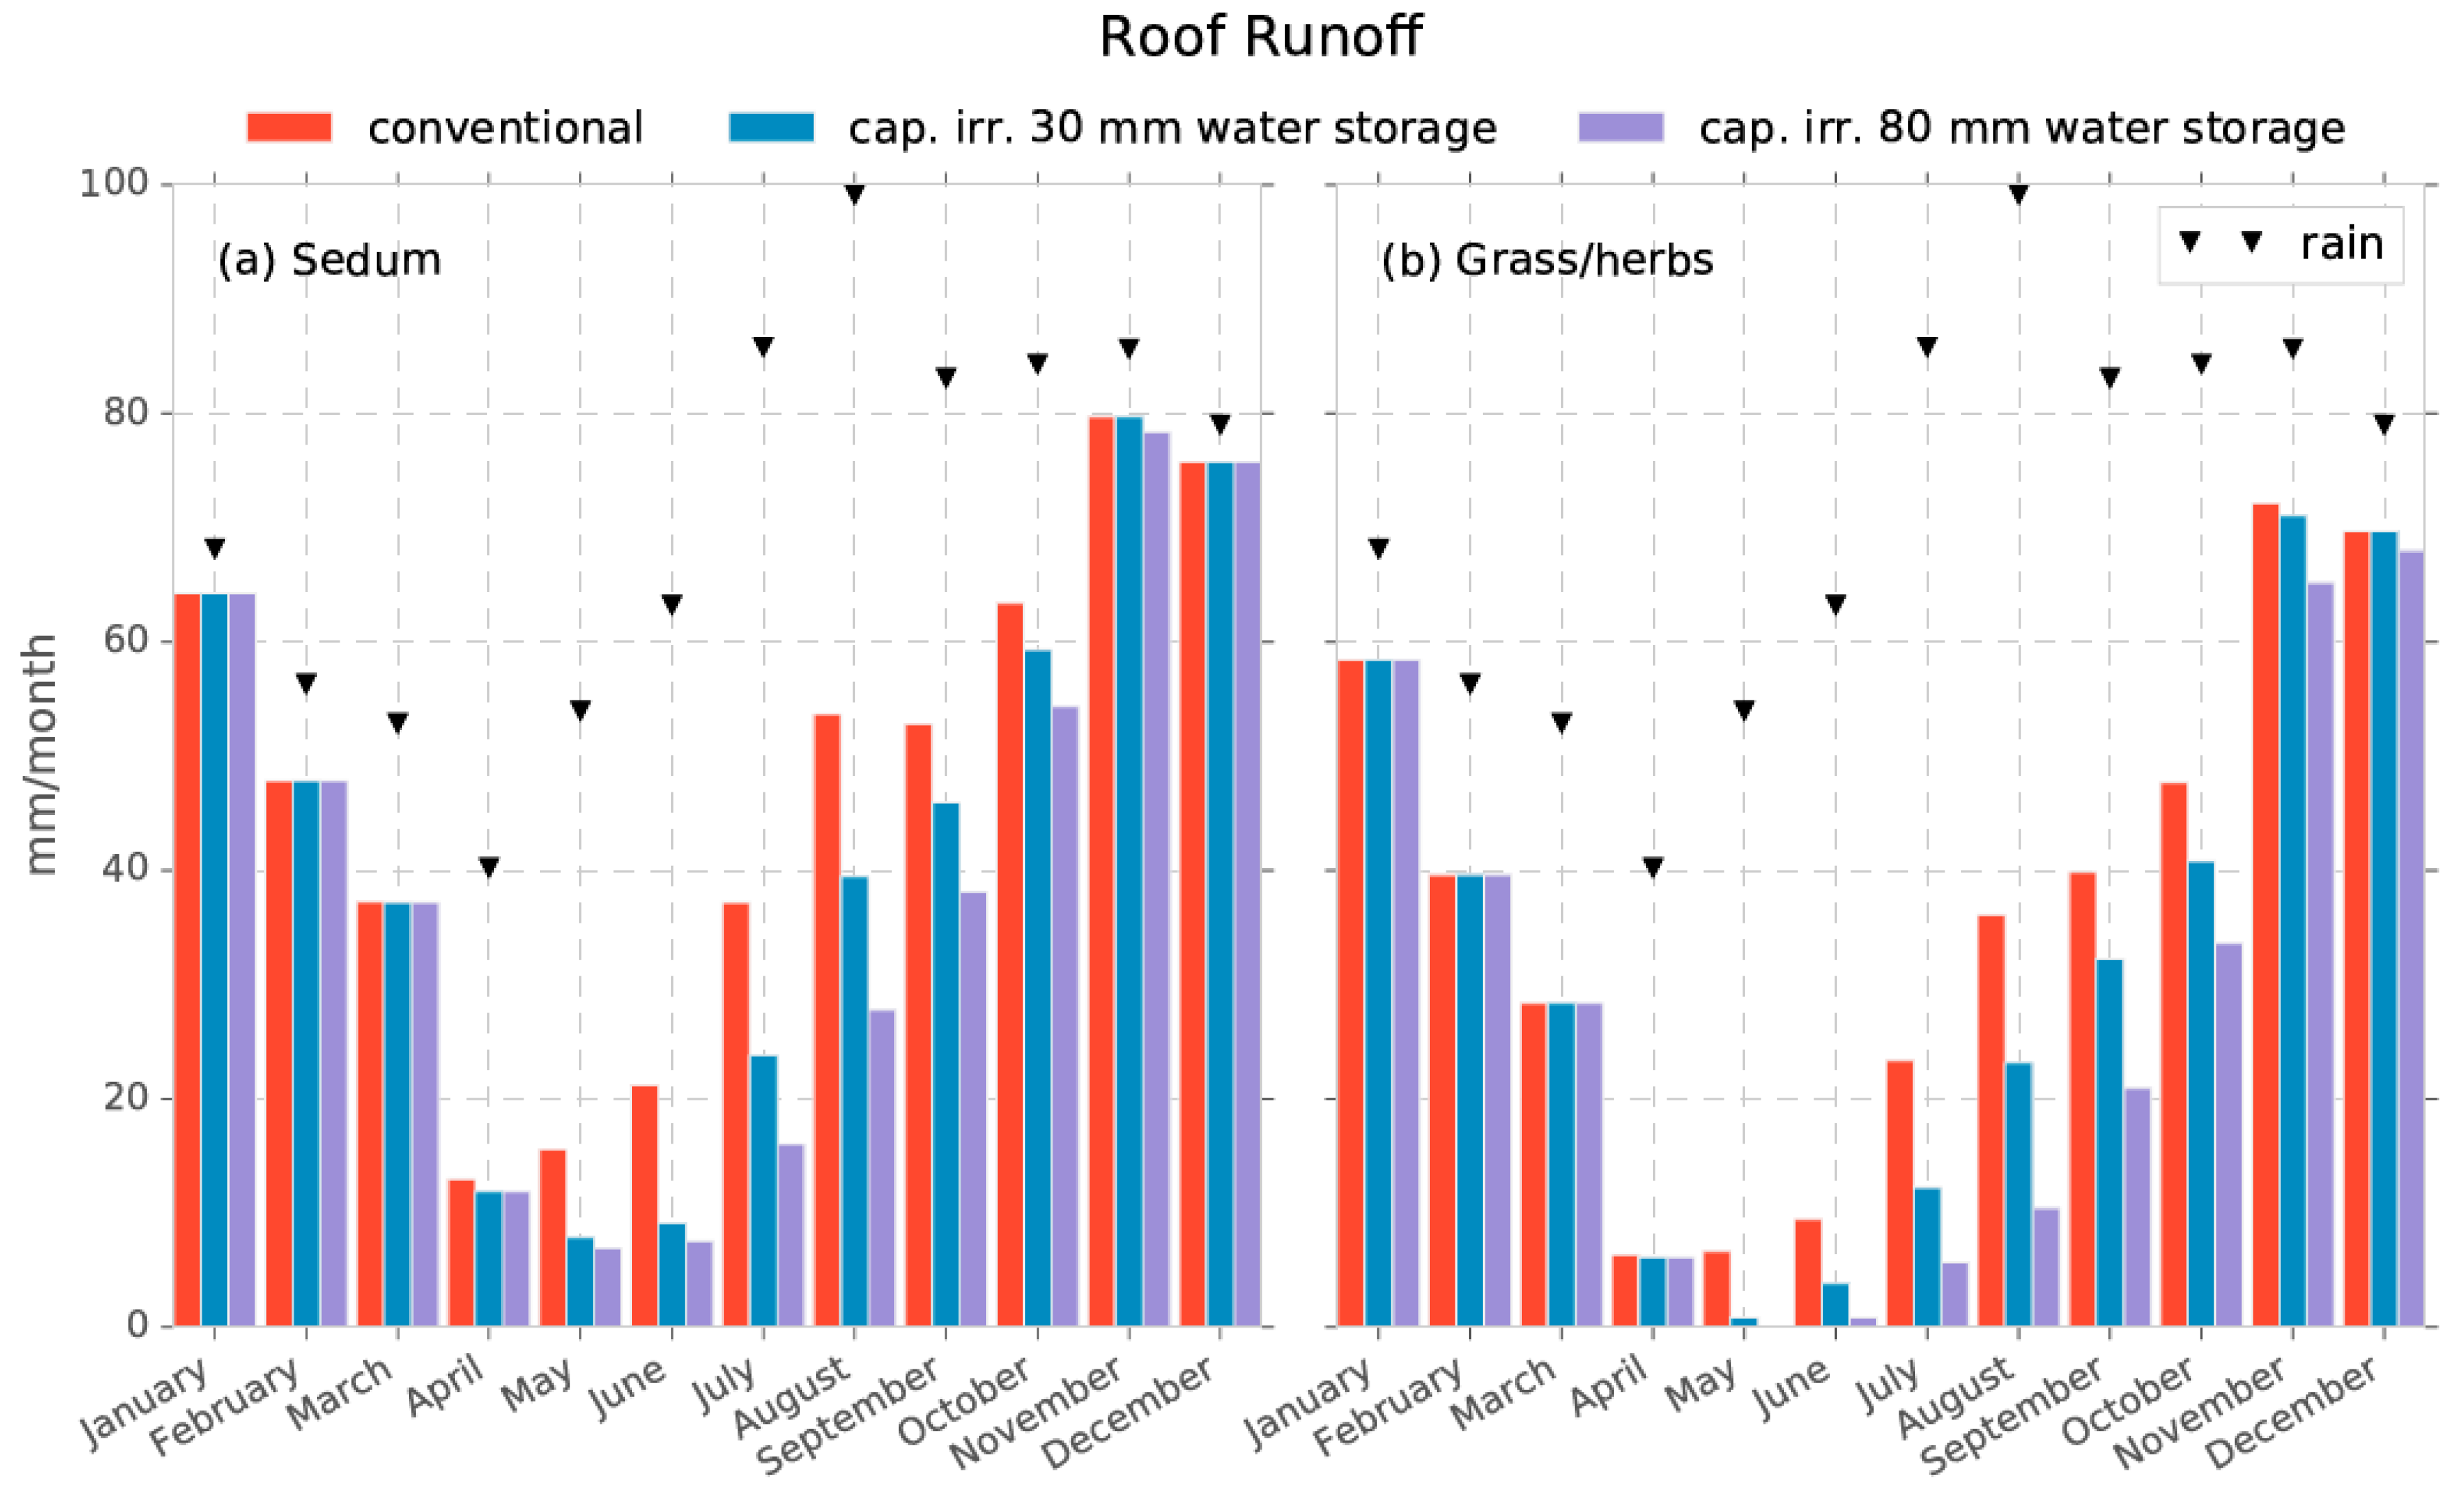
3.2. Long-Term Evaporation Fluxes From Six Different Roof Setups

Long term averaged simulated Ep was 401 mm/year for the Sedum vegetation, and 587 mm/year for the grass/herb vegetation (Table 1). For conventional roof systems, Ea was on average 290 mm/year and 412 mm/year for the Sedum and grass/herb vegetation cover, respectively, i.e., much lower (111 mm/year and 173 mm/year) than the potential evaporation. Such a water shortage is severe and in line with our observation that the Sedum on the conventional roof was colored red and experienced severe water stress. By adding a Permavoid storage and capillary irrigation system with a storage volume of 30 mm and 80 mm, the water shortage for Sedum was reduced to 51 mm/year and 15 mm/year and for grass/herbs to 121 mm/year and 72 mm/year, respectively. The shortage for grass/herbs remained large. Only a few years occurred without a water shortage for the grass/herb cover and a storage of 80 mm (Figure 8f). For Sedum, the water shortage was almost absent for each year using a water storage of 80 mm in the Permavoid storage unit (Figure 8c).
For the conventional roof system, water shortages already started in March and continued until September under the Dutch climate (Figure 9a,d). Using capillary irrigation, the start of water shortages were delayed by approximately one month (Figure 9b,e,f) or disappeared (Figure 9c). Given the water shortages of ca. 20 mm already occurring in April, grass/herb vegetation would probably not survive (and thus be not sustainable) under the conventional system (Figure 9d). Even combined with capillary irrigation and a water storage of 30 mm, significant evaporation reduction occurred from May until August (Figure 9e). Installing 80 mm of water storage limited the water shortages to predominantly the summer months (Figure 9f). Nevertheless, shortages will still be significant during dry years.

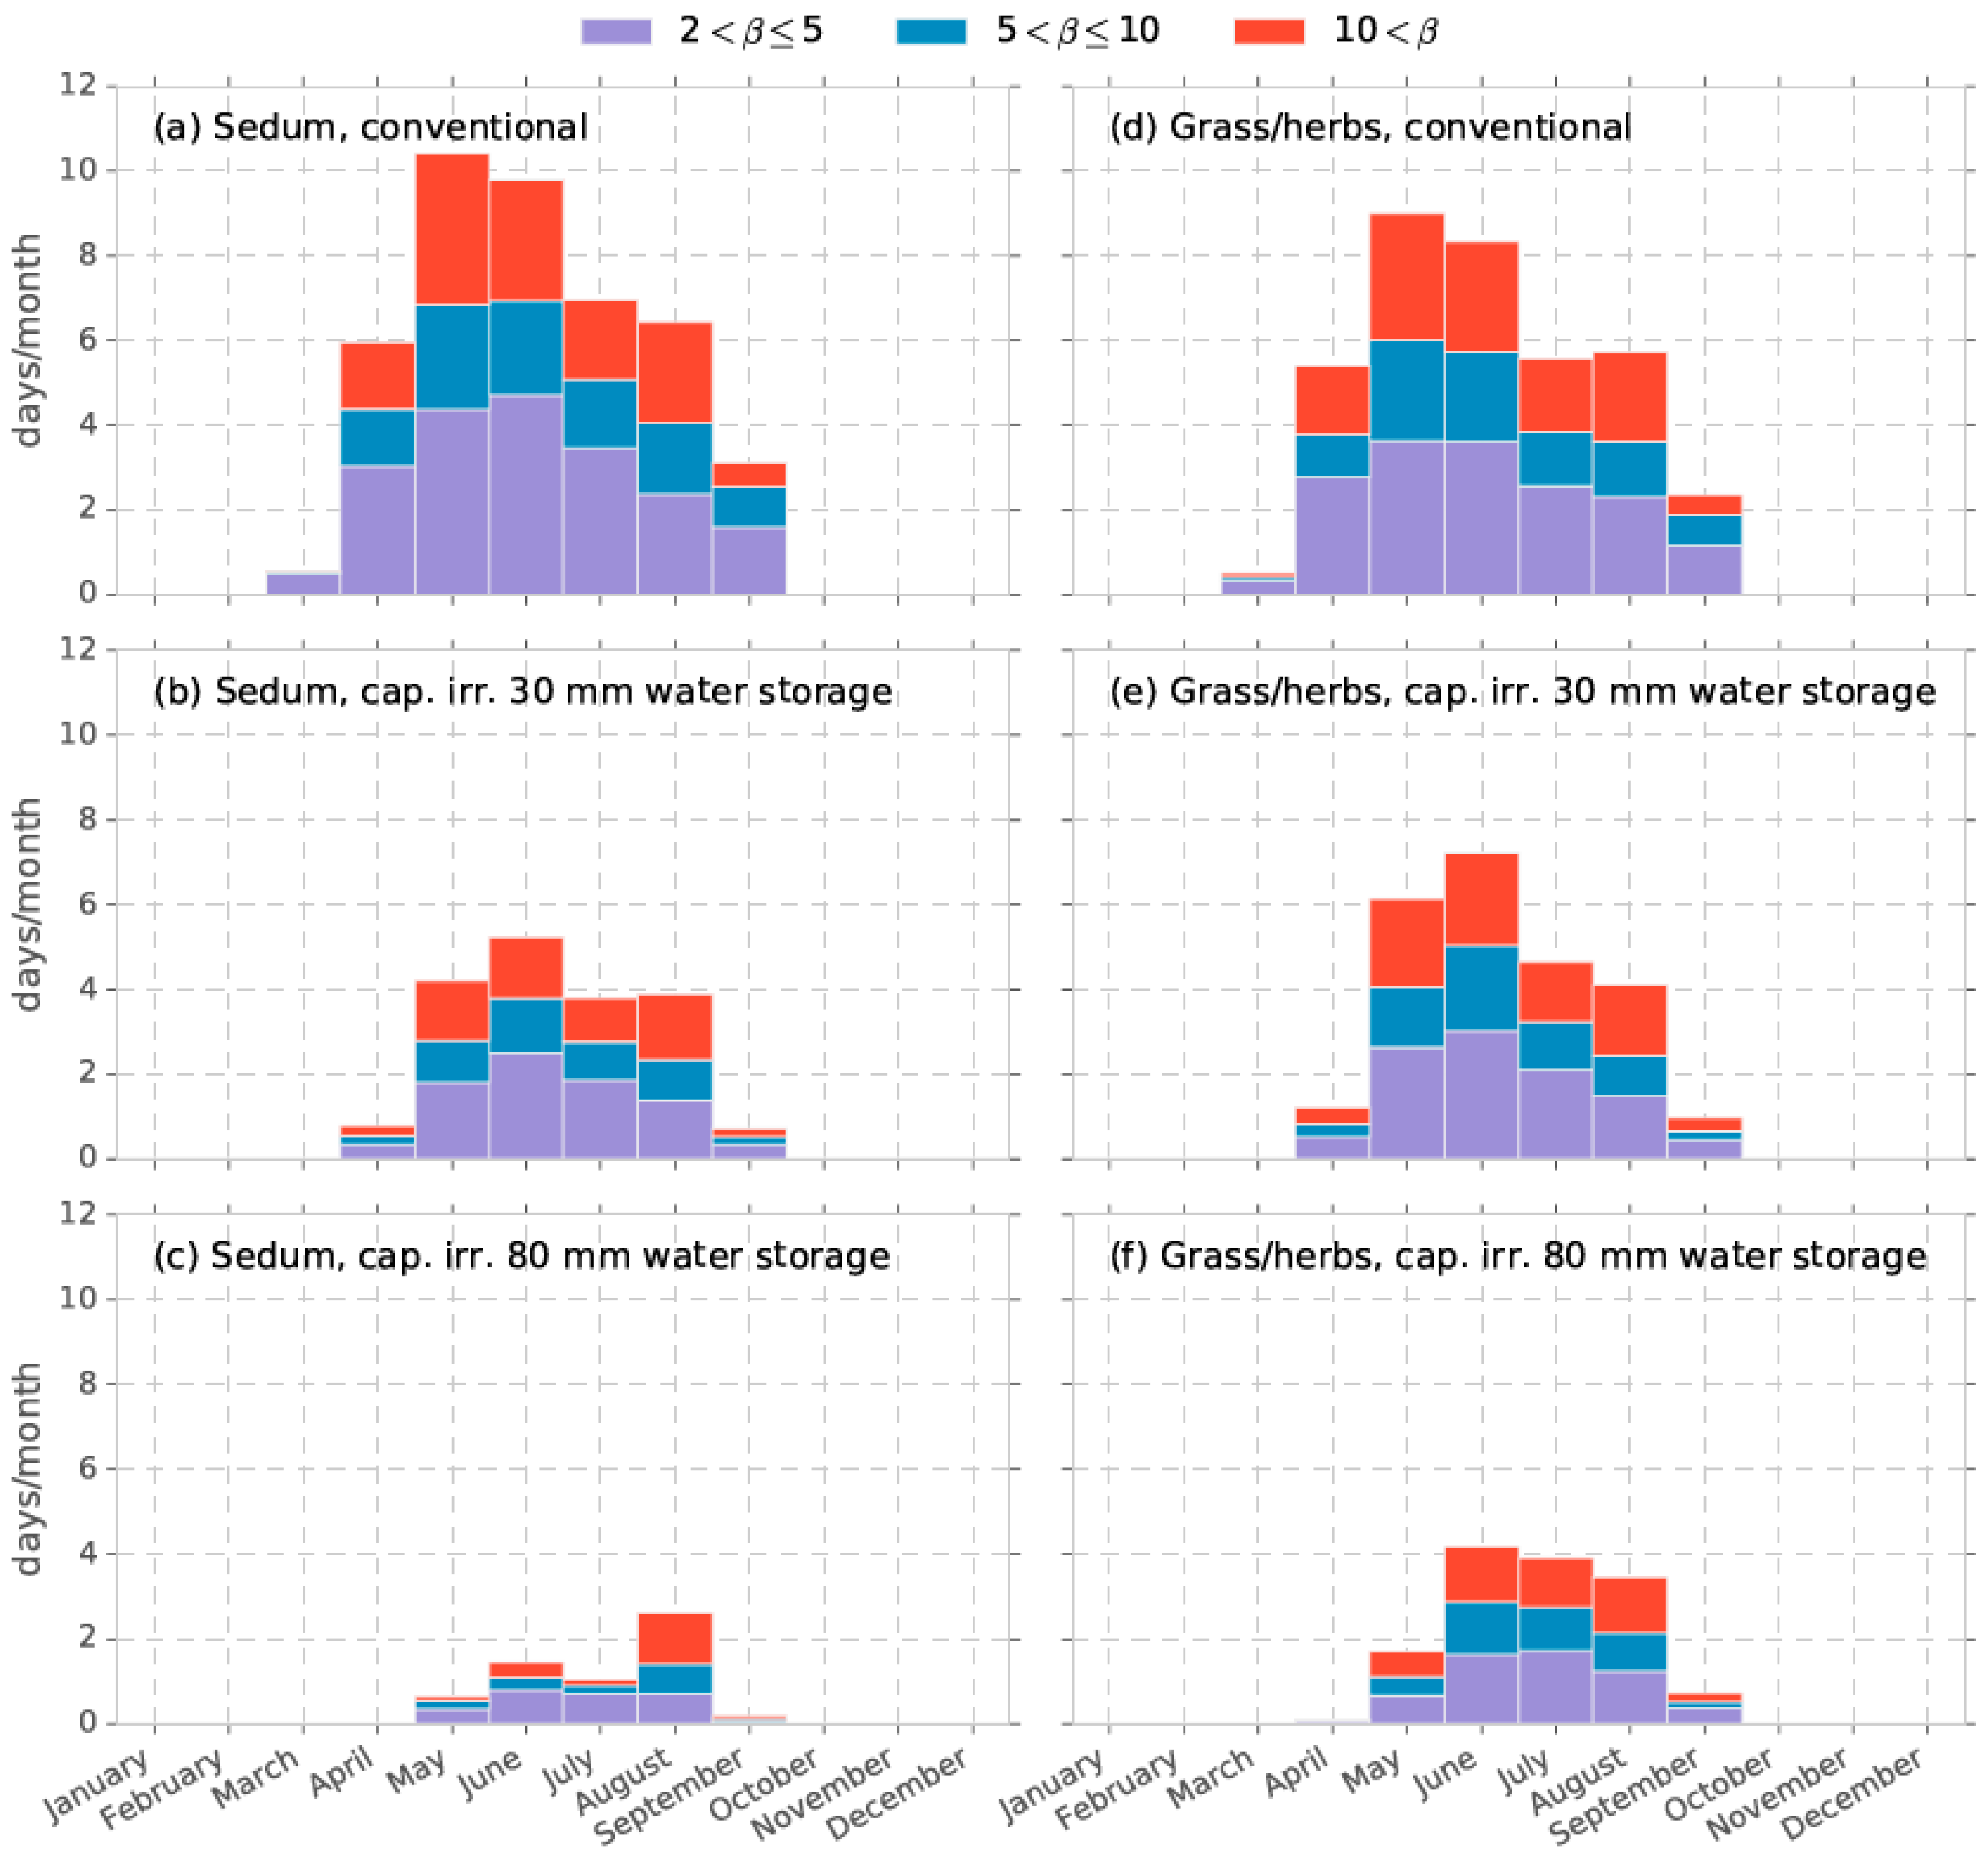
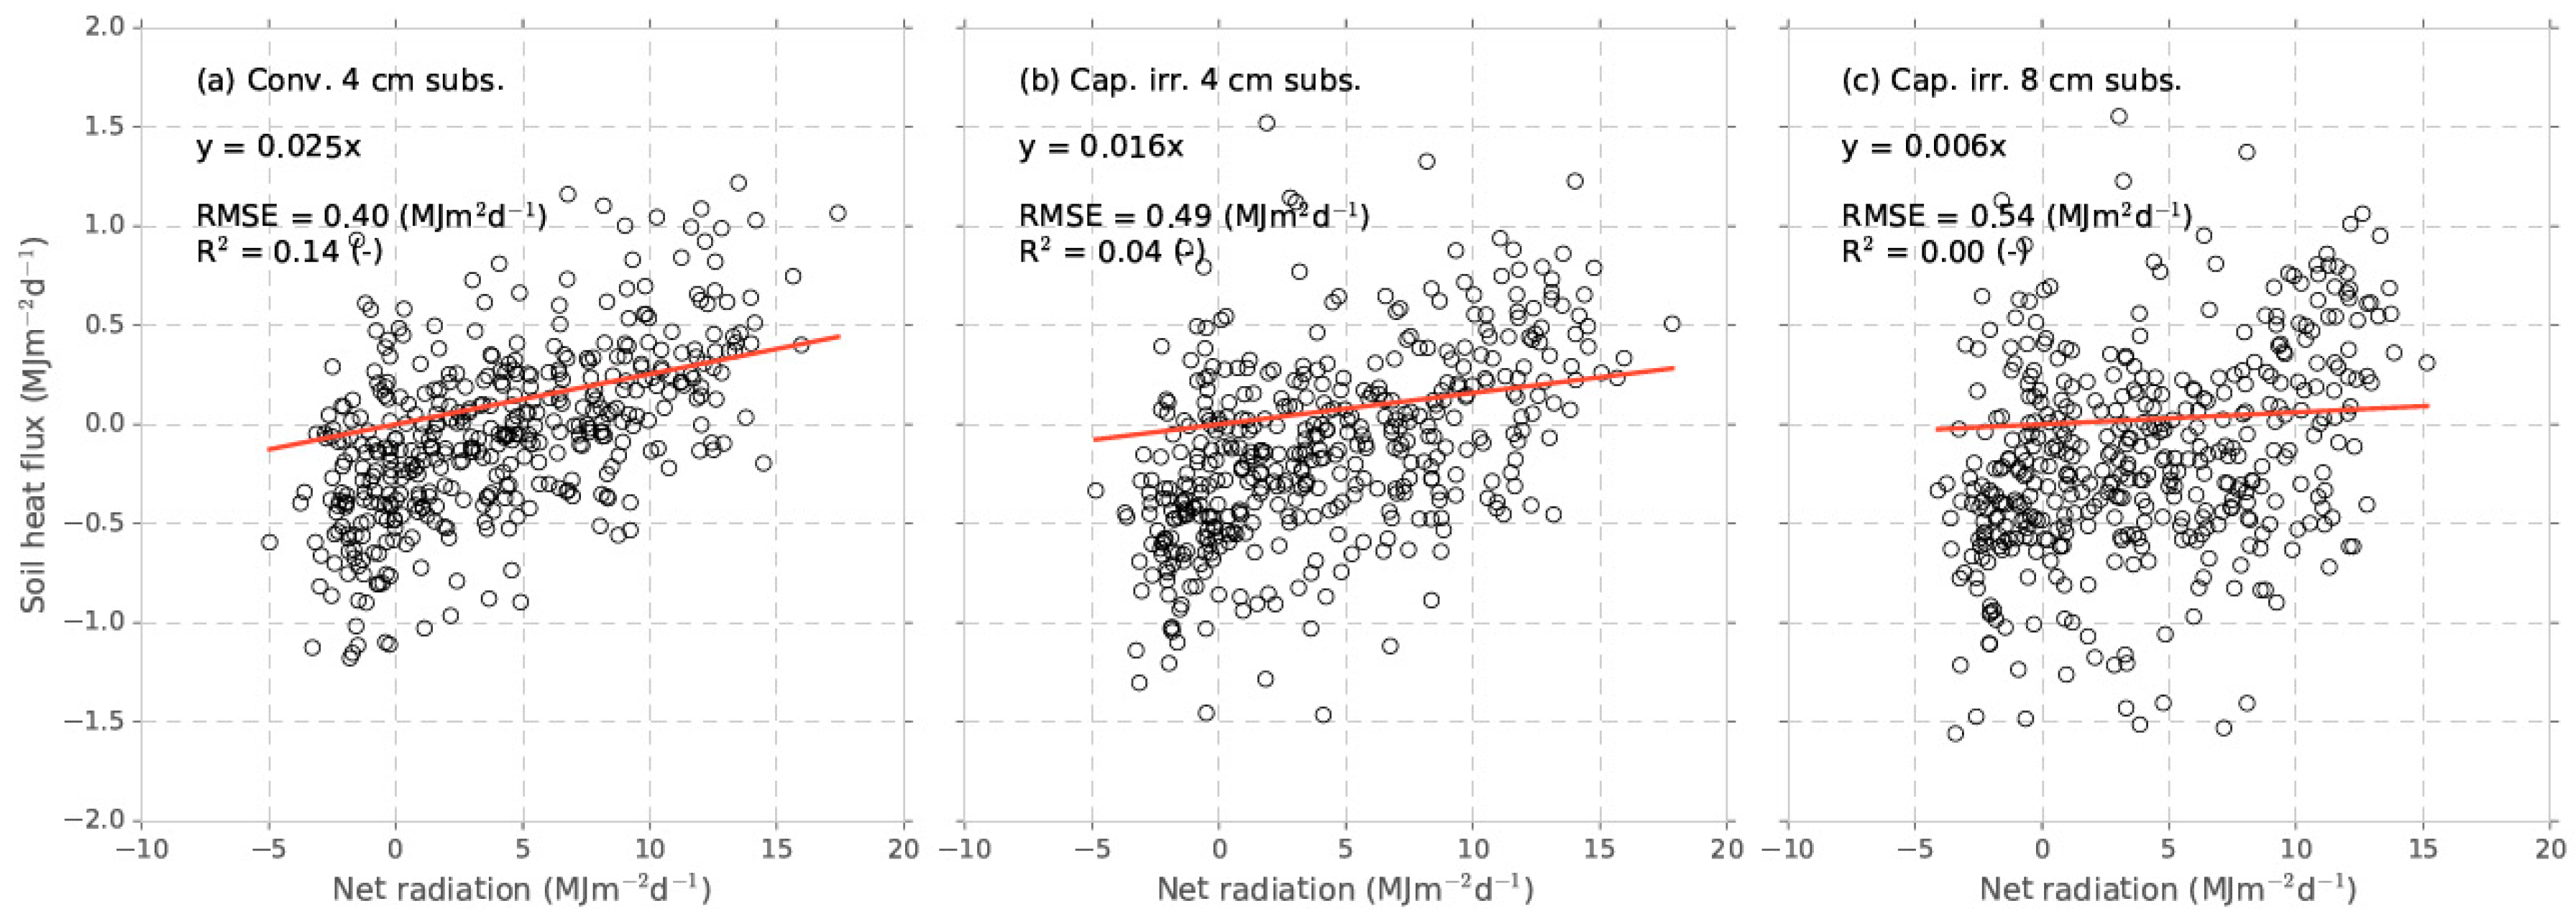
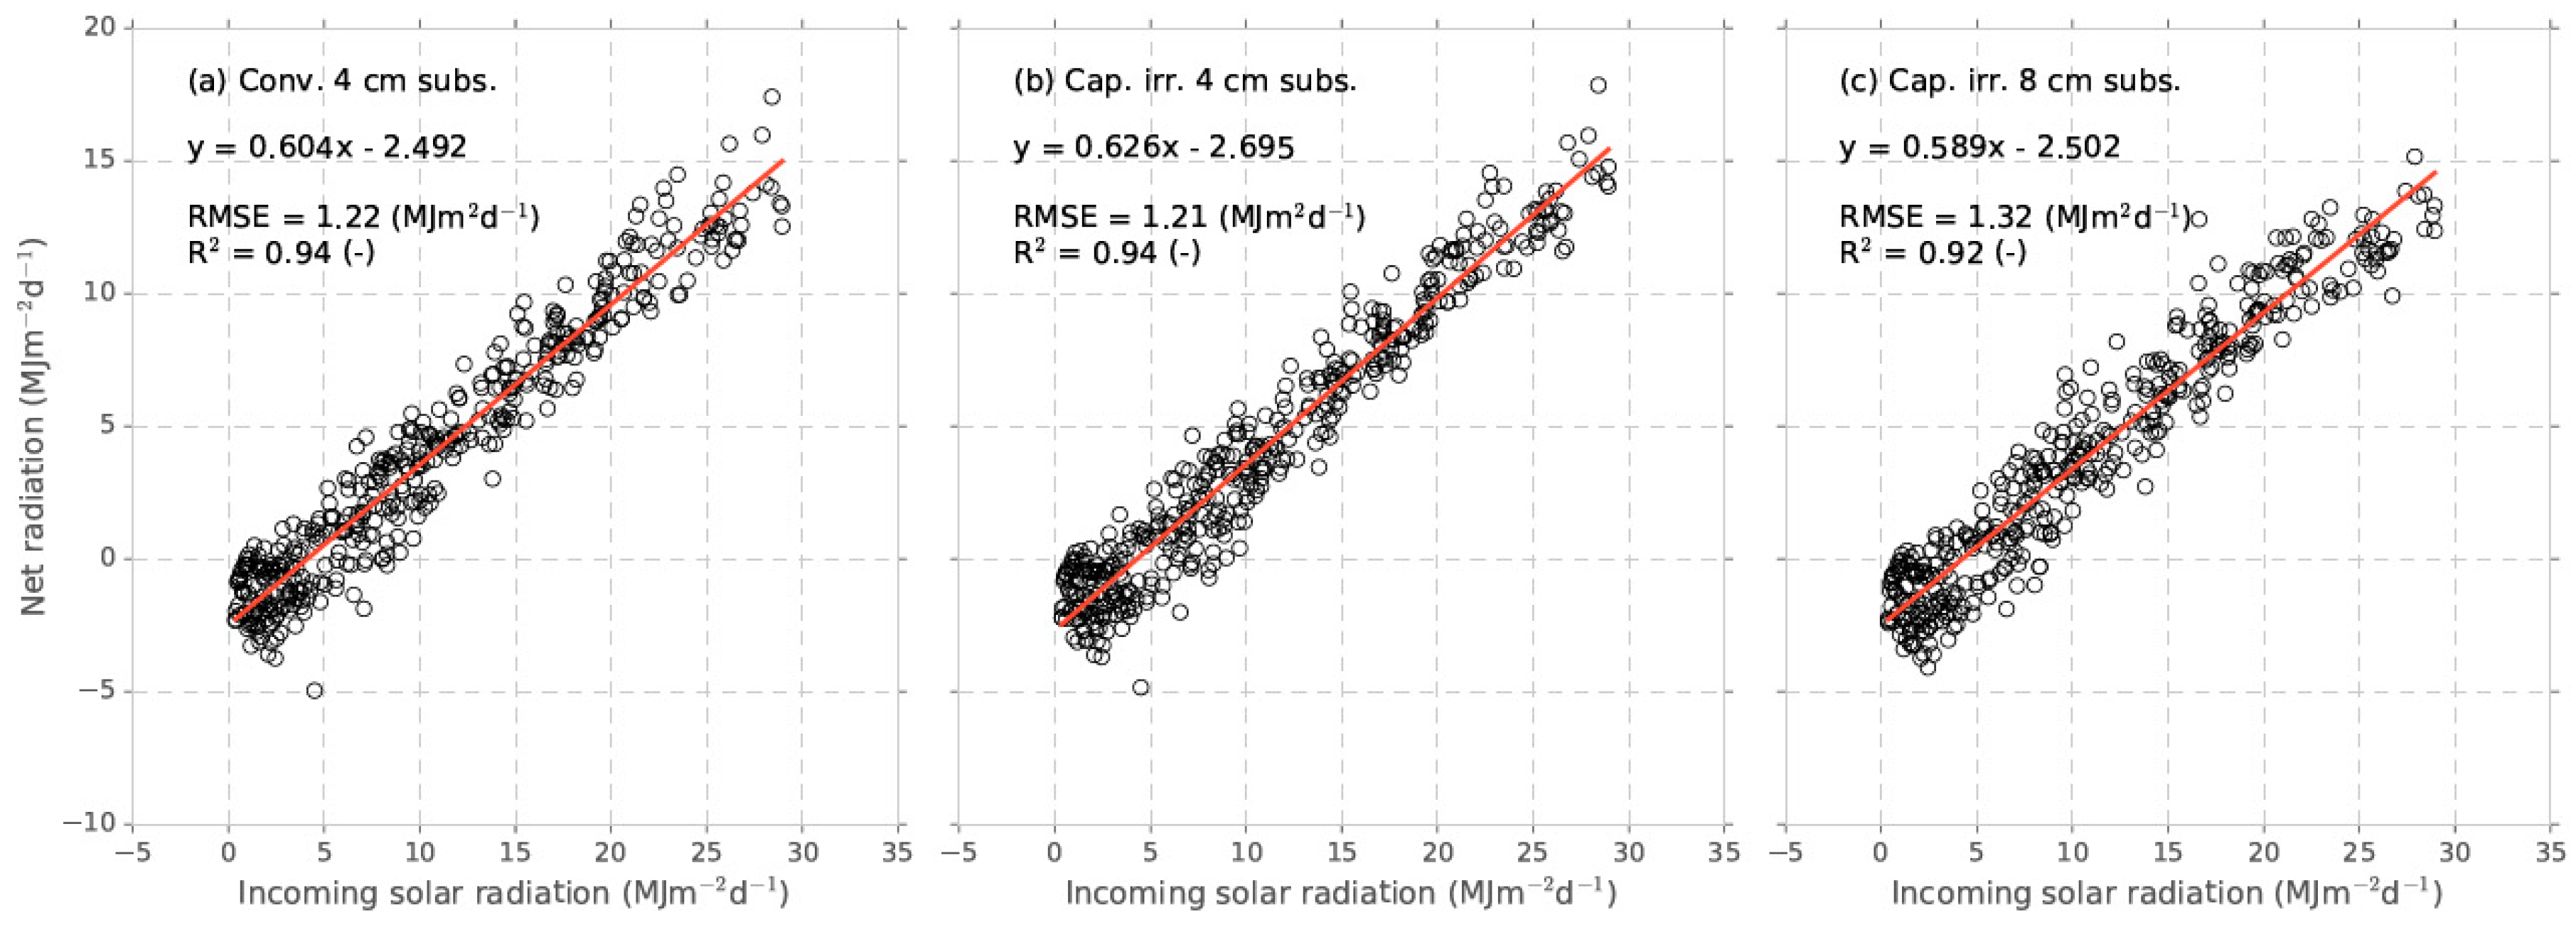
3.3. Energy Considerations

The Bowen ratio β, i.e., the ratio between LE and H, yields a quick insight into the prevailing microclimate on the different roofs. The annual mean Bowen ratios were below one for all investigated systems (Table 2), which was in line with the local temperate humid climate conditions. The abundant water supply at the capillary irrigated plots was reflected in very low mean βs. On hot summer days, however, β became much higher. During hot summer days, βs of well over 10 occurred at all modeled roof setups, indicating days with virtually no water available for evaporation, and high H fluxes (Figure 10), i.e., extensive warming of the air. Conditions resembling semi-arid conditions (2 < β ≤ 5) and arid conditions (5 < β ≤ 10) even occurred on a regular basis during spring and summer. Nonetheless, there were distinct differences between the different roof setups. With over 10 days per month with β > 2 (total stacked column) and up to four days per month, with even β > 10, the conventional system was the least effective for evaporative cooling. Storage of precipitation and capillary irrigation reduced the number of days per month with water stress and high β. Furthermore, storage of water limited water stress and high βs to predominantly June, July, and August, while without storage, high βs also occurred in spring and early autumn. Storing to a maximum of 30 mm already halved the number of days, with β > 2 for a Sedum-vegetated roof compared to the conventional layout (Figure 10b). Increasing the storage level to 80 mm roughly halves the number of days with β > 2 again and delays high β days till the end of summer (Figure 10c). Storing precipitation water has less effect on the βs of the grass/herb vegetated systems (Figure 10e,f). Although the annual mean LE is higher for the grass/herbs vegetation (Table 2), the number of days with low LE and thus lower evaporative cooling is lower for the Sedum vegetation. The higher Ep of the grass/herbs vegetation and consequently the earlier event of running dry for the precipitation storage form an explanation for this.

4. Discussion

In this study, the water availability and water demand is quantified for green roofs with and without precipitation storage and the capillary irrigation. We present one year of detailed measurements of actual evaporation and parameterized the Penman–Monteith equation with on-site measurements. We used this dataset to parameterize and validate a simple bucket model to estimate actual evaporation for a period of 30 years. The model performed well with mean deviations of −0.04 mm/day, 0.28 mm/day, and 0.01 mm/day, respectively, for the conventional plot, the capillary irrigated plot with 4 cm substrate, and the capillary irrigated plot with 8 cm substrate. This model performance was very good, and comparable with, for instance [25], who used a variation of the Thornthwaite–Mather approximation to calculate Ea based on the substrate moisture content. In line with [25], the Penman–Monteith based estimates of Ep using on-site and the regional datasets in combination with a simple water availability model, resulted in a good prediction of Ea for different green roof layouts in Amsterdam.
As hypothesized, the storage of precipitation and capillary irrigation proved to be an effective measure for increasing evaporation. Installing a maximum 80 mm storage and capillary irrigation system increased the mean annual Ea to 101 mm/year and 96 mm/year, respectively, compared to a conventional grass/herbs and Sedum layout (Table 1). The mean annual water shortage reduced to 72 and 15 mm, respectively, resulting in an almost potential evaporation of the Sedum vegetation. Hydrological performance in the sense of evaporating precipitation water instead of discharging this water to the sewer was thus greatly improved by the storage and capillary irrigation system.
The Sedum-covered plots at the beginning of the experiment had a remarkably large evaporation rate. There is still some debate in the literature on the effectiveness of Sedum vegetation for evaporation and consequent cooling. For instance, Solcerova et al. [20] state in their recent paper that Sedum species do not transpire during daytime due to their crassulacean acid metabolism (CAM). Our detailed 5 min basis Ea measurements however, showed predominantly daytime evaporation for the Sedum vegetation. This resulted in daily evaporation fluxes of up to 4 mm/day when the water availability was not limiting. Our results fell within the range of several detailed studies on the evaporation presented in [27,28]. Comparable daily Ea fluxes, of over 4 mm/day, were found by [27] for two sedum dominated roofs in New York. Our results are supported by many ecological and plant physiological studies, who point out the water status dependency of the metabolism of Sedum species [28,40,41,42,43,44,45,46,47]. For instance, in the majority of European species, CAM activity is water status-dependent [42]. Many of the species in commercially available Sedum mix blankets and plugs, e.g., Sedum album, Sedum acre, Sedum kamschaticum, exhibit C3-type photosynthesis when water is available, but they shift to CAM mode when water becomes scarce.
Based on our results, in contrast to [20], we advocate the application of Sedum species as rooftop vegetation when cooling is the main objective, and active irrigation is not favored. A well-watered Sedum vegetation (i.e., not experiencing water stress) has a lower annual evaporation compared to a grass/herbs vegetation, but day-to-day evaporation still remains substantial, up to 4 mm/day, when water is available. Moreover, due to the higher water efficiency of Sedum vegetation, it takes longer before the water runs out in the system and evaporation declines. Our results showed that when storing up to 80 mm of water, Sedum vegetation is sustainable in the long term. Grass/herbs vegetation wilts when water runs out, and it takes substantial time to recover. During this period, evaporation and thus cooling is strongly reduced. Due to the CAM shift, Sedum species can survive prolonged drought periods and recover quickly when water is available again. With on average ca. 70 mm and in dry years over 150 mm of additional irrigation annually, grass/herbs vegetation becomes sustainable under the Dutch current climate, assuming an 80 mm storage level and capillary irrigation. Besides, the extra cooling capacity, such as vegetation, provides additional advantages such as a higher potential for more natural vegetation sustaining native biodiversity. Irrigation might become even more essential, as very recent high-resolution climate modeling suggests amplified the drought conditions in central-western Europe during the future spring and summer [48]. The question is, of course, where to obtain this irrigation water. The maximum allowable weight on existing roofs is often limited, especially restricting the amount of water storage on the roofs of already existing buildings [49]. Tap water is an easily available source and it can be directly supplied to the storage units with an automated valve. Although using tap water might be a financially viable solution [50], using this high quality water might not be a very sustainable solution, especially in prolonged dry periods. On a neighborhood level, high-rise buildings might be fitted with a reflective white coating or white gravel (so called ‘cool roofs’) [19], in combination with rainwater storage. This water could then be used to irrigate the lower-lying roofs during periods with water demand. It might also be beneficial, depending on the local geohydrological conditions, to store excess rainwater in subsurface aquifers during winter (in our case over 337–562 mm/year, depending on a grass/herbs or sedum vegetation, when subtracting annual mean Ea (Table 1) from mean P), and to recover this water for irrigation during summer. This might also reduce peak storm water discharges and provide water for other functions. Given the positive experiences with aquifer storage and recovery for greenhouses [51], such a solution might be feasible on a neighborhood level. Other options might be the treatment and reuse of greywater, as proposed by [52], or a combination of the above options.
Presenting our results, we want to address the importance of local microclimatic conditions such as wind speed and anthropogenic sources of energy when estimating the Ep and Ea of green roofs. For instance, not correcting for wind speed differences between the local site and the regional meteorological station (Schiphol) would lead to a 140 mm larger potential evaporation for the grass/herbs vegetation. This implies that roofs exposed to wind will have larger water shortages than what is presented in this paper and this will result in harsher environments for the grasses and herbs. This is especially the case for tall vegetation with a low aerodynamic resistance, such as grasses and herbs. The Ep of Sedum only marginally increased with 19 mm without correcting for wind. Moreover, additional energy sources such as air vents and air conditioning units are common on roof tops. In our case, a building air vent next to the 4 cm substrate capillary irrigated plot resulted in a measured Ea exceeding the estimated Ep by several mm/day during hot days in August 2017 and June 2018.
Although Sedum is a good choice with respect to the survival of drought periods and evaporative cooling, for reducing storm water runoff, a grass/herbs vegetation might be a better choice (Figure 11). Plots with grass/herbs vegetation show an overall lower estimated discharge due to the higher evaporation. During winter, the estimated storm water runoff of the different roof setups is comparable. During spring and summer, estimated differences are clearly visible. The Monthly averaged estimated runoff from a capillary-irrigated roof with 80 mm storage is only half that of a conventional roof with Sedum vegetation (Figure 11a). With grass/herbs vegetation, this difference is even larger, resulting in almost no estimated discharge in May and June, and less than one third of the estimated discharge in July and August (Figure 11b).
The question remains for whether green roofs cool the air. We found that evaporation and thus LE is highly dependent on the configuration of the roof, and especially the ability to store and provide water when needed. We observed higher maximum air temperatures at 21.5 cm above the substrate level on hot summer days at the conventional roof compared to the irrigated plots. We however chose not to use this data because these temperature differences are hard to interpret due to, for instance, the advection of warmer or colder air from adjacent areas of the roof, the effects of ventilation systems, and mixing of the air due to wind effects. Instead, we therefore decided to focus on the energy balance, which provides less disputable information on the effects of the different green roof layouts on the urban energy balance. We showed that the distribution of net incoming energy over latent energy LE and sensible heat flux H is highly dependent on the water availability, which is in line with the calculations of [19]. We calculated the number of days per month above certain Bowen ratios (β) (Figure 10) to assess the occurrence and severity of dry-out events. A storage of 80 mm and capillary irrigation limited the number of β > 2 days per month to one or two on average during summer for a Sedum vegetation and up to four days for a grass/herbs vegetation. Without capillary irrigation, the number of high β days was much higher with over eight days per month with β > 2 and over three days per month with β > 10 during summer. Storage and capillary irrigation thus strongly reduces H. Additional irrigation can reduce the sensible heat flux even further. To assess the potential of different green roof designs effects on UHI, our findings need to be extrapolated to the city scale level with regional climate models.
Our measurements, parameterizations, and simulations can help to improve the implementation of water availability effects in these models under temperate conditions. Further research is needed to assess the effect of water storage and capillary irrigation for green roof performance under different climatic conditions. As pointed out by [21], solar radiation and relative humidity are the key meteorological factors for the evaporative cooling potential of green roofs. For instance, in tropical megacities (e.g., Bangkok, Singapore) evaporation is reduced due to very high RH, limiting the evaporative cooling potential. Nonetheless, Jim et al. [21] still measured a significant cooling effect on the air layer directly above the vegetation in humid sub-tropical Hong Kong. Blue-green roofs in megacities with a hot-dry climate with high solar intensity (e.g., Cairo) however, might have a higher cooling potential compared to our results when irrigation water is available. Morakinyo et al. [53] compared the thermal performance of green roofs under four climatic conditions (temperate (Paris), warm humid (Tokyo), hot humid (Hong Kong) and hot-dry (Cairo)) using ENVI-met model calculations for virtual urban density scenarios. Their results indicate that the cooling potential of (intensive) green roofs follows this order (from high to low potential): hot-dry, hot-humid, warm-humid, and temperate, when water availability is not a constraining factor. Based on these results, we expect that blue-green roofs with capillary irrigation have beneficial effects on the urban climate outside of temperate regions.
Amsterdam has about 12 km2 of unused flat roof tops, providing a vast area for greening the city, storing excess precipitation, and reducing UHI. Our research provides valuable information on the feasibility and effectiveness of different green roof designs, which might be implemented on these currently unused rooftops. Depending on the building weight limitations, which need to be evaluated in each case by a structural engineer, we advocate rooftop storage of precipitation water and the use of this water for irrigation if possible. In our case, the maximum load was only 90 kgm−2, but with some relatively simple structural changes, we could increase the maximum load to over 142 kgm−2 for the three raised research plots. Storing precipitation and capillary irrigation results in reduced H, less discharge to the sewer system and more options for more diverse and natural vegetation.

5. Conclusions

  • A combination of Penman–Monteith estimates of potential evaporation, and a simple bucket model for evaporation reduction results in good estimates of actual evaporation of green roof vegetations (i.e., NSE > 0.73, Pearson’s r > 0.86).
  • Storing precipitation water and passive capillary irrigation significantly increases the evaporation and delays the evaporation reduction and decrease of latent heat flux during hot dry periods.
  • Storing precipitation water and passive capillary irrigation decreases the number of days with high Bowen ratios. Storage and capillary irrigation thus strongly reduces the sensible heat flux.
  • Sedum had a remarkably large evaporation rate and showed predominantly daytime evaporation, pointing at a shift from CAM to C3 when water is abundantly available.
  • Although well-watered Sedum vegetation has a lower evaporation rate compared to grass/herbs vegetation, day-to-day evaporation still remains substantial. Moreover, due to the higher water efficiency of a Sedum vegetation, it takes longer before the water runs out in the system and evaporative cooling declines.
  • In the case of stormwater reduction and biodiversity as additional objectives, a grass/herb vegetation might provide extra benefits due to the higher evaporation and the earlier emptying of the system, and a more diverse native vegetation. However, under the Dutch climatic conditions, additional irrigation is needed for the survival of such a vegetation during dry spells.
  • To assess the potential effects on UHI, our findings need to be extrapolated to the city scale and other climates with regional climate models. Our measurements, parameterizations, and simulations can help to improve the implementation of water availability effects in these models.

Author Contributions

D.G.C.; B.R.V. designed and performed the experiments; T.v.V.; B.R.V. and D.G.C. analyzed the data; D.G.C.; B.R.V. and R.P.B. wrote the paper.

Funding

This activity is financed with PPS-funding from the Topconsortia for Knowledge & Innovation (TKI’s) of the Ministry of Economic Affairs and Climate (The Netherlands).

Acknowledgments

We thank our project partners (the municipality of Amsterdam, Waternet, Marineterrein Amsterdam, Drainproducts Europe BV, and Aedes Real Estate for establishing the research site (see www.projectsmartroof.nl). We want to thank Joris Voeten for his help with the construction and maintenance of the Smartroof 2.0 roof garden and research plots.

Conflicts of Interest

The authors declare no conflict of interest. The founding sponsors had no role in the design of the study; in the collection, analyses, or interpretation of data; in the writing of the manuscript, and in the decision to publish the results.

Abbreviations

NotationDescription
EEvaporation from a vegetated surface (mm/day)
EtPlant transpiration (mm/day)
EsSoil evaporation (mm/day)
EiEvaporation of intercepted water (mm/day)
EpPotential evaporation (mm/day)
EaActual evaporation (mm/day)
LELatent heat flux (MJm−2/day)
HSensible heat flux (MJm−2/day)
RnNet radiation (MJm−2/day)
RsIncoming shortwave radiation (MJm−2/day)
GSoil heat flux (MJm−2/day)
ρaAir density (kg m−3)
cpSpecific heat of moist air (J·kg−1 °C−1)
esSaturation vapour pressure of the air (kPa)
eaActual vapour pressure of the air (kPa)
raAerodynamic resistance to turbulent heat and vapour transfer (s·m−1)
rsSurface resistance (s·m−1)
γPsychrometric constant (kPa·°C−1)
λLatent heat of vaporization (J·kg−1)
ρwDensity of liquid water (kg·m−3)
θSoil moisture content (−)
TsoilSoil temperature (°C)
TaAmbient air temperature (°C)
PPrecipitation (mmd−1)
RHRelative humidity (-)
zmHeight of wind measurements (m)
zhHeight of humidity measurements (m)
dZero plane displacement height (m)
zomRoughness length governing momentum transfer (m)
zohRoughness length governing transfer of heat and vapour (m)
kVon Karman’s constant (0.41 (-))
uzWind speed at height zm (ms−1)
VVegetation height (m)
βBowen ratio (-)
RCRoot Constant in simple bucket model (mm)
PWPPermanent Wilting Point in simple bucket model (mm)
DDrainage in simple bucket model (mm/day)

Appendix A. Linear Regressions between Rn and G, and between Rs and Rn

Figure A1. Linear regression between on-site measured net radiation Rn and soil heat flux G.
Water 10 01253 g0a1
Figure A2. Linear regression between on-site measured incoming solar radiation Rs and net radiation Rn.
Water 10 01253 g0a2

Appendix B. List of Sown Plant Species

Table A1. Plant species sown on the roof.
Species NameSpecies Name (Continued)
Achillea millefoliumKoeleria glauca
Allium schoenoprasumLinaria vulgaris
Anthoxanthum odoratumLinum usitatissimum
Armeria maritimaLotus corniculatus subsp. corniculatus
Bromus tectorumMelica ciliata
Campanula rotundifoliaOriganum vulgare
Dianthus armeriaPhleum boehmeri
Dianthus carthusianorumPlantago media
Dianthus deltoidesPotentilla argentea
Dianthus superbusPrunella grandiflora
Erigeron acerPrunella vulgaris
Erodium cicutariumRumex acetosella
Festuca ovina subsp. cinereaSatureja vulgaris
Festuca ovina subsp. ovinaSedum acre
Festuca rubra subsp. arenariaSedum album
Galium verumSedum rupestre
Geranium robertianumSedum spurium
Helichrysum arenariumSilene vulgaris
Hieracium pilosellaThymus pulegioides
Jasione montanaTrifolium arvense

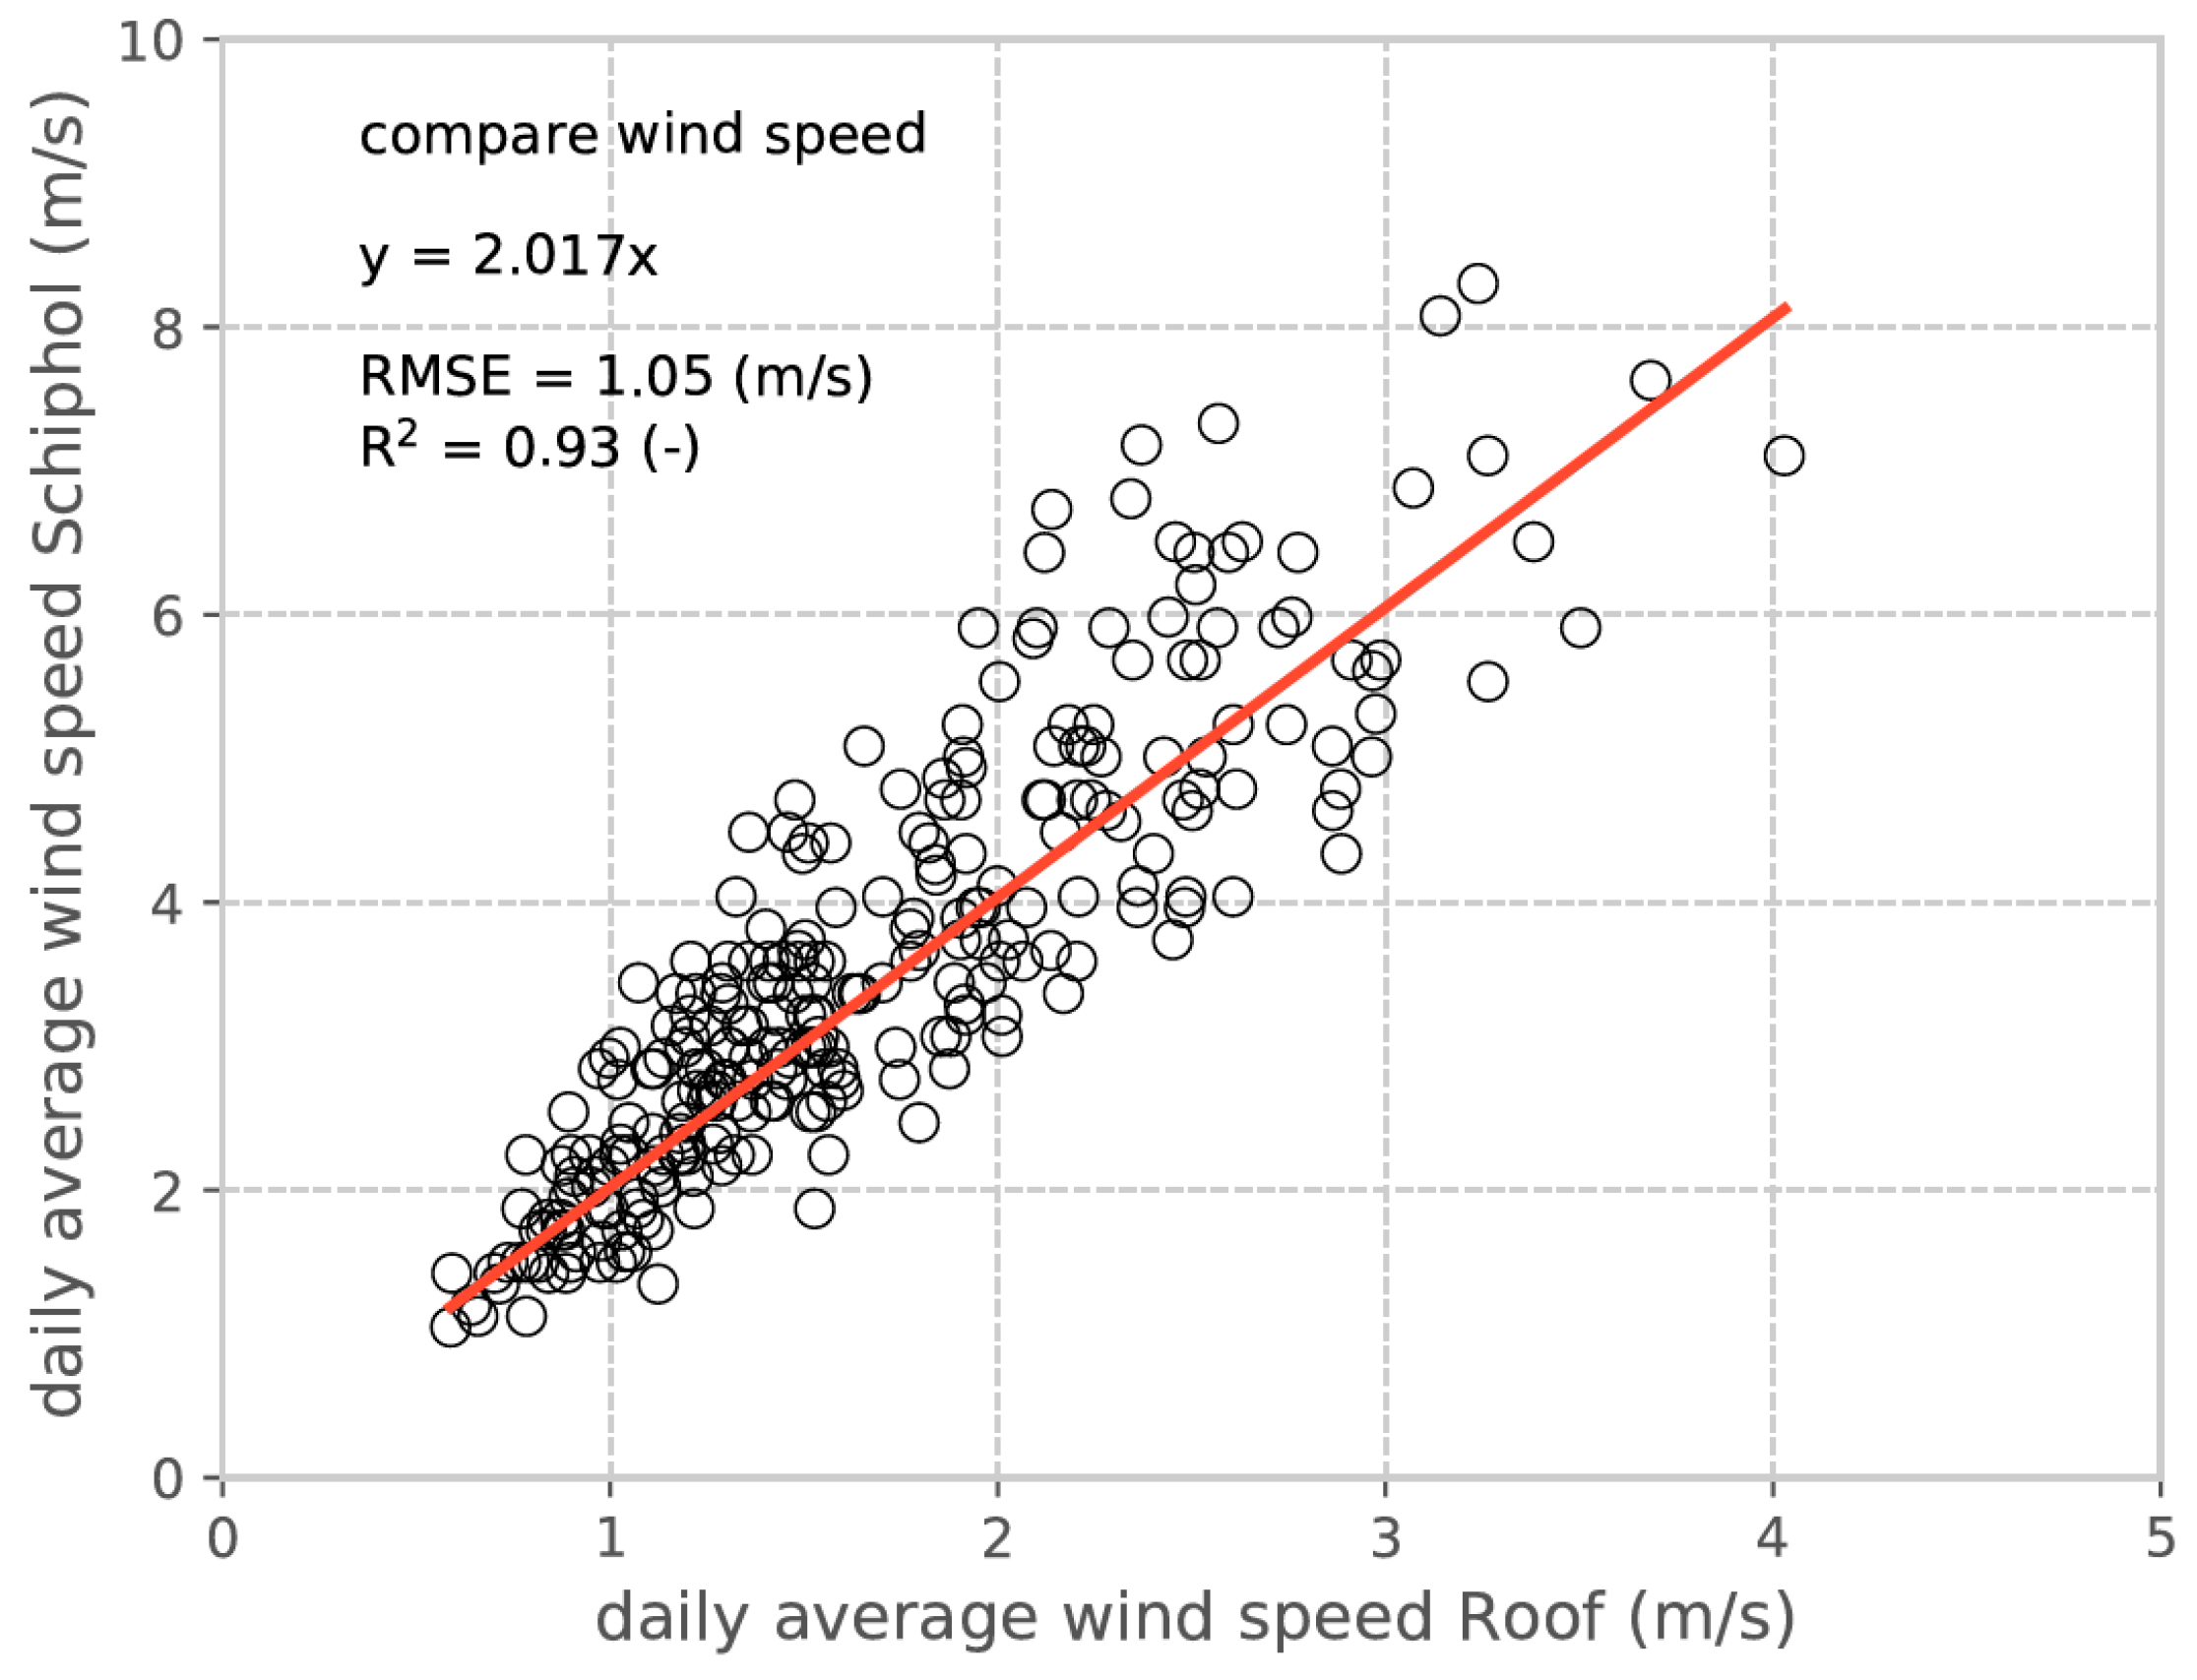
Appendix C. Wind Speed Correction

To keep the 30 year model simulations comparable to the measurement period, we corrected the wind speed of location Schiphol to represent the conditions of the experimental roof. First, the wind speed of both sites was corrected to a 2 m height with a wind profile relationship proposed by [38]:
u 2 = u z 4.87 ln ( 67.8 z 5.42 )  
where u2 is the wind speed at 2 m height, uz is the measured wind speed, and z is the height of the windspeed measurement (z = 10 for Schiphol, z = 1.5 for the green roof). Second, the wind speed correction factor for keeping the 30 year model simulations comparable to the measurement period was derived by linear regression (Figure A3). The wind speed at Schiphol was a factor that was 2.017 larger than on the green roof.
Figure A3. Comparison between the daily averaged wind speed at the research site (roof) and the daily averaged wind speed at Schiphol after correction for the measurement height.
Water 10 01253 g0a3

References

  1. Kleerekoper, L.; Van Esch, M.; Salcedo, T.B. How to make a city climate-proof, addressing the urban heat island effect. Resour. Conserv. Recycl. 2012, 64, 30–38. [Google Scholar] [CrossRef]
  2. Santamouris, M. Cooling the cities—A review of reflective and green roof mitigation technologies to fight heat island and improve comfort in urban environments. Sol. Energy 2014, 103, 682–703. [Google Scholar] [CrossRef]
  3. Scholz, M. Case study: Design, operation, maintenance and water quality management of sustainable storm water ponds for roof runoff. Bioresour. Technol. 2004, 95, 269–279. [Google Scholar] [CrossRef] [PubMed]
  4. Wong, K.V.; Paddon, A.; Jimenez, A. Review of world urban heat islands: Many linked to increased mortality. J. Energy Resour. Technol. 2013, 135, 022101. [Google Scholar] [CrossRef]
  5. Tan, J.; Zheng, Y.; Tang, X.; Guo, C.; Li, L.; Song, G.; Zhen, X.; Yuan, D.; Kalkstein, A.J.; Li, F. The urban heat island and its impact on heat waves and human health in shanghai. Int. J. Biometeorol. 2010, 54, 75–84. [Google Scholar] [CrossRef] [PubMed]
  6. Konopacki, S.; Akbari, H. Energy Savings for Heat-Island Reduction Strategies in Chicago and Houston (Including Updates for Baton Rouge, Sacramento, and Salt Lake City). Available online: http://repositories.cdlib.org/lbnl/LBNL-49638 (accessed on 14 September 2018).
  7. Rosenfeld, A.H.; Akbari, H.; Romm, J.J.; Pomerantz, M. Cool communities: Strategies for heat island mitigation and smog reduction. Energy Build. 1998, 28, 51–62. [Google Scholar] [CrossRef]
  8. Tosca, M.G.; Campbell, J.; Garay, M.; Lolli, S.; Seidel, F.; Marquis, J.; Kalashnikova, O. Attributing accelerated summertime warming in the southeast united states to recent reductions in aerosol burden: Indications from vertically-resolved observations. Remote Sens. 2017, 9. [Google Scholar] [CrossRef]
  9. Lenderink, G.; Van Meijgaard, E. Increase in hourly precipitation extremes beyond expectations from temperature changes. Nat. Geosci. 2008, 1, 511–514. [Google Scholar] [CrossRef]
  10. Klein Tank, A.M.G.; Lenderink, G. Klimaatverandering in Nederland; Aanvullingen op de knmi’06 Scenario’s; KNMI: De Bilt, The Netherlands, 2009. [Google Scholar]
  11. Attema, J.; Bakker, A.; Beersma, J.; Bessembinder, J.; Boers, R.; Brandsma, T.; van den Brink, H.; Drijfhout, S.; Eskes, H.; Haarsma, R. Knmi’14: Climate change scenarios for the 21st century—A netherlands perspective; KNMI: De Bilt, The Netherlands, 2014. [Google Scholar]
  12. Foster, J.; Lowe, A.; Winkelman, S. The Value of Green Infrastructure for Urban Climate Adaptation; Center Clean Air Policy: Washington, DC, USA, 2011; pp. 1–52. [Google Scholar]
  13. Gill, S.E.; Handley, J.F.; Ennos, A.R.; Pauleit, S. Adapting cities for climate change: The role of the green infrastructure. Built Environ. 2007, 33, 115–133. [Google Scholar] [CrossRef]
  14. Costanzo, V.; Evola, G.; Marletta, L. Energy savings in buildings or uhi mitigation? Comparison between green roofs and cool roofs. Energy Build. 2016, 114, 247–255. [Google Scholar] [CrossRef]
  15. Ran, J.; Tang, M. Passive cooling of the green roofs combined with night-time ventilation and walls insulation in hot and humid regions. Sustain. Cities Soc. 2018, 38, 466–475. [Google Scholar] [CrossRef]
  16. Karteris, M.; Theodoridou, I.; Mallinis, G.; Tsiros, E.; Karteris, A. Towards a green sustainable strategy for mediterranean cities: Assessing the benefits of large-scale green roofs implementation in thessaloniki, northern greece, using environmental modelling, gis and very high spatial resolution remote sensing data. Renew. Sustain. Energy Rev. 2016, 58, 510–525. [Google Scholar] [CrossRef]
  17. Gregoire, B.G.; Clausen, J.C. Effect of a modular extensive green roof on stormwater runoff and water quality. Ecol. Eng. 2011, 37, 963–969. [Google Scholar] [CrossRef]
  18. Coutts, A.M.; Daly, E.; Beringer, J.; Tapper, N.J. Assessing practical measures to reduce urban heat: Green and cool roofs. Build. Environ. 2013, 70, 266–276. [Google Scholar] [CrossRef]
  19. Li, D.; Bou-Zeid, E.; Oppenheimer, M. The effectiveness of cool and green roofs as urban heat island mitigation strategies. Environ. Res. Lett. 2014, 9, 055002. [Google Scholar] [CrossRef] [Green Version]
  20. Solcerova, A.; van de Ven, F.; Wang, M.; Rijsdijk, M.; van de Giesen, N. Do green roofs cool the air? Build. Environ. 2017, 111, 249–255. [Google Scholar] [CrossRef]
  21. Jim, C.Y.; Peng, L.L.H. Weather effect on thermal and energy performance of an extensive tropical green roof. Urban For. Urban Green. 2012, 11, 73–85. [Google Scholar] [CrossRef]
  22. Bartholomeus, R.; Stagge, J.; Tallaksen, L.; Witte, J. How over 100 years of climate variability may affect estimates of potential evaporation. HESSD 2014, 11, 10787–10828. [Google Scholar] [CrossRef]
  23. Voyde, E.; Fassman, E.; Simcock, R.; Wells, J. Quantifying evapotranspiration rates for New Zealand green roofs. J. Hydrol. Eng. 2010, 15, 395–403. [Google Scholar] [CrossRef]
  24. Tabares-Velasco, P.C.; Srebric, J. The role of plants in the reduction of heat flux through green roofs: Laboratory experiments. Ashrae Trans. 2009, 115, 793–802. [Google Scholar]
  25. DiGiovanni, K.; Montalto, F.; Gaffin, S.; Rosenzweig, C. Applicability of classical predictive equations for the estimation of evapotranspiration from urban green spaces: Green roof results. J. Hydrol. Eng. 2012, 18, 99–107. [Google Scholar] [CrossRef]
  26. Sims, A.W.; Robinson, C.E.; Smart, C.C.; Voogt, J.A.; Hay, G.J.; Lundholm, J.T.; Powers, B.; O’Carroll, D.M. Retention performance of green roofs in three different climate regions. J. Hydrol. 2016, 542, 115–124. [Google Scholar] [CrossRef]
  27. Marasco, D.E.; Hunter, B.N.; Culligan, P.J.; Gaffin, S.R.; McGillis, W.R. Quantifying evapotranspiration from urban green roofs: A comparison of chamber measurements with commonly used predictive methods. Environ. Sci. Technol. 2014, 48, 10273–10281. [Google Scholar] [CrossRef] [PubMed]
  28. Johannessen, B.G.; Hanslin, H.M.; Muthanna, T.M. Green roof performance potential in cold and wet regions. Ecol. Eng. 2017, 106, 436–447. [Google Scholar] [CrossRef]
  29. Makkink, G.F. Testing the penman formula by means of lysimeters. J. Inst. Water Eng. 1957, 11, 277–288. [Google Scholar]
  30. Voeten, J.G.; van de Werken, L.; Newman, A.P. Demonstrating the use of below-substrate water storage as a means of maintaining green roofs-performance data and a novel approach to achieving public understanding. In World Environmental and Water Resources Congress; ASCE Library: West Palm Beach, FL, USA, 2016; pp. 12–21. [Google Scholar]
  31. Optigrün. Properties of the m-l Substrate; Optigrün International: Krauchenwies-Göggingen, Germany, 2013. [Google Scholar]
  32. Voortman, B.; Bartholomeus, R.; Van Der Zee, S.; Bierkens, M.; Witte, J. Quantifying energy and water fluxes in dry dune ecosystems of the netherlands. HESS 2015, 19, 3787–3805. [Google Scholar]
  33. Jarraud, M. Guide to Meteorological Instruments and Methods of Observation (wmo-no. 8); World Meteorological Organisation: Geneva, Switzerland, 2008. [Google Scholar]
  34. Peters, A.; Nehls, T.; Schonsky, H.; Wessolek, G. Separating precipitatin and evapotranspiration from noise—A new filter routine for high-resolution lysimeter data. HESS 2014, 18, 1189–1198. [Google Scholar]
  35. Irmak, S.; Mutiibwa, D.; Payero, J.O. Net radiation dynamics: Performance of 20 daily net radiation models as related to model structure and intricacy in two climates. Trans. ASABE 2010, 53, 1059–1076. [Google Scholar] [CrossRef]
  36. Sabziparvar, A.; Mirgaloybayat, R.; Marofi, S.; Zare-Abyaneh, H.; Khodamorad Pour, M. Evaluation of some net radiation models for improving daily reference evapotranspiration estimation in iran. J. Irrig. Drain. Eng. 2016, 142, 04016051. [Google Scholar] [CrossRef]
  37. Monteith, J.L.; Unsworth, M.H. Principles of Environmental Physics, 2nd ed.; Edward Arnold: London, UK, 1990; p. 291. [Google Scholar]
  38. Allen, R.G.; Pereira, L.S.; Raes, D.; Smith, M. Crop Evapotranspiration—Guidelines For Computing Crop Water Requirements; FAO—Food and Agriculture Organization of the United Nations: Rome, Italy, 1998; Volume 56. [Google Scholar]
  39. Ireson, A.; Butler, A. A critical assessment of simple recharge models: Application to the UK chalk. HESS 2013, 17, 2083–2096. [Google Scholar]
  40. Gravatt, D.A.; Martin, C.E. Comparative ecophysiology of five species of Sedum (crassulaceae) under well-watered and drought-stressed conditions. Oecologia 1992, 92, 532–541. [Google Scholar] [CrossRef] [PubMed]
  41. Kuronuma, T.; Watanabe, H. Photosynthetic and transpiration rates of three Sedum species used for green roofs. Environ. Control Biol. 2017, 55, 137–141. [Google Scholar] [CrossRef]
  42. Pilon-Smits, E.A.H.; Hart, H.T.; Meesterburrie, J.A.N.; Naber, P.; Kreuler, R.; Van Brederode, J. Variation in crassulacean acid metabolism within the genus sedum: Carbon isotope composition and water status dependent phosphoenolpyruvate carboxylase activity. J. Plant Physiol. 1991, 137, 342–346. [Google Scholar] [CrossRef]
  43. Castillo, F. Antioxidative protection in the inducible cam plant Sedum album l. Following the imposition of severe water stress and recovery. Oecologia 1996, 107, 469–477. [Google Scholar] [CrossRef] [PubMed]
  44. Sayed, O.; Earnshaw, M.; Cooper, M. Growth, water relations, and cam induction in Sedum Album in response to water stress. Biol. Plant. 1994, 36, 383. [Google Scholar] [CrossRef]
  45. Kluge, M. Is Sedum Acre L. A cam plant? Oecologia 1977, 29, 77–83. [Google Scholar] [CrossRef] [PubMed]
  46. Starry, O.; Lea-Cox, J.; Kim, J.; Van Iersel, M. Photosynthesis and water use by two Sedum species in green roof substrate. Environ. Exp. Bot. 2014, 107, 105–112. [Google Scholar] [CrossRef]
  47. Monterusso, M.A.; Rowe, D.B.; Rugh, C.L. Establishment and persistence of sedum spp. And native taxa for green roof applications. Hortscience 2005, 40, 391–396. [Google Scholar]
  48. Van der Linden, E.C.; Haarsma, R.J.; van der Schrier, G. Resolution-dependence of future european soil moisture droughts. Hydrol. Earth Syst. Sci. Discuss. 2018, 2018, 1–31. [Google Scholar] [CrossRef]
  49. Getter, K.L.; Rowe, D.B. Media depth influences Sedum green roof establishment. Urban Ecosyst. 2008, 11, 361. [Google Scholar] [CrossRef]
  50. Sun, T.; Bou-Zeid, E.; Ni, G.-H. To irrigate or not to irrigate: Analysis of green roof performance via a vertically-resolved hygrothermal model. Build. Environ. 2014, 73, 127–137. [Google Scholar] [CrossRef]
  51. Zuurbier, K.G.; Raat, K.J.; Paalman, M.; Oosterhof, A.T.; Stuyfzand, P.J. How subsurface water technologies (swt) can provide robust, effective, and cost-efficient solutions for freshwater management in coastal zones. Water Resour. Manag. 2017, 31, 671–687. [Google Scholar] [CrossRef]
  52. Fowdar, H.S.; Hatt, B.E.; Breen, P.; Cook, P.L.; Deletic, A. Designing living walls for greywater treatment. Water Res. 2017, 110, 218–232. [Google Scholar] [CrossRef] [PubMed]
  53. Morakinyo, T.E.; Dahanayake, K.K.C.; Ng, E.; Chow, C.L. Temperature and cooling demand reduction by green-roof types in different climates and urban densities: A co-simulation parametric study. Energy Build. 2017, 145, 226–237. [Google Scholar] [CrossRef]
Figure 1. Top view of the three research plots (green squares) and locations of the different sensors. Distances are in mm. In brown is the inspection floor.
Water 10 01253 g001
Figure 2. Schematic cross-sections of the three research plots. The left and right plot are equipped with the Permavoid drainage and capillary irrigation system.
Water 10 01253 g002
Figure 3. Lysimeter design (left), and (right) a lysimeter embedded in the green roof surface shortly after planting the sedum blankets. The drawing of the lysimeter shows the two roof designs: storage and capillary irrigation (left of the diagonal dashed line) and a conventional build up (right of the diagonal dashed line).
Water 10 01253 g003
Figure 4. Structure of the simple bucket model (after [39]).
Water 10 01253 g004
Figure 5. Measured and modeled daily evaporation for the three lysimeters. With Ep calculated with on-site measured variables (black line), Ea measured with weighing lysimeters (red line) and Ea modeled with the simple bucket model (blue line).
Water 10 01253 g005
Figure 6. Measured against modeled daily actual evaporation. The dotted line represents the 1:1 line.
Water 10 01253 g006
Figure 7. Measured and modeled daily water availability during the measurement period. Water availability was measured by subtracting the dead weight of the lysimeters from the total weight of the lysimeters over time. The measured peak in available water on 10 December 2017 is related to a heavy snowfall event that resulted in a strong increase of the lysimeter weight.
Water 10 01253 g007
Figure 8. Simulated long-term yearly evaporation and water shortage (difference between Ep and Ea) of six different green roof setups.
Water 10 01253 g008
Figure 9. Long-term monthly mean evaporation and water shortage (difference between Ep and Ea) of six different green roof setups.
Water 10 01253 g009
Figure 10. Long-term energy performance of green roof systems expressed in an average number of days per month within a certain Bowen ratio range. The total height of the stacked column denotes the average number of days per month with β > 2.
Water 10 01253 g010
Figure 11. Estimated (with the bucket model) monthly averaged runoff for the six roof setups based on 30 years of Schiphol meteorological data. Black triangles denote the monthly averaged precipitation over the period 1988–2017.
Water 10 01253 g011
Table 1. Long-term annual mean cumulative evaporation.
Roof SystemVegetationWater Storage (mm)Ep (mm/year)Ea (mm/year)Water Shortage (mm)
ConventionalSedum-401290111
ConventionalGrass/herbs-587414173
Capillary irrigationSedum3040135051
Capillary irrigationSedum8040138615
Capillary irrigationGrass/herbs30587466121
Capillary irrigationGrass/herbs8058751572
Table 2. Long-term annual mean latent heat flux (LE) fractions of Rn and Bowen ratio’s for six system layouts.
Roof SystemVegetationWater Storage
(mm)
Fraction LE of Rn
(-)
Bowen Ratio β
(-)
ConventionalSedum-0.540.87
ConventionalGrass/herbs-0.650.55
Capillary irrigationSedum300.710.41
Capillary irrigationSedum800.760.31
Capillary irrigationGrass/herbs300.860.16
Capillary irrigationGrass/herbs800.950.05

