Detecting the Dominant Cause of Streamflow Decline in the Loess Plateau of China Based onthe Latest Budyko Equation


1
State Key Laboratory of Eco-hydraulics in Northwest Arid Region of China, Xi’an University of Technology, Xi’an 710048, China
2
State Key Laboratory of Simulation and Regulation of Water Cycle in River Basin, China Institute of Water Resources and Hydropower Research, Beijing 100038, China
3
Environmental Change Institute, University of Oxford, Oxford OX1 3QY, UK
*
Author to whom correspondence should be addressed.
Water 2018, 10(9), 1277; https://doi.org/10.3390/w10091277
Submission received: 19 July 2018
/
Revised: 10 September 2018
/
Accepted: 16 September 2018
/
Published: 18 September 2018
(This article belongs to the Section Hydrology)
Abstract
:Quantifying the relative contributions of climate variability and human activity to streamflow change is important for effective water resource use and management. Four sub-catchments of the Wei River Basin (WRB) in the Loess Plateau in China were selected as the study region, where the evolution of parameter from the latest Budyko equation (Wang-Tang equation) was explored using an 11-year moving window. The elasticity of streamflow was derived from the climatic aridity index, represented by the ratio of annual potential evaporation () to annual precipitation (), and catchment characteristics as represented by . The effects of climate change and human activities on streamflow change during 1971–2010 were quantified with climate elasticity and decomposition methods. The contributions of different types of human activities to streamflow were further empirically determined using the water and soil conservation method. Results indicate that (1) under the same climate condition ( and ), a higher value of caused an increase in evaporation rate () and a decrease in runoff. Changes in these hydrological variables led to a subsequent reduction in streamflow in the WRB; (2) The absolute value of the precipitation elasticity was larger than the potential evaporation elasticity, indicating that streamflow change was more sensitive to precipitation; (3) The results based on the two methods were consistent. Climate change and human activities contributed to the decrease in streamflow by 29% and 71%, respectively, suggesting that human activities have exerted more profound impacts on streamflow in the study region; (4) Contributions of different water and soil conservation measures to streamflow reduction were calculated and sorted in descending order: Irrigation, industrial and domestic consumption, terrace, afforestation, reservoirs, check-dams, then grass-planting.
1. Introduction
Climate change and human activities have been altering hydrological cycles over the past few decades [1,2,3]. As a critical component of the hydrological cycle, streamflow is experiencing a downward trend due to climate warming and increasing water consumption driven by rapid growth of population and economy in many regions. The decreasing trend is expected to continue [4,5,6,7,8]. Climate variability includes changes in precipitation, temperature, and other climatic variables, which together determine the streamflow [8,9]. Precipitation directly affects streamflow through precipitation patterns, intensity, and spatial distribution, whereas the effect of temperature is mainly manifested through altering the evapotranspiration and snowmelt [10]. According to the IPCC (Intergovernmental Panel on Climate Change) Fifth Assessment Report (AR5), the average global surface temperature had increased by 0.85 °C from 1880 to 2012 [11]. Therefore, global warming has intensified the change in atmospheric variables and enhanced the frequency and severity of extreme climate events (e.g., floods and droughts) [12,13,14]. Simultaneously, human activities are altering the spatiotemporal distribution of streamflow by changing the land cover (e.g., afforestation and grass-planting) [15,16], hydraulic structure construction, reservoir operation [17], and direct consumption of surface water and groundwater for industrialization, urbanization, and agriculture [18,19,20]. Human activities also indirectly alter streamflow by influencing climate system (e.g., increasing greenhouse gas emissions) [21,22]. As a consequence, separating the roles that natural climate change and human activities play in hydrological evolution is important for deeply comprehending the hydrological evolution mechanism. Simultaneously, the results are crucial to policy-makers for sustainable water resources management [23,24,25,26,27,28].
During the past decades, two main types of methodologies have been adopted to isolate the impacts of natural climate change and human activities on streamflow change: Hydrologic model simulation and statistical methods. Hydrological models, such as the conceptual rainfall-runoff model SIMHYD [29], the Variable Infiltration Capacity (VIC) model [30], the Soil Water Assessment Tool (SWAT) [31], the Generalized Additive Model (GAM) [32], the physically-based distributed Mike SHE model [33], and the Xinanjiang model [34], are powerful tools for exploring the relationships among climate variation, human activities, and streamflow change. However, hydrological model simulations require large amounts of high-quality observations as the input. Simultaneously, uncertainties arising from model structure, parameters, and calibration scheme further challenge accuracy of the modeling results. In contrast, statistically-based methods, such as the time trend method [35] and double mass curve method [36], are relatively simple and lack the representation of physical mechanisms.
The Budyko framework depicts the long-term relationships between mean annual evaporation, potential evaporation, and precipitation. The single-parameter Budyko equations, such as Fu [37], Choudhury-Yang [38,39], Zhang [40], and Wang-Tang [41], are able to capture the effects of catchment properties on water balance (e.g., vegetation differences, topography information, and soil properties). The Wang-Tang equation, proposed in 2014, is the latest equation, and a single parameter controlled by vegetation and rainfall frequency is included. Given a prescribed parameter value, Wang-Tang can be rewritten into the original Budyko framework and the Fu, which are known as the most widely used Budyko type. Xing et al. [42] applied the Wang-Tang equation to 35 basins across China including the Yellow River Basin, and found performed well in simulating streamflow. Recently, climate elasticity and decomposition methods based on the Budyko hypothesis have been extensively used to quantify the climate- and human-induced streamflow changes. These two approaches are more reasonable and credible compared to other statistical methods due to the inclusion of basic physical processes [43,44]. Furthermore, the parameters can be obtained easily and the calculation process is relatively simple. Thus, the elasticity and decomposition method have been increasingly used for determining streamflow change.
The Loess Plateau, located in the middle reaches of the Yellow River, is well known for soil erosion and sediment discharge. Since the 1960s, many soil and water conservation measures have been implemented to address the soil erosion issues. Simultaneously, the Loess Plateau has experienced a sharp decrease in streamflow, making the region ecologically fragile. As a result, many studies have been carried out to identify the reasons behind the decline in streamflow mainly through “detecting the breakpoints, then separating the roles of climate variation and human activities in streamflow reduction”. Li et al. [45] used the SWAT model to separate the impacts caused by natural climate change and human activities on streamflow variation in the Loess Plateau, and the results indicated that streamflow decreased by 9.6%, 95.8% of which was caused by land use and climate changes. By using a statistical method in the Hekou-Longmen region of the Yellow River, Min et al. [46] found that precipitation and land use were responsible for 29% and 71% of runoff reduction, respectively. The Wei River Basin (WRB) in the Loess Plateau is an important food production base and an industrial and commercial base in Northwestern China. Water scarcity in the WRB has limited its socioeconomic development and has endangered the health of the natural ecosystem. In light of the importance of ensuring water security, further quantification of the relative contributions of climate change and human activities to the decreasing runoff is needed. Zhan et al. [47] employed an improved climate elasticity method to evaluate the contributions of natural climate change and human activities to streamflow decline in the WRB, and found that 71–78% of the streamflow reduction was attributable to human activities, whereas the remaining 22–29% was induced by climate variation. However, the statistical methods and the hydrological models applied to the Loess Plateau in previous studies did not represent physical processes or had limitations in model calibration/validation and parameter estimation due to the large amount of input required. Despite these limitations, the existing studies showed that human activities have played a crucial role in streamflow decrease. However, the relative contributions of different water and soil conservation measures (e.g., afforestation, grass-planting, level terrace, and check-dam) to streamflow decline have not been explored in depth.
In this study, the climatic elasticity and decomposition methods based on the Wang-Tang equation with time-varying parameters were chosen to quantify the impacts of climate change and human activities on streamflow change in the WRB in the Loess Plateau during 1960–2010. The purposes of this paper were to: (1) Identify the breakpoints of streamflow, with a focus on the possible causes behind the abrupt changes; (2) reveal the relationship between elasticity of streamflow, the climatic aridity index, and the 11-year moving window Budyko parameter; and (3) to investigate the fractional contributions of climate change and human activities to streamflow changes, and discuss the impacts of human activities in detail.
2. Study Area and Data
2.1. Overview of the Wei River Basin
The Wei River Basin (WRB), located between 103.5 and 110.5° E and 33.5 and 37.5° N was selected as the study area in this paper (Figure 1), and most parts of WRB belong to the Loess Plateau. As the largest tributary of the Yellow River in China, the WRB covers a total area of 13.5 × 10⁴ km2 [48,49]. The WRB is divided into 4 zones based on the main reach and the tributaries of the Wei River Basin: The upstream (UWR), the middle reaches and downstream (MDWR), the largest tributary (JRB), and the second tributary (BLRB) of WRB. The JRB and BLRB are two ecologically fragile regions of the Loess Plateau in China [50]. Located in the continental monsoon zone, the annual precipitation is approximately 559 mm, and about 60% of annual discharge occurs from June to September. The streamflow is approximately 10.4 billion m3, accounting for 17% of the total streamflow of the Yellow River. Topographically, the altitude decreases from the highest northwest mountainous areas to the lowest Guanzhong Plain in the southeast and south portion of the WRB.
2.2. Study Data
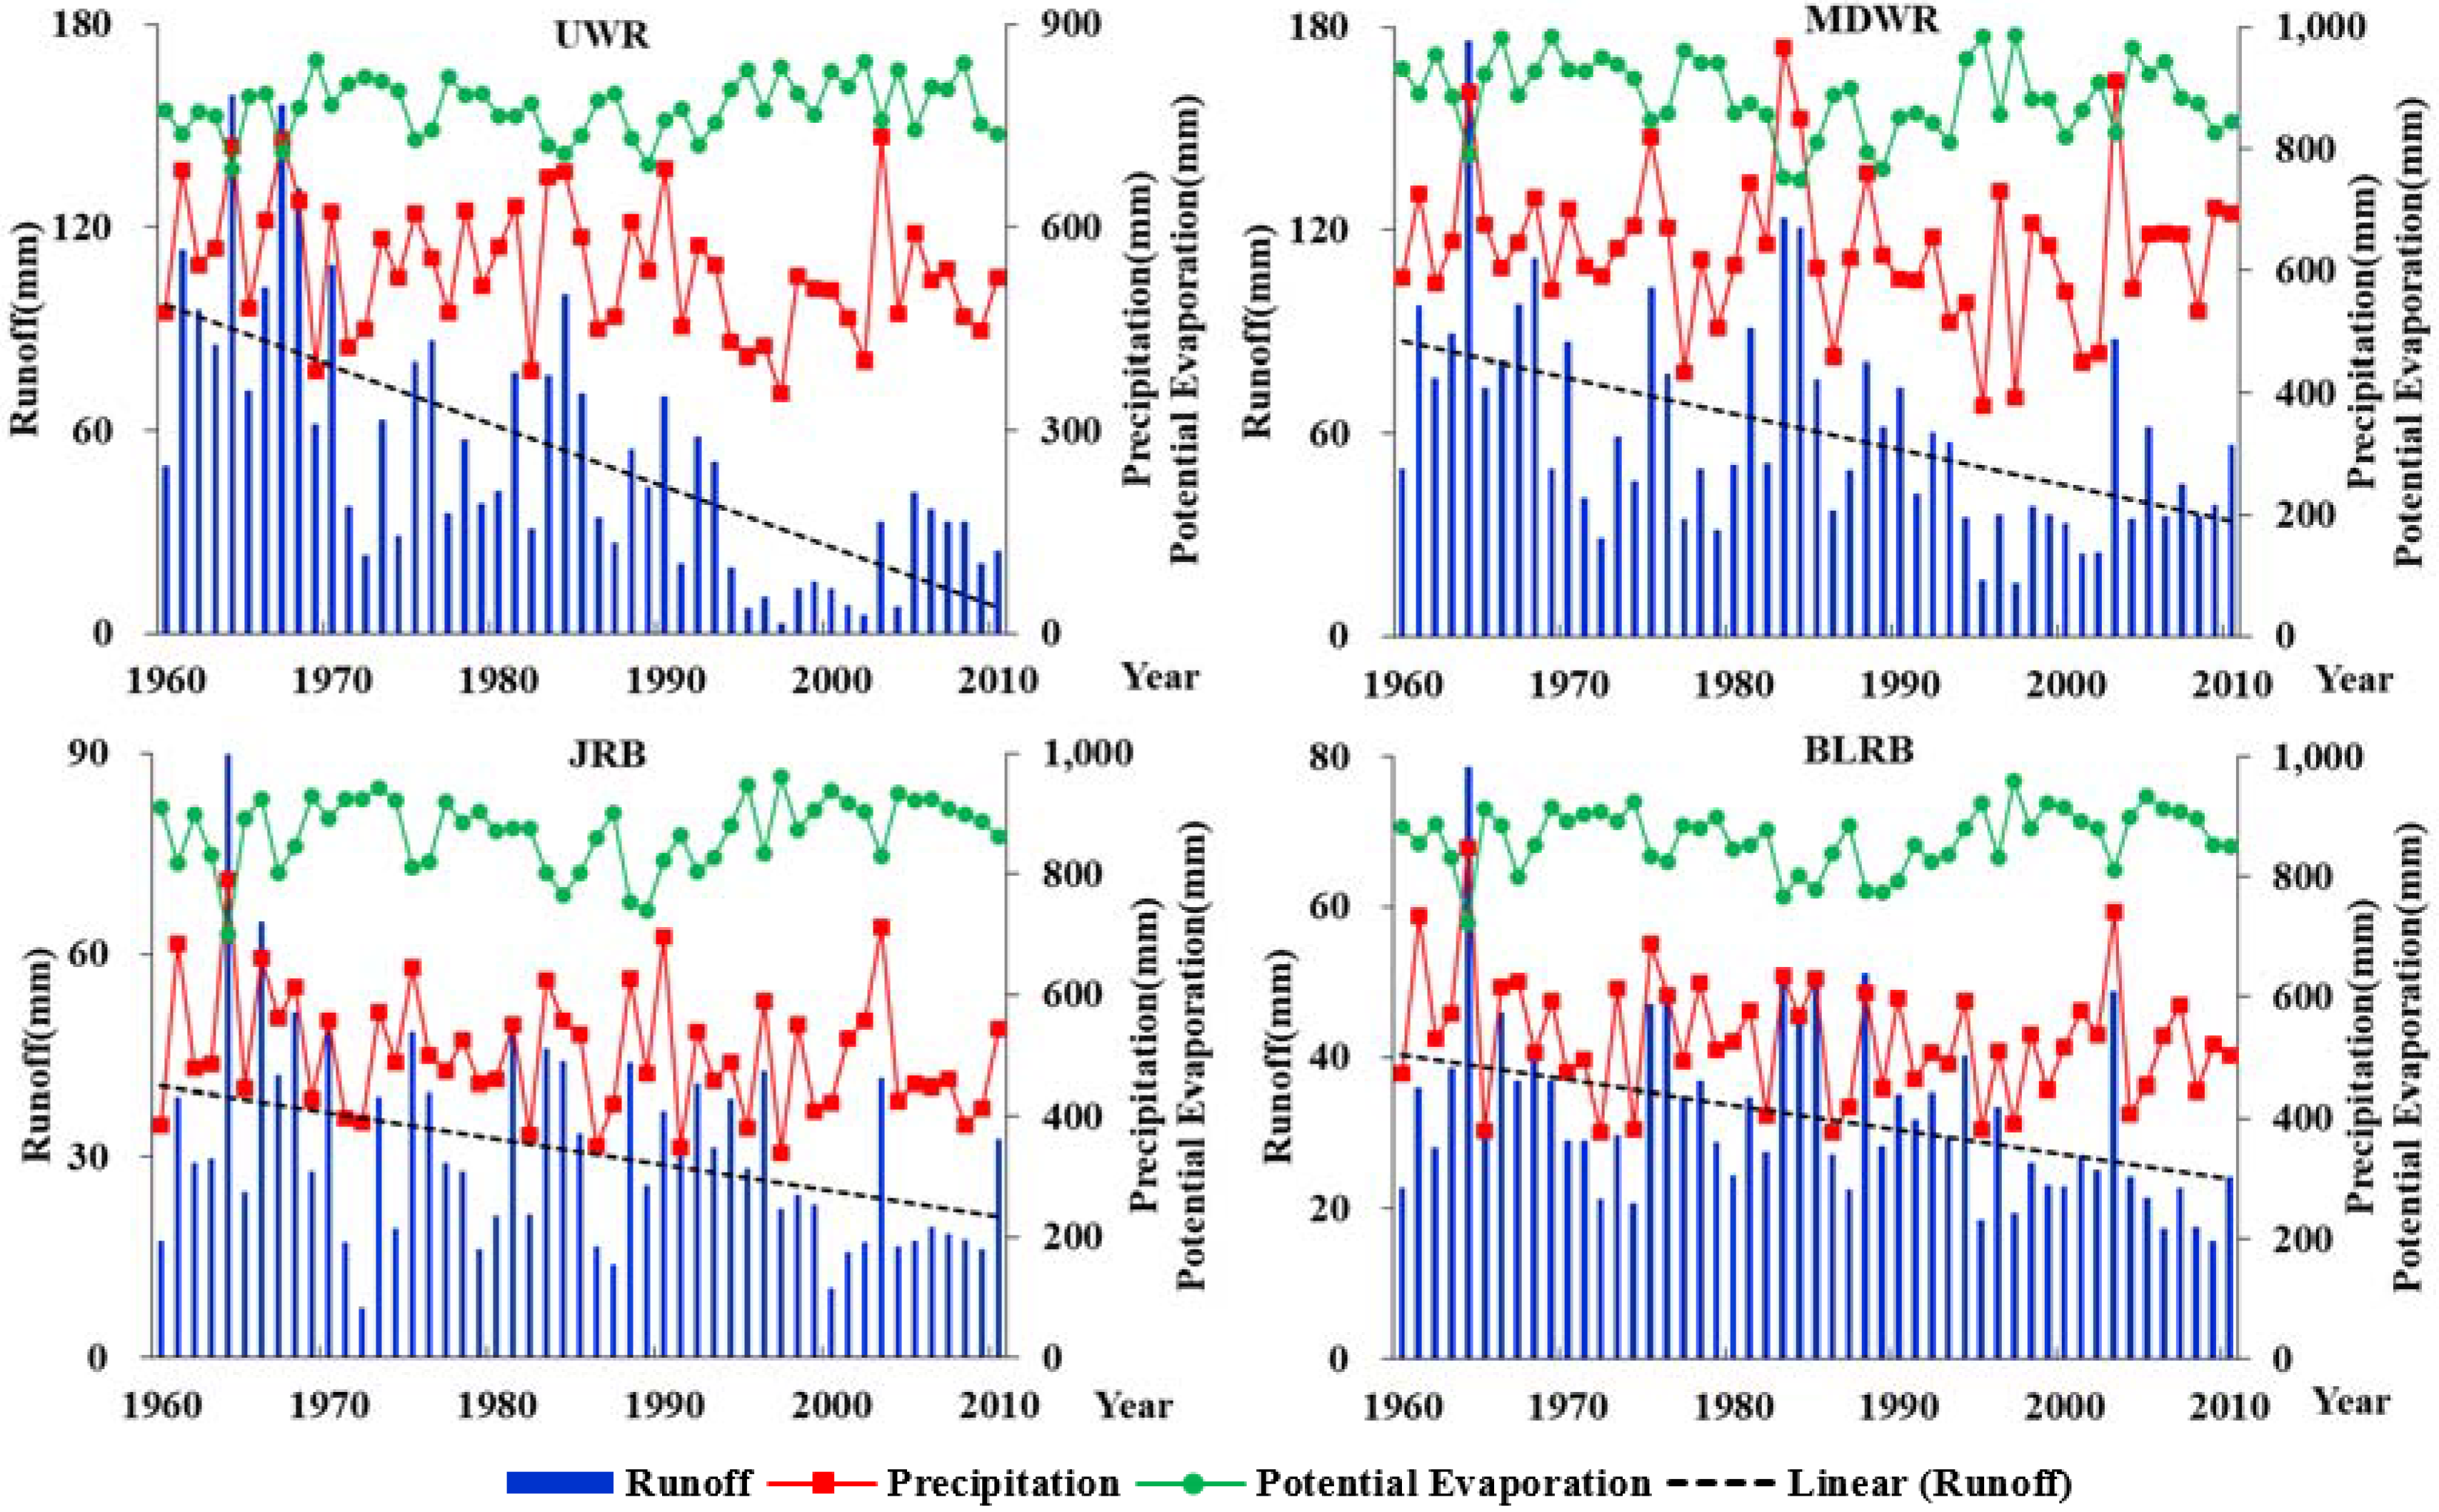
The hydrological data used in this paper included the daily observed streamflow from the four hydrological stations (Table 1). These data were acquired from the Bureau of Hydrology of the Yellow River Water Resources Commission covering the 1960–2010 period. The meteorological data (including the daily precipitation, temperature, sunshine duration, wind speed, relative humidity, and actual vapor pressure, among others) from the 21 National Meteorological Observatory (NMO) stations that cover the 1960–2010 period inside the catchment (Figure 1 and Table 2) were obtained from the National Climatic Centre of China (NCC). Potential evaporation data were estimated using the Penman-Menteith method, following the recommendation by the World’s Food and Agriculture Organization (FAO) in 1998 [51,52,53]. Missing values of precipitation accounted for less than 0.01% of the total data, and were filled using the linear interpolation method. Average areal precipitation and potential evaporation for each controlled basin were estimated using the Thiessen polygon method [54] based on data from the 21 meteorological stations. Additionally, all the meteorological data were aggregated to an annual scale (1960–2010) for analysis in this study. The long-term variations in precipitation (), runoff depth (), and annual potential evaporation () of the four zones from 1960 to 2010 are shown in Figure 2. Human activities included soil and water conservation measures (e.g., reforestation, grass-planting, terrace, and check-dams), reservoir construction, irrigation, industrialization, and urbanization. The area of soil and water conservation measures, water diversion of canal head and drainage water volume in the irrigation district, reservoirs inflow and outflow, and industrial and daily life water consumption data were collected from the Soil and Water Conservation of the Shaanxi Provincial Bureau and the Ministry of Water Resources.
3. Methodology
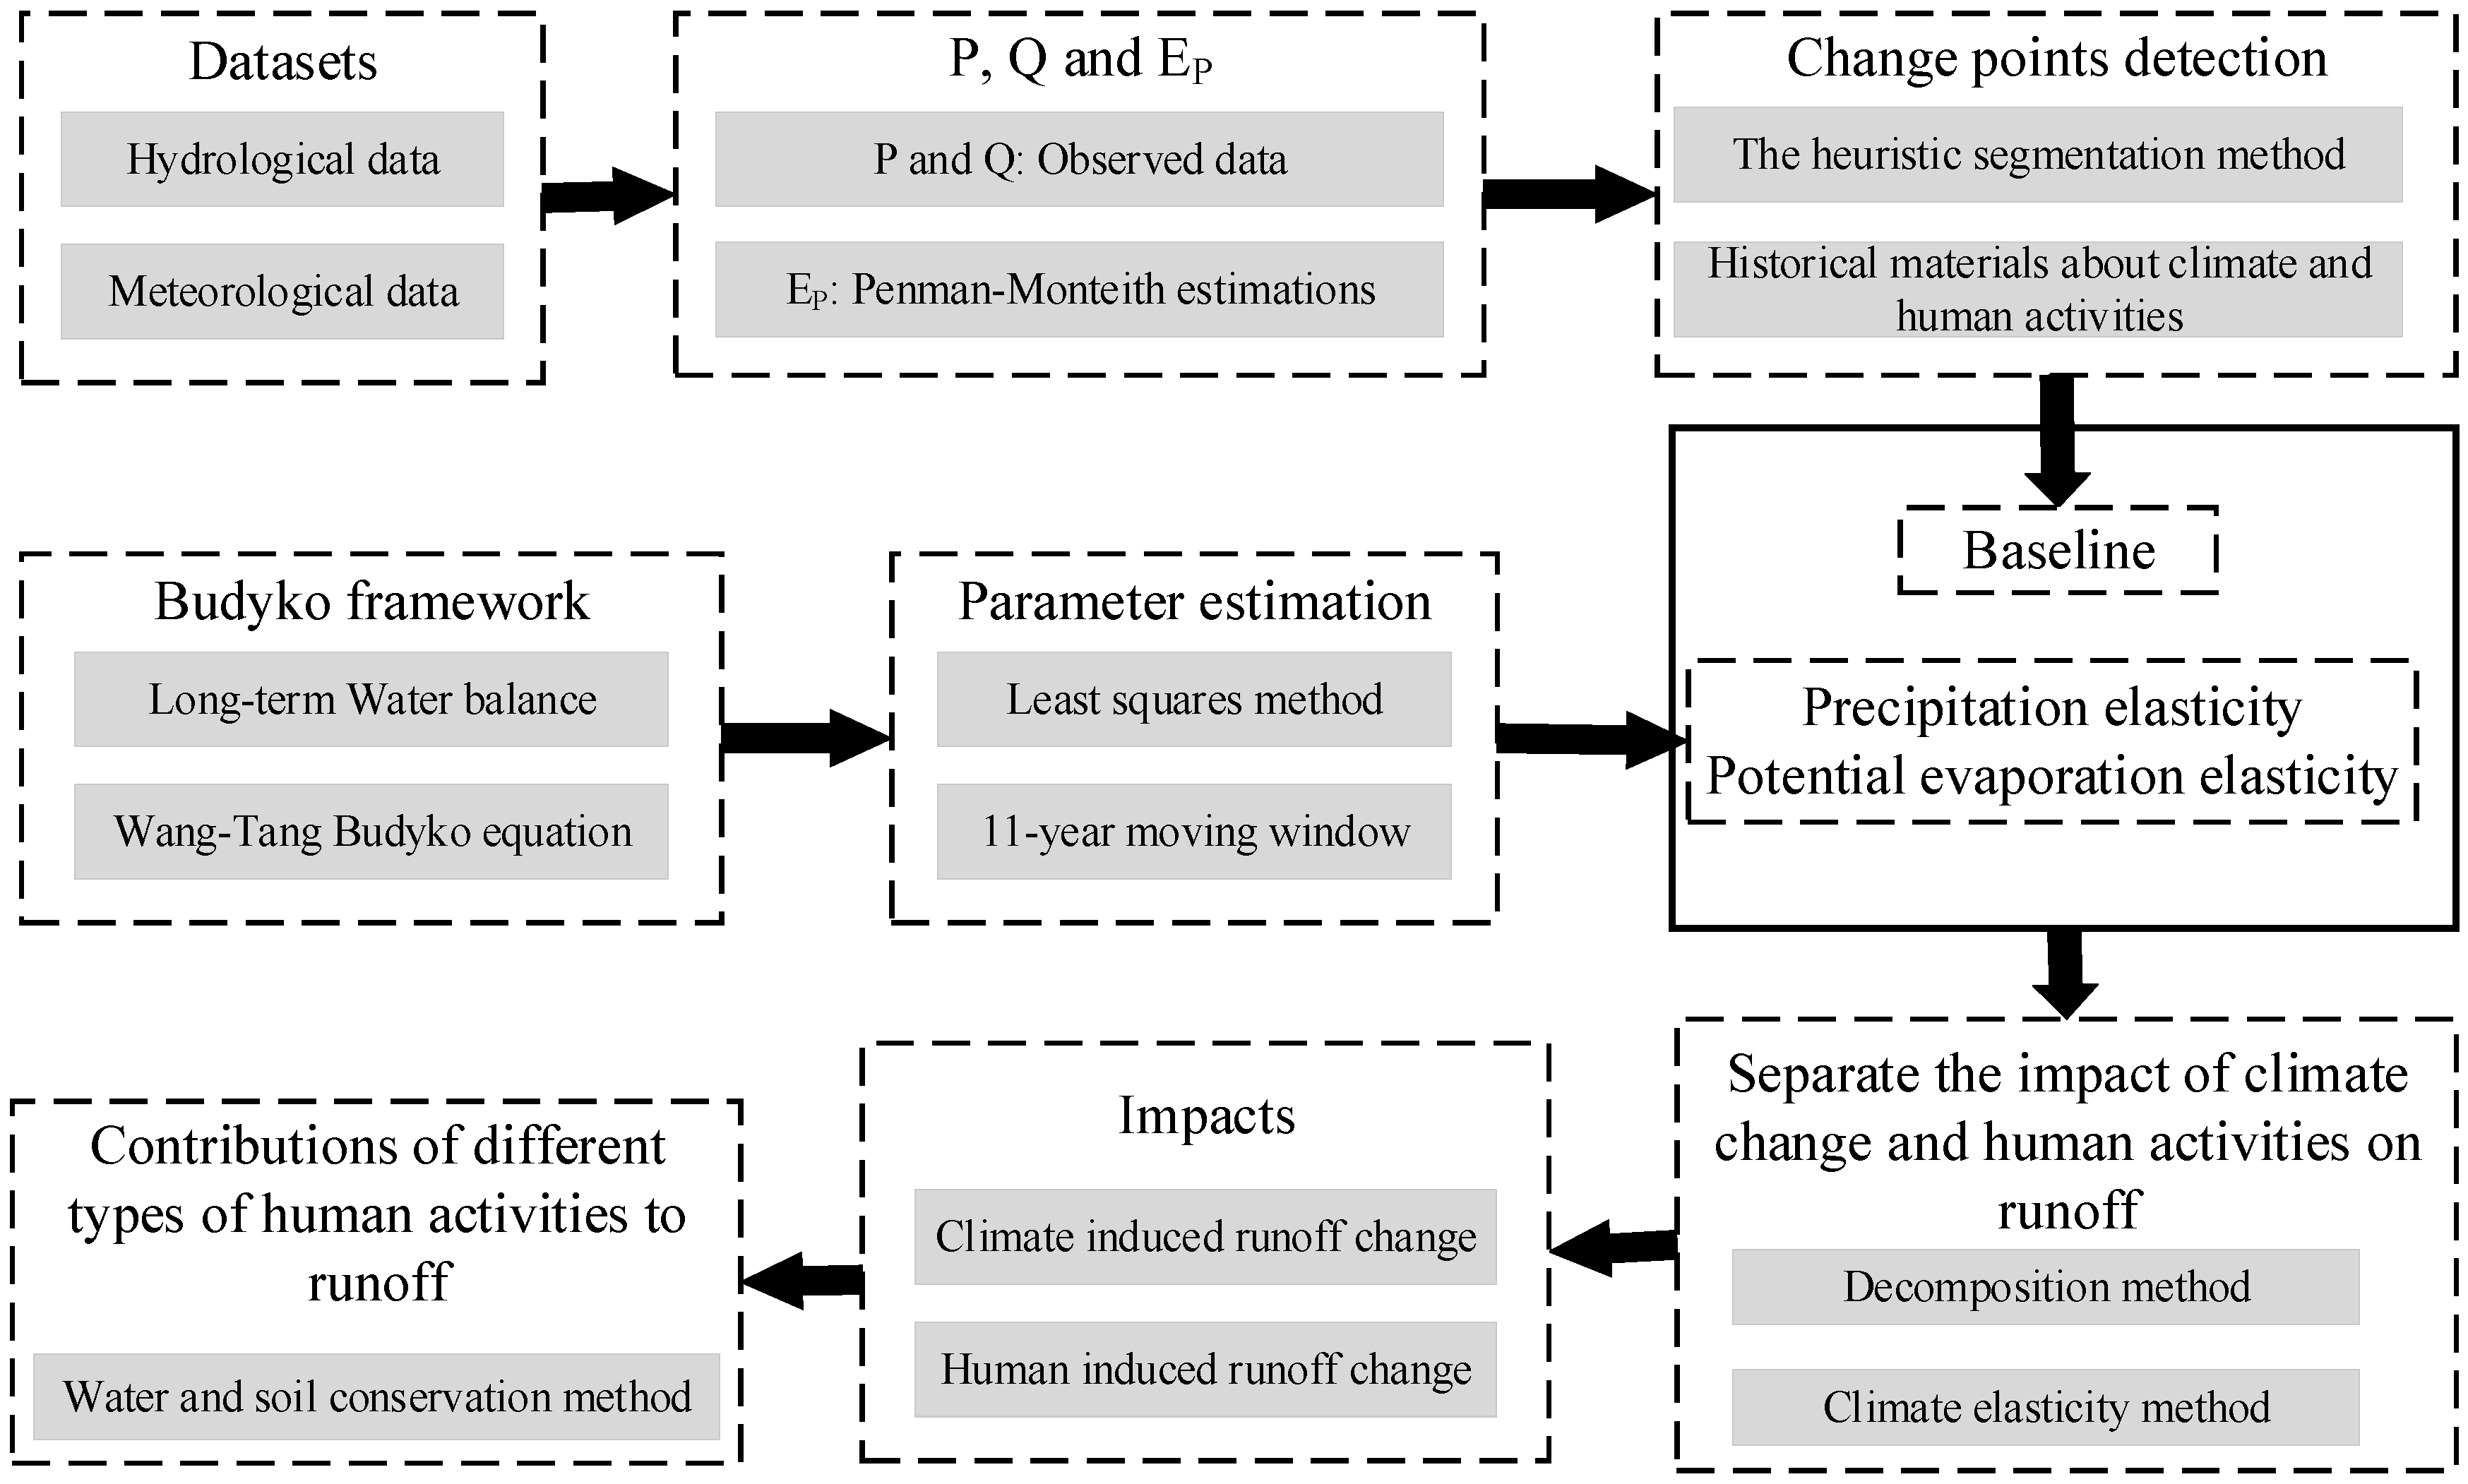
The overall methodology used in this study is presented in Figure 3. First, change point detection of the streamflow time series during 1960–2010 was carried out using the heuristic segmentation method. The period before the change point was less effected by the human activities, and was used as the baseline. We derived the time series of the parameter in the Budyko-type equation using a moving window of 11 years, and examined the relationship between the temporal variations in the parameter with climate factors. Based on the relationship, two simple conceptual methods based on the Budyko hypothesis (decomposition and climate elasticity method) were employed to quantify the impacts of climate change and human activities on streamflow changes. Additionally, the water and soil conservation method was used to separate the impacts of different water and soil measures on runoff decrease [55,56,57,58].
3.1. Breakpoints Analysis
The heuristic segmentation method was applied to detect the possible change points in this study. For a time series with observations , a sliding point moved step-by-step from left to right along the time series to divide the non-stationary time series into several stationary segments [59]. The averages and standard deviations of the left part of the point are represented by and , respectively, while the values of the right part are represented by and . The statistical significance of the difference between the two Gaussian-distributed random series and was tested by Student’s t-test statistic:
where
where and represent the length of the left and right series, respectively. By moving the point along the given time series step-by-step, statistic is calculated to estimate the difference between the averages of the right and left time series. A larger value means a more significant difference in the average values between the left and right time series. The largest value was taken as the candidate for the cut point. Then, the statistical significance corresponding to the largest was computed:
where , and and are derived from Monte Carlo simulations, denotes the length of the original time series, and is the incomplete beta function. If the difference of the averages is not statistically significant (e.g., is less than a threshold of 0.95), the time series will not be split. Otherwise, the time series will be partitioned into two segments. The iteration of the above procedure on each new segment will continue until the acquired significant value is less than the threshold or the length of the acquired segments is less than the prescribed minimum segment length l0 (normally set to 25).
3.2. Quantifying the Influences of Climate Change and Human Activities on Streamflow Change
3.2.1. Budyko Framework
The long-term water-balance for a given watershed can be expressed as:
where is actual evaporation (mm) and is the change in the basin water storage (mm). Budyko [60] proposed a semi-empirical equation for describing the coupled water-energy balance ( and were used to measure the available energy and water, respectively) and assumed that the ratio of mean annual evaporation to mean annual precipitation () is primarily controlled by the ratio of mean annual potential evaporation to mean annual precipitation () [61]:
where is the actual evaporation rate and is the climatic aridity index; In arid regions (), evaporation is limited by water supply, whereas in humid regions (), energy supply impedes evaporation. Therefore, the climatic aridity index can be used for reflecting the reciprocity between climate variability, hydrological process, and the ecosystem.
Wang and Tang [41] proposed a single-parameter Budyko equation:
where is controlled by vegetation and rainfall frequency, and can be interpreted as the ratio of initial evaporation ratio (, where is the initial evaporation, is the soil wetting) to the Horton index () [62,63,64]. can also be represented as from the evaporation perspective. Since is always greater than , ranges from 0 to 1. Setting to 0 and 1, the lower and upper bound of Wang-Tang equation can be obtained. Specifically, when = , Equation (6) is the same as Fu’s equation with ω = 2. The Wang-Tang equation satisfies the boundary conditions: When , when .
3.2.2. Decomposition Method
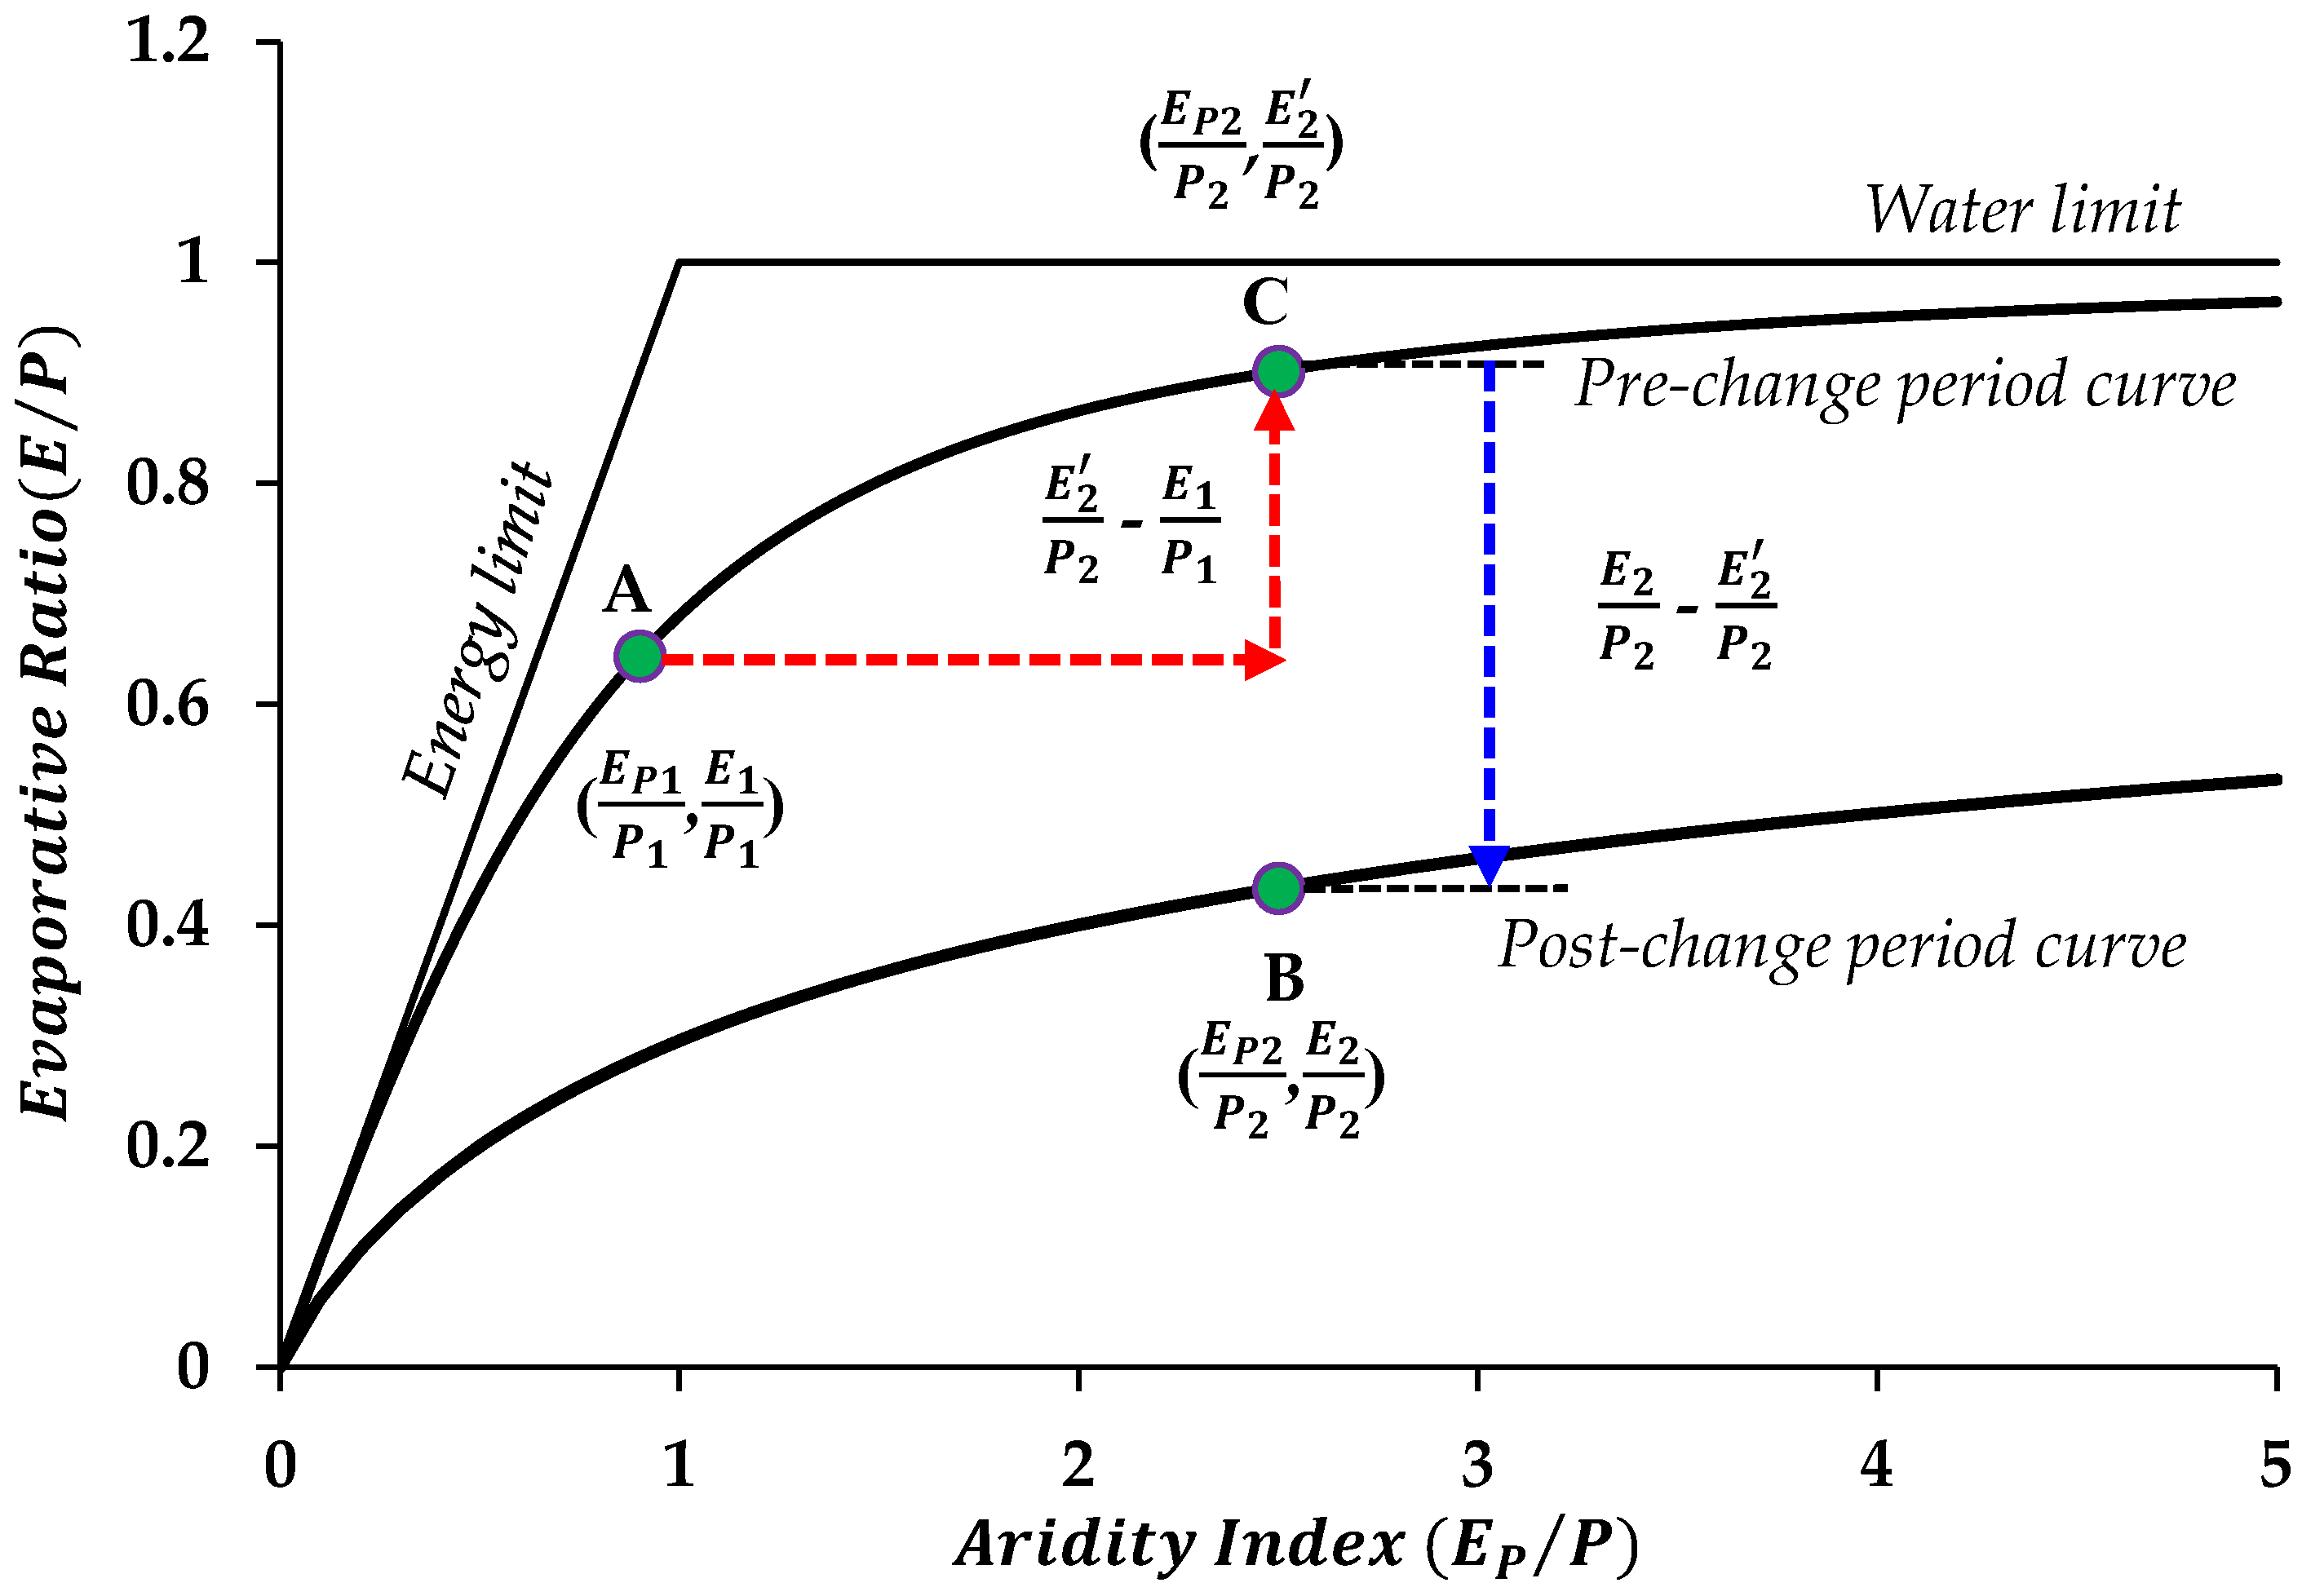
Climate change affects runoff by changing the mean annual precipitation () and potential evaporation (), whereas direct human activities influence runoff by altering the precipitation proportion between evaporation () and runoff (). Based on the original Budyko curve and the assumption following the geographic zonality concept, Wang and Hejazi [22] proposed a vertical decomposing method. The method assumes that if the climatic aridity index () of a catchment without direct human activities moves to a drier or wetter point due to climate change, the evaporation ratio () will also move to a new point, but will still follow the same Budyko curve as before. Thus, assuming natural climate change is the only influencing factor, point A (pre-change period) moves to point C (post-change period) along the Budyko curve. If both climate change and direct human activities exert influences in the watershed, point A will shift to point B (post-change period) (Figure 4). Thus, climate change causes both horizontal and vertical shifts, and direct human interferences only cause a vertical change. For a long-term period, streamflow is a function of the precipitation and evaporation ratio:
The magnitude of direct human-induced impacts on streamflow () is:
The contribution of climate change to streamflow () is:
where denotes the observed streamflow in the pre-change period, and plus equals the total change in mean annual streamflow () from period 1 to period 2. Both and can be positive or negative. Given the available , and data, climate-induced and direct human-induced impacts on streamflow change can be derived.
3.2.3. Climate Elasticity Method
Schaake and Waggoner [65] proposed the climate elasticity method to assess the impact of natural climate change on streamflow variations. and are two primary independent climatic variables that are relevant for streamflow. The changes in streamflow can be expressed as:
Based on the elasticity concept (), Equation (10) can be rewritten as:
where and are the precipitation and potential evaporation elasticity, respectively, which can be calculated based on Equation (6):
Consequently, climate-induced streamflow change can be computed as:
where denotes the total change in streamflow caused by the combined effects of natural climate change and human activities, and is the human-induced change. The percentage contributions of climate-induced () and human-activities-induced () streamflow changes can be computed as follows:
3.3. Impacts of Direct Human Activities on Streamflow
Runoff reduction caused by direct human activities (soil and water conservation measures) was computed using the water and soil conservation method [55,56,57,58]. Direct human activities include soil and water conservation measures (e.g., reforestation, grass-planting, terrace, and check-dams), reservoir construction, irrigation, industrialization, and urbanization. Based on field experiments and the influence of different measures on streamflow, the effect of each soil and water conservation measure on runoff was determined. Thus, the individual impacts of different measures on runoff variations were obtained. The runoff reduction caused by reservoirs was calculated as the difference between inflow and outflow of the reservoirs during a period, whereas the impact of irrigation on runoff was the difference between water diversion of canal head and drainage water volume. The industrial and domestic water use induced runoff was the product of the water consumption coefficient and the water consumption. Thus, the ratio of each component to the total was taken as the contribution of each water and soil measure on runoff reduction.
4. Results
4.1. Change Points Analysis
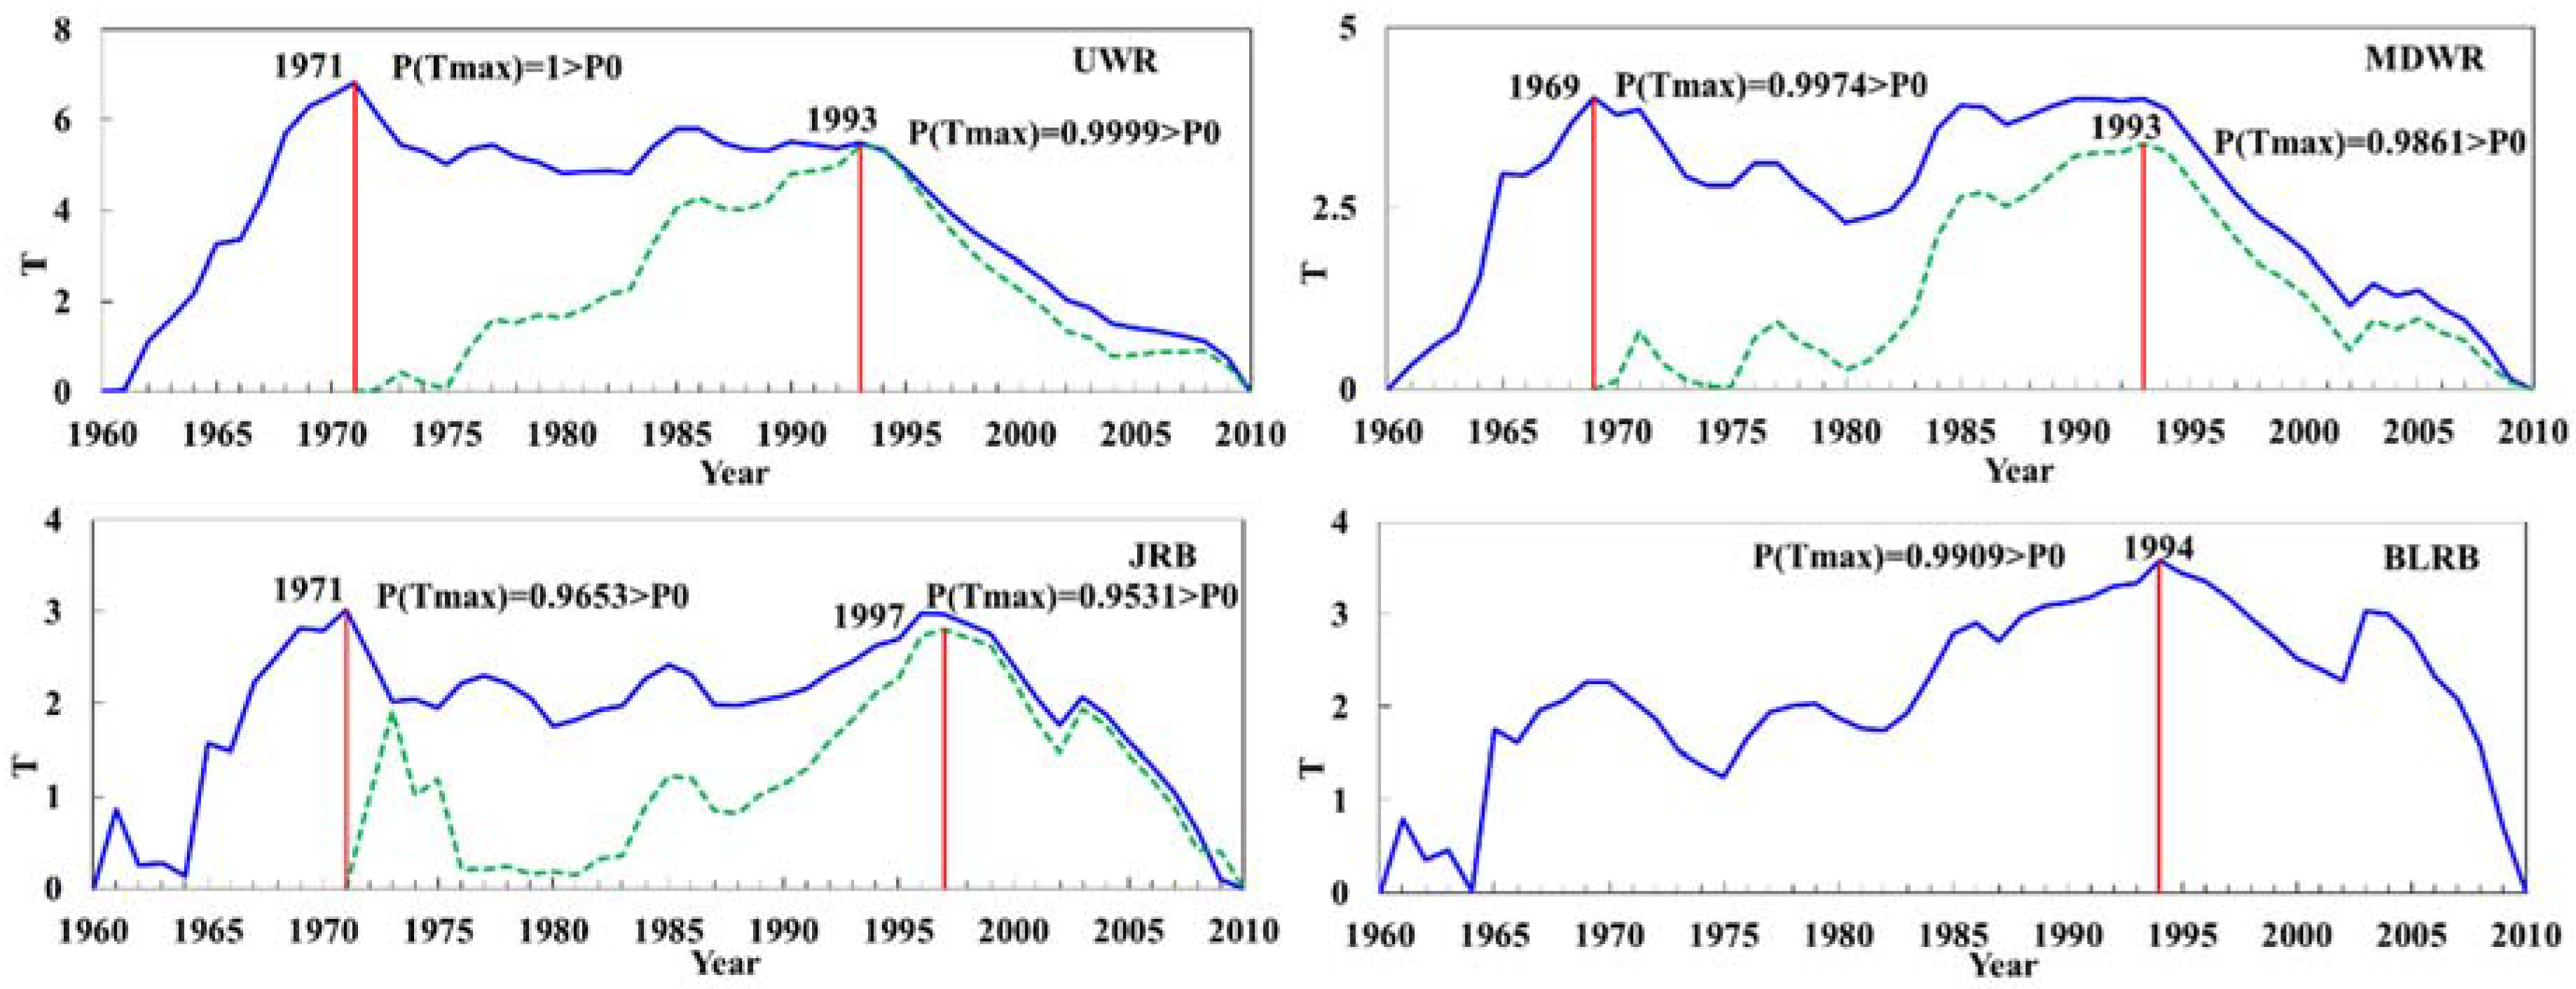
As shown in Figure 5, the blue solid line depicts the first iteration and segmentation process, while the green dotted line represents the second process. The results show that annual streamflow in UWR (1971 and 1993), MDWR (1969 and 1993) and JRB (1971 and 1997) are detected with two inflection points by the heuristic segmentation method. Only one change point (1994) is detected in BLRB. It can be seen that the breakpoints in the annual streamflow series in the WRB are mostly concentrated around 1970 and the early 1990s.
It should be noted here that the year 1972 corresponds to occurrence of an El Niño event, which caused substantial atmospheric circulation anomalies in China [66]. As a result, WRB, which is located in the continental monsoon climate zone of China, experienced a sharp drop in precipitation due to the weakness of the western Pacific subtropical high pressure system. Additionally, a series of water soil conservation measures have been implemented in the WRB to address soil erosion since 1970 [24,67]. Consistent with the above results, 1971 was detected as the change point in annual streamflow series in the WRB, and the study period for the four sub-catchments is divided into two periods correspondingly: The pre-change (1960–1970) and post-change (1971–2010) periods.
4.2. Climatic Aridity Index and Elasticity of Runoff
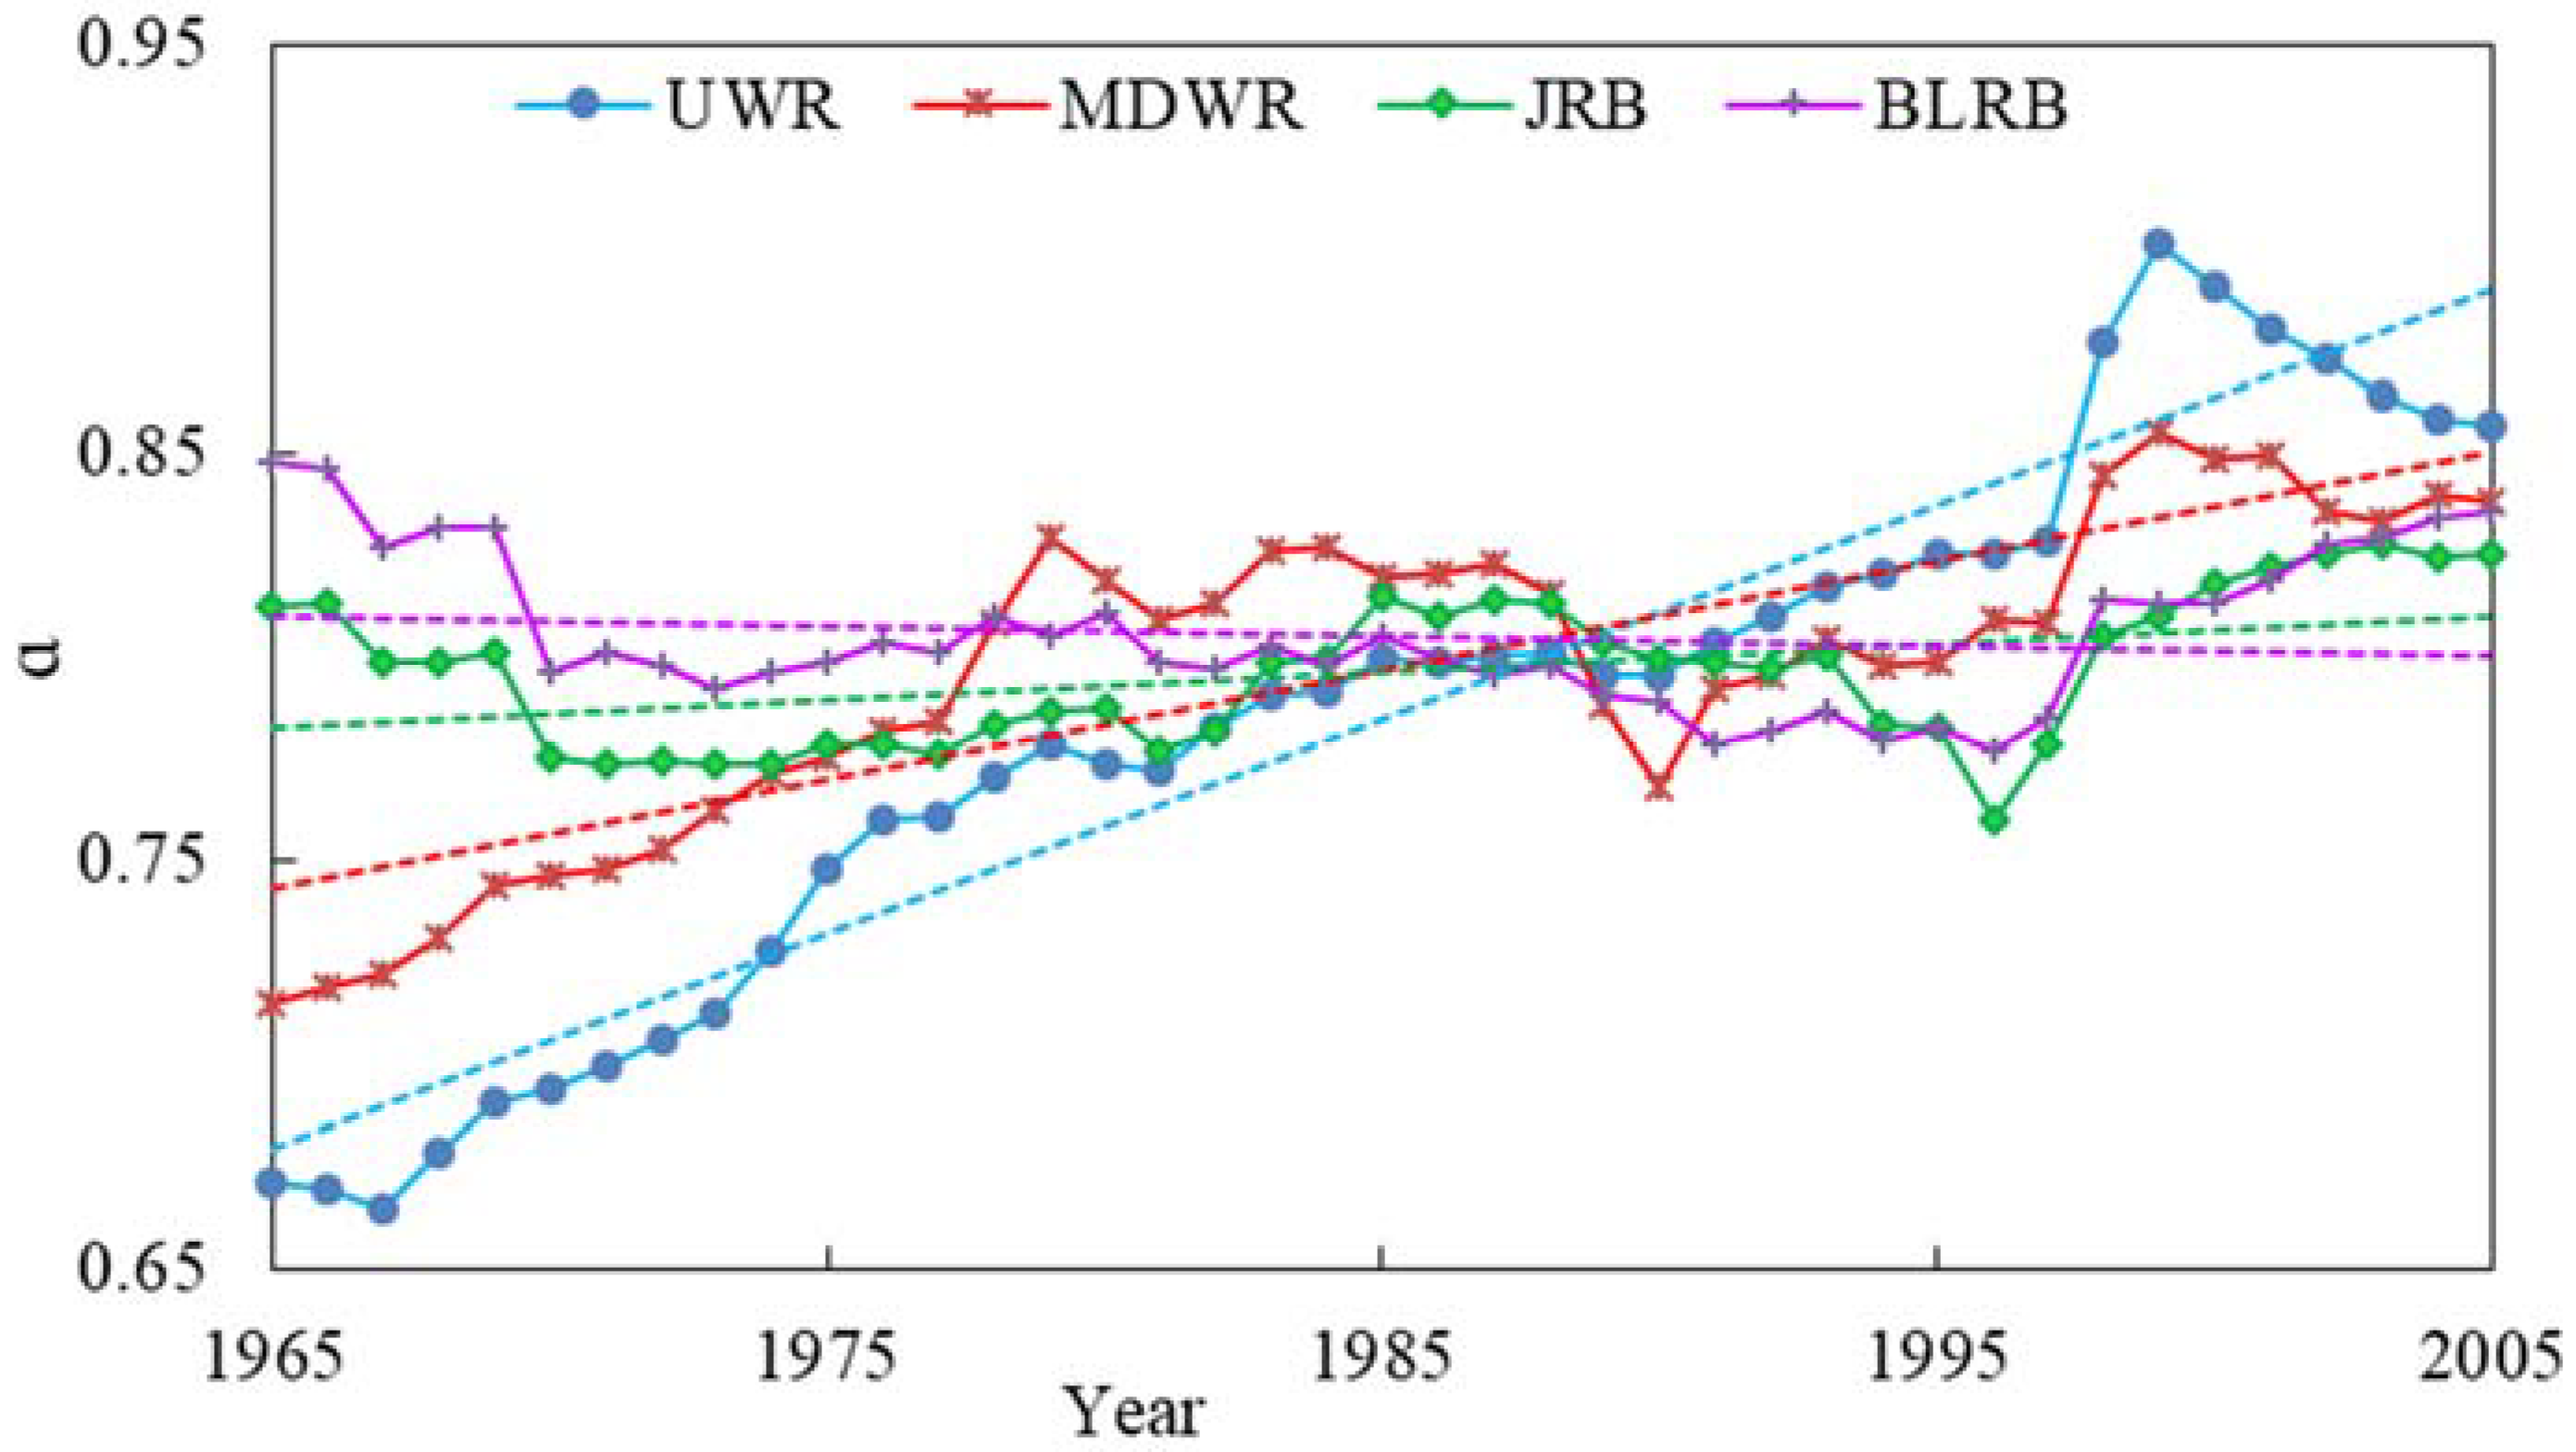
Based on the long-term mean annual , and , the parameter in the 4 sub-catchments are estimated from Equation (6) using the least squares method (Table 1). For better illustration, an 11-year moving window is used, and its temporal evolution and linear trend are displayed in Figure 6. An increase in is observed in the UWR, MDWR and JRB regions, while the BLRB shows a decreasing trend. In the four catchments, the long-term mean annual ranges from 0.77 to 0.81 with an average of 0.79.
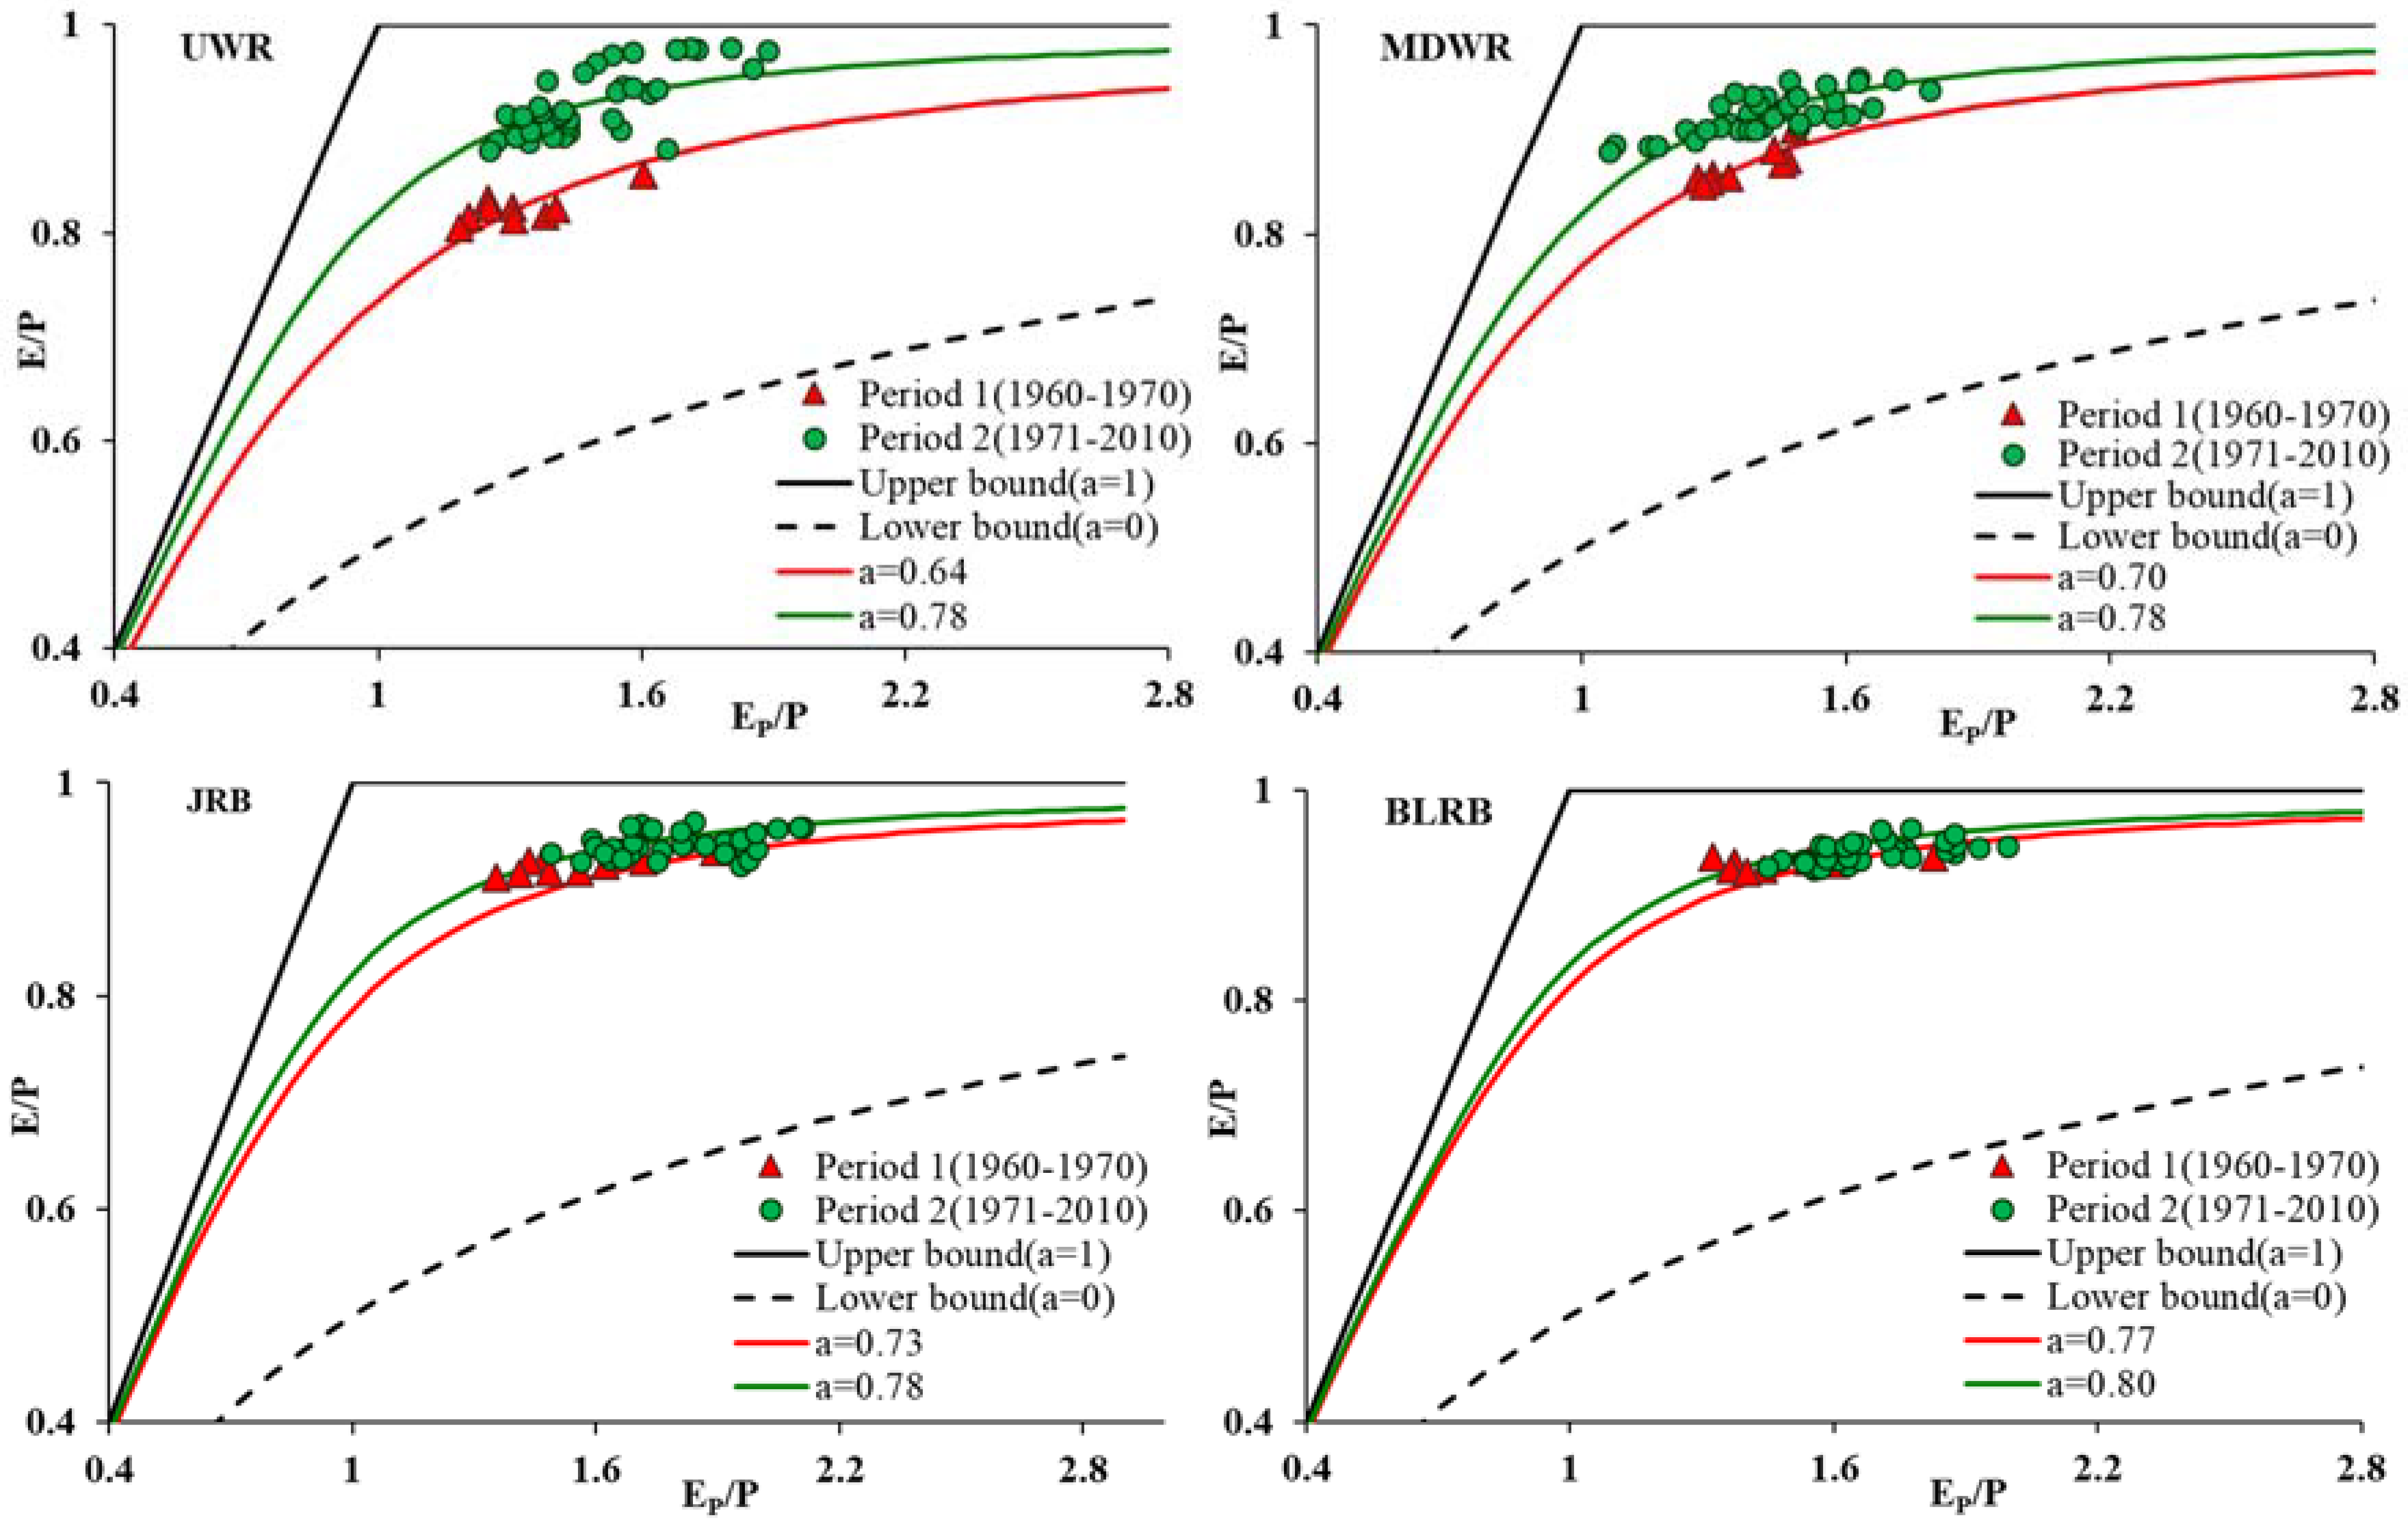
According to Figure 7, we found that all points () move right along their fitted Budyko curves from the pre-change period (1960–1970) to the post-change (1971–2010) in the four sub-catchments, indicating that climate conditions in the WRB shifts toward an increasing climate aridity (). Additionally, from the pre-change period to the post-change period, all points in the four catchments showed upward vertical movements away from the Budyko curve, suggesting that the WRB is becoming drier (increasing ) due to enhanced actual evaporation. Climate change affects runoff by changing the mean annual precipitation () and potential evaporation (), while direct human activities influence the runoff by altering the precipitation partition between evaporation () and runoff (). Over a long-term period, increasing would lead to a decrease in streamflow. Thus, climate-induced runoff change and direct human-induced runoff change are negative. That is, climate change and direct human activities have reduced runoff in the WRB. Moreover, we estimated the parameters in the Wang-Tang Budyko equation for the pre-change and post-change periods. The results apparently show that the values of Budyko parameter after breakpoints are higher than that before breakpoints, and the impacts of direct human activities on runoff are increasing in the four catchments. Under the same climate condition ( and ), a higher value of parameter results in higher evaporation rate (), leading to a lower due to the long-term water-balance equation. Thus, both water and energy balance considerations support the view that streamflow in the WRB is reduced in the post-change period.
According to Equations (12) and (13), the elasticity of streamflow to precipitation and potential evaporation are evaluated and shown in Table 1. The range of climatic aridity index is 1.46 (MDWR)–1.81 (JRB), with a mean value of 1.62 across all four sub-catchments. In addition, we find that the aridity index in the post-change period is larger than the pre-change period in all regions, which indicates that climatic conditions in WRB have become drier in the study period. In the four sub-catchments, the precipitation elasticity and potential evaporation elasticity range from 2.93 to 3.11 (3.02 on average) and −1.93 to −2.11 (−2.02 on average), respectively. This indicates that a 10% increase in would cause 29.3% to 31.1% increase in runoff, respectively, while a 10% increase in EP would decrease runoff by 19.3% to 21.1%, respectively. Obviously, the absolute value of is higher than for the four basins, indicating that streamflow are more sensitive to precipitation than potential evaporation. From Table 1, we find that and are distinctly different from one basin to another. High values of precipitation elasticity ( > 3.02) and potential evaporation elasticity ( < −2.02) are observed in the MDWR and BLRB, while UWR and JRB have relatively small values. This suggests that runoff changes are highly sensitive to climate conditions in MDWR and BLRB.
4.3. Quantitative Attribution of Streamflow Decrease
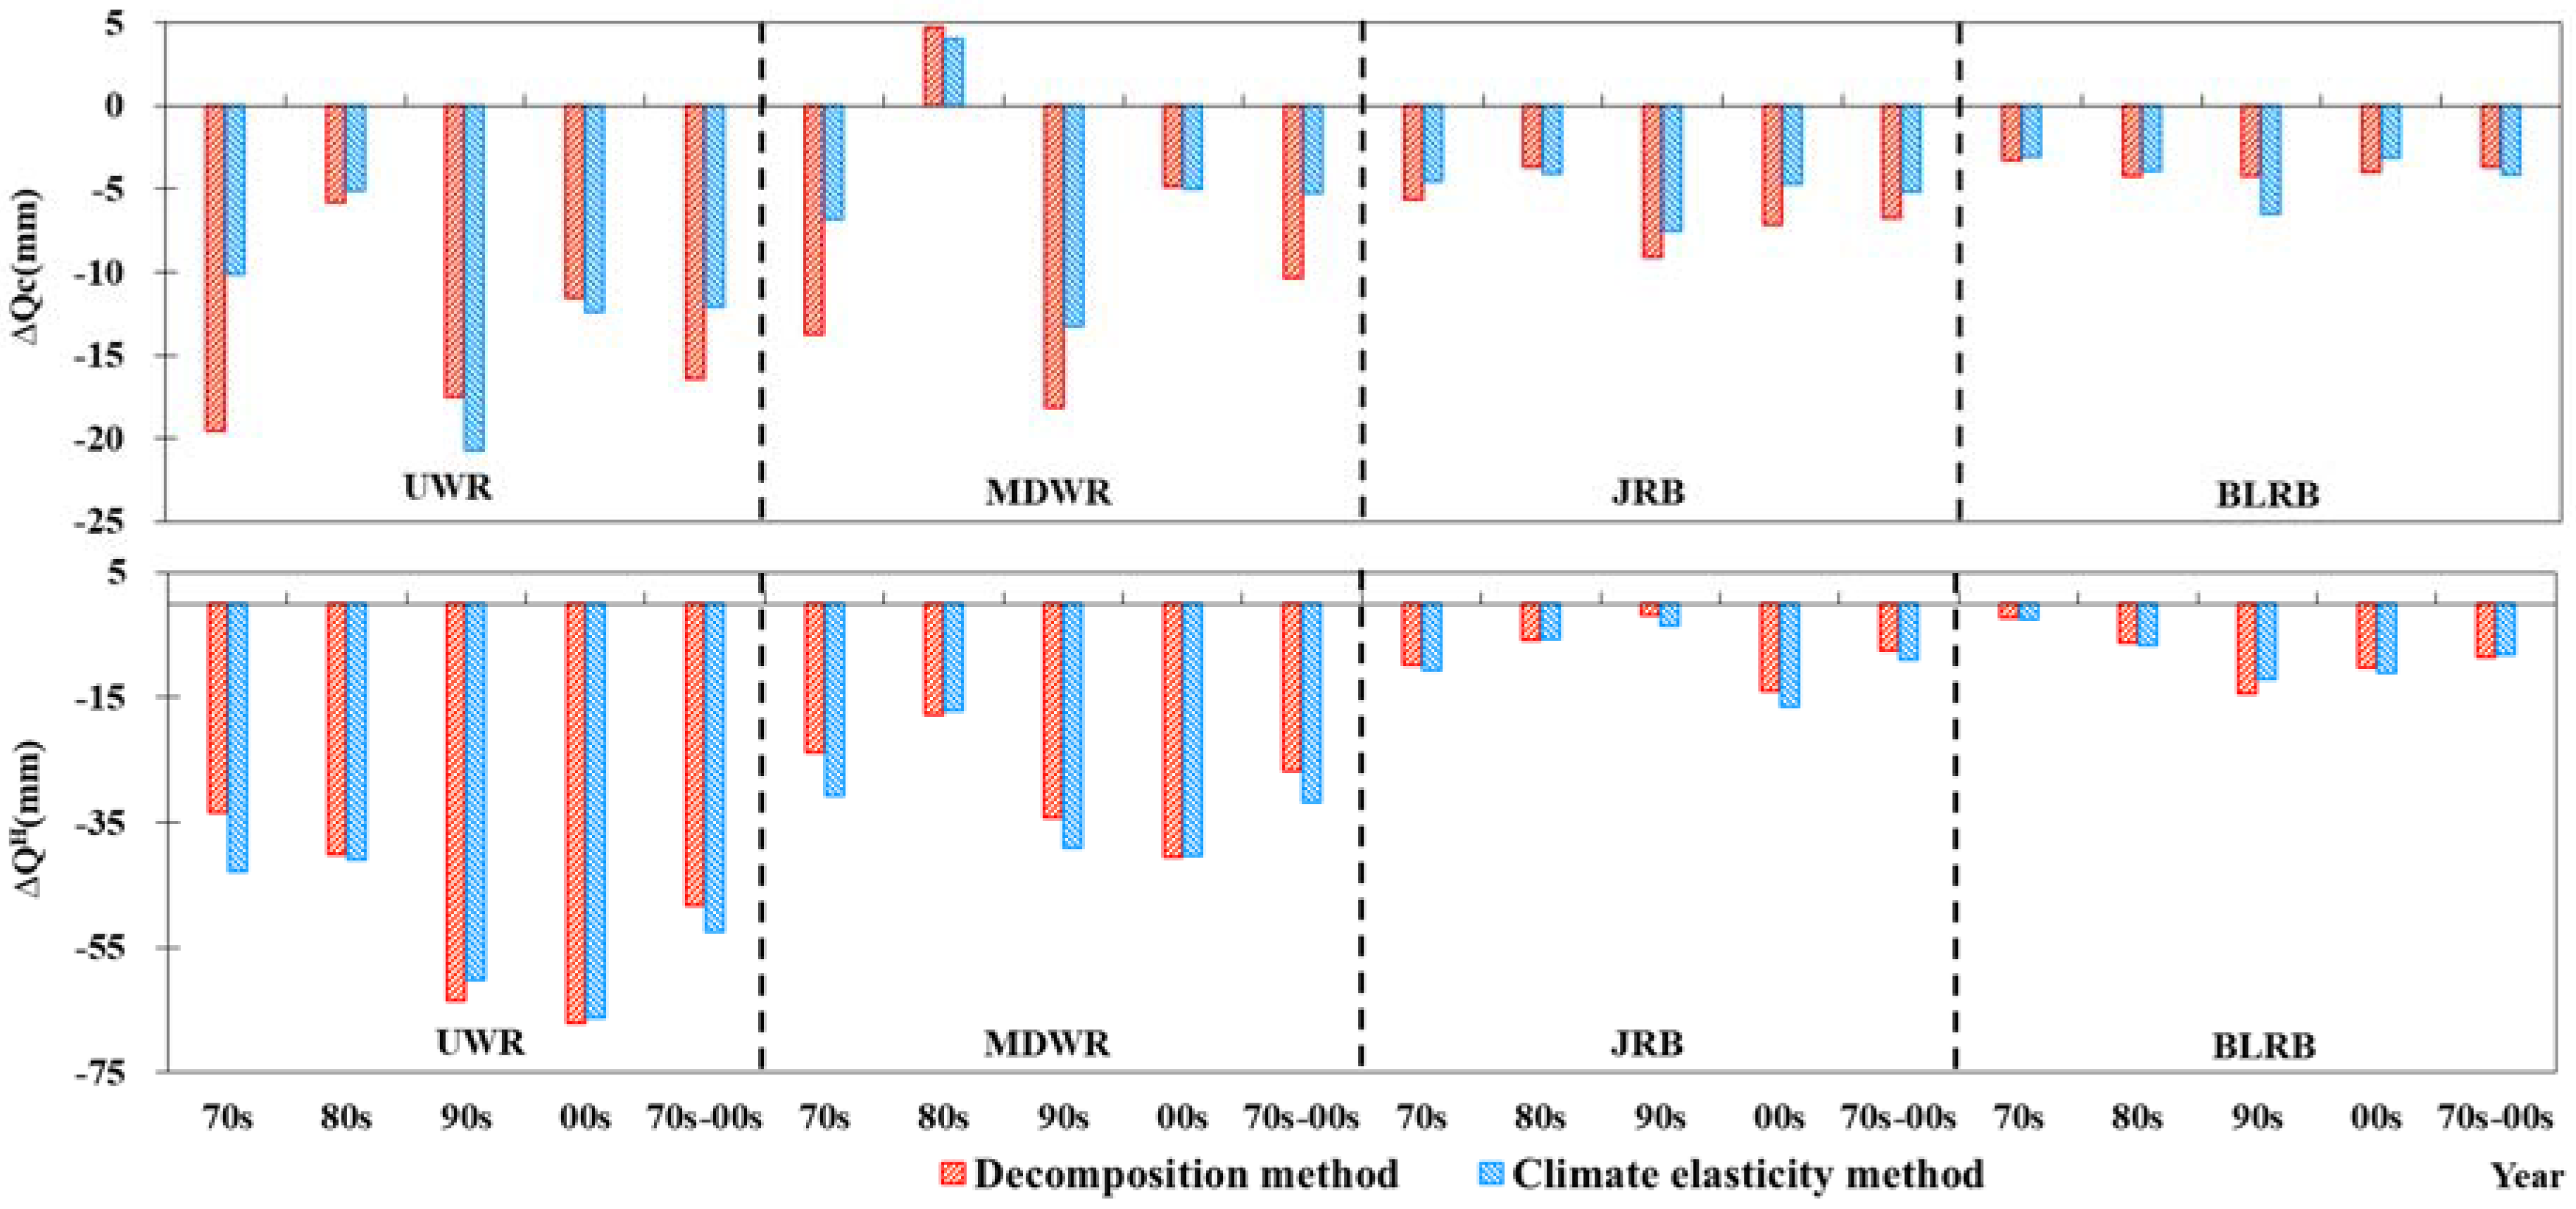
The period of 1960–1970 was selected as the pre-change period, and the corresponding parameter values are summarized in Table 1. The climate-induced and human-induced streamflow changes during 1971–2010 were calculated and displayed in Figure 8. Both climate and human activities tend to cause a decrease in streamflow in the four study zones using the decomposition and elasticity methods. In particular, for the MDWR, climate change impact is positive during the 1980s. This means that precipitation and potential evaporation changes lead to an increase in streamflow in the 1980–1989 period. It has been documented that temperature has exhibited an increasing change in 1980s [68], while 1981–1985 is the continuous high flow period of WRB. Thus, climate change caused the enhancement of streamflow during the 1980s period. For all the basins, climate-induced streamflow change peaked in the 1990s, while human-induced streamflow change is larger in 1990s and 2000s than other periods. Thus, it can be concluded that and changes are closely related to the abnormal climate changes in 1990s and the effective implementation of the soil and water conservation measures and ecological restoration projects.
According to Table 3, the contribution rate based on the decomposition method indicates that during the 1971–2010 period, the estimated accounts for 25~47% of the total streamflow decline, whereas human interferences lead to a 53~75% reduction in streamflow. The contribution rate of human activities estimated with the elasticity method is 64–86% in the four zones, which is a slightly larger than the results obtained with the decomposition method. As mentioned above, human activities influence streamflow through direct and indirect ways. The decomposition method can only allow for estimation of the direct human-induced streamflow change, and thus the results we obtained are credible. Consequently, on average, 71% of streamflow decline is attributed to human interferences, indicating that human activities have exerted more profound effects on streamflow change. Climatic variation such as increase of temperature and potential evaporation and decrease of precipitation have exerted the first-order impact on streamflow before 1970, while human activities played a second-order role in the decrease of streamflow after 1970. Gao et al. [69] reported that, on average, 83% of the streamflow decrease in the WRB was attributed to human activities, which is larger than our estimates. This is because the effects of direct human activities were not separated from the total human impacts. Consequently, the two Budyko based methods are applicable for revealing the contribution of climate and human activities to streamflow change.
5. Discussion
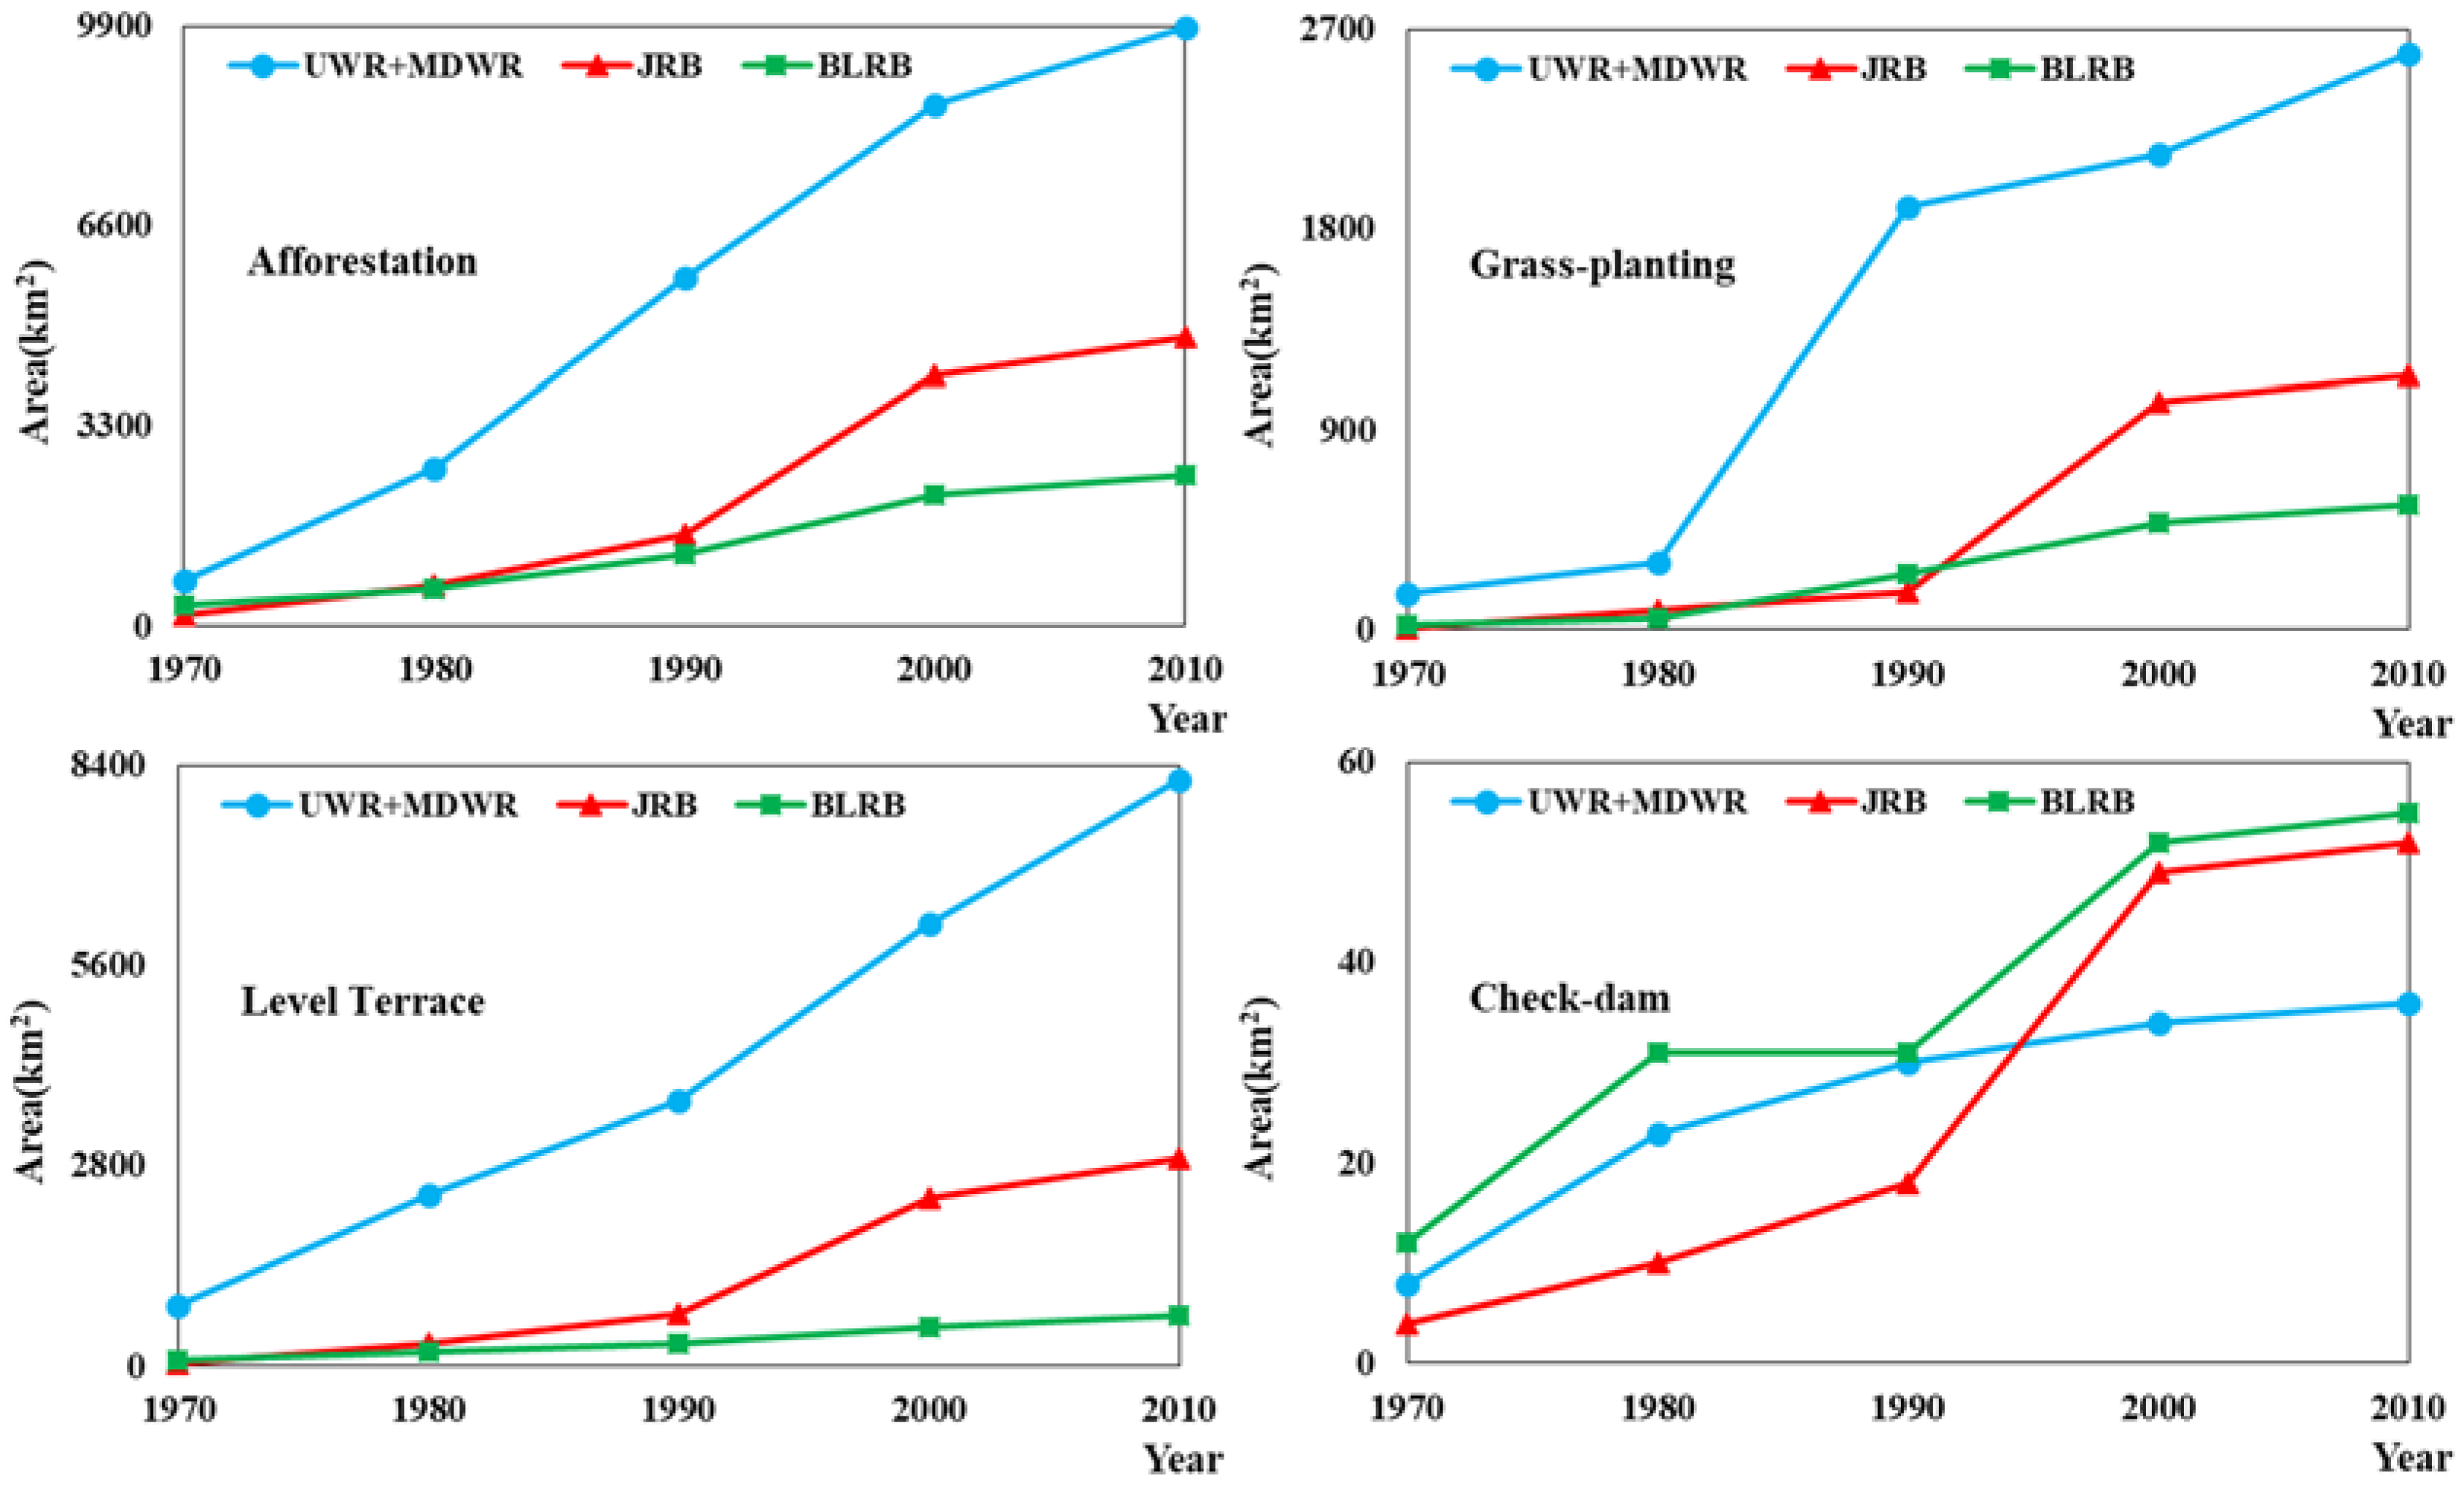
Human activities dominate streamflow change in the WRB. Since 1970, large-scale implementation of soil and water conservation measures (slope measures: Afforestation, grass-planting and level terrace, channel measures: Check-dam) have been undertaken vigorously against soil erosion, which affected runoff process especially with the launch of Central Government’s soil conservation policy [24,70]. Afforestation and grass-planting reduce runoff through intercepting precipitation, increasing evaporation, improving the soil structure and enhancing infiltration [71]. Creation of terraces slow down the slope gradient of cultivated land, thus facilitating the infiltration, and finally reducing runoff velocity [72]. As shown in Figure 9, in the four zones, soil and water conservation measures have doubled or tripled from 1970 to 1990, especially after the promulgation of the law on soil and water conservation in 1991, then strengthened significantly by 2010. Here, the “water and soil conservation methods” was applied to estimate the particular contribution of different human activities. As shown in Table 4, streamflow change caused by the slope measures has increased intensively and rapidly over the past decades. It is estimated that afforestation, grass-planting and creation of terrace account for 4.5%, 0.7% and 6.9% of the runoff decrease, respectively, between 1970 and 2010 in the whole WRB. This indicates that creation of terrace is an effective measure to reduce runoff for the whole WRB. For the JRB, terraces are the main influencing factors on streamflow decline, while afforestation plays the most important role in reducing streamflow in the BLRB. Due to of the unstable watershed management strategy in the 1990s, the effect of slope measures on streamflow reduction grew steadily to reach its peak in the late 1990s and then decreased after 2000 for the JRB and BLRB. It should be noted that in 1999, the Central Government has proposed the ecological restoration project “Green for Grain” (GFG). Thus, the significant increase in vegetation coverage could theoretically lead to the strengthening of infiltration and more water is trapped in the soil, resulting in decrease in runoff [73]. However, as the increased seedlings in the new planted forest and grassland are still in its infancy, the effect of increased vegetation on runoff reduction is not significant in 2000s, which implies that the benefit of GFG project on soil erosion control has lag effect.
Water demand has increased sharply with growth of population and economy after the launch of the reform and opening-up policy in 1978, which enhanced the industrial and domestic water consumption in the WRB (Table 4). As the largest water user, irrigation accounted for 63.6% of the total water withdrawal over the study period in the WRB, although irrigation technology has improved recently. Large amounts of uncultivated land were converted into irrigation areas to meet food demand. As a result, check-dams and reservoirs, which have more direct and positive effects on runoff decline, were constructed extensively in the WRB. The engineering measures affect runoff by peak clipping the flood flow and storing water in the reservoirs during the rainy season and releasing water during the dry season for irrigation and other users. Besides, reservoirs with large storage capacity would increase evaporation, which also affects streamflow decline [74]. By the year 2007, approximately 129 reservoirs with a total storage capacity of approximately 1.67 billion m3 and 3291 pump projects were built in the WRB [75]. Due to the limited regulation capacity of small reservoirs, the water reduction caused by these reservoirs can be ignored. Here, only large- and medium-sized reservoirs, such as the Yangmaowan, Shitouhe, and Fengjiashan reservoirs, in the mainstream of WRB were considered. Table 4 shows that the most obvious decrease in streamflow by reservoirs and check-dams occurred in the 1970s by 2.0% and 3.4%, respectively, which is consistent with previous analysis that found that a large number of reservoirs and check-dams became gradually ineffective or were destroyed by sediment and floods since 1980s. Consequently, the decreasing effect of engineering measures on streamflow gradually weakened, whereas the effect of slope measures has enhanced.
6. Conclusions
The hydrological cycle is affected by the changing climate and intensifying human activities. Since the 1960s, annual runoff has exhibited a decreasing trend in the four sub-catchments with an abrupt change point detected in 1971. Thus, the study period was divided into the pre-change period (1960–1970) and the post-change period (1971–2010). The change in runoff between the two sub-periods was estimated and attributed to the effects of natural climate change and human activities.
In this paper, two attribution methods based on the Wang-Tang equation were introduced to explicitly quantify the relative contributions of climate change and human activities to changes in streamflow between 1960 and 2010. The Budyko parameter in the WRB, which was obtained by the least square method, increased in all the sub-catchments of the WRB except for the BLRB. Runoff changes were more sensitive to climate variations in MDWR and BLRB than UWR and JRB. That is, a geographic difference exists in the climate elasticity in the WRB. For the entire basin, the hydrological responses were more sensitive to precipitation than potential evapotranspiration.
The decomposition method and climate elasticity method consistently showed that the contribution of climate change on streamflow reduction ranged from 14% to 47%, whereas human activities were responsible for 53–86% of the decline. This indicates that human activities have a more profound effect on streamflow variations than climate variation during the post-change period. This study highlights the impacts of specific types of human activity on streamflow changes by using the water and soil conservation method. The results showed that irrigation, industrial and domestic consumption, and terraces were the three major types of direct human activities affecting runoff, which accounted for 92% of the total runoff reduction induced by direct human activities.
This study has considerable implications for water resource planners and managers, through exploring the mechanisms underlying the changing process of hydrological cycle, and quantifying the contributions of various influencing factors on runoff reduction in the WRB.
Author Contributions
Q.H. proposed the idea of this paper; S.H. guided the writing and analyzing work; J.Z. did the calculation work and wrote the manuscript; H.W. and G.L. commented on and revised the manuscript.
Funding
This research was funded by the National Key Research and Development Program of China (grant number 2017YFC0405900), the National Natural Science Foundation of China (grant number 51709221), the Planning Project of Science and Technology of Water Resources of Shaanxi (grant numbers 2015slkj-27 and 2017slkj-19), the China Scholarship Council (grant number 201608610170), the Open Research Fund of State Key Laboratory of Simulation and Regulation of Water Cycle in River Basin (China Institute of Water Resources and Hydropower Research, grant number IWHR-SKL-KF201803) and the Doctorate Innovation Funding of Xi’an University of Technology (grant number 310-252071712).
Acknowledgments
We acknowledge the financial support from the National Key Research and Development Program of China (2017YFC0405900), the National Natural Science Foundation of China (51709221), the Planning Project of Science and Technology of Water Resources of Shaanxi (2015slkj-27 and 2017slkj-19), the China Scholarship Council (201608610170), the Open Research Fund of State Key Laboratory of Simulation and Regulation of Water Cycle in River Basin (China Institute of Water Resources and Hydropower Research, grant number IWHR-SKL-KF201803) and the Doctorate Innovation Funding of Xi’an University of Technology (grant number 310-252071712).
Conflicts of Interest
The authors declare no conflict of interest.
References
- Huntington, T.G. Evidence for intensification of the global water cycle: Review and synthesis. J. Hydrol. 2006, 319, 83–95. [Google Scholar] [CrossRef]
- Milly, P.C.; Dunne, K.A.; Vecchia, A.V. Global pattern of trends in streamflow and water availability in a changing climate. Nature 2005, 438, 347–350. [Google Scholar] [CrossRef] [PubMed]
- Gao, Y.; Zhu, X.; Yu, G.; He, N.; Wang, Q.; Tian, J. Water use efficiency threshold for terrestrial ecosystem carbon sequestration in China under afforestation. Agric. For. Meteorol. 2014, 195, 32–37. [Google Scholar] [CrossRef]
- Mccabe, G.J.; Wolock, D.M. A step increase in streamflow in the conterminous United States. Geophys. Res. Lett. 2002, 29, 38-1–38-4. [Google Scholar] [CrossRef]
- Birsan, M.V.; Molnar, P.; Burlando, P.; Pfaundler, M. Streamflow trends in Switzerland. J. Hydrol. 2005, 314, 312–329. [Google Scholar] [CrossRef]
- Khaliq, M.N.; Ouarda, T.B.M.J.; Gachon, P. Identification of temporal trends in annual and seasonal low flows occurring in Canadian rivers: The effect of short- and long-term persistence. J. Hydrol. 2009, 369, 183–197. [Google Scholar] [CrossRef]
- Velpuri, N.M.; Senay, G.B. Analysis of long-term trends (1950–2009) in precipitation, runoff and runoff coefficient in major urban watersheds in the United States. Environ. Res. Lett. 2013, 8, 24020–24026. [Google Scholar] [CrossRef]
- Vörösmarty, C.J.; Green, P.; Salisbury, J.; Lammers, R.B. Global Water Resources: Vulnerability from Climate Change and Population Growth. Science 2000, 289, 284–288. [Google Scholar] [CrossRef] [PubMed]
- Patterson, L.A.; Lutz, B.; Doyle, M.W. Climate and direct human contributions to changes in mean annual streamflow in the South Atlantic, USA. Water Resour. Res. 2013, 49, 7278–7291. [Google Scholar] [CrossRef] [Green Version]
- Berghuijs, W.R.; Woods, R.A.; Hrachowitz, M. A precipitation shift from snow towards rain leads to a decrease in streamflow. Nat. Clim. Chang. 2014, 4, 583–586. [Google Scholar] [CrossRef] [Green Version]
- Pachauri, R.K.; Allen, M.R.; Barros, V.R.; Broome, J.; Cramer, W.; Christ, R.; Church, J.A.; Clarke, L.; Dahe, Q.; DASGUPTA, P.; et al. Climate Change 2014: Synthesis Report; Contribution of Working Groups I, II and III to the Fifth Assessment Report of the Intergovernmental Panel on Climate Change; IPCC: Geneva, Switzerland, 2014; p. 151. [Google Scholar]
- Déry, S.J.; Hernández-Henríquez, M.A.; Burford, J.E.; Wood, E.F. Observational evidence of an intensifying hydrological cycle in northern Canada. Geophys. Res. Lett. 2009, 36, 88–97. [Google Scholar] [CrossRef]
- Thompson, J.R. Modelling the impacts of climate change on upland catchments in southwest Scotland using MIKE SHE and the UKCP09 probabilistic projections. Hydrol. Res. 2012, 43, 507. [Google Scholar] [CrossRef]
- Xiong, L.; Yu, K.; Zhang, H.; Zhang, L. Annual runoff change in the headstream of Yangtze River and its relation to precipitation and air temperature. Hydrol. Res. 2013, 44, 850–874. [Google Scholar] [CrossRef]
- Cruise, J.F.; Laymon, C.A.; Al-Hamdan, O.Z. Impact of 20 Years of Land-Cover Change on the Hydrology of Streams in the Southeastern United States 1. J. Am. Water Resour. Assoc. 2010, 46, 1159–1170. [Google Scholar] [CrossRef]
- Zheng, J.; Yu, X.; Deng, W.; Wang, H.; Wang, Y. Sensitivity of Land-Use Change to Streamflow in Chaobai River Basin. J. Hydrol. Eng. 2013, 18, 457–464. [Google Scholar] [CrossRef]
- Rossi, A.; Massei, N.; Laignel, B.; Sebag, D.; Copard, Y. The response of the Mississippi River to climate fluctuations and reservoir construction as indicated by wavelet analysis of streamflow and suspended-sediment load, 1950–1975. J. Hydrol. 2009, 377, 237–244. [Google Scholar] [CrossRef]
- Weiskel, P.K.; Vogel, R.M.; Steeves, P.A.; Zarriello, P.J.; DeSimone, L.A.; Ries, K.G. Water use regimes: Characterizing direct human interaction with hydrologic systems. Water Resour. Res. 2007, 43. [Google Scholar] [CrossRef]
- Huang, S.; Huang, Q.; Chang, J.; Leng, G. Linkages between hydrological drought, climate indices and human activities: A case study in the Columbia River basin. Int. J. Climatol. 2016, 36, 280–290. [Google Scholar] [CrossRef]
- Xu, X.; Yang, D.; Yang, H.; Lei, H. Attribution analysis based on the Budyko hypothesis for detecting the dominant cause of runoff decline in Haihe basin. J. Hydrol. 2014, 510, 530–540. [Google Scholar] [CrossRef]
- Wu, J.; Miao, C.; Wang, Y.; Duan, Q.; Zhang, X. Contribution analysis of the long-term changes in seasonal runoff on the Loess Plateau, China, using eight Budyko-based methods. J. Hydrol. 2016, 545, 263–275. [Google Scholar] [CrossRef]
- Wang, D.; Hejazi, M. Quantifying the relative contribution of the climate and direct human impacts on mean annual streamflow in the contiguous United States. Water Resour. Res. 2011, 47, 411. [Google Scholar] [CrossRef]
- Wang, X. Advances in separating effects of climate variability and human activity on stream discharge: An overview. Adv. Water Resour. 2014, 71, 209–218. [Google Scholar] [CrossRef]
- Gao, G.; Fu, B.; Wang, S.; Liang, W.; Jiang, X. Determining the hydrological responses to climate variability and land use/cover change in the Loess Plateau with the Budyko framework. Sci. Total Environ. 2016, 557, 331–342. [Google Scholar] [CrossRef] [PubMed] [Green Version]
- Arnell, N.W. Climate change and global water resources. Glob. Environ. Chang. 1999, 9, S31–S49. [Google Scholar] [CrossRef]
- Pahl-Wostl, C.; Knieper, C. The capacity of water governance to deal with the climate change adaptation challenge: Using fuzzy set Qualitative Comparative Analysis to distinguish between polycentric, fragmented and centralized regimes. Glob. Environ. Chang. 2014, 29, 139–154. [Google Scholar] [CrossRef]
- Fang, W.; Huang, Q.; Huang, S.; Yang, J.; Meng, E.; Li, Y. Optimal sizing of utility-scale photovoltaic power generation complementarily operating with hydropower: A case study of the world’s largest hydro-photovoltaic plant. Energy Convers. Manag. 2017, 136, 161–172. [Google Scholar] [CrossRef]
- Zhang, S.; Yang, D.; Jayawardena, A.W.; Xu, X.; Yang, H. Hydrological change driven by human activities and climate variation and its spatial variability in Huaihe Basin, China. Int. Assoc. Sci. Hydrol. Bull. 2015, 61, 1370–1382. [Google Scholar] [CrossRef]
- Chiew, F.H.S.; Teng, J.; Vaze, J.; Post, D.A.; Perraud, J.M.; Kirono, D.G.C.; Viney, N.R. Estimating climate change impact on runoff across southeast Australia: Method, results, and implications of the modeling method. Water Resour. Res. 2009, 45, 82–90. [Google Scholar] [CrossRef]
- Bao, Z.; Zhang, J.; Wang, G.; Fu, G.; He, R.; Yan, X. Attribution for decreasing streamflow of the Haihe River basin, northern China: Climate variability or human activities? J. Hydrol. 2012, 460, 117–129. [Google Scholar] [CrossRef]
- Fohrer, N.; Haverkamp, S.; Frede, H.G. Assessment of the effects of land use patterns on hydrologic landscape functions: Development of sustainable land use concepts for low mountain range areas. Hydrol. Process. 2005, 19, 659–672. [Google Scholar] [CrossRef]
- Schilling, K.E.; Chan, K.S.; Liu, H.; Zhang, Y.K. Quantifying the effect of land use land cover change on increasing discharge in the Upper Mississippi River. J. Hydrol. 2010, 387, 343–345. [Google Scholar] [CrossRef]
- Bourgault, M.A.; Larocque, M.; Roy, M. Simulation of aquifer-peatland-river interactions under climate change. Hydrol. Res. 2014, 45, 425–440. [Google Scholar] [CrossRef]
- Jiang, T.; Chen, Y.D.; Xu, C.Y.; Chen, X.; Chen, X.; Singh, V.P. Comparison of hydrological impacts of climate change simulated by six hydrological models in the Dongjiang Basin, South China. J. Hydrol. 2007, 336, 316–333. [Google Scholar] [CrossRef]
- Zhang, L.; Zhao, F.F.; Brown, A.E. Predicting effects of plantation expansion on streamflow regime for catchments in Australia. Hydrol. Earth Syst. Sci. Discuss. 2012, 9, 379–403. [Google Scholar] [CrossRef]
- Wei, X.H.; Zhang, M.F. Quantifying streamflow change caused by forest disturbance at a large spatial scale: A single watershed study. Water Resour. Res. 2010, 46, 439–445. [Google Scholar] [CrossRef]
- Baw-Puh, F. On the calculation of the Evaporation from land surface. Chin. J. Atmos. Sci. 1981, 1, 002. [Google Scholar]
- Choudhury, B. Evaluation of an empirical equation for annual evaporation using field observations and results from a biophysical model. J. Hydrol. 1999, 216, 99–110. [Google Scholar] [CrossRef]
- Yang, H.; Yang, D.; Lei, Z.; Sun, F. New analytical derivation of the mean annual water-energy balance equation. Water Resour. Res. 2008, 44, 893–897. [Google Scholar] [CrossRef]
- Zhang, L.; Dawes, W.R.; Walker, G.R. Response of Mean Annual ET to Vegetation Changes at Catchment Scale. Water Resour. Res. 2001, 37, 701–708. [Google Scholar] [CrossRef]
- Wang, D.; Tang, Y. A one-parameter Budyko model for water balance captures emergent behavior in Darwinian hydrologic models. Geophys. Res. Lett. 2014, 41, 4569–4577. [Google Scholar] [CrossRef]
- Xing, W.; Wang, W.; Zou, S.; Deng, C. Projection of future runoff change using climate elasticity method derived from Budyko framework in major basins across China. Glob. Planet. Chang. 2018, 162, 120–135. [Google Scholar] [CrossRef]
- Liang, K.; Liu, C.; Liu, X.; Song, X. Impacts of climate variability and human activity on streamflow decrease in a sediment concentrated region in the Middle Yellow River. Stoch. Environ. Res. Risk Assess. 2013, 27, 1741–1749. [Google Scholar] [CrossRef]
- Sun, Y.; Tian, F.; Yang, L.; Hu, H. Exploring the spatial variability of contributions from climate variation and change in catchment properties to streamflow decrease in a mesoscale basin by three different methods. J. Hydrol. 2014, 508, 170–180. [Google Scholar] [CrossRef]
- Li, Z.; Liu, W.Z.; Zhang, X.C.; Zheng, F.L. Impacts of land use change and climate variability on hydrology in an agricultural catchment on the Loess Plateau of China. J. Hydrol. 2009, 377, 35–42. [Google Scholar] [CrossRef]
- Mu, X.M.; Basang, C.; Zhang, L.; Gao, P.; Wang, F.; Zhang, X.P. Impact of soil conservation measures on runoff and sediment in Hekou-Longmen region of the Yellow River. J. Sediment Res. 2007, 2, 36–41. [Google Scholar]
- Zhan, C.S.; Jiang, S.S.; Sun, F.B.; Jia, Y.W.; Niu, C.W.; Yue, W.F. Quantitative contribution of climate change and human activities to runoff changes in the Wei River basin, China. Hydrol. Earth Syst. Sci. 2014, 11, 2149–2175. [Google Scholar] [CrossRef]
- Huang, S.; Chang, J.; Huang, Q.; Chen, Y. Spatio-temporal changes and frequency analysis of drought in the Wei River Basin, China. Water Resour. Manag. 2014, 28, 3095–3110. [Google Scholar] [CrossRef]
- Huang, S.; Chang, J.; Huang, Q.; Chen, Y. Monthly streamflow prediction using modified EMD-based support vector machine. J. Hydrol. 2014, 511, 764–775. [Google Scholar] [CrossRef]
- Liu, S.; Huang, S.; Xie, Y.; Leng, G.; Huang, Q.; Wang, L.; Xue, Q. Spatial-temporal changes of rainfall erosivity in the loess plateau, China: Changing patterns, causes and implications. CATENA 2018, 166, 279–289. [Google Scholar] [CrossRef]
- Allen, R.G.; Pereira, L.S.; Raes, D.; Smith, M. Crop Evapotranspiration-Guidelines for Computing Crop Water Requirements; FAO Irrigation and Drainage Paper 56; FAO-Food and Agriculture Organisation of the United Nations: Rome, Italy, 1998; Volume 300, pp. 156, 178. [Google Scholar]
- Fang, W.; Huang, S.; Huang, Q.; Huang, G.; Meng, E.; Luan, J. Reference evapotranspiration forecasting based on local meteorological and global climate information screened by partial mutual information. J. Hydrol. 2018, 561, 764–779. [Google Scholar] [CrossRef]
- Monteith, J.L. Evaporation and Environment. Symp. Soc. Exp. Biol. 1965, 19, 205–234. [Google Scholar] [PubMed]
- Thiessen, A.H. Precipitation Averages for Large Areas. Mon. Weather Rev. 1911, 39, 1082–1084. [Google Scholar] [CrossRef]
- Xing-Min, M.U.; Wang, L.I. Review of Evaluation Method of Impact of Soil and Water Conservation Practices on River Flows. Bull. Soil Water Conserv. 2004, 24, 73–78. [Google Scholar]
- Zhao, J.; Huang, Q.; Chang, J.; Liu, D.; Huang, S.; Shi, X. Analysis of temporal and spatial trends of hydro-climatic variables in the Wei River Basin. Environ. Res. 2015, 139, 55–64. [Google Scholar] [CrossRef] [PubMed]
- Yao, W.; Ran, D.; Chen, J. Recent changes in runoff and sediment regimes and future projections in the Yellow River basin. Adv. Water Sci. 2013, 24, 607–616. [Google Scholar]
- Zhao, J. Streamflow and Sediment Discharge Change and Its Response to Climate Change and Human Activities of Wei River Basin. Master’s Thesis, Xi’an University of Technology, Xi’an, China, 2014. [Google Scholar]
- Bernaola-Galván, P.; Ivanov, P.C.; Amaral, L.A.N.; Stanley, H.E. Scale invariance in the nonstationarity of human heart rate. Phys. Rev. Lett. 2001, 87, 168105. [Google Scholar] [CrossRef] [PubMed]
- Budyko, M.I. Climate and Life; Academic: San Diego, CA, USA, 1974. [Google Scholar]
- Malagò, A.; Bouraoui, F.; De Roo, A. Diagnosis and Treatment of the SWAT Hydrological Response Using the Budyko Framework. Sustainability 2018, 10, 1373. [Google Scholar] [CrossRef]
- Horton, R.E. The Rôle of infiltration in the hydrologic cycle. Eos Trans. Am. Geophys. Union 1933, 14, 446–460. [Google Scholar] [CrossRef]
- Troch, P.A.; Martinez, G.F.; Pauwels, V.R.; Durcik, M.; Sivapalan, M.; Harman, C.; Brooks, P.D.; Gupta, H.; Huxman, T. Climate and vegetation water use efficiency at catchment scales. Hydrol. Process. 2009, 23, 2409–2414. [Google Scholar] [CrossRef]
- Voepel, H.; Ruddell, B.; Schumer, R.; Troch, P.A.; Brooks, P.D.; Neal, A.; Durcil, M.; Sivapalan, M. Quantifying the role of climate and landscape characteristics on hydrologic partitioning and vegetation response. Water Resour. Res. 2011, 47, 427–438. [Google Scholar] [CrossRef]
- Schaake, J.C.; Waggoner, P.E. From climate to flow. Clim. Chang. US Water Resour. 1990, 177–206. [Google Scholar]
- Li, Y.; Chang, J.; Wang, Z.; Li, H. Detection of Abrupt Changes in Runoff in the Weihe River Basin. Adv. Meteorol. 2016, 2016, 6962082. [Google Scholar] [CrossRef]
- Zhang, X.; Zhang, L.; Zhao, J.; Rustomji, P.; Hairsine, P. Responses of streamflow to changes in climate and land use/cover in the Loess Plateau, China. Water Resour. Res. 2009, 44, 2183–2188. [Google Scholar] [CrossRef]
- Sun, Q.; Miao, C.; Duan, Q.; Wang, Y. Temperature and precipitation changes over the Loess Plateau between 1961 and 2011, based on high-density gauge observations. Glob. Planet. Chang. 2015, 132, 1–10. [Google Scholar] [CrossRef] [Green Version]
- Gao, P.; Geissen, V.; Ritsema, C.J.; Mu, X.M.; Wang, F. Impact of climate change and anthropogenic activities on stream flow and sediment discharge in the Wei River basin, China. Hydrol. Earth Syst. 2013, 17, 961–972. [Google Scholar] [CrossRef] [Green Version]
- Wang, S.; Fu, B.; Piao, S.; Lü, Y.; Ciais, P.; Feng, X.; Wang, Y. Reduced sediment transport in the Yellow River due to anthropogenic changes. Nat. Geosci. 2016, 9, 38–41. [Google Scholar] [CrossRef]
- Xu, J. Variation in annual runoff of the Wudinghe River as influenced by climate change and human activity. Quat. Int. 2011, 244, 230–237. [Google Scholar] [CrossRef]
- Xu, J.H.; Niu, Y.G. Effect of Hydraulic Engineering Works on River Flow and Sediment Load in the Middle Yellow River Basin; Publishing House for Yellow River Water Conservancy Zhengzhou: Zhengzhou, China, 2000. [Google Scholar]
- Yang, Y.; Shang, S.; Jiang, L. Remote sensing temporal and spatial patterns of evapotranspiration and the responses to water management in a large irrigation district of North China. Agric. For. Meteorol. 2012, 164, 112–122. [Google Scholar] [CrossRef]
- Liu, R. Benefit analysis of water reduction and sediment reduction in weihe river basin and prediction of water and sediment change trend. Bull. Soil Water Conserv. 1993, 6, 17–22. [Google Scholar]
- Chang, J.; Wang, Y.; Istanbulluoglu, E.; Bai, T.; Huang, Q.; Yang, D.; Huang, S. Impact of climate change and human activities on runoff in the Weihe River Basin, China. Quat. Int. 2015, 380, 169–179. [Google Scholar] [CrossRef]
Figure 1.
Location of the study area and hydro-meteorological stations.

Figure 2.
Annual precipitation, potential evaporation, and runoff of the four sub-catchments in the Wei River Basin (WRB).
Figure 2.
Annual precipitation, potential evaporation, and runoff of the four sub-catchments in the Wei River Basin (WRB).

Figure 3.
Flowchart of the framework for quantifying the impacts of climate change and human activities on streamflow change.
Figure 3.
Flowchart of the framework for quantifying the impacts of climate change and human activities on streamflow change.

Figure 4.
Decomposition method to quantify the climate change and direct human activities impacts on mean annual streamflow.
Figure 4.
Decomposition method to quantify the climate change and direct human activities impacts on mean annual streamflow.

Figure 5.
Segmentations and change points of mean annual streamflow in the four zones. The blue solid line and the green dotted line refer to the first and second iteration and segmentation process, respectively.
Figure 5.
Segmentations and change points of mean annual streamflow in the four zones. The blue solid line and the green dotted line refer to the first and second iteration and segmentation process, respectively.

Figure 6.
Temporal evolution of the annual parameter . The solid line and the dotted line refer to the 11-year moving and trend line of parameter , respectively.
Figure 6.
Temporal evolution of the annual parameter . The solid line and the dotted line refer to the 11-year moving and trend line of parameter , respectively.

Figure 7.
The trajectory of evaporation ratio versus aridity index from period 1 (pre-change period) to period 2 (post-change period) in the four sub-catchments of WRB. The red solid lines and green solid lines indicate the fitted Budyko curves before and after breakpoints, respectively.
Figure 7.
The trajectory of evaporation ratio versus aridity index from period 1 (pre-change period) to period 2 (post-change period) in the four sub-catchments of WRB. The red solid lines and green solid lines indicate the fitted Budyko curves before and after breakpoints, respectively.

Figure 8.
Fractional contribution of climate changes and human activities to the variation of streamflow estimated by the decomposition method and the climate elasticity method.
Figure 8.
Fractional contribution of climate changes and human activities to the variation of streamflow estimated by the decomposition method and the climate elasticity method.

Figure 9.
Statistics of soil and water conservation practices.


Table 1.
Hydroclimatic characteristics of the Wei River Basin (WRB).
| Gauge Station | Basin | Drainage Area (104 km2) | Period | Average Value | ||||||
|---|---|---|---|---|---|---|---|---|---|---|
| mm/year | 108 km3/year | εP | εEP | |||||||
| Linjiacun | UWR | 3.07 | 1960–2010 | 536.60 | 16.06 | 777.09 | 0.77 | 1.50 | 2.98 | −1.98 |
| Huaxian | MDWR | 10.65 | 1960–2010 | 634.14 | 64.64 | 886.28 | 0.79 | 1.46 | 3.11 | −2.11 |
| Zhangjiashan | JRB | 4.32 | 1960–2010 | 502.48 | 13.30 | 869.93 | 0.80 | 1.81 | 2.93 | −1.93 |
| Zhuangtou | BLRB | 2.56 | 1960–2010 | 530.74 | 8.24 | 863.63 | 0.81 | 1.70 | 3.05 | −2.05 |
Note: represents the parameter of Wang-Tang equation; represents the aridity index; εP and εEP represent the elasticity of runoff.
Table 2.
Descriptions of the weather stations used in this study.
| Catchment | No. | Weather Station | Latitude (N) | Longitude (E) | Altitude (m) |
|---|---|---|---|---|---|
| UWR | 1 | Lintao | 35.35 | 103.85 | 1893 |
| 2 | Huajialing | 35.38 | 105.00 | 2450 | |
| 3 | Xiji | 35.97 | 105.72 | 1916 | |
| 4 | Minxian | 34.43 | 104.02 | 2315 | |
| 5 | Tianshui | 34.58 | 105.75 | 1141 | |
| 6 | Baoji | 34.35 | 107.13 | 612 | |
| MDWR | 7 | Wugong | 34.25 | 108.22 | 447 |
| 8 | Xian | 34.30 | 108.93 | 397 | |
| 9 | Tongchuan | 35.08 | 109.07 | 978 | |
| 10 | Foping | 33.52 | 107.98 | 827 | |
| 11 | Zhenan | 33.43 | 109.15 | 693 | |
| 12 | Shangzhou | 33.87 | 109.97 | 742 | |
| 13 | Huashan | 34.48 | 110.08 | 2064 | |
| JRB | 14 | Huanxian | 36.58 | 107.30 | 1255 |
| 15 | Pingliang | 35.55 | 106.67 | 1346 | |
| 16 | Xifeng | 35.73 | 107.63 | 1421 | |
| 17 | Guyuan | 36.00 | 106.27 | 1753 | |
| 18 | Changwu | 35.20 | 107.80 | 1206 | |
| BLRB | 19 | Luochuan | 35.82 | 109.50 | 1159 |
| 20 | Yanan | 36.60 | 109.50 | 958 | |
| 21 | Wuqi | 36.92 | 108.17 | 1331 |
Table 3.
Table 3 The contribution of climate and human impacts to streamflow changes during 1971–2010 with 4 sub-catchments considered in this study.
Table 3.
Table 3 The contribution of climate and human impacts to streamflow changes during 1971–2010 with 4 sub-catchments considered in this study.
| Regions | Time Period | Average Value (mm/year) | Decomposition Method | Elasticity Method | Average | |||||
|---|---|---|---|---|---|---|---|---|---|---|
| UWR | 1960–1970 | 586.5 | 766.9 | 103.1 | ||||||
| 1971–2010 | 517.7 | 779.2 | 38.44 | 25 | 75 | 19 | 81 | 22 | 78 | |
| MDWR | 1960–1970 | 667.3 | 917.1 | 90.0 | ||||||
| 1971–2010 | 625.0 | 877.8 | 52.9 | 28 | 72 | 14 | 86 | 21 | 79 | |
| JRB | 1960–1970 | 553.2 | 857.9 | 42.4 | ||||||
| 1971–2010 | 488.5 | 873.24 | 28.1 | 47 | 53 | 37 | 64 | 42 | 58 | |
| BLRB | 1960–1970 | 577.4 | 857.7 | 38.6 | ||||||
| 1971–2010 | 517.9 | 865.3 | 26.4 | 30 | 70 | 34 | 66 | 32 | 68 | |
| Average | 1971–2010 | −32.1 | 33 | 67 | 26 | 74 | 29 | 71 | ||
Table 4.
The percentage contribution of soil and water conservation measures and water users to the streamflow reduction caused by direct human activities at the end of each decade (%).
Table 4.
The percentage contribution of soil and water conservation measures and water users to the streamflow reduction caused by direct human activities at the end of each decade (%).
| Catchment | Decade | Level Terrace | Afforestation | Grass-Planting | Check-Dam | Reservoirs | Irrigation | Industrial and Domestic |
|---|---|---|---|---|---|---|---|---|
| UWR + MDWR | 1960s | 4.1 | 1.6 | 0.2 | 0.3 | 93.8 | ||
| 1970s | 4.4 | 2.1 | 0.2 | 0.5 | 92.9 | |||
| 1980s | 6.6 | 4.4 | 1.0 | 0.5 | 87.5 | |||
| 1990s | 9.5 | 5.7 | 0.9 | 0.3 | 83.5 | |||
| 2000s | 12.3 | 6.4 | 1.1 | 0.3 | 79.9 | |||
| Average | 8.1 | 4.5 | 0.8 | 0.4 | 86.2 | |||
| JRB | 1960s | 1.7 | 2.7 | 0.1 | 1.7 | 93.8 | ||
| 1970s | 6.7 | 5.8 | 0.5 | 12.7 | 74.4 | |||
| 1980s | 10.9 | 9.7 | 0.7 | 8.8 | 69.9 | |||
| 1990s | 19.8 | 14.9 | 2.4 | 1.8 | 61.1 | |||
| 2000s | 15.6 | 10.9 | 1.8 | 0.6 | 71.1 | |||
| Average | 14.1 | 10.7 | 1.5 | 3.6 | 70.1 | |||
| BLRB | 1960s | 8.1 | 15.6 | 0.7 | 13.7 | 61.9 | ||
| 1970s | 8.6 | 11.7 | 0.7 | 26.7 | 52.4 | |||
| 1980s | 11.0 | 18.4 | 2.5 | 12.2 | 55.9 | |||
| 1990s | 11.4 | 19.3 | 2.8 | 11.9 | 54.6 | |||
| 2000s | 10.6 | 16.1 | 2.4 | 7.4 | 63.5 | |||
| Average | 10.6 | 16.9 | 2.2 | 11.5 | 58.8 | |||
| WRB | 1960s | 3.5 | 1.9 | 0.2 | 0.8 | 1.6 | 81.1 | 10.9 |
| 1970s | 4.2 | 2.4 | 0.2 | 2.0 | 3.4 | 81.1 | 6.8 | |
| 1980s | 6.2 | 4.6 | 0.9 | 1.4 | 2.1 | 72.9 | 12.0 | |
| 1990s | 7.7 | 5.3 | 0.9 | 0.8 | 1.3 | 55.7 | 28.3 | |
| 2000s | 8.7 | 5.3 | 0.9 | 0.5 | 1.3 | 52.5 | 30.8 | |
| Average | 6.9 | 4.5 | 0.7 | 1.0 | 1.8 | 63.6 | 21.5 |
© 2018 by the authors. Licensee MDPI, Basel, Switzerland. This article is an open access article distributed under the terms and conditions of the Creative Commons Attribution (CC BY) license (http://creativecommons.org/licenses/by/4.0/).
Share and Cite
MDPI and ACS Style
Zhao, J.; Huang, S.; Huang, Q.; Wang, H.; Leng, G. Detecting the Dominant Cause of Streamflow Decline in the Loess Plateau of China Based onthe Latest Budyko Equation. Water 2018, 10, 1277. https://doi.org/10.3390/w10091277
AMA Style
Zhao J, Huang S, Huang Q, Wang H, Leng G. Detecting the Dominant Cause of Streamflow Decline in the Loess Plateau of China Based onthe Latest Budyko Equation. Water. 2018; 10(9):1277. https://doi.org/10.3390/w10091277
Chicago/Turabian StyleZhao, Jing, Shengzhi Huang, Qiang Huang, Hao Wang, and Guoyong Leng. 2018. "Detecting the Dominant Cause of Streamflow Decline in the Loess Plateau of China Based onthe Latest Budyko Equation" Water 10, no. 9: 1277. https://doi.org/10.3390/w10091277
Note that from the first issue of 2016, this journal uses article numbers instead of page numbers. See further details here.